Orientation relationship of eutectoid FeAl and FeAl2
8
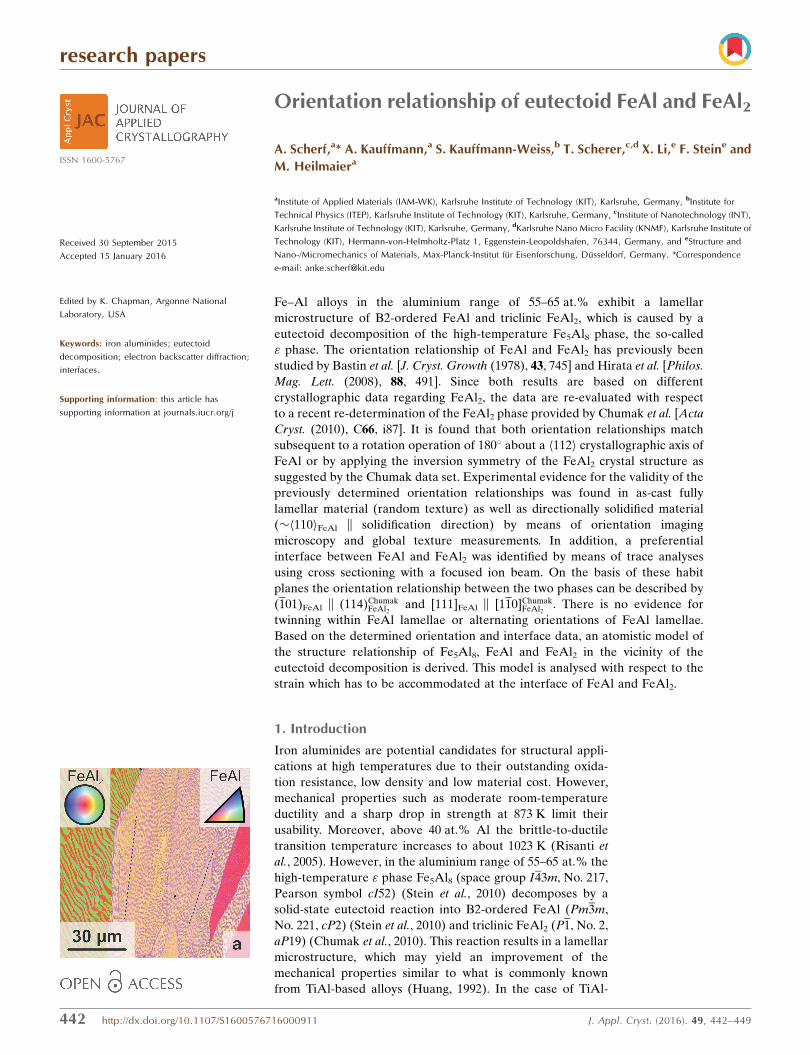
research papers 442 http://dx.doi.org/10.1107/S1600576716000911 J. Appl. Cryst. (2016). 49, 442–449 Received 30 September 2015 Accepted 15 January 2016 Edited by K. Chapman, Argonne National Laboratory, USA Keywords: iron aluminides; eutectoid decomposition; electron backscatter diffraction; interfaces. Supporting information: this article has supporting information at journals.iucr.org/j Orientation relationship of eutectoid FeAl and FeAl 2 A. Scherf, a * A. Kauffmann, a S. Kauffmann-Weiss, b T. Scherer, c,d X. Li, e F. Stein e and M. Heilmaier a a Institute of Applied Materials (IAM-WK), Karlsruhe Institute of Technology (KIT), Karlsruhe, Germany, b Institute for Technical Physics (ITEP), Karlsruhe Institute of Technology (KIT), Karlsruhe, Germany, c Institute of Nanotechnology (INT), Karlsruhe Institute of Technology (KIT), Karlsruhe, Germany, d Karlsruhe Nano Micro Facility (KNMF), Karlsruhe Institute of Technology (KIT), Hermann-von-Helmholtz-Platz 1, Eggenstein-Leopoldshafen, 76344, Germany, and e Structure and Nano-/Micromechanics of Materials, Max-Planck-Institut fu ¨ r Eisenforschung, Du ¨ sseldorf, Germany. *Correspondence e-mail: [email protected] Fe–Al alloys in the aluminium range of 55–65 at.% exhibit a lamellar microstructure of B2-ordered FeAl and triclinic FeAl 2 , which is caused by a eutectoid decomposition of the high-temperature Fe 5 Al 8 phase, the so-called " phase. The orientation relationship of FeAl and FeAl 2 has previously been studied by Bastin et al. [J. Cryst. Growth (1978), 43, 745] and Hirata et al. [Philos. Mag. Lett. (2008), 88, 491]. Since both results are based on different crystallographic data regarding FeAl 2 , the data are re-evaluated with respect to a recent re-determination of the FeAl 2 phase provided by Chumak et al. [Acta Cryst. (2010), C66, i87]. It is found that both orientation relationships match subsequent to a rotation operation of 180 about a h112i crystallographic axis of FeAl or by applying the inversion symmetry of the FeAl 2 crystal structure as suggested by the Chumak data set. Experimental evidence for the validity of the previously determined orientation relationships was found in as-cast fully lamellar material (random texture) as well as directionally solidified material (h110i FeAl || solidification direction) by means of orientation imaging microscopy and global texture measurements. In addition, a preferential interface between FeAl and FeAl 2 was identified by means of trace analyses using cross sectioning with a focused ion beam. On the basis of these habit planes the orientation relationship between the two phases can be described by ( 101) FeAl || (114) Chumak FeAl 2 and [111] FeAl || [1 10] Chumak FeAl 2 . There is no evidence for twinning within FeAl lamellae or alternating orientations of FeAl lamellae. Based on the determined orientation and interface data, an atomistic model of the structure relationship of Fe 5 Al 8 , FeAl and FeAl 2 in the vicinity of the eutectoid decomposition is derived. This model is analysed with respect to the strain which has to be accommodated at the interface of FeAl and FeAl 2 . 1. Introduction Iron aluminides are potential candidates for structural appli- cations at high temperatures due to their outstanding oxida- tion resistance, low density and low material cost. However, mechanical properties such as moderate room-temperature ductility and a sharp drop in strength at 873 K limit their usability. Moreover, above 40 at.% Al the brittle-to-ductile transition temperature increases to about 1023 K (Risanti et al., 2005). However, in the aluminium range of 55–65 at.% the high-temperature " phase Fe 5 Al 8 (space group I 43m, No. 217, Pearson symbol cI52) (Stein et al., 2010) decomposes by a solid-state eutectoid reaction into B2-ordered FeAl (Pm 3m, No. 221, cP2) (Stein et al., 2010) and triclinic FeAl 2 (P 1, No. 2, aP19) (Chumak et al., 2010). This reaction results in a lamellar microstructure, which may yield an improvement of the mechanical properties similar to what is commonly known from TiAl-based alloys (Huang, 1992). In the case of TiAl- ISSN 1600-5767
Transcript of Orientation relationship of eutectoid FeAl and FeAl2
research papers
442 http://dx.doi.org/10.1107/S1600576716000911 J. Appl. Cryst. (2016). 49, 442–449
Received 30 September 2015
Accepted 15 January 2016
Edited by K. Chapman, Argonne National
Laboratory, USA
Keywords: iron aluminides; eutectoid
decomposition; electron backscatter diffraction;
interfaces.
Supporting information: this article has
supporting information at journals.iucr.org/j
Orientation relationship of eutectoid FeAl and FeAl2
A. Scherf,a* A. Kauffmann,a S. Kauffmann-Weiss,b T. Scherer,c,d X. Li,e F. Steine and
M. Heilmaiera
aInstitute of Applied Materials (IAM-WK), Karlsruhe Institute of Technology (KIT), Karlsruhe, Germany, bInstitute for
Technical Physics (ITEP), Karlsruhe Institute of Technology (KIT), Karlsruhe, Germany, cInstitute of Nanotechnology (INT),
Karlsruhe Institute of Technology (KIT), Karlsruhe, Germany, dKarlsruhe Nano Micro Facility (KNMF), Karlsruhe Institute of
Technology (KIT), Hermann-von-Helmholtz-Platz 1, Eggenstein-Leopoldshafen, 76344, Germany, and eStructure and
Nano-/Micromechanics of Materials, Max-Planck-Institut fur Eisenforschung, Dusseldorf, Germany. *Correspondence
e-mail: [email protected]
Fe–Al alloys in the aluminium range of 55–65 at.% exhibit a lamellar
microstructure of B2-ordered FeAl and triclinic FeAl2, which is caused by a
eutectoid decomposition of the high-temperature Fe5Al8 phase, the so-called
" phase. The orientation relationship of FeAl and FeAl2 has previously been
studied by Bastin et al. [J. Cryst. Growth (1978), 43, 745] and Hirata et al. [Philos.
Mag. Lett. (2008), 88, 491]. Since both results are based on different
crystallographic data regarding FeAl2, the data are re-evaluated with respect
to a recent re-determination of the FeAl2 phase provided by Chumak et al. [Acta
Cryst. (2010), C66, i87]. It is found that both orientation relationships match
subsequent to a rotation operation of 180� about a h112i crystallographic axis of
FeAl or by applying the inversion symmetry of the FeAl2 crystal structure as
suggested by the Chumak data set. Experimental evidence for the validity of the
previously determined orientation relationships was found in as-cast fully
lamellar material (random texture) as well as directionally solidified material
(�h110iFeAl || solidification direction) by means of orientation imaging
microscopy and global texture measurements. In addition, a preferential
interface between FeAl and FeAl2 was identified by means of trace analyses
using cross sectioning with a focused ion beam. On the basis of these habit
planes the orientation relationship between the two phases can be described by
(101)FeAl || (114)ChumakFeAl2
and [111]FeAl || [110]ChumakFeAl2
. There is no evidence for
twinning within FeAl lamellae or alternating orientations of FeAl lamellae.
Based on the determined orientation and interface data, an atomistic model of
the structure relationship of Fe5Al8, FeAl and FeAl2 in the vicinity of the
eutectoid decomposition is derived. This model is analysed with respect to the
strain which has to be accommodated at the interface of FeAl and FeAl2.
1. Introduction
Iron aluminides are potential candidates for structural appli-
cations at high temperatures due to their outstanding oxida-
tion resistance, low density and low material cost. However,
mechanical properties such as moderate room-temperature
ductility and a sharp drop in strength at 873 K limit their
usability. Moreover, above 40 at.% Al the brittle-to-ductile
transition temperature increases to about 1023 K (Risanti et
al., 2005). However, in the aluminium range of 55–65 at.% the
high-temperature " phase Fe5Al8 (space group I43m, No. 217,
Pearson symbol cI52) (Stein et al., 2010) decomposes by a
solid-state eutectoid reaction into B2-ordered FeAl (Pm3m,
No. 221, cP2) (Stein et al., 2010) and triclinic FeAl2 (P1, No. 2,
aP19) (Chumak et al., 2010). This reaction results in a lamellar
microstructure, which may yield an improvement of the
mechanical properties similar to what is commonly known
from TiAl-based alloys (Huang, 1992). In the case of TiAl-
ISSN 1600-5767

based alloys, it has been shown that the mechanical properties
strongly depend on colony size, lamellar spacing and lamellar
orientation with respect to the loading axis (Yamaguchi et al.,
2000; Fujiwara et al., 1990). The influence of the latter was
evaluated using single crystals consisting of single colonies
(Fujiwara et al., 1990; Inui et al., 1992). By applying the
knowledge about this anisotropic behaviour it is possible to
optimize the microstructural development and, therefore,
mechanical properties – for example by a suitable directional
solidification process. However, the control of the eutectoid
microstructure by directional solidification in the case of Fe–
Al needs a detailed characterization of the relationship
between the decomposing " phase and the resulting phases
FeAl and FeAl2.
In the present study, the orientation relationship, as deter-
mined previously by Bastin et al. (1978) and Hirata et al.
(2008), will be confirmed and the supposed differences will be
examined. In addition, the interface of the FeAl and FeAl2
lamellae is investigated by means of local orientation deter-
mination and cross sectioning. In contrast to the investigation
of Bastin et al. (1978), a distinct preferential interface can be
identified. By applying the experimental data, the atomistic
details of the relationship of the involved crystal structures are
discussed. A possible orientation and interface relationship of
FeAl and FeAl2 to the high-temperature " phase during the
eutectoid reaction is proposed.
2. Experimental
Two rods of an alloy with a nominal composition of 60.5 at.%
Al were produced by arc melting and subsequent casting into
a copper mould with dimensions of Ø 13.5 � 170 mm. One of
the rods was directionally solidified using additional zone
melting. The velocity was 18 mm h�1 at a temperature
gradient of roughly 30 K mm�1.
In order to investigate the orientation relationship of FeAl
and FeAl2, orientation imaging microscopy by electron
backscatter diffraction (EBSD) and texture analysis by X-ray
diffraction (XRD) were carried out. EBSD was performed
utilizing a Zeiss Auriga cross-beam scanning electron micro-
scope (SEM) operated at 20 kV (with 120 mm aperture) and
equipped with an EDAX DigiView EBSD detector. The
orientation maps of 100 � 100 mm were obtained by indexing
patterns of 686 � 686 pixels (maximum resolution) with eight
to ten bands at a point rate of about 25 s�1 and a step size of
0.1 mm. The fraction of indexed points is above 99.8%. For the
maps on as-cast material and on directionally solidified
material 70 and 73%, respectively, of the points were recorded
with confidence indices (CIs) above 0.1. The contribution of
low CIs is mainly attributed to regions with overlapping
patterns of both phases near the phase boundaries. Thus, small
lamella spacing and low inclination with respect to the surface
locally result in a higher fraction of low CIs. Nevertheless, for
all investigated regions reliable information for the lamella
orientations was observed. The maps in Figs. 4 and 5 below are
shown without any cleaning operation. Cross sectioning was
performed using the focused Ga ion beam (FIB) of the Auriga
microscope at 30 kV and 16 nA. XRD texture measurements
were carried out on a Bruker D8 diffractometer equipped with
an Eulerian cradle. The Cu X-ray tube was operated at 40 kV
and 40 mA. In order to determine the exact Bragg positions
on the directionally solidified material, measurements with !offset were initially performed. Using ! offset, peak positions
of inclined (with respect to the sample surface) sets of crys-
tallographic planes can be analysed. For this kind of
measurement a motorized slit of 0.7 mm and a 2.5� axial Soller
slit were used at the source as well as two motorized slits of
9 mm, a 2.5� axial Soller slit and an Ni filter at the Lynxeye-XE
detector. For texture measurements a Gobel mirror, circular
slit of 1 mm in diameter and collimator of 1 mm were used at
the source as well as two motorized slits of 9 mm at the
Lynxeye-XE in 0D mode with three channels. The pole figures
were determined between 0 and 360� in ’ as well as 0–80� in �with steps of 4�. The defocusing-induced intensity decrease
with increasing tilting angle was estimated by accompanying
measurements on powder samples of different materials. For
both kinds of experiments, cross sections were prepared by a
standard metallographic procedure including grinding up to a
grid of P4000 and subsequent polishing with 1 mm diamond
suspension as well as oxide polishing suspension OP-S
provided by Buehler.
3. Results and discussion
3.1. Crystallographic data from literature – revisited
The orientation relationship of FeAl and FeAl2 was
previously investigated by Bastin et al. (1978) and Hirata et al.
(2008) using the Weissenberg technique and transmission
electron microscopy, respectively. Thereby, Bastin et al.
revealed ½111�FeAl jj ½100�BastinFeAl2
and ð011ÞFeAl jj ð002ÞBastinFeAl2
based
on a pseudo-monoclinic description of the FeAl2 crystal
structure in directionally solidified, fully lamellar material
(Livingston, 1973).1 Despite the fact that Bastin et al. inves-
tigated fully lamellar material, they were not able to identify
preferential interface planes between the two structures.
Hirata et al. (2008) determined ½111�FeAl jjNð241ÞCorbyFeAl2
and
ð110ÞFeAl jj ð221ÞCorbyFeAl2
using crystallographic data (triclinic
description) for FeAl2 provided by Corby & Black (1973).
Note that the angle between Nð241ÞCorbyFeAl2
and Nð221ÞCorbyFeAl2
is
91.26� whereas ½111�FeAl and Nð110ÞFeAl are perpendicular.
This issue is addressed in x3.2. In their approach, an Al-lean
alloy with 55 at.% Al, exhibiting a B2 matrix with FeAl2
particles, was used. Because particles were analysed, prefer-
ential interfaces were not obtained. Since it cannot easily be
rationalized whether the two relationships are similar or not, a
research papers
J. Appl. Cryst. (2016). 49, 442–449 A. Scherf et al. � Orientation relationship of eutectoid FeAl and FeAl2 443
1 Throughout the article, superscripts in crystallographic notations highlightthe crystallographic data set and subscripts denote the phase. Moreover, [ . . . ]and h . . . i are used for directions and crystallographically equivalentdirections, respectively, whereas ( . . . ) and { . . . } are used for planes andcrystallographically equivalent planes, respectively. The mathematical expres-sion describing two parallel planes in the two structures ( . . . )FeAl || ( . . . )FeAl2
holds true also for the plane normals of the mentioned planes. If directions areparallel to plane normals, the description by Hirata et al. in the form of[ . . . ]FeAl || N( . . . )FeAl2
is used.

comparison of the two data sets was carried out first. For this
purpose, suitable transformations of the crystallographic data
were examined with respect to a recent re-determination
described as follows.
Crystallographic data by Chumak et al. (2010) are used as
the reference data for FeAl2. The lattice parameters are
summarized in Table 1. For comparison, the original crystal-
lographic data, as used by Bastin et al. (1978) and Hirata et al.
(2008), are included in Table 1 as well. In the case of Corby &
Black (1973), a suitable transformation is given by the Inor-
ganic Crystal Structure Database (ICSD, collection code
150477) as a0 = a, b0 =�b and c0 = a� c. The transformation of
the data, determined by Bastin et al. (1978), was derived to be
a0 = c, b0 = a + c and c0 = 12 (b + c). For the description of the
crystal structure in a pseudo-monoclinic framework, Bastin et
al. (1978) used a non-primitive unit cell exhibiting twice the
volume of the primitive unit cell evaluated by Chumak et al.
(2010). In order to visualize the derived transformations, the
basis vectors transformed accordingly are presented in
stereographic projection in Fig. 1 with respect to the unit cell
of Chumak et al. (2010).
The congruence of ½100�ChumakFeAl2
� ½100�CorbyFeAl2
� ½001�BastinFeAl2
,
½010�ChumakFeAl2
� ½010�CorbyFeAl2� ½101�Bastin
FeAl2as well as of ½001�Chumak
FeAl2�
½101�CorbyFeAl2� ½0 1
212�
BastinFeAl2
in the stereographic projection in Fig. 1
illustrates that the descriptions of FeAl2 are similar and can be
transformed appropriately. In order to compare the previously
determined orientation relationships, transformed and reor-
iented data for the triclinic FeAl2 phase will be used in the
following.
The stereographic projections presenting the orientation
relationship between FeAl and FeAl2 according to Bastin et al.
research papers
444 A. Scherf et al. � Orientation relationship of eutectoid FeAl and FeAl2 J. Appl. Cryst. (2016). 49, 442–449
Table 1Comparison of lattice parameters of FeAl2 according to the relevant references and appropriate transformations.
Reference/transformation a (A) b (A) c (A) � (�) � (�) � (�) Volume (A3)
Chumak et al. (2010) 4.8745 6.4545 8.7361 87.93 74.396 83.062 262.79Corby & Black (1973) 4.878 6.461 8.800 91.75 73.27 96.89 263.69Transformation by a0 = a, b0 = �b, c0 = a � c 4.878 6.461 8.748 87.93 74.45 83.11 263.69Bastin et al. (1978) 7.594 16.886 4.862 89.55 122.62 90.43 525.10Transformation by a0 = c, b0 = a + c, c0 = 1
2 (b + c) 4.862 6.442 8.806 88.24 73.48 83.15 262.55
Figure 1Stereographic projection of the transformed basis vectors according tothe different descriptions of the FeAl2 phase with respect to the unit cellreported by Chumak et al. (2010).
Figure 2Stereographic projection of the orientation relationship between FeAland FeAl2 according to (a) Bastin et al. with ½111�FeAl jj ½100�Bastin
FeAl2and
ð011ÞFeAl jj ð002ÞBastinFeAl2
[in terms of the Chumak data (Chumak et al., 2010):
½111�FeAl jjNð241ÞChumakFeAl2
and ð011ÞFeAl jj ð221ÞChumakFeAl2
], (b) Hirata et al. with
½111�FeAl jjNð241ÞCorbyFeAl2
and ð110ÞFeAl jj ð221ÞCorbyFeAl2
[in terms of the Chumak
data (Chumak et al., 2010): ½111�FeAl jjNð241ÞChumakFeAl2
and ð110ÞFeAl jj
ð221ÞChumakFeAl2
]. For the pole projection of lattice planes, the normal vector
of the planes is used.

(1978) and Hirata et al. (2008) are shown in Fig. 2. This clearly
reveals that the two orientation relationships are not neces-
sarily identical. It is possible to achieve congruence of both
data sets by a rotation operation of 180� about a h112iFeAl
direction in the centres of Figs. 2(a) and 2(b) or by applying
the inversion symmetry of the FeAl2 phase, which is assumed
by the crystallographic data in Chumak et al. (2010). In the
latter case, both orientation relationships describe the same
situation. In contrast, a 180� rotation about a h112iFeAl axis
corresponds to the common twin system f112gh111i of body-
centred cubic metals (Christian & Mahajan, 1995) as well as of
the ordered structures derived from that (Cahn & Collect,
1961). In principle, the two twin-related orientations of FeAl
can be caused by either twin boundaries within a single FeAl
lamella which form during the transformation of the " phase to
FeAl or growth of two different variants of FeAl separated by
the FeAl2 phase. These two possibilities can be examined with
automated orientation imaging microscopy using EBSD as has
been done in this study. The occurrence of inversion symmetry
of FeAl2 or inversion twinning within FeAl2 cannot be
investigated by the applied methods.
3.2. As-cast material
Figs. 3(a) and 3(b) show examples of the obtained electron
backscatter patterns for the later orientation determination of
FeAl2 and FeAl, respectively. Despite a low number of zone
axes in the case of FeAl2, a robust assignment of zone axes was
possible in order to determine phase and orientation within
the probed sample volume.
The orientation mapping [colour code according to the
inverse pole figure (IPF) of the sample surface normal, see
insets and description of Fig. 4(a)] of the as-cast state in
Fig. 4(a) shows four different colonies of varying orientation.
The volume fractions of the phases are approximately 40 and
60 vol.% for FeAl and FeAl2, respectively. This is higher than
the theoretical evaluation which leads to 28 and 72 vol.%
based on the phase diagram and the crystallographic data. The
shift of the relative proportions might be attributed to the high
cooling rate in the water-cooled copper mould. The rotation of
the lamellar traces on the surface for the colony in the centre
of Fig. 4(a) is marked by blue dashed lines indicating
maximum deviation from the mean rotation. The stereo-
graphic projection in Fig. 4(c) illustrates the determined
orientation relationship of the two phases within the colony in
the centre of the image [the complete set of stereographic
projections for all colonies in Fig. 4(a) is provided as
supporting information]. In accordance with the previous
investigations, ½111�FeAl is almost parallel to Nð241ÞChumakFeAl2
and
ð110ÞFeAl is parallel to ð221ÞChumakFeAl2
in all cases. Nevertheless, as
mentioned before the angle between Nð241ÞChumakFeAl2
and
Nð221ÞChumakFeAl2
remains 91.26�, indicating that ð110ÞFeAl and
Nð221ÞChumakFeAl2
are not the habit planes of these structures. In
order to determine the interface plane of the lamellae, the
inclination of the colonies was determined on cross sections
prepared by FIB. A cross section in Fig. 4(a) is shown in
Fig. 4(b). The rotation and inclination with respect to the
horizontal image edge and the sample surface, respectively,
were determined from Figs. 4(a) and 4(b). These are included
in the stereographic projections in Fig. 4(c) as blue lines in the
radial and peripheral directions. The intersections of these
lines correspond to the interface plane normal. In all investi-
gated cases, ð114ÞChumakFeAl2
with minor deviations was found as the
common plane between FeAl and FeAl2. Owing to the distinct
orientation relationship, this coincides well with ð110ÞFeAl. An
according low-indexed direction in FeAl2 within ð114ÞChumakFeAl2
could be identified as ½110�ChumakFeAl2
. Moreover, ½110�ChumakFeAl2
is
found to be parallel to ½111�FeAl. Thus, the orientation rela-
tionship between FeAl and FeAl2 can now be expressed in
terms of the habit planes in the following way:
½111�FeAl jj ½110�ChumakFeAl2
and ð101ÞFeAl jj ð114ÞChumakFeAl2
. This is
discussed on the basis of a crystallographic model in x3.4 in
more detail. In addition, there is no evidence for an alter-
nating orientation change or twinning of the FeAl lamellae.
research papers
J. Appl. Cryst. (2016). 49, 442–449 A. Scherf et al. � Orientation relationship of eutectoid FeAl and FeAl2 445
Figure 3Electron backscatter patterns of (a) FeAl2 and (b) FeAl.

research papers
446 A. Scherf et al. � Orientation relationship of eutectoid FeAl and FeAl2 J. Appl. Cryst. (2016). 49, 442–449
Figure 5(a) Orientation mapping according to the inverse pole figure of thesolidification direction on the cross section of the rod (same insets as inFig. 4). Missing points in the centre of the image are caused by beamdamage. (b) An example of a SEM micrograph on a cross sectionprepared by FIB (secondary electron contrast, tilt-corrected). Therotation and inclination with respect to the horizontal image edge andthe sample surface, respectively, are highlighted by blue lines. The meanvalue obtained by analysing several colonies is indicated by a dashed line– the standard deviation by dotted lines. (c) Stereographic projection ofthe determined orientations of the colony in the centre of (a). Blue linesindicate rotation and inclination of the lamella traces according to (a) and(b). For the pole projection of lattice planes, the normal vector of theplanes is used.
Figure 4(a) Orientation mapping according to the inverse pole figure of thesurface normal on a cross section of the arc-melted button (see insets;centre of the IPF of FeAl2 corresponds to ½001�Chumak
FeAl2, standard triangle of
FeAl encloses ½100�FeAl, ½110�FeAl and ½111�FeAl). Blue lines indicateminima and maxima of the lamella trace rotation with respect to thehorizontal edge of the colony in the centre of the image. (b) An exampleof a SEM micrograph on a cross section prepared by FIB (secondaryelectron contrast, tilt-corrected). The blue dashed line indicates the meanof the lamella trace inclination with respect to the sample surfaceobtained from several cross sections. The standard deviation is high-lighted by dotted lines. (c) Stereographic projection of the determinedorientations of the colony in the centre of (a). Blue lines indicate rotationand inclination of the lamella traces according to (a) and (b). Thecomplete set of stereographic projections for all colonies in (a) isprovided as supporting information. For the pole projection of latticeplanes, the normal vector of the planes is used.

3.3. Directionally solidified materialAn orientation mapping of the directionally solidified
material analogous to Fig. 4 is presented in Fig. 5(a). The
volume fractions of FeAl and FeAl2 are in agreement with the
theoretical calculations with approximately 30 and 70 vol.%,
respectively. The solidification direction is perpendicular to
the plane of the image. The map is characterized by a rotation
angle of about (53 2)� with respect to the horizontal edge
(blue dashed lines) of the lamellae on the prepared surface as
well as homogeneous crystallographic orientations of FeAl
and FeAl2 with respect to the solidification direction. Hence,
the boundaries between the colonies visible in Fig. 5(a) are
small-angle colony boundaries. The inclination of the lamellae
into the depth of the investigated material is uniform, too. The
inclination angle is about (75 3)� with respect to the sample
surface as highlighted by blue dashed lines in Fig. 5(b). The
stereographic projection in Fig. 5(c) (centre represents the
solidification direction) illustrates the determined orientation
relationship of the directionally solidified material which is the
same as found for the as-cast state (see Fig. 4c) and the rela-
tionships presented in Fig. 2. The orientation relationship
seems to be robust with respect to different conditions of
formation: it is observed not only during precipitation of FeAl
(Hirata et al., 2008) but also during fast and slow cooling of
fully lamellar material. Again, no alternating FeAl orienta-
tions or twinning of FeAl occurred. The determination of the
interface plane normal by the measurement of rotation and
inclination of the lamellae also reveals the congruence
ð114ÞChumakFeAl2
� ð110ÞFeAl within the interface.
In order to verify the local results on a large scale, texture
measurements using an X-ray goniometer were carried out.
The experimental pole figures are shown in Figs. 6(a)–6(d).
Distinct spots within the pole figures indicate strong texturing
of the investigated material. In the case of FeAl2, the low
crystal symmetry causes single spots within the range of the
measurement. The slightly increased intensity at high tilt angle
visible in Figs. 6(a)–6(d) is caused by insufficient correction of
defocusing. Additional signals in the measured pole figures
might be caused by overlapping Bragg positions at the chosen
2� value. By applying the obtained orientation information, a
research papers
J. Appl. Cryst. (2016). 49, 442–449 A. Scherf et al. � Orientation relationship of eutectoid FeAl and FeAl2 447
Figure 6Texture analysis of directionally solidified material: (a) to (d) experimental XRD pole figures of FeAl2 and FeAl (defocusing corrected). (e)Stereographic projection of FeAl and FeAl2 revealing an alignment of the solidification direction near to the h110iFeAl axis of the FeAl phase as well as anorientation relationship according to ð011ÞFeAl jj ð114ÞChumak
FeAl2and ½111�FeAl jj ½110�Chumak
FeAl2. For the pole projection of lattice planes, the normal vector of the
planes is used.
stereographic projection is calculated and
presented in Fig. 6(e) (the simulations of the
pole figures are included in the supporting
information). FeAl exhibits an alignment of
�h110iFeAl parallel to the solidification
direction. As previously shown in the local
analysis by EBSD, the global texture
measurement provides evidence for the
same orientation relationship between FeAl
and FeAl2.
3.4. Crystallographic model
Based on the experimental determination
of the orientation relationship and interface
plane between FeAl and FeAl2, a model of

the crystallographic relationships of the phases participating in
the eutectoid decomposition can be derived. As previously
pointed out by Stein et al. (2010), the unit-cell parameter of
the high-temperature Fe5Al8 phase is approximately three
times larger than that of FeAl. The unit cell of Fe5Al8 is indeed
a 33 superstructure with 52 atoms and two vacancies in
comparison to the W prototype. Thus, a cube-on-cube relation
is to be expected.
Fig. 7 shows the atomic sites based on crystallographic data
determined close to the decomposition temperature (Stein et
al., 2010). In Fig. 7(a), the crystal structures of Fe5Al8 and
FeAl are displayed with a [111] viewing direction. The
assumption of a cube-on-cube relation seems to be reasonable
owing to the common hexagonal arrangement of atomic
columns in both phases. According to the determined orien-
tation and interface relationship, FeAl2 is viewed from
½110�ChumakFeAl2
with a ð114ÞChumakFeAl2
plane towards a ð101ÞFeAl of
FeAl. The hexagonal arrangement of atomic columns is
observed, too. The hexagonal arrangement is formed by
ð114ÞChumakFeAl2
, ð113ÞChumakFeAl2
and ð221ÞChumakFeAl2
planes (note that
½110�ChumakFeAl2
describes the intersection line of all three planes
accurately). These planes show the highest structure factors of
FeAl2 indicating the closest-packed planes within this struc-
ture. The highest structure factor and, thus, highest atomic
packing is found for ð114ÞChumakFeAl2
. This might result in the
exclusive selection of the observed habit planes since ð101ÞFeAl
is the closest-packed plane for FeAl. Fig. 7(b) provides a
scheme of the atomic sites within the interface between FeAl
and FeAl2. Thus, ð101ÞFeAl and ð114ÞChumakFeAl2
are arranged in-
plane whereas the viewing directions of the aforementioned
Fig. 7(a) are pointing upwards.
The strains between FeAl and FeAl2 which have to be
accommodated at the interface can be analysed by the lattice
plane distances provided in Fig. 7(b). At the maximum a
deviation of 0.14% is observed within the interface, indicating
a very good compatibility.
Future local high-resolution investigations with respect to
lattice structure and chemistry of the interface should be
performed in order to reveal the interface structure as well as
the possibility of slip transfer between the investigated phases.
f110gFeAl surfaces are known to reorganize to FeAl2
commensurate structures for energetic reasons (Baddorf &
Chandavarkar, 1996). Hence, similar effects are also expected
for the interface between FeAl and FeAl2. This might be
facilitated by the changing Al content in both phases during
cooling which will lead to locally changing lattice parameters
in the vicinity of the interface. In addition, the interface
structure of branched lamellae, as shown in Fig. 4(b) and
frequently found in this system, remains unclear.
4. Conclusions
This study provides the following main results regarding the
orientation and interface relationship of FeAl and FeAl2
resulting from a eutectoid decomposition of Fe5Al8:
(i) The orientation relationship determined by Bastin et al.
and Hirata et al. was confirmed in fully lamellar as-cast and
directionally solidified material.
(ii) In addition, the interface of FeAl and FeAl2 lamellae is
found to be ð101ÞFeAl jj ð114ÞChumakFeAl2
. Based on this habit plane
the orientation relationship can be set up by ½111�FeAl jj
½110�ChumakFeAl2
.
research papers
448 A. Scherf et al. � Orientation relationship of eutectoid FeAl and FeAl2 J. Appl. Cryst. (2016). 49, 442–449
Figure 7Schematic drawings of the crystallographic model based on thedetermined orientation relationship and interface of FeAl and FeAl2.A possible orientation relationship of Fe5Al8 is also proposed. (a)[111]Fe5Al8
of the high-temperature " phase, ½110�ChumakFeAl2
of FeAl2 and½111�FeAl are pointing out-of-plane. The interface planes of FeAl2 andFeAl are ð114ÞChumak
FeAl2jj ð101ÞFeAl. (b) Atomic sites within the interface
planes ð101ÞFeAl and ð114ÞChumakFeAl2
. Semi-transparent sites are off the
interface plane of the particular phases. The drawings are based onVESTA (Momma & Izumi, 2011) graphics using crystallographic data at1373 K (Fe5Al8) and 1353 K (FeAl2 and FeAl). The translations betweenthe phases are anticipated or arbitrary. For characterization of theviewing directions, the normal vectors of the lattice planes are used andsymbolized by Nð. . .Þ.

(iii) There is no evidence for an alternating orientation
change of FeAl lamellae suggesting that FeAl2 has inversion
symmetry.
(iv) The directional solidification leads to a near h110iFeAl ||
solidification direction texture.
(v) The observed orientation and interface relationship can
be described well by a crystallographic model. In addition, a
possible orientation relationship to the high-temperature
Fe5Al8 phase is proposed.
Acknowledgements
The authors gratefully acknowledge funding by the German
Research Foundation (DFG) within the project ‘Fein-lamel-
lare Fe–Al in situ Kompositwerkstoffe’ (HE 1872/26-1). AK
thanks the Carl-Zeiss-Foundation for financial support in the
form of a postdoctoral grant. This work was partly carried out
with the support of the Karlsruhe Nano Micro Facility
(KNMF, http://www.knmf.kit.edu/), a Helmholtz Research
Infrastructure at Karlsruhe Institute of Technology (KIT,
http://www.kit.edu/index.php). We gratefully acknowledge
funding of the Bruker D8 through the Helmholtz Energy
Materials Characterization Platform (HEMCP) initiated by
the Helmholtz Association and coordinated by Forschungs-
zentrum Julich. Thanks are due to Professor John Perepezko,
University of Madison, Wisconsin, and Professor Sharvan
Kumar, Brown University, Providence, for fruitful discussions.
References
Baddorf, A. P. & Chandavarkar, S. S. (1996). Phys. B Condens. Matter,221, 141–144.
Bastin, G. F., van Loo, F. J. J., Vrolijk, J. W. G. A. & Wolff, L. R.(1978). J. Cryst. Growth, 43, 745–751.
Cahn, R. W. & Collect, J. A. (1961). Acta Metall. 9, 138–148.Christian, J. W. & Mahajan, S. (1995). Prog. Mater. Sci. 39, 1–157.Chumak, I., Richter, K. W. & Ehrenberg, H. (2010). Acta Cryst. C66,
i87–i88.Corby, R. N. & Black, P. J. (1973). Acta Cryst. B29, 2669–2677.Fujiwara, T., Nakamura, A., Hosomi, M., Nishitani, S. R., Shirai, Y. &
Yamaguchi, M. (1990). Philos. Mag. A, 61, 591–606.Hirata, A., Mori, Y., Ishimaru, M. & Koyama, Y. (2008). Philos. Mag.
Lett. 88, 491–500.Huang, S.-C. (1992). Metall. Trans. A, 23, 375–377.Inui, H., Oh, M., Nakamura, A. & Yamaguchi, M. (1992). Acta Metall.
Mater. 40, 3095–3104.Livingston, J. D. (1973). Proc. Conf. In Situ Composites, Publication
NMAB-308, Vol. I, p. 87. Washington, DC: National Academy ofSciences.
Momma, K. & Izumi, F. (2011). J. Appl. Cryst. 44, 1272–1276.Risanti, D., Deges, J., Falat, L., Kobayashi, S., Konrad, J., Palm, M.,
Poter, B., Schneider, A., Stallybrass, C. & Stein, F. (2005).Intermetallics, 13, 1337–1342.
Stein, F., Vogel, S. C., Eumann, M. & Palm, M. (2010). Intermetallics,18, 150–156.
Yamaguchi, M., Johnson, D. R., Lee, H. N. & Inui, H. (2000).Intermetallics, 8, 511–517.
research papers
J. Appl. Cryst. (2016). 49, 442–449 A. Scherf et al. � Orientation relationship of eutectoid FeAl and FeAl2 449