Organized Crime, Violence, and Politics - Harvard...
50
Organized Crime, Violence, and Politics * Alberto Alesina † Salvatore Piccolo ‡ Paolo Pinotti § First Draft: December 2015 This Draft: November 2016 Abstract We show that in Sicily Mafia killings of politicians increase before elections and have negative effects on the vote received by parties not captured by the Mafia. Then, using a very large data set of electoral speeches, we find strong evidence that anti-mafia activities by politicians elected in Sicily are, in fact, negatively correlated with the levels of pre-electoral violence. Using data on homicides in all regions of Italy starting from the end of the nineteenth century, we identify a political cycle of homicides only in regions with organized crime. We also show how this electoral cycle changes as a function of different electoral rules and the relative strength of captured and non-captured parties. All these empirical findings are rationalized by a simple signaling model in which criminal organizations exert pre-electoral violence to inform adverse politicians about their military strength. Keywords: organized crime, electoral violence, voting, political discourse JEL codes: K42, D72 Politics and mafia are two powers on the same territory; either they make war or they reach an agreement. Paolo Borsellino, Anti-Mafia Prosecutor, assassinated by the Mafia You make war to live in peace. Tot`o Riina, Mafia Boss * We would like to thank Unicredit and Universities Foundation and EIEF for financial support. For useful comments we are grateful to Ylenia Brilli, Paolo Buonanno, Ernesto Dal Bo, Melissa Dell, Rafael Di Tella, Claudio Ferraz, Nicola Gennaioli, Armando Miano, Luisa Patruno, Aldo Pignataro, Shanker Satyanath, Andrei Shleifer, Francesco Sobbrio, Guido Tabellini, and seminar participants at NBER Culture and Institutions Meeting 2016, Barcelona GSE Summer Forum, Bocconi University, Universitat de Barcelona, EEA-ESEM (Toulouse, 2014), Paris School of Economics, the 2016 Transatlantic Workshop on the Economics of Crime, and the 2016 Workshop on Economics of Crime and Conflict (Bergamo). Gabriele Borg, Elisa Facchetti, Armando Miano, and Benjamin Villanyi provided excellent research assistance. † Harvard University, IGIER, CEPR, and NBER ‡ Catholic University of Milan, Department of Economics and Finance, and CSEF (Naples) § Bocconi University, BAFFI-CAREFIN Center, Fondazione Debenedetti, and CEPR 1
Transcript of Organized Crime, Violence, and Politics - Harvard...

Organized Crime, Violence, and Politics∗
Alberto Alesina† Salvatore Piccolo ‡ Paolo Pinotti§
First Draft: December 2015
This Draft: November 2016
Abstract
We show that in Sicily Mafia killings of politicians increase before elections and
have negative effects on the vote received by parties not captured by the Mafia.
Then, using a very large data set of electoral speeches, we find strong evidence that
anti-mafia activities by politicians elected in Sicily are, in fact, negatively correlated
with the levels of pre-electoral violence. Using data on homicides in all regions of
Italy starting from the end of the nineteenth century, we identify a political cycle
of homicides only in regions with organized crime. We also show how this electoral
cycle changes as a function of different electoral rules and the relative strength of
captured and non-captured parties. All these empirical findings are rationalized by
a simple signaling model in which criminal organizations exert pre-electoral violence
to inform adverse politicians about their military strength.
Keywords: organized crime, electoral violence, voting, political discourse
JEL codes: K42, D72
Politics and mafia are two powers on the same territory;
either they make war or they reach an agreement.
Paolo Borsellino, Anti-Mafia Prosecutor, assassinated by the Mafia
You make war to live in peace.
Toto Riina, Mafia Boss
∗We would like to thank Unicredit and Universities Foundation and EIEF for financial support. Foruseful comments we are grateful to Ylenia Brilli, Paolo Buonanno, Ernesto Dal Bo, Melissa Dell, RafaelDi Tella, Claudio Ferraz, Nicola Gennaioli, Armando Miano, Luisa Patruno, Aldo Pignataro, ShankerSatyanath, Andrei Shleifer, Francesco Sobbrio, Guido Tabellini, and seminar participants at NBERCulture and Institutions Meeting 2016, Barcelona GSE Summer Forum, Bocconi University, Universitatde Barcelona, EEA-ESEM (Toulouse, 2014), Paris School of Economics, the 2016 Transatlantic Workshopon the Economics of Crime, and the 2016 Workshop on Economics of Crime and Conflict (Bergamo).Gabriele Borg, Elisa Facchetti, Armando Miano, and Benjamin Villanyi provided excellent researchassistance.†Harvard University, IGIER, CEPR, and NBER‡Catholic University of Milan, Department of Economics and Finance, and CSEF (Naples)§Bocconi University, BAFFI-CAREFIN Center, Fondazione Debenedetti, and CEPR
1

1 Introduction
In many countries, even rich ones, criminal organizations thrive thanks to their connec-
tions with the polity. In order to benefit from the profit opportunities afforded by the
allocation of public works and procurement contracts, criminal organizations instruct
captured politicians to distort the allocation of public funds in their favor.1 Politicians
also use their influence to weaken enforcement against organized crime.2 In order to
achieve these goals, criminal organizations around the world use various tools, including
terror and violence.3
In this paper we study the use of pre-electoral violence by criminal organizations as a
means of influencing elections. This violence serves two purposes. First, it damages anti-
mafia parties in the electoral competition. Second, by signaling the strength of organized
crime, it affects the behavior of appointed politicians. Through these channels, organized
crime can profoundly affect the functioning of democracies.
We investigate these phenomena by exploiting several rich data sets on criminal or-
ganizations and politics in Italy, a country historically plagued by organized crime. In
particular, we take advantage of unique data on victims of the Sicilian Mafia, electoral
results, and parliamentary activity of members of the national parliament (MPs) ap-
pointed in Sicily since 1945. Using these data, we first uncover abnormal increases in the
number of political murders (i.e., murders of party and union members) perpetrated by
the Sicilian Mafia during the year preceding an election. The increase is sizable, from
0.034 to 0.098 victims per month. It is specific to political murders – there is no in-
crease in, say, the number of entrepreneurs or judges killed by the Mafia.4 In principle,
electoral violence may have two opposite effects on the vote share of anti-mafia parties.
On the one hand, voters could punish parties that are more connected with the Mafia
in response to more murders. On the other hand, they may turn in favor of the parties
allied with the Mafia in order to guarantee ‘peace’ and avoid additional violence; also,
violence can directly damage the electoral machine of anti-mafia parties (e.g., by killing
party activists). Our empirical results suggest that the latter effects prevail in the data.
For historical reasons (discussed in the next Section) the Sicilian Mafia traditionally
opposed left-wing groups, such as the Communist and Socialist parties and the labor
unions, while favoring parties to the Center-Right of the political spectrum. In fact, we
find that an additional political homicide during the electoral period brings, on average,
1See Schelling (1971) for an early theoretical analysis and Barone and Narciso (2015) for evidence onthe allocation of public investment subsides in Sicily.
2Acemoglu et al. (2013) discuss the generalized amnesty enacted by Colombian President Uribe infavor of members of paramilitary groups.
3Lupo (2013) and Solis and Aravena (2009) provide extensive anecdotal evidence from Italy and LatinAmerica, respectively.
4Clearly, electoral violence may include many other activities besides homicides, like non-lethal at-tacks, disruption of campaign activities, arsons etc. We focus on homicides because (i) more data areavailable on these (extreme) events, and (ii) they are less subject to the under-reporting issues.
2

a 3 percentage point decrease in the vote share of the Left across all national elections
between 1948 and 2013. This finding is consistent with event-study evidence from an
infamous massacre of left-wing activists on Labour Day 1947, which is associated with a
dramatic sway of votes away from leftist parties in the following elections.
Turning to the behavior of appointed politicians, we measure their efforts to fight the
Mafia by the number of times they mention it in official parliamentary debates, on the
(reasonable) premise that they do so to attract attention to the problem of organized
crime (and not to praise it). We thus collect the transcripts of all parliamentary debates
that featured at least one intervention by an MP appointed in Sicily – about 300,000 pages
in total – and we measure the occurrence of the word “Mafia” by MP-legislature. We find
that one additional political homicide during the electoral period lowers the probability
that a given MP mentions the Mafia at least once over the following legislature by 4
percentage points – on a baseline probability of 10 percent. This effect operates through
both an “extensive” and an “intensive” margin. MPs of the Left talk more about the
Mafia, and the negative effect of political homicides on the vote share of the Left reduces
their probability of appointment in the parliament (the “extensive” margin). Conditional
on partisan affiliation, political homicides reduce the propensity of all MPs to talk about
the Mafia (the “intensive” margin). Interestingly, the reduction is stronger for MPs of
the Left, who are the most likely targets of future Mafia violence; conversely, it is weaker
for MPs appointed in other regions, who are probably less threatened by the Mafia. Once
again, the effect is specific to political homicides. Indeed, other (non-political) homicides
have an opposite effect, increasing the salience of Mafia in parliamentary debates, the
more so for MPs of the Left.
Unfortunately, we do not have as detailed information on the victims of the other
criminal organizations active in Italy – the Camorra in Campania and the ’Ndrangheta
in Calabria – as we have for the Sicilian Mafia.5 To overcome this limitation, we compare
homicides between Italian regions with and without an historical presence of criminal
organizations, through electoral and non-electoral periods. Although local homicide rates
are a coarse measure of violence by criminal organizations, they have the advantage of
being available for all Italian regions since 1887. Rich institutional variation over this
long-run period allows us to quantify electoral violence under different levels of political
contestability – as determined by the institutional regime, electoral system, and level of
political competition. To the extent that violence is a strategic tool used to influence
electoral and political outcomes, it should be used more when/where elections are more
contestable. Indeed, criminal organizations should abstain from violence when there is
little or no scope for affecting political and electoral equilibria.
5From now on, “mafia” denotes generically all criminal organizations ex. Art. 416-bis of the ItalianPenal Code (see, Section 2.1), while the “Mafia” denotes the specific criminal organization active inSicily.
3

The results across Italian regions confirm this intuition. We detect a significant in-
crease in homicides in mafia regions relative to non-mafia regions before elections in all
periods except during the Fascist dictatorship (1922-43). Elections held during this pe-
riod were one-party votes for the Fascist party – the only one admitted to run in the
1929 and 1934 elections – so criminal organizations had no chances of influencing polit-
ical equilibria. Democratic elections also varied in the degree of political contestability,
depending on the electoral system in place and the relative strength of different par-
ties. In particular, under a majoritarian system, in which candidates compete in several
single-member, first-past-the-post districts, political violence should be concentrated in
those swing districts where the electoral outcome is uncertain. This is because there is
little incentive to engage in violence where the preferred party is either very likely or
very unlikely to win the election – irrespective of the actions of the criminal group. By
contrast, under a proportional system, in which all candidates compete in a single, “at
large”electoral district, the incentives to perpetrate electoral violence should depend only
on the gap between parties at the national level. We find empirical support for these
predictions by exploiting the electoral reform of 1993, which changed the Italian electoral
system from proportional to majoritarian. We provide a simple theoretical model that
rationalizes these empirical findings.
We are not the first to study violence as a political tool. In their pioneering work,
Dal Bo and Di Tella (2003) show how interest groups may use violence to manipulate
elected politicians.6 Dal Bo et al. (2006, 2007) build on the same idea but allow for the
use of both monetary incentives and self-enforceable punishments within a unified frame-
work, and derive implications for the quality of public officials.7 The main implication
of these models is that, in order to influence political decisions, criminal organizations
should perpetrate violence against politicians in office.8 Our empirical results suggest that
violence before elections is at least as valuable as violence after elections as a strategy
for influencing political outcomes.
Using media reports on attacks against Italian local politicians (i.e., mayors and city
councilors) over the period 2010-2014, Daniele and Dipoppa (2016) show that violence
increases mostly after local elections. A potential reconciliation of the different timing
of political violence in national and local elections is that, ex-ante, criminal organiza-
tions may have less information on candidates and parties running in local elections.
Thus they do not quite know whom to target ex-ante. In fact, the greatest majority
6See also Collier and Vicente (2012). More generally, the idea that special interest groups may try toexert political influence dates back to early work in public choice theory – see, e.g., the articles collectedin Buchanan et al. (1980).
7This follows the tradition of economic models of lobbying, which focus primarily on the role ofpositive (monetary) incentives — see, e.g., Bernheim and Whinston (1986), Grossman and Helpman(1994), and Leaver (2009) among others.
8See also Ellman and Wantchekon (2000) who study a model in which riots are used strategically bythe party that loses the elections to hold up politicians that take office.
4

of local politicians are affiliated to a myriad of local party lists (“liste civiche”). Based
on our own calculations on publicly available data from the Italian Ministry of Interior
(www.amministratori.interno.it) this was the case for 75% of all local politicians in office
in 2014. Such local lists typically operate only in one of the 8,100 Italian municipalities
and have little or no connection with national mass parties. In this case, a “wait-and-see”
strategy may be more efficient. In national elections, instead, there is much less uncer-
tainty on the attitude of different parties towards criminal organizations. As we have
discussed above, Center-Right parties – the Christian Democrats before and the Forza
Italia party later on – were closer to Mafia interests than the leftist parties. Under these
conditions, it is more effective for criminal organizations to perpetrate violence before
elections, in order to influence not only the behavior of appointed politicians, but also
the chances of election of well identified anti-mafia candidates.
More generally, our results contribute to a burgeoning empirical literature on the
relationship between organized crime and the polity. De Feo and De Luca (2013) and
Buonanno et al. (2014) document the symbiotic relationship between the Sicilian Mafia
and Center-Right parties in the First and Second Republic, respectively; this is, indeed,
an important premise of our empirical analysis.9 Pinotti (2013) and Daniele (2015) test
the implications of Dal Bo et al. (2006, 2007) on the quality of the political class using data
on, respectively, national and local politicians in Italy. Consistent with the predictions
of the model, they find that politicians in mafia-ridden areas are negatively selected on
outside income opportunities. These papers are silent on the use of violence by criminal
organizations to influence electoral results and politicians’ behavior, the effectiveness of
such practices, and how such use varies with the type of institutional regime, electoral
rule, and level of political competition. These are the primary objectives of our empirical
and theoretical analysis.
The rest of the paper is structured as follows. Section 2 provides an historical overview
that explains why Italian criminal organizations — especially the Sicilian Mafia — are
of particular interest. Hence, in Section 3 we consider mafia killings in Sicily and their
effects. In Section 4 we consider all regions of Italy for a longer historical period. Section
5 provides a model that rationalizes our results, focusing on the role of the electoral
system. Section 6 concludes. Additional results and proofs are in the Appendix.
9Acemoglu et al. (2013) provide evidence of a similar relationship in Colombia between paramilitariesand the so-called “third political parties”.
5

2 Institutional and historical background
2.1 Criminal organizations in Italy
Article 416-bis, introduced into the Italian Penal Code in 1982, defines a mafia-type
criminal organization as a “stable association that exploits the power of intimidation
granted by the membership in the organization, and the condition of subjugation and
omerta10 that descend from it, to commit crimes and acquire the control of economic
activities, concessions, authorizations, and public contracts”. As of the end of 2013 —
the last year in which these data are available — 5,470 people have been charged with
this crime, 4,148 of whom in Sicily, Campania, and Calabria.11 These southern regions
host three of the oldest and most powerful criminal organizations in the World: Mafia,
Camorra, and ’Ndrangheta.12
The definition in Article 416-bis highlights three fundamental features of these crim-
inal groups. First, they are organizations governed by a complex hierarchical structure.
For example, the Sicilian Mafia, which is of primary interest for the present paper, has
a distinctively pyramidal structure. At the base there is a multitude of criminal groups
(clans) that control criminal businesses — extortion, racketeering, drug smuggling, loan
sharking, prostitution, etc. — in a town or city neighborhood. Clans are organized
into districts (mandamenti) of three or four geographically adjacent clans. Each district
elects a representative to sit on its Provincial Commission, whose primary role is to re-
solve conflicts between the clans and to regulate the use of violence. Finally, the apex
of the pyramid is the Regional Commission (Cupola), which takes decisions regarding
alliances or wars with other criminal organizations, the commission of terrorist attacks,
or the murder of prominent politicians and public officials.13
The second major feature of mafia groups highlighted by Article 416-bis is the power of
intimidation. These organizations command thousands of heavily armed men, equipped
with machine guns, RPG launchers, high-powered explosives, and armored cars. This
allows Mafia, Camorra, and ’Ndrangheta to control all criminal activity in their respective
regions of influence.
Finally, and most importantly, Article 416-bis emphasizes the reach of these criminal
groups into the official economy. Mafia-type organizations derive part of their profits from
10The omerta is a code of conduct prohibiting the reporting of fellow members to authorities. Althoughit is sometimes disguised as a “rule of honor”, it rests in practice upon the threat of extreme violenceagainst the relatives of informants.
11Obviously, these figures greatly understate the size of these organizations, as omerta limits whistle-blowing and other sources of reporting of mafia crimes (Acconcia et al., 2014).
12Two other regions in the South-East, Puglia and Basilicata, have also witnessed the presence ofcriminal organizations since the mid-1970s (Pinotti, 2015). However, such organizations have beentraditionally less powerful than Mafia, Camorra, and ’Ndrangheta, especially from a political perspective.
13The ’Ndrangheta adopts a similar pyramidal model, whereas the Camorra has a more horizontalstructure (Catino, 2014).
6

“the control of economic activities, concessions, authorizations, and public contracts”.
Schelling (1971) argued that public works and procurement contracts are attractive profit
opportunities for mafia-type organizations, since they allow extorted firms to offload the
predation costs on soft public budgets. According to the Italian judge Giovanni Falcone,
who led the so-called Maxi Trial against the Sicilian Mafia in 1987 — and was later killed
by the organization — “more than one fifth of Mafia profits come from public investment”
(Falcone, 1991). More recently, Barone and Narciso (2015) show that the allocation of
public investment funds is correlated with Mafia presence across Sicilian municipalities.
The embezzlement of public funds on a large-scale is only possible through the col-
lusion of political parties with criminal organizations. Indeed, the history of Mafia,
Camorra, and ’Ndrangheta has been inextricably intertwined with political power since
Italy’s Unification in 1861. The very origin of the Sicilian Mafia has been traced back
to the demand for protection from southern landlords and urban elites, generated by the
power vacuum that followed the defeat of the Kingdom of Two Sicilies (Bandiera, 2003).
In its role as protector, the Mafia also acted as a military force, fighting against workers’
protests and revolts (Gambetta, 1996).14
Over the subsequent decades, this tradition of collaboration between the Sicilian Mafia
and the conservative bloc remained pervasive. During the so-called First Italian Repub-
lic (1945-1993), the two protagonists in the Italian political arena were the Christian
Democrats and the Italian Communist Party. Some of the most prominent Sicilian mem-
bers of the Christian Democrats accepted the Mafia’s support to reinforce their positions
against leftist opponents. In return, if elected, they would use their influence to subvert
the police and judicial system interference with Mafia activities, both at the local and
national level (Falcone, 1991; Paoli, 2003; Lodato and Buscetta, 2007).
The collusion between a section of the Christian Democrats and criminal organizations
is apparent from judicial investigations into members of the Italian Parliament for mafia-
related crimes. We explored this relationship by looking at prosecutors’ requests to
proceed against a member of Parliament (“Richieste di autorizzazione a procedere”) — a
key step to lifting Parliamentary immunity, which protected national-level politicians from
judicial investigations. We used the data originally collected by Golden (2007) — and
used, among others, by Nannicini et al. (2013) — and added the types of crime described
in each request. The institution of Parliamentary immunity was abolished in 1993, so
our data cover only the period up to that year. Between 1945 and 1993, 11 members
of Parliament were investigated for mafia association ex. Article 416-bis; all of them
had been elected as representatives of the Christian Democrats or their government allies
14A formalization of Gambetta’s theory of protection is offered by Dixit (2003). In a repeated gamein which transactions involve asymmetric prisoners’ dilemmas, criminal organizations act as profit-maximizing private intermediaries that supply information and enforcement to parties whose trade is notprotected by state enforcement. In this context, he finds conditions under which private law enforcementdominates no enforcement: a theory of the emergence of criminal organizations.
7

of the Center-Right. In addition, many more politicians were investigated for “simple”
criminal association (Article 416 of the Penal Code) or for malfeasance, which typically
signal some relationship with criminal organizations – at least in mafia-ridden regions.15
Figure 1 shows that the Christian Democrats and their allies were more likely to be
investigated for mafia-related crimes compared to politicians of the Left, even more so
in Sicily, Campania, and Calabria. This finding is confirmed by OLS regressions of the
probability of being investigated on a dummy for partisan affiliation, a dummy for being
appointed in mafia regions, and the interaction between the two.16
Figure 1: Members of the Italian Parliament investigated for mafia-type criminal associ-ation and related crimes, 1945-1993
0%
2%
4%
6%
8%
10%
mafia association(Art. 416-bis)
criminal association(Art. 416)
malfeasance
Elected in Sicily
Centre-Right Centre-Left
0%
2%
4%
6%
8%
10%
mafia association(Art. 416-bis)
criminal association(Art. 416)
Malfeasance
Elected in Calabria
Centre-Right Centre-Left
0%
2%
4%
6%
8%
10%
mafia association(Art. 416-bis)
criminal association(Art. 416)
Malfeasance
Elected in Campania
Centre-Right Centre-Left
0%
2%
4%
6%
8%
10%
mafia association(Art. 416-bis)
criminal association(Art. 416)
Malfeasance
Elected in other regions
Centre-Right Centre-Left
Note: The graphs show the fraction of members of the Italian Parliament investigated for mafia-type criminal association(Article 416-bis of the penal code) and related crimes, by political alignment and region in which they were elected.
After the transition to the Second Republic (1993), a similar relationship holds be-
tween the Sicilian Mafia and important factions of the Center-Right coalition (Buonanno
et al., 2014). Criminal organizations have been especially interested in influencing na-
15Article 416 (“associazione a delinquere”) punishes all groups of three or more people involved insome type of criminal activity. As such, it does not recognize the specificity of mafia-types associationsin terms of stability, military power, and infiltration of the official economy. The category malfeasanceincludes instead different types of corruption.
16The results are presented in Table A1 of Appendix 3.
8

tional elections because criminal laws concerning the length and harshness of prison
sentences, mandatory resettlement of mafia members, seizures of assets, and harshness
of enforcement against criminal organizations are decided by the national Parliament.
2.2 The strategy of violence
In the first post-Fascism democratic elections for the Regional Government of Sicily, on
April 20, 1947, a coalition of communist and socialist parties clinched an unexpected
victory over the Christian Democrats. A few days later, on May 1, 1947, hundreds of
Sicilian peasants were celebrating the victory during the traditional ‘Labour Day’ parade
at Portella della Ginestra, when machine-gun fire broke out from the surrounding hills.
Eleven people were killed immediately and thirty-three wounded, some of whom died in
the following days. Although the bandit and separatist leader Salvatore Giuliano was
blamed for orchestrating the shooting at Portella, it later emerged that the Sicilian Mafia
ordered the massacre in reaction to the recent electoral success of the Left (Lupo, 2013).
Over the following months, the Mafia killed dozens of political activists, members of
worker unions, and peasants. When Sicilians voted again at the national elections on
April 18, 1948, Communists and Socialists obtained only 20.9% of the votes, down from
30.4% the previous year. The Christian Democrats, on the other hand, almost secured
an absolute majority, winning 47.9% of the vote, up from 20.5% the year before. Other
right-wing factions such as the fascist and the monarchist parties also gained considerable
ground.
Although particularly infamous, the episode of Portella Della Ginestra was just part
of a wider strategy of intimidation against left-wing groups, their candidates and the
electorate.17 During subsequent decades, the Sicilian Mafia killed many political activists
and local politicians, including the proponent of Article 416-bis, Pio La Torre, who was
the head of the Italian Communist Party in Sicily. Similarly, starting from the mid
70’s, the Sicilian Mafia exerted heavy political pressure to prevent national laws aimed at
harshening imprisonment conditions for convicted mafia members. In particular, between
1992 and 1995 the Sicilian Mafia undertook an aggressive intimidation campaign against
national politicians to force them to abolish Article 41-bis of the Penal Code, which
imposed extremely harsh prison conditions on members of criminal organizations.
Other criminal organizations in Italy have also engaged in violence and intimidation
against local politicians and party members, so much so that in 2013 the Italian Parlia-
ment instituted an ad-hoc Commission to investigate this phenomenon. The final report
produced by the Commission (Lo Moro et al., 2015) contains a list of political homi-
17Note that this episode is consistent with the signaling model that will be developed in the nextsection and not with a story in which violence is just a retaliation device. The reason is that, if usedas a threat, violence should have been directed toward center/right candidates that were responsible(vis-a-vis the mafia) for not winning the elections, rather than toward their opponents.
9

cides in Italy during the period 1974-2013. In the total of 143 such homicides, 104 were
committed in Sicily, Campania, and Calabria; see Figure 2.
Figure 2: Homicides of local administrators across Italian regions, 1974-2013
0
5
10
15
20
25
30
35
40
45
MAR EMR UMB TAA FVG VDA ABR PIE MOL TOS VEN BAS LIG LAZ PUG LOM SAR CAL CAM SIC
Note: The graph shows the total number of local administrators killed in Italian regions during the period 1974-2013.Black bars denote regions with a higher presence of criminal organizations – namely Sicily, Calabria, and Campania.
2.3 Not only Italy
The links between criminal organizations and politics, together with the systematic use
of violence against political opponents and activists, are features not only of Italian crim-
inal organizations, but are widespread in other countries as well. Drug cartels in Mexico
and Colombia have often turned to violence to establish control of political leaders, local
administrators, the police forces, and public officials. Between the 80’s and 90’s, the
Medellin cartel of Pablo Escobar waged a systematic campaign of violence and intimi-
dation against national-level politicians to block the extradition of Colombian narcos to
the United States. Ministry of Justice Rodrigo Lara and the presidential candidate Luis
Carlos Galan — both strong supporters of extraditions — were killed during this period,
together with hundreds of lower-level politicians and public officials.18 Also similar to the
Sicilian Mafia, Colombian drug cartels allied with rich landowners to combat advocates
of social reforms. As a consequence, thousands of left-wing activists — in particular,
the members of the party Union Patriotica — were killed by the drug lords of both the
Medellin and Cali cartels (Americas Watch Committee, 1989; Mendez, 1990).
18At the time of his assassination, Galan was conducting his electoral campaign for the 1990 electionsand was comfortably ahead in the polls.
10
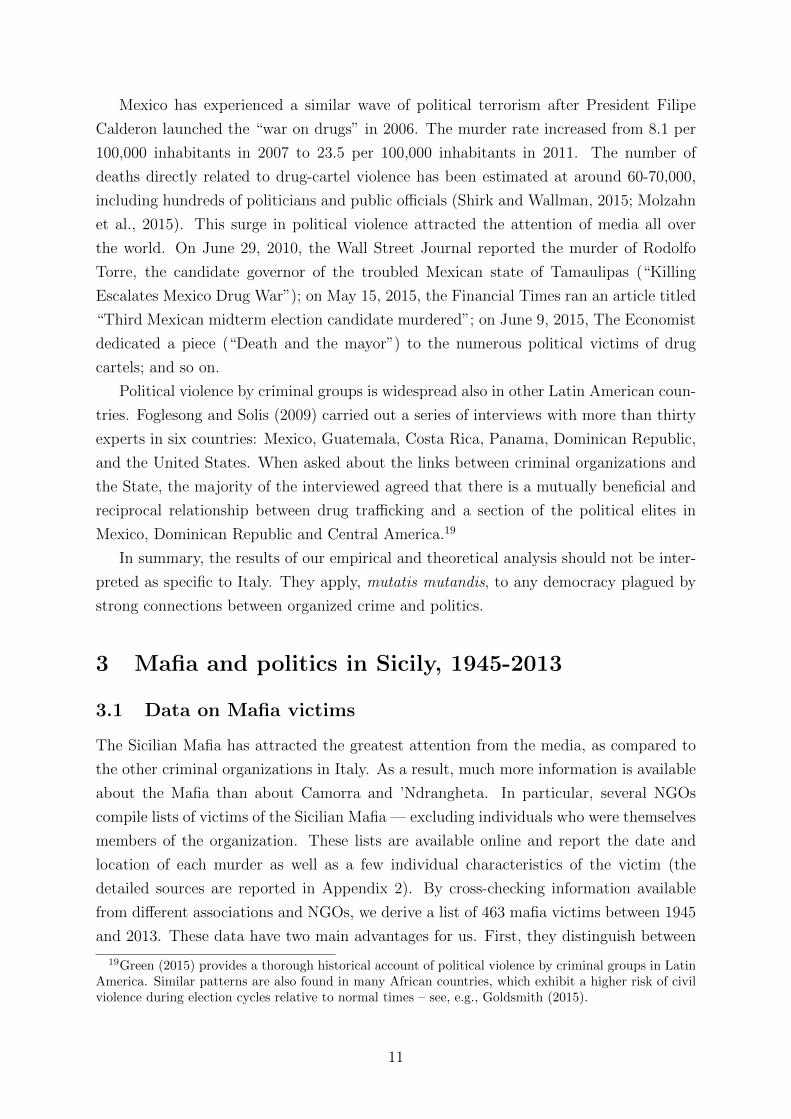
Mexico has experienced a similar wave of political terrorism after President Filipe
Calderon launched the “war on drugs” in 2006. The murder rate increased from 8.1 per
100,000 inhabitants in 2007 to 23.5 per 100,000 inhabitants in 2011. The number of
deaths directly related to drug-cartel violence has been estimated at around 60-70,000,
including hundreds of politicians and public officials (Shirk and Wallman, 2015; Molzahn
et al., 2015). This surge in political violence attracted the attention of media all over
the world. On June 29, 2010, the Wall Street Journal reported the murder of Rodolfo
Torre, the candidate governor of the troubled Mexican state of Tamaulipas (“Killing
Escalates Mexico Drug War”); on May 15, 2015, the Financial Times ran an article titled
“Third Mexican midterm election candidate murdered”; on June 9, 2015, The Economist
dedicated a piece (“Death and the mayor”) to the numerous political victims of drug
cartels; and so on.
Political violence by criminal groups is widespread also in other Latin American coun-
tries. Foglesong and Solis (2009) carried out a series of interviews with more than thirty
experts in six countries: Mexico, Guatemala, Costa Rica, Panama, Dominican Republic,
and the United States. When asked about the links between criminal organizations and
the State, the majority of the interviewed agreed that there is a mutually beneficial and
reciprocal relationship between drug trafficking and a section of the political elites in
Mexico, Dominican Republic and Central America.19
In summary, the results of our empirical and theoretical analysis should not be inter-
preted as specific to Italy. They apply, mutatis mutandis, to any democracy plagued by
strong connections between organized crime and politics.
3 Mafia and politics in Sicily, 1945-2013
3.1 Data on Mafia victims
The Sicilian Mafia has attracted the greatest attention from the media, as compared to
the other criminal organizations in Italy. As a result, much more information is available
about the Mafia than about Camorra and ’Ndrangheta. In particular, several NGOs
compile lists of victims of the Sicilian Mafia — excluding individuals who were themselves
members of the organization. These lists are available online and report the date and
location of each murder as well as a few individual characteristics of the victim (the
detailed sources are reported in Appendix 2). By cross-checking information available
from different associations and NGOs, we derive a list of 463 mafia victims between 1945
and 2013. These data have two main advantages for us. First, they distinguish between
19Green (2015) provides a thorough historical account of political violence by criminal groups in LatinAmerica. Similar patterns are also found in many African countries, which exhibit a higher risk of civilviolence during election cycles relative to normal times – see, e.g., Goldsmith (2015).
11

Table 1: Victims of the Sicilian Mafia, 1945-2013
Total number of victims 462Police forces and judges 142Entrepreneurs 79Politicians, party and union members 50Others 192
Note: This table shows the number of mafia victims, for different categories of individuals, during the period 1945-2013.
victims that were somehow linked with politics — specifically, members of political parties
and labor unions — and other victims. Note than in Italy labor unions — in particular
the largest one, the CGIL — have been closely linked with the Communist Party and
its successors. Second, they report the exact date of each murder, which allows us to
precisely investigate the time dynamics of violence around elections. Finally, they also
report the municipality in which each murder was committed.20
Table 1 shows that police officers, judges, and entrepreneurs paid the highest toll to
Mafia violence, followed by politicians and other representatives of political parties and
union members. However, taking into account that those politically involved are a very
small fraction of the population, they face a particularly high risk compared to individuals
not involved in politics.
Unfortunately, this type of information was not collected in a systematic way for the
victims of other criminal organizations. For instance, the NGO Progetto Legalita lists
352 victims of the Sicilian Mafia, but only 34 victims of the Camorra and 31 victims of
the ’Ndrangheta. This large difference is at odds with the number of homicides in each
region classified by judicial authorities as mafia-related (ex. Article 416-bis): 1695 in
Sicily, 2892 in Campania, and 1307 in Calabria.21 For this reason, we begin and focus
our empirical analysis on Sicily.
3.2 Electoral violence
We begin by investigating the relationship between the timing of national elections and
political murders — murders of politicians and representatives of political parties and
workers’ unions. In Figure 3, we simply compare the incidence of political homicides
and homicides of entrepreneurs in the 12 months before a national election, in the 12
months after the election, and in the other months. The average number of victims per
month is comparable between the two groups (0.060 and 0.094, respectively); however,
20The Italian administrative framework comprises 8,100 municipalities in total, corresponding to level4 of Eurostat’s Nomenclature of Territorial Units for Statistics (NUTS2). In the 2011 census, the median(average) population size was 2,448 (7,386) inhabitants.
21The total number of mafia-related homicides is much higher than the number of mafia victims becausethe former – but not the latter – include all murders of individuals that were themselves members ofcriminal organizations.
12

they exhibit very different temporal patterns. Political homicides increase by three times
in the 12 months before the elections – from 0.032 to 0.098 victims per month (left
graph). They also remain higher in the 12 months after the elections (0.074); however,
the difference with the number of victims in normal times is not statistically significant.
As for entrepreneurs (right graph), there is no evidence of abnormal increases in homicides
around elections.
Figure 3: Timing of homicides committed by the Sicilian Mafia, 1945-2013
0.0
5.1
.15
vict
ims
per m
onth
normal times pre-elections post-elections
Politicians, party and union members
0.0
5.1
.15
vict
ims
per m
onth
normal times pre-elections post-elections
Entrepreneurs
Note: This figure compares the number of politicians and party and union members (left graph) and entrepreneurs (rightgraph) killed by the Mafia around elections. In particular, the graphs show the average number of Mafia victims per monthin the 12 months before a national election, in the 12 months after the election, and in the other months, respectively, andthe corresponding confidence intervals (at the 95% confidence level).
We then estimate the following equation:
yt = α + β ∗ electoralt + γ ∗ postelectoralt + δ′X + εt,
where yt is the number of political murders committed by the Mafia in each month t during
the period 1945-2013; electoralt is a dummy equal to 1 in the month of the elections and
in the 11 preceding months (and equal to zero otherwise); postelectoralt is a dummy
equal to 1 in the 12 months after an election; Xt is a vector of control variables; finally,
εt is an error term summarizing the effect of other factors omitted from the equation.22
Consistent estimates of β and γ require that the timing of national elections is uncor-
related with other (omitted) determinants of political murders in εt. They are. In fact,
unlike local (administrative) elections, the timing of national elections does not system-
atically respond to local conditions in Sicily, so reverse causality should not be a serious
issue in this context.23 To address spurious correlation from other sources, we always
22The month of the elections is included in the pre-electoral period. All results are unaffected whenincluding the month of the elections in the post-electoral period.
23As a robustness check, we also exclude from the sample earlier elections called before the end of thelegislature (5 years). All our results are robust.
13
include on the right-hand side of the equation a third order polynomial in the number of
months since January 1945 (to control for long-run trends) and 12 month-specific fixed
effects (to control for seasonality).
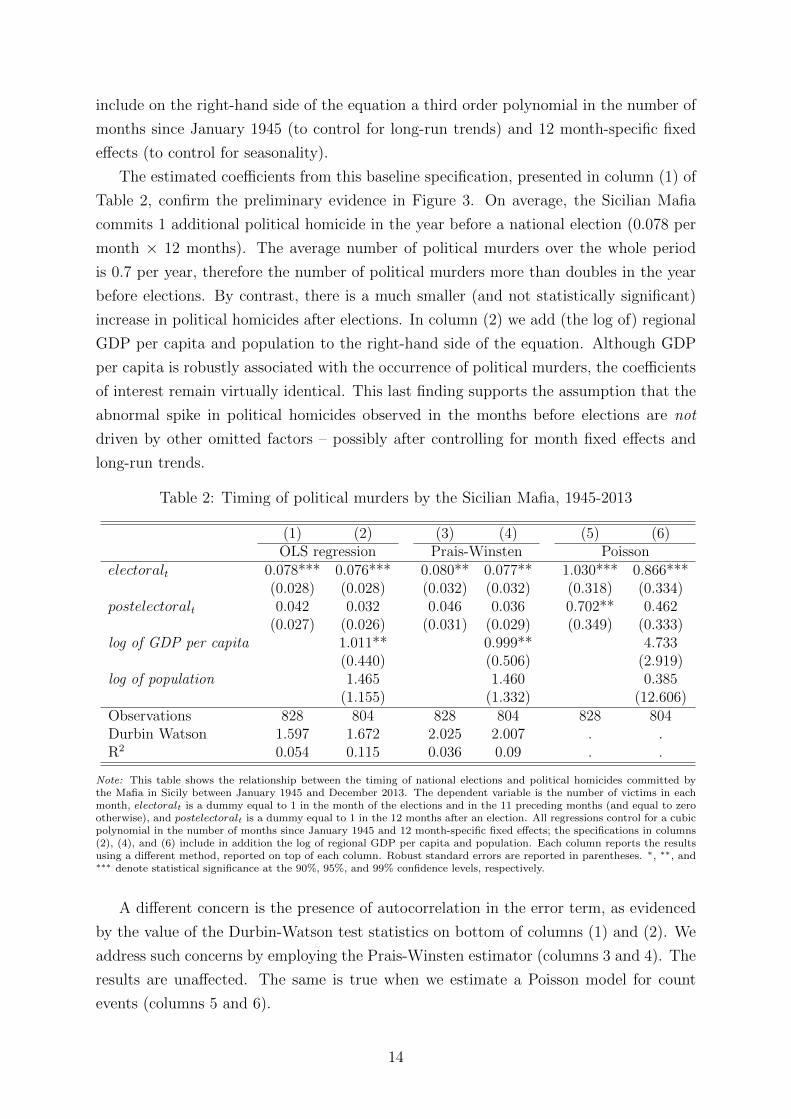
The estimated coefficients from this baseline specification, presented in column (1) of
Table 2, confirm the preliminary evidence in Figure 3. On average, the Sicilian Mafia
commits 1 additional political homicide in the year before a national election (0.078 per
month × 12 months). The average number of political murders over the whole period
is 0.7 per year, therefore the number of political murders more than doubles in the year
before elections. By contrast, there is a much smaller (and not statistically significant)
increase in political homicides after elections. In column (2) we add (the log of) regional
GDP per capita and population to the right-hand side of the equation. Although GDP
per capita is robustly associated with the occurrence of political murders, the coefficients
of interest remain virtually identical. This last finding supports the assumption that the
abnormal spike in political homicides observed in the months before elections are not
driven by other omitted factors – possibly after controlling for month fixed effects and
long-run trends.
Table 2: Timing of political murders by the Sicilian Mafia, 1945-2013
(1) (2) (3) (4) (5) (6)OLS regression Prais-Winsten Poisson
electoralt 0.078*** 0.076*** 0.080** 0.077** 1.030*** 0.866***(0.028) (0.028) (0.032) (0.032) (0.318) (0.334)
postelectoralt 0.042 0.032 0.046 0.036 0.702** 0.462(0.027) (0.026) (0.031) (0.029) (0.349) (0.333)
log of GDP per capita 1.011** 0.999** 4.733(0.440) (0.506) (2.919)
log of population 1.465 1.460 0.385(1.155) (1.332) (12.606)
Observations 828 804 828 804 828 804Durbin Watson 1.597 1.672 2.025 2.007 . .R2 0.054 0.115 0.036 0.09 . .
Note: This table shows the relationship between the timing of national elections and political homicides committed bythe Mafia in Sicily between January 1945 and December 2013. The dependent variable is the number of victims in eachmonth, electoralt is a dummy equal to 1 in the month of the elections and in the 11 preceding months (and equal to zerootherwise), and postelectoralt is a dummy equal to 1 in the 12 months after an election. All regressions control for a cubicpolynomial in the number of months since January 1945 and 12 month-specific fixed effects; the specifications in columns(2), (4), and (6) include in addition the log of regional GDP per capita and population. Each column reports the resultsusing a different method, reported on top of each column. Robust standard errors are reported in parentheses. ∗, ∗∗, and∗∗∗ denote statistical significance at the 90%, 95%, and 99% confidence levels, respectively.
A different concern is the presence of autocorrelation in the error term, as evidenced
by the value of the Durbin-Watson test statistics on bottom of columns (1) and (2). We
address such concerns by employing the Prais-Winsten estimator (columns 3 and 4). The
results are unaffected. The same is true when we estimate a Poisson model for count
events (columns 5 and 6).
14

Table 3: Timing of murders by the Sicilian Mafia, 1945-2013, for different categories ofvictims
(1) (2) (3) (4) (5)politicians entrepreneurs police & judges others all victims
electoral 0.935*** -0.512 0.176 0.316 0.216(0.323) (0.323) (0.406) (0.455) (0.235)
IRR [2.547] [0.599] [1.192] [1.372] [1.241]
postelectoral 0.487 -0.289 0.453 0.489 0.339(0.395) (0.281) (0.430) (0.450) (0.252)
IRR [1.627] [0.749] [1.573] [1.631] [1.404]
Note: This table shows the relationship between the timing of national elections and homicides committed by the Mafia inSicily between January 1945 and December 2013, by category of victim. The dependent variable is the number of victimsin each month, electoralt is a dummy equal to 1 in the month of the elections and in the 11 preceding months (and equalto zero otherwise), and postelectoralt is a dummy equal to 1 in the 12 months after an election. The coefficients areestimated using Poisson regressions. Incidence Rate Ratios (equal to the exponentiated coefficients) are reported in squarebrackets. All regressions include on the right hand side a cubic polynomial in the number of months since January 1945,12 month-specific fixed effects, the log of regional GDP per capita and population. Robust standard errors are reported inparentheses. ∗, ∗∗, and ∗∗∗ denote statistical significance at the 90%, 95%, and 99% confidence levels, respectively.
In Table 3 we compare the Incidence Rate Ratios (IRR) of being killed by the Mafia
before and after elections – as given by the exponentiated coefficients of the Poisson
regression – between politicians and other groups: entrepreneurs, police and judges, and
other victims. These results confirm that political homicides more than double before
elections, while there is no significant effect for any other category of victims.
Our results are robust to using alternative definitions for electoral and postelectoral,
which attach lower importance to months that are farther away from the elections (within
the 1-year time window around the elections). In particular, we regress the number of
political murders on electoral∗t = [12+(t− t∗)]/12, ∀t ∈ [t∗−11, t∗], and postelectoral∗t =
[12 + (t∗ + 1− t)]/12, ∀t ∈ [t∗ + 1, t∗ + 12], where t∗ is the month of the elections. They
are also robust to excluding from the sample earlier elections called before the end of the
legislature, whose timing is potentially endogenous (if anything, the effect is larger on
this sub-sample).24
3.3 Electoral results
We now investigate whether pre-electoral political homicides influence electoral results
in the direction preferred by the Mafia, namely against leftist parties. In Table 4, we
regress the share of votes obtained by the Left in each municipality and election during
the post-War period on the number of people killed by the Mafia in the 12 months
preceding the elections. The baseline specification in column (1) includes municipality
and election fixed effects, observations are weighted by the size of the electorate in each
municipality and election (so the results are representative at the regional level), and
24The results of these robustness tests are shown in Tables A2 and A3 of the Appendix.
15

heteroskedasticity-robust standard errors are clustered by municipality. In column (2),
we add the number of victims during the same period who were members of political
parties or labor unions.
Both total and political homicides negatively affect the vote share of the Left; however,
the effect of political homicides is ten times larger (-2.2 percentage points). These findings
are unaffected when we control for the share of votes obtained in the previous election
(column 3). They are also robust to coding Mafia violence using a dummy for observing
(at least) one homicide (columns 4 to 6).
Table 4: Electoral violence and electoral outcomes in Sicily, 1947-2013
(1) (2) (3) (4) (5) (6) (7) (8)all national elections, 1948-2013 period 1947-48
Total homicides before elections -0.003*** -0.002*** -0.002***(0.001) (0.001) (0.001)
Political homicides before elections -0.022*** -0.024***(0.006) (0.007)
Any homicide before elections -0.017*** -0.011** -0.004(0.004) (0.005) (0.004)
Any political homicide before elections -0.021** -0.025***(0.010) (0.009)
Voting for the Left, previous election 0.513*** 0.513***(0.035) (0.035)
Distance from Portella della Ginestra 0.001(0.026)
Elections 1948 -0.070*** -0.065***(0.011) (0.015)
Distance from Portella X Election 1948 (100s km) 0.030** 0.029*(0.012) (0.016)
Constant 0.207*** 0.208*** 0.112*** 0.208*** 0.208*** 0.112*** 0.288*** 0.286***(0.009) (0.009) (0.009) (0.009) (0.009) (0.009) (0.034) (0.005)
Observations 6,533 6,533 6,171 6,533 6,533 6,171 709 709Municipality FE YES YES YES YES YES YES NO YESYear FE YES YES YES YES YES YES NO NOR-squared 0.788 0.789 0.854 0.789 0.789 0.854 0.024 0.927
Note: This table shows the effect of electoral violence by the Mafia on electoral results in Sicily. The dependent variableis the vote-share obtained by the Left – the Italian Communist Party in the First Republic and the Center-Left coalitionin the Second Republic – in each municipality and election after World War II. Columns (1) to (6) include in the sampleall national elections between 1948 and 2013, columns (7) and (8) include in the sample only the regional elections of 1947and the national elections of 1948. Total homicides before elections is the number of people killed by the Mafia in eachmunicipality in the year before elections, and political homicides before elections is the number of victims that had somelinkage with political parties and/or trade unions (e.g., party members or local administrators); any (political) homicidebefore elections equals 1 if there was at least one (political) victim before elections and 0 otherwise. Distance from Portelladella Ginestra is the geodesic distance of each municipality from the location of the massacre and elections 1948 is a dummyfor the 1948 elections. Observations are weighted by the size of the electorate. Robust standard clustered by municipalityare reported in parentheses. ∗, ∗∗, and ∗∗∗ denote statistical significance at the 90%, 95%, and 99% confidence levels,respectively.
In the last two columns of Table 4 we focus on the events of Portella della Ginestra,
already discussed in Section 2.2. In particular, we regress the vote share of the Left
at the regional elections of 1947 and at the national elections of 1948 on the distance
of each municipality from the location of the massacre, a dummy for the 1948 election,
and the interaction between these two variables.25 The interaction coefficient in column
(7) of Table 4 suggests that the loss in votes by the Left between the 1947 and 1948
elections is stronger in municipalities that are closer to the massacre; the same is true
when including municipality fixed effects, thus dropping distance from Portella from the
25The location of Portella Della Ginestra is shown in Figure A2 of Appendix 3.
16

regression (column 8).26
The effect on voting in other municipalities — i.e., those that were not directly tar-
geted by the massacre — is likely due to the intimidating effect of electoral violence,
which is likely stronger in municipalities that are closer to the location of the massacre.
This finding is consistent with political violence affecting subsequent electoral results
over and above the destruction of (local) party and electoral machinery. We further ex-
plore the intimidating effect of electoral violence by looking at the behavior of appointed
politicians.
3.4 The behavior of appointed politicians
Since it credibly signals the military power of the Mafia, and the willingness to use it,
electoral violence may influence the behavior of appointed politicians. Once again, the
direction of such influence is not clear a priori. On the one hand, the public opinion
could push politicians to take action against the increase in violence — e.g., by devoting
more resources to the fight against organized crime. On the other hand, electoral violence
increases the credibility of future retaliation, thus discouraging anti-mafia efforts by scared
politicians.
We consider the relationship between electoral violence and the behavior of appointed
politicians, as measured by how often they openly talk about the Mafia once they sit in
the national parliament. In principle, one could talk about the Mafia to praise it, or to
discount its existence; in practice, however, the Mafia is overwhelmingly mentioned with
a negative connotation and to indicate the need to take measures aganist it (at least in
official discourses). Therefore, the willingness to bring up the problem in the national
parliament is a good proxy for anti-mafia efforts.
We collected the transcripts of all parliamentary debates featuring at least one inter-
vention by an MP elected in Sicily from the main parties of the Left and Right during the
period 1948-2013. We processed this very large amount of information — about 300,000
pages of transcripts — using an ad-hoc automatized routine that identified the inter-
vention of each MP within the same debate. This was possible thanks to the fact that
the name of each speaker, and the beginning and end of each intervention, are clearly
marked in the transcripts.27 We then measured the occurrence of the word “Mafia” by
MP-legislature. Table 5 shows summary statistics distinguishing MPs by partisan affilia-
tion and region of election. In particular, we report the average number of occurrences of
the word “Mafia”, its occurrence every 1,000 words, and the fraction of cases in which it
26Notice that, in column (7), the votes obtained by the Left at the 1947 regional elections (before themassacre) do not vary significantly with distance from Portella della Ginestra.
27This was possible thanks to the fact that the name of each speaker, and the beginning and end ofeach intervention, are clearly marked in the transcripts. In general the work was made difficult andextremely time consuming because of the poor physical state of parts of this documentation.
17

Table 5: Summary statistics on parliamentary debates featuring the intervention of anMP appointed in Sicily, 1948-2013
MPs elected in Sicily elected in other regionsall Left others all Left others
number of obs. (MP-legislature) 653 187 466 7,064 2,822 4,242
Sample statistics (avg. by MP-legislature):total number of words spoken (× 1,000) 8.28 10.91 7.23 6.78 7.97 5.99occurrences of the word “Mafia” 3.17 6.76 1.72 0.53 0.71 0.40occurrence of “Mafia” × 1,000 words 0.38 0.62 0.24 0.08 0.09 0.07mentioning “Mafia” at least once 0.22 0.37 0.16 0.09 0.12 0.07maximum number of occurrences 263 263 62 99 98 99
was mentioned at least once. As might be expected, Mafia is more salient in the parlia-
mentary discourses of MPs appointed in Sicily: on average, 22 percent of them mention
it at least once in the course of a legislature, compared to 9 percent of MPs appointed
in other regions. Differences by partisan affiliation are even more important: 37 percent
of MPs appointed in Sicily with Left parties talk about the Mafia, as opposed to just
16 percent of those appointed with other parties. Partisanship also plays a role for MPs
appointed in other regions – though the gap is smaller.
In Table 6 we relate the probability of talking (at least once) about the Mafia in the
course of a given legislature to the number of political homicides committed by the Mafia
in the 12 months before the elections (analogously to what we did in Table 4 for electoral
results). We always control for the total number of words spoken by each MP in a given
legislature. 28
The sample in the first three columns of Table 6 includes only MPs elected in Sicily.
In column (1), a higher number of homicides during the electoral period increases the
salience of Mafia-related issues in the political debate during the legislature that follows,
but the coefficient is small and not statistically significant. In column (2), however,
political murders decrease the propensity to talk about the Mafia – keeping constant the
total number of homicides. This effect is large and statistically significant: an additional
political homicide reduces the probability of talking about the Mafia by 4 percentage
points – on a baseline probability of 22 percent. These results confirm the hypothesis
that (only) political homicides have an intimidating effect on MPs appointed in the
elections.
In column (3) we add to the equation a dummy for politicians appointed from the
Left and its interaction with total and political homicides committed during the electoral
28We focus on the probability of mentioning the Mafia at least once rather than on the total numberof occurrences in order to ease the interpretation of the coefficients of interest and minimize the influenceof outliers – the great majority of MPs never mention the Mafia and a few of them mention it hundredsof times, see the last row of Table 5. However, the results are qualitatively unaffected when we use thisalternative definition of the dependent variable; see Table A4 in the Appendix.
18

Table 6: Electoral violence and parliamentary debates about the mafia, 1948-2013
(1) (2) (3) (4) (5) (6) (7) (8)all MPs elected in Sicily MPs elected in other regions all MPs
Total number of words (× 1,000) 0.007*** 0.007*** 0.006** 0.010*** 0.010*** 0.010*** 0.009*** 0.009***(0.002) (0.002) (0.002) (0.002) (0.002) (0.002) (0.001) (0.001)
Total homicides before elections 0.004 0.011** 0.008* 0.002 0.006*** 0.006*** 0.006*** 0.005***(0.004) (0.005) (0.004) (0.002) (0.001) (0.001) (0.001) (0.001)
Political homicides before elections -0.039** -0.029** -0.020*** -0.018*** -0.020*** -0.018***(0.015) (0.013) (0.003) (0.002) (0.003) (0.002)
Left 0.134*** 0.020** 0.021***(0.039) (0.007) (0.007)
Left X total homicides 0.014*** 0.002 0.002(0.004) (0.001) (0.001)
Left X political homicides -0.042*** -0.005 -0.005(0.010) (0.004) (0.004)
Sicily 0.101*** 0.071*(0.031) (0.034)
Elected in Sicily X total homicides 0.005 0.003(0.004) (0.004)
Elected in Sicily X political homicides -0.019 -0.012(0.013) (0.012)
Left X Sicily 0.105**(0.040)
Left X Elected in Sicily X total homicides 0.011***(0.003)
Left X Elected in Sicily X political homicides -0.034***(0.007)
Constant 0.133** 0.120** 0.084 0.005 -0.002 -0.010 0.001 -0.006(0.051) (0.047) (0.049) (0.016) (0.012) (0.011) (0.014) (0.013)
Observations 653 653 653 7,064 7,064 7,064 7,717 7,717R-squared 0.405 0.418 0.430 0.097 0.101 0.102 0.170 0.184
Note: This table shows the effect of electoral violence by the Mafia on parliamentary debates since 1948, as reported inthe official transcripts of the Italian Parliament. The sample in columns (1) to (3) includes all parliamentary speechesby MPs elected in Sicily; the sample in columns (4) to (6) includes all MPs elected in other regions who intervened ina parliamentary debate in which at least one MP elected in Sicily also intervened; and the sample in columns (7) and(8) includes all MPs in the previous columns. The unit of observation is the MP-legislature and the dependent variableis a dummy equal to 1 if the MP mentioned the word “Mafia” at least once in a given legislature. Total homicidesbefore elections is the number of people killed by the Mafia in each municipality in the year before elections, and politicalhomicides before elections is the number of victims that had some linkage with political parties and/or trade unions (e.g.,party members or local administrators). Left and Sicily are dummy variables for MPs of the Left (the Italian CommunistParty in the First Republic and the Center-Left coalition in the Second Republic) and MPs appointed in Sicily, respectively.Finally, total number of words (× 1,000) is the total number of words pronounced by each MP in a given legislature. Robuststandard errors are reported in parentheses and are clustered by MP and by legislature using the two-way clustering methoddescribed in Cameron et al. (2012). ∗, ∗∗, and ∗∗∗ denote statistical significance at the 90%, 95%, and 99% confidencelevels, respectively.
19

period. Several interesting findings emerge. First, in line with the preliminary evidence
in Table 5, MPs of the Left are more willing to bring up the Mafia in parliamentary
debates, especially after periods of greater electoral violence. Each homicide increases
the probability of talking about the Mafia on average by 2.2 percentage points for MPs
of the Left, but only by 0.8 percentage points for other MPs (see the coefficients of Total
homicides and Left X total homicides). Second, the coefficient of political homicides
becomes smaller and is no longer statistically significant. This is due to the fact that
political homicides decrease voting for the Left (see Table 4) and, thus, the chances of
appointing MPs that, on average, talk more about the Mafia. Third, although MPs of the
Left are on average more willing to talk about the Mafia, they are also more intimidated
by political murders. Each political homicide decreases the probability of talking about
the Mafia on average by 7.1 percentage points for MPs of the Left, but only by 2.9
percentage points for other MPs (see the coefficients of Political homicides and Left X
political homicides). Therefore, electoral violence effectively signals the strength of the
Mafia to its political opponents, who are more at risk of future retaliation.
In columns (4) to (6) we replicate the analysis for MPs appointed in other regions
who intervened in the same debates in which (at least) one MP appointed in Sicily also
intervened. The coefficients of total homicides, political homicides, and their interactions
with Left have the same sign as those estimated for MPs appointed in Sicily, but they are
lower in magnitude and often not statistically significant. Clearly the Mafia may have less
intimidatory power against MPs, party organizations, and voters in other regions than
Sicily. In the last two columns of Table 6 we pool together MPs appointed in all regions,
we include a dummy for MPs appointed in Sicily and interact it with all other variables
of interest. On the one hand, MPs appointed in Sicily talk more about the Mafia; on
the other they also seem more vulnerable to intimidation (column 7). In line with the
results in the previous columns, these effects are stronger for MPs appointed with the
Left (column 8).
4 Criminal organizations and electoral violence in
Italy: 1887-2012
Italy comprises 20 administrative regions, corresponding to level 2 of Eurostat’s NUTS
classification of territorial units. Using official paper publications by the Italian National
Statistical Institute (ISTAT), we have reconstructed yearly series of homicide rates at the
regional-level starting from 1887. For the first decades of this period, the small region of
Valle D’Aosta was aggregated with Piedmont, and the regions of Veneto, Friuli Venezia
Giulia and Trentino were aggregated. We maintain the same classification (16 regions in
total) also for the following years. Provincial-level data are available for the last part of
20

the sample period (1983-2012).
Figure 4 plots the homicide rate distinguishing between regions with an historical
presence of mafia-type criminal organizations — i.e., Sicily, Campania, and Calabria —
and other Italian regions. The homicide rate in mafia regions is always much higher than
in non-mafia regions.29
Figure 4: Homicide rates in mafia and non-mafia regions, 1887-2012
05
1015
hom
icid
e ra
te X
100
,000
inha
bita
nts
1890 1900 1910 1920 1930 1940 1950 1960 1970 1980 1990 2000 2010
mafia regions non-mafia regions
Note: The graph shows the time series of homicides per 100,000 inhabitants in regions with an historical presence ofmafia-type criminal organizations (Sicily, Campania, and Calabria) and in other regions. The series does not include theyears during World War II (1940-45).
In order to quantify the extent of electoral cycles in violence, we first estimate a series
of simple univariate regressions for each Italian region:
homicidesrt = αr + βr ∗ electoralt + εrt, (1)
where homicidesrt is the homicide rate per 100,000 inhabitants in region r and year t,
electoralt identifies the period before the elections (defined below), and εrt is an error
term. The coefficient βr captures any systematic change in the homicide rate of region r
during the electoral period. In line with the analysis in the previous section, we assume
that the electoral period starts one year before the election date. However, since data
29We exclude homicides for the World War II years because, during this period, the victims of thecivil war between Fascists and partisans were recorded as homicides. Since the civil war was foughtmainly in the northern part of Italy, the homicide rate in non-mafia regions is abnormally high – greaterthan in mafia regions – towards the end of the conflict (1944-45). However, this is clearly a distinctphenomenon from criminal homicides perpetrated outside the war period. For completeness, in FigureA1 of Appendix 3 we also show the graph including the war period.
21

on homicide rates are available only at yearly frequencies, we impute to each year t the
fraction of the electoral period falling within that year. Therefore, if elections are held in
month m of year t (m = 1, 2, ..., 12), electoralt = m/12 and electoralt−1 = (12−m)/12.
For instance, if national elections are held in April (as is normally the case in Italy)
electoralt = 1/3 and electoralt−1 = 2/3.
Figure 5 shows the region-specific estimated coefficients and confidence intervals.
Sicily, Calabria, and Campania exhibit abnormal spikes in the homicide rate during the
electoral period — i.e., between 1.5 and 2.5 additional homicides on average per 100,000
inhabitants. This is a large effect, as the average homicide rate during the same period
was 5.5 in mafia regions and 2.5 in non-mafia regions. The coefficient is positive and
significantly different from zero also for Puglia, and it is close to statistically significant
for Basilicata. These two regions also experienced the presence of criminal organizations,
although only since the 1970s and on a smaller scale than in Sicily, Calabria, and Cam-
pania (Pinotti, 2015). The coefficient is not significantly different from zero for any other
Italian region.
Figure 5: Electoral violence in Italian regions, 1887-2012
-4-2
02
4
SIC CAM CAL PUG BAS ABMEMR LAZ LIG LOMMAR PIV SAR TOS UMB VTF
Note: This figure shows the differential effect of electoral cycles on homicides in Italian regions, based on separate regressionsby region of the homicide rate per 100,000 inhabitants on a measure of the electoral cycle. Black symbols denote regionswith an historical presence of mafia-type organizations. The regressions are estimated on yearly observations for thehomicide rate over the period 1887-2012, the measure of the electoral cycle is the fraction of months in each calendar yearwithin 12 months from the following national election. The plots show the point estimate and confidence intervals of thecoefficient of this variable. Robust standard errors are used for constructing the confidence interval.
In Table 7 we pool all regions together and estimate a series of difference-in-differences
models interacting the measure of electoral cycles, electoralt, with indicator variables for
regions with an historical presence of criminal organizations. The estimated equation in
22

Table 7: Electoral violence in mafia and non-mafia regions, 1887-2012
(1) (2) (3) (4) (5) (6) (7)complete sample: 1887-2012 1887-1921 1922-45 1946-2012
electoral period 0.407(0.863)
mafia X electoral period 1.574** 1.504* 0.149*(0.731) (0.816) (0.085)
Sicily X electoral 1.992*** 1.971*** 1.280 1.132**(0.548) (0.372) (1.674) (0.483)
Calabria X electoral 1.338** 1.524*** -1.228 0.761(0.547) (0.237) (0.768) (0.563)
Campania X electoral 1.182** 0.909*** -2.168 0.972***(0.484) (0.044) (1.426) (0.363)
Observations 2,016 1,936 1,936 1,936 496 400 1,040Controls and year FE NO YES YES YES YES YES YESR-squared 0.004 0.487 0.650 0.487 0.554 0.472 0.481
Note: This table shows the differential effect of electoral cycles on homicides in mafia and non-mafia regions. In all columnswith the exception of (3), the dependent variable is the homicide rate per 100,000 inhabitants in each region and year; incolumn (3), the dependent variable is the logarithm of 1 plus the total number of murders in each region and year. Theexplanatory variable electoral period is the fraction of months in each calendar year within 12 months of the followingnational election, and mafia is an indicator variable equal to 1 for regions with an historical presence of mafia-type criminalorganizations – Sicily, Calabria, and Campania. Columns (5), (6), and (7) include in the sample only the years betweenUnification and Fascism, Fascism and the World-War II period, and the Republican period, respectively (the exact periodis indicated at top of each column). The average homicide rate in each period is also reported (in brackets). Region fixedeffects are included in all regressions; in columns (2) to (7) we also include year fixed effects and the logarithms of GDP percapita and population in each region and year. Robust standard errors are reported in parentheses and they are clusteredby region and by year using the two-way clustering method described in Cameron et al. (2012). ∗, ∗∗, and ∗∗∗ denotestatistical significance at the 90%, 95%, and 99% confidence levels, respectively.
column (1) is
homicidesrt = α ∗ electoralt + β ∗mafiar ∗ electoralt + γ′xrt + δr + εrt, (2)
where mafiar is a dummy equal to 1 for Sicily, Calabria, and Campania, and it is equal
to 0 for other regions; xrt is a vector of additional observed determinants of the homicide
rate that vary across regions and years; δr is a region-specific fixed effect; and εrt is a
residual term summarizing the effect of other omitted factors. The estimated coefficient α
captures the average increase in homicide rate for regions without an historical presence
of mafia organizations (mafiar = 0) and β estimates the additional increase in Sicily,
Calabria, and Campania. We always report heteroskedasticity-robust standard errors
clustered by region and year – for a total of 116 clusters – using the two-way clustering
method of Cameron et al. (2012).
During electoral periods, the homicide rate in mafia regions increases by 1.6 addi-
tional homicides per 100,000 inhabitants (statistically significant at the 5% confidence
level) relative to non-mafia regions. This result is unaffected when including a full set
of year fixed effects in the regression — thus dropping electoralt — the log of regional
GDP per capita, and the log of population (column 2).30 In column (3) we re-estimate
30Data on regional GDP per capita and population are available from Malanima and Daniele (2007)
23

the same specification for the log of murders (as opposed to the murder rate).31 Since we
are controlling on the right-hand side of the equation for the log of population, the coef-
ficient of the interaction term equals approximately the (additional) percentage increase
in homicides over population. This coefficient is positive and significant, meaning that
the homicide rate increases also in relative terms – not only in levels – in mafia regions
during the electoral period. In column (4) we estimate three separate interaction terms
for each of the mafia-affected regions. All three coefficients are statistically significant
and of the same order of magnitude (between 1 and 2 additional homicides per 100,000
inhabitants).
4.1 Electoral violence under democracy and dictatorship
To the extent that electoral violence is strategically used to influence electoral and po-
litical outcomes, it should vary with the degree of political contestability, which in turn
depends on the institutional regime. The recent Italian history provides rich variation in
this respect. In particular, it is possible to distinguish three periods since the Unification:
the Constitutional monarchy until 1861, in which the Parliament was elected through free
democratic elections (though with restricted suffrage); the Fascist dictatorship between
1922 and 1945; and the Republican period after 1945. Of course, political contestability
was minimal (or nil) under the dictatorship, in which elections were actually plebiscites
for the Fascist party – the only one admitted to run in the 1929 and 1934 elections.
In columns (5) to (7) of Table 7, we compare the extent of electoral violence under
the Fascist regime and under the other two periods. Homicides increase around electoral
periods in mafia regions (relative to other regions) in all periods except during Fascism.
This finding is consistent with the fact that criminal organizations had little or no chances
of influencing elections during this period.32
4.2 Electoral violence under different voting rules
Even within the Republican period, there is considerable variation in political contesta-
bility, depending on the type of electoral institutions in place and the relative strength
of different parties.
and ISTAT, respectively. These are the only control variables available at the regional level over theperiod 1887-2012.
31In 6 observations out of 2,016 the number of homicides is equal to zero, so the logarithm would notbe defined. For this reason, we increase by 1 the number of homicides in all observations.
32The results for the Fascist period can actually be considered as a placebo test. As an additionalplacebo test, we run our analysis for other types of (predatory) crimes. These results are reported inTable A5 of Appendix 3.
24
4.2.1 Proportional elections
At the end of World War II, a national unity government formed by all anti-fascist par-
ties (Communists, Socialists, Christian Democrats, and Liberals) guided the transition
to the First Italian Republic. The committee in charge of the electoral reform adopted a
proportional system with party lists and preference votes for individual candidates. The
system remained in place, with only minor changes, until 1993. Throughout this period,
the political landscape was marked by competition between the Christian Democrats
and the Communist Party. Although the Christian Democrats always obtained a rel-
ative majority — i.e., forming a series of coalition governments with the help of small
center parties — their vote share was progressively eroded by the advance of the Italian
Communist Party. Since the Sicilian Mafia and other criminal organizations traditionally
opposed the Left, we should expect that electoral violence intensifies when the gap with
government parties gets narrower (as we will argue more formally in Section 5).
To test this prediction, we interact our main variable of interest, mafiar ∗ electoralt,with the gap between the percentage vote-shares of the Christian Democrats and the
Italian Communist Party. Since the relative performance of the two parties in mafia
regions would partly depend on electoral violence carried out by criminal organizations
— this is indeed the main premise of our analysis — we consider the gap within the
sub-sample of non-mafia regions.33
The results are presented in column (1) of Table 8. Indeed, more contested elections
are characterized by greater electoral violence. If the two parties had equal chances of
winning the elections (i.e., gapt = 0), the homicide rate in the year before elections would
increase by 4.3 additional homicides in mafia regions relative to non-mafia regions. An
electoral advantage of 5 percentage points for the Christian Democrats over the Commu-
nists reduces the differential in homicides to about 2.5 per 100,000 inhabitants.34
4.2.2 Majoritarian elections
In the wake of massive corruption scandals, the First Republic came to an abrupt end
in 1992-1993. The Christian Democrats and their allies in government were severely
damaged by the judicial investigations and disappeared from the political arena. The
subsequent transition to the so-called Second Republic involved a change from a pure
proportional electoral system to a mixed system with a strong majoritarian component.
Under the new system, 75% of seats were attributed by plurality rule in 475 single-
33Official data on electoral results are available from the dedicated website of the Italian Ministry ofInterior (www.elezionistorico.interno.it).
34To minimize the risk of omitted variable bias in the estimated coefficient of mafiar ∗electoralt∗gapt,one must also include, on the right-hand side of the equation, all interactions between any two variablesin the triple interaction term. However, gapt is defined only for the electoral period (analogously toelectoralt) so mafiar ∗ gapt is ultimately identical to mafiar ∗ electoralt ∗ gapt, while electoralt ∗ gaptis absorbed by the year fixed effects.
25

Table 8: Electoral violence under different types of electoral system
(1) (2) (3) (4) (5) (6) (7) (8)regional data, 1946-2012 provincial data, 1993-2004 type of homicide
1948-1992 1887-1909 1993-2004 majoritarian elections mafia non-mafiamafia X electoral period 4.303*** 1.463*** 1.610** 1.512** 1.254**
(1.098) (0.332) (0.585) (0.578) (0.416)mafia X electoral period X gap -0.372*** -0.028 -0.007
(0.075) (0.029) (0.041)mafia X electoral X contested district 5.686** 5.459** 4.350*** 1.109
(1.911) (2.408) (1.049) (1.457)electoral X contested district 0.465** 0.418** 0.019 0.398*
(0.171) (0.181) (0.016) (0.193)Observations 752 496 192 1,140 1,140 1,140 1,140 1,140mafia region X year FE NO NO NO NO NO YES YES YESR-squared 0.143 0.127 0.277 0.082 0.108 0.030 0.071 0.009
Note: This table shows the differential effect of electoral cycles on homicides in mafia and non-mafia regions under differentelectoral regimes. The units of observation are region-years in columns (1) to (3), and province-years in columns (4) to(8), as reported at the bottom of each column – the sample period is also indicated. The dependent variable in columns(1) to (6) is the homicide rate per 100,000 inhabitants. Separate figures for mafia-related and other crimes are available incolumns (7) and (8) for the sub-period 1993-2004. The principle explanatory variables of interest are interactions betweenelectoral period, mafia, and gap. electoral period is the fraction of months in each calendar year within 12 months from thefollowing national election. mafia is an indicator variable equal to 1 for regions with an historical presence of mafia-typecriminal organizations – Sicily, Calabria, and Campania. Finally, gap is the difference in the voting share of the two mainparties (or coalition of parties) of the Left and Right in non-mafia regions. Region and year fixed effects are included inall regressions and region X year fixed effects are included in columns (6) to (8). Robust standard errors are reported inparentheses and they are clustered by region and year using the two-way method described in Cameron et al. (2012). ∗,∗∗, and ∗∗∗ denote statistical significance at the 90%, 95%, and 99% confidence levels, respectively.
member districts (the remaining 25% were filled with proportional representation). The
system remained in place until 2004, when a further electoral reform abolished single-
member districts and re-introduced closed party lists. A majoritarian rule had already
been adopted in Italy in the period before Fascism (1861-1909) although, at that time,
suffrage was restricted to a minor share of the population (males above a certain income
level).
Under a majoritarian system, electoral competition is concentrated in contested dis-
tricts. Therefore, electoral violence should be localized in such districts, whereas it should
not depend on the gap between the two main parties at the national level. This is consis-
tent with the evidence we obtain when we replicate the analysis in column (1) of Table
8 for the periods in which a majoritarian system was in place: 1887-1909 (column 2),
and 1994-2004 (column 3). During the former period, the Left coalition comprised the
Socialists and other radical parties, whereas the Right comprised liberal and conservative
parties — including the so called “Historical left”, a moderate liberal party very similar
to the “Historical right”. During the latter period, the Left comprised the Democratic
Party — i.e., the heir of the Italian Communist Party — and its allies, whereas the Right
comprised Forza Italia — i.e., the party of Silvio Berlusconi — and its allies.35 The
results in columns (2) and (3) of Table 8 confirm that, under majoritarian elections, the
extent of electoral violence is unrelated to the intensity of electoral competition at the
national-level.
35The electoral data for the periods 1887-1909 and 1994-2004 are available, respectively, from Corbettaand Piretti (2009) and from the website of the Italian Ministry of Interior.
26

Violence should be concentrated, instead, in those “swing” districts where the outcome
is more uncertain. Unfortunately, homicide rates are not available at the district level.
The finest level of geographical detail is provincial — available since 1983. Each province
includes multiple districts but no electoral district crosses provincial borders.36 We thus
compute the fraction of voters in each province residing in contested districts, defined
as those in which the gap between the winning and losing coalition at the first elections
held with the majoritarian system (1994) was below 5 percent.37 Then, we interact this
variable with mafiar∗electoralt in equation (2). We also interact the fraction of voters in
contested districts with electoralt, while the interaction with mafiar is absorbed by the
province fixed effects (always included in the regression). The regression also controls for
the log of province population, the only variable available at the provincial level during
the sample period.
The results are presented in columns (4) to (6) of Table 8. A standard deviation
increase in the fraction of voters residing in contested districts (0.32) increases the dif-
ferential in homicides between mafia and non-mafia regions during electoral periods from
1.2 to 3 (column 5). Exploiting variation across provinces, it is possible to extract any
differential trend in homicide rates between mafia and non-mafia regions by interacting
mafiar with the set of year fixed effects; when doing so, the triple interaction coefficient
remains identical (column 6).
The province-level criminal statistics available since 1983 also allow us to distinguish
between mafia-related homicides and other homicides. Such a distinction was introduced
with Article 416-bis of the Penal Code, which classifies as mafia-related the homicides
committed by mafia members for the purposes of the organization. The last two columns
of Table 8 show that the effect of interest is entirely due to mafia-related homicides.
5 A model of pre-electoral intimidation
Building on the evidence collected up to this point, we now develop a simple model in
which criminal organizations use pre-electoral violence to signal their military strength to
the parties competing in the political arena. Specifically, we study the mechanisms that
allow criminal organizations to have their captured politicians elected under alternative
electoral rules and different degrees of political competition.38 The results rationalize the
findings highlighted above regarding different voting systems.
36In 1993 there were 95 provinces and 475 districts, with a median size of 2,247 and 527 squarekilometers, respectively.
37The results are robust to other sensible choices regarding this threshold.38The mechanism through which politicians are captured by criminal organizations is not studied here.
In some cases, the members of Italian criminal organizations become themselves politicians.
27

5.1 Proportional electoral system
Two political parties compete to attract a mass 1 of voters in a large election. One party
is honest (h), the other (c) is captured by a criminal organization. For simplicity, and
with no loss of generality, we posit that each vote is equivalent to one seat.39 When in
office, the c party favors the criminal organization and its illegal activities; the h party
does not. The criminal organization obtains a return, b, for each seat (vote) obtained by
the captured party. Therefore, if the captured party wins a share x ∈ [0, 1], the criminal
organization gets a return bx. The voters’ choice is influenced by the electoral effort (e)
exerted by the honest party during the electoral campaign. The vote-share of the honest
party, when it exerts effort e, is
h (e, α) ≡ α + e,
where α is the share of voters who always vote for h regardless of e — i.e., fully honest
voters. Hence, the c party obtains a share equal to 1−h (e, α).40 For simplicity, we assume
that only honest candidates exert effort to win swing voters (we relax this assumption in
Section 5.3).
The cost of exerting campaigning effort is ψ (e, α, θ) and is increasing and convex in
e. It is decreasing in α since parties with a larger share of fully honest voters have —
other things being equal — a relatively lower cost of capturing swing voters because of
positive externalities and/or herding behavior within social networks (see, e.g., Knoke,
1994, among others). In other words, if a large fraction of voters is honest it is easier
to enforce honesty on potentially dishonest individuals: an hypothesis consistent with
Tabellini (2008). Finally, the cost of effort is also increasing in the parameter θ ∈ {s, w},which measures the organization’s military power and its willingness to use it: s stands
for strong, w stands for weak, with ∆ ≡ s− w ≥ 0.41
This relationship between effort cost and military strength of the organization is a
convenient shortcut to capture, within a unified framework, several interpretations of
the model. First, violence may imply that a candidate of the honest party is killed.
In that case, another candidate may have to run; the latter may be less efficient at
attracting votes (possibly because he is scared or, even more simply, because he is a
second choice) which is equivalent to a higher cost of effort per vote obtained. Second,
even if the honest candidate is not killed, violence may disrupt his campaign by damaging
39Further, we also assume there is only one honest party, but there could be more as was the casein Sicily. Assuming that there is only one criminal organization in each district is consistent with thepyramidal structure of the Sicilian Mafia, as we discussed above.
40Our approach borrows from Coate (2004). In his model there are three groups of voters: those whovote for sure for a certain candidate (leftists, and rightists in Coate’s model) and swing voters who canbe convinced by campaign effort. See also Prat (2002) and Roemer (2006) for similar models.
41We make the assumption of two possible types of criminal organization for simplicity. The qualitativeinsights of the model remain true in a more general environment with multiple types.
28

his headquarters and scaring his campaign ‘workers’. These disruptions increase the cost
of effort. Third, voters may be intimidated by violence, and may thus prefer to elect
the corrupt party in order to avoid additional violence, which implies that the necessary
effort to persuade them to vote for the honest party increases. Our specification allows
for all three interpretations or a combination of them.
In order to obtain closed form solutions we assume a specific functional form for the
effort cost — i.e.,
ψ (e, α, θ) =θe2
2 (1 + α). (3)
The honest party does not know the organization’s type when it chooses effort. Their
prior belief is that the organization is strong with probability β ∈ [0, 1]. Hence, if feasible,
the criminal organization would like to signal its military power in order to increase the
effort costs of the h party. The signaling device is pre-electoral violence, ν ≥ 0, which may
take the form of assassinations, violent riots, vandalism, etc., causing both psychological
and physical impediments (including death) to the candidates of the honest party. Thus,
from now on, signaling military power is meant in the sense of signaling the willingness to
use a certain level of violence. Although criminal organizations always retain this option,
the willingness to actually exert violence may vary considerably over time, depending
(among other things) on the leaders in power in a given historical period. For instance,
Toto Riina and Bernardo Provenzano — the two most important leaders of the Sicilian
Mafia in recent decades — had a very different propensity to use violence; very high
propensity for the former, less so for the latter. Strong leaders may want to reveal their
willingness to use violence; however, this is complicated by the fact that they operate in
the underworld. Therefore, politicians and voters may have imperfect information about
the attitude of the criminal leaders in power and they may, as a consequence, be unable
to distinguish truly strong leaders from imitators. For this reason, strong leaders may
need to undertake costly action for the threat of violence to be credible.42 Thus violence
disrupts the campaign of the honest party and, in addition, intimidates its candidates
and voters.
The cost of electoral violence is k (ν, θ) = νθ, which is inversely related to the orga-
nization’s military power and, as discussed above, reflects the willingness to use it. The
timing of the game is as follows:
1. Nature draws θ.
2. The criminal organization chooses the intensity of electoral violence ν.
3. Honest candidates observe ν, update beliefs, and decide how much effort e to invest
in the campaign.
42Smith and Varese (2001) discuss a similar issue in the case of extortion.
29

4. The elections occur.
The game is solved using a perfect Bayesian equilibrium (see, e.g., Fudenberg and
Tirole, 1991). Therefore, a strategy for the criminal organization is a function that maps
its military power (type) onto a level of violence, while the strategy for honest politicians
specifies an effort choice contingent on the information revealed at stage 2. Off-path
beliefs will be specified as we go along. We mostly focus upon separating equilibria,
which are of greatest interest; however, in Appendix 1 we also examine pooling ones.
Let ν∗θ denote the equilibrium intensity of violence when the type of the criminal orga-
nization is θ. We rule out uninteresting equilibria in which, regardless of the organization
type, honest politicians exert no effort as well as those in which honest politicians always
win the election regardless of effort. This is guaranteed by the following:
• Assumption A1. w > 1+α1−α .
Let β (ν) ≡ Pr [θ = s|ν] be the posterior of the honest party upon observing ν ≥ 0.
In a separating equilibrium, β (ν∗s ) ≡ 1 and β (ν∗w) ≡ 0. The objective function of the
honest party is equal to its share of votes net of the effort cost. Hence, upon observing
ν∗θ , at stage 3 the honest party chooses the effort level that solves the following problem
maxe∈[0,1−α]
{h (e, α)− E [ψ (e, α, θ) |ν∗θ ]} ,
where, under the quadratic specification (3), it follows that
E [ψ (e, α, θ) |ν∗θ ] = [β (ν∗θ ) s+ (1− β (ν∗θ ))w]︸ ︷︷ ︸≡E[θ|ν∗θ ]
e2
2 (1 + α).
The first-order condition, necessary and sufficient for an optimum implies
e∗θ =1 + α
θ,
with e∗s < e∗w < 1− α by Assumption A1.
Hence, in equilibrium, effort is decreasing in the military power of the criminal or-
ganization and is increasing in the share α of h’s ideological voters. The incremental
vote-share that the corrupted party obtains when it is supported by a strong organiza-
tion amounts to
h (e∗w)− h (e∗s) = (1 + α)∆
ws,
which is (ceteris paribus) increasing in α and in ∆. The outcome described above emerges
in equilibrium when (ν∗s , ν∗w) satisfy the no-mimicking conditions of the organization,
which ensures that types do not mimic each other — i.e., a strong (resp. weak) type
30
must not profit from exerting a level of violence that is attributed to the weak type (resp.
strong).
Note that, in a separating equilibrium, the level of violence exerted by the weak
organization cannot be positive — i.e., it must be ν∗w = 0. Intuitively, this is because a
weak organization would always have an incentive not to exert violence in a separating
equilibrium. Hence, to find an equilibrium we simply need to determine ν∗s , which will be
pinned down by the incentive compatibility constraints. We thus establish the following
result.
Proposition 1. Suppose that Assumption A1 holds. There always exists the least-costly
separating equilibrium in which ν∗w = 0 and ν∗s = b (1 + α) ∆s
.
The ‘least-costly’ separating equilibrium we have identified corresponds to the ‘Riley
outcome’ (Fudenberg and Tirole, 1991). It implies that the level of pre-electoral violence
can act as a signal to intimidate candidates of the honest party. This seems consistent with
the evidence presented in Section 3.2. Moreover, consistent with the evidence reported
in Section 4.2.1, the level of violence exerted by the strong type in such an equilibrium
is increasing in α, the popularity of the honest party.
In Appendix 1 we discuss multiplicity of equilibria including pooling outcomes and
we also show that the equilibrium just described is the only one that survives the Cho
and Kreps (1987) intuitive criterion.
5.2 Majoritarian system
Consider now a majoritarian system. Specifically, suppose that the voting population
is split in N identical districts, each populated by a mass 1N
of voters and denoted by
i ∈ {1, .., N}. In each district a candidate wins the election with a simple majority.
Everybody votes. The (total) revenue of the criminal organization is bxN
where x is the
total number of districts won by candidates of party c. The honest politician running in
district i exerts effort ei, which determines the share h (ei) = αi + ei of the honest party
in that district. As before, αi measures the mass of a district i’s electors that always vote
for h. The criminal organization can still be either strong or weak, and this characteristic
is common to all districts. For the moment we posit that there are no informational
externalities between districts. That is, the information about θ revealed through the
use of violence within district i does not affect the behavior of politicians in the other
districts. We discuss this in more detail below and in Appendix 1.
We restrict attention to separating equilibria in which only the strong organization en-
gages in pre-electoral violence; the analysis of pooling equilibria is discussed in Appendix
1. We also assume that the cost of exerting violence for the organization is additively
separable across districts. That is, letting ν =∑N
i=1 νi, we assume:
31

• Assumption A2. The total cost of violence k (ν,θ) is additive — i.e.,
k (ν, θ) =N∑i=1
k (νi, θ) .
Clearly, this is a restrictive assumption. Committing crimes and violence in district
i may affect the cost of doing the same in district j in a variety of ways. Party h may
adopt more precautions in district j having observed violence in district i, in turn raising
the cost of violence in support of party c. Law enforcers — possibly under pressure from
public opinion — may increase security as violence escalates in several districts. On the
other hand, public opinion (and law enforcers) may be accustomed to a certain level of
intimidation and violence (or be scared by it), numbing the effect of further violence and
releasing pressure for greater enforcement efforts. Both these effects seem plausible and,
in principle, they may be at play simultaneously. Hence, by imposing separability we
isolate the model results from the relative strength of these two forces.
Formally, Assumption A2 implies that the organization’s maximization problem is
separable across districts. Therefore, in order to characterize the equilibrium of the game
we can focus on a generic district (say i). The timing of the game is as before. When
the captured party obtains a majority of votes in a district it wins the seat.43 That is,
for given effort ei it needs to obtain a share of votes
1− hi (ei, αi) >1
2,
which requires the honest candidates to exert a sufficiently low campaigning effort — i.e.,
ei <1
2− αi.
Obviously, engaging in pre-electoral violence in district i is useless if αi ≥ 1/2 since the
honest party wins the election even if ei = 0.44 Hence, hereafter, we focus on the most
interesting case αi < 1/2.
In a separating equilibrium, the honest party wins the elections if, and only if, the
utility of being appointed exceeds the corresponding effort cost. That is,
1 ≥ ψ(12− αi, αi, θ).
Let us first focus on districts in which honest candidates win the election only when they
43For simplicity, we assume that in the case of a tie the honest party wins the subsequent round ofelections.
44We are excluding here a situation in which the candidate of party h is killed and the party cannotsupply another candidate for which α ≥ 1/2.
32

face a weak organization, namely districts in which the following condition holds:
ψ(12− αi, αi, w) ≤ 1 < ψ(1
2− αi, αi, s). (4)
Note that, under a majoritarian system, a weak criminal organization has an even stronger
incentive not to exert violence in a separating equilibrium. This is because it makes
no profit when αi satisfies (4). Hence, a separating equilibrium must again be such
that ν∗i,w = 0 < ν∗i,s, with the latter inequality satisfying the organization’s incentive
compatibility constraints.
To rule out the uninteresting case in which the weak organization always loses the
elections regardless of αi, we assume that
• Assumption A3. w is large enough to imply ψ(12− αi, αi, w) > 1 for some
αi ∈ (0, 12).
Essentially, when this assumption is violated the problem becomes trivial since the
weak organization is never willing to exert violence to win the election even when αi is
equal to zero.
We can thus establish the following result.
Proposition 2. Suppose that A2 and A3 hold. Under a majoritarian system, the least-
costly separating equilibrium features
ν∗i,w = 0 < ν∗i,s =wb
N,
and exists only if s is not too small, and if αi is neither too large nor too low. Otherwise,
in district i, there is only a pooling outcome in which the organization does not exert
violence.
As seen in the data (i.e., Section 4.2.2), under a majoritarian system, an equilibrium
in which only the strong organization engages in electoral violence only arises in districts
where there is head-to-head competition between parties. By contrast, it is never optimal
for the criminal organization to rely on costly violence in order to signal its military
strength if one of the two parties wins the election no matter what ei is. In this region
of parameters, only a pooling equilibrium exists, which can be easily constructed by
choosing appropriate off-equilibrium beliefs.45
45Of course, among the class of pooling equilibria, the one that maximizes the organization’s expectedprofit features no violence.
33

5.3 Remarks
5.3.1 Uninformed corrupt candidate
We have so far assumed that captured politicians always know the organization type
and that they always favour it once they are elected. Although both these assumptions
seem quite realistic, at least in the case of the Sicilian Mafia, the insights of the model
do not change — qualitatively — when such assumptions are weakened. Suppose, for
example, that corrupt politicians do not know the type of the organization they are facing
and that they may decide, once in office, not to support the organization. In this case,
the organization members have an extra reason for signaling their military strength. In
fact, by exerting violence against the candidates of the honest party, they will signal
their type not only to these candidates but also to corrupt politicians. Anticipating this,
corrupt politicians will continue to favor the criminal organization once they are in office.
Obviously, this argument is strengthened if we assume that corrupt politicians also exert
a campaigning effort that counterbalances the effort exerted by the honest candidates on
the swing voters.
5.3.2 Information externalities across districts
In our analysis of the majoritarian system we have assumed that candidates in one district
do not learn from the criminal organization’s behavior in other districts. Suppose instead
that exerting violence in one district signals the criminal organization’s type in other
districts as well. Our results do not change qualitatively in this case. Here is the intuition
for why. Consider the simplest possible case where there are only two districts (N = 2)
that differ not only by the share of people that always vote for the honest candidates but
also with respect to the attention they receive from the media. District 1 is ‘central’ while
district 2 is ‘peripheral’. Formally, this means that if the organization signals its type to
the honest candidates in district 1, with probability λ1 ∈ [0, 1] this information reaches
district 2, while the information disclosed in district 2 reaches district 1 with probability
λ2 < λ1. Intuitively, if it is profitable for a strong type to only exert violence in district
1 in order to win elections in both districts, then a weak type will want to do the same.
Actually, the more attractive this option is to the strong type — e.g., the larger is λ1
— the more attractive it is for the weak type too. Hence, the potential cost savings
from only exerting violence in central districts is offset by the possibility of mimicking.
This makes it hard for strong types to exploit information externalities between central
districts and peripheral ones (see also Appendix 1).
34

6 Conclusions
We show that in Sicily mafia killings of politicians increase before elections and have
negative effects on the vote received by parties not captured by the mafia. Then, using a
very large data set of electoral speeches, we find strong evidence that anti-mafia activities
by politicians elected in Sicily are, in fact, negatively correlated with the levels of pre-
electoral violence. Using data on homicides in all regions of Italy going back to the end
of the nineteenth century, we document a political cycle of homicides only in regions with
organized crime. We also show how this cycle changes as a function of the institutional
regime, the electoral rules, and the relative strength of captured and non captured parties.
All these findings are rationalized by a novel signaling model.
References
Acconcia, Antonio, Giovanni Immordino, Salvatore Piccolo, and Patrick Rey,
“Accomplice Witnesses and Organized Crime: Theory and Evidence from Italy,” The
Scandinavian Journal of Economics, 2014, 116 (4), 1116–1159.
Acemoglu, Daron, James A Robinson, and Rafael J Santos, “The monopoly of
violence: Evidence from Colombia,” Journal of the European Economic Association,
2013, 11 (s1), 5–44.
Americas Watch Committee, The Killings in Colombia, Human Rights Watch, 1989.
Bandiera, Oriana, “Land reform, the market for protection, and the origins of the
Sicilian mafia: theory and evidence,” Journal of Law, Economics, and Organization,
2003, 19 (1), 218–244.
Barone, Guglielmo and Gaia Narciso, “Organized crime and business subsidies:
Where does the money go?,” Journal of Urban Economics, 2015, 86, 98–110.
Bernheim, B Douglas and Michael D Whinston, “Menu auctions, resource alloca-
tion, and economic influence,” The quarterly journal of economics, 1986, pp. 1–31.
Bo, Ernesto Dal and Rafael Di Tella, “Capture by threat,” Journal of Political
Economy, 2003, 111 (5), 1123–1154.
, Pedro Dal Bo, and Rafael Di Tella, “Plata o Plomo?: Bribe and Punishment
in a Theory of Political Influence,” American Political Science Review, 2006, 100 (01),
41–53.
, , and , “Reputation when threats and transfers are available,” Journal of Eco-
nomics & Management Strategy, 2007, 16 (3), 577–598.
35
Buchanan, James M, Robert D Tollison, and Gordon Tullock, Toward a theory
of the rent-seeking society number 4, Texas A & M Univ Pr, 1980.
Buonanno, P., G. Prarolo, and P. Vanin, “Organized Crime and Electoral Outcomes
in Sicily,” Working Papers wp965, Dipartimento Scienze Economiche, Universita’ di
Bologna September 2014.
Cameron, A Colin, Jonah B Gelbach, and Douglas L Miller, “Robust inference
with multiway clustering,” Journal of Business & Economic Statistics, 2012.
Catino, Maurizio, “How Do Mafias Organize?,” European Journal of Sociology, 2014,
55 (02), 177–220.
Cho, In-Koo and David M Kreps, “Signaling games and stable equilibria,” The
Quarterly Journal of Economics, 1987, pp. 179–221.
Coate, Stephen, “Political competition with campaign contributions and informative
advertising,” Journal of the European Economic Association, 2004, 2 (5), 772–804.
Collier, Paul and Pedro C Vicente, “Violence, bribery, and fraud: the political
economy of elections in Sub-Saharan Africa,” Public Choice, 2012, 153 (1-2), 117–147.
Corbetta, Piergiorgio and Maria Serena Piretti, Atlante storico-elettorale d’Italia:
1861-2008, Zanichelli, 2009.
Daniele, Gianmarco, “Strike one to educate one hundred: organized crime, political
selection and politicians’ ability,” Working Papers 2015/37, Institut d’Economia de
Barcelona (IEB) 2015.
and Gemma Dipoppa, “Mafia, Elections and Political Violence,” Available at SSRN
2812591, 2016.
Dixit, Avinash, “On Modes of Economic Governance,” Econometrica, 2003, 71 (2),
449–481.
Ellman, Matthew and Leonard Wantchekon, “Electoral competition under the
threat of political unrest,” Quarterly Journal of Economics, 2000, pp. 499–531.
Falcone, Giovanni, “Cose di Cosa Nostra, in collaborazione con Marcelle Padovani,”
Milan: Rizzoli, 1991.
Feo, Giuseppe De and Giacomo De Luca, “Mafia in the ballot box,” 2013.
Foglesong, Todd and Luis Guillermo Solis, “Organized Crime and its Impact on
Democratic Societies,” 2009.
36
Fudenberg, Drew and Jean Tirole, “Game theory, 1991,” Cambridge, Massachusetts,
1991, 393.
Gambetta, Diego, The Sicilian Mafia: the business of private protection, Harvard
University Press, 1996.
Golden, Miriam, “Charges of Malfeasance, Preference Votes, Government Portfolios,
and Characteristics of Legislators, Chamber of Deputies, Republic of Italy, Legislatures
I-XI: Preference Votes, 1948-1994,” Technical Report, Harvard University 2007.
Goldsmith, Arthur A, “Elections and civil violence in new multiparty regimes. Evi-
dence from Africa,” Journal of Peace Research, 2015, 52 (5), 607–621.
Green, W John, A History of Political Murder in Latin America: Killing the Messen-
gers of Change, Suny Press, 2015.
Grossman, Gene M and Elhanan Helpman, “Protection for Sale,” American
Economie Review, 1994, 84 (4), 833–850.
Knoke, David, Political networks: the structural perspective, Vol. 4, Cambridge Univer-
sity Press, 1994.
Leaver, Clare, “Bureaucratic minimal squawk behavior: Theory and evidence from
regulatory agencies,” The American Economic Review, 2009, pp. 572–607.
Lo Moro, Doris, Marcello Gualdani, and Vittorio Zizza, “Commissione parla-
mentare di inchiesta sul fenomeno delle intimidazioni nei confronti degli amministratori
locali,” Technical Report, Italian Senate 2015.
Lodato, Saverio and Tommaso Buscetta, La mafia ha vinto: intervista con Tommaso
Buscetta, Mondadori, 2007.
Lupo, Salvatore, History of the Mafia, Columbia University Press, 2013.
Malanima, P and V Daniele, “Il prodotto delle regioni e il divario Nord-Sud in Italia
(1861-2004),” Rivista di politica economica, 2007.
Mendez, Juan E, The ”Drug War” in Colombia: The Neglected Tragedy of Political
Violence, Human Rights Watch, 1990.
Molzahn, Cory, Viridiana Rıos, and David A Shirk, “Drug violence in Mexico:
Data and analysis through 2014,” Trans-Border Institute, University of San Diego, San
Diego, 2015.
37

Nannicini, Tommaso, Andrea Stella, Guido Tabellini, and Ugo Troiano, “Social
capital and political accountability,” American Economic Journal: Economic Policy,
2013, 5 (2), 222–250.
Paoli, Letizia, Mafia brotherhoods: Organized crime, Italian style, Oxford University
Press, 2003.
Pinotti, Paolo, “Organized Crime, Violence, and the Quality of Politicians: Evidence
from Southern Italy,” Lessons from the Economics of Crime: What Reduces Offending?,
2013, p. 175.
, “The economic costs of organised crime: evidence from southern Italy,” The Economic
Journal, 2015, 125 (586), F203–F232.
Prat, Andrea, “Campaign spending with office-seeking politicians, rational voters, and
multiple lobbies,” Journal of Economic Theory, 2002, 103 (1), 162–189.
Roemer, John E, “Party competition under private and public financing: A comparison
of institutions,” Advances in theoretical economics, 2006, 6 (1), 1–31.
Schelling, Thomas C, “What is the business of organized crime?,” The American
Scholar, 1971, pp. 643–652.
Shirk, David and Joel Wallman, “Understanding Mexico’s Drug Violence,” Journal
of Conflict Resolution, 2015.
Smith, Alastair and Federico Varese, “Payment, Protection and Punishment. The
Role of Information and Reputation in the Mafia,” Rationality and Society, 2001, 13
(3), 349–393.
Solis, Luis Guillermo and Francisco Rojas Aravena, “Organized Crime in Latin
America and the Caribbean,” 2009.
Tabellini, Guido, “The Scope of Cooperation: Values and Incentives,” The Quarterly
Journal of Economics, 2008, 123 (3), 905–950.
38

Appendix 1: Proofs
Proof of Proposition 1. The (equilibrium) profit of a type-θ criminal organization is:
π∗θ ≡ b [1− h (e∗θ, α)]− k (ν∗θ , θ) =
{b[1− α− 1+α
s
]− ν∗s
s
b[1− α− 1+α
w
]− ν∗w
w
⇔ θ = s,
⇔ θ = w.
In order to construct equilibria we must now specify off-path beliefs. Note that, for
any ν∗w, a weak type has no incentive to mimic the strong type as long as ν∗s ≥ ν, with ν
being the solution of
b [1− h (e∗s, α)]− k (ν, w) = b [1− h (e∗w, α)]− k (ν∗w, w) ⇔
ν (ν∗w) = ν∗w + b (1 + α)∆
s.
The most natural separating equilibria are those in which the observed violence level
is high and the organization is strong. That is, a candidate for a PBE has to set beliefs
such that
β (ν) = 1 ⇔ ν ≥ ν,
β (ν) = 0 ⇔ ν < ν.
If the criminal organization optimizes its behavior given these beliefs, then it is easy to
show that it chooses no violence when it is weak — i.e., ν∗w = 0. Indeed, if ν∗w > 0 the
weak organization would strictly gain by choosing ν = 0 regardless of the off-equilibrium
belief associated with this choice. By contrast, when it is strong, it chooses
ν (0) ≡ b (1 + α)∆
s.
Note that this level of violence also satisfies the incentive compatibility constraint of the
strong type — i.e.,
b [1− h (e∗s, α)]− ν∗ss≥ b [1− h (e∗w, α)] ⇔ ν∗s ≤ b
∆
w(1 + α) ,
with b∆w
(1 + α) > ν (0). Hence, the separating equilibrium that is least costly requires a
level of violence equal to b∆s
(1 + α). �
Equilibrium selection (proportional system). The intuitively plausible PBE iden-
tified in Proposition 1 is not unique: many other separating equilibria exist. In fact,
note that, for any equilibrium candidate such that ν∗s > 0 = ν∗w, incentive compatibility
A1

requires
b [1− h (e∗s, α)]− ν∗ss≥ b [1− h (e∗w, α)] ⇔ ν∗s ≤ b (1 + α)
∆
w,
for the strong type. And, equivalently,
b [1− h (e∗w, α)] ≥ b [1− h (e∗s, α)]− ν∗sw
⇔ ν∗s ≥ b (1 + α)∆
s,
for the weak type. One can find off-equilibrium beliefs that support any ν∗s such that
ν∗s ∈ S ≡[b (1 + α)
∆
s, b (1 + α)
∆
w
].
Essentially, this requires β (ν) = 1 for every ν ≥ ν∗s and β (ν) = 0 otherwise. The
least-costly separating equilibrium has two appealing properties. First, it maximizes
the criminal organization’s expected profit (this property is straightforward to verify).
Second, it is the only one that meets the Cho and Kreps (1987) intuitive criterion. To
see why, recall that a PBE is ‘unreasonable’ in the Cho-Kreps sense if it is sustained
by off-path beliefs that ‘attribute’ some deviations to types that prefer to play their
equilibrium strategy rather than the observed deviation, even if these beliefs would treat
such types in the best possible way following the deviation (see Fudenberg and Tirole,
1998). In other words, beliefs conditional on out-of-equilibrium actions should reflect the
fact that these actions are more likely to be chosen by one organizational type rather
than another. More formally, using our notation, β (ν) = 1 for some ν 6= ν∗s is compelling
in the Cho-Kreps sense whenever
π∗w > b [1− h (e∗s, α)]− k (ν, w) ,
π∗s ≤ b [1− h (e∗s, α)]− k (ν, s) .
Similarly, β (ν) = 0 for some ν 6= ν∗s is compelling in the Cho-Kreps sense whenever
π∗w ≤ b [1− h (e∗s, α)]− k (ν, w) ,
π∗s > b [1− h (e∗s, α)]− k (ν, s) .
Meaning that when a deviation is dominated for one type of organization but not
for the other, this deviation should never be attributed to the player for which it is
dominated. When an equilibrium does not satisfy this criterion, it fails the Cho-Kreps
test. Applying this logic to the set S of separating equilibria, it can be shown that every
ν∗s > ν (0) fails to satisfy its requirements except for the least-costly one ν (0). In fact,
A2

consider any ν ∈ [ν (0) , ν∗s ]. By construction
π∗s = b [1− h (e∗s, α)]− k (ν (0) , s) > b [1− h (e∗s, α)]− k (ν, s) ,
but
π∗w ≤ b [1− h (e∗s, α)]− k (ν, w) .
Meaning that a reasonable system of off-equilibrium beliefs should be such that β (ν) = 1
for every ν ∈ [ν (0) , ν∗s ], which is in contradiction with the fact that ν∗s is sustained by off-
equilibrium beliefs such that β (ν) = 1 for every ν ≥ ν∗s and β (ν) = 0 otherwise. Hence,
all separating equilibria strictly contained in S are discarded by the intuitive criterion.
By construction, the least-separating equilibrium cannot be discarded by the Cho-
Kreps intuitive criterion — i.e., it survives the test. Indeed:
π∗w < b [1− h (e∗s, α)]− k (ν, w) ,
and
π∗s < b [1− h (e∗s, α)]− k (ν, s) ,
at any ν < ν (0). So that β (ν) = 0 for ν < ν (0) is plausible in the Cho-Kreps sense.
By the same token, it can be shown that
π∗w > b [1− h (e∗s, α)]− k (ν, w) ,
and
π∗s > b [1− h (e∗s, α)]− k (ν, s) ,
for any ν > ν (0). So that β (ν) = 1 for ν > ν (0) is plausible in the Cho-Kreps sense. �
Pooling Equilibria (proportional system). In a pooling equilibrium, the criminal
organization always chooses ν∗ regardless of its type. In this case, honest politicians base
their effort choice on the prior, i.e., β (ν∗) = β. Hence, the electoral effort chosen by the
honest candidates in any of these (candidate) equilibria solves the following maximization
problem
maxe∈[0,1−α]
{h (e, α)− E [θ|ν∗] e2
2 (1 + α)
},
where
E [θ|ν∗] = βs+ (1− β)w.
The solution for is:
e∗ =1 + α
βs+ (1− β)w.
A3

In equilibrium we must have:
ν∗ ∈ P ≡[0,
b (1 + α) β∆
βs+ (1− β)w
]For any ν∗ in this interval, one can construct off-equilibrium beliefs that support this
outcome as a PBE. Intuitively, the set of pooling equilibria is determined by the fact that
the weak organization could induce an effort of 1+αw
without the need to exert violence.
That is
b [1− h (e∗, α)]− k (ν∗, w) ≥ b [1− h (e∗w, α)] ⇔ ν∗ ≤ b (1 + α) β∆
βs+ (1− β)w. (5)
This is because there cannot exist a pooling equilibrium such that β (0) = 1. Hence,
β (0) must be equal to 0 in any pooling equilibrium. Condition (5) is in fact a neces-
sary condition for a pooling equilibrium to exist, otherwise a weak organization would
always profit from revealing its type. As before, it is possible to find appropriate out-of-
equilibrium beliefs that support each of these levels of violence as a pooling equilibrium.
For example, β (ν) = β whenever ν ≥ ν∗ and β (ν) = 0 otherwise. Under these beliefs, a
strong organization never profits from revealing its type if the weak organization doesn’t,
nor can it gain by pretending to be a weak type. Indeed, any level of violence higher than
the equilibrium level is always attributed (off-equilibrium) by candidates to the weak
type, which leads them to increase effort at the expense of the deviating organization.
How robust are these equilibria? Following the logic used in the case of separating
equilibria it is straightforward to show that the Cho-Kreps intuitive criterion discards all
of them.46 Let πpθ be type θ’s equilibrium expected profit in a pooling equilibrium. The
idea is that since the pooling outcome is sustained by beliefs such that β (ν) = 0 for every
ν ≥ ν∗, and the strong type has lower costs of violence, there always exists a ν ′ > ν∗ such
that
πps > b [1− h (e∗w, α)]− k (ν ′, s) ,
πpw ≤ b [1− h (e∗w, α)]− k (ν ′, w) ,
but yet 1− β (ν ′) > 0, which is implausible in the Cho-Kreps sense.
We can thus conclude that the least-costly separating outcome characterized in Propo-
sition 1 is the most appealing equilibrium of the game. �
46Of course, there may also exist semi-separating equilibria, in which at least one type mixes betweentwo signals, one of which is also chosen with positive probability by the other type. These equilibria,however, do not satisfy the intuitive criterion – for a simple exposition, see, e.g., Bolton and Dewatripont,(2005, Ch. 3.1.).
A4

Proof of Proposition 2. First, note that condition (4) can be rewritten as
1
s< ψ(
1
2− αi, αi, 1) <
1
w,
where
ψ(1
2− αi, αi, 1) ≡
[12− αi
]22 (1 + αi)
,
which is strictly decreasing in αi for αi ∈[0, 1
2
]. Hence, it is satisfied only if s is not too
small — i.e., 1s< limαi→0
[ 12−αi]2
2(1+αi)= 1
8— and if αi ∈ [α, α), with
α ≡ 1
2+
1
w−√
3
w+
1
w2< α ≡ 1
2+
1
s−√
3
s+
1
s2<
1
2,
and α > 0 by assumption A3.
Recall that, under assumption A2, the objective function of the criminal organization
is separable across districts. Hence, focus (without loss of generality) on a generic district
i, and assume that αi ∈ [α, α]. In this region of parameters a weak type can never induce
the honest candidate(s) to lose the election. As a result, in equilibrium it must be ν∗i,w = 0,
so that it makes no profit — i.e., π∗i,w = 0. By contrast, in a separating equilibrium, the
strong type can allow the corrupt party to win the election. Hence, its (equilibrium)
profit is
π∗i,s ≡b
N− k(ν∗i,s, s).
That is, the benefit of ruling the district bN
net of signaling cost k(ν∗i,s, s
).
Hence, a separating equilibrium in which ν∗i,s > 0 can exist if, and only if, the following
incentive compatibility constraints hold
b
N− k(ν∗i,s, s) ≥ 0 ≥ b
N− k(ν∗i,s, w).
This defines the set of separating equilibria
ν∗i,s ∈ S ′ ≡[wb
N,sb
N
].
As before, the off-equilibrium beliefs that support each of these equilibria are such that
β (ν) = 1 for every ν ≥ ν∗i,s, and β (ν) = 0 otherwise. We have thus established the
existence of the least-costly separating equilibrium, in which ν∗i,s = wbN
. �
Equilibrium selection (majoritarian system). The least-costly separating equilib-
rium characterized in Proposition 2 not only maximizes the organization’s expected profit,
but it is also the only one that survives the intuitive criterion. To see why, consider any
ν∗i,s ∈ S ′ strictly larger than ν∗i,s, sustained by off-equilibrium beliefs such that β (ν) = 1
A5
for every ν ≥ ν∗i,s, and β (ν) = 0 otherwise. Consider a deviation ν ∈ [wbN, ν∗i,s). The
following is true
π∗i,s =b
N− k
(ν∗i,s, s
)<
b
N− k (ν, s) ,
whereas by incentive compatibility
0 =b
N− k(wb
N, w) >
b
N− k(ν, w).
Hence, the off-equilibrium beliefs such that β (ν) = 0 for every ν < ν∗i,s cannot satisfy the
intuitive criterion.
By contrast, the least costly separating equilibrium is consistent with Cho-Kreps
because
0 <b
N− k (ν, w) ,
andb
N− k(wb
N, s) <
b
N− k (ν, s)
for every ν < wbN
. So that β (ν) = 0 for ν < wbN
is plausible in the Cho-Kreps sense.
By the same token, it can be shown that
0 >b
N− k (ν, w) ,
andb
N− k(wb
N, s) >
b
N− k (ν, s) ,
for every ν > wbN
. So that β (ν) = 1 for ν > wbN
is plausible in the Cho-Kreps sense.
The analysis of pooling equilibria under a majoritarian system follows the same logic
as in the proportional system and is omitted for brevity. �
Information externalities. Consider the most interesting case in which in both dis-
tricts the c party can win if the criminal organization signals its type — i.e., αi that
satisfies (4) for i = 1, 2. Clearly, when λ1 = λ2 = 0 the organization exerts the same level
of violence in both districts — i.e., ν∗i,s = wb2
and ν∗i,w = 0. The same option is feasible
when λ1 > λ2 ≥ 0, and yields the (strong) organization a total payoff
∑i=1,2
b
2
[1− w
s
]= b
[1− w
s
].
However, an alternative strategy that the organization could enact would be to exert vio-
lence, say ν∗, only in district 1, in order to exploit the informational externality between
districts while saving on the cost of signaling in district 2. In this case, the equilibrium
A6

expected payoff of the strong organization is
b
2(1 + λ1)− ν∗
s,
which does not induce mimicking by the weak type when
0 ≥ b
2(1 + λ1)− ν∗
w⇔ ν∗ ≥ bw
2(1 + λ1) .
Restricting attention (as before) to the least-costly separating equilibrium — i.e., ν∗ =bw2
(1 + λ1) — we have
b[1− w
s
] 1 + λ1
2≤ b
[1− w
s
].
Hence, it is never convenient to exert violence only in district 1. Of course, since, λ2 < λ1
it is also not profitable for the organization to engage in violence only in district 2 to save
on the signaling cost in district 1. �
Appendix 2: Lists of victims of the Sicilian Mafia
Organization Web Address
Fondazione Progetto Legalita http://www.progettolegalita.it/it/prodotti sociali/elenco vittime della mafia.php
Libera http://www.libera.it/flex/cm/pages/ServeBLOB.php/L/IT/IDPagina/87
VittimeMafia http://www.vittimemafia.it/
Wikipedia https://it.wikipedia.org/wiki/Vittime di Cosa nostra in Italia
A7

Appendix 3: Additional figures and tables
Figure A1: Homicide rates in mafia and non-mafia regions, 1887-2012
05
1015
2025
3035
1890 1900 1910 1920 1930 1940 1950 1960 1970 1980 1990 2000 2010
mafia regions non-mafia regions
Note: The graph shows the time series of homicides per 100,000 inhabitants in regions with an historical presence ofmafia-type criminal organizations (Sicily, Campania, and Calabria) and in other regions.
Figure A2: The Massacre of Portella della Ginestra
Note: The map indicates the location of the Massacre of Portella della Ginestra, on Labour Day 1947.
A8

Table A1: Judicial investigations for mafia-related crimes and political alignment of mem-bers of the Italian Parliament, 1945-1993
(1) (2) (3) (4) (5) (6)mafia association criminal association malfeasance(Article 416-bis) (Article 416) (corruption, abuse)
mafia region 0.009*** 0.029*** 0.032***(0.003) (0.008) (0.009)
Left -0.001* -0.001 -0.007* -0.002 -0.019*** -0.015***(0.001) (0.001) (0.004) (0.004) (0.004) (0.004)
Left X mafia region -0.009*** -0.009*** -0.021* -0.024** -0.024** -0.027**(0.003) (0.003) (0.011) (0.011) (0.011) (0.011)
Constant 0.001* 0.021*** 0.032***(0.001) (0.003) (0.003)
Observations 6,043 6,033 6,043 6,033 6,043 6,033Region FE NO YES NO YES NO YESLegislature FE NO YES NO YES NO YESR2 0.006 0.014 0.006 0.045 0.009 0.056
Note: This table shows the relationship between the MPs’ probability of being investigated for mafia-related crimes, theregion in which they were appointed, and their party affiliation. The dependent variable is a binary indicator equal to onefor MPs investigated for various types of crime (indicated on top of each column) and equal to zero other otherwise. Theexplanatory variables mafia region and Left are indicator variables equal to one for MPs elected in Sicily, Calabria, andCampania, and for politicians elected with a party of the Left, respectively. The data cover the period 1945-1993. ∗, ∗∗,and ∗∗∗ denote statistical significance at the 90%, 95%, and 99% confidence levels, respectively.
Table A2: Timing of political murders by the Sicilian Mafia, 1945-2013 (robustness:excluding early elections
(1) (2) (3) (4) (5) (6)OLS regression Prais-Winsten Poisson
electoral 0.130*** 0.138*** 0.135*** 0.145*** 1.310*** 1.269***(0.043) (0.048) (0.051) (0.055) (0.335) (0.373)
postelectoral 0.064 0.053 0.070 0.061 0.877** 0.736**(0.041) (0.039) (0.048) (0.045) (0.365) (0.359)
log of GDP per capita 0.977 0.924 2.268(0.642) (0.774) (2.935)
log of population 3.249* 3.326* 13.793(1.666) (2.011) (21.995)
Observations 528 504 528 504 528 504Durbin Watson 1.584 1.616 1.983 1.981 . .R2 0.156 0.170 0.120 0.133 0.298 0.293
Note: This table shows the relationship between the timing of national elections and political homicides committed bythe Mafia in Sicily between January 1945 and December 2013. The dependent variable is the number of victims in eachmonth, electoral is a dummy equal to 1 in the month of the elections and in the 11 preceding months (and equal to zerootherwise), and postelectoral is a dummy equal to 1 in the 12 months after an election. All regressions control for a cubicpolynomial in the number of months since January 1945 and 12 month-specific fixed effects; the specifications in columns(2), (4), and (6) include in addition the log of regional GDP per capita and population. Each column reports the resultsusing a different method, reported on top of each column. Robust standard errors are reported in parentheses. ∗, ∗∗, and∗∗∗ denote statistical significance at the 90%, 95%, and 99% confidence levels, respectively.
A9

Table A3: Timing of political murders by the Sicilian Mafia, 1945-2013 (robustness:weighting by distance from elections)
(1) (2) (3) (4) (5) (6)OLS regression Prais-Winsten Poisson
electoral∗ 0.101** 0.092** 0.102** 0.093* 0.989** 0.710*(0.042) (0.043) (0.048) (0.048) (0.386) (0.426)
postelectoral∗ 0.026 0.008 0.025 0.008 0.479 0.091(0.032) (0.033) (0.039) (0.039) (0.584) (0.598)
log of GDP per capita 0.991** 0.982* 6.167*(0.447) (0.516) (3.492)
log of population 1.224 1.211 -0.118(1.130) (1.308) (13.151)
Observations 828 804 828 804 828 804Durbin Watson 1.661 1.698 2.008 2.002 . .R2 0.112 0.130 0.087 0.103 . .
Note: This table shows the relationship between the timing of national elections and political homicides committed bythe Mafia in Sicily between January 1945 and December 2013. The dependent variable is the number of victims ineach month, the main explanatory variables electoral∗ and postelectoral∗ are two measures of the distance from electionsconstructed as triangular weighting schemes within a symmetric 1-year window around elections. In particular, electoral∗t =[12 + (t − t∗)]/12, ∀t ∈ [t∗ − 11, t∗] and postelectoral∗t = [12 + (t∗ + 1 − t)]/12, ∀t ∈ [t∗ + 1, t∗ + 12], where t∗ is themonth of the elections. All regressions control for a cubic polynomial in the number of months since January 1945 and12 month-specific fixed effects; the specifications in columns (2), (4), and (6) include in addition the log of regional GDPper capita and population. Each column reports the results using a different method, reported on top of each column.Robust standard errors are reported in parentheses. ∗, ∗∗, and ∗∗∗ denote statistical significance at the 90%, 95%, and99% confidence levels, respectively.
A10

Table A4: Electoral violence and parliamentary debates about the mafia, 1948-2013(robustness: occurrence of the word “Mafia”)
(1) (2) (3) (4) (5) (6) (7) (8)all MPs elected in Sicily MPs elected in other regions all MPs
total number of words (× 1,000) 0.606*** 0.607*** 0.596*** 0.106*** 0.107*** 0.106*** 0.193** 0.191**(0.168) (0.165) (0.161) (0.032) (0.032) (0.032) (0.079) (0.078)
total homicides before elections 0.108 0.291* 0.209 0.021 0.046*** 0.034*** 0.050*** 0.043***(0.113) (0.148) (0.129) (0.016) (0.011) (0.009) (0.014) (0.013)
political homicides before elections -0.978** -0.660 -0.131*** -0.107*** -0.140*** -0.121***(0.447) (0.400) (0.035) (0.025) (0.043) (0.033)
Left 1.868* -0.044 -0.131(1.026) (0.076) (0.128)
Left X total homicides 0.350** 0.032** 0.020(0.157) (0.013) (0.018)
Left X political homicides -1.336*** -0.062 -0.050(0.386) (0.045) (0.048)
Sicily 1.595* 0.552(0.774) (0.373)
Sicily X total homicides 0.219 0.130(0.149) (0.107)
Sicily X political homicides -0.812* -0.420(0.455) (0.318)
Left X Sicily 3.317*(1.743)
Left X Sicily X total homicides 0.410(0.239)
Left X Sicily X political homicides -1.689*Observations 653 653 653 7,064 7,064 7,064 7,717 7,717R2 0.405 0.418 0.430 0.097 0.101 0.102 0.170 0.184
Note: This table shows the effect of electoral violence by the Mafia on parliamentary debates since 1948, as reported in theofficial transcripts of the Italian Parliament. The sample in columns (1) to (3) includes all parliamentary speeches by MPselected in Sicily; the sample in columns (4) to (6) includes all MPs elected in other regions that intervened in a parliamentarydebate in which at least one MP elected in Sicily also intervened; and the sample in columns (7) and (8) includes all MPsin the previous columns. The unit of observation is the MP-legislature and the dependent variable is the number of timesthe word “Mafia” is mentioned by each MP in a given legislature. total homicides before elections is the number of peoplekilled by the Mafia in each municipality in the year before elections, and political homicides before elections is the numberof victims that had some linkage with political parties and/or trade unions (e.g., party members or local administrators).Left and Sicily are dummy variables for MPs of the Left (the Italian Communist Party in the First Republic and theCenter-Left coalition in the Second Republic) and MPs appointed in Sicily, respectively. Finally, total number of words (×1,000) is the total number of words pronounced by each MP in a given legislature. Robust standard errors are reported inparentheses and are clustered by MP and by legislature using the two-way clustering method described in Cameron et al.(2012). ∗, ∗∗, and ∗∗∗ denote statistical significance at the 90%, 95%, and 99% confidence levels, respectively.
A11

Table A5: Other crimes in mafia and non-mafia regions during the electoral period,1956-2012
(1) (2) (3) (4) (5) (6) (7)theft robberies extortions kidnap all predatory smug drug
mafia X electoral period 39.80 -0.757 0.205 0.218 9.123 12.42 -0.300(69.49) (12.07) (0.841) (0.279) (12.51) (9.175) (6.148)
Average crime rate 1413.5 40.545 5.954 1.463 33.826 22.694 44.214Observations 912 608 608 608 912 480 608R2 0.805 0.435 0.722 0.803 0.566 0.156 0.814Number of regions 16 16 16 16 16 16 16Initial year 1956 1975 1975 1975 1956 1983 1975
Note: This table shows the differential effect of electoral cycles on various types of crime (other than homicides), indicatedon top of each column, in mafia and non-mafia regions. The category ‘all predatory’ is the sum of robberies, extortions, andkidnappings. The dependent variable is the crime rate per 100,000 inhabitants in each region and year, the explanatoryvariable of interest is the interaction between the fraction of months in each calendar year within 12 months from thefollowing national election (electoral Period) and an indicator variable equal to 1 for regions with an historical presence ofmafia-type criminal organizations (mafia). All series extend through year 2012 but the initial sample year varies for eachtype of offense, and it is reported at the bottom of each column; the average crime rate for each type of offense is alsoreported in the table. Region and year fixed effects are included in all regressions. Robust standard errors are reported inparentheses and they are clustered by region and by year using the two-way clustering method described in Cameron et al.(2012). ∗, ∗∗, and ∗∗∗ denote statistical significance at the 90%, 95%, and 99% confidence levels, respectively.
A12