organizational transformation research ver. 4
158
Irwin Archer 02737073 2012 FACULTY OF ENGINEERING THE UNIVERSITY OF THE WEST INDIES REPORT TITLE: AN INVESTIGATION INTO THE FACTORS THAT CAUSE ORGANIZATIONAL TRANSFORMATION INITIATIVES TO FAIL A Project Report Submitted in Partial Fulfillment of the Requirements to the Degree of Master of Science In Project Management of The University of the West Indies PRMG6014 Project Management Research Project
-
Upload
irwin-archer -
Category
Documents
-
view
237 -
download
8
Transcript of organizational transformation research ver. 4

Irwin Archer
02737073
2012
NAME: SOCA WARRIOR
FACULTY OF
ENGINEERING
THE UNIVERSITY OF THE WEST
INDIES
REPORT TITLE:
AN INVESTIGATION INTO THE FACTORS THAT
CAUSE ORGANIZATIONAL TRANSFORMATION
INITIATIVES TO FAIL
A Project Report
Submitted in Partial Fulfillment of the
Requirements to the Degree of Master of Science
In Project Management
of
The University of the West Indies
PRMG6014
Project Management Research
Project

i
ABSTRACT
A high failure rate plagues organizational transformation initiatives. This project
report examines the implementation of such an initiative amidst turbulent
environmental conditions with the aim of identifying competencies that contribute
to their success and factors that cause their failure. The organization under study
is an electricity transmission and distribution utility that serves the nation of
Trinidad and Tobago. Strategic leadership, Project Management, Programme
Management and Portfolio Management were identified as the key competencies
required for successful organizational transformations.
Twelve objective performance measurements were compared to the varying levels
of strategic leadership that existed within the organization from 2008-2012. In
addition, the perspectives of the initiative’s key stakeholders were sought in order
to evaluate its overall success. The Project, Programme and Portfolio
Management Maturity levels were also measured to add context to the
understanding of results observed. Models designed to build these competencies
were discussed and target levels of competency maturity for the organization were
recommended based on its unique needs.
It was found that strategic leadership is related to organizational performance, but
is inhibited by the presence of strong external political influences and low project,
programme and portfolio management maturity levels. This research adds to the
field of study by proposing an ideal environment and model for the execution of
ii
organizational transformations. The recommendations of this report promise a
boost in the efficiency and success rate of these initiatives.
Keywords:
Irwin Archer; organizational transformation; project management; programme
management; portfolio management; T&TEC; strategic planning; strategic
leadership

iii
ACKNOWLEDGEMENTS
All praises and thanks be to Allah.
I would like to acknowledge Mr. Clyde Pilgrim, Programme Coordinator at the
Ministry of Housing and the Environment, for his help in reviewing this
manuscript at key milestones during its creation. I also acknowledge Dr. Manfred
Jantzen who sparked my interest in organizational transformation early on in my
postgraduate studies. Last but not least, I acknowledge my research supervisor,
Professor Winston H. E. Suite, for providing timely guidance that greatly
improved the quality of this project report.

iv
TABLE OF CONTENTS
ABSTRACT ........................................................................................................ i
ACKNOWLEDGEMENTS ............................................................................... iii
LIST OF ABBREVIATIONS ........................................................................... vii
TABLE OF FIGURES ..................................................................................... viii
LIST OF TABLES ...............................................................................................x
PREFACE.......................................................................................................... xi
CHAPTER 1 ........................................................................................................1
1.0 INTRODUCTION: ................................................................................1
1.1 BACKGROUND ...................................................................................5
1.2 SUMMARY ........................................................................................ 15
CHAPTER 2 ...................................................................................................... 17
2.0 PROBLEM DEFINITION ................................................................... 17
2.1 HYPOTHESES: ................................................................................... 18
2.2 AIMS AND OBJECTIVES .................................................................. 18
2.3 METHODOLOGY .............................................................................. 20
2.3.1 Overview ...................................................................................... 20
2.3.2 Population, sampling and instrumentation ..................................... 21

v
2.3.3 Analysis plan ................................................................................ 24
2.3.4 Assumptions ................................................................................. 27
2.3.5 Limitations ................................................................................... 28
2.4 DELIVERABLES ................................................................................ 29
2.5 SUMMARY ........................................................................................ 30
CHAPTER 3 ...................................................................................................... 31
3.0 LITERATURE REVIEW ..................................................................... 31
3.0.1 Strategic Planning ......................................................................... 31
3.0.2 Organizational Transformation ..................................................... 42
3.1 SUMMARY ........................................................................................ 51
CHAPTER 4 ...................................................................................................... 53
4.0 PRESENTATION OF DATA .............................................................. 53
4.0.1 Objective 3 ................................................................................... 53
4.0.2 Objective 4 ................................................................................... 60
4.0.3 Objective 5 ................................................................................... 67
4.0.4 Objective 6 ................................................................................... 72
4.0.5 Strategic Leadership...................................................................... 76
4.0.6 P3M3 Assessment ......................................................................... 81
4.1 SUMMARY ........................................................................................ 85
CHAPTER 5 ...................................................................................................... 86

vi
5.0 DISCUSSION ...................................................................................... 86
5.1 RECOMMENDATIONS ..................................................................... 93
5.1.1 Short term ..................................................................................... 93
5.1.2 Medium Term ............................................................................... 97
5.1.3 Long Term .................................................................................... 99
5.2 CONCLUSION.................................................................................. 100
BIBLIOGRAPHY ............................................................................................ 103
APPENDIX A: SUMMARY OF ELECTRICITY RATES ............................... 116
APPENDIX B- VISION AND MISSION OF T&TEC ..................................... 118
APPENDIX C: CUSTOMER SURVEY........................................................... 120
APPENDIX D: JOB SATISFACTION QUESTIONNAIRE............................. 122
APPENDIX E: LIST OF PROJECTS AND ACTIVITIES ............................... 126
APPENDIX F: TABLES FOR GRAPHS ......................................................... 131
APPENDIX G: FREEDOM OF INFORMATION ACT ................................... 135
APPENDIX H: CORRELATION TABLE ....................................................... 140
APPENDIX I: TREND OF FINANCIAL RATIOS .......................................... 142

vii
LIST OF ABBREVIATIONS
AGM: Assistant General Manager
AMI: Advanced Metering Infrastructure
CEO: Chief Executive Officer
CMMI: Capability Maturity Model Integration
GES: Guaranteed Electricity Standards
GORTT: Government of the Republic of Trinidad and Tobago
HSE: Health, Safety and the Environment
ISO: International Standards Organization
OES: Overall Electricity Standards
OPM3: Organizational Project Management Model
OWTU: Oilfield Workers Trade Union
P3M3: Portfolio, Programme and Project Management Maturity Model
PNM: People’s National Movement
PMO: Project Management Office
QSS: Quality of Service Standards
RIC: Regulated Industries Commission
SOE: State Owned Enterprise
SPOTS: Strategic Plans on Top Shelves – gathering dust
T&TEC: Trinidad and Tobago Electricity Commission
The Commission: The Trinidad and Tobago Electricity Commission

viii
TABLE OF FIGURES
Figure 1-1: Graph showing number of T&TEC Customers 1947-2006 .................6
Figure 1-2: Chart Showing Electricity Generating Capacity of Power
Producers in Megawatts .......................................................................................8
Figure 1-3: Graph showing number of T&TEC employees from 1949-2006 .........9
Figure 1-4: Map of Distribution Areas, Offices and Service Centres of
T&TEC .............................................................................................................. 11
Figure 1-5: T&TEC Top Level Organizational Chart ......................................... 13
Figure 3-1: Ansoff Matrix .................................................................................. 36
Figure 3-2: Diagrammatic Meta-Theory of Strategically Planned
Organizational Transformations. ........................................................................ 51
Figure 4-1: Chart showing geographic location of respondents to the
customer satisfaction survey ............................................................................... 53
Figure 4-2: Chart showing average of responses to customer satisfaction
survey ................................................................................................................ 55
Figure 4-3: Chart showing Average Score in each area ....................................... 55
Figure 4-4: Graph showing written complaints per 10,000 customers from the
periods ending Jun 2008 to Sep 2011 ................................................................. 56
Figure 4-5: Graph showing customers per employee from the periods ending
Jun 2008 to Sep 2011 ......................................................................................... 57
Figure 4-6: Graph showing current and quick ratios. .......................................... 62
Figure 4-7: Graph showing Fixed and Total Asset Turnover............................... 63
Figure 4-8: Graph showing T&TEC’s annual profitability ratios ........................ 65

ix
Figure 4-9: Graph showing Times Interest Earned Ratio .................................... 66
Figure 4-10: Chart showing gender of job satisfaction questionnaire
respondents ........................................................................................................ 67
Figure 4-11: Chart showing geographic area of job satisfaction questionnaire
respondents ........................................................................................................ 67
Figure 4-12: Chart showing tenure of job satisfaction questionnaire
respondents ........................................................................................................ 68
Figure 4-13: Chart showing average scores for objective 5 and its elements ....... 69
Figure 4-14: Graph showing recordable and reported incidents from Jan
2008- Dec 2011 .................................................................................................. 70
Figure 4-15: Graph showing the severity of safety incidents from Q1 2008 to
Q4 2012 ............................................................................................................. 71
Figure 4-16: Chart showing scores for objective 6 and its elements .................... 73
Figure 4-17: Graph showing Leadership Score of 4 General Managers of
T&TEC (question 20) ........................................................................................ 77
Figure 4-18: Graph showing scores for Strategic Leadership and its
components ........................................................................................................ 79
Figure 4-19: Graph showing leadership score from Jan 2008 – Dec 2011 ........... 80
Figure 4-20: Project Management Maturity ........................................................ 83
Figure 4-21: Programme Management Maturity ................................................. 84
Figure 4-22: Portfolio Management Maturity ..................................................... 85
Figure 5-1: Chart showing target competency maturity levels ............................ 97
Figure I-1: Graphs showing declining financial trend ....................................... 144

x
LIST OF TABLES
Table 1-1: Employee Analysis as at 2011-09-31 ................................................. 10
Table 2-1 Distribution of customers and employees of T&TEC .......................... 22
Table 4-1: Rating scale for questionnaire responses ............................................ 54
Table 4-2: Calculation of Frequency Rate and Incident Rate .............................. 70
Table 4-3: Profile on General Managers ............................................................. 76
Table 4-4: Turnover of General Managers .......................................................... 76
Table 4-5: Calculation of the weighted average leadership score ........................ 78
Table A-1: Summary of electricity rates ........................................................... 117
Table F-1: Table showing data used to calculate 7 financial ratios. ................... 132
Table F-2: Data used to calculate customers per employee ratio and written
complaints per 10,000 customers...................................................................... 133
Table F-3: Data used to calculate reported, recordable and severity safety
indexes ............................................................................................................. 134
Table H-1: Correlation of performance data with strategic leadership ............... 141
xi
PREFACE
The writer joined T&TEC as an administrative employee in April of 2008. As
such, it was possible to observe the implementation of the organization’s 2008-
2012 strategic plan. As a Management Professional, the writer appreciated the
quality of this strategic plan and looked forward to seeing its objectives achieved.
A proper implementation of this plan would bring about a total transformation of
T&TEC as technology, strategy, culture and the very structure of the organization
adapted to deliver higher performance in its changing external environment.
However, what transpired in the subsequent 4 years was far from what was
expected. Even though projects designed to realize T&TEC’s strategic objectives
were well financed, they seemed to have failed to bring about the improvements
they promised. The performance of T&TEC seemed to have dropped rather than
risen, and the organizational culture became even more dysfunctional.
Midway through the implementation of this plan, the writer began a M.Sc. Degree
in Project Management at the University of the West Indies. While progressing
through the course material, the writer quickly learned Project, Programme and
Portfolio Management best practices. It then became evident that a lack of these
competencies within T&TEC was affecting the organization’s ability to properly
implement the 2008-2012 strategic plan. It also became evident that strategic
planning and project management are extremely similar disciplines. The topic of
this project report therefore became an easy choice.

xii
The writer is pleased to present this unique analysis of organizational
transformation initiatives. It builds upon a common premise among authors, that
project management is a critical competency required for the successful
implementation of such initiatives. In this report, the writer describes the best
practices of Strategic Planning, Strategic Leadership, Project Management,
Programme Management and Portfolio Management; and how they must interact
to bring about the successful transformation of an organization.
Many organizations start transformation initiatives based on elaborate, well
intentioned strategic plans; but do nothing to address their shortcomings in
project, programme and portfolio management. In this research, the writer
explores models that are designed to measure and build these competencies, as
well as models that measure true organizational performance. Strategic leadership
is the thread that binds all of these critical competencies together in a meaningful
way. This competency will also be measured and compared to the true
performance of T&TEC during the strategic planning term.
Through this research, the writer will show that the competencies of the CEO and
the experienced project manager are almost indistinguishable, and how a project
management approach to strategic leadership can increase the success rate of
transformation initiatives.
Very rarely do opportunities arise that enable the analysis of the effects of
strategic leadership. However, such analysis was made possible in this research
project by the high turnover of General Managers at T&TEC. A comprehensive
methodology designed to reach a wide audience of management and technical

xiii
professionals captures the factors that cause organizational transformation
initiatives to fall short of success. Ultimately, this research project synthesizes
empirical evidence and current best practices into a dynamic meta-theory of
strategic planning and implementation that promises to boost the success rate of
transformation initiatives.
Other organizational transformation studies encountered have looked at the topic
from cultural and behavioral angles (Banish & Nawaz, 2003), (Wagner, 2006).
The writer believes that the connected nature of Strategic Leadership and Project
Management is underemphasized in existing organizational transformation
research and thus saw it fit to pioneer this much needed research project. It is
hoped that it sparks continued interest in these critical competencies and increased
acknowledgement of the suitability of the project manager for the leadership roles
within organizations.
1
1 CHAPTER 1
1.0 INTRODUCTION:
Trinidad and Tobago is a relatively young nation, having attained independence
from England in 1962. This independence meant that many public sector
organizations were thrust into the hands of local executives for the first time.
These locals were inexperienced in the art of strategic leadership and therefore
relied on inherited organizational systems and structures to keep their
establishments running. The Trinidad and Tobago Electricity Commission
(T&TEC) is one such organization (Mitchel, 2007).
T&TEC continues to function as Trinidad & Tobago’s sole electricity
transmission and distribution utility. However, as major advancements have
occurred in T&TEC's external environment in the 21st century, the 'old'
leadership paradigm has become obsolete. There is now a recognized need for
strategic leadership as the organization must transform to survive.
Currently, T&TEC is experiencing a leadership crisis that is evidenced by a high
turnover of General Managers (Welch, 2011), (Javeed, T&TEC boss sent packing,
2011), (Kissoon, 2011). This top executive post officially changed hands 5 times
since 2008. In addition, two Chairmen of T&TEC have resigned since 2008
amidst allegations of corruption (Javeed, T&TEC BOSS QUITS, 2012),
(Hassanali & Gumbs-Sandiford, 2012), (Cornelly, 2008), and the media generally
depicts T&TEC as an organization in which corruption abounds (Lord, 2008),
(Alexander, 2009), (Julien, 2010). The industrial relations climate of T&TEC can
2
only be described as anarchic, characterized by prolonged negotiations, frequent
protests, and general antagonism between operational employees and
management. Some effects of this crisis include under motivated employees and
customers that seem dissatisfied with the quality of service they receive from
T&TEC.
As the end of the 2008-2012 Strategic Planning term approaches, it seems
appropriate to revisit this plan and evaluate its implementation. This strategic plan
was an attempt to transform T&TEC into a high performance organization.
Organizational transformation initiatives such as this bear many similarities to a
project in that they are transient endeavours with specified objectives, and budgets
and schedules within which these objectives must be achieved. However, the
magnitude and complexity of the scope of such initiatives place them in a
category above that of projects as they often comprise of several projects and
programmes. It is still believed that Project and Programme Management
knowledge can be applied in evaluating the implementation of organizational
transformation initiatives.
This research project aims to do just that, and will evaluate the implementation of
the 2008-2012 strategic plan of T&TEC by determining the progress made
towards achieving its objectives. The following six strategic objectives were set
for T&TEC in its 2008-2012 strategic plan:

3
Engineering related
1. “To ensure that the necessary generation capacity is planned and
developed to match the load demand with the desired reliability at all
times.
2. To ensure that the transmission and distribution infrastructure is
developed, operated and maintained to provide a safe, reliable electricity
supply to all customers.”
Management Related
3. “To achieve the highest level of customer satisfaction through excellence
in customer service.
4. To ensure that T&TEC attains financial viability through the application
of economic tariffs, cost consciousness, and the promotion of a culture of
revenue enhancement and protection.
5. To ensure that health, safety, security, environmental, quality and business
continuity management systems are developed and integrated in all of
T&TEC’s business operations.
6. To ensure the development of a caring and service oriented organizational
culture, that promotes trust, respect, open communication, empowerment
of employees, teamwork and a recognition and reward system for
employees’ performance.”
(T&TEC, 2008)

4
The first two strategic objectives rely upon the Commission’s technical
competency in Electrical Engineering; they are classified as engineering
objectives. The remaining four strategic objectives require high levels of
managerial and leadership competencies; they are classified as management
objectives. For the purposes of succinctness, clarity and remaining within the
scope of knowledge of the writer, only the management objectives of T&TEC
will be evaluated. The writer believes that these objectives represent the true
purpose of the strategic plan and that the engineering objectives are pursued in
order to achieve these management objectives. The achievement of these
management objectives would therefore indicate that the strategic plan was
successfully implemented.
Through this research, the writer hopes to demonstrate the applicability of project
and programme management to strategic leadership and organizational
transformation initiatives. It is hoped that this research can justify the ascent of
the project manager beyond middle management and towards the leadership
position within organizations.

5
1.1 BACKGROUND
The Trinidad and Tobago Electricity Commission was formed by the Trinidad
and Tobago Electricity Ordinance No. 42 of 1945. Its mandate was to carry out a
nationwide electrification initiative of the then colonial government. Making use
of Trinidad and Tobago’s abundant supply of hydrocarbons, T&TEC was able to
keep abreast with the rapidly increasing demand for electricity on the islands and
has played a key role in national development.
When the nation gained independence in 1962, patriotism and nationalism
sentiments grew within T&TEC and plans were made to place locals in top
administrative positions within the organization. These plans did not sit well with
the administrators of the former colonial regime, who fled the Commission en
masse in 1964, leaving the inexperienced locals to fend for the organization and
themselves. This exodus, which was amidst the construction of the Port of Spain
B Power Station, caused the first Prime Minister of Trinidad and Tobago, Dr. Eric
Williams, to intervene. He procured experts from Canada and Israel to train the
local engineers and administrators. T&TEC’s has since continued its
electrification of the nation, serving its growing customer base with increased
reliability (see Figure 1-1).

6
Figure 1-1: Graph showing number of T&TEC Customers 1947-2006
Source: (Mitchel, 2007)
The level of household electrification is currently over 97%. This attests to the
extensiveness of the transmission and distribution networks and can be attributed
to the high level of technical competency of the Commission’s workforce. There
are four general classes of customers: Residential, Commercial, Industrial and
Street Lighting. The industrial customers in particular, enjoy rates that are among
the lowest in the region (see APPENDIX A: SUMMARY OF ELECTRICITY
RATES). This is made possible by the low natural gas prices enjoyed by T&TEC
and plays an important role in attracting foreign investors to Trinidad and Tobago.
T&TEC purchases natural gas from the National Gas Company of Trinidad and
Tobago for use by independent power producers then purchases generated
electricity from them through long term power purchase agreements. The
Commission therefore pays an energy conversion cost to these power producers.
.
0
50000
100000
150000
200000
250000
300000
350000
400000
1947
1950
1953
1956
1959
1962
1965
1968
1971
1974
1977
1980
1983
1986
1989
1992
1995
1998
2001
2004
Customers
Customers
7
Since the late 1980’s there has been a GORTT drive to privatize or close low
performing State Owned Enterprises (SOEs). 49% of the telecommunications
company- TELCO, was divested in 1987 and Trinidad Cement was divested
through a public offering in 1988. From the 90’s onwards, the Fertilizer company-
Fertrin, the Iron and Steel company- ISPATT, the postal service and the national
airline were among the many organizations privatized, and sugar manufacturing
was closed after a failed attempt to transform the struggling SOE: Caroni (1975
Ltd) (Bernal & Leslie, 1999), (Ministry of Trade and Industry, 2011). The
electrical power generation sector was also largely divested in this drive leaving
T&TEC to focus mainly on electricity transmission and distribution. Today,
T&TEC’s electricity grid is powered by Trinidad Generation Unlimited and
Trinity Power, which are independent power producers; POWERGEN, which is a
subsidiary that is 51% owned by T&TEC; and the Cove Power Station, which is
fully owned by T&TEC (see Figure 1-2).
The Trinidad Generation Unlimited Union Estate Power Station was originally
constructed to supply electricity to an aluminum smelter planned for south
Trinidad. 240 MW was intended to supply the smelter, with the extra 480 MW
going to the national electricity grid (Ministry of Energy and Energy Affairs,
2009). However, this smelter project was shelved when the government changed
in 2010, resulting in a surplus of electricity generation capacity in Trinidad and
Tobago. The optimization of electricity generation through switching to combined
cycle generation and the shutting down of lesser efficient power plants is the new
strategy amidst the current surplus (Doughty, 2012).

8
Figure 1-2: Chart Showing Electricity Generating Capacity of Power Producers in Megawatts
Source: (Ministry of Energy and Energy Affairs, 2009)
T&TEC recruits employees to entry level professional, technical, administrative
and field positions. Higher level positions are filled primarily by the promotion of
existing employees. Staff retention at T&TEC is high due to the relatively high
salaries and wages offered to employees. The operational employees of T&TEC
are heavily unionized and are represented by the Oilfield Workers Trade Union.
Wage negotiations become due every three years and typically result in salary and
wage increases. These negotiations are often delayed and are thus typically
accompanied by industrial action. This industrial action is done clandestinely
however, because T&TEC is classed as an “essential industry” in the Industrial
Relations Act #23 of 1972 of Trinidad and Tobago. Section 67 of this Act
POWERGEN, 1344
TRINITY POWER, 225
TRINIDAD GENERATION
UNLIMITED, 720
Cove Power Station, 64

9
stipulates a fine and jail sentence for T&TEC employees that partake in industrial
action.
The workforce of T&TEC has grown considerably over the years in response to
its steadily increasing customer base (see Figure 1-3). The optimization of human
resources through the use of technology continues to be a strategy of T&TEC.
Figure 1-3: Graph showing number of T&TEC employees from 1949-2006
Note: at the end of 1994, the generation assets of the organization were divested.
Source: (Mitchel, 2007)
The Senior Staff Association is the union that negotiates on behalf of the
Commission’s Senior Staff. However, details about the compensation paid to this
class of employees are not publicized within the organization. A presentation of
the size and composition of the Commission’s workforce as at 2011-09-31 can be
seen in Table 1-1.
0
500
1000
1500
2000
2500
3000
3500
1949
1953
1957
1961
1965
1969
1973
1977
1981
1985
1989
1993
1997
2001
2005
no. of employees
no. of employees

10
CLASSIFICATION TEMPORARY PERMANENT TOTAL
Executive and Managerial Staff - 166 166
Administrative Staff 112 732 844
Technical/ Professional Staff 9 454 463
Security Staff - 37 37
Hourly Rated 101 1,076 1,177
TOTAL 222 2,465 2,687
Table 1-1: Employee Analysis as at 2011-09-31
Source: (T&TEC, 2011)
The above table represents an official staff analysis done at T&TEC. At the time
of writing of this report, more recent official data were unavailable.
There is a high level of danger inherent in many of the job tasks at T&TEC. As
such, safety is treated as a high priority. Health, Safety and Environmental
management are all integrated into a single department under the Human
Resources Division of the Commission. This department ensures compliance to
the Occupational Safety and Health Act of 2004 of Trinidad and Tobago by
communicating the Commission’s safety policy to employees and monitoring,
investigating and recording accidents. The department also conducts training,
inspections and events aimed at boosting safety consciousness. The organization
is monitored by the Environmental Management Authority to ensure that it
complies with the Environmental Management Act of 2000. Internal
environmental policing therefore seeks to detect and deter breaches of this Act
before heavy penalties are faced by the Commission. Transformer oil spills,
which result in the pollution of ground water and harming of humans and wildlife,
continue to be among the top environmental concerns of T&TEC.

11
T&TEC is divided geographically into Five Distribution areas (see Figure 1-4). Its
main functions include the operation, development and maintenance of its
transmission and distribution networks, and the retail of electricity to the
populations of Trinidad and Tobago. The customer service centers are the primary
interaction points between T&TEC and its customers. Customers visit these
centers to pay bills, make queries, transfer accounts, request new electricity
supplies or make changes to their existing supplies. The business hours of these
Customer Service Centres are from 8:00 AM to 3:45 PM Mondays to Fridays.
Customer payments are also facilitated via online banking.
Figure 1-4: Map of Distribution Areas, Offices and Service Centres of T&TEC
Source: (T&TEC)

12
T&TEC is overseen by a Board of Commissioners appointed by the Government
of the Republic of Trinidad and Tobago. This board is led by its Chairman in
appointing a General Manager to run the day to day affairs of the organization.
The relationship between the Commissioners and the General Manager is similar
to that of a Board of Directors and a CEO of a traditional corporation. The
organization is separated into six functional areas (see Figure 1-5), each overseen
by an Assistant General Manager (AGM).
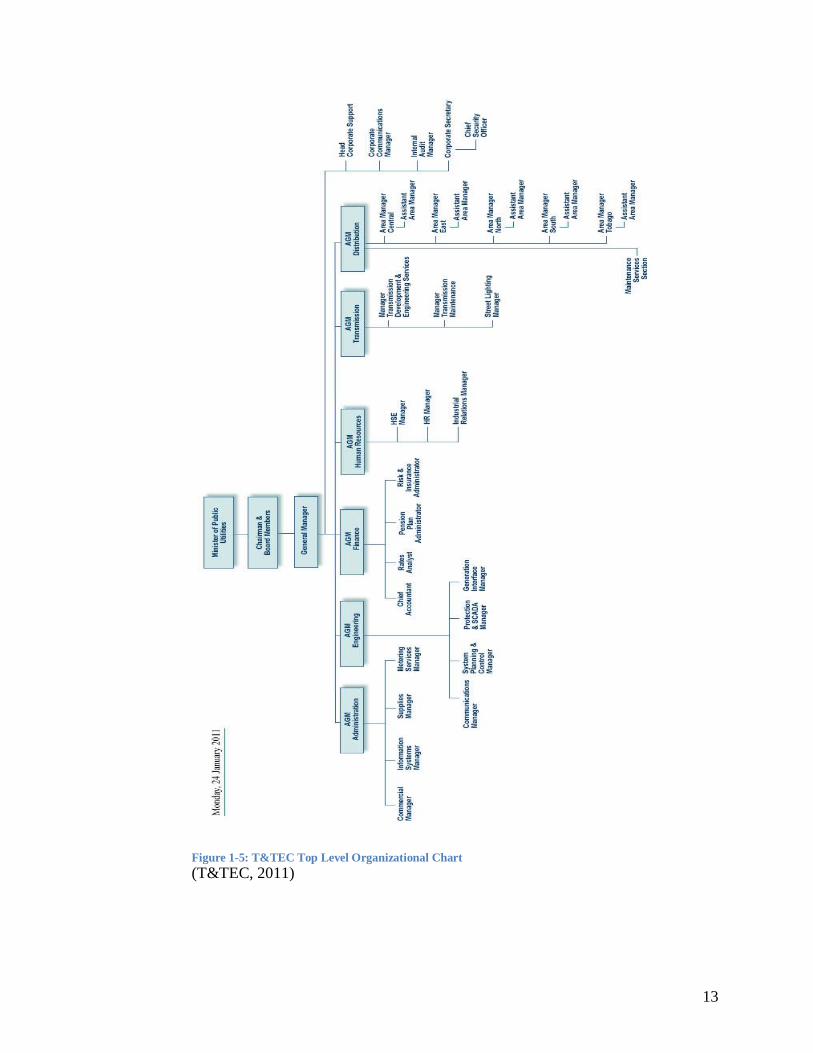
13
Figure 1-5: T&TEC Top Level Organizational Chart
(T&TEC, 2011)

14
In 2004, T&TEC began a transformation drive in response to the GORTT’s
Vision 2020 initiative. This initiative was aimed at taking Trinidad and Tobago to
developed country status by the year 2020. To support this initiative T&TEC was
required to develop its customer service, financial viability, technological
capability, human resource potential and electricity infrastructure. Various
shortcomings in each of these areas could not be allowed to continue if the nation
of Trinidad and Tobago was to be on its way towards developed country status
(T&TEC, 2004).
The 2008-2012 strategic plan continued with the theme of organizational
transformation, but with a new mission and vision. Customer Service and
Environmental Awareness rose to higher prominence in the 2008-2012 plan, each
being specially mentioned in the vision and mission statements respectively (See
APPENDIX B- VISION AND MISSION OF T&TEC). In addition, projects
aimed at obtaining ISO 9001 and 14001 certifications were included in the plan.
These international standards are aimed at developing and institutionalizing
quality management and environmental management respectively.
A major error in this new strategic plan however, was a projection of political
stability for the strategic planning term. What ensued can only be described as a
political upheaval. The PNM Government, under the directive of the then Prime
Minister Patrick Manning, called a general election 2 years early and lost. The
result was an unanticipated change in the governance of the Republic of Trinidad
and Tobago, and soon after, a change in the Board of Commissioners of T&TEC.
There was also a high turnover of General Managers of T&TEC and a resultant

15
leadership crisis within the organization. The General Manager post officially
changed hands 5 times since 2008. Never before in the history of the Commission
had the turnover rate for this post been so high.
In addition, the Regulated Industries Commission (RIC), which is an oversight
body set up by the GORTT to monitor and enforce Quality of Service Standards
(QSS) for the nation’s major utilities, had reached a major milestone at the end of
2009. Its revised QSS for T&TEC had become law. These new laws meant that
T&TEC had to automatically disburse increased compensatory payments for
breaches in more demanding Guaranteed Electricity Standards (GES), which are a
subset of the QSS (Ministry of Legal Affairs, 2009). Compliance to these new
laws was challenging, but meant that T&TEC had to treat customer service
equally as important as financial performance in order to survive.
2008-20012 strategic plan therefore faced turbulent environmental conditions. A
successful implementation of this plan demanded competent leadership, a clear
and effective implementation strategy and a workforce committed towards
achieving the vision.
1.2 SUMMARY
Trinidad and Tobago’s sole electricity transmission and distribution utility,
T&TEC, faces an uncertain future amidst a chaotically changing external
environment. Organizational transformation was deemed necessary in 2004 and
continues into the 2008-2012 strategic planning term. Political and internal
leadership upheavals during the current strategic planning term have placed the
transformation effort at even greater odds with success. The four ‘managerial

16
objectives’ of the Commission have been deemed to be capable indicating the
success of the organizational transformation initiative.
Deeper analysis of T&TEC’s internal and external environments and its history
allude to a possible divestment of the organization if its performance does not
reflect a successful transformation. The organization is closely monitored by
stakeholders such as the media, OWTU, RIC and the EMA. The GORTT also
provides oversight and control of the organization through the Minister of Public
Utilities. The organization enjoys a surplus of generation capacity and over 97%
household electrification coverage which attest to its high technical competency.
The managerial competencies within the organization, which can have a
significant impact on stakeholder satisfaction, have come under question in this
research. These issues will be elaborated upon in chapter 2.

17
2 CHAPTER 2
2.0 PROBLEM DEFINITION
During the implementation of the 2008-2012 strategic plan, the efficacy of
projects was an issue. Even though some projects were well financed, they either
remain incomplete or failed to satisfy their stakeholders. Another issue was that
problems were cited and acknowledged in the strategic plan, but no initiatives or
projects were put in place to fix them. In addition, a low level of project
management competency seemed to persist throughout the analytical period.
There was a strong political influence on the day to day operation T&TEC via the
Board of Commissioners. General Managers were not given full autonomy.
Politics therefore trickled down into the operational activities of T&TEC. General
Managers who opposed or questioned political directions were fired.
The General Managers of T&TEC seemed to be exclusively skilled and qualified
in electrical engineering, despite the fact that 4 out of the 6 strategic objectives of
the Commission were management oriented. This is evidenced by the fact that the
position requires a B.Sc. in Electrical Engineering, but no formal management
qualifications. Strategic leadership, a key competency required for effective
organizational leadership was not institutionalized within T&TEC.

18
2.1 HYPOTHESES:
1. T&TEC has failed to achieve the management objectives outlined in its
2008-2012 Strategic Plan.
2. The reasons for this failure are a lack of strategic leadership and low levels
of project, programme and portfolio management maturity within the
organization.
2.2 AIMS AND OBJECTIVES
As stated in the literature, environmental scanning is required to gain a holistic
understanding of an organization’s context before developing strategy. As such, it
is an aim of this research to explore the major external and intra-organizational
forces that acted upon T&TEC prior to and during its transformation attempt.
The literature mentions the importance of strategic leadership to transformation
initiatives. This research therefore also seeks to obtain the opinions of the
employees with regards to quality of leadership they have had, and the effects of
the leadership on their behavior during the transformation initiative.
T&TEC’s project management competency was admittedly low in 2008. From the
literature, the writer deduced and conjectured that it was the absence of this
critical competency that hindered the proper execution of the transformation
initiative. As such, it is an objective of this research to measure the portfolio,
programme and project management competencies of T&TEC. A relationship
between these competencies and the success of the transformation initiative
should depict a level of causality and will be the basis of solution formulation.

19
Ultimately, this research aims to measure the success of T&TEC’s transformation
initiative. Understanding why these initiatives fail is the core purpose of this
research. An important objective is therefore to analyze the performance of
T&TEC during its transformation attempt. Such measures may allow the
researcher to establish relationships between changing environmental forces,
leadership, project management competencies and performance.
Finally, this research is aimed toward proposing solutions to the problems that are
perceived to have inhibited the transformation effort. It is hoped that these
recommendations can be extrapolated to other organizations within Trinidad and
Tobago’s public sector which grapple with difficulties in executing
transformation initiatives.

20
2.3 METHODOLOGY
2.3.1 Overview
Organizational research findings are the solutions to many managerial problems
in today’s increasingly turbulent global environment (Rynes & McNatt, 2001).
This has motivated the writer to focus on problems faced during monumental
transformation efforts that are being undertaken within many organizations in
their fight for survival. Empirical evidence shows that research based
management practices result in higher organizational performance (Becker &
Gerhart, 1996). However, organizations are hesitant to turn to academic research
findings when designing management practices due to an overemphasis on theory
and complicated methodologies within the research literature (Worrall, Lubbe, &
Klopper, 2007). It was therefore the aim of the writer to bridge the gap between
research findings and management practice by utilizing an effective research
methodology.
There is no universally correct research paradigm. Research methods should be
contingent upon the topic being studied and the purpose and objectives of the
undertaking (Walter, 2010), (Kayrooz & Trevitt, 2005). In an effort to be
comprehensive, many researchers advocate multiplism in research methods and
perspectives (Greene, 2007), (Winship & Morgan, 1999). A convergence of the
findings of multiple research methods increases the validity of a study
(Pinsonneault & Kraemer, 1993). Such mixing of research methods widens the
acceptance of the research findings and produces a greater likelihood that results

21
and recommendations will be respected and implemented (Sachdeva, Williams, &
Quigley, 2007). It is therefore important to understand the strengths and
weaknesses of available research methods so that one may ascertain the suitability
of methods for one’s research.
2.3.2 Population, sampling and instrumentation
Utilizing the concept of multiplism, this research sought to obtain the perceptions
of two populations: employees and customers of T&TEC. This was because the
management objectives outlined in the 2008-2012 strategic plan focused heavily
on the perspectives of these two stakeholders. These perspectives were gathered
primarily by using questionnaires. Analysis was also done based on observations
and pertinent documentation available such as strategic plans, performance
reports and financial statements of T&TEC, and monthly reports of the RIC.
These documents proved to be a valuable source of objective secondary data.
Lastly, the research depended upon a P3M3 assessment completed by the writer.
At the last official enumeration at the end of September 2011, T&TEC had
approximately 2,687 employees, 166 of which were management and executive;
and 422,913 customers. The following table represents the customer and
employee distribution among the areas distribution areas of T&TEC:

22
Area No. of non-managerial
Employees
No. of Customers
North 544 89,128
East 688 112,691
South 781 127,909
Central 424 69,496
Tobago 145 23689
Total 2581 422,913
Table 2-1 Distribution of customers and employees of T&TEC Note: the distribution of employees was estimated based on the actual customer
distribution.
Customers were chosen by running a “LIST OF ACCOUNTS WITH SERVICE
ORDER ACTIVITY” query on T&TEC’s ‘Ventyx’ customer database. The
search included all distribution areas, but was limited to customers who placed
service orders at T&TEC from January to June 2012. The search produced a list
of 37,598 customers. Customers were then randomly selected from the list
generated. The selected customers were then called on the contact numbers on
record and invited to participate in the short phone survey. The customer
satisfaction survey targeted customers who had interacted with T&TEC
employees in 2012 and were able to recall and evaluate their experience (see
APPENDIX C: CUSTOMER SURVEY).
A total of 57 customers were contacted via phone and 41 responded to the survey.
The phone survey proved to be a slow method of collecting the required data. As
23
such, it was supplemented with an online customer satisfaction survey. The
questions of the phone survey were published on Google Forms, which is a
groupware tool designed to obtain real-time survey feedback via the internet. This
Google Forms survey was emailed to 97 people and published on popular local
websites such as TTOnline.com and Trinituner.com. The form was viewed 196
times on TTOnline.com and 655 times on Trinituner.com. A total of 1005
customers had therefore been exposed to the survey but only 186 of them
responded. The response rate for this survey was therefore 18.5%.
A snowball sample was gathered from employees by asking participants to
forward a job satisfaction questionnaire to coworkers they believed would
participate in the study. Field employees were given a printed questionnaire while
office employees were sent the questionnaire via email. These questionnaires
were designed to evaluate strategic objectives 5 and 6, and strategic leadership
(see APPENDIX D: JOB SATISFACTION QUESTIONNAIRE). To discourage
respondent bias, the questions were not labeled under themes or topics, they were
simply listed. Due to a slow formal data gathering process within T&TEC, the
employee feedback form was also published via Google Forms and was emailed
to known employees of T&TEC.
The writer was employed by T&TEC at the beginning of the current strategic
planning period as an entry level clerk. As such, various observations within the
organization and in its external environment were possible and were included in
this research. These observations were used to add a qualitative context to the

24
quantitative data collected, thereby aiding in the interpretation and analysis of
data.
2.3.3 Analysis plan
Due to its higher appeal and level of acceptance (Sachdeva, Williams, & Quigley,
2007), the positivistic method was incorporated. The writer developed
hypotheses to explain phenomena observed within the organization during his
tenure, and then tested them within the environmental context of T&TEC.
The structure of the strategic plan of T&TEC was conducive to this type of
research as it clearly specified broad strategic objectives for the planning term and
listed projects intended to bring about the achievement of these objectives. The
list of projects associated with the organization’s strategic objectives (see
APPENDIX E: LIST OF PROJECTS AND ACTIVITIES) provided a basis for
developing a questionnaire to be administered to these stakeholders. The
questions simply sought to ascertain if the projects’ objectives were perceived to
be successfully achieved. This approach was inspired by the Balanced Scorecard
approach to performance measurement.
The success of the transformation initiative therefore depended on the acumen of
strategic planners in choosing value adding projects and the successful
implementation of these projects. However, also stated in the strategic plan was
the fact that the Project Management competency within T&TEC was the lowest
and most underdeveloped of all its competencies, scoring a meager 4 / 10 in the
pre planning competency assessment. The aim of this research was therefore to

25
demonstrate that this low project management competency was directly
responsible for the apparent failure of the transformation initiative. To establish
this causal relationship and test this hypothesis, the quantitative research method
was employed. The transformation of T&TEC is still in progress, having been
started since the 2004 Strategic Plan in response to the GORTT Vision 2020
initiative. The writer was unable to control the factors that influenced the success
or failure of this transformation. The only way to test this hypothesis was
therefore to demonstrate that if the Project Management competency within
T&TEC continues to be low, the transformation effort could not succeed. The
writer accepted the pre planning competency assessment performed by T&TEC
and reassessed these competencies using contemporary tools and techniques. This
added a longitudinal dimension to the study. In essence, the research design
utilized a causal model to explain the relationship between the variables of the
P3M3 and organizational transformation success (Hellevik, 1984).
From the literature it was learnt that project portfolio management and
programme management are also crucial to organizational transformation and
strategic plan implementations. The projects chosen to implement the
organizational strategy reflect the organization’s portfolio management
competency. The organization’s ability to realize synergy from projects with
similar objectives reflects its programme management competency. It was
therefore necessary to utilize the P3M3 to fully assess the competencies of
T&TEC that were hypothesized to have had a direct relationship with the ability
of the transformation to succeed. The P3M3 was more appealing than other

26
maturity models because it is freely available to the public and there are no
royalties associated with its use. Also, the P3M3 consists of independent
assessments of portfolio, programme and project management maturity. The
independence of these assessments allowed the writer more precision in
pinpointing and establishing causal relationships between the variables in this
study.
From the literature, it was also learnt that the presence of strategic leadership is a
critical success factor in organizational transformation initiatives. Using the
criterion and identifiers of this type of leadership from the literature, questions
were included in the questionnaires administered to employees to evaluate the
General Managers that have led T&TEC from 2008 to 2012. Employees who had
at least 4 years of service were selected for the questionnaire because of this.
Financial ratio analysis was the method utilized to measure the financial
performance of T&TEC. The writer referred to the quarterly financial accounting
statements of T&TEC from June 2008 to September 2011 in performing the
financial ratio analysis. This objective secondary data is presented graphically in
Chapter 4 and as tables in APPENDIX F: TABLES FOR GRAPHS .
A constructivist approach was necessary due to the complexity of organizational
transformation initiatives. A wide variety of empirical data was utilized to gain a
comprehensive understanding of the limitations faced in the transformation
initiative. Customer satisfaction, employee motivation and teamwork, safety and
environment performance, and financial viability were assessed objectively to
serve as a basis for deductive reasoning (Kayrooz & Trevitt, 2005). Primary data

27
was largely cross sectional in nature, but was supplemented with available
historical secondary data to add a longitudinal dimension that aided in causal
analysis.
In summary, the methodology involved an analysis of the following variables:
1. Balanced scorecard performance
2. Strategic leadership
3. Portfolio Management Maturity
4. Programme Management Maturity
5. Project Management Maturity
The Balanced Scorecard approach to performance management involves
measuring the achievement of objectives set by an organization. For this reason,
this assessment was deemed to be capable of determining the success of the
organizational transformation initiative. It was thus the dependent variable in this
research. The primary data collected was cross sectional in nature. As such,
inferences pertaining to causality were possible but were based on counterfactual
interpretations inspired by theories of best practice in the literature (Winship &
Morgan, 1999). Such inferences were supported historical data to increase their
validity.
2.3.4 Assumptions
It was assumed that the institutionalization and maturity of Portfolio, Programme
and Project Management can survive political upheavals.

28
It was also assumed that since this study evaluated the management of T&TEC,
the opinions of operational and supervisory level employees were sufficient for
determining employee satisfaction and HSE performance.
2.3.5 Limitations
Ethical issues- the researcher was a silent observer during the study. As such,
ethical issues may arise out of the decision to publish aspects of the behavior and
culture of T&TEC employees without their permission or knowledge. To
overcome this issue, the identities of employees were kept anonymous throughout
this study.
Geographical constraints- The writer is an employee of the Central
Distribution area of T&TEC. As such, it was not possible to visit other
distribution areas to liaise with employees and observe their behaviour and culture
during working hours. To overcome this constraint, questionnaires were
communicated to and from these areas via electronic means. The writer’s direct
observations therefore pertained to employees of the Central Distribution area
only.
Time constraints- The writer had to expedite the data collection phase of the
research project due to strict time constraints imposed by the Faculty of
Engineering of the University of the West Indies, St Augustine. Also, this
research project was conducted on a part time basis. As such, time consuming
research tools such as interviews and unstructured qualitative methodologies were
avoided.

29
Access constraints- The secondary data available to the writer was constrained
to those listed in compliance to sections 7, 8 & 9 of the Freedom of Information
Act 1999(see APPENDIX G: FREEDOM OF INFORMATION ACT). Official
records were, at best, only as recent as the third quarter of 2011. More recent data
was unofficial, unpublished and estimated where possible. In addition, T&TEC’s
corporate communications policy made it difficult for the writer to approach
employees directly to obtain questionnaire feedback. The writer was required to
submit the form through official channels in the Eastern, Northern and Tobago
Distribution areas and have the questionnaire distributed to employees by
Management representatives. Feedback was slow in these areas as a result as
employees were reluctant to respond, thinking it was a T&TEC questionnaire. In
the South and Central Distribution areas however, the writer was able to approach
employees directly and obtain completed questionnaires on the spot. Time and
access constraints were chiefly responsible for the high sampling errors of 9.92%
in the job satisfaction questionnaire and 7.18% on the customer satisfaction
survey (VanAmburg Group Inc., 2008).
2.4 DELIVERABLES
1. Financial Ratio Analysis
2. P3M3 Assessment
3. Strategic Leadership assessment
4. Customer satisfaction assessment
5. HSE Assessment
6. Employee satisfaction assessment

30
2.5 SUMMARY
Cross sectional and longitudinal measurements of performance and strategic
leadership were gathered from primary and secondary sources. They were then
interpreted within the context of key competency maturity levels within T&TEC
to test the two hypotheses of this research project. A comprehensive
environmental analysis added further context to the understanding of data
collected. The writer encountered and overcame various constraints during this
research effort and is confident about the soundness of the methodology chosen.
In the following chapter, a review of the literature on strategic planning and
organizational transformation is presented.

31
3 CHAPTER 3
3.0 LITERATURE REVIEW
3.0.1 Strategic Planning
Strategic planning is aimed at providing a purpose and direction for an
organization. It is the undertaking of leaders who are required to chart a course for
an organization and steer it towards the destination envisaged. Strategy is
therefore the answer to the question: “how should the organization get to its
desired destination?” (Strickland III, Gamble, & Thompson, Jr., 2007), (Henry A.
, 2008). It represents a departure from the traditional notion that leaders were
administrators of passive organizations, subject to the actions of the ‘invisible
hand’ of the free market economy. It is a manager’s way of taking control of and
responsibility for the future of the organization (Ghemawat, Collis, Pisano, &
Rivkin, 1999), (Johnston, Jr. & Bate, 2003).
The strategy of an organization guides its actions at all levels. The dissemination
and marketing of a good strategy to all of the organization’s strategic business
units, departments and employees is thus the key to ensuring organizational
success (Strickland III, Gamble, & Thompson, Jr., 2007). Strategic planning is
like project management in that a definition of the successful outcome of the
undertaking is necessary from the onset. As one author puts it, leaders must ‘start
with the end in mind’ (Hobbs, 2008). This destination point or ultimate goal of

32
strategic planning is contained in an organization’s strategic vision statement. An
organization’s strategy is therefore a means toward an end: realizing the vision.
An organization’s journey towards its vision is not a perpetual endeavor as
organizations do expect to realize this vision someday. This brings into
consideration the mutability of the strategic vision. Most authors agree that the
vision statement can change in response to major developments in an
organization’s internal and external environments or upon its successful
fulfillment (Beach, 2006). One author however, wrote that the vision statement is
associated with the founder of the organization and does not change over time
(Henry A. , 2008). What is common among these views is that the organization’s
vision is a description of a future state that the organization aspires to become in
the long term. A 1992 journal article showed that there was little research being
done into management science tools that aid in planning the direction of
organizations (Ckarke, 1992). Interestingly the journal did not mention the
importance of the strategic vision.
Before this vision is known, a methodology for formulating it must be chosen. All
organizations seek success, but their focus and the factors they use to define and
measure success differ. Organizational success factors may be defined with an
internal or external focus. The external focus, i.e. a focus on the organization’s
stakeholders’ perceptions of success, is most desirable. One author describes such
success factors as ‘strategic factors’. They are the organizational factors which
customers, suppliers, owners and employees see and evaluate. Identifying key
stakeholders and the factors they use to define organizational success are thus

33
among the first steps in proper strategic planning (Kenny, 2005). The practice of
focusing solely on improving existing internal processes and procedures results in
a poor strategy. An external focus that is either too broad or too narrow can lead
to an equally poor organizational strategy. Organizations should not focus on
employees at the expense of owners (shareholders), or customers at the expense
of employees etc. A balanced and responsible approach to strategic planning
ensures that an organization’s key stakeholders all remain content with the
organization’s progress (Maak & Pless, 2006).
Once the right focus is achieved, the organization must set performance objectives
with respect to its key stakeholders. These ‘strategic objectives’ are all formulated
with the purpose of transporting the organization towards its vision. To ensure a
successful implementation, strategic objectives should be: S.M.A.R.T. (Sanghera,
2009) -adapted from (Doran, 1981):
Specific,
Measurable,
Attainable,
Relevant,
Timely
The above acronym has been cleverly expanded to S.M.A.R.T.E.R, by adding
Evaluated and Revised to the list of previously mentioned qualities (McCarthy,
2008). These additions emphasize the fact that objectives are not static and must
adapt if necessary to changes in the environments they were originally set in.

34
External (political, economic, social, technological, legal, environmental)
scanning and SWOT (strengths, weaknesses, opportunities, and threats) analysis
are common undertakings of strategic leaders. These efforts are necessary for the
organization to objectively appraise its resources and capabilities and apply them
in an evolving environmental context (Hickman, 2010). As this environmental
evolution continues at a rapid pace, it is an organization’s ability to anticipate and
respond to change that is the formula for success (Pantaleo & Pal, 2008). For this
reason some authors add a monitoring and controlling phase to the strategy
formulation and execution process. In this process, a vision is set, objectives that
would transport the organization toward its vision are formulated and a strategy to
achieve these objectives is crafted and implemented. The monitoring and
controlling phase simply makes adjustments and adaptations to the
aforementioned phases based on developments in a firm’s internal and external
environments (Strickland III, Gamble, & Thompson, Jr., 2007). Such an approach
leads to a strategy that exploits an organization’s key strengths and resources and
develops them to better cope with emergent issues and changes in a firm’s
environments (Grant, Contemporary Strategy Analysis, 2008), (Steiss, 2003).
This view supports a study published in 2003 in the Strategic Management
Journal. The study found that environmental unpredictability is significantly
related with strategic decision speeds, which is in turn related with improved
organizational growth (Baum & Wally, 2003). Organizations should therefore
select leaders who possess the requisite amounts of entrepreneurship and
dynamism to manage within the particular environments they face. This

35
‘corporate entrepreneurship’ can lead to radical innovation that delivers a high
payoff to the firm, but due to its riskiness, it should be accompanied by polices
that afford participants a safety net (Burgelman, 1983).
In contrast, a corporate culture characterized by high amounts of coercive politics
decreases rational decision making, lowers employee morale, diverts resources
away from organizational goals, impedes strategy formulation and
implementation, and ultimately has negative effects on organizational
performance (Voyer, 1994). The support of the board should therefore be secured
by the C.E.O. before embarking on major change initiatives. It was found in a
study that strategic change initiatives that lacked board support were negatively
correlated with performance changes (Golden & Zajac, 2001). Transformation
therefore requires that an organization re-evaluates and optimizes its investment
in and application of control mechanisms (Sia & Neo, 1997).
Another study showed that radical changes in an organization’s external
environment inhibit intra-organizational transformation initiatives. Such
upheavals exceed the organization’s adaptive capacity and its ability to learn,
thereby reducing its relevancy (Newman, 2000). There is also a negative
relationship between the degree of environmental unpredictability and
organizational profitability, indicating that it is indeed difficult to manage in such
environments (Baum & Wally, 2003).
Michael Porter, a most prominent author in the field of strategic planning
(Ramos-Rodríguez & Ruíz-Navaro, 2004), developed a 5 forces model of industry
analysis that evaluates the long term profitability of industries and the viability of

36
organizations within them. These 5 competitive forces are: bargaining power of
buyers, threat of new entrants, threat of substitute products/ services, bargaining
power of suppliers and the degree of rivalry among existing competitors.
According to Porter, an organization’s strategy should focus on choosing
profitable industries, defending against these forces and leveraging them in the
favour of the organization (Porter, Competitive Strategy, 1980), (Porter, How
Competitive Forces Shape Strategy, 1997), (Henry A. E., 2011).
Another pioneering theorist, Igor Ansoff, demonstrated that in seeking growth and
development, organizations have four basic alternatives: market penetration,
market development, product development and diversification. This model was
summarized as the ‘Ansoff matrix,’ and provided a theoretical guideline to
organizations on the common quest of growth (Ansoff, 1957).
Figure 3-1: Ansoff Matrix

37
Modern industry analysis has shown that within industries, firms tend to follow
similar strategies in the quest for success. These ‘strategic groups’ consist of core
firms, which follow the group strategy closely; and secondary firms which follow
it less closely. Secondary firms outperform core firms in such groups, possibly
due to their increased responsiveness to environmental changes, rather than just
responding to group behavior alone. Interestingly, secondary firms outperform
solitary firms (which do not belong to a group) as well, possibly due to the lack of
legitimacy and the unconventional strategies associated with solitary firms
(McNamara, Deephouse, & Luce, 2003). Firms should thus try to maintain a fit
between their strategy and the environmental and organizational exigencies they
face. Insufficient or excessive strategic change can both have negative effects on
firm performance (Zajac, Kraatz, & Bresser, 2000), (Huizing, Koster, & Bouman,
1997).
Performance measurement has a major role to play in effective strategic
leadership. Many organizations fail to achieve their strategic objectives simply
because they do not have performance metrics established to measure the
organization’s progress towards achieving these objectives. The metrics present in
myopic organizations address short term financial targets and thus provide
motivation for employees to focus only on these targets at the expense of creating
long term value for the firm. What gets measured gets done. Performance
measurement systems should therefore be tailored to the unique strategic
objectives of an organization (Niven, 2002).

38
The Balanced Scorecard approach to performance measurement and strategy
implementation arose out of a research study conducted by two Boston scholars,
Robert Kaplan and David Norton. The study addressed the hypothesis that
financial measures provided a limited and ineffective representation of
organizational performance and that a multi-faceted approach to performance
measurement was needed. The study concluded that performance metrics should
focus on four general areas- customer issues, internal business processes,
employee activities and shareholder concerns. The resulting system of
performance metrics became widely published and adopted as a compliment to
conventional financial measures and as a driver of future success within
organizations (Kaplan & Norton, 2001). It also allowed the organization to
communicate its vision and strategy to all of its employees and provide a strategic
focus for their activities and actions. One author proposed the use of analytics
(weighted average custom metrics) to overcome the shortcomings he identified in
the Balanced Scorecard approach. The use of analytics allows organizations to
tailor their performance measurement systems to serve their unique needs and
gain a more accurate measurement of organizational health and progress (Brown
M. G., 2007). A common feature of effective performance measurement systems
is that they are based on and supported by objectives and performance targets.
Organizational strategy is typically formulated at three hierarchical levels. Long
term planning is done at the strategic level, mid-term at the tactical level and short
term decisions are made at the operational level (Mahdi Bashiri, 2012). Mintzberg
identifies the three levels of strategy as corporate, business and functional in

39
companies that comprise of several strategic business units (Mintzberg, 1994).
Researchers identify the need for the use of multiple conceptual tools in strategic
decision support systems as no single tool captures the complexity of strategic
thinking (Coleman, Belardo, & Duchessi, 1994), (O'Shannassy, 2003). It is noted
however that it is the complexity and instability of business environments that
prompt increased investments of time and resources into strategic planning. A
positive relationship has been observed between the time and effort spent
planning strategy and the empirical performance of organizations in unstable
environments. In addition, it was found that this increased planning spurs the
development and learning of new means and strategies, thereby expanding the
collection of formal planning tools (Brews & Hunt, 1999).
One journal article opined that the utilization and growth of strategic thinking is
limited by the lack of frequency with which firms must make strategic decisions.
The strategic learning curve is therefore protracted by the long term nature of
corporate strategy. Organizational myopia and difficulties in sourcing accurate
industry data on which to base strategy are other limitations to strategic planning
(Urbany, 1998). Based on their unique historical path and experiences,
organizations learn and develop unique competencies that ensure their survival in
competitive environments. Some researchers found that these distinctive
competencies are difficult for competitors to imitate and positively affect
organizational performance (Barnett, Greve, & Park, 1994), (Huber, 1991).
Others have found that organizational learning is not inherently or exclusively
positive and must be managed within its unique context (Crossan & Berdrow,

40
2003). Another researcher found that strategic learning occurs at multiple levels
within an organization. By seeking out patterns and trends at the business level of
the organization, corporate level managers can distill business level knowledge
into corporate level knowledge (Kuwada, 1998). It should therefore be possible
for organizations to supplement their strategic learning at the corporate level by
observing the more eventful business and operational levels. Such learning is
enhanced by the maintenance of an organizational knowledge base to support
managers (Thomas, Sussman, & Henderson, 2001).
In large multi-national corporations, strategic planning has become decentralized
and informal in response to growing unpredictability and dynamism within their
environments. Such moves afford large organizations increased responsiveness
and capacity to strategize on the scale they operate on (Grant, Strategic Planning
in a Turbulent Environment: Evidence from the Oil Majors, 2003). The
involvement of middle management in the championing, facilitating and
synthesizing of strategy has thus become a reality (Floyd & Wooldridge, 1992).
The practitioners of strategic planning are pioneering new methodologies
according to their empirical observations and experiences. Continued research
into these innovations is necessary in order to close the gap between academic
model building and current strategic decision making practices (Boulding, 1994).
Thus far, the consensus has been that strategy is intangible. It is the guide,
methodology and plan of action upon which an organization acts and bases its
decisions. Strategic leadership- which involves setting a vision for the future,
communicating it to subordinates and motivating actions which add long term

41
value to the organization- is the way strategy is successfully championed (Rowe,
2001), (Elenkov, Judge, & Wright, 2005), (Beach, 2006). But how is this strategy
translated into tangible initiatives and change measures that propel an
organization forward? How does an organization actually achieve its objectives?
And what process is involved in managing the journey?

42
3.0.2 Organizational Transformation
Organizational transformation is an episodic, discontinuous, intermittent
transition between states that differ substantially in crucial features such as
strategy and structure (Fariborz, 2006), (Edwards, 2010), (Oliff, 2012). It is a
purposeful and intentional change in the business model of an organization that is
aimed at increasing the organization’s relevancy and responsiveness to its
changing environment (Kotnour, 2010). Organizational transformation is thus at
the heart of strategic planning. The transition of an organization from its current
state to the future state described in its strategic vision often involves
organizational transformation. Environmental change makes intra-organizational
change inevitable. In some cases this intra-organizational change may be
incremental or impulsive in response to environmental developments. However,
there comes a time when environmental changes outpace the organizational
adjustments so much so that the organization requires a transformation to remain
relevant. Such an organization must transform or face demise (Jenkins &
Ambrosini, 2002), (Demers, 2007).
Empirically, projects and programmes are the vehicles that transport organizations
along paths of planned change and transformation (Kerzner, 2001). A project is a
temporary initiative that a company puts in place alongside its regular operations
in order to achieve a specific objective (Morgan, Levitt, & Malek, 2007) such as
the creation of a product, service or result (Project Management Institute, 2008).
Project Management is the application of knowledge, skills, tools and techniques

43
to project activities to meet the project requirements (Project Management
Institute, 2008), (Sanghera, 2009). Project management is becoming a legitimate
management model as change and transformation must occur more frequently in
modern dynamic environments (Madter, Bower, & Aritua, 2012). It has led to the
institutionalization of the matrix organizational design which overcomes the
limitations of traditional organizational charts by allowing human resources to be
assembled from multiple functional areas and levels within an organization
(Knutson, 2001). Such teams are formulated based on their skill and expertise in
the initiative being undertaken and allow an organization to harness the true
power of its human resource.
The strategic vision serves as a tool that filters and aligns projects undertaken by
the organization. Programme management involves managing and coordinating
multiple project teams towards like objectives (Tabrizi, 2007). Many programmes
also contain aspects of ongoing operations (Morris & Pinto, 2007), (Brown J. T.,
2008). A project can either add toward achieving the strategic vision or suck
valuable resources away from this quest. Programme Managers must schedule
and prioritize projects based on their need for precedent projects, resource
limitations and their long term value adding prospects. When done properly,
Programme Management harnesses synergy that results in the creation of more
value than projects could if they were managed individually. This is largely due to
the fact that programmes comprise of projects with shared objectives that can
benefit from the sharing of resources. Successful strategy implementation requires
translating the strategy into a project and programme portfolio. Choosing the right

44
projects, investing in them in the right amounts and choosing the right priorities
and schedules are the activities that collectively ensure good strategy
implementation (Morgan, Levitt, & Malek, 2007), (Morgan, Cole, Johnson, &
Johnson, 2010). Effective portfolio management involves soliciting an array of
project proposals that exceeds an organization’s capacity, and selecting those
which promise the most progress towards strategic objectives. This surplus of
proposals allows for the elimination of low-return projects and the balancing of
risks (Moore, 2010). Portfolio performance is also dependent on organizational
learning and adaptive capabilities (Biedenbach & Müller, 2012).
Strategic Plans on Top Shelves- gathering dust (SPOTS) are those which are not
acted upon and properly executed. This is cited as a reason for the failure of many
organizational transformation initiatives (Haines, 2000). The only actions and
activities that serve to execute the strategy are the projects and programmes that
would bring the organization from its current state to its desired future state.
When corporate leaders fail to perform the important job of strategic project
portfolio management, they relinquish control of the organization to lower
managerial levels (Morgan, Levitt, & Malek, 2007). Such a leader cannot harness
the true propellants of change within the organization or guide it in the right
direction. To be successful as a strategic leader, one must thus become deeply
involved in these change propellants; indeed, one must perform strategic project
portfolio management. Research has shown that institutionalized portfolio
management and success in research and development companies are strongly
related (Cooper, Edgett, & Kleinschmidt, 2001).

45
Great strategy execution is also dependent on the project and program
management competencies within the organization. The success of strategic
project portfolio management is therefore limited by the capacity and ability of
staff to ensure that these projects and programmes achieve their objectives.
Contemporary project managers rely upon nine knowledge areas to successfully
drive projects from concept to completion:
1. Project integration management to ensure that the various project
elements are effectively coordinated.
2. Project scope management to ensure that all the work required (and only
the required work) is included.
3. Project time management to provide an effective project schedule.
4. Project cost management to identify needed resources and maintain
budget control.
5. Project quality management to ensure functional requirements are met.
6. Project human resource management to development and effectively
employ project personnel.
7. Project communications management to ensure effective internal and
external communications.
8. Project risk management to analyze and mitigate potential risks.
9. Project procurement management to obtain necessary resources from
external sources.
Source: (Project Management Institute, 2008)

46
One author describes scope, time and cost as the golden triangle due to their
higher level of importance and the triangular connection between them. One
cannot change one of these dimensions of a project without changing at least one
other side (Sanghera, 2009). However, a project can be completed within these
constraints and still be a failure if it does not satisfy stakeholder needs. There
must therefore be a strategic focus in project management (Callahan & Brooks,
2004).
Five stages are involved in managing a project from concept to completion:
1. Initiation
2. Planning
3. Implementation
4. Monitoring and Controlling
5. Closing
These five stages are referred to as the Project Life Cycle. Investments into the
first two stages are most rewarding in aligning projects to strategy and ensuring
their success (Project Management Institute, 2008).
In corporate America, 10% of successfully formulated strategies carry through to
successful implementation (Morgan, Levitt, & Malek, 2007). A 1999 article
estimates that 70% of corporate strategies fail due to poor implementation
(Charran & Colvin, 1999). This is in accordance with another study which found
that approximately 71% of CEOs departed from their offices involuntarily
(Khurana, et al., 2003). The overwhelming majority of CEO failures can therefore
be attributed to their failure to effectively implement the strategic plans they were

47
mandated to execute. The problem does not seem to be management’s reluctance
or inability to conjure up changes. Rather, the problem seems to be an inability to
successfully implement such changes (Herold & Fedor, 2008). Since projects are
the drivers of change within organizations, one can deduce that the majority of
CEO failures are attributable to poor strategic project portfolio management and/
or poor project management competency within these organizations.
Ironically, the evolution of project management typically lags behind the
development of other capabilities within an organization (Crawford, 2002). When
this lack of Project Management becomes critical, organizations are faced with an
ultimatum- transform or face demise. To be successful, this infusion of project
management competency must be executed much in the same way that
organizational transformation initiatives are executed. An assessment of this
competency must be done, a vision for the desired competency level must be set,
and strategies and measures to build the project management competency to the
level envisioned must be implemented. The Project Management Maturity Model
(PM3) aims to achieve this infusion by measuring the application of the 9
knowledge areas of Project Management within organizations. Three components
of the PMBOK® receive special interest in the PM3:
1. Project Management Office- an office that exists solely to support project
teams.
2. Management Oversight- the level of interest managers devote to projects
3. Professional Development- the development of the Project Manager’s
unique set of technical, managerial and leadership skills.
48
Five levels of maturity are derived from the measurements which facilitate the
identification of critical areas in need of development and the setting of targets
and objectives for the growth of Project Management within organizations
(Crawford, 2002), (Callahan & Brooks, 2004). These levels denote the presence
of standardization and improvement in the project management culture of an
organization:
1. Common language
2. Common processes
3. Singular methodology
4. Benchmarking
5. Continuous improvement
Source: (Kerzner, 2001)
Each level denotes a higher level of maturity with respect to the areas measured
(Crawford, 2002). Project management is best when it is accomplished through a
structured repeatable process (Brown J. T., 2008). As an organization grows in
maturity, it shifts from ad hoc management of chaotic change to the best practices
of the structured discipline of project management. This shift is typically
accompanied by increases in accountability, discipline and integrity within the
organization (Brown J. T., 2008), (Teller, Unger,, Kock, & Gemünden, 2012).
Project Management requires a level of knowledge and mastery of skills that
create and define a career path for professionals to the highest levels of
organizations (Knutson, 2001). Individuals who succeed at Project Management
go on to succeed in leading business enterprises later in their careers (Termini,
49
2009). This is because strategic planning is an essential part of Project
Management. There are many similarities between the project life cycle and the
journey of an organization toward its strategic vision. Both require extensive
planning, environmental scanning and responsiveness, and precise execution of
plans using expert technical and managerial skills. Project and portfolio
management are therefore fractals or focused subsets of Strategic Management
(Killen, Jugdev, Drouin, & Petit, 2012), (Callahan & Brooks, 2004). They
represent the manifestation of the same organizational strategy, but at different
levels of magnification and detail in an organization.
This PM3 has evolved into the Portfolio, Programme and Project Management
Maturity Model (P3M3) to address the other critical competencies required by
organizations (Sowden, Hinley, & Steve Clarke, 2010). Portfolio management
maturity in particular is required to add context to the understanding of the impact
of portfolio management on portfolio performance (Jonas, 2010). The P3M3
simplified and standardized the assessment of maturity by analyzing seven
process perspectives within each management competency.
The Organizational Project Management Maturity Model (OPM3) uses a similar
methodology and is based on common premise that portfolio, programme and
project management maturity are correlated with strategy implementation
effectiveness (Project Management Institute, Inc., 2003). However, the OPM3
assessment ranks organizations along a continuum whereas the P3M3 assessment
produces an independent staged based maturity for each of its sub-units. A third
maturity model, the Capability Maturity Model Integration (CMMI®), also ranks

50
organizations along a continuum (CMMI Product Team, 2010). It bears many
similarities to the other models in that it charts a course for the development of
key competencies within organizations.
Research has shown that the formalization portfolio management and project
management complement each other in enhancing organizational performance
(Teller, Unger,, Kock, & Gemünden, 2012). The P3M3’s independent
assessments can therefore prove to be valuable in harmonizing the maturities of
these three critical competencies.

51
3.1 SUMMARY
The following diagram is the conceptualization of a meta-theory derived from the
literature about strategically planned organizational transformations.
VISION
FORMULATIONEnvironmental
Scanning (PESTLE,
SWOT,5 forces
model- Industry
Analysis)
Stakeholder analysis
Str
ate
gy
Co
rpo
rate
Va
lue
s
Mis
sio
n
SUCCESS!
VISION FULFILLED
Portfolio
Programmes
Projects
Balanced Scorecard
Performance Measurement
and Management System
and
P3M3
Strategic Objectives
Figure 3-2: Diagrammatic Meta-Theory of Strategically Planned Organizational Transformations.
Figure 3-2, which shows the strategic planning and implementation process,
summarizes the literature perused. Portfolio, programme and project management
are collectively the operationalization of a strategic plan. Their maturity provides
52
context to the understanding of an organization’s efforts to achieve its vision.
Strategic leadership is the ability to synthesize the concepts in Figure 3-2 into a
focused drive to organizational success. In the following chapter, these concepts
will be examined at T&TEC as it attempted to execute an organizational
transformation initiative from 2008- 2012.

53
4 CHAPTER 4
4.0 PRESENTATION OF DATA
Data collection focused on the selected strategic objectives of T&TEC, the levels
of strategic leadership from 2008 to 2012 and a P3M3 assessment. In the
following sections, the measurements collected will be presented, along with a
historical background on each measurement.
4.0.1 Objective 3
To achieve the highest level of customer satisfaction through excellence in
customer service
This objective was measured using a customer satisfaction survey. The
perceptions of customers regarding the targets set in this objective therefore
formed the basis of this assessment. Below are some demographic data about the
respondents to the customer satisfaction survey.
What area of T&T do you live?
North
43 23%
East
34 18%
South
35 19%
Central
44 24%
Tobago
30 16%
Figure 4-1: Chart showing geographic location of respondents
to the customer satisfaction survey
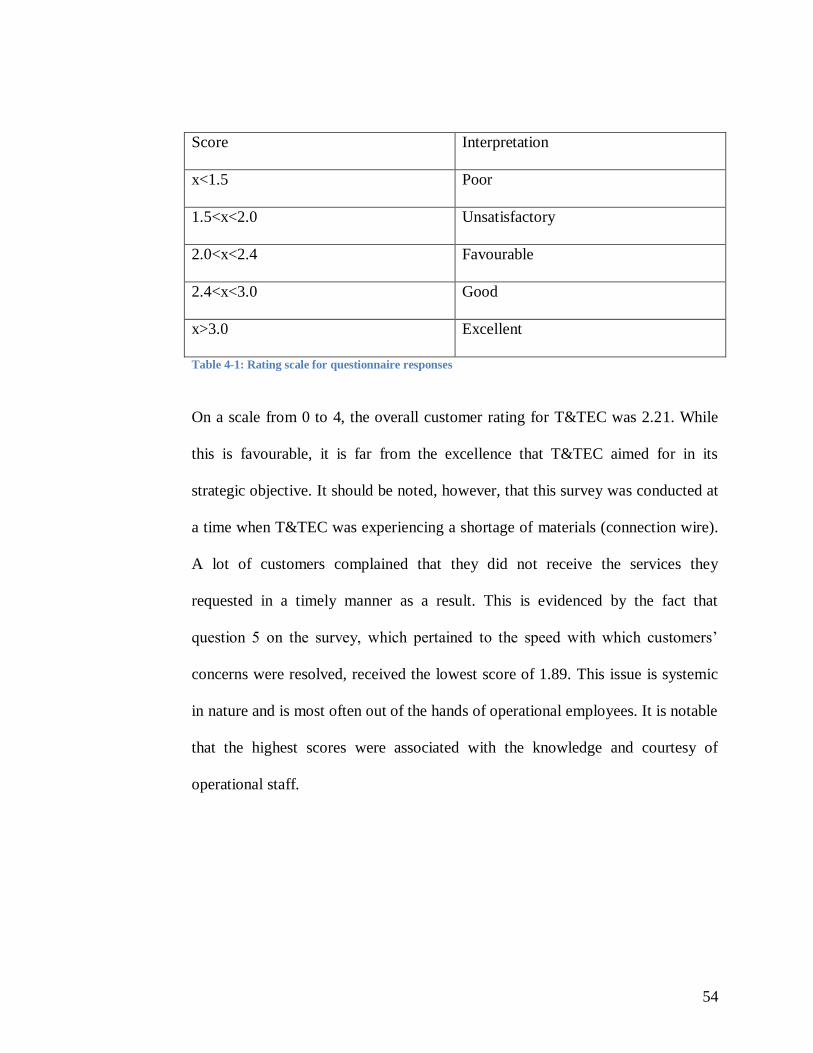
54
Score Interpretation
x<1.5 Poor
1.5<x<2.0 Unsatisfactory
2.0<x<2.4 Favourable
2.4<x<3.0 Good
x>3.0 Excellent
Table 4-1: Rating scale for questionnaire responses
On a scale from 0 to 4, the overall customer rating for T&TEC was 2.21. While
this is favourable, it is far from the excellence that T&TEC aimed for in its
strategic objective. It should be noted, however, that this survey was conducted at
a time when T&TEC was experiencing a shortage of materials (connection wire).
A lot of customers complained that they did not receive the services they
requested in a timely manner as a result. This is evidenced by the fact that
question 5 on the survey, which pertained to the speed with which customers’
concerns were resolved, received the lowest score of 1.89. This issue is systemic
in nature and is most often out of the hands of operational employees. It is notable
that the highest scores were associated with the knowledge and courtesy of
operational staff.
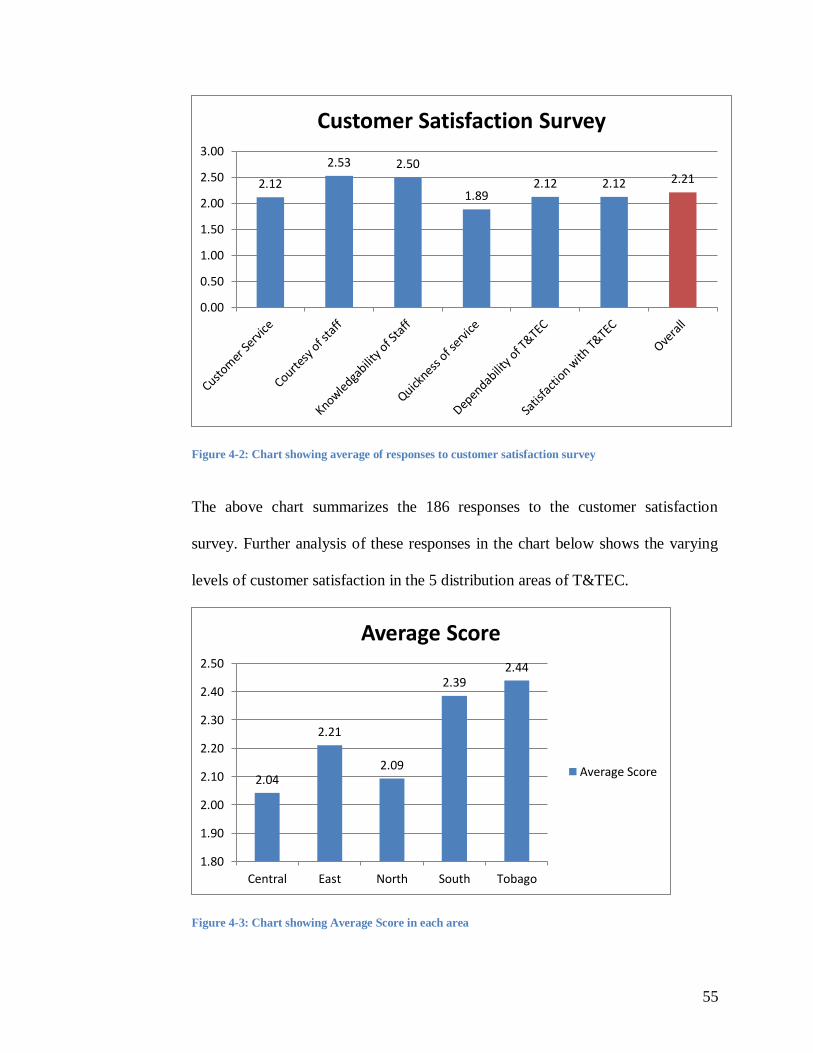
55
Figure 4-2: Chart showing average of responses to customer satisfaction survey
The above chart summarizes the 186 responses to the customer satisfaction
survey. Further analysis of these responses in the chart below shows the varying
levels of customer satisfaction in the 5 distribution areas of T&TEC.
Figure 4-3: Chart showing Average Score in each area
2.12
2.53 2.50
1.89 2.12 2.12 2.21
0.00
0.50
1.00
1.50
2.00
2.50
3.00
Customer Satisfaction Survey
2.04
2.21
2.09
2.39 2.44
1.80
1.90
2.00
2.10
2.20
2.30
2.40
2.50
Central East North South Tobago
Average Score
Average Score

56
Interestingly, the Central area, which has won the “best performing area” prize for
the past 6 years in a row, received an average score of 2.04, the lowest among the
areas. These data are cross sectional in nature and must thus be interpreted in
context. In addition to a shortage of materials, the Central Area experienced a
shortage of manpower from May 2012 onwards. A contractor that provided
connection related services to T&TEC was sent on safety training and did not
return to the job. Customers that requested connection related services since then
had to wait abnormally long as a result.
In order to gain a deeper understanding of customer satisfaction, the following
objective longitudinal secondary data were utilized.
Figure 4-4: Graph showing written complaints per 10,000 customers from the periods ending Jun 2008
to Sep 2011
(Data sourced from RIC Monthly Complaints Reports and T&TEC quarterly
accounting statements)
The RIC is an oversight body that ensures that customer service at Trinidad and
Tobago’s utilities is satisfactory. Customers that have tried and failed to satisfy
0.0000
0.5000
1.0000
1.5000
2.0000
2.5000
3.0000
3.5000
Jun
-08
Sep
-08
Dec
-08
Mar
-09
Jun
-09
Sep
-09
Dec
-09
Mar
-10
Jun
-10
Sep
-10
Dec
-10
Mar
-11
Jun
-11
Sep
-11
written complaints per 10,000 customers
written complaints per10,000 customers
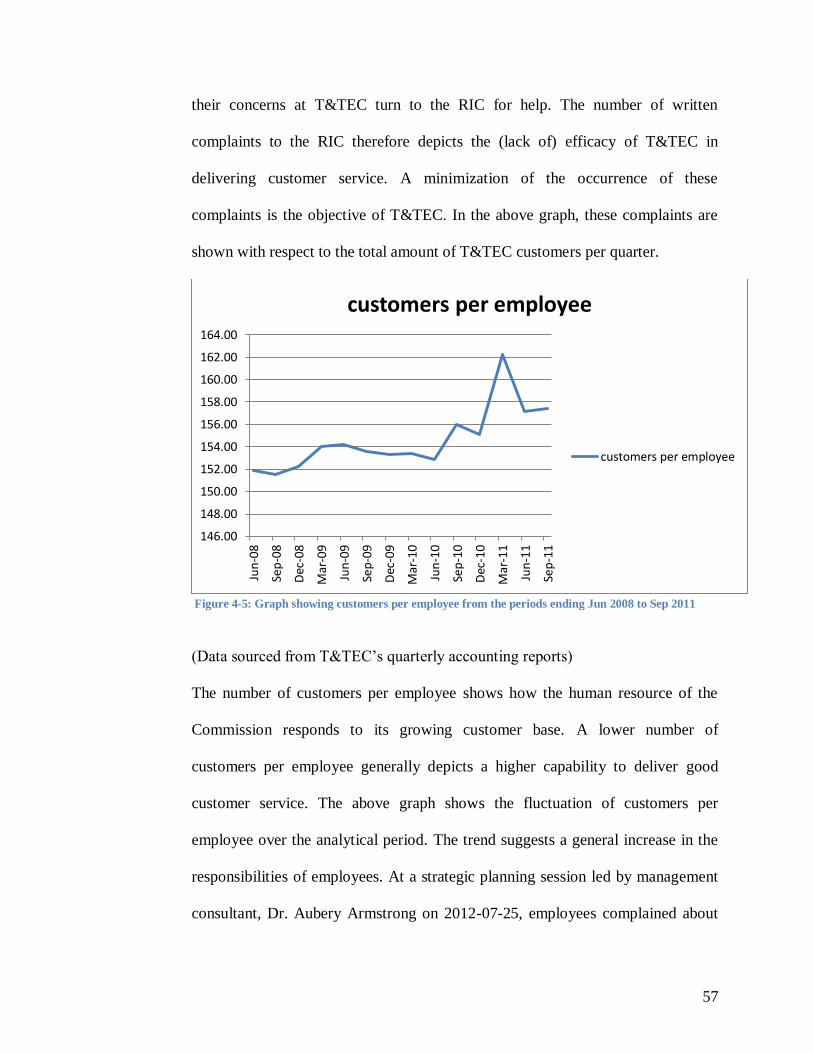
57
their concerns at T&TEC turn to the RIC for help. The number of written
complaints to the RIC therefore depicts the (lack of) efficacy of T&TEC in
delivering customer service. A minimization of the occurrence of these
complaints is the objective of T&TEC. In the above graph, these complaints are
shown with respect to the total amount of T&TEC customers per quarter.
Figure 4-5: Graph showing customers per employee from the periods ending Jun 2008 to Sep 2011
(Data sourced from T&TEC’s quarterly accounting reports)
The number of customers per employee shows how the human resource of the
Commission responds to its growing customer base. A lower number of
customers per employee generally depicts a higher capability to deliver good
customer service. The above graph shows the fluctuation of customers per
employee over the analytical period. The trend suggests a general increase in the
responsibilities of employees. At a strategic planning session led by management
consultant, Dr. Aubery Armstrong on 2012-07-25, employees complained about
146.00
148.00
150.00
152.00
154.00
156.00
158.00
160.00
162.00
164.00
Jun
-08
Sep
-08
Dec
-08
Mar
-09
Jun
-09
Sep
-09
Dec
-09
Mar
-10
Jun
-10
Sep
-10
Dec
-10
Mar
-11
Jun
-11
Sep
-11
customers per employee
customers per employee
58
the increasing workload they faced and the fact that staff was not similarly
increasing. Employees also complained about management’s widespread use of
contractors instead of hiring new full time T&TEC employees. The number of
customers per employee can therefore also reflect employee satisfaction. It must
be noted however, that as technology becomes more advanced, powerful and
ubiquitous, there may be an increased capacity of customers that can be
effectively served by each employee. T&TEC’s Advanced Metering
Infrastructure (AMI) project for example, which was implemented during the
analytical term, involved an upgrade of meters across the country to new models
that could transmit their readings to T&TEC servers wirelessly. This meant that
meters no longer needed to be physically read and the Commission’s staff of
meter readers were no longer required. Technology here enabled manpower
savings and an increase in the customer per employee capacity of the
Commission. T&TEC’s Service Link project is another example of technology
replacing manpower. This project involved outfitting field employees with mobile
computers that could be used to input job data in the field when completing
service orders. This meant that service order processing clerks were not required
in such large numbers as before. The relationship between this variable and
conjectured causal variables must thus be considered in this context. An increase
in customers per employee may not necessarily be a negative change. The
optimization of human resources was listed in the 2008-2012 strategic plan as an
initiative aimed at increasing financial viability. For this reason, an increase in

59
customers per employee will be viewed as favourable change in this analysis
effort.

60
4.0.2 Objective 4
To ensure that T&TEC attains financial viability through the application of
economic tariffs, cost consciousness, and the promotion of a culture of revenue
enhancement and protection
It was necessary to perform financial ratio analysis to measure T&TEC’s financial
performance over the analytical period. Using the pertinent data from T&TEC’s
quarterly financial statements (see APPENDIX F: TABLES FOR GRAPHS),
graphs showing the financial ratios for the analytical period were created. This
permitted historical analysis and was conducive to the comparison and correlation
of the variables of this study. The quarterly financial statements for the period
ending 2008-03-31was not found at T&TEC’s library in Mt. Hope. In addition to
this, the quarterly financial statement for the period ending 2011-12-31 was
unaudited and therefore unavailable for perusal at the time of this study. As such
the analysis was done from the period ending 2008-06-30 to 2012-09-30.

61
4.0.2.1 Liquidity
The current ratio shows the relationship between an organization’s current assets
and current liabilities.
A current ratio that is greater than 1 indicates that an organization has sufficient
current assets to pay its short term liabilities. From Figure 4-6 below, it can be
seen that T&TEC’s current ratio remained below 1 for the entire analytical period.
Also, there appears to be a trend of rapidly decreasing liquidity from June 2008 to
September 2009, after which the liquidity stabilizes. Overall, the current ratios for
the analytical period show that T&TEC has endured ominously low levels of
liquidity.
The quick ratio, also known as the acid test ratio, is a more stringent measure of
liquidity.
Inventory, which is less liquid than other current assets, is subtracted from the
total current assets to show the relationship between an organization’s most liquid
assets and its current liabilities. Since inventory levels have remained relatively,
constant, a similar trend in the quick ratio is seen. It is considered healthy for an
organization to maintain a quick ratio that is above 1 as well. Both liquidity ratios
therefore tell a story of poor financial management.

62
Figure 4-6: Graph showing current and quick ratios.
4.0.2.2
This low level of liquidity manifested itself in the fact that T&TEC delayed
granting due salary increases to employees for as much as 40 months during the
analytical period. This created a tense industrial relations environment and
negatively affected employee morale. Contractors also experienced long delays in
receiving payment for their services, leaving some of them no choice but to cease
offering their services to T&TEC. Liquidity is therefore essential to the operation
of any business entity. The absence of liquidity at T&TEC has been a hindrance
to the achievement of key strategic objectives.
4.0.2.3 Asset Management
The Asset Turnover ratios show the efficiency with which an organization uses its
assets to generate sales. The fixed assets turnover shows the sales generating
power of an organization’s long term assets, while the total assets turnover
0
0.1
0.2
0.3
0.4
0.5
0.6
0.7
0.8
0.9
Current Ratio
Quick Ratio

63
includes current assets in the computation. These ratios vary according to industry
and ideally they should be compared to industry averages. T&TEC is a monopoly
in the local electricity distribution industry. However, in the absence of industry
averages, trend analysis can be done using historical financial data. Both turnover
ratios depict a general trend of decline in the productivity of T&TEC’s assets over
the analytical period with seasonal peaks in turnover in the third quarter.
Figure 4-7: Graph showing Fixed and Total Asset Turnover
The ratios in Figure 4-7 were derived from quarterly financial statements of
T&TEC. It was therefore necessary to annualize them to conform to accounting
standards. The annualized formulae used are as follows:
1.
2.
-
0.20
0.40
0.60
0.80
1.00
1.20
1.40
1.60
1.80
2.00
Jun
-08
Sep
-08
Dec
-08
Mar
-09
Jun
-09
Sep
-09
Dec
-09
Mar
-10
Jun
-10
Sep
-10
Dec
-10
Mar
-11
Jun
-11
Sep
-11
Fixed Asset Turnover
Total Asset Turnover
64
4.0.2.4 Profitability
Profitability is a critical measure of financial performance. T&TEC is a state
owned organization which does not seek to maximize profits, but rather to cover
its costs. Profitability still serves as an indicator of the financial viability of
T&TEC and is therefore important to this research effort.
Here, two common profitability ratios are used: the net profit margin and the
return on assets (ROA). The net profit margin depicts net profit as a percentage of
sales. The objective of T&TEC is to maintain a positive net profit margin. The net
profit margin is however seen to decline into a deficit in the 4th quarter of 2010
before quickly recovering the next quarter. The Return on Assets (ROA), which
depicts net profit as a percentage of total assets, follows an almost identical trend.
Capital budgeting is used to ensure that an organization invests in assets that are
justified by their return. This competency within T&TEC appears to have suffered
during the analytical term, evidenced by a declining trend in the ROA up till
2011.
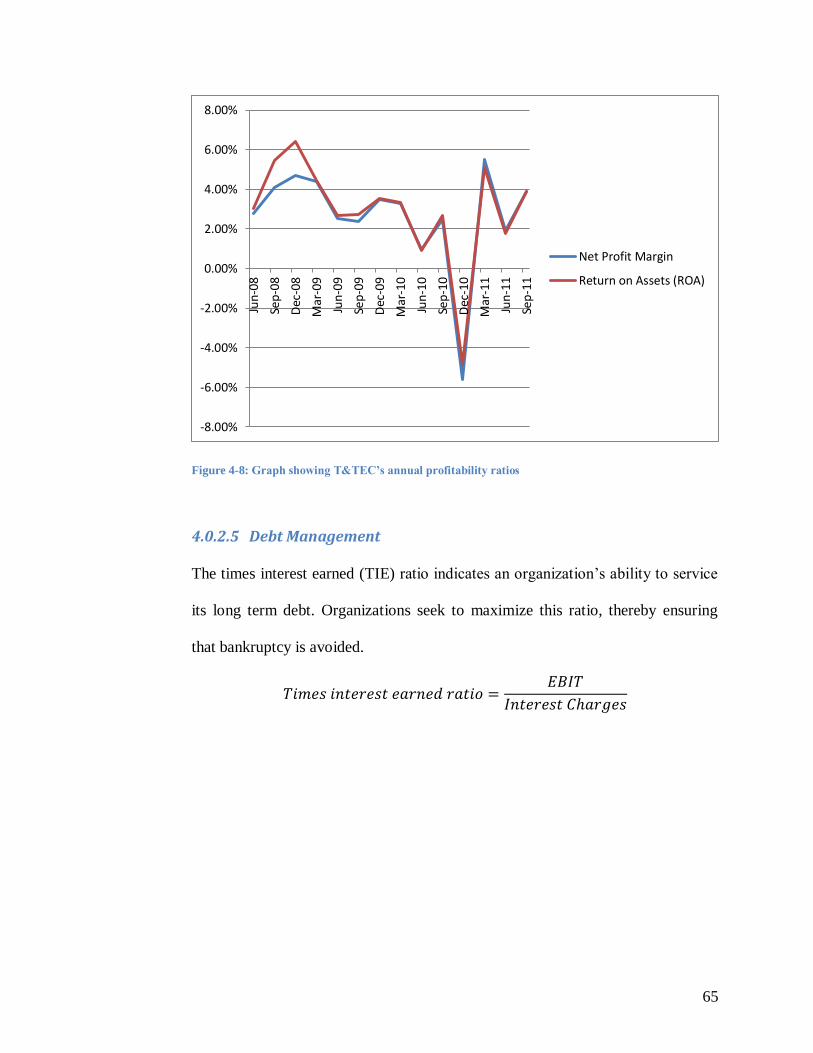
65
Figure 4-8: Graph showing T&TEC’s annual profitability ratios
4.0.2.5 Debt Management
The times interest earned (TIE) ratio indicates an organization’s ability to service
its long term debt. Organizations seek to maximize this ratio, thereby ensuring
that bankruptcy is avoided.
-8.00%
-6.00%
-4.00%
-2.00%
0.00%
2.00%
4.00%
6.00%
8.00%
Jun
-08
Sep
-08
Dec
-08
Mar
-09
Jun
-09
Sep
-09
Dec
-09
Mar
-10
Jun
-10
Sep
-10
Dec
-10
Mar
-11
Jun
-11
Sep
-11
Net Profit Margin
Return on Assets (ROA)

66
Figure 4-9: Graph showing Times Interest Earned Ratio
T&TEC’s TIE ratio has fluctuated throughout the analytical period, even
declining precariously below 1 in 2010.
The financial performance of T&TEC during the analytical period is far from
ideal. From the data available, there is definitely no great sense of improvement in
the financial standing of the organization that would indicate a successful
transformation.
0.00
0.50
1.00
1.50
2.00
2.50
3.00
3.50
Jun
-08
Sep
-08
Dec
-08
Mar
-09
Jun
-09
Sep
-09
Dec
-09
Mar
-10
Jun
-10
Sep
-10
Dec
-10
Mar
-11
Jun
-11
Sep
-11
Times Interest Earned Ratio
Times Interest EarnedRatio

67
4.0.3 Objective 5
To ensure that health, safety, security, environmental, quality and business
continuity management systems are developed and integrated in all of T&TEC’s
business operations.
The job satisfaction questionnaire evaluated objective 5, 6 and strategic
leadership. Below are some demographic data about the respondents to the
questionnaire:
Gender:
Figure 4-10: Chart showing gender of job satisfaction questionnaire respondents
Area in which employees work
Figure 4-11: Chart showing geographic area of job satisfaction questionnaire respondents
*Note: Tobago employees opted not to participate in the survey.
Tenure:
Male
48 51%
Female
46 49%
North
16 17%
South
23 24%
East
25 27%
Central
30 32%
Tobago
0 0%

68
Figure 4-12: Chart showing tenure of job satisfaction questionnaire respondents 4-10 years
56 60%
11-15 years
16 17%
15-20 years
3 3%
21+ years
19 20%
Questions 2 to 7 of the job satisfaction questionnaire measured the elements of
objective 5. By scoring the responses from 0-4, it was possible to derive an
average score of 1.88. This score suggests that performance with respect to
objective 5 was unsatisfactory. At the time of writing of this project, T&TEC
employees who responded to the questionnaire perceived that the organization
had failed to achieve this objective. It should be noted however that as at 2012-
07-17, despite the best efforts of the researcher, the job satisfaction questionnaire
only attracted 94 respondents. At a 95% confidence interval, with a population
size of 2521, the sampling error is therefore 9.92% (VanAmburg Group Inc.,
2008). Also, Tobago employees chose not to participate in the questionnaire. This
introduced a non-sampling error that must also be considered when interpreting
these results.

69
Figure 4-13: Chart showing average scores for objective 5 and its elements
The above graph summarizes the responses to questions that pertained to
objective 5. Questions that pertained to Health, Safety and the Environment
received the highest scores in this category. This indicates that the Commission’s
HSE programme was more effective than the other initiatives pursuant to
objective 5. The implementation of the ISO 14001 standard and an increased
emphasis on safety during the analytical period can be seen as being responsible
for these relatively higher scores.
Objective longitudinal secondary data was needed for a deeper understanding of
T&TEC’s performance with respect to this objective. The following safety data
were derived from T&TEC’s monthly safety reports.
2.37
1.98 1.91
2.14
1.43 1.45
1.88
0.00
0.50
1.00
1.50
2.00
2.50

70
Figure 4-14: Graph showing recordable and reported incidents from Jan 2008- Dec 2011
FREQUENCY RATE INCIDENT RATE
The number of Recordable Cases
The Number of Reported Cases for Every
for Every 200 000 Man-hours Worked
200 000 Man-hours Worked
No. of Disabling Injuries X 200 000
No. of reports X 200 000
No. of Man-hours Worked
No. of Man-hours Worked
Table 4-2: Calculation of Frequency Rate and Incident Rate
Source: (T&TEC, Jan 2008- Sep 2011)
The above graph (Figure 4-14) shows the stabilization and control of the
incidence of safety cases from Q2 2010 onwards. Employees may have
experienced an increase in safety awareness during this time that led to their
favourable evaluation of safety performance in the questionnaires. An increase in
the prominence of safety promotion events and marketing efforts designed to
boost safety consciousness can be credited for this.
0.000
1.000
2.000
3.000
4.000
5.000
6.000
7.000
8.000
9.000
Q108
Q208
Q308
Q408
Q109
Q209
Q309
Q409
Q110
Q210
Q310
Q410
Q111
Q211
Q311
Q411
FREQUENCY
INCIDENT

71
The severity of accidents, measured in days lost, showed large fluctuations during
the analytical period, reaching its highest peaks in 2011. These severe accidents
took a toll on the image of T&TEC, but prompted greater safety assurance efforts.
These efforts contributed to a favourable evaluation of the Commission’s
approach to employee safety in the job satisfaction questionnaire.
Figure 4-15: Graph showing the severity of safety incidents from Q1 2008 to Q4 2012
Source: (T&TEC, Jan 2008- Sep 2011)
0.000
10.000
20.000
30.000
40.000
50.000
60.000
70.000
80.000
90.000
Q108
Q208
Q308
Q408
Q109
Q209
Q309
Q409
Q110
Q210
Q310
Q410
Q111
Q211
Q311
Q411
SEVERITY
SEVERITY
SEVERITY RATE The Number of Man-Days Lost in Every
200,000 Man hours Worked
No. of Man-Days Lost X 200 000
No. of Man hours Worked

72
4.0.4 Objective 6
To ensure the development of a caring and service oriented organizational
culture, that promotes trust, respect, open communication, empowerment of
employees, teamwork and a recognition and reward system for employees’
performance.
The T&TEC job satisfaction questionnaire was the tool used to measure this
objective. Aspects of the organizational culture were not measured during the
analytical period and thus, only cross sectional data were collected. Through
analysis of the questionnaire feedback, it was therefore possible to ascertain if the
objective was achieved. Questions 9 through 14 on the questionnaire pertain to
this objective and break it down into its basic elements. This section received an
overall average score of 1.47, which suggests poor performance with respect to
Objective 6 (see Figure 4-16). Performance based rewards, which was explicitly
mentioned within the objective, received the lowest score in the entire
questionnaire. Performance appraisals at T&TEC are entirely subjective and are
based on the perspective of the supervisor of an employee. No objective
performance indicators are included in the appraisal. The result is that promotions
and perks are granted to employees who find favour with their supervisors or
management and not necessarily to those who perform exceptionally. This may be
a source of many performance related problems within T&TEC.

73
Figure 4-16: Chart showing scores for objective 6 and its elements
Operational employees are hired at entry level and higher vacancies are filled
internally. Promotions are usually based on tenure and employees are made to
wait many years for small promotions. Education does not quicken the progress
of one’s career at T&TEC. Entry level employees typically wait 3 to 4 years
before being upgraded from temporary to permanent status, then wait another two
years to get another automatic promotion, regardless of education or performance.
Typically, employees that upgrade their education while at T&TEC experience no
return on their investment.
1.09
1.97
1.48 1.40
1.93
0.96
1.50 1.47
0.00
0.50
1.00
1.50
2.00
2.50
74
A system of escalating disciplinary action is used to discourage undesirable
employee behavior at T&TEC. To avoid such consequences, employees only need
to adhere to minimum performance standards and attendance requirements. In the
absence of rewards for exceptionally high performance, the objective of many
employees is simply to avoid disciplinary action by giving the minimum required
levels of performance.
T&TEC’s management staff are a reclusive group, hardly being seen or heard by
employees and customers. A bureaucratic and authoritative approach to
communication has been adopted by management. Employees are dictated to and
not facilitated, mandated and not guided, and driven, not led. There is a separation
between management and employees in all the literature and policies of the
organization. Management staff have positioned themselves as an elite group and
regularly exercise their power and authority but do not attempt to show charisma
or true leadership. The result is that there is a mistrust of management among the
lower level staff of T&TEC. This is admitted as a weakness in the SWOT analysis
contained in T&TEC’s 2008-2012 strategic plan.
At the strategic planning session held on 2012-07-25 at the Central Distribution
Area, employees complained emphatically about the failure of objective 6 and
identified the organizational culture of T&TEC as a major weakness. The
relationship between management and operational employees was most criticized
by the participants of the session. Excessive bureaucracy, poor industrial
relations, poor planning of jobs and communication issues were also among the
problems discussed.

75
A dysfunctional organizational culture, which was the reason for the inclusion of
this strategic objective, continues to exist at T&TEC. As such, this objective
continues into the 2012-2016 strategic plan.

76
4.0.5 Strategic Leadership
Strategic Leadership was measured by questions 15 to 20 on the job satisfaction
questionnaire. The questions were based on the definition of this type of
leadership in the literature. Question 20 sought the opinion of staff on the
leadership competencies of the 4 General Managers who were officially appointed
during the analytical period. The percentage tenure of each general manager was
used along with the respondent scores to derive a weighted average strategic
leadership score for the analytical period.
Below, a profile on each general manager and a table showing their tenure during
the analytical period are presented:
Name Tenure at first
official
appointment
Education
Indarjit Singh 23 Years B.Sc. Electrical Engineering, M.Sc.
Engineering
Ernest Boxill 35 Years B.Sc. Electrical Engineering
Glenford Cyrille 36 Years B.Sc. Electrical Engineering,
Advanced Diploma in Electrical
Engineering, training in finance,
business and management fields
Kelvin Ramsook 25 Years B.Sc. Electrical Engineering Table 4-3: Profile on General Managers
From To
Months Served
Indarjit Singh 1/1/2008 7/16/2008 6.6
Ernest Boxill 7/17/2008 3/31/2009 8.6
Courtenay Mark* 4/1/2009 9/30/2009 6.1
Glenford Cyrille* 10/1/2009 1/17/2010 3.6
Indarjit Singh 1/18/2010 12/31/2010 11.6
Glenford Cyrille* 1/1/2011 3/31/2011 3.0
Kelvin Ramsook* 4/1/2011 4/30/2011 1.0
Glenford Cyrille 5/1/2011 11/21/2011 6.8
Kelvin Ramsook 11/21/2011 7/17/2012 8.0 Table 4-4: Turnover of General Managers
* Acting appointment
Source: (T&TEC Watts Happening Magazines, Mar 2008 – Dec 2011)

77
Figure 4-17: Graph showing Leadership Score of 4 General Managers of T&TEC (question 20)
Glenford Cyrille, who was unceremoniously removed from office in November
2011, received the highest score in question 20. After 36 years in the
Commission, he possessed a high level of integrity and a wide array of technical,
managerial and leadership skills that made him stand out from the other leaders.
What may have also been responsible for his high rating is the fact that during
tense industrial negotiations in 2011, Mr. Cyrille and the Board of Directors
visited all areas of T&TEC to have meetings with employees. These meetings
were intended to build familiarity between employees and the leadership, to
solicit feedback from employees about problems and concerns they had about the
organization; and to inform employees about the Commission’s cash flow issues.
Employees were also informed about strategies that were employed to improve
the organization’s financial viability and its ability to pay overdue salary
increases. This unprecedented gesture by the leadership of the Commission during
1.29 1.46
2.57
1.51
0.00
0.50
1.00
1.50
2.00
2.50
3.00
Indarjit Singh Ernest Boxill GlenfordCyrille
KelvinRamsook
Leadership Score
Leadership Score

78
the tenure of Glenford Cyrille was positively viewed by employees and was
reflected in the questionnaire responses.
The four scores in Figure 4-17 were used to calculate the weighted average
leadership competency score. This score was used to incorporate question 20 into
the overall strategic leadership score.
Tenure in months
% tenure Leadership Score
Weighted score
Indarjit Singh 18.1 37.0% 1.29 0.48
Ernest Boxill 8.6 17.5% 1.46 0.25
Glenford Cyrille 13.4 27.3% 2.57 0.70
Kelvin Ramsook 8.9 18.2% 1.51 0.28
TOTAL 49.0 100% 1.71
Table 4-5: Calculation of the weighted average leadership score
Note: The leadership score computation disregarded the tenure of Courtenay Mark who only acted
in the position and was not ever officially appointed.
Indarjit Singh, though reformative in his approach to leadership, had a poor
approach to industrial relations and was thus negatively viewed by staff and the
Oilfield Workers’ Trade Union (OWTU) (Kissoon, 2011).

79
Figure 4-18: Graph showing scores for Strategic Leadership and its components
Overall, it is apparent that strategic leadership was lacking at T&TEC. A lack of
holistic training of the managerial and executive staff may be responsible for this.
This sentiment was echoed by participants at the 2012-2016 strategic planning
session held at the Distribution Central Area on 2012-07-25.
Longitudinal data for strategic leadership was generated by plotting the leadership
score of the general managers of T&TEC against their tenure over time. This was
then correlated with the longitudinal performance data gathered in the previous
sections of this report (see APPENDIX H: CORRELATION TABLE).
1.43 1.36
1.80 1.85
1.49
1.71 1.59
0.00
0.20
0.40
0.60
0.80
1.00
1.20
1.40
1.60
1.80
2.00

80
Figure 4-19: Graph showing leadership score from Jan 2008 – Dec 2011
Ernest Boxill’s score was inputted as an estimate for April 2009 to September
2009 as no major changes were introduced by Courtenay Mark during his short
acting tenure. The above graph serves as the means of testing hypothesis 2 of this
research. The frequency with which the leadership of T&TEC changed (see Table
4-4) provided a unique opportunity to test the effects of varying levels of strategic
leadership on the performance of the organization. The findings of this analysis
will be discussed in the next chapter.
0.00
0.50
1.00
1.50
2.00
2.50
3.00
Mar
-08
Jun
-08
Sep
-08
Dec
-08
Mar
-09
Jun
-09
Sep
-09
Dec
-09
Mar
-10
Jun
-10
Sep
-10
Dec
-10
Mar
-11
Jun
-11
Sep
-11
Dec
-11
Leadership score
Leadership score

81
4.0.6 P3M3 Assessment
A phone liaison with the Chief Manpower Officer of T&TEC guided the
following assessments. The assessment utilized the P3M3 guide, methodology,
models and assessment tools (Sowden, Hinley, & Steve Clarke, 2010), (OGC,
2010), (OGC, 2010), (OGC, 2010), (OGC, P3M3® – Portfolio Management Self-
Assessment, 2010), (OGC, 2010) (OGC, P3M3® – Project Management Self-
Assessment, 2010).
4.0.6.1 Project Management Maturity
4.0.6.1.1 Management Control
There is no centralized standard or control mechanism for project management at
T&TEC. Projects are distributed throughout the organization and are managed
independently according to the individual preferences of managers, and engineers.
Engineers, Area Managers and Line Managers are typically seconded from their
job functions and given the responsibility to execute projects. Basic protocols
such as project definition, planning and tracking are followed for high profile
projects, but in general, an ad hoc approach to project execution is taken. Key
project participants lack training in project management.
4.0.6.1.2 Benefits Management
Benefits are articulated in project proposals, but no consistent system is followed
to measure and ensure their achievement. Project information is localized, with
little information sharing. There is a discouragingly lengthy and excessively
bureaucratic process associated with accessing project information. Sharing of
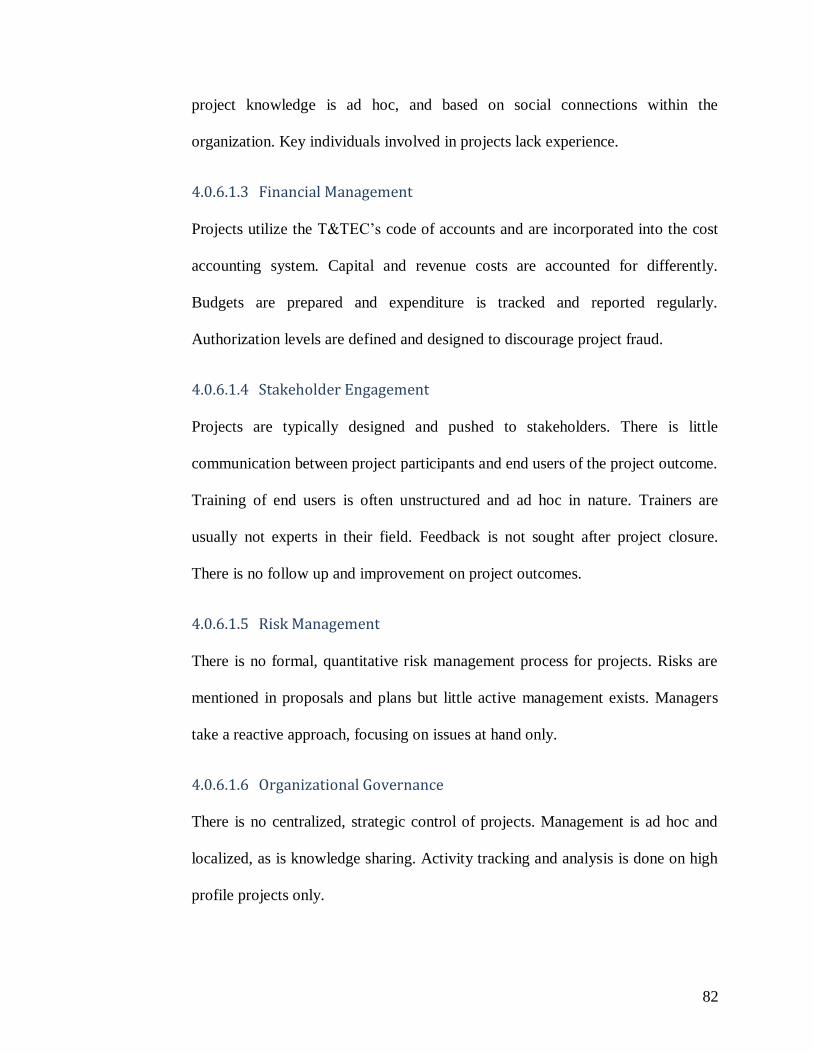
82
project knowledge is ad hoc, and based on social connections within the
organization. Key individuals involved in projects lack experience.
4.0.6.1.3 Financial Management
Projects utilize the T&TEC’s code of accounts and are incorporated into the cost
accounting system. Capital and revenue costs are accounted for differently.
Budgets are prepared and expenditure is tracked and reported regularly.
Authorization levels are defined and designed to discourage project fraud.
4.0.6.1.4 Stakeholder Engagement
Projects are typically designed and pushed to stakeholders. There is little
communication between project participants and end users of the project outcome.
Training of end users is often unstructured and ad hoc in nature. Trainers are
usually not experts in their field. Feedback is not sought after project closure.
There is no follow up and improvement on project outcomes.
4.0.6.1.5 Risk Management
There is no formal, quantitative risk management process for projects. Risks are
mentioned in proposals and plans but little active management exists. Managers
take a reactive approach, focusing on issues at hand only.
4.0.6.1.6 Organizational Governance
There is no centralized, strategic control of projects. Management is ad hoc and
localized, as is knowledge sharing. Activity tracking and analysis is done on high
profile projects only.

83
4.0.6.1.7 Resource Management
Roles and responsibilities on project teams are generic. There is a lack of
experience among project participants.
Level 3
Level 2 Level 2 Level 2
Level 1 Level 1 Level 1 Level 1 Level 1 Level 1 Level 1
Management Control
Benefits Management
Financial Management
Stakeholder Engagement
Risk Management
Organizational Governance
Resource Management
Figure 4-20: Project Management Maturity
The diagram above shows maturity levels of 7 process perspectives of Project
Management. A Project Management Maturity level of 1 is derived by taking the
lowest score among the process perspectives measured. This scoring
interpretation methodology is considered both a strength and a weakness of the
P3M3. It causes organizations seeking growth to develop holistically, but may
cause an organization with just a few weak process perspective scores to appear
infantile to an uninformed observer. The P3M3 Self-Assessment Guide also
demonstrates the use of an average of the process perspective scores to determine
the overall competency maturity level for an organization. By using this
methodology and rounding down to the nearest whole number, a Project
Management Maturity Level of 1 is still evident. Both methodologies produce the
same result but the writer is in favour of the lowest process perspective score
method. The strengths of this methodology outweigh the weakness and it is
therefore deemed to be most helpful to organizations seeking holistic
development. The remaining two competency assessments will be summarized.
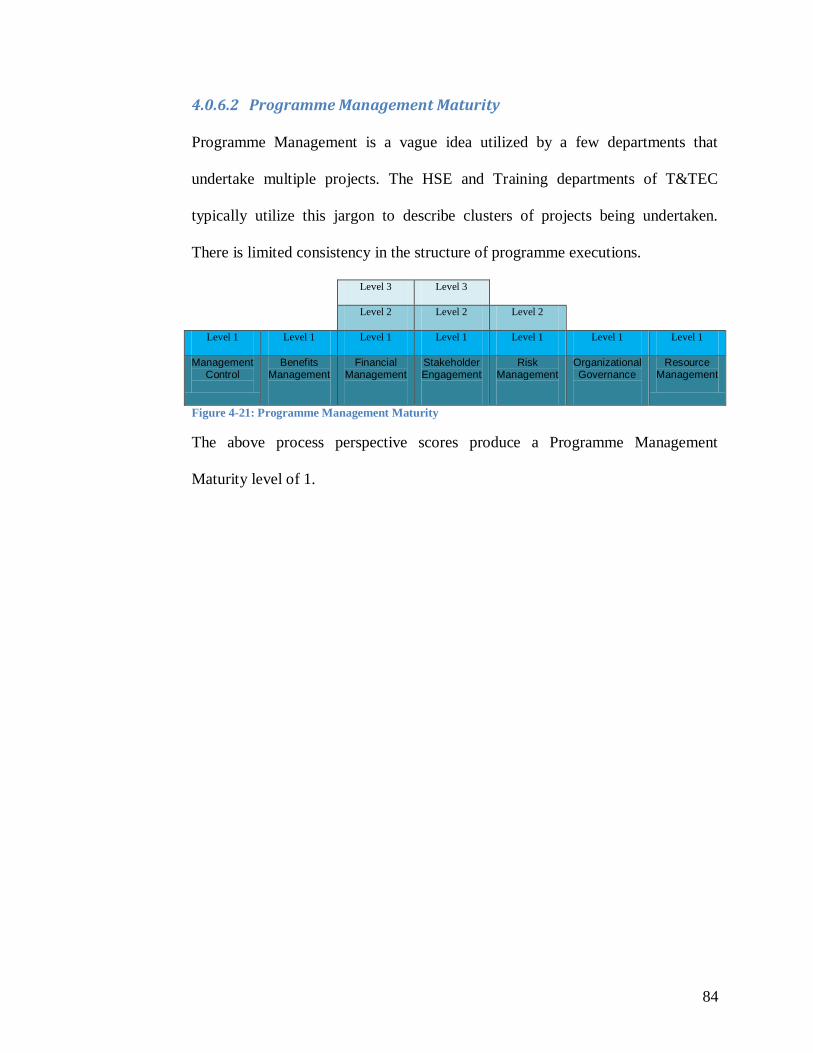
84
4.0.6.2 Programme Management Maturity
Programme Management is a vague idea utilized by a few departments that
undertake multiple projects. The HSE and Training departments of T&TEC
typically utilize this jargon to describe clusters of projects being undertaken.
There is limited consistency in the structure of programme executions.
Level 3 Level 3
Level 2 Level 2 Level 2
Level 1 Level 1 Level 1 Level 1 Level 1 Level 1 Level 1
Management Control
Benefits Management
Financial Management
Stakeholder Engagement
Risk Management
Organizational Governance
Resource Management
Figure 4-21: Programme Management Maturity
The above process perspective scores produce a Programme Management
Maturity level of 1.

85
4.0.6.3 Portfolio Management Maturity
Key individuals lack training in portfolio management. There is little centralized
management of the portfolio. Portfolio management is more commonly found at
the area management level. The definition of the project portfolio takes place at
strategic planning time and little or no changes are made to it afterwards. The
portfolio shows a lack of responsiveness to environmental changes. There are
critical issues identified during internal scanning but no initiatives are included in
the portfolio to address them. The portfolio therefore shows a lack of proper
alignment with strategic goals.
Level 2
Level 1 Level 1 Level 1 Level 1 Level 1 Level 1 Level 1
Management
Control
Benefits
Management
Financial
Management
Stakeholder
Engagement
Risk
Management
Organizational
Governance
Resource
Management
Figure 4-22: Portfolio Management Maturity
The above scores allude to a Portfolio Management Maturity level of 1
4.1 SUMMARY
T&TEC fell short of excellence in customer satisfaction and performed
unsatisfactorily with respect to objectives 4, 5 and 6. The overall level of strategic
leadership was low. Glenford Cyrille, the only leader to possess managerial,
financial and business training, was the only leader whose strategic leadership
skills were favourably appraised by employees. The P3M3 scores were all at level
1. These findings will be discussed in the following chapter.

86
5 CHAPTER 5
5.0 DISCUSSION
The previous chapter presented 12 longitudinal performance measurements as
well as a longitudinal strategic leadership evaluation for the analytical period.
Correlation of the performance variables with strategic leadership levels over the
analytical period was a means of inferring causality. 8 of the 12 performance
measurements confirmed hypothesis 2 with weak to moderate correlation
coefficients (see APPENDIX H: CORRELATION TABLE). The reported and
recordable safety incident indexes each displayed a weak negative relationship
with the strategic leadership index. The severity index however, showed a weak
positive correlation.
When compared with strategic leadership, customers per employee and written
complaints per 10,000 customers confirmed hypothesis 2 with moderate positive
and negative correlation coefficients respectively. The positive customer per
employee correlation with strategic leadership is deemed favourable because of
the Commission’s expressed desire to optimize its human resources and save on
manpower costs. The moderate negative correlation of the customer complaints
index with strategic leadership shows a decrease in the amount of customer
complaints when strategic leadership increased and vice versa.
When compared to strategic leadership over the analytical period, 4 out of the 7
financial ratios confirmed hypothesis 2, with weak positive correlation
coefficients. These were the quick ratio, times interest earned ratio, net profit

87
margin and return on assets ratio. The current ratio and asset turnover ratios
however, showed weak negative correlations with strategic leadership.
It was conjectured that low levels of Portfolio, Programme and Project
Management Maturity hampered the proper execution of the transformation
initiative. The P3M3 assessment did indeed confirm these low competency
maturity levels. It can be deduced that stronger correlations between the
performance variables and strategic leadership would be possible if there were
higher levels of organizational project management at T&TEC. The reason for
this counterfactual conjecture is that there were activities and initiatives included
within the 2008 to 2012 strategic plan to address the Commission’s shortcomings
in performance. The continued low performance shows a lack of efficacy in
implementing these initiatives. The low levels of Project, Programme and
Portfolio Management Maturity therefore acted as inhibitors to strategic
leadership at T&TEC.
In considering inhibitors, the political upheaval that occurred during the analytical
period must also be discussed. The findings of this research confirm studies that
show that upheavals in an organization’s external environment can inhibit intra
organizational transformation (Newman, 2000) and how coercive politics can
negatively affect organizational performance (Voyer, 1994). The unpredictable
external political influence on T&TEC was cited as a major inhibitor to
organizational development at the strategic planning session held at the Central
Distribution Area on 2012-07-25. The presence of these internal and external
inhibitors of strategic leadership therefore decreased the effect strategic leadership

88
was able to have on the performance variables examined. This is the reason that a
weak to moderate confirmatory correlation of 8 out of the 12 performance
variables with strategic leadership is considered a significant finding in this
research.
Performance measurement is a major issue plaguing T&TEC. The subjective
nature of employee appraisals along with the lack of performance based rewards
contributed to a dysfunctional organizational culture at T&TEC. The lack of
visibility of balanced measurements of organizational performance contributed to
a dysfunctional culture at the management level as well. Managers face a moral
hazard, in that no consequences are perceived to be associated with a lack of
performance. They continue to fail to achieve the objectives of the organization,
yet enjoy job security. There is no ownership of responsibility for the
achievement of the objectives and goals contained in the strategic plan. Oversight
bodies such as the RIC and the GORTT are not doing enough to hold managers
accountable for the continued poor performance of T&TEC.
The difficulties faced by the writer in obtaining performance data attest to the
attitude of managers towards being evaluated. Additional performance data such
as the customer average interruption duration index (CAIDI) and the number of
trouble reports per quarter were requested through formal channels in June 2012.
To date, these data were not released. Fortunately, customer service data were
available at the RIC and were used to evaluate objective 3.
T&TEC did follow through with customer service improvement initiatives such as
the AMI, Service Link and Call Center projects. However, procurement issues

89
have resulted in continued occurrences of material shortages that have prevented
customers from accessing a basic electricity service from T&TEC in a timely
manner. The Commission is overlooking fundamental weaknesses which stem
from a lack of managerial competency among its management staff. Procurement
delay was an identified weakness in the 2008-2012 strategic plan and an e-
procurement system was proposed as a solution. However, customer feedback and
empirical evidence show that to date, the benefits of this system have not been
realized.
Authors within the literature promote a balanced approach to performance
management (Maak & Pless, 2006), (Kaplan & Norton, 2001), (Brown M. G.,
2007). However, T&TEC has prioritized its transmission and distribution
objectives and has overlooked its managerial objectives. This is evidenced by the
Commission’s heavy investment in its electrical engineering competencies and its
failure to develop its human relations and project management competencies,
which were incidentally the lowest rated competencies in a human resource audit
done in 2008. The project management competency in particular was critical to
the implementation of the strategic plan. A lack of initiatives to improve this
competency has ultimately led to a failure of many objectives and projects listed
in the strategic plan.
The questionnaire feedback from customers and employees confirmed hypothesis
1. T&TEC fell short of achieving its ‘managerial’ objectives once again in 2012.
The objective longitudinal data also confirmed this, showing no improvement in
the financial performance of T&TEC that would indicate a successful

90
transformation. All 7 financial ratios analyzed depict a trend of declining financial
performance (see APPENDIX I: TREND OF FINANCIAL RATIOS). In
addition, accident severity had an increasing trend over the analytical period.
Written complaints per 10,000 customers, reported and recordable safety incident
indexes; and customers per employee however, showed slightly developing trends
over the analytical term. With 8 out of 12 performance metrics showing a
deteriorating trend, it can be said that performance over the analytical period was
less than desirable.
T&TEC’s P3M3 scores are consistent with a PWC study which showed that most
public sector organizations (56.3%) possess a level 1 maturity
(PricewaterhouseCoopers, 2004). The PWC study also showed that higher project
management maturity levels deliver superior performance in project delivery and
business benefits. This study was repeated in 2007 and showed a positive
relationship between project management certification and project performance.
Interestingly, only 3% of respondents (project managers) possessed Master’s
Degrees in Project Management, up from 2% in 2004 (PricewaterhouseCoopers,
2007). The level of project management certification at T&TEC continues to be
low. The ad hoc execution of high profile projects by unqualified personnel has
resulted in the failure of these projects to satisfy their stakeholders and contribute
to the achievement of the strategic objectives of T&TEC. The absence of an
initiative to increase this competency in the 2008-2012 strategic plan has trapped
the organization in a recurring loop of strategic failure.

91
Operational employees play a key role in executing the strategy of an
organization. Without a clear communication of the strategy and timely
motivation to work towards organizational objectives, employees have developed
an unclear vision about the organization and their role in it. The operational
employees of T&TEC have become engulfed in routine tasks and cannot identify
with the long term vision of the organization anymore. This lack of motivation,
which is a key function within the discipline of Management, is another inhibitor
of strategic growth and progress at T&TEC.
T&TEC’s approach to strategic planning is fundamentally flawed and may be a
root cause of the organization’s continued performance shortfalls. When there is
the need to prepare a strategic plan, the Commission retains the services of
external consultants. For the 2012-2016 strategic plan, Dr. Aubery Armstrong, a
renowned management scholar and former university professor was contracted.
No doubt, a well-crafted strategic plan will be produced by this consultant, as has
been in the past. The problem with this is, once the strategic plan is prepared, the
consultant leaves, and the implementation of the plan is left totally up to the
managers within T&TEC. This ultimately leads to SPOTS syndrome and/ or poor
implementation attempts (Haines, 2000). Unless the Commission boosts its
competencies in portfolio, programme and project management, strategic
planning will continue to yield lackluster results at T&TEC. This cycle of
strategic planning and failure to achieve strategic objectives has been repeated
long enough to warrant strategic learning. The existence of the same issues and
problems from the 2008-2012 strategic plan in the 2012- 2016 strategic planning

92
sessions should serve as an indicator to the leaders of T&TEC that their approach
is fundamentally flawed. It is hoped that this research project prompts a revision
in the strategy of T&TEC that stops the cycle of strategic failure that has become
a 5 year routine.

93
5.1 RECOMMENDATIONS
5.1.1 Short term
The following recommendations should be implemented within one year of the
receipt of this research project.
5.1.1.1 Increase oversight of organizational performance
Proper oversight mechanisms and enforcement of performance standards must be
institutionalized within T&TEC. Managers must be given responsibility and held
accountable for the strategic objectives and projects outlined in T&TEC’s
strategic plans. Organizational performance metrics should be standardized and
made more visible to key stakeholders within and external to T&TEC.
It is a recommendation of this research paper that the Balanced Scorecard system
of performance measurement and management be adopted by T&TEC. This will
yield the following benefits:
Tracking of the true performance of T&TEC with respect to its strategic
plan
Communication of organizational progress to key stakeholders
A source of strategic direction that motivates staff toward achieving the
vision
A means of objectively appraising the performance of management staff.
Fortunately, the RIC has taken the initiative and has released a consultative
document indicating its intention to produce and publish revised reports on the
performance of T&TEC (RIC, 2011). A wide array of performance indicators,
94
including those contained in this research project will be included in the report.
This report will be published via the RIC website, social networking media and
the local newspapers. This is exactly what T&TEC needs to ensure higher
visibility and scrutiny of management’s performance. T&TEC should collaborate
with the RIC to ensure the accurate communication of the data as often as
required.
5.1.1.2 Increase human relations training
T&TEC needs to increase the human relations training of its Management staff.
The complaints throughout the organization about the poor relationship between
operational employees and management staff warrant an intervention. A staff
development programme aimed at solving this issue should be initiated and made
high priority. Expert management consultancy services should be procured to
ensure that effective solutions to the human relations issues are developed and
institutionalized within T&TEC. This will yield the following benefits:
Increased employee morale
Increased productivity
Decreased absenteeism
More efficient communication
Increased camaraderie and teamwork among staff

95
5.1.1.3 Revise the performance appraisal system
T&TEC also needs to review its performance appraisal system. The current
system has contributed to the dysfunctional organizational culture evidenced in
this research project. Appraisals should be based on objective performance data
for each employee. A review of the operational job tasks should be performed
with the aim of identifying key performance indicators for each position. These
key performance indicators should be made a major component of regular
appraisals. The presence of high levels of subjective bias in the current
performance appraisal system needs to be eliminated before steps can be taken to
institute a performance based rewards system at T&TEC. The following benefits
can be realized from these initiatives
Increased employee motivation and morale
Increased employee performance
Higher quality supervisory staff
Increased organizational performance
5.1.1.4 Develop a Project Management Office (PMO)
T&TEC undertakes a large number of projects, but there is no centralized
repository of project knowledge within the organization. Project management is
decentralized, with ownership scattered across the organization. There is little
information sharing and organizational learning with respect to project
management as a result. There is also a lack of standardization of project
management methodologies. Project managers typically lack training in the
discipline and execute projects according to their personal preferences.

96
The 2008-2012 strategic plan relied heavily upon the successful execution of
projects aimed at achieving the objectives and vision of T&TEC. The low project
management competency within the organization resulted in a lack of efficacy of
these initiatives. A Project Management Office is a much needed establishment
within T&TEC at present. Such an office can house the Commission’s project
management expertise and support project managers in key functions and
knowledge areas associated with the discipline. This office can also serve to
increase the Commission’s project management competency by providing:
Mentoring of project staff
Training of project staff
Project management oversight (real time monitoring and tracking)
Recruitment of project management staff
Project management audits
Project support services such as risk management, procurement
management and schedule management
A project management methodology and guide and a host of other
services.
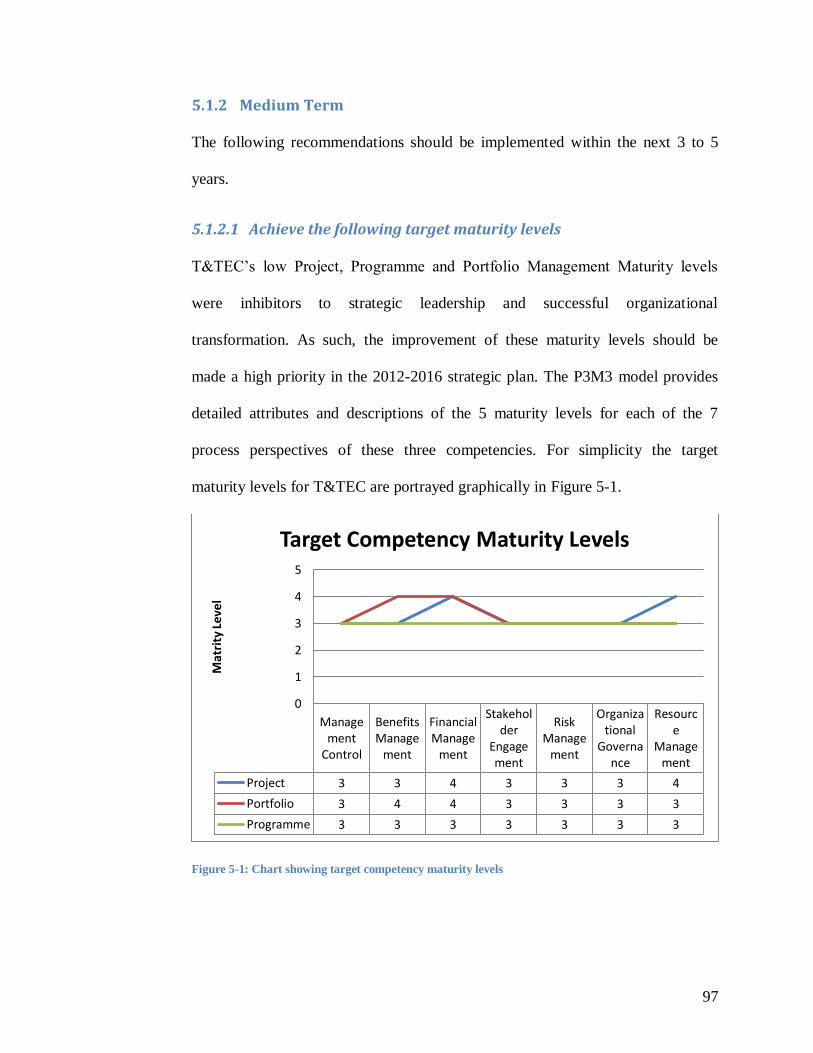
97
5.1.2 Medium Term
The following recommendations should be implemented within the next 3 to 5
years.
5.1.2.1 Achieve the following target maturity levels
T&TEC’s low Project, Programme and Portfolio Management Maturity levels
were inhibitors to strategic leadership and successful organizational
transformation. As such, the improvement of these maturity levels should be
made a high priority in the 2012-2016 strategic plan. The P3M3 model provides
detailed attributes and descriptions of the 5 maturity levels for each of the 7
process perspectives of these three competencies. For simplicity the target
maturity levels for T&TEC are portrayed graphically in Figure 5-1.
Figure 5-1: Chart showing target competency maturity levels
Management
Control
BenefitsManage
ment
FinancialManage
ment
Stakeholder
Engagement
RiskManage
ment
Organizational
Governance
Resource
Management
Project 3 3 4 3 3 3 4
Portfolio 3 4 4 3 3 3 3
Programme 3 3 3 3 3 3 3
0
1
2
3
4
5
Mat
rity
Lev
el
Target Competency Maturity Levels

98
A maturity level of 3 is recommended for all 3 of these critical competencies. The
descriptions and attributes of the maturity levels in Figure 5-1 should be consulted
in the P3M3 and a gap analysis should be performed. The presence of a Project
Management Office will greatly assist in the infusion of these competencies into
T&TEC. This recommendation is therefore dependent on the establishment of a
PMO in the short term future.
5.1.2.2 Revise the qualification requirements for the General Manager
position
The General Manager position requires a high level of competency in strategic
leadership. C.E.O’s must rely on technical and managerial expertise in performing
the important function of strategic project portfolio management. As such, expert
knowledge in financial management, project management and strategic leadership
should be made a requirement for this top position within the T&TEC. Amidst the
many inhibitors to strategic leadership, this research effort still discerned a
relationship between strategic leadership and organizational performance
variables. Glenford Cyrille, the only General Manager to possess training in
engineering, finance, business and management, was highly rated by employees
and was associated with higher levels of organizational performance. The
Commission should seek to institutionalize this skill set at this very important
executive level.

99
5.1.3 Long Term
The following recommendation should be implemented within the next 5 to 10
years:
5.1.3.1 Privatize T&TEC
In order for T&TEC to achieve its objectives, it must be freed from political
control. The privatization of this SOE should therefore be seriously considered by
the GORTT. Strategic leadership does not seem possible within the current
politically dominated environment of T&TEC. As seen in this research project, it
is the customers and employees who suffer as a result of this. In the interest of
achieving the vision, satisfying T&TEC’s most important stakeholders, and
facilitating Trinidad and Tobago towards developed country status, uninhibited
strategic leadership, characteristic of the private sector must be established. Such
an undertaking would be a project in and of itself. Employee concerns about
retrenchment, customer concerns about increasing rates and other stakeholder
concerns will have to be managed and controlled. The writer believes that
research can show the positive effects of privatization in other former SOE’s such
as the Trinidad and Tobago Postal Service that can easily justify such a move at
T&TEC. The nation is fortunate to have a vibrant financial market that can easily
facilitate the transfer of ownership of T&TEC to investors within Trinidad and
Tobago. The Commission’s key stake holder, its customers, could then become its
owner, thereby ensuring that customer service is treated with the priority it
deserves.

100
5.2 CONCLUSION
This project report has been a comprehensive review of strategic planning and
strategy implementation. Pertinent theories and research findings were compared
to the actual practice strategic planning within the Trinidad and Tobago
Electricity Commission. Organizational transformation, which is often the goal of
strategic planning, was seen to be a conglomeration of initiatives aimed at
effecting radical and comprehensive positive changes within an organization.
Examination of T&TEC’s organizational transformation attempt confirmed the
findings of other researchers that strategic planning is not the primary cause of
failed organizational transformations or poor organizational performance. The
shortcomings lie in the implementation of strategic plans (Morgan, Levitt, &
Malek, 2007), (Charran & Colvin, 1999), (Khurana, et al., 2003), (Herold &
Fedor, 2008). There is often a mismatch of skills and competencies within
organizations that prevent the translation of strategic plans into positive
organizational change. This was the case at T&TEC, where it was found that key
personnel lacked critical skills and experience required to operationalize the
organizational strategy.
Organizational project management, which in involves strategic project portfolio
management, programme management and project management, is the model that
should be adhered to in the implementation of strategic plans and transformation
initiatives. It results in a permeation of the strategy throughout all levels of an
organization and enables leaders to focus resources on propelling the organization
towards its strategic vision.
101
The examination of T&TEC’s performance from 2008-2012 showed that low
levels of Project, Programme and Portfolio Management Maturity can inhibit an
organization’s efforts to achieve organizational transformation. Strategic
leadership, which complements organizational project management, has a low to
moderate relationship with organizational performance under these conditions. It
is clear therefore that to increase the success rate of transformation initiatives,
organizations must build their project, programme and portfolio management
competencies.
The P3M3 has proven to be an invaluable tool for measuring and building project,
programme and portfolio management competencies. The independence of the
sub-components of the P3M3 gives an organization the flexibility to develop the
competencies and process perspectives that are in most dire need of attention. The
scoring methodology suggested in this plan, may be deemed to be too vague, as it
would allow organizations with a wide array of scores in different process
perspectives to exist within the same overall maturity level. Perhaps organizations
which choose to adopt this tool can modify it for internal use, such that more
precise maturity levels are derived from the questionnaires.
Further research should focus on the effects of the competency maturity levels
within the P3M3. The P3M3 assessments should be conducted within T&TEC at
regular intervals and should be recommended to other state owned organizations.
This would facilitate longitudinal analysis of the effects of the changing

102
competency levels as well as the comparison of the scores and performance of
T&TEC with those of other public sector organizations.
This research has been an enlightening experience. It allowed the writer to see the
great value of project management in an organizational setting. The Trinidad and
Tobago Electricity Commission can benefit greatly from institutionalizing
organizational project management. The establishment of a Project Management
Office at T&TEC is highly recommended as it would result in a greater return on
the organization’s investment in strategic planning and organizational
transformation. Project Management is indeed the ideal management model for
the modern dynamic business environment. The adaptability of this discipline to a
wide range of application scenarios makes it an invaluable tool for every
organization. By utilizing the concepts and models within this project report, the
Project Manager can add great value to the management and executive levels a
great variety of organizations.

103
BIBLIOGRAPHY
Alexander, G. (2009, February 27). Minister gets interim report on T&TEC
corruption charges. Trinidad and Tobago Guardian.
Ansoff, H. I. (1957). Strategies for Diversification. Harvard Business Review Vol
35 Issue 5, 113-124.
Banish, B. J., & Nawaz, M. I. (2003). The Role of Culture in Organizational
Change. Massachusetts: MIT.
Barnett, W. P., Greve, H. R., & Park, D. Y. (1994). An Evolutionary Model of
Organizational Performance. Strategic Management Journal Vol. 15, 11-
28.
Baum, J. R., & Wally, S. (2003). Strategic Decision Speed and Firm Performance.
Strategic Management Journal, 1107- 1129.
Beach, L. (2006). Leadership and the Art of Change. California: Sage
Publications Ltd. .
Becker, B., & Gerhart, B. (1996). The Impact of Human Resource Management
on Organizational Performance: Progress and Prospects. The Academy of
Management Journal, Vol. 39, No. 4, 779-801.
Bernal, R. L., & Leslie, W. J. (1999). Privatization in the English Speaking
Caribbean: An Assessment. Policy Papers on the Americas, 9-.
Biedenbach, T., & Müller, R. (2012). Absorptive, innovative and adaptive
capabilities and their impact on project and project portfolio performance.
International Journal of Project Management 30 , 621-635.

104
Boulding, W. (1994). Understanding Managers' Strategic Decision-Making
Processes. Marketing Letters, 413-426.
Brews, P. J., & Hunt, M. R. (1999). LEARNING TO PLAN AND PLANNING
TO LEARN: RESOLVING THE PLANNING SCHOOL/LEARNING
SCHOOL DEBATE. Strategic Management Joumai, 889-913.
Brown, J. T. (2008). The Handbook of Program Management. New York:
McGraw-Hill.
Brown, M. G. (2007). Beyond the Balanced Scorecard. New York: Productivity
Press.
Burgelman, R. A. (1983). Corporate Entrepreneurship and Strategic Management:
Insights from a Process Study. Manageent Science Vol 29 No. 12, 1349-
1364.
Callahan, K., & Brooks, L. (2004). Essentials of Strategic Project Management.
Hoboken: John Wiley & Sons.
Charran, R., & Colvin, G. (1999). Why CEOs Fail. Fortune, 69-78.
Ckarke, D. L. (1992). A Literature Analysis of the Use of Management Science
Tools in Strategic Planning. The Journal of the Operational Research
Society, 859-870.
CMMI Product Team. (2010). CMMI® for Development, Version 1.3. Hanscom:
Software Engineering Process Management Program.
Coleman, J. R., Belardo, S., & Duchessi, P. (1994). A Strategic Decision Support
System at Orell Fussli. Journal of Management Information Systems, 135-
157.

105
Cooper, R., Edgett, S., & Kleinschmidt, E. (2001). Portfolio Management for
New Product Development Results of an Industry Practices Study
Reference Paper #13. R&D Management Vol. 31 No. 4, 361-380.
Cornelly, C. (2008, October 9). T&TEC shocker: Chairman Ramlal quits.
Trinidad and Tobago Guardian.
Crawford, J. K. (2002). Project Management Maturity Model. New York: Marcel
Dekker Inc.
Crossan, M. M., & Berdrow, I. (2003). Organizational Learning and Strategic
Renewal. Strategic Management Journal 24, 1087-1105.
Demers, C. (2007). Organizational Change Theories. Los Angeles: Sage
Publications Inc. .
Doran, G. T. (1981). There's a S.M.A.R.T. way to write management's goals and
objectives. Management Review Vol. 70 Issue 11 (AMA FORUM, 35-36.
Doughty, M. (2012, May 12). PowerGen gets another 15 years. The Trinidad
Guardian Newspaper.
Edwards, M. G. (2010). Organizational Transformation for Sustainability. New
York: Routledge.
Elenkov, D. S., Judge, W., & Wright, P. (2005). Strategic Leadership and
Executive Innovation Influence: An International Mulit-Cluster
Comparitave Study. Strategic Management Journal 26, 665-682.
Fariborz, D. (2006). Organizational Transformation and Performance: An
Examination of Three Perspectives. J Managerial Issues, 104-128.
106
Floyd, S. W., & Wooldridge, B. (1992). Middle Management Involvement in
Strategy and its Asoociation with Strategic Type: A Research Note.
Strategic Management Journal Vol. 13, 153-167.
Ghemawat, P., Collis, D. J., Pisano, G. P., & Rivkin, J. W. (1999). Strategy and
the Business Landscape. Addison-Wesley.
Golden, B. R., & Zajac, E. J. (2001). WHEN WILL BOARDS INFLUENCE
STRATEGY? INCLINATION×POWER = STRATEGIC CHANGE.
Strategic Management Journal, 1087–1111.
Government of the Republic of Trinidad and Tobago. (2011). Government of the
Republic of Trinidad and Tobago 2011 Updated Public Statement of the
TRINIDAD AND TOBAGO ELECTRICITY COMMISSION In
compliance with Sections 7,8 and 9 of the Freedom of Information Act
1999.
Grant, R. M. (2003). Strategic Planning in a Turbulent Environment: Evidence
from the Oil Majors. Strategic Management Journal, 491–517.
Grant, R. M. (2008). Contemporary Strategy Analysis. Malden: Blackwell
Publishing.
Greene, J. C. (2007). Mixed Methods in Social Inquiry. San Francisco: Jossey-
Bass.
Haines, S. G. (2000). The Systems Thinking Approach to Strategic Planning and
Management. Boca Raton: CRC Press.
Hassanali, S., & Gumbs-Sandiford, A. (2012, April 1). Omar Khan to exit as
T&TEC chairman. Trinidad and Tobago Guardian.

107
Hellevik, O. (1984). Introduction to Causal Analysis. London: George Allen &
Unwin (Publishers) Ltd. .
Henry, A. (2008). Understanding Strategic Management. Oxford: Oxford
University Press.
Henry, A. E. (2011). Understanding Strategic Management. Oxford: Oxford
University Press.
Herold, D. M., & Fedor, D. B. (2008). Change the way you lead change.
California: Stanford University Press.
Hickman, G. R. (2010). Leading Organizations Perspectives for a New Era.
Thousand Oaks: Sage Publications Inc.
Hobbs, L. (2008). Strategic DNA. Chicago: Agate Publishing.
Huber, G. P. (1991). Organizational Learning: The Contributing Process and the
Literatures. Organizational Science Vol. 2 No. 1, 88-115.
Huizing, A., Koster, E., & Bouman, W. (1997). Balance in Business Process
Reengineering: An Empirical Study of Fit and Performance. Journal of
Management Information Systems Vol. 14 No. 1, 93-118.
Javeed, A. (2011, November 25). T&TEC boss sent packing. Trinidad and
Tobago Guardian.
Javeed, A. (2012, April 3). T&TEC BOSS QUITS. Trinidad Express Newspapers.
Jenkins, M., & Ambrosini, V. (2002). Strategic Management A Multi Perspective
Approach. Bassingstroke: Palgrave.
Johnston, Jr., R. E., & Bate, J. D. (2003). The Power of Strategy Innovation. New
York: Amacom.
108
Jonas, D. (2010). Empowering project portfolio managers: How management
involvement impacts project portfolio management performance.
International Journal of Project Management, 818-831.
Julien, J. (2010, July 1). Minister: Blatant breaches. Trinidad Express
Newspapers.
Kaplan, R., & Norton, D. (2001). The Strategy Focused Organization. Boston:
Harvard Business School Press.
Kayrooz, C., & Trevitt, C. (2005). Research in Organizations and Communities.
Crows Nest: Allen & Unwin.
Kenny, G. (2005). Strategic Planning and Performance Measurement. Great
Britain: Elsevier.
Kerzner, H. (2001). Strategic Planning for Project Management Using a Project
Management Maturity Model. New York: John Wiley & Sons Inc.
Khurana, R., Wiersema, M., Fuller, J., Berglas, S., Maccoby, M., Schaeffer, L. D.,
. . . Eckert, R. A. (2003). Harvard Business Review on Leadership at the
Top. Boston: Harvard Business School Press.
Killen, C. P., Jugdev, K., Drouin, N., & Petit, Y. (2012). Advancing project and
portfolio management research: Applying strategic management theories.
International Journal of Project Management 30, 525-538.
Kissoon, C. (2011, February 3). T&TEC GM must go, says union. Trinidad
Express Newspapers.
Knutson, J. (2001). Project Management for Business Professionals. New York:
John Wiley & Sons Inc.
109
Kotnour, T. G. (2010). Transforming Organizations. New York: CRC Press.
Kuwada, K. (1998). Strategic Learning: The Continuous Side of Discontinuous
Change. Organization Science/ Vol. 9, No. 6, 719-736.
Lord, R. (2008, October 7). Mark alleges fraud in T&TEC. Trinidad and Tobago
Guardian.
Maak, T., & Pless, N. M. (2006). Responsible Leadership in a Stakeholder
Society- A Relational Perspective. Joural of Business Ethics, 99-115.
Madter, N., Bower, D. A., & Aritua, B. (2012). Projects and personalities: A
framework for individualising project management career development in
the construction industry. International Journal of Project Management
30, 273-281.
Mahdi Bashiri, H. B. (2012). A new approach to tactical and strategic planning in.
Applied Mathematical Modelling, 1703–1717.
McCarthy, J. (2008). Prometheus Strategy. Retrieved 03 30, 2012, from
PrometheulStrategy.com: The Most Powerful Srategic Business Planning
System Available!: http://www.prometheusstrategy.com/main/index.php
McNamara, G., Deephouse, D. L., & Luce, R. A. (2003). Competitive Positioning
Within and Across a Strategic Group StructureL The Performance of
Core, Secondary and Solitary Firms. Strategic Management Journal, 161-
181.
Ministry of Energy and Energy Affairs. (2009). Electric Power: Energy
Resources- Ministry of Energy and Energy Affairs- Trinidad and Tobago.
110
Retrieved June 27, 2012, from
http://www.energy.gov.tt/energy_resources.php?mid=9
Ministry of Legal Affairs. (2009, December 31). Laws of Trinidad and Tobago,
Regulated Industries Commission Act Chapter 54:73. Port of Spain.
Ministry of Trade and Industry. (2011). A Guide to Investing in Trinidad and
Tobago. Port of Spain: Ministry of Trade and Industry.
Mintzberg, H. (1994). The Rise and Fall of Strategic Planning. Toronto: The Free
Press.
Mitchel, M. A. (2007). Electricity in Trinidad and Tobago 1895-2006. Trinidad
and Tobago Electricity Commission.
Moore, S. (2010). Strategic Project Portfolio Management. Hoboken: John Wiley
& Sons.
Morgan, M. I., Cole, A. B., Johnson, D. R., & Johnson, R. J. (2010). Executing
your Business Transformation. San Francisco: Jossey-Bass.
Morgan, M., Levitt, R. E., & Malek, W. (2007). Executing Your Strategy. Boston:
Harvard Business School Press.
Morris, P. W., & Pinto, J. K. (2007). The Wiley Guide to Project Program and
Portfolio Management. Hoboken: John Wiley & Sons, Inc. .
Newman, K. L. (2000). Organizational Transformation during Institutional
Upheaval. Academy of Management Review, 602-619.
Niven, P. R. (2002). Balanced Scorecard Step-By-Step. New York: John Wiley &
Sons.
OGC. (2010). P3M3® – Portfolio Management Self-Assessment. London.

111
OGC. (2010). P3M3® – Portfolio Model. London.
OGC. (2010). P3M3® – Programme Management Self-Assessment. London.
OGC. (2010). P3M3® – Programme Model. London.
OGC. (2010). P3M3® – Project Management Self-Assessment. London.
OGC. (2010). P3M3® – Project Model. London.
Oliff, M. D. (2012). A quick guide to enterprise transformation. Industrial
Engineer, 40-41.
O'Shannassy, T. (2003). Modern Strategic Management. Singapore Management
Review, Vol. 25 No. 1, 53-67.
Pantaleo, D., & Pal, N. (2008). From Strategy to Execution. Berlin Heidelberg:
Springer- Verlag.
Pinsonneault, A., & Kraemer, K. L. (1993). Survey Research Methodology in
Management Information Systems: An Assessment. Journal of
Management Information Systems Vol 10 No. 2, 75-105.
Porter, M. E. (1980). Competitive Strategy. New York: The Free Press.
Porter, M. E. (1997). How Competitive Forces Shape Strategy. Harvard Business
Review, 1-10.
PricewaterhouseCoopers. (2004). Boosting Business Performance through
Programme and Project Management: A first global survey on the current
state of project management maturity in organisations across the world.
connectedthinking, 12.
PricewaterhouseCoopers. (2007). Insights and Trends: Current Programme and
Project Management Practices. Insights and Trends, 1-14.

112
Project Management Institute. (2008). A Guide to the Project Management Body
of Knowledge (PMBOK® Guide) - Fourth Edition. Newton Square:
Project Management Institute Inc.
Project Management Institute, Inc. (2003). Organizational Project Management
Maturity Model. Newtown Square: Project Management Institute, Inc.
Ramos-Rodríguez, A.-R., & Ruíz-Navaro, J. (2004). CHANGES IN THE
INTELLECTUAL STRUCTURE OF STRATEGIC MANAGEMENT
RESEARCH: A BIBLIOMETRIC STUDY OF THE STRATEGIC
MANAGEMENT JOURNAL, 1980–2000. Strategic Management
Journal, 981–1004.
RIC. (2011). Performance Reporting and Monitoring. Port-of-Spain: RIC.
Rowe, W. G. (2001). Creating wealth in organizations: The role of strategic
leadership. Academy of Management Executive Vol. 15, 81-94.
Rynes, S. L., & McNatt, D. B. (2001). BRINGING THE ORGANIZATION
INTO ORGANIZATIONAL RESEARCH: AN EXAMINATION OF
ACADEMIC RESEARCH INSIDE ORGANIZATIONS. JOURNAL OF
BUSINESS AND PSYCHOLOGY Vol. 16, No. 1,, 3-19.
Sachdeva, R., Williams, T., & Quigley, J. (2007). Mixing Methodologies to
Enhance the Implementation of Healthcare Operational Research. The
Journal of the Operational Research Society, Vol. 58, No. 2,, 159-167.
Sanghera, P. (2009). 90 Days to Success as a Project Manager. Boston: Course
Technology.

113
Sia, S. K., & Neo, B. S. (1997). Reengineering Effectiveness and the Redesign of
Organizational Control: A Case Study of the Inland Revenue Authority of
Singapore. Journal of Management Information Systems/ Vol 14 No. 1,
69-92.
Sowden, R., Hinley, D., & Steve Clarke. (2010). Portfolio, Programme and
Project Management Maturity Model (P3M3®) Introduction and Guide to
P3M3®. London: Ofice of Government Commerce.
Steiss, A. W. (2003). Strategic Management for Public and Nonprofit
Organizations. New York: Marcel Dekker Inc.
Strickland III, A. J., Gamble, J. E., & Thompson, Jr., A. A. (2007). Crafting and
Executing Strategy 15th Ed. New York: Mc Graw-Hill Irwin.
T&TEC. (2004). Strategic Plan 2004-2008. Port of Spain: T&TEC.
T&TEC. (2008). T&TEC Strategic Plan 2008-2012. Strategic Plan.
T&TEC. (2011). FINANCIAL REPORT FOR THE THIRD QUARTER ENDED
2011 09 30. Port of Spain: T&TEC.
T&TEC. (2011, January 24). Organizational Structure. Retrieved from Trinidad
& Tobago Electricity Commission:
http://www.ttec.co.tt/about_us/structure/default.htm
T&TEC. (Jan 2008- Sep 2011). Monthly Safety Reports . Port of Spain: T&TEC.
T&TEC. (n.d.). MAP OF BOUNDARIES/OFFICE LOCATIONS. Retrieved 07 05,
2012, from http://www.ttec.co.tt/about_us/maps/default.htm
Tabrizi, B. N. (2007). Rapid Transformation. Boston: Harvard Business School
Press.

114
Teller, J., Unger,, B. N., Kock, A., & Gemünden, H. G. (2012). Formalization of
project portfolio management: The moderating role of project portfolio
complexity. The International Journal of Project Management, 596-607.
Termini, M. J. (2009). From Concept to Customer: Portfolio, Pipeline and
Strategic Project Management. Dearborn: Society of Manufacturing
Engineers.
Thomas, J. B., Sussman, S. W., & Henderson, J. C. (2001). Understanding
"Strategic Learning": Linking Organizational Learning, Knowledge
Management and Sensemaking. Organization Science/ Vol. 12, 331-345.
Trinidad & Tobago Guardian. (2008, July 08). Ernest Boxhill named T&TEC's
new GM. Business Guardian.
Urbany, J. E. (1998). Rational Strategic Reasoning: An Unnatural Act? Marketing
Letters 9:3, 285–299.
VanAmburg Group Inc. (2008). VanAmburg Groupp- Brilliant Marketing
Solutions. Retrieved 06 04, 2012, from
http://www.vanamburggroup.com/tool-statistical-validity.php
Voyer, J. J. (1994). Coercive Organizational Politics and Organizational
Outcomes: An Interpretive Study. Organizational Science Vol. 5 No. 1,
72-85.
Wagner, R. S. (2006). The Human Element of Organizational Transformation: A
Phenomenographic Study of how Internal Stakeholders in Federal
Defense Organizations Experience and Make Sense of Planned

115
Organizational Change. Ann Arbor: ProQuest Information and Learning
Company.
Walter, M. (2010). Social Research Methods. South Melbourne: Oxford.
Welch, A. (2011, February 6). T&TEC GM retires. Trinidad Express
Newspapers.
Winship, C., & Morgan, S. L. (1999). The Estimation of Causal Effects from
Observational Data. Annual Reviews, 659-707.
Worrall, L., Lubbe, S., & Klopper, R. (2007). Academic Research and
Management Practice: Is the Relevance Gap Closing? Alternation 14, 292-
316.
Zajac, E. J., Kraatz, M. S., & Bresser, R. K. (2000). Modeling the Dynamics of
Strategic Fit: A Normative Approach to Strategic Change. Strategic
Management Journal 21, 429-453.

116
A. APPENDIX A: SUMMARY OF ELECTRICITY RATES

117
Table A-1: Summary of electricity rates

118
B. APPENDIX B- VISION AND MISSION OF T&TEC
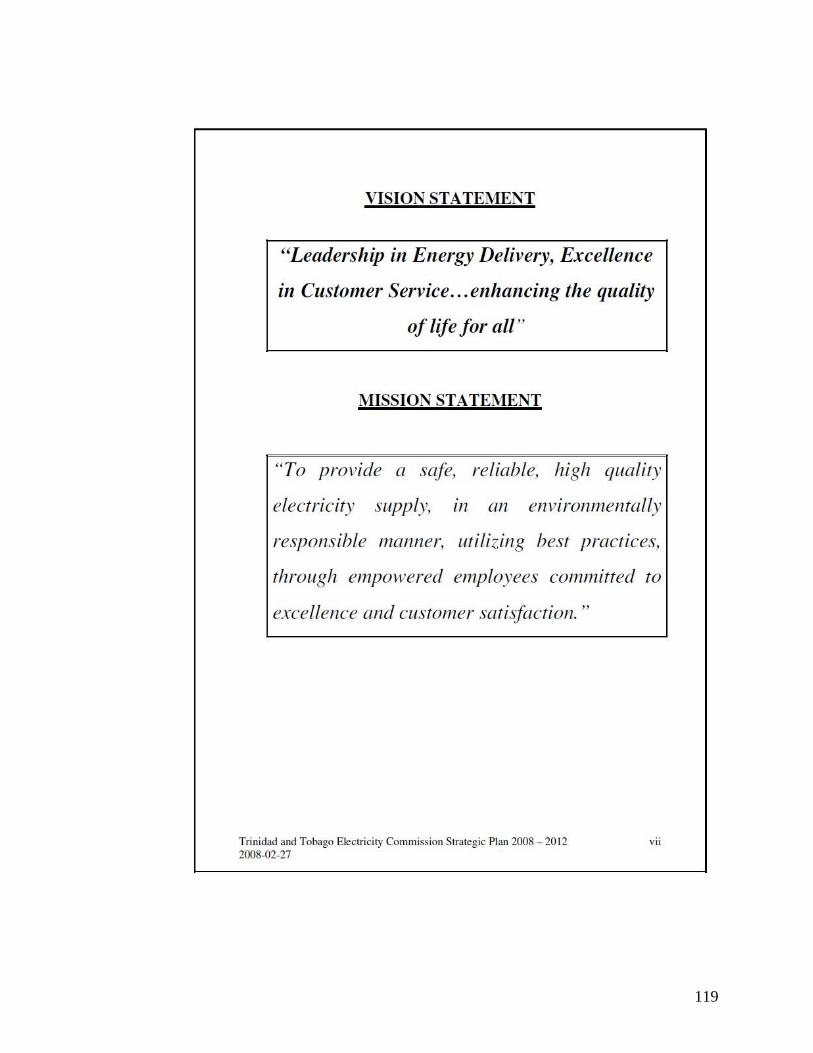
119
120
C. APPENDIX C: CUSTOMER SURVEY
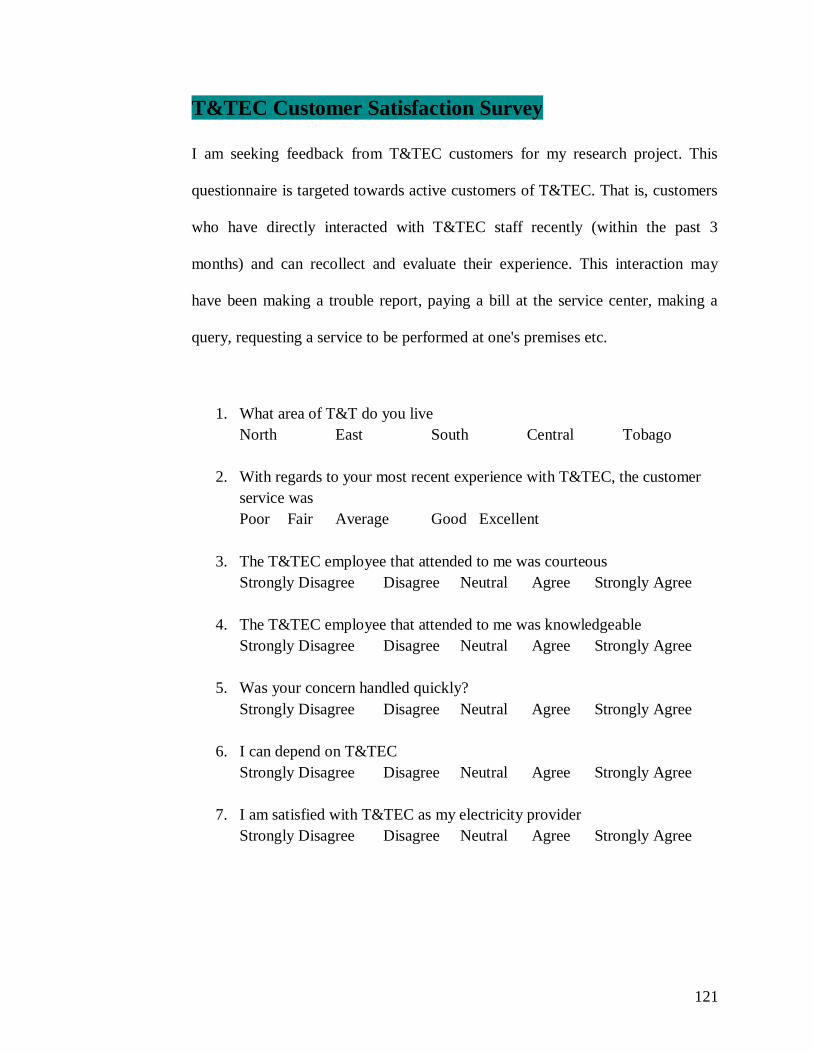
121
T&TEC Customer Satisfaction Survey
I am seeking feedback from T&TEC customers for my research project. This
questionnaire is targeted towards active customers of T&TEC. That is, customers
who have directly interacted with T&TEC staff recently (within the past 3
months) and can recollect and evaluate their experience. This interaction may
have been making a trouble report, paying a bill at the service center, making a
query, requesting a service to be performed at one's premises etc.
1. What area of T&T do you live
North East South Central Tobago
2. With regards to your most recent experience with T&TEC, the customer
service was
Poor Fair Average Good Excellent
3. The T&TEC employee that attended to me was courteous
Strongly Disagree Disagree Neutral Agree Strongly Agree
4. The T&TEC employee that attended to me was knowledgeable
Strongly Disagree Disagree Neutral Agree Strongly Agree
5. Was your concern handled quickly?
Strongly Disagree Disagree Neutral Agree Strongly Agree
6. I can depend on T&TEC
Strongly Disagree Disagree Neutral Agree Strongly Agree
7. I am satisfied with T&TEC as my electricity provider
Strongly Disagree Disagree Neutral Agree Strongly Agree

122
D. APPENDIX D: JOB SATISFACTION QUESTIONNAIRE
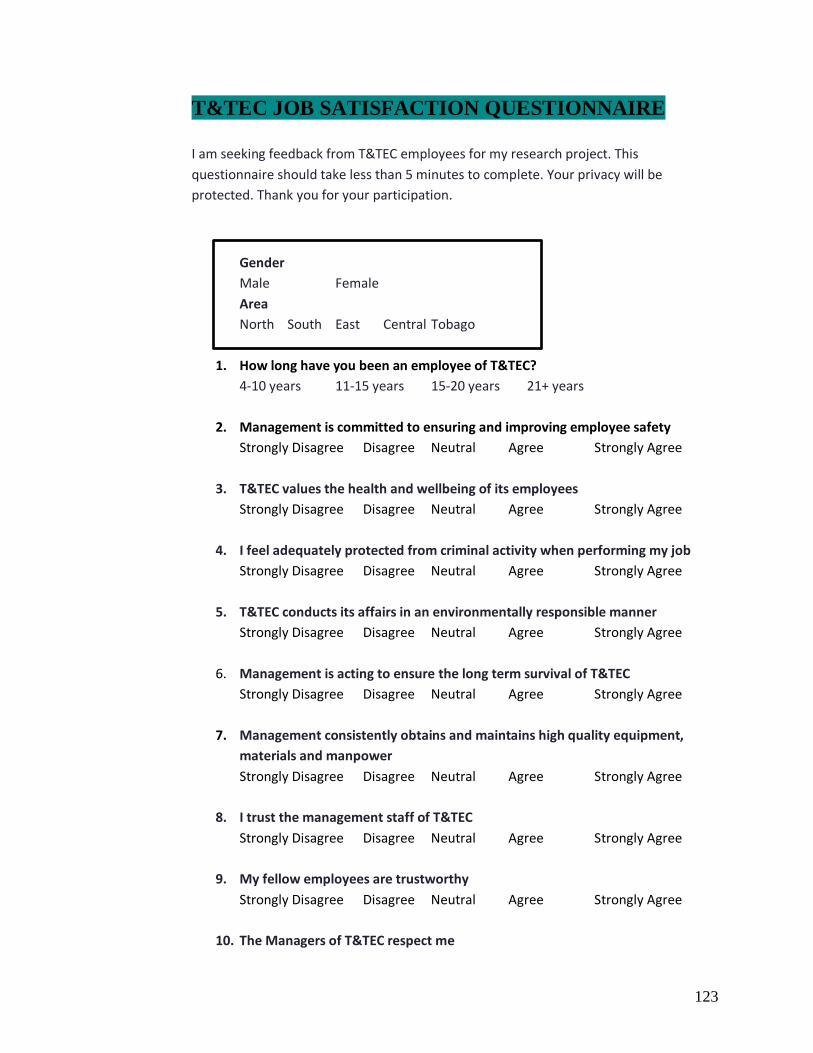
123
T&TEC JOB SATISFACTION QUESTIONNAIRE
I am seeking feedback from T&TEC employees for my research project. This
questionnaire should take less than 5 minutes to complete. Your privacy will be
protected. Thank you for your participation.
Gender
Male Female
Area
North South East Central Tobago
1. How long have you been an employee of T&TEC?
4-10 years 11-15 years 15-20 years 21+ years
2. Management is committed to ensuring and improving employee safety
Strongly Disagree Disagree Neutral Agree Strongly Agree
3. T&TEC values the health and wellbeing of its employees
Strongly Disagree Disagree Neutral Agree Strongly Agree
4. I feel adequately protected from criminal activity when performing my job
Strongly Disagree Disagree Neutral Agree Strongly Agree
5. T&TEC conducts its affairs in an environmentally responsible manner
Strongly Disagree Disagree Neutral Agree Strongly Agree
6. Management is acting to ensure the long term survival of T&TEC
Strongly Disagree Disagree Neutral Agree Strongly Agree
7. Management consistently obtains and maintains high quality equipment,
materials and manpower
Strongly Disagree Disagree Neutral Agree Strongly Agree
8. I trust the management staff of T&TEC
Strongly Disagree Disagree Neutral Agree Strongly Agree
9. My fellow employees are trustworthy
Strongly Disagree Disagree Neutral Agree Strongly Agree
10. The Managers of T&TEC respect me
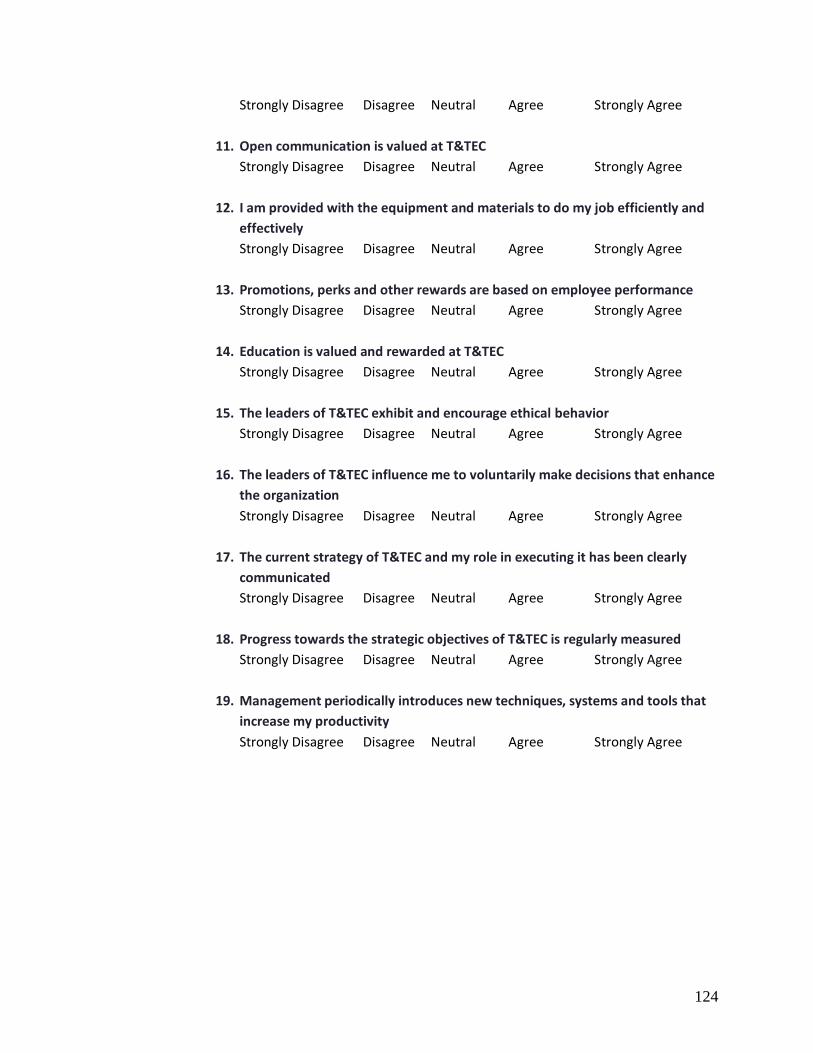
124
Strongly Disagree Disagree Neutral Agree Strongly Agree
11. Open communication is valued at T&TEC
Strongly Disagree Disagree Neutral Agree Strongly Agree
12. I am provided with the equipment and materials to do my job efficiently and
effectively
Strongly Disagree Disagree Neutral Agree Strongly Agree
13. Promotions, perks and other rewards are based on employee performance
Strongly Disagree Disagree Neutral Agree Strongly Agree
14. Education is valued and rewarded at T&TEC
Strongly Disagree Disagree Neutral Agree Strongly Agree
15. The leaders of T&TEC exhibit and encourage ethical behavior
Strongly Disagree Disagree Neutral Agree Strongly Agree
16. The leaders of T&TEC influence me to voluntarily make decisions that enhance
the organization
Strongly Disagree Disagree Neutral Agree Strongly Agree
17. The current strategy of T&TEC and my role in executing it has been clearly
communicated
Strongly Disagree Disagree Neutral Agree Strongly Agree
18. Progress towards the strategic objectives of T&TEC is regularly measured
Strongly Disagree Disagree Neutral Agree Strongly Agree
19. Management periodically introduces new techniques, systems and tools that
increase my productivity
Strongly Disagree Disagree Neutral Agree Strongly Agree
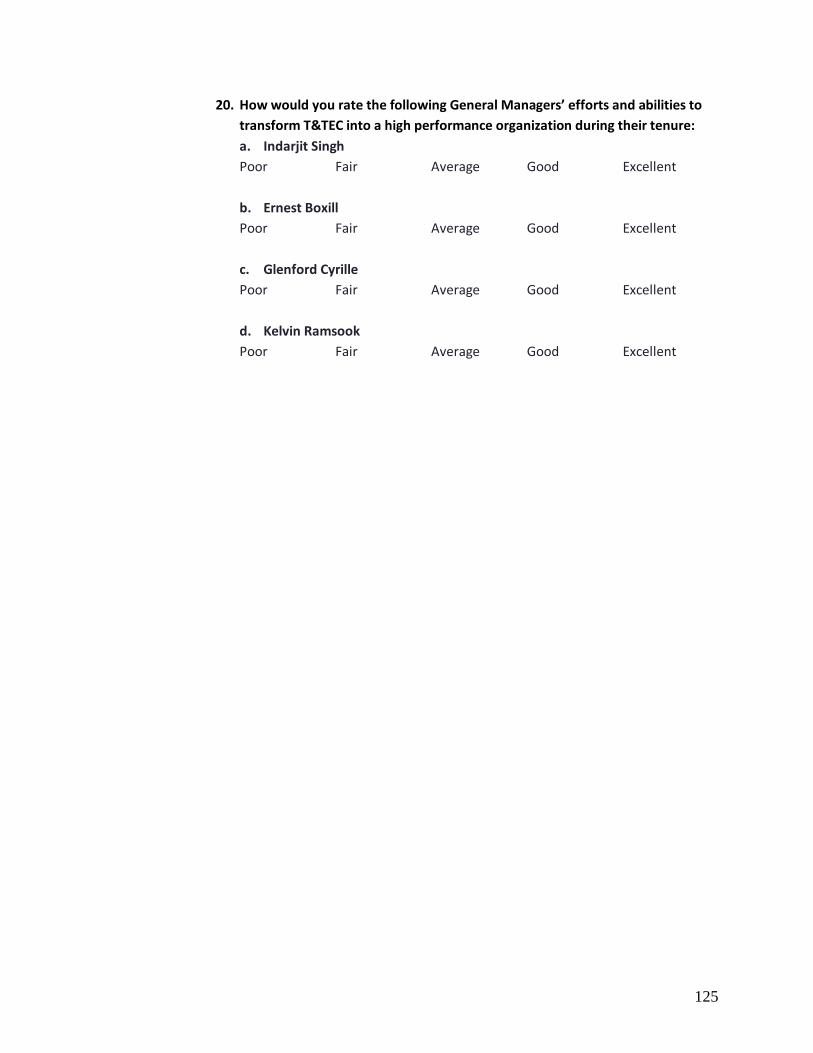
125
20. How would you rate the following General Managers’ efforts and abilities to
transform T&TEC into a high performance organization during their tenure:
a. Indarjit Singh
Poor Fair Average Good Excellent
b. Ernest Boxill
Poor Fair Average Good Excellent
c. Glenford Cyrille
Poor Fair Average Good Excellent
d. Kelvin Ramsook
Poor Fair Average Good Excellent

126
E. APPENDIX E: LIST OF PROJECTS AND ACTIVITIES

127
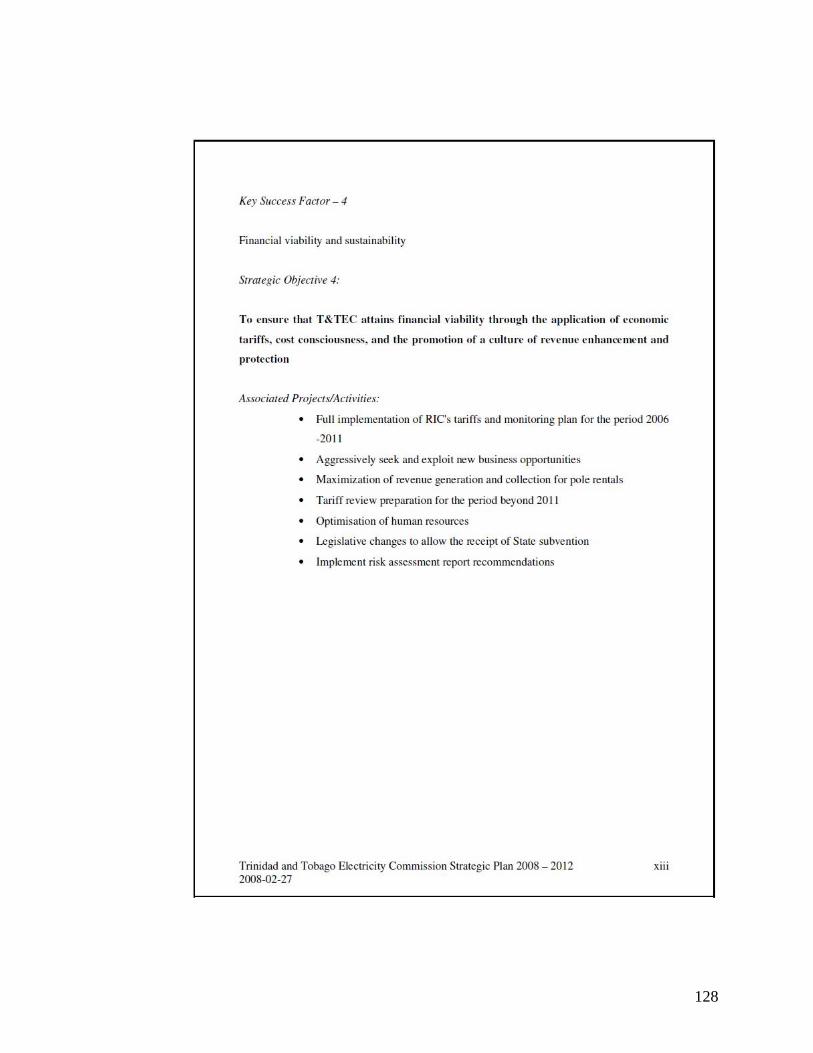
128

129

130
(T&TEC, 2008)

131
F. APPENDIX F: TABLES FOR GRAPHS

132
Financial Ratios
Table F-1: Table showing data used to calculate 7 financial ratios.
Customers per employee and written complaints per 10,000 employees
Quarterly Financial Data
Period Ending Jun-08 Sep-08 Dec-08 Mar-09 Jun-09 Sep-09 Dec-09 Mar-10 Jun-10 Sep-10 Dec-10 Mar-11 Jun-11 Sep-11
Inventories 536,498,584 544,034,989 498,193,011 429,545,685 411,286,447 389,686,895 380,389,508 360,770,278 347,713,915 369,046,563 368,486,214 363,322,448 362,484,461 399,355,329
1,797,107,472 1,741,840,537 1,788,129,262 1,698,780,905 1,518,946,048 1,551,034,360 1,775,494,820 1,705,829,902 1,884,640,472 1,892,322,083 1,892,490,910 1,915,216,992 1,977,176,767 1,985,530,018
Fixed Assets 4,152,668,886 4,300,372,419 4,526,189,313 4,702,081,134 4,877,167,354 4,923,320,782 6,646,144,486 6,061,752,720 6,110,442,205 6,034,926,147 6,897,677,146 6,845,405,360 6,800,193,470 6,738,307,731
Total Assets 5,949,776,358 6,042,212,956 6,314,318,575 6,400,862,039 6,396,113,402 6,474,355,142 8,421,639,306 7,767,582,622 7,995,082,677 7,927,248,230 8,790,168,056 8,760,622,352 8,777,370,237 8,723,837,749
Interest and Finance Charges 51,342,435 51,356,488 44,222,376 43,428,826 43,227,123 43,229,178 56,368,028 70,115,299 70,236,382 27,950,514 137,642,883 77,611,192 76,980,700 77,471,323
Net Income 45,207,175 82,882,377 101,002,140 71,402,438 42,560,353 44,272,889 74,314,701 64,524,035 18,540,799 53,145,695 (106,709,851) 112,395,186 38,455,575 85,016,137
EBIT 96,549,610 134,238,865 145,224,516 114,831,264 85,787,476 87,502,067 130,682,729 134,639,334 88,777,181 81,096,209 30,933,032 190,006,378 115,436,275 162,487,460
2,257,962,007 2,317,676,174 2,634,914,218 2,687,675,433 2,672,641,019 2,768,321,534 2,998,304,499 2,894,254,662 3,116,098,063 3,323,752,990 3,293,236,412 3,228,567,434 3,273,611,522 3,200,586,242
Sales 1,621,925,252 2,015,780,041 2,140,633,326 1,621,554,790 1,692,126,469 1,845,454,481 2,137,341,144 1,965,243,951 1,884,089,690 2,151,005,184 1,910,374,762 2,033,160,144 2,007,362,070 2,189,378,148
0.80 0.75 0.68 0.63 0.57 0.56 0.59 0.59 0.60 0.57 0.57 0.59 0.60 0.62
0.56 0.52 0.49 0.47 0.41 0.42 0.47 0.46 0.49 0.46 0.46 0.48 0.49 0.50
Times Interest Earned Ratio 1.88 2.61 3.28 2.64 1.98 2.02 2.32 1.92 1.26 2.90 0.22 2.45 1.50 2.10
2.79% 4.11% 4.72% 4.40% 2.52% 2.40% 3.48% 3.28% 0.98% 2.47% -5.59% 5.53% 1.92% 3.88%
3.04% 5.49% 6.40% 4.46% 2.66% 2.74% 3.53% 3.32% 0.93% 2.68% -4.86% 5.13% 1.75% 3.90%
Fixed Asset Turnover 1.56 1.87 1.89 1.38 1.39 1.50 1.29 1.30 1.23 1.43 1.11 1.19 1.18 1.30
Total Asset Turnover 1.09 1.33 1.36 1.01 1.06 1.14 1.02 1.01 0.94 1.09 0.87 0.93 0.91 1.00
Total Current Assets
Current Liabilities
Current Ratio
Quick Ratio
Net Profit Margin
Return on Assets (ROA)

133
Table F-2: Data used to calculate customers per employee ratio and written complaints per 10,000 customers
Period Ending Written Complaints Number of employeesNumber of
customers
Customers per
employee
Written complaints
per 10,000
customers
31-Mar 80
Jun-08 80 2589 393155 151.86 2.0348
30-Sep 104 2613 395849 151.49 2.6273
Dec-08 118 2622 399092 152.21 2.9567
31-Mar 75 2610 401995 154.02 1.8657
Jun-09 113 2623 404573 154.24 2.7931
30-Sep 81 2649 406771 153.56 1.9913
Dec-09 79 2667 408826 153.29 1.9324
31-Mar 101 2679 411005 153.42 2.4574
Jun-10 110 2680 409676 152.86 2.6850
30-Sep 96 2659 414796 156.00 2.3144
Dec-10 111 2689 417108 155.12 2.6612
31-Mar 57 2583 419023 162.22 1.3603
Jun-11 93 2680 421122 157.14 2.2084
30-Sep 96 2687 422913 157.39 2.2700
Dec-11 74
Estimated figure because this document was missing from the records at T&TEC's library

134
Reported, recordable and severity safety indexes
Table F-3: Data used to calculate reported, recordable and severity safety indexes
Period man hrs recordable reported days lost FREQUENCY INCIDENT SEVERITY
Q1 08 1325.565 9 16 79 1.358 2.414 11.919
Q2 08 1325.555 15 22 345 2.263 3.319 52.054
Q3 08 1325.55 30 35 191 4.526 5.281 28.818
Q4 08 1641.818 9 13 220 1.096 1.584 26.800
Q1 09 1464.485 8 23 69 1.093 3.141 9.423
Q2 09 2433.467 14 33 90 1.151 2.712 7.397
Q3 09 1594.67 6 26 33 0.753 3.261 4.139
Q4 09 1509.706 8 17 118 1.060 2.252 15.632
Q1 10 1510.984 45 61 397 5.956 8.074 52.549
Q2 10 1540.819 12 26 187 1.558 3.375 24.273
Q3 10 1586.179 13 19 314 1.639 2.396 39.592
Q4 10 1591.553 5 17 494 0.628 2.136 62.078
Q1 11 1516.552 17 27 177 2.242 3.561 23.342
Q2 11 1456.023 7 19 324 0.962 2.610 44.505
Q3 11 1538.186 9 16 438 1.170 2.080 56.950
Q4 11 1517.691 8 18 589 1.054 2.372 77.618

135
G. APPENDIX G: FREEDOM OF INFORMATION ACT

136

137

138

139
(Government of the Republic of Trinidad and Tobago, 2011)

140
H. APPENDIX H: CORRELATION TABLE

141
Table showing correlation of performance data with strategic leadership
Table H-1: Correlation of performance data with strategic leadership
Legend (negative or positive) 0<x<0.4 weak correlation, 0.4<x<0.7 moderate correlation, 0.7<x<1 strong correlation
PeriodLeadership
scoreFREQUENCY INCIDENT SEVERITY
Customers
per employee
Written
Complaints per
10,000
customers
Current
RatioQuick Ratio
Times
Interest
Earned Ratio
Net Profit
Margin
Return on
Assets
(ROA)
Fixed Asset
Turnover
Total Asset
Turnover
Mar-08 1.29 1.358 2.414 11.919
Jun-08 1.29 2.263 3.319 52.054 151.86 2.035 0.796 0.558 1.881 0.028 0.030 1.562 1.090
Sep-08 1.41 4.526 5.281 28.818 151.49 2.627 0.752 0.517 2.614 0.041 0.055 1.875 1.334
Dec-08 1.46 1.096 1.584 26.800 152.21 2.957 0.679 0.490 3.284 0.047 0.064 1.892 1.356
Mar-09 1.46 1.093 3.141 9.423 154.02 1.866 0.632 0.472 2.644 0.044 0.045 1.379 1.013
Jun-09 1.46 1.151 2.712 7.397 154.24 2.793 0.568 0.414 1.985 0.025 0.027 1.388 1.058
Sep-09 1.46 0.753 3.261 4.139 153.56 1.991 0.560 0.420 2.024 0.024 0.027 1.499 1.140
Dec-09 2.57 1.060 2.252 15.632 153.29 1.932 0.592 0.465 2.318 0.035 0.035 1.286 1.015
Mar-10 1.52 5.956 8.074 52.549 153.42 2.457 0.589 0.465 1.920 0.033 0.033 1.297 1.012
Jun-10 1.29 1.558 3.375 24.273 152.86 2.685 0.605 0.493 1.264 0.010 0.009 1.233 0.943
Sep-10 1.29 1.639 2.396 39.592 156.00 2.314 0.569 0.458 2.901 0.025 0.027 1.426 1.085
Dec-10 1.29 0.628 2.136 62.078 155.12 2.661 0.575 0.463 0.225 -0.056 -0.049 1.108 0.869
Mar-11 2.57 2.242 3.561 23.342 162.22 1.360 0.593 0.481 2.448 0.055 0.051 1.188 0.928
Jun-11 2.19 0.962 2.610 44.505 157.14 2.208 0.604 0.493 1.500 0.019 0.018 1.181 0.915
Sep-11 2.57 1.170 2.080 56.950 157.39 2.270 0.620 0.496 2.097 0.039 0.039 1.300 1.004
Dec-11 2.11 1.054 2.372 77.618
Correlation
Coefficient -0.152 -0.178 0.171 0.642 -0.553 -0.216 0.034 0.114 0.370 0.269 -0.381 -0.327
customer service datasafety data financial performance data
142
I. APPENDIX I: TREND OF FINANCIAL RATIOS

143
Liquidity and Debt Service Ratios
0.000
0.100
0.200
0.300
0.400
0.500
0.600
0.700
0.800
0.900
Mar
-08
Jul-
08
No
v-0
8
Mar
-09
Jul-
09
No
v-0
9
Mar
-10
Jul-
10
No
v-1
0
Mar
-11
Jul-
11
No
v-1
1
Current Ratio
Quick Ratio
Linear (Current Ratio)
Linear (Quick Ratio)
0.000
0.500
1.000
1.500
2.000
2.500
3.000
3.500
Mar
-08
Jul-
08
No
v-0
8
Mar
-09
Jul-
09
No
v-0
9
Mar
-10
Jul-
10
No
v-1
0
Mar
-11
Jul-
11
No
v-1
1Times Interest Earned Ratio
Times Interest EarnedRatio
Linear (Times InterestEarned Ratio)

144
Profitability and Asset Management Ratios
Figure I-1: Graphs showing declining financial trend
-0.080
-0.060
-0.040
-0.020
0.000
0.020
0.040
0.060
0.080
Mar
-08
Jul-
08
No
v-0
8
Mar
-09
Jul-
09
No
v-0
9
Mar
-10
Jul-
10
No
v-1
0
Mar
-11
Jul-
11
No
v-1
1
Net Profit Margin
Return on Assets(ROA)
Linear (Return onAssets (ROA))
0.000
0.200
0.400
0.600
0.800
1.000
1.200
1.400
1.600
1.800
2.000
Mar
-08
Jul-
08
No
v-0
8
Mar
-09
Jul-
09
No
v-0
9
Mar
-10
Jul-
10
No
v-1
0
Mar
-11
Jul-
11
No
v-1
1
Fixed Asset Turnover
Total Asset Turnover
Linear (Fixed AssetTurnover)
Linear (Total AssetTurnover)