Organizational Initiatives Towards Developing … 2015/Sympo...Organizational Initiatives Towards...
29
Organizational Initiatives Towards Developing Greener Processes for Generic Active Pharmaceutical Ingredients IGCW, DEC 4-5, 2015 Vilas H Dahanukar, Ph.D., FRSC Chief Scientist Process R&D GOOD HEALTH CAN’T WAIT.
Transcript of Organizational Initiatives Towards Developing … 2015/Sympo...Organizational Initiatives Towards...
Organizational Initiatives Towards
Developing Greener Processes for
Generic Active Pharmaceutical
Ingredients
IGCW, DEC 4-5, 2015
Vilas H Dahanukar, Ph.D., FRSC
Chief Scientist Process R&D
G O O D H E A LT H CAN ’ T W A I T.
2
• Background
• Introduction to Quality by Design and Six Sigma
• Work practices developed at DRL
• Case study highlighting example of greener
processes using QbD
PRESENTATION OUTLINE
3
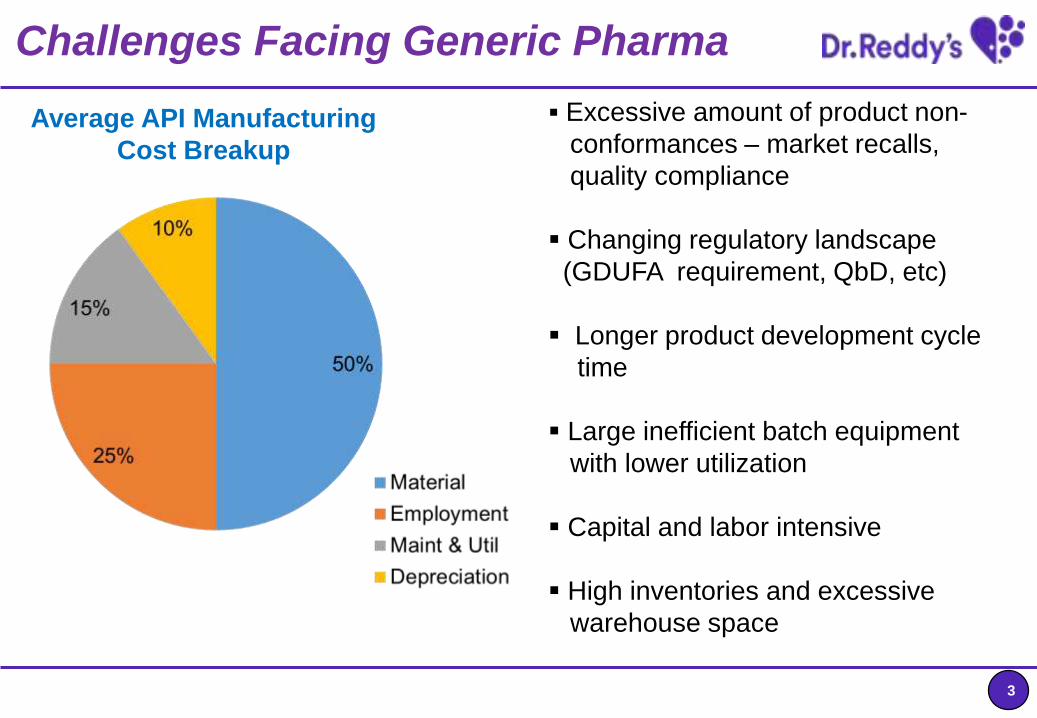
Average API Manufacturing
Cost Breakup
Excessive amount of product non-
conformances – market recalls,
quality compliance
Changing regulatory landscape
(GDUFA requirement, QbD, etc)
Longer product development cycle
time
Large inefficient batch equipment
with lower utilization
Capital and labor intensive
High inventories and excessive
warehouse space
Challenges Facing Generic Pharma
4
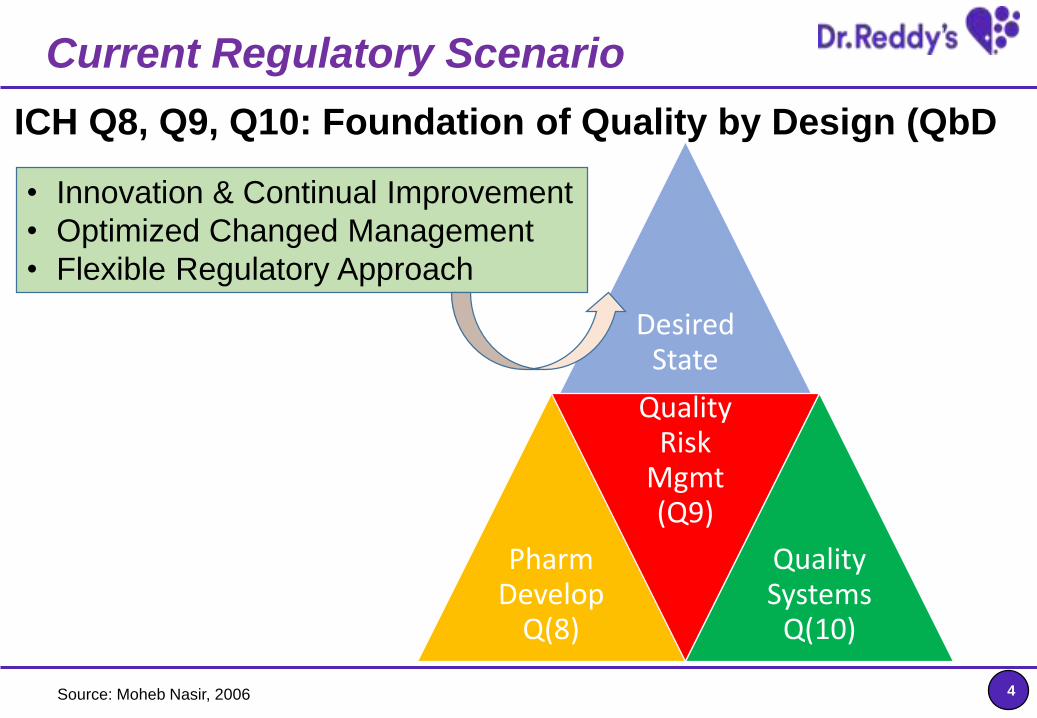
Desired State
Pharm Develop
Q(8)
Quality Risk
Mgmt(Q9)
Quality Systems
Q(10)
ICH Q8, Q9, Q10: Foundation of Quality by Design (QbD
Current Regulatory Scenario
• Innovation & Continual Improvement
• Optimized Changed Management
• Flexible Regulatory Approach
Source: Moheb Nasir, 2006
5
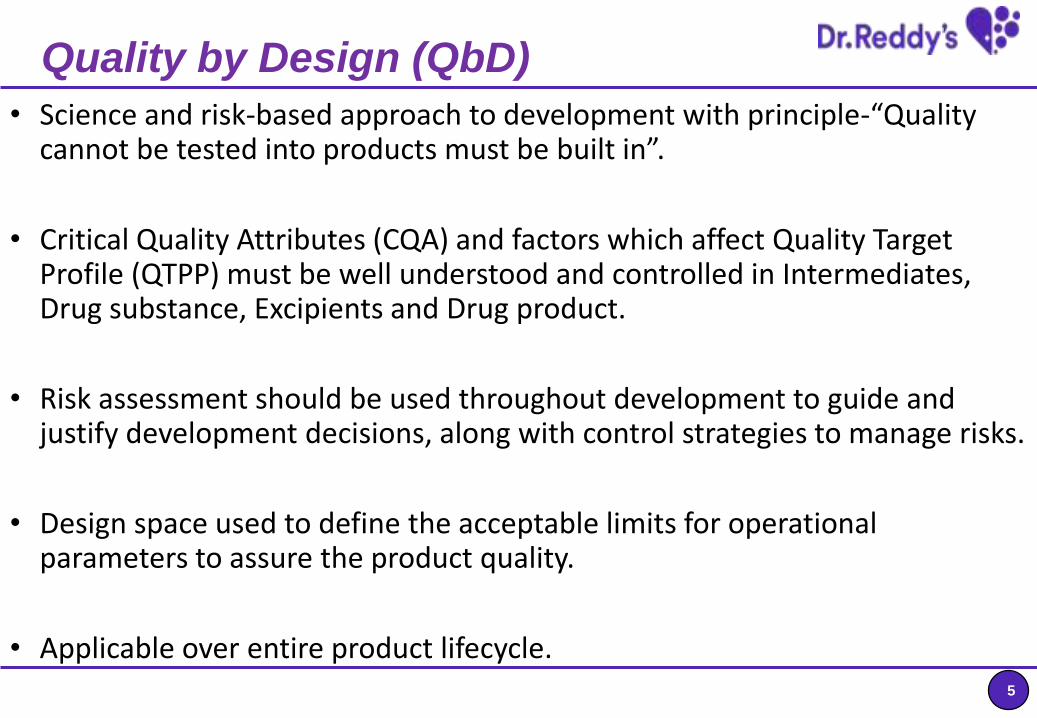
Quality by Design (QbD)
• Science and risk-based approach to development with principle-“Quality cannot be tested into products must be built in”.
• Critical Quality Attributes (CQA) and factors which affect Quality Target Profile (QTPP) must be well understood and controlled in Intermediates, Drug substance, Excipients and Drug product.
• Risk assessment should be used throughout development to guide and justify development decisions, along with control strategies to manage risks.
• Design space used to define the acceptable limits for operational parameters to assure the product quality.
• Applicable over entire product lifecycle.
6
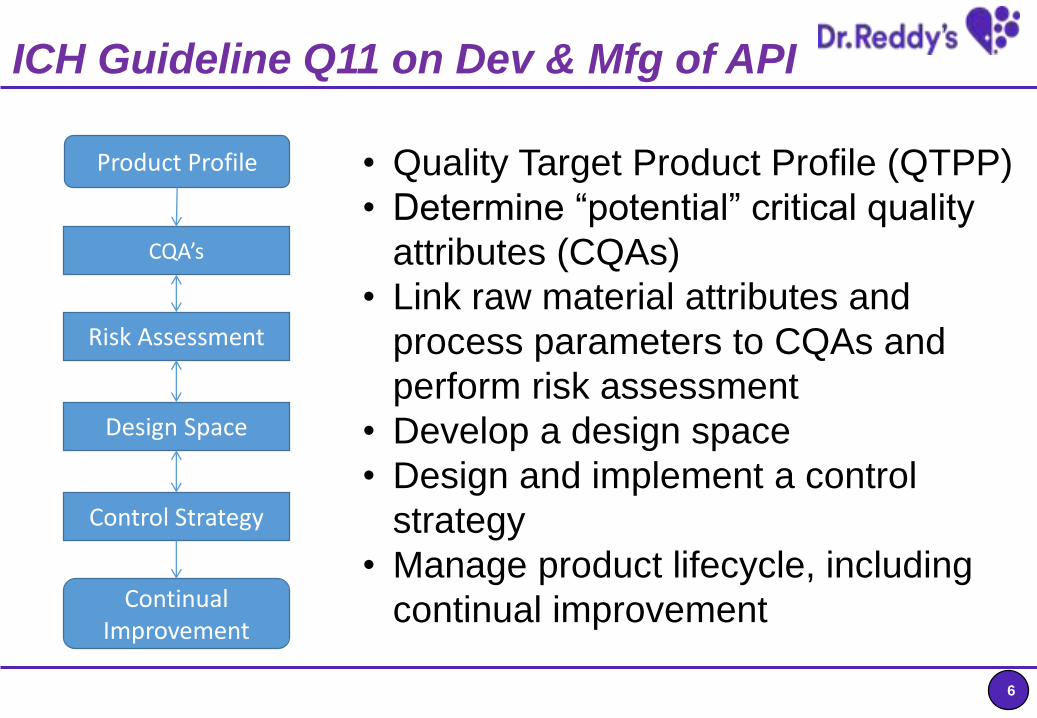
• Quality Target Product Profile (QTPP)
• Determine “potential” critical quality
attributes (CQAs)
• Link raw material attributes and
process parameters to CQAs and
perform risk assessment
• Develop a design space
• Design and implement a control
strategy
• Manage product lifecycle, including
continual improvementContinual Improvement
CQA’s
Risk Assessment
Design Space
Control Strategy
Product Profile
ICH Guideline Q11 on Dev & Mfg of API
7
WHAT IS DOE?
• Designed set of experiments in which all relevant factors (variables that influence response) are varied simultaneously instead of traditional OVAT (one variable at a time)
• Analysis indicate which factors influence the outcome and identifies optimal conditions
• Systematic, organized approach to process optimization & designing robust processes
• Mathematical model of the design space
• Screening• Which factors are most influential ?
• What are their appropriate values/ranges ?
• Optimization• Extract information regarding how factors combine to influence response
• Identify optimized reaction conditions
• Automation/technology helps reduce the effort needed

8
CONTROL STRATEGY
Nature of Control Extent of Control
Design Space: Multidimensional combination and
interaction of input variables (e.g., material attributes) and
process parameters that have been demonstrated to
provide assurance of quality (derived from DoE)
Design Control: Controls implemented to avoid/exclude
the potential failure scenario(s), viz., selecting the route,
including an unit operation, excluding temperature zone.
Process Control: Controlled through Edge of Failure
(EOF)/What-if studies, and suitable validatable sampling
plan and test procedure (controls on CMA and CPP, in-
process controls)
System Control: Evaluated through sampling protocol; eg.
in process sampling, GLP and GMP controls in plant
• PAR > NOR
• PAR = NOR
• PAR # NOR
• PAR < NOR
9
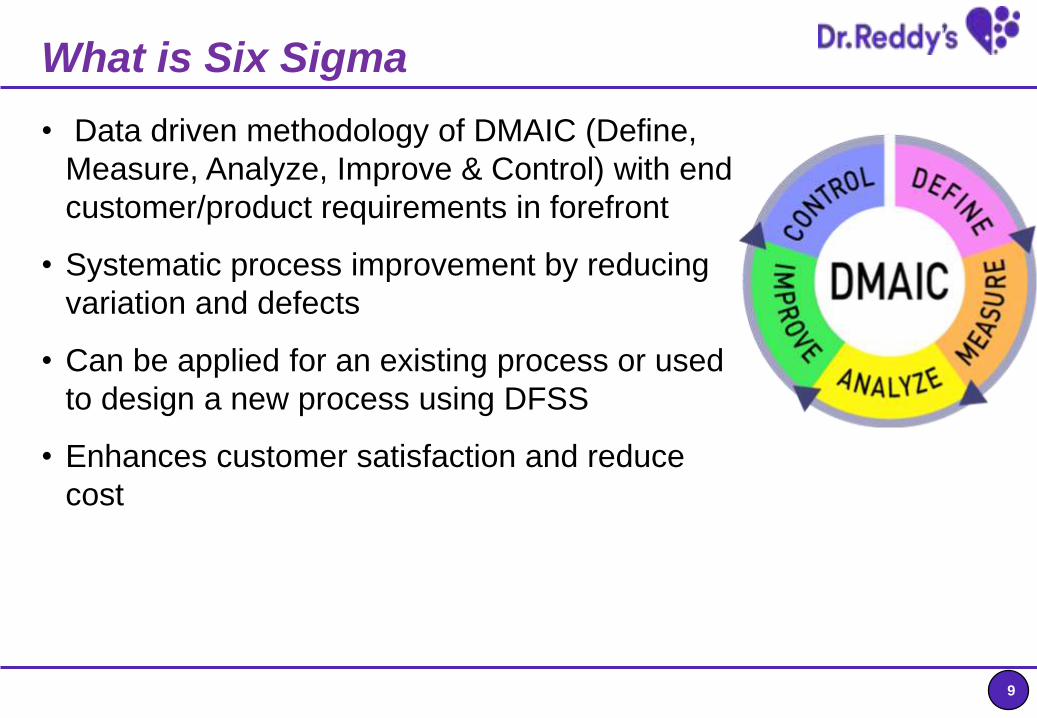
• Data driven methodology of DMAIC (Define,
Measure, Analyze, Improve & Control) with end
customer/product requirements in forefront
• Systematic process improvement by reducing
variation and defects
• Can be applied for an existing process or used
to design a new process using DFSS
• Enhances customer satisfaction and reduce
cost
What is Six Sigma
10
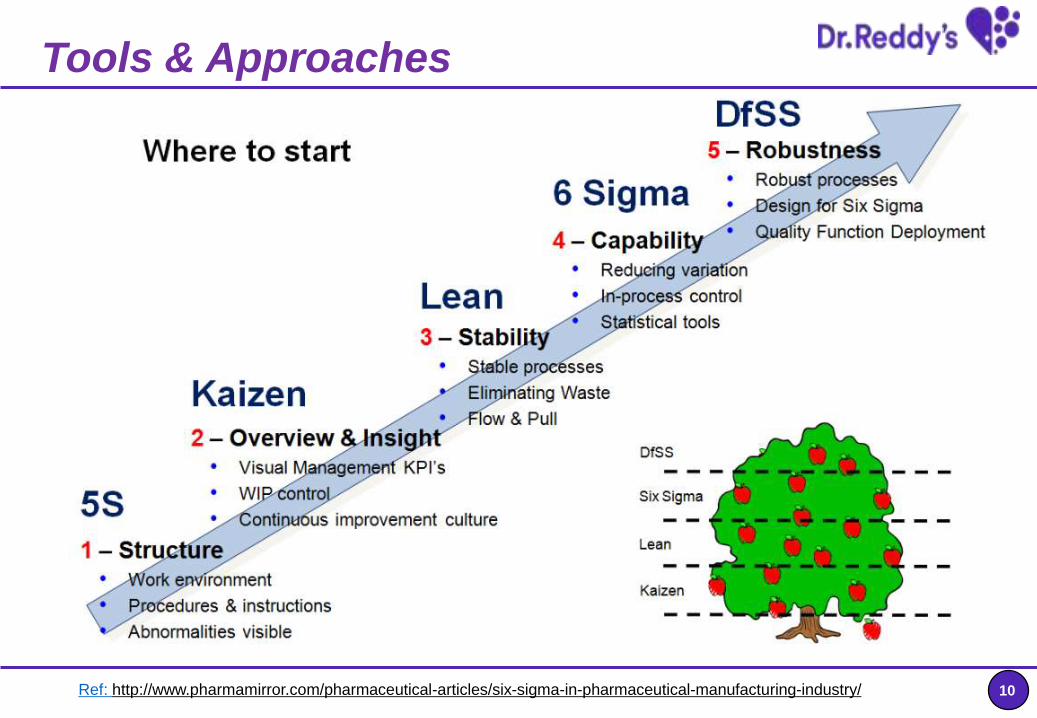
Tools & Approaches
Ref: http://www.pharmamirror.com/pharmaceutical-articles/six-sigma-in-pharmaceutical-manufacturing-industry/
11
OVERVIEW OF WORK PRACTICES AT DRL
12
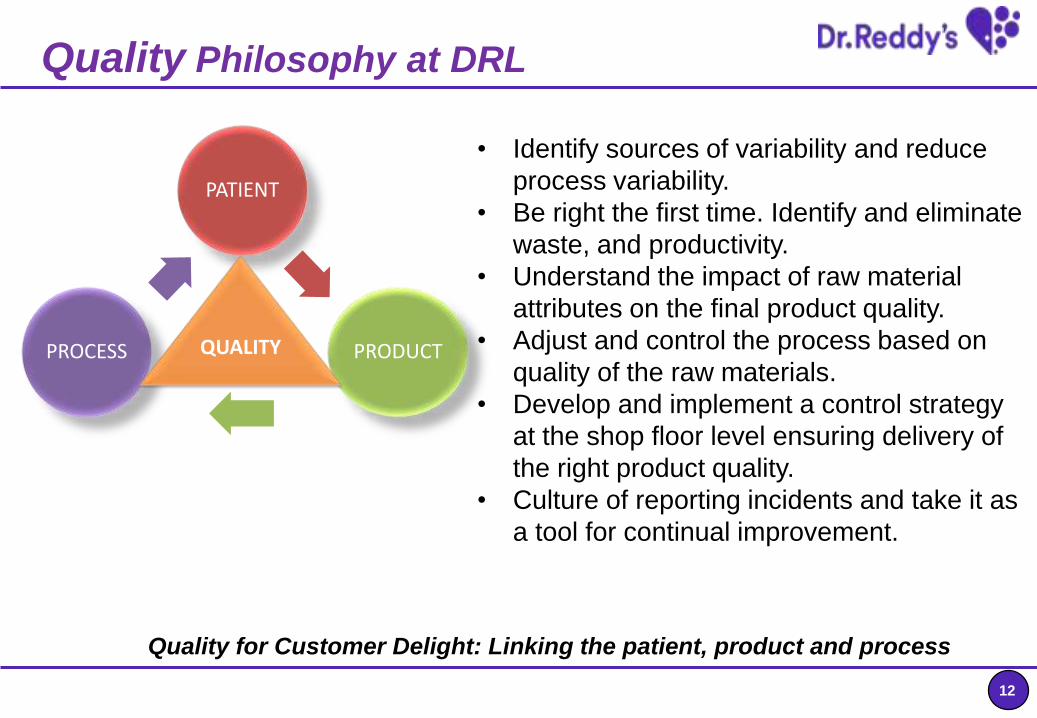
Quality Philosophy at DRL
• Identify sources of variability and reduce
process variability.
• Be right the first time. Identify and eliminate
waste, and productivity.
• Understand the impact of raw material
attributes on the final product quality.
• Adjust and control the process based on
quality of the raw materials.
• Develop and implement a control strategy
at the shop floor level ensuring delivery of
the right product quality.
• Culture of reporting incidents and take it as
a tool for continual improvement.
Quality for Customer Delight: Linking the patient, product and process
PATIENT
PRODUCTPROCESS A T
13
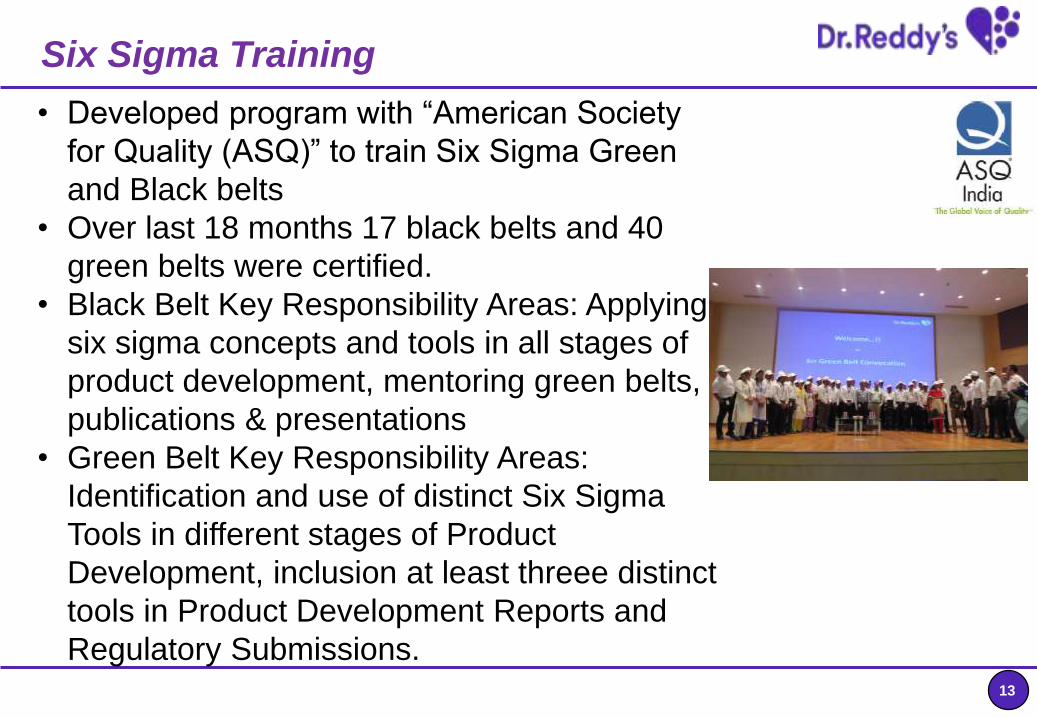
Six Sigma Training
• Developed program with “American Society
for Quality (ASQ)” to train Six Sigma Green
and Black belts
• Over last 18 months 17 black belts and 40
green belts were certified.
• Black Belt Key Responsibility Areas: Applying
six sigma concepts and tools in all stages of
product development, mentoring green belts,
publications & presentations
• Green Belt Key Responsibility Areas:
Identification and use of distinct Six Sigma
Tools in different stages of Product
Development, inclusion at least threee distinct
tools in Product Development Reports and
Regulatory Submissions.

14
Generic API Development
•Literature & Patent survey
•Product Development Strategy
•Route identification (BI metrics & cost models)
•Raw Material identification & sourcing
•Feasibility
•Optimization (Solvent, Reagent Selection, DoE, Design space)
•Analytical method development (DoE)
•Validated Method dev
•Trial & validation
•Stability studies
•Polymorph
•Salt
Risk Assessment & control with documented data
done at each stage in API development cycle
Define Research Design Develop Implement
Product selectionForm
selectionProcess
DevelopmentTechnology
TransferValidation & DMF filing
•Scale up FMEA

15
QbD Enabled Product Development
API
Product
Develop
ment
Next Project Route selection metrics QTPP OEL ( safety, impurity limits)
Solvent Selection ( Prior knowledge, Principal component analysis); Reagent Selection
Brainstorming prior to parameter selection ( FMEA, Pareto analysis)
Factors selection for DOE ( Mechanistic understanding, Cause & Effect analysis)
Screening & optimisation DOE ( Choice of design based on nature of reaction)
Calorimetric studies ( Safety & QA) Linking intermediate CQA , CMA with
product CQA ( Matrix diagrams) Impurity tracker ( Defining key, critical,
non-critical, GTA, cutt-off imp’s) PMI tracker
Scale dependent and independent parameters
Scale up FMEA Specifications ( NOR,
PAR, Process capability) Control Strategy
(Process, equipment, Inprocess)
Inprocess and Spec trend analysis
Scale dependency of critical parameters
Confirmation of design space on scale
Route selection &
Feasibility

16
ROUTE SELECTION METRICS
No. Parameter Variable Criterion Points Route A Route B Route C
1Reaction Mass Intensity(total wt of reactionmaterials/wt of product)
Does any stages have RMIgreater than 5?
No/Yes 10/7 10 10 10
2Process Mass Intensity(mass of materialsin/mass of product)
Does any stage has PMIgreater than 20 ?
Yes/No 10/7 7 7 3
3 YieldAny stages have yield lessthan 80% ?
No/Yes 10/7 8 8 4
4 Starting Materials
Are all raw materialsreadily available andinexpensive (individualcontribution of less than20% to total RMC)??
Yes/No 10 /7 7 7 7
5Use of HazardousReagents
Any hazardous reagentsused?
No /Yes 10/7 10 10 10
6 Intermediates
Does route involvesintermediates with poorphysical and chemicalproperties?
Yes/No 10/7 8 8 8
Org. Process Res. Dev . 2012,16, 1697
17
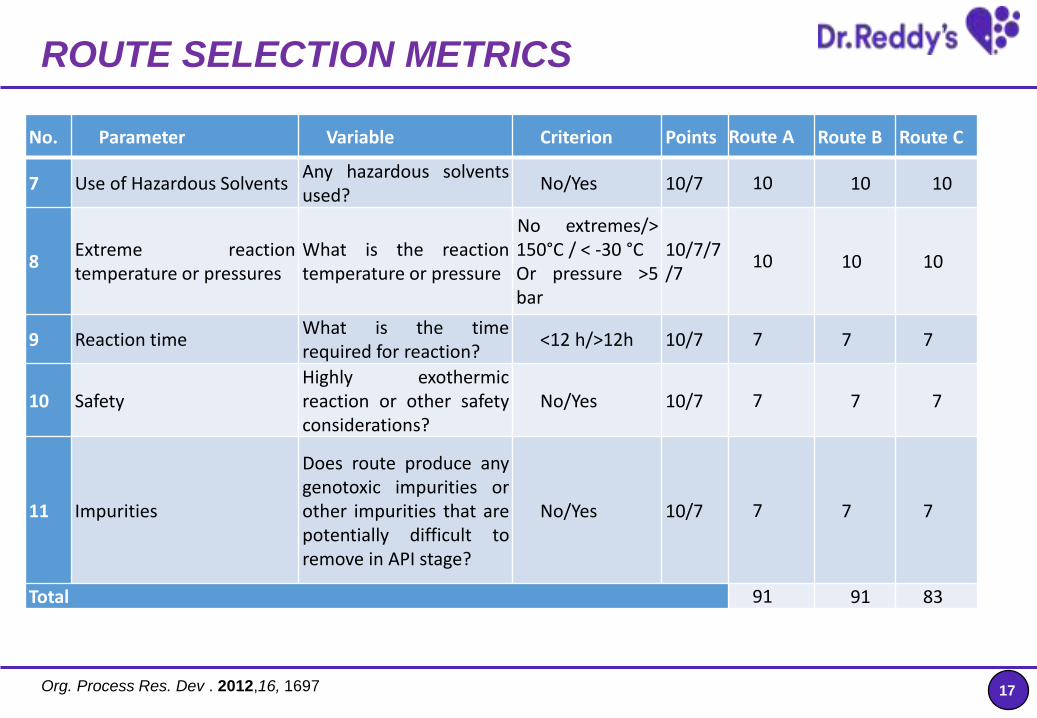
ROUTE SELECTION METRICS
No. Parameter Variable Criterion Points Route A Route B Route C
7 Use of Hazardous SolventsAny hazardous solventsused?
No/Yes 10/7 10 10 10
8Extreme reactiontemperature or pressures
What is the reactiontemperature or pressure
No extremes/>150°C / < -30 °COr pressure >5bar
10/7/7/7
10 10 10
9 Reaction timeWhat is the timerequired for reaction?
<12 h/>12h 10/7 7 7 7
10 SafetyHighly exothermicreaction or other safetyconsiderations?
No/Yes 10/7 7 7 7
11 Impurities
Does route produce anygenotoxic impurities orother impurities that arepotentially difficult toremove in API stage?
No/Yes 10/7 7 7 7
Total 91 91 83
Org. Process Res. Dev . 2012,16, 1697
18
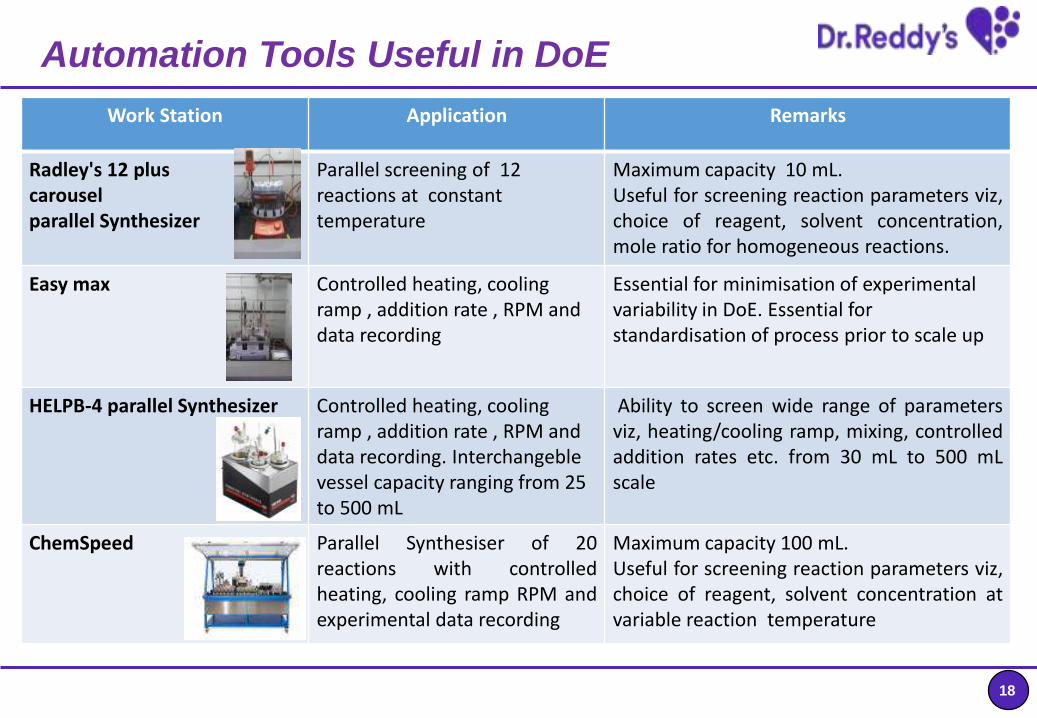
Automation Tools Useful in DoE
Work Station Application Remarks
Radley's 12 plus carousel parallel Synthesizer
Parallel screening of 12 reactions at constant temperature
Maximum capacity 10 mL.Useful for screening reaction parameters viz,choice of reagent, solvent concentration,mole ratio for homogeneous reactions.
Easy max Controlled heating, cooling ramp , addition rate , RPM and data recording
Essential for minimisation of experimental variability in DoE. Essential for standardisation of process prior to scale up
HELPB-4 parallel Synthesizer Controlled heating, cooling ramp , addition rate , RPM and data recording. Interchangeblevessel capacity ranging from 25 to 500 mL
Ability to screen wide range of parametersviz, heating/cooling ramp, mixing, controlledaddition rates etc. from 30 mL to 500 mLscale
ChemSpeed Parallel Synthesiser of 20reactions with controlledheating, cooling ramp RPM andexperimental data recording
Maximum capacity 100 mL.Useful for screening reaction parameters viz,choice of reagent, solvent concentration atvariable reaction temperature
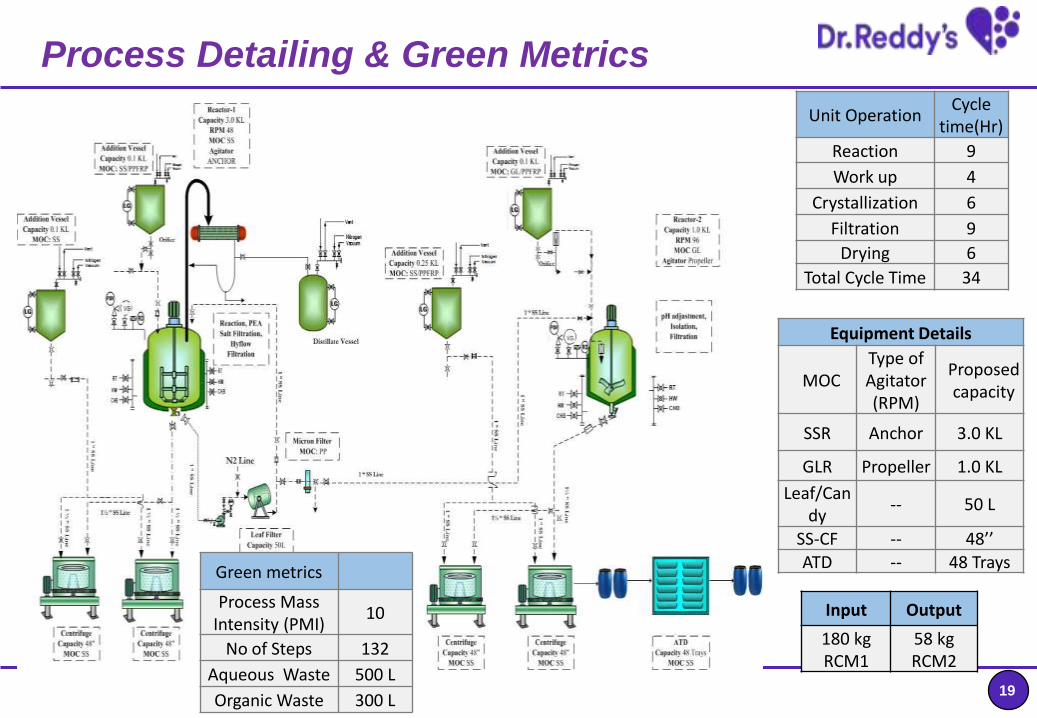
19
Equipment Details
MOC Type of Agitator (RPM)
Proposed capacity
SSR Anchor 3.0 KL
GLR Propeller 1.0 KL
Leaf/Candy
-- 50 L
SS-CF -- 48’’
ATD -- 48 Trays
Unit OperationCycle
time(Hr)
Reaction 9
Work up 4
Crystallization 6
Filtration 9
Drying 6
Total Cycle Time 34
Input Output
180 kgRCM1
58 kg RCM2
Process Detailing & Green Metrics
Green metrics
Process Mass Intensity (PMI)
10
No of Steps 132
Aqueous Waste 500 L
Organic Waste 300 L
20
CASE STUDY: OPTIMIZATION OF CHEMICAL
REACTION USING DoE
21
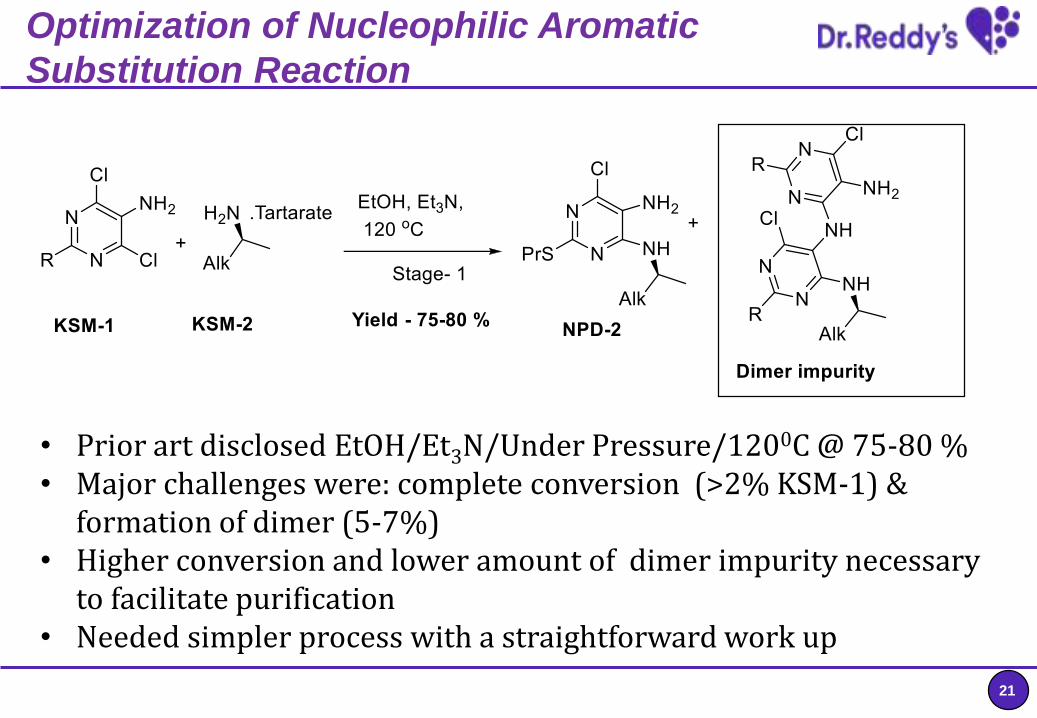
Optimization of Nucleophilic Aromatic
Substitution Reaction
• Prior art disclosed EtOH/Et3N/Under Pressure/1200C @ 75-80 %• Major challenges were: complete conversion (>2% KSM-1) &
formation of dimer (5-7%)• Higher conversion and lower amount of dimer impurity necessary
to facilitate purification• Needed simpler process with a straightforward work up
22
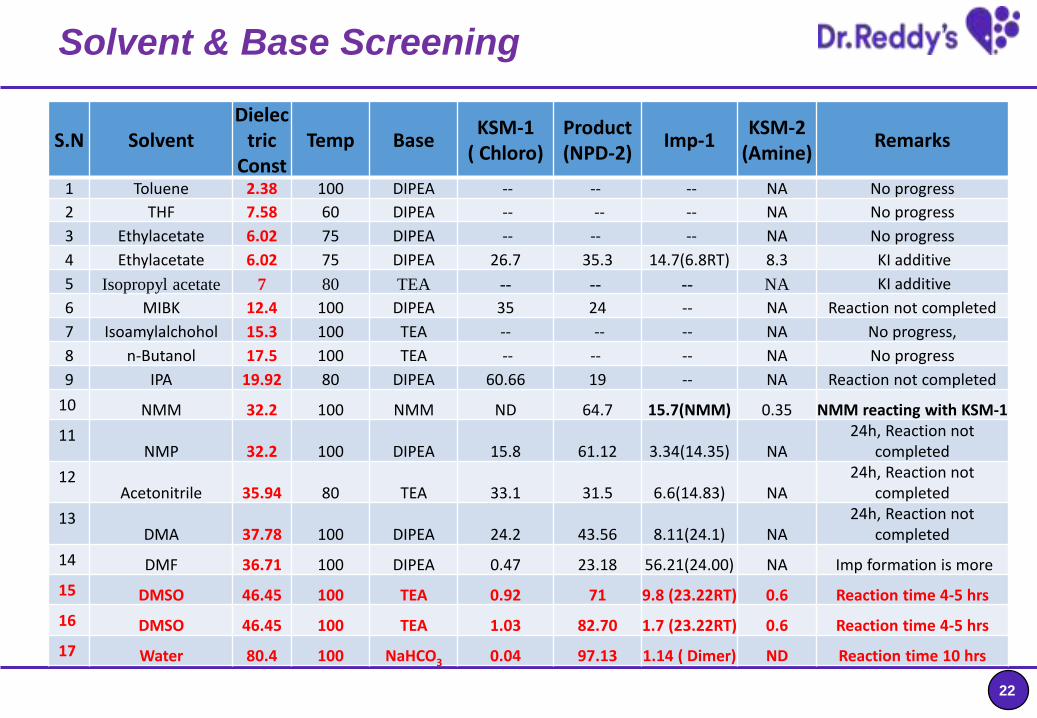
Solvent & Base Screening
S.N Solvent Dielec
tric Const
Temp BaseKSM-1
( Chloro)Product (NPD-2)
Imp-1KSM-2
(Amine)Remarks
1 Toluene 2.38 100 DIPEA -- -- -- NA No progress
2 THF 7.58 60 DIPEA -- -- -- NA No progress
3 Ethylacetate 6.02 75 DIPEA -- -- -- NA No progress
4 Ethylacetate 6.02 75 DIPEA 26.7 35.3 14.7(6.8RT) 8.3 KI additive
5 Isopropyl acetate 7 80 TEA -- -- -- NA KI additive
6 MIBK 12.4 100 DIPEA 35 24 -- NA Reaction not completed
7 Isoamylalchohol 15.3 100 TEA -- -- -- NA No progress,
8 n-Butanol 17.5 100 TEA -- -- -- NA No progress
9 IPA 19.92 80 DIPEA 60.66 19 -- NA Reaction not completed
10 NMM 32.2 100 NMM ND 64.7 15.7(NMM) 0.35 NMM reacting with KSM-1
11NMP 32.2 100 DIPEA 15.8 61.12 3.34(14.35) NA
24h, Reaction not completed
12Acetonitrile 35.94 80 TEA 33.1 31.5 6.6(14.83) NA
24h, Reaction not completed
13DMA 37.78 100 DIPEA 24.2 43.56 8.11(24.1) NA
24h, Reaction not completed
14 DMF 36.71 100 DIPEA 0.47 23.18 56.21(24.00) NA Imp formation is more
15 DMSO 46.45 100 TEA 0.92 71 9.8 (23.22RT) 0.6 Reaction time 4-5 hrs
16 DMSO 46.45 100 TEA 1.03 82.70 1.7 (23.22RT) 0.6 Reaction time 4-5 hrs
17 Water 80.4 100 NaHCO3 0.04 97.13 1.14 ( Dimer) ND Reaction time 10 hrs
23
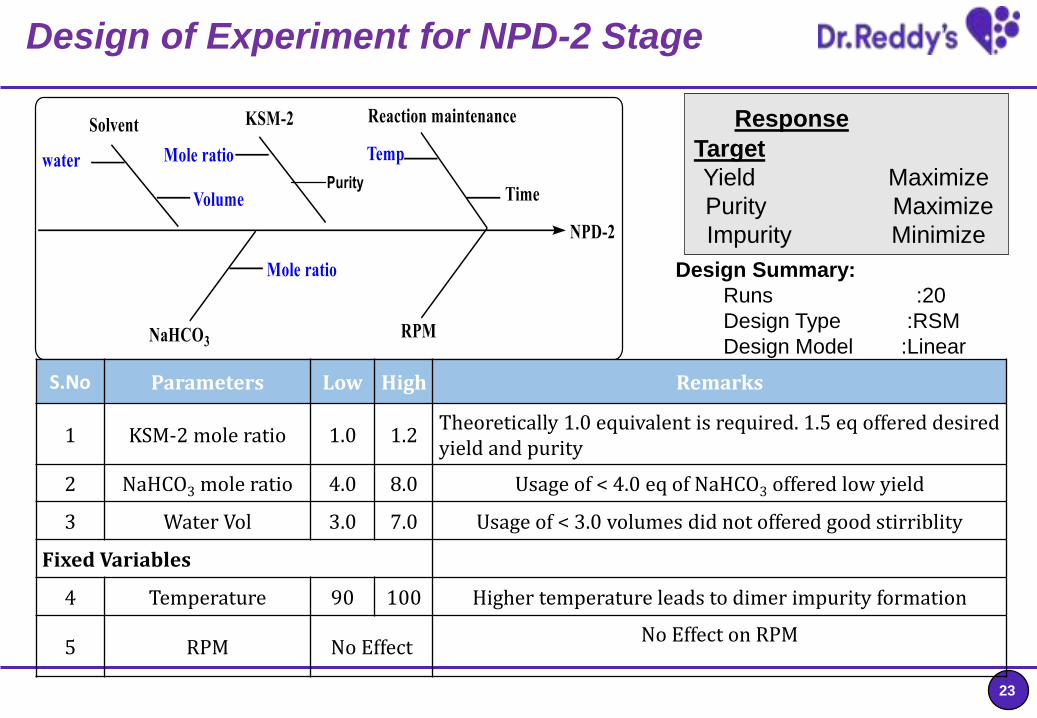
Design of Experiment for NPD-2 Stage
Response
Target
Yield Maximize
Purity Maximize
Impurity Minimize
S.No Parameters Low High Remarks
1 KSM-2 mole ratio 1.0 1.2Theoretically 1.0 equivalent is required. 1.5 eq offered desired yield and purity
2 NaHCO3 mole ratio 4.0 8.0 Usage of < 4.0 eq of NaHCO3 offered low yield
3 Water Vol 3.0 7.0 Usage of < 3.0 volumes did not offered good stirriblity
Fixed Variables
4 Temperature 90 100 Higher temperature leads to dimer impurity formation
5 RPM No EffectNo Effect on RPM
Design Summary:
Runs :20
Design Type :RSM
Design Model :Linear
24
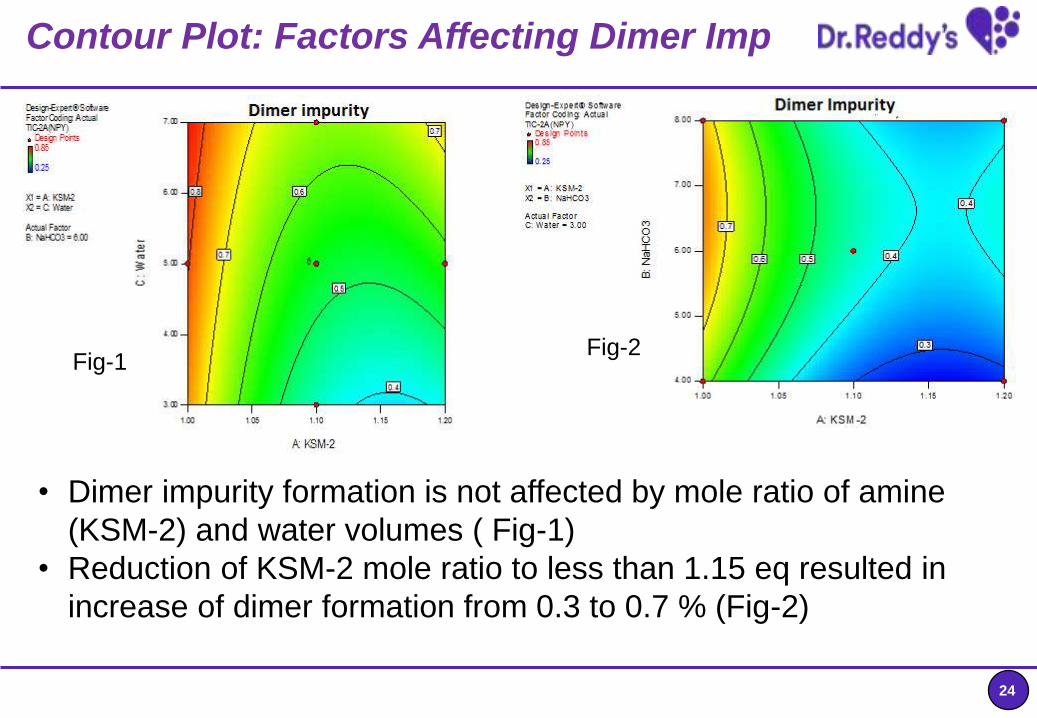
Contour Plot: Factors Affecting Dimer Imp
• Dimer impurity formation is not affected by mole ratio of amine
(KSM-2) and water volumes ( Fig-1)
• Reduction of KSM-2 mole ratio to less than 1.15 eq resulted in
increase of dimer formation from 0.3 to 0.7 % (Fig-2)
Fig-1Fig-2
25
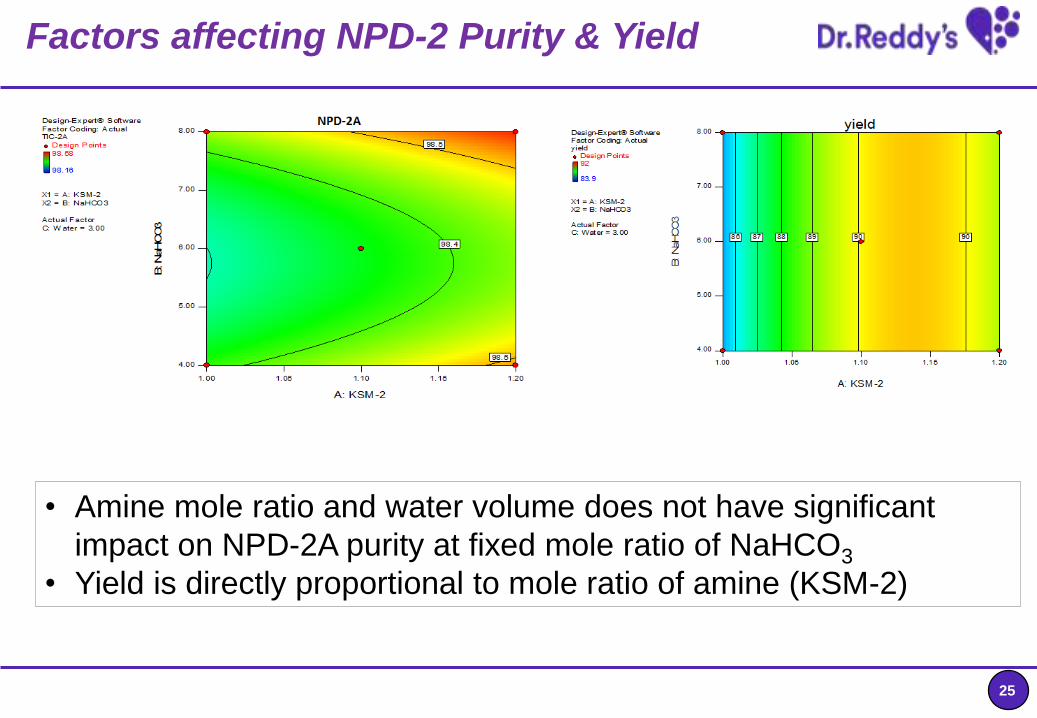
Factors affecting NPD-2 Purity & Yield
• Amine mole ratio and water volume does not have significant
impact on NPD-2A purity at fixed mole ratio of NaHCO3
• Yield is directly proportional to mole ratio of amine (KSM-2)
Low

26
• High conversion obtained with higher mole ratio of amine (KSM-2)
• Purity of 98.1- 98.5 % is feasible within the identified ranges of
water and mole ratio of amine.
Factors Affecting Yield & Purity

27
Design Space Validation & GMP Batch Data
Design-Expert® SoftwareFactor Coding: ActualOverlay Plot
yieldTIC-2ATIC-2A(NPY)
Design Points
X1 = A: KSM-2X2 = B: NaHCO3
Actual FactorC: Water = 3.00
1.00 1.05 1.10 1.15 1.20
4.0
5.0
6.0
7.0
8.0Overlay Plot
A: KSM-2
B:
Na
HC
O3
yield: 89.000
TIC-2A(NPY): 0.500
S.
No
KSM-2
m/r
NaHCO3
m/r
H2O
VolumeYield Purity Dimer
1
1.2 5.0 3.0
Actual / observed 90.95 98.81 0.65
Predicted 89.33 98.44 0.36
2
1.1 7.0 3.0
Actual / observed 91.4 98.82 0.66
Predicted 89.9 98.40 0.45
3
1.1 6.0 3.0
Actual / observed 90.96 98.65 0.65
Predicted 90.04 98.37 0.44
Trend Data of Scale up batches under optimum conditions
B.No Solvent Base Temp (°C)
Time (h)
Input (Kg)
Output (Kg)
%yield Purity (%)
AOGH000031 Water NaHCO3 90-95 15 9.0 14.4 91.0 98.4
AOGH000034 Water NaHCO3 90-95 15 9.0 15.1 95.3 98.6
AOGH000040 Water NaHCO3 90-95 15 9.0 14.8 93.5 98.5
28
SUMMARY
Advantages:
• Focused experimentation helps in enhancing R&D
productivity and development of robust product development
using science and risk based approach
• Enables to maximize process efficiency and minimize waste-
Greener Processes
• Facilitates Life Cycle Management and managing regulatory
changes
Challenges:
• Culture and mindset change (creativity/innovation vs.
systems/processes) needs to be managed
• Need investment and commitment from senior management
in implementation of QbD
29
ACKNOWLEDGMENT
Dr. ERR Chandrashekar
Dr. Rakeshwar Bandicchor
Dr. Amit Biswas
Dr. Sudhir Nambiar
Srinivas Mazumdar
PVM Ravi Shankar
Integrated Product Development Organization (IPDO), Hyderabad