Organizational Behavior and Human Decision Processes/media/227429ac253a44d5abe102b... ·...
69
Running Head: PUSHING AWAY FROM ADVICE 1 Pushing Away From Representative Advice: Advice Taking, Anchoring, and Adjustment Christina A. Rader, Jack B. Soll, and Richard P. Larrick Duke University Under second review at Organizational Behavior and Human Decision Processes The authors would like to thank Francesca Gino, Julia Minson, and two anonymous reviewers as well as Lalin Anik, H. Min Bang, and the Management and Organizations seminar at Duke for their helpful comments on this work. We are also grateful to Daniel C. Feiler for his assistance collecting a portion of the data and the Fuqua School of Business for providing the funding for this work. Correspondence concerning this article should be addressed to Christina A. Rader, The Fuqua School of Business, Duke University, 100 Fuqua Drive, Box 90120, Durham, NC 27708- 0120, USA. E-mail [email protected]. Phone: +1 (303) 725-5982.
Transcript of Organizational Behavior and Human Decision Processes/media/227429ac253a44d5abe102b... ·...

Running Head: PUSHING AWAY FROM ADVICE 1
Pushing Away From Representative Advice:
Advice Taking, Anchoring, and Adjustment
Christina A. Rader, Jack B. Soll, and Richard P. Larrick
Duke University
Under second review at
Organizational Behavior and Human Decision Processes
The authors would like to thank Francesca Gino, Julia Minson, and two anonymous
reviewers as well as Lalin Anik, H. Min Bang, and the Management and Organizations seminar
at Duke for their helpful comments on this work. We are also grateful to Daniel C. Feiler for his
assistance collecting a portion of the data and the Fuqua School of Business for providing the
funding for this work.
Correspondence concerning this article should be addressed to Christina A. Rader, The
Fuqua School of Business, Duke University, 100 Fuqua Drive, Box 90120, Durham, NC 27708-
0120, USA. E-mail [email protected]. Phone: +1 (303) 725-5982.

Running Head: PUSHING AWAY FROM ADVICE 2
Abstract
Five studies compare the effects of forming an independent judgment prior to receiving advice
with the effects of receiving advice before forming one’s own opinion. We call these the
independent-then-revise sequence and the dependent sequence, respectively. We found that
dependent participants adjusted away from advice, leading to fewer estimates close to the advice
compared to independent-then-revise participants (Studies 1-5). This “push-away” effect was
mediated by confidence in the advice (Study 2), with dependent participants more likely to
evaluate advice unfavorably and to search for additional cues than independent-then-revise
participants (Study 3). Study 4 tested accuracy under different advice sequences. Study 5 found
that classic anchoring paradigms also show the push-away effect for median advice. Overall, the
research shows that people adjust from representative (median) advice. The paper concludes by
discussing when push-away effects occur in advice taking and anchoring studies and the value of
independent distributions for observing these effects.
Keywords: advice taking, anchoring, combining opinions, judgment, opinion revision

Running Head: PUSHING AWAY FROM ADVICE 3
Introduction
People often have to make decisions about topics on which they are not well informed,
such as retirement, health care, or new work projects. Therefore, using advice from other people
is an important life skill (Heath & Heath, 2013). Yet a large literature shows that people do not
take advice particularly well, often overweighting their own opinions (Harvey & Fischer, 1997;
Yaniv & Kleinberger, 2000) or ignoring the advice that they receive (Soll & Larrick, 2009). In
this paper we ask whether changing the way the advice is provided changes how much people
use that advice. Specifically, we manipulate when the advice is given, relative to exposure to the
decision problem, to test whether the timing of advice has an important influence on how much
advice people take and on accuracy.
The degree to which people take advice has important implications for judgmental
accuracy. First, egocentric bias may cause people to underweight the opinions of others who are
more accurate than they are (Yaniv & Kleinberger, 2000). Second, when individual abilities are
not too different from one another, averaging quantitative judgments is typically superior to
relying on one person’s opinion (Armstrong, 2001; Clemen, 1989; Hastie, 1986; Yaniv, 2004).
This benefit occurs for quantitative estimates because errors cancel out when estimates bracket
(i.e., fall on both sides of) the truth. As long as bracketing is sufficiently frequent, averaging is a
very powerful way to reduce judgmental error (Soll & Larrick, 2009). By underweighting or
ignoring advice, as the literature shows is common, people lose out on benefitting from the
knowledge of others.
Studies of advice taking typically ask participants to form their own opinion on the
decision problem before seeing the opinion of their advisor, after which they are given a chance
to revise by using the advice however they wish (see review by Bonaccio & Dalal, 2006). We

Running Head: PUSHING AWAY FROM ADVICE 4
call this the independent-then-revise advice sequence (Figure 1). Most advice taking studies
embed within this sequence tasks in which participants answer numerical, fact-based questions,
such as dates in history or the weights of people in photographs. This allows the researcher to
calculate continuous measures of both the amount of advice taking and accuracy. The
independent-then-revise sequence has the advantage of helping the judge to avoid any “mental
contamination” (Wilson & Brekke, 1994) from the advisor when forming their opinion. Seeing
the advisor’s answer first could cause errors to be correlated, decrease the chances of bracketing,
and thereby decrease the potential benefit of combining opinions with the advisor.
A number of core findings in the advice taking literature have emerged from this standard
independent-then-revise paradigm. People tend to discount the opinions of others, with average
weights of 70% on their own estimate and 30% on the advice (Harvey & Fischer, 1997; Yaniv &
Kleinberger, 2000). Notably, this average weight arises from a multi-modal distribution of
weights in which people often ignore advice entirely, occasionally average, and more rarely fully
accept advice (Minson, Liberman, & Ross, 2011; Soll & Larrick, 2009; Soll & Mannes, 2011).
A number of moderators of advice taking have also been identified. For example, people take
more advice the more they trust the advisor (Gino & Schweitzer, 2008) or when they pay for the
advice (Gino, 2008). People take less advice when they are primed with power (See, Morrison,
Rothman, & Soll, 2011; Tost, Gino, & Larrick, 2012, 2013) or induced to experience certain
emotions such as anger (Gino & Schweitzer, 2008).
Although most results have been obtained with the independent-then-revise sequence, in
many advice-taking situations people receive advice before they have an opportunity to form
their own opinion on a question—advice comes first, followed by an estimate. For example,
subordinates may make recommendations to their managers about spending in categories that the

Running Head: PUSHING AWAY FROM ADVICE 5
manager had not previously considered, such as, “We should budget $1,500 to send me to a
conference in Hawaii.” When working on the conference budget, the manager will be forming an
estimate of the appropriate allocation after receiving the subordinate’s advice. We call this the
dependent advice sequence, because the judgment is likely to be influenced by, and therefore
dependent upon, the advice.
We are aware of only a handful of studies that have compared dependent and
independent-then-revise advice sequences directly. Koehler and Beauregard (2006) asked
participants to estimate dates in history with an advisor, either before or after seeing advice. As
expected, final answers were closer to the advice in the dependent sequence than in the
independent-then-revise sequence. Moreover, participants in the dependent condition of their
final experiment were also asked to guess what they would have answered independently, had
they not seen the advice. These participants gave guesses that were much closer to the advice
than what participants in the independent-then-revise condition said independently. Based on
this, the researchers concluded that people tend to underestimate the degree to which their
answers in a dependent sequence are influenced by the answers of others. The result provides
support for the idea that advice contaminates thought, causing people to retrieve advice-
consistent information.
Yaniv and Choshen-Hillel (2012, Study 3) included a dependent manipulation in which
participants began by estimating the number of calories of different food items in a “blindfolded”
state, with the names of the foods disguised, based on the estimates of five advisors. Following
this, the foods were revealed and participants had the chance to revise their estimates. Similar to
the Koehler and Beauregard study, dependent answers were on average closer to the mean of the
advice compared to the revised answers in the independent-then-revise condition (which we term

Running Head: PUSHING AWAY FROM ADVICE 6
the revised answers). Moreover, dependent answers were more accurate because they more
closely approximated equal-weighting of individual judgments in the group, a benchmark that
people often fall short of in independent-then-revise because they tend to overweight their own
opinions (Mannes, 2009).
Finally, Sniezek and Buckley (1995) had participants answer two-alternative questions
with the aid of two advisors. In contrast to the Yaniv and Choshen-Hillel result, participants
were more accurate in the independent-then-revise sequence than in the dependent sequence.
Similar to the other researchers, Sniezek and Buckley theorized that people rely more on
independently generated information in the independent-then-revise sequence. In comparison to
the estimation tasks that are common to many advice taking studies, it may be that participants in
the two-alternative task benefitted from independence because it was easy to apply majority rule,
which is generally a very effective strategy for combining opinions (Hastie & Kameda, 2005).
We are interested in two main questions about the independent-then-revise and dependent
advice sequences: When do people take more advice? When are they more accurate? All three
papers with a direct comparison between independent-then-revise and dependent found that
people take more advice in dependent advice sequences. This would also be the natural
prediction from the perspective of decades of anchoring research (Chapman & Johnson, 1999;
Mussweiler & Strack, 1999; Tversky & Kahneman, 1974). Although the logic behind such a
prediction is compelling and the published data well-supports it, we will suggest that there are
situations in which the opposite can happen such that answers are more distant from advice in
dependent versus independent-then-revise sequences. In terms of accuracy, the two studies
reviewed earlier that contained a direct comparison of accuracy found opposite results, which
appears to be due to differences in task and number of advisors. To provide a benchmark
Running Head: PUSHING AWAY FROM ADVICE 7
relevant to contemporary research on advice taking, we compare the dependent and independent-
then-revise sequences for the case of quantity estimates with one advisor. From an information
aggregation point of view greater accuracy can be obtained by averaging two independent
estimates, which favors the independent-then-revise sequence. However, given that people often
ignore advice, it is possible that dependent sequence leads to greater accuracy if people anchor
on the advice and adjust part way toward what they would have said in its absence, mimicking
the effect of averaging two independent estimates.
When Dependence Leads to Less Advice Taking
To understand the effects of dependence on advice taking, we consider the perspective of
anchoring research (Chapman & Johnson, 1999; Mussweiler & Strack, 1999; Tversky &
Kahneman, 1974), given that the advice is likely to act as an anchor for dependent participants.
A critical difference between research on anchoring and on advice taking is that anchoring
studies typically provide participants with anchors that are near the extremes of what people
might answer independently (e.g., Jacowitz & Kahneman, 1995). In contrast, studies of advice
taking often sample advice representatively from the distribution of unaided guesses (Bonaccio
& Dalal, 2006). Providing extreme anchors is helpful for detecting anchoring effects because it
maximizes the probable effect size. However, in everyday advice taking situations we expect
that people will rarely encounter extreme advice (because by definition, extreme advice comes
from the tails of the distribution of all possible advice and is therefore less likely to occur); more
often they will see advice relatively close to the center of the distribution of independent answers
(but see Gino, Brooks, & Schweitzer, 2012 for an advice taking experiment using extreme
advice). Central advice, in particular, can frequently match (or nearly match) what the person
would have said independently if they were in the independent-then-revise sequence rather than

Running Head: PUSHING AWAY FROM ADVICE 8
the dependent sequence, a situation we term a “counterfactual match.” For example, in an age
estimation task, if many people independently think that a target person is 63 years old, then in
many cases the advice given will be age 63 and the answer that would have been estimated
independently is also age 63, creating a counterfactual match. Precisely how often such
counterfactual matches occur depends on the variance and shape of the distribution of
independent estimates. For instance, they will be particularly likely when the distribution has a
tall peak at the median. The anchoring literature is mute on what happens in the case of central
advice, which is critical because central advice is the norm in everyday opportunities to receive
advice rather than the exception. From the perspective of how well people use advice, these are
important circumstances to understand.
Although studies of anchoring have not looked at what happens when advice matches
what people would have said on their own, the theory of anchoring does speak to this question, at
least implicitly. The most prominent and widely-accepted theory that applies is anchoring-as-
accessibility, because the anchor in advice taking is provided by an external source (Epley,
2004). The theory posits that the anchor either primes anchor-consistent information in memory
(Mussweiler & Strack, 1999), or more generally causes people to focus first on anchor-consistent
features of the target (Chapman & Johnson, 1999). Although the anchor may be rejected as the
answer, the generated anchor-consistent information remains active, and therefore pulls
judgment in the direction of the anchor. Based solely on accessibility, one might hypothesize
that a central anchor would boost evidentiary support for answers near the center of the
distribution, leading to a strong anchoring effect in dependent sequences.
However, this interpretation of anchoring as solely accessibility neglects the potential
role of adjustment in the judgment process. Although it has been proposed that effortful

Running Head: PUSHING AWAY FROM ADVICE 9
adjustment away from an anchor only applies to internally generated anchors (Epley, 2004),
recent evidence with externally-generated anchors suggests that both accessibility and
adjustment operate together in a multi-stage process (Simmons, LeBoeuf, & Nelson, 2010). For
example, upon seeing the advice that a target person is 63 years old in an age estimation task, the
judge may initially focus on consistent cues such as the target’s baldness (which illustrates
selective search prompted by the anchor). Following this, the judge may consider whether the
balance of remaining cues favors a higher or lower answer, and adjust in that direction. For
extreme advice, the initial consideration of evidence will cause the judge to start at an extreme
answer, and insufficient adjustment will likely arrive at an answer close to the extreme anchor
and quite distant from what would have been said independently. However, for central advice
the accessibility stage of the process will cause many judges to notice evidence that they would
have noticed anyway, putting them in the counterfactual match category. In other words, even if
they had not seen the advice, they would have on their own started with an answer close to it.
What happens next? We posit that the judge tests the advice by implicitly asking the
question that anchoring studies ask explicitly—Is the answer higher or lower than that?
(Simmons et al., 2010). This internal framing of the problem will often lead the judge to identify
evidence in one direction (“he has a lot of wrinkles around his eyes”), and additional evidence
may then be recruited that favors answers on that same side of the advice and not the other side
(“and his hair is pretty thin”). The result of this will be a push-away effect: Judges in a
dependent sequence, in the event of a counterfactual match, will systematically give answers that
deviate from the advice. Of course, we cannot know how a specific participant would have
responded in the absence of advice. Even so, we can infer that the push-away effect exists if the
Running Head: PUSHING AWAY FROM ADVICE 10
distribution of answers in the dependent sequence exhibits a “hole” at the location of the advice,
when compared to a distribution of independent answers.
To illustrate the push-away effect, consider the following example. A judge is completing
an age estimation task. The judge would have independently estimated age 63, but the judge is
in a dependent advice sequence. The judge sees advice of age 63, a counterfactual match. We
predict that seeing age 63 will bring to the judge’s mind much of the same information that
would have come to mind independently. For instance, the judge may notice that the target has
wrinkles and greying hair. Next, we suggest that the judge thinks, “Is this person older or
younger than 63?” The judge chooses a direction (higher in this case) and then focuses on
evidence consistent with that direction—the target person has a lot of wrinkles around his eyes
and has pretty thin hair. The judge picks an answer consistent with the selected evidence, which
is a moderate deviation from the advice—age 66. Across many judges, this push away will
appear as a “hole” in the distribution of dependent answers, at the location of the advice.
Whereas the dependent sequence is likely to prompt additional recruitment and search for
information, judges in an independent-then-revise sequence have already completed a search and
reported an answer before they see the advice. Moreover, the independent-then-revise sequence
now makes available an additional cue, which is the extent to which the advice agrees or
disagrees with their independent answer. When the advice matches a person’s initial,
independent opinion, the person is likely to infer from the observed consensus that the answer is
fairly accurate (Budescu & Yu, 2007), express greater confidence in that answer, and therefore
stay with it. When there is a mismatch such that the initial answers disagree, people will
occasionally accept the advice to some extent (Soll & Larrick, 2009). Putting these effects
together, we expect more responses close to the advice in an independent-then-revise sequence,
Running Head: PUSHING AWAY FROM ADVICE 11
compared to a distribution of unaided, independent judgments. In terms of the influence of
advice, therefore, our discussion suggests that dependent and independent-then-revise advice
sequences are likely to have different effects on the distribution of estimates. Although
differences in accessibility may cause greater assimilation to advice in dependent sequences, the
adjustment phase can actually lead to a “push-away” effect, leaving judgments further from
advice in the dependent sequence than in the independent-then-revise sequence.
Overview of Studies
We present the results of five studies addressing the question of whether people take
more advice when they have first formed their own independent judgment (independent-then-
revise sequence) or have no prior opinion (dependent sequence). Study 1 provides an initial
demonstration of the push-away effect. Using median advice, we found that dependent estimates
were less likely to be close to the advice than revised estimates (from the independent-then-
revise sequence) and that they were further from the advice on average than revised estimates.
Next, Studies 2 and 3 explore the mechanism for the push-away effect. We first tested
whether confidence mediates the effect. Because participants in a dependent sequence cannot
observe the counterfactual matches (that is, instances where the answer they would have given
independently matches or nearly matches the advice), they are not as confident in advice as they
would be otherwise. We propose that confidence is what causes people to either accept the
advice quickly or pursue extended deliberation by asking whether the answer is higher or
lower. Once they recruit initial evidence in one a direction, evidentiary search is biased in that
direction, leading to adjustment and a hole in the distribution of estimates. In Study 2, we found
that confidence in the advice indeed mediates the push away effect and Study 3 deepened our

Running Head: PUSHING AWAY FROM ADVICE 12
understanding of the process using a verbal protocol task where participants talk aloud as they
make their decision, providing corroborating evidence for the confidence process.
Study 4 investigates the implications of dependence for accuracy. Using a wide span of
advice covering the range of what people might plausibly encounter, we found that both advice
sequences are beneficial, compared to the accuracy of independent judgments. Consistent with
anchoring-as-accessibility, we also found that when advice is very extreme, dependent estimates
are less accurate than revised estimates, because dependent estimates are pulled toward bad
advice more than revised estimates. And consistent with the push away effect, we found that a
situation in which the dependent sequence should produce highly accurate judgments—exposure
to median advice—yields no gain in accuracy over the independent-then-revise sequence.
Finally, Study 5 considers how the dependent sequence performed when implemented as
the standard anchoring paradigm (which included varying whether the source of information was
social or not and whether a comparative “higher or lower” judgment preceded the estimate). We
found that the dependent sequence gave the same results when configured as in the standard
anchoring paradigm. The results suggest that similar processes underlie judgments in the
dependent sequence in both the advice taking and anchoring paradigms. In the General
Discussion, we explore the similarity between anchoring and dependent advice taking at greater
length.
Study 1
Study 1 investigated the basic question of how estimates differ when people see advice
first (dependent advice sequence) versus when they give an independent answer first and then
revise it (independent-then-revise advice sequence). We varied whether participants saw the

Running Head: PUSHING AWAY FROM ADVICE 13
dependent or the independent-then-revise advice sequence and crossed that with advice
centrality—whether they saw advice that was low (15th
percentile), high (85th
percentile), or at
the median of independent judgments. Participants estimated the age of a person in a photo, as
part of a series of studies administered jointly.
Method
Participants. Three hundred eighteen members of a paid survey panel (66% female, Mage
= 50) completed the survey online. One participant was excluded who gave responses outside
the range of the human life span.
Materials and procedure. Participants were randomly assigned to either the dependent
or independent-then-revise advice sequence and estimated the age of an adult white male (correct
answer = 41) from a single black and white photo (Kennedy, Hope, & Raz, 2009; Minear &
Park, 2004). A separate advice pool came from students at Duke University (N = 40) who gave
estimates to a paper and pencil version in exchange for a small payment. These estimates were
used as advice by selecting the 15th
, 50th
, and 85th
percentiles from the advice pool (which
corresponded to ages 37, 45, and 51 years, respectively). The advice was described as the
answer from another survey taker, and participants were told that they could use the other
person’s answer however they wished in forming their own estimate. Participants in the
dependent advice sequence saw two screens: On the first screen they were shown the advice; on
the second screen they saw the photo plus the advice and gave a single, final answer.
Participants in the independent-then-revise advice sequence saw three screens: On the first
screen they were shown the photo and gave an initial independent answer. On the second screen,
they were shown the advice. Finally, on the third screen, they were shown the advice alongside
their initial answer and the photo and they gave a final answer on this screen, which gave them

Running Head: PUSHING AWAY FROM ADVICE 14
an opportunity to revise their initial independent answer however they wished. The complete
text of the instructions is presented in the Appendix.
Results
Figure 2 shows the distribution of estimates for each condition. We used two measures to
examine the influence of advice. The first looks simply at the percentage of answers that are
close to advice and the second looks at the absolute distance between the advice and the
participant’s answers.
Percent of estimates close to the advice. Table 1 shows the percentage of estimates
within 2 years and within 5 years of the advice, for low, median, and high advice. These values
are shown for the dependent estimates and the independent and revised estimates from the
independent-then-revise condition. At each level of advice, dependence led to a decrease in
close answers (within 2 years of advice) relative to the independent estimates, and revision led to
an increase. Together, these effects led to fewer close answers among the dependent estimates
than among the revised estimates, χ2(1) = 15.98, p <.001, an effect that held at least directionally
at each level of advice χ2
low(1) = 1.98, p = .159, χ2
median(1) = 10.60, p = .001, χ2
high(1) = 4.71, p
= .030. Even when the band is expanded from percent of answers within 2 years to percent of
answers within 5 years (creating a 10-year interval), there are still fewer answers close to the
advice among the dependent estimates than among the revised estimates, at both low and median
advice. This is surprising because a prediction based on the anchoring literature would suggest
the opposite, due to enhanced accessibility in the dependent advice sequence.
Absolute distance between advice and estimate. Although there are fewer responses
close to advice in the dependent advice sequence, it might still be the case that enhanced
accessibility in the dependent sequence pulls in guesses that otherwise would have been extreme,

Running Head: PUSHING AWAY FROM ADVICE 15
and that therefore overall answers might on average be closer to advice with dependent estimates
than with revised or independent estimates. We investigated this by computing the absolute
difference between the advice and the estimates, presented in Table 1. At median advice, the
dependent estimates were further from the advice than the revised estimates, t(105) = 3.36, p =
.001, d = .66, and perhaps surprisingly, were also further from the advice than the independent
estimates, t(211) = 2.71, p = .007, d = .43. This last result indicates that when people see advice
before forming an opinion, they can on average be further from that advice than if they do not
see advice at all. We had hypothesized such a result based on the high probability of
counterfactual matches for median advice. The effect was not expected for extreme advice
where counterfactual matches are rare. In support of this, the pattern described above disappears
at low and high advice, in some cases yielding final judgments closer to advice in the dependent
sequence than in the independent-then-revise sequence (as shown in Table 1).
Discussion
Study 1 provided initial evidence that people who are exposed to advice before forming
their own opinion may test that advice by implicitly asking “higher or lower?,” creating a push-
away effect. With median advice, the push-away effect appears to wipe out the effect of
accessibility in dependent advice sequences. In this case, counterfactual matches are relatively
common: The advice tends to match what dependent participants would have said independently
had they been in the independent-then-revise condition. With counterfactual matches, because
people tend to notice the same information that they would have without the advice, any
adjustment has the effect of pushing them away from the advice. This yields final judgments in
the dependent sequence that are further from advice than in the independent-then-revise
sequence.
Running Head: PUSHING AWAY FROM ADVICE 16
With extreme advice, however, information search is skewed by the anchor/advice since
counterfactual matches are rare. Although we still expect people to adjust away from the advice
in the dependent sequence when the advice is extreme (as they do for median advice), we also
expect a stronger accessibility effect as more uncommon information is made accessible. This
yields final judgments in the dependent sequence that are closer to advice than in the
independent-then-revise sequence. The results of Study 1 are consistent with this interpretation.
We have attributed the different patterns of influence in the dependent and independent-
then-revise sequences to differences in accessibility and also to differences in search behavior.
The advice in the dependent sequence may initially bias participants toward advice-consistent
evidence (accessibility), but their testing of the advice appears to cause them to choose a
direction, pushing answers away from the advice (search). Whereas these mechanisms are likely
to both be strong for extreme advice, for central advice we expect the effect of accessibility to be
weak, because for many participants the advice will make accessible evidence that they would
have considered anyway. Thus, for median advice adjustment is the only mechanism that has a
discernible impact on the distribution of answers.
Study 2
In the next study we sought to better understand how median advice can have opposite
effects in the dependent and independent-then-revise sequences, creating a distributional hole in
the case of dependent estimates and pulling in mass in the case of revised estimates. We propose
that confidence in advice can explain this seemingly paradoxical result. In the dependent advice
sequence, participants evaluate the advice near the beginning of a search process, and therefore
are likely to have relatively low confidence in whatever answer is presented. This may prompt

Running Head: PUSHING AWAY FROM ADVICE 17
them to ask the higher or lower question, and thus deviate from the advice in a consistent
direction as more evidence is accumulated. Meanwhile, high confidence may be the norm in
independent-then-revise sequence because close matches between the advice and the
independent estimate—which are taken as a cue to accuracy—are both common and observable
for median advice. When there is a direct match, people will see little need to seek out additional
information and will typically stick with their original answer. When there is a near match,
participants are likely to stick with their original answer, or, if they do revise, they will adjust in
the direction of advice and not away from it.
In addition to examining the mediating role of confidence, in this study we also compare
the dependent and revised distributions to an independent-only distribution collected from a
separate control group, different from the participants in the independent-then-revise condition.
All participants received median advice.
Method
Six hundred five members of an online survey panel completed the study (50% female,
Mage = 41). Similar to Study 1, participants were randomly assigned to an advice sequence and
estimated the age of a person in a photo. The photo was randomly selected for each participant
from a set of 10 photos in which correct answers ranged from 18 to 83 (Kennedy et al., 2009;
Minear & Park, 2004). All participants who saw advice were given median advice from an
advice pool comprised of a separate group of online participants (N = 195). Participants were
told that they would receive a bonus of $0.25 if their final answer was within 3 years of the
correct answer.
Confidence in advice was measured immediately after participants saw the advice using
two items from See et al. (2011) (Cronbach’s α = .67) (This was only done for the dependent and

Running Head: PUSHING AWAY FROM ADVICE 18
independent-then-revise advice sequences, not the independent-only sequence). The items were
“How accurate do you think this answer is?” and “How confident do you feel in this answer?” (1
= not at all, 7 = extremely).1
Results
Percent of estimates close to the advice. Replicating Study 1, there were fewer
dependent estimates within 2 years of the advice than revised estimates (24% and 47%,
respectively), χ2(1) = 23.16, p <.001. As shown in Table 1, this was due to the dependent
estimates having fewer answers close to the advice compared to the independent estimates, and
revised estimates having more close answers. This was also directionally true at 5 years.
Absolute distance between advice and estimate. Absolute distances are shown in
Table 1.2 Once again, dependent estimates were further from the advice than revised estimates,
MDependent = 4.81, SDDependent = 3.08, MRevised = 3.66, SDRevised = 3.25, t(403) = 3.68, p < .001, d =
.37. In this instance, the effect appears to be mainly driven by participants in the independent-
then-revise condition, whose revised estimates were closer to the advice than where they started
with their independent estimates. Participants in the dependent advice sequence were either
unaffected overall by the advice (compared to the independent estimates from the independent-
then-revise sequence), or moderately pulled toward the advice (compared to the independent-
only control). Based on our earlier analysis, whether the dependent sequence produces estimates
closer or further away from advice compared to independent judgments depends on the balance
1 Compared to Study 1, the instructions for Study 2 included more screens: The measure of confidence in advice
appeared on its own screen, and we also had additional screens before and after the confidence measure reminding
people that they would see advice and then later would give their estimate. We also excluded following phrase
which had been part of the Study 1 instructions: “You can use the estimate however you wish in forming your own
estimate”. 2 Because we used ten different photos in this study, we standardized absolute distances by photo using the
following equation: absolute distance = (|estimate – advice| / sdphoto )× avgsd, where sdphoto is the standard deviation
for that particular photo from the distribution of independent estimates in the advice pool and avgsd is a constant
calculated by averaging the standard deviations of all ten photos. We multiplied by avgsd so that the numbers
represent years, for the convenience of comparison to other numbers in the last 3 columns of Table 1.

Running Head: PUSHING AWAY FROM ADVICE 19
between adjustment and enhanced accessibility, which still plays a role for those participants in
the dependent sequence who on their own would have produced extreme answers.
Confidence in advice. As we had predicted, participants in the dependent advice
sequence were less confident (M = 4.35, SD = 1.27) in the advice than participants in the
independent-then-revise sequence (M = 4.88, SD = 1.28), t(403) = 4.20, p < .001, d = .42. We
tested the mediating role of confidence for both dependent variables, using the appropriate
bootstrapping method for the dichotomous “within 2 years” measure and the continuous absolute
distance measure (Hayes, 2012). Results are shown in Figure 3 (advice sequence is coded as
dependent = .5, revised = -.5). The mediation in panel (a) implies that confidence in advice
accounts for 10 percentage points of the 23 point gap between conditions(calculated from Table
1 as 47% minus 24%). In the second analysis, the mediation through confidence accounts for
about half the 1.15 year gap (4.81 minus 3.66) in absolute distance between the dependent and
revised estimates.
Discussion
The results of Study 2 are consistent with our account that seeing advice before forming
an independent opinion results in lower confidence in the advice, encouraging additional search
and thereby lessening the propensity to give answers close to the advice. If people sampled
information in the same manner as they do independently, this process would not produce a hole
in the distribution. Rather, the data suggest that people pick a direction in which to adjust from
the advice in the dependent sequence, and this biases answers away from the center of the
distribution.
We further suggest that the distribution in the independent-then-revise sequence differs
from that in the dependent sequence in large part because matching advice is observed in the

Running Head: PUSHING AWAY FROM ADVICE 20
independent-then-revised sequence, leading people to stick with their answers. We performed an
additional analysis to explore this idea. We divided participants in the independent-then-revise
advice sequence into two groups: those whose initial independent estimates matched the advice
(within 2 years) and those whose estimates did not. We then calculated the average confidence
for each of these groups, as well as for the independent-then-revise and dependent sequences
overall. As shown in Table 2, independent-then-revise participants were more confident when
advice matched their initial estimate; when it did not match, their confidence level (and
subsequent closeness to advice) were similar to dependent participants. This suggests that the
matching cases in independent-then-revise, and the consequent high confidence in advice, play a
key role in creating the difference between the two conditions.
In Study 2, we identified confidence as a mediator of the push-away effect—when
participants lack confidence in advice, they are more likely to pick a direction and adjust. This
happens more in the dependent advice sequence, because the sequence precludes the confidence-
building effect of observing a match. This lowered confidence is the first step in the process we
hypothesized: Participants in the dependent advice sequence will have lower confidence in the
advice. They will then tend to ask whether the answer is higher or lower than the advice, recruit
evidence in the favored direction, and adjust accordingly. The next experiment uses a verbal
protocol task to examine this hypothesis.
Study 3
In this study participants were asked to “talk aloud” as they made their decisions. By
asking participants to talk aloud, we hoped to get a clearer indication for whether dependent
participants tended to ask themselves whether the answer is higher or lower than the advice,
recruit evidence in the favored direction, and adjust accordingly. We hypothesized that when

Running Head: PUSHING AWAY FROM ADVICE 21
giving dependent estimates, participants would be less likely to make positive remarks about the
advice than when giving revised estimates, which would be consistent with our suggestion that
people initially conclude that the answer is higher or lower than the advice. We also
hypothesized that when giving dependent estimates, participants would be more likely to pay
attention to cues than when giving revised estimates, consistent with our suggestion that they
will recruit evidence in their favored direction. Study 3 also allowed us to test another
alternative hypothesis: that participants in the dependent sequence were more focused on trying
to give their own estimate compared to those in the independent-then-revise sequence.
Specifically, we wanted to measure whether judges in the dependent sequence made explicit
statements that they were trying to generate an independent assessment that was not influenced
by the advice. Judges may do this, for example, if they are concerned that the experimenter
would infer that they are lazy or thoughtless if they simply adopt the advice as their own answer.
Study 3 was a two-cell design with participants randomly assigned to either the dependent or
independent-then-revise sequence, using the same wording as in Study 1. Each participant saw
three photos.
Method
Participants. Sixty people participated from the behavioral lab at Duke’s Fuqua School
of Business (65% female, Mage = 28). One participant was removed from the analysis because he
did not allow his verbal report to be sound-recorded. A pilot pool of 10 participants was also run
for use in developing a coding scheme and training coders.
Materials and procedure. Participants were greeted by a research assistant and led to a
room with a computer and two chairs. The participant was seated facing the computer with the
research assistant seated behind them and to the right. The participant completed the informed

Running Head: PUSHING AWAY FROM ADVICE 22
consent and then the research assistant read the talk aloud instructions, adapted from Ericsson &
Simon (1993):
In this experiment we are interested in what you say to yourself as you perform some
tasks that we give you. In order to do this we will ask you to TALK ALOUD as you
work on the problems. What I mean by talk aloud is that I want you to say out loud
everything that you say to yourself silently. Just act as if you are alone in the room
speaking to yourself – you don’t need to explain why you say what you say. If you are
silent for any length of time I will remind you to keep talking aloud. We will sound-
record you as you do this. Do these instructions make sense to you? Do you have any
questions?
After the participant’s questions were answered, the research assistant started the sound
recording and asked the participant to do two practice problems, talking aloud all the while. The
practice problems consisted of adding two numbers in their head (1237 + 539) and estimating the
number of windows in their parents’ house. Research assistants would prompt participants who
stopped talking by saying “keep talking”.3
Preparation of data for analysis. The talk-aloud protocols were recorded in sound files
that were transcribed by professional transcriptionists and spot-checked by the first author. A
team of five research assistants (different from those who administered the study) coded the
resultant transcripts. The coding scheme was developed by the first author from the pilot data
and then revised in consultation with the research assistants over several hours of meetings and
practice coding. Coders indicated the presence or absence of the codes of interest as well as the
3 In addition to the concurrent reports given while they were solving the problems, participants were asked to give a
retrospective report of their thoughts, that is, to recall what they were thinking. The instructions were read by the
research assistant, adapted from Ericsson & Simon (1993). Because concurrent reports are generally regarded as the
most accurate, our analysis focuses on those reports. Results are largely the same with retrospective reports.

Running Head: PUSHING AWAY FROM ADVICE 23
order in which the codes occurred in a given protocol. This was accomplished by giving coders
a spreadsheet with the transcript double spaced and having them input the code directly above
the section of the text where the relevant language appeared.4 Each transcript was coded by two
coders. Inter-rater agreement was acceptable: The weighted average Kappa across all codes was
.71. In the case of disagreement between coders, a code was assumed to be present if either
coder indicated its presence. Results are largely the same if a code was only assumed present if
both coders indicated its presence. Table 3 presents the codes, example text, and inter-rater
agreement.
Results
Percent of estimates close to the advice. As in previous studies, we measured the
percent of estimates within 2 years and within 5 years of advice (see Table 1). In the dependent
sequence, 46% of estimates were within 2 years of the advice, compared to 70% of revised
estimates. To compare these percentages while taking into account the within-subject nature of
the data, we used generalized estimating equations (GEE) with a binomial distribution, a logit
link function, and an unstructured correlation structure. Advice sequence was contrast coded as
dependent = 0.5 and revised = -0.5. This analysis confirmed that close responses (within 2
years) were more frequent among dependent estimates than among revised estimates, b = -1.01, z
= -3.46, p < .001. Compared to independent estimates, the dependent sequence again had fewer
estimates close to the advice, although this comparison did not reach significance, b = -0.34, z = -
1.22, p = .221.
4 We consider our coding method to be a hybrid of the two main methods of protocol analysis: complete transcript
analysis and segment analysis. Some researchers have coded entire transcripts for the presence or absence of items
(e.g. Schkade & Payne, 1994) whereas others have broken protocols into segments of the smallest subject-verb units
possible (e.g. Ericsson & Simon, 1993). In working with pilot data, we found that breaking the protocols into small
independent units was infeasible, because the meaning of those units was lost and because we cared about some
elements such as facial cues that were even smaller than a subject-verb unit. Therefore, we developed the
aforementioned method.

Running Head: PUSHING AWAY FROM ADVICE 24
Verbal protocol results. Table 3 presents the results of the verbal protocol analysis. For
each code, the table indicates the percent of participants who received that code at least once for
their protocol for a photo. Percentages were compared using GEE as above, and Table 3
contains the bs, zs, and ps from those analyses. Participants in the dependent sequence were
more likely to give negative remarks (e.g., advice was not good, advice was too high or too low)
and were less likely to give positive remarks (e.g., the advice was close to their own estimate).5
We subtracted negative remarks from positive remarks to create a composite variable measuring
net positive remarks about the advice. Those in the dependent sequence had fewer positive
thoughts about the advice on net than those in the independent-then-revise sequence. When
giving dependent estimates, participants were also more likely to mention cues at least once,
compared to when giving revised estimates, and were more likely to display a composite
sequence of rejecting the advice, mentioning cues, and then giving an estimate, consistent with
our hypothesized process. The verbal protocol also allows us to look at alternate hypotheses,
such as a desire to give one’s own estimate or not repeat the advice. There is no difference in the
frequency with which participants mentioned this in the dependent vs. independent-then-revise
sequences– in fact, the code was rarely used, with only two instances of its use.
We next performed an additional analysis to understand the impact of the independent
initial estimate on revised estimates. As we did in the discussion section of Study 2, we divided
participants in the independent-then-revise advice sequence into two groups: those whose initial
independent estimates matched the advice (within 2 years) and those whose estimates did not.
5 While the design of the advice sequences makes it more likely that people in the independent-then-revise advice
sequence would remark on the difference between their own estimate and the advice, because people in the
independent-then-revise have previously given an estimate, it is notable that those in the independent-then-revise
predominantly said that the advice was close to their own estimate. Furthermore, the fact that participants in the
dependent advice sequence would sometimes say that they had their own estimate that was also close shows that the
comment is not impossible in the dependent condition, just infrequent.

Running Head: PUSHING AWAY FROM ADVICE 25
We then calculated the verbal protocol results for each of these groups within the independent-
then-revise condition, and compared them to the results for dependent participants (treated as a
single group), as shown in Table 4. In terms of both frequency of negative remarks and
closeness to the advice, non-matching participants in the independent-then-revise sequence look
very similar to the entire pool of participants assigned to the dependent sequence. In contrast,
matching participants exhibited a different pattern—they did not criticize the advice, and they
tended to stay close to their original answers.
Discussion
The protocol data support the idea that compared to people in the independent-then-revise
sequence, people in the dependent sequence are more likely to ask whether the answer is higher
or lower than the advice, choose a direction, and recruit evidence that favors answers in that
direction, resulting in a push-away effect. This is evident in the data showing that people in the
dependent sequence were more likely to say that the advice was too high or too low, were more
likely to mention cues, and overall had fewer net positive comments about the advice than people
in the independent-then-revise sequence. For example, in a typical pattern, a participant in the
dependent sequence began by concluding that the person was younger than the advice and then
focused on cues consistent with that direction:
And now I am guessing this person’s age and another person’s guess is 45, and actually, I
don’t think he is around 45. He may be around mid or early 40s, but I don’t think he’s as
old as 45. He is bald. He is kind of bald, but not bald enough and there are not many
wrinkles on his head.
By contrast, in the independent-then-revise sequence, participants often saw that the advice
matched their own estimate (within 2 years 54% of the time) and would then not search for other

Running Head: PUSHING AWAY FROM ADVICE 26
answers. For example, in a pattern observed for many independent-then-revise participants, a
participant who initially said 46 and then saw advice of 45 said: “The other person said 45, so
I’m going to keep the same answer that I had before, which is roughly 45.”
The examples above suggest that the same individual can respond differently depending
on the advice sequence that they are in. An individual who is a “counterfactual match” is likely
to reject advice in the dependent sequence. But that same person, if assigned to the independent-
then-revise sequence, would observe the match and be very confident that the advice is correct.
Study 4
Study 4 investigated the impact of advice sequence on accuracy, using a wider span of
advice centrality. As we discussed in the introduction, previous work has reached differing
conclusions about accuracy. Sniezek and Buckley (1995) found that participants were less
accurate when in the dependent sequence, perhaps because they were biased towards confirming
evidence, whereas Yaniv and Choshen-Hillel (2002) found that participants were more accurate
in the dependent sequence because they gave more equal weight to the advice as opposed to
overweighting their own opinion.
We expected greater statistical independence in the independent-then-revise sequence,
suggesting that the most accurate procedure would be to average the initial answer and the
advice in that condition. This, however, is an ideal procedure that is unlikely to be used in
intuitive revision. Past research has shown that people tend to ignore advice in independent-
then-revise sequences, sticking with their original estimate about 40% of the time (Soll &
Larrick, 2009). We also expected, however, that accuracy in the dependent sequence may suffer
because of the push-away effect for central advice (which is likely to be very accurate because it
is near the mean of many independent judgments), and because of enhanced accessibility for
Running Head: PUSHING AWAY FROM ADVICE 27
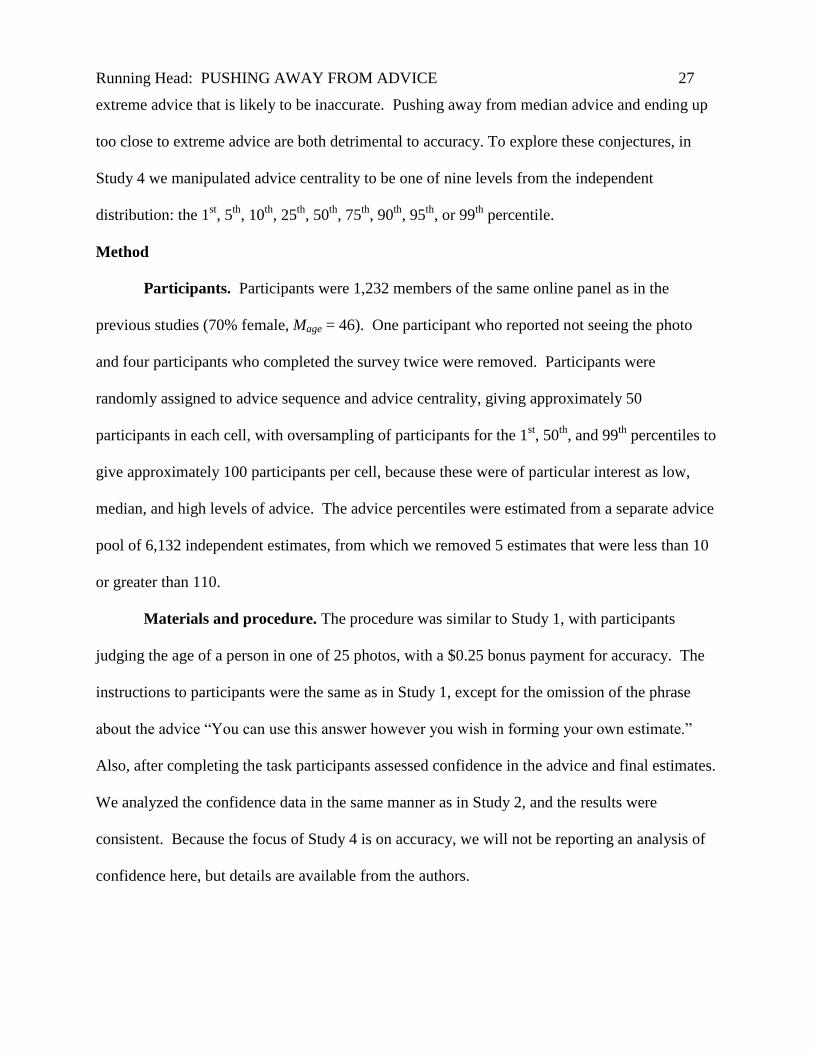
extreme advice that is likely to be inaccurate. Pushing away from median advice and ending up
too close to extreme advice are both detrimental to accuracy. To explore these conjectures, in
Study 4 we manipulated advice centrality to be one of nine levels from the independent
distribution: the 1st, 5
th, 10
th, 25
th, 50
th, 75
th, 90
th, 95
th, or 99
th percentile.
Method
Participants. Participants were 1,232 members of the same online panel as in the
previous studies (70% female, Mage = 46). One participant who reported not seeing the photo
and four participants who completed the survey twice were removed. Participants were
randomly assigned to advice sequence and advice centrality, giving approximately 50
participants in each cell, with oversampling of participants for the 1st, 50
th, and 99
th percentiles to
give approximately 100 participants per cell, because these were of particular interest as low,
median, and high levels of advice. The advice percentiles were estimated from a separate advice
pool of 6,132 independent estimates, from which we removed 5 estimates that were less than 10
or greater than 110.
Materials and procedure. The procedure was similar to Study 1, with participants
judging the age of a person in one of 25 photos, with a $0.25 bonus payment for accuracy. The
instructions to participants were the same as in Study 1, except for the omission of the phrase
about the advice “You can use this answer however you wish in forming your own estimate.”
Also, after completing the task participants assessed confidence in the advice and final estimates.
We analyzed the confidence data in the same manner as in Study 2, and the results were
consistent. Because the focus of Study 4 is on accuracy, we will not be reporting an analysis of
confidence here, but details are available from the authors.

Running Head: PUSHING AWAY FROM ADVICE 28
Results
Because we are interested in the effects of how far the advice is from the median, rather
than whether it is specifically high or low compared to the median, we collapsed our results for
cells of equal advice centrality, such as 25th
/75th
, 10th
/90th
, etc. (Before doing this, we first
confirmed that low and high advice had similar effects.)
Percent of estimates close to the advice. Similar to previous studies, there were fewer
dependent estimates close to the advice than revised estimates for median and 25th
/75th
percentile
advice (see Table 1), χ2(1)
= 13.50, p <.001 and χ
2(1)
= 6.73, p = .01, respectively. However, at
the most extreme levels of advice (10th
/90th
, 5th
/95th
, and 1st/99
th) there was no difference
between the dependent and revised estimates, all χ2s
< 0.6, all ps >.4. This is not surprising given
that counterfactual matches are rare at the extremes.
Absolute distance between advice and estimate. Absolute distances were standardized
as in Study 2 (see Table 1). To analyze the differences between the dependent and revised
estimates, we ran two-sample t-tests for each level of advice centrality. Similar to earlier
analyses, we found that with median advice, dependent estimates were further from the advice
than were revised estimates, t(203) = 3.63, p <.001, whereas with more extreme advice (the
25th
/75th
and 10th
/90th
percentiles), there was no difference, all ts < .55, all ps > .5. However,
with very extreme advice at the 5th
/95th
and 1st/99
th percentiles, dependent estimates trended
closer to the advice than revised estimates, t(198) = 1.66, p = .098, and t(412) = 3.14, p = .002,
showing a pull towards the advice in the dependent sequence.
Accuracy. To explore accuracy, we calculated two different performance metrics for the
dependent and revised estimates at each level of advice centrality. The first metric is the
absolute distance between the estimate and the mean of the independent answers for a photo. The

Running Head: PUSHING AWAY FROM ADVICE 29
conclusion of a large body of research on aggregating opinions is that simple averages perform
best (Clemen, 1989; Einhorn, Hogarth, & Klempner, 1977; Hastie, 1986; Yaniv, 2004). Thus,
this metric allows us to compare how well participants did compared to a prescriptive strategy,
irrespective of whether that strategy happened to perform well for the 25 specific photos (since
luck is a factor). Second, we also looked at realized accuracy—the absolute distance between
the estimate and the true answer for each photo. Results are shown in Figure 4; all distances are
standardized by photo using the distribution of independent estimates from the advice pool.
Lower numbers indicate higher accuracy.
To analyze the differences between the dependent and revised estimates, we ran two-
sample t-tests for each level of advice centrality. Starting with the first metric, when participants
received median advice their dependent estimates were further from the mean of independent
answers than were their revised estimates, t(203) = 3.66, p < .001. There were no differences for
advice of moderate extremity (the 25th
/75th
, 10th
/90th
, and 5th
/95th
percentiles), all ts < 1, all ps >
.4. However, with very extreme advice at the 1st/99
th percentile, dependent estimates were
further from the photo mean than were revised estimates, t (412) = 3.19, p < .001.
We next consider our measure of actual accuracy, which compares estimates to the
correct answers. Here there were no differences between the dependent and revised estimates
with median advice (t(203) = 0.52, p = .605) or with advice that was moderately extreme (the
25th
/75th
, 10th
/90th
, and 5th
/95th
percentiles), all ps > .2. However, with very extreme advice at the
1st/99
th percentile, dependent estimates were significantly further from the truth than were
revised estimates, t (412) = 2.50, p = .013.

Running Head: PUSHING AWAY FROM ADVICE 30
Discussion
Overall, dependent and revised estimates were very similar in accuracy, only differing for
the most extreme advice. Furthermore, participants in both advice sequences performed better
than independent judgments alone for a wide range of advice (See Figure 4). There are two
instances for which we were able to conclude that the advice sequence matters. First, as in
Studies 1-3, at median advice the push-away effect caused dependent estimates to be further
away from the advice. Because the mean or median of many opinions is likely to be very
accurate (e.g., Clemen, 1989; Hastie, 1986), we had expected that this push-away would harm
accuracy. However, this was only directionally true in our data (see Figure 4b). Second, when
the advice was extreme dependent participants were pulled substantially toward the generally
bad advice, harming accuracy. We believe that our data give a slight edge to the independent-
then-revise sequence for those wishing to maximize accuracy—it prevents the pull toward
extreme (bad) advice and it prevents pushing away from median advice. However, this contest
between advice sequences ended in a close call, because there are hints that the dependent
sequence excels with moderately extreme advice.
Overall, there is one very clear prescription that emerges from this study—both advice
sequences are superior to not getting advice at all. Although based on our results we recommend
the independent-then-revise sequence, the data also show that the dependent sequence will be at
least as good in most circumstances.
Study 5
In this final study, we explore the similarities between the dependent condition and the
traditional anchoring paradigm as well as test a boundary condition on the push away-effect.
Our reasoning about the push-away effect posited that upon seeing advice, people in the

Running Head: PUSHING AWAY FROM ADVICE 31
dependent condition implicitly ask the question – Is the answer higher or lower than that? This
is precisely the question that is asked explicitly in most anchoring studies. In Study 5, we tested
the effect of this explicit comparative question by including a version of our dependent condition
that contains this comparative question, making it similar to the traditional anchoring paradigm.
Additionally, we explored whether the source of the advice makes any difference in how
people respond. Specifically, does it matter whether the source is believed to be a social one such
as another person (as used thus far in our dependent and independent-then-revise conditions), or
a nonsocial source such as a randomly generated number (as in many traditional anchoring
studies)? If the push-away effect were observed only for social sources, it would suggest
different causal mechanisms than if the effect were observed for nonsocial sources as well. For
example, if the push-away effect occurred more strongly for social sources, it suggests that
people may be motivated by reactance or need for uniqueness (which we return to in the General
Discussion). For the remainder of this study, we will refer to the “prompt number” or simply
“prompt” as a common way of describing the identical information presented as “advice from a
poll” in the social condition and a “number from a pool” in the nonsocial condition.
Finally, Study 5 included very extreme advice, in an attempt to replicate the boundary
condition on the push-away effect found in Study 4. We expected that, at very extreme prompts,
the push-away effect would be swamped by the pulling effects of accessibility, yielding final
judgments closer to the prompt than if people gave an independent answer and reversing the
pattern we have observed reliably for median prompts. Moreover, we expected that this reversal
would happen for both social and nonsocial sources, and regardless of whether a comparative
question was asked. Such a result would support our claim that a common cognitive process
underlies both dependent advice taking and traditional anchoring tasks.
Running Head: PUSHING AWAY FROM ADVICE 32
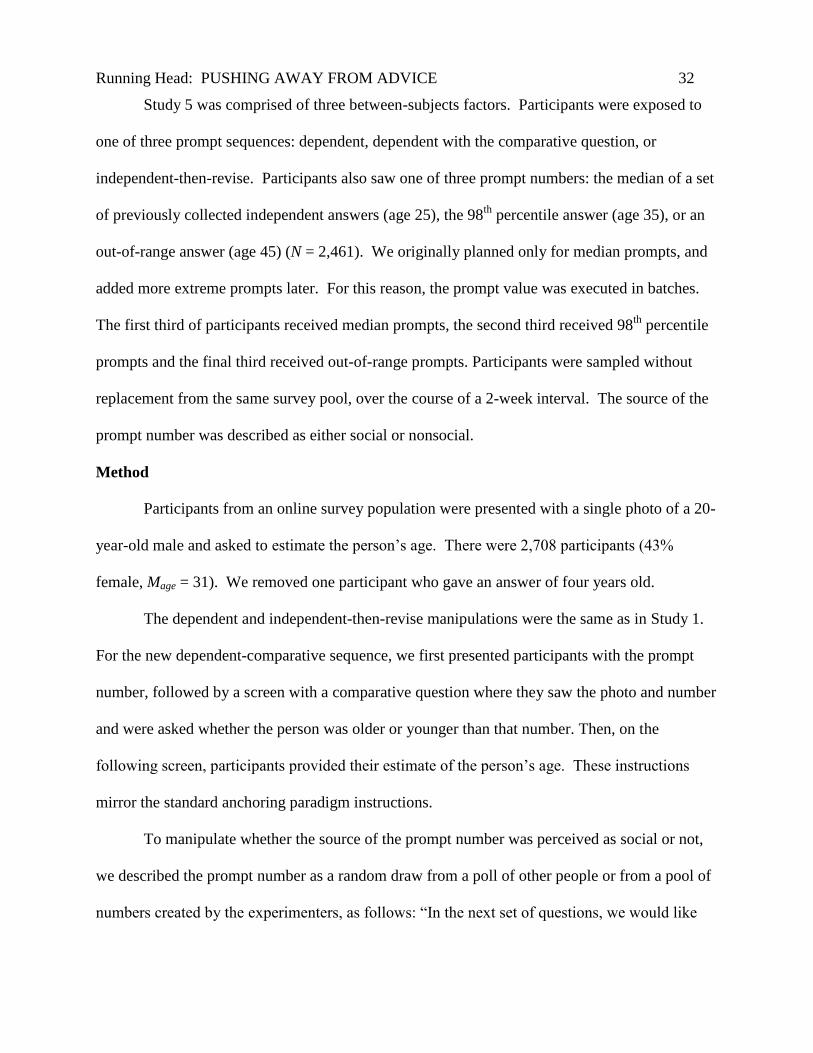
Study 5 was comprised of three between-subjects factors. Participants were exposed to
one of three prompt sequences: dependent, dependent with the comparative question, or
independent-then-revise. Participants also saw one of three prompt numbers: the median of a set
of previously collected independent answers (age 25), the 98th
percentile answer (age 35), or an
out-of-range answer (age 45) (N = 2,461). We originally planned only for median prompts, and
added more extreme prompts later. For this reason, the prompt value was executed in batches.
The first third of participants received median prompts, the second third received 98th
percentile
prompts and the final third received out-of-range prompts. Participants were sampled without
replacement from the same survey pool, over the course of a 2-week interval. The source of the
prompt number was described as either social or nonsocial.
Method
Participants from an online survey population were presented with a single photo of a 20-
year-old male and asked to estimate the person’s age. There were 2,708 participants (43%
female, Mage = 31). We removed one participant who gave an answer of four years old.
The dependent and independent-then-revise manipulations were the same as in Study 1.
For the new dependent-comparative sequence, we first presented participants with the prompt
number, followed by a screen with a comparative question where they saw the photo and number
and were asked whether the person was older or younger than that number. Then, on the
following screen, participants provided their estimate of the person’s age. These instructions
mirror the standard anchoring paradigm instructions.
To manipulate whether the source of the prompt number was perceived as social or not,
we described the prompt number as a random draw from a poll of other people or from a pool of
numbers created by the experimenters, as follows: “In the next set of questions, we would like

Running Head: PUSHING AWAY FROM ADVICE 33
you to estimate the age of a person in a photograph. [We took a poll with the photograph, and
people’s estimates were] / {We created a pool of numbers that were} all within 20 years of the
right answer. Roughly half the estimates were within five years of the right answer. The
computer will randomly select [an estimate from one person in our poll] / {a number from our
pool} to show you.” (The language was adjusted slightly for the out-of-range condition, which
used age 45, to say that all answers were “within 25 years of the right answer,” rather than 20
years as in the other conditions.) We reminded participants of the source of the prompt number
just prior to displaying it, and when it displayed it was always labeled as either a “randomly
selected estimate from one person in our poll” or a “randomly selected number from our pool.”
Results
Percent of estimates close to the prompt. Table 5 presents the percent of estimates
close to the prompt. We suggested that the dependent and dependent-comparative prompt
sequences are based on similar processes and therefore would show similar results for the
percent of estimates close to the prompt, which they did. As shown in Table 5, there was no
difference in close answers (within 2 years) in the dependent and dependent-comparative
sequences for the median prompt, nor for the 98th percentile prompt. For out-of-range prompts,
there were not enough close estimates to run any meaningful tests (less than 0.5% of estimates
were close). We also replicated the push-away effect with the median prompt. There were fewer
dependent estimates and dependent-comparative estimates close to the prompt, compared to
either the independent or the revised estimates (both of which were provided by participants in
the independent-then-revise condition).
We also tested whether there was any interaction of the source with prompt sequence, or
any main effect of source. For the median and 98th percentile prompts, we ran a logistic

Running Head: PUSHING AWAY FROM ADVICE 34
regression on the percent of estimates close to the prompt, with source coded as social = 0.5 and
nonsocial = -0.5, prompt sequence effects-coded, and their interaction. (For out-of-range
prompts, there were not enough close estimates to run any meaningful tests—less than 0.5% of
estimates were close). Participants in the nonsocial condition trended toward giving fewer
estimates close to the prompt than those in the social condition for median prompts (50% in
nonsocial vs. 56% in social, b = 0.23, Wald χ2 = 2.71, p = .100), but not for 98th percentile
prompts (7% in nonsocial vs. 7% in social, b = -0.06, Wald χ2 = 0.06, p = .813). Because all
interactions were nonsignificant (all Wald χ2s < 2.00, all ps > .15), source has no bearing on the
aforementioned comparisons between advice sequences.
Absolute distance between the prompt and estimate. The last four columns of Table 5
show the pairwise comparisons between the different sequences. Also included are comparisons
with the independent estimates (which are paired tests when comparing with the revised
estimates). We highlight three aspects of these results. First, the two types of dependent
estimates were very similar to each other and moved in tandem across the prompt values.
Apparently, it did not matter whether or not participants were asked a comparative “higher or
lower” question before providing their own answers. Second, across all levels of the prompt, the
revised estimates are closer to the prompt than are the independents. This simply shows that, as
in advice-taking research, participants who began by forming initial opinions tended to revise
toward the prompt. Third, and critically, the relation of the dependent estimates (both types) to
the revised and independent estimates flips as the prompt becomes increasingly extreme. At the
median prompt, the dependent estimates exhibit a net push-away effect, in the sense that they are
on average further away from the prompt than what people say when the prompt is absent (i.e.,
the independent estimates). However, when the prompt was out-of-range, the dependent

Running Head: PUSHING AWAY FROM ADVICE 35
estimates were pulled towards the prompt even more so than the revised estimates. Overall,
these results show that the impact of “pushing away” from the prompt depends on its location.
The net push-away effect is strongest when the prompt is at the median. As the prompt becomes
increasingly extreme, the net push-away effect attenuates, because the pull towards the prompt
dominates the push-away.
Analogous to our analysis of percent close, we also ran a separate ANOVA (source ×
prompt sequence) at each level of the prompt, this time with absolute distance as the dependent
measure. There were no effects of source at the median or 98th percentile. For out-of-range
prompts, a main effect of source (F = 6.17, p = .013) was qualified by a source × prompt
sequence interaction (F = 3.31, p = .037). Whereas the independent-then-revised distances were
unaffected by the prompt sequence, dependent estimates were closer for social estimates than
nonsocial ones (13.61 vs. 14.87, averaging over the two types of dependent sequences). Even so,
the overall pattern and significance levels were similar for both types of sources, which is why
we collapsed across them for purposes of presentation in Table 5.
Discussion
One of our goals in Study 5 was to investigate whether there is something special about
advice taking that differentiates it from other situations in which people might be influenced by
anchors. We identified three ways in which a dependent advice taking task differs from a
traditional anchoring task. First, in anchoring tasks the prompt number is typically introduced
with a comparative question (e.g., “Is the person older or younger than 50?”). This differs from
advice taking studies, in which the prompt number is offered as a statement of fact (e.g., “The
person is 50”). Second, in anchoring tasks the prompt number typically does not originate from
a social source, whereas in advice taking studies it almost always does. Third, with occasional

Running Head: PUSHING AWAY FROM ADVICE 36
exceptions, anchoring studies typically offer extreme prompt numbers, sometimes even beyond
the far edges of what people would report on their own.
Overall, we found that dependent advice-taking and traditional anchoring tasks have
much in common in terms of their observed effects. The presence or absence of a comparative
question made no discernable difference. The effect of a social source was also minimal—
although there was some evidence that participants gave answers that were closer to the prompt
when the prompt number was described as coming from a poll of participants rather than from a
pool of numbers. This effect was most pronounced in dependent sequences with an out-of-range
prompt. The result suggests that although dependent participants are influenced by accessibility,
they may still engage in more search for nonsocial sources, presumably because they perceive
them to be less credible. In contrast, independent-then-revise participants are likely to ignore
prompts that are very distant from their own opinions, so the social/nonsocial distinction is less
likely to have an impact on them.
Finally, we identified a boundary condition to the push-away effect with the dependent
sequences. As in Studies 1-4, when the prompt number was positioned at the median of the
distribution of independent answers, dependent responses were less likely to be close to it, and
were on average further away from it. Also, as in Studies 1-4, the revisions from the
independent-then-revise condition were influenced by the median prompt such that they were
more likely to be close to the prompt than were the independent estimates. Study 5 showed
clearly, however, that as the prompt position becomes more extreme the entire pattern reverses.
For out-of-range prompts that are typical of many anchoring studies, the extreme prompt exerts
much more pull on dependent participants than on those who are revising an initial independent
guess, leaving dependent participants closer to the extreme number.

Running Head: PUSHING AWAY FROM ADVICE 37
We emphasize that the reversal we have described happened for both social and
nonsocial sources, and did not depend on whether or not a comparative question was asked. The
balance between the pull towards the prompt and the push away from the prompt fundamentally
depends on the position of the advice or anchor within the distribution of independent answers.
Our results strongly suggest that a common mechanism underlies influence in both dependent
advice taking tasks (even those lacking a comparative question) and in traditional anchoring
tasks. In the General Discussion that follows, we elaborate on how we think this mechanism
operates, and discuss additional potential moderators of how they balance out to produce an
overall push-away or pull-toward effect.
General Discussion
In a series of five studies we found that individuals in a dependent advice-taking
sequence gave fewer estimates close to the advice compared to the revised answers of
individuals who first formed independent opinions before seeing advice. Whereas participants in
the independent-then-revise sequence tended to move toward advice, the answers of dependent
individuals were, ironically, sometimes further away from the advice than independent answers
given by people who did not see advice at all (Studies 1 and 3). We posited that this push-away
effect occurs when people lack sufficient confidence in the advice and test alternative answers.
In doing so, they may engage in biased search by choosing a direction and favoring evidence
consistent with their choice. The opposite effect occurs in the independent-then-revise sequence:
Advice that closely matches the subjects’ independent answers boosts their confidence in the
advice. Consistent with this sketch of the process, confidence mediated the relationship between
advice sequence and the degree of push-away (Study 2), and a verbal protocol analysis showed

Running Head: PUSHING AWAY FROM ADVICE 38
that the dependent sequence causes people to question the advice and to attend to cues that point
toward a different answer (Study 3).
The push-away effect is surprising in light of decades of research showing that anchors
have a profound “pull-toward” influence on judgment. We examined two possible factors that
might account for this discrepancy with traditional anchoring results: the typical presence of a
comparative higher/lower question in anchoring studies, and the typical presence of a social
source in advice-taking studies. Neither factor made a difference in the degree of “pulling
toward” or “pushing away.” In fact, we observed aggregate push-away and pull-toward effects
in both advice-taking and anchoring tasks (Study 5). The critical difference between dependent
advice-taking and anchoring is not the nature of the task or information source, but rather the
location of the prompt in the distribution of independent answers. In dependent sequences,
central advice and anchors lead to a push-away effect, whereas extreme advice and anchors
produce a pull-toward effect.
We were also interested in the implications of the advice sequence for accuracy (Study
4). Participants in both sequences benefited from advice compared to not receiving advice at all.
However, if there is a choice we recommend the independent-then-revise sequence, for two
reasons. First, at median advice participants who first formed an independent opinion were
closer to the mean of the distribution of independent estimates than were those who did not. This
is noteworthy because average guesses in a crowd tend to cancel out high and low errors and can
thus be very accurate (Armstrong, 2001; Clemen, 1989; Hastie, 1986; Yaniv, 2004). Second,
dependent participants were pulled toward bad advice in the extreme tails of the independent
distribution, leading to greatly diminished accuracy. In comparison, participants in the
independent-then-revise sequence were largely immune to the deleterious effect of bad advice.

Running Head: PUSHING AWAY FROM ADVICE 39
We note, however, that extreme advice is by definition rare, and with this one exception
participants in both advice sequences performed similarly well – and better than independent
judgments, for a wide range of advice.
The remainder of our discussion is organized as follows. First, we discuss the role of
adjustment in advice taking and anchoring. Next, we discuss boundary conditions and
moderators of the push-away effect. Finally, we consider two alternative explanations for the
push-away effect, psychological reactance and need for uniqueness, and we describe the results
of two additional studies we ran which suggest that these mechanisms did not contribute to the
patterns we found.
Adjustment in Advice Taking and Anchoring
Our results join an accumulating body of evidence suggesting that anchoring can occur as
the result of a controlled and effortful adjustment process (Epley & Gilovich, 2001, 2006;
Simmons et al., 2010) in addition to automatic processes such as selective accessibility
(Chapman & Johnson, 1999; Mussweiler & Strack, 1999). Although adjustment was the original
explanation for anchoring (Tversky & Kahneman, 1974), it fell out of favor because anchoring
effects were insensitive to plausible moderators of adjustment such as incentives and because
process tracing methods did not uncover evidence of adjustment (see Chapman & Johnson, 2002,
for a review). Subsequently, a new view of anchoring as selective accessibility came to
dominate (Chapman & Johnson, 1994, 1999; Mussweiler & Strack, 1999; Strack & Mussweiler
1997). However, additional research revealed that people do in fact adjust away from self-
generated anchors (Epley & Gilovich, 2001, 2006). For example, in the process of estimating
the boiling point of water on Mt. Everest, a person might first retrieve the boiling point of water
at sea level, and then adjust downward. Recently, Simmons, LeBeouf, & Nelson (2010) showed

Running Head: PUSHING AWAY FROM ADVICE 40
that people effortfully adjust away from experimenter-provided anchors as well. They argued
that the adjustment process is often difficult to detect because people may adjust away from an
anchor and then adjust back towards it, backtracking over adjustments that were already made.
When people are sure of the direction to adjust, then their adjustments are more visible and are
sensitive to factors predicted to influence the motivation to adjust, such as monetary incentives
(Janiszewski & Uy, 2008; Simmons et al., 2010). Similarly, our results also show that people
choose a direction and adjust away from advice.
Corroborating our results, a recent study by Simmons (2013) illustrates a similar pattern
in which there will be systematic adjustment away from an anchor resulting in a final distribution
shifted away from independent judgments. In these studies, participants were shown the average
estimate from a group of prior participants for extreme stimuli such as the weight of an adult
elephant, and asked whether they thought the answer was higher or lower than that. Because the
concept elephant is associated with the concept big, people tend to say “higher” and test answers
greater than the provided group mean. This has two consequences. First, successive groups give
increasingly higher estimates, because each group adjusts upward from the provided mean.
Second, and most relevant to our thesis, our analysis suggests that the second group (and
possibly the next several) will exhibit a net push-away effect—their answers will be further away
from the anchor than had they not been provided an anchor at all. This is because for the second
group the anchor is near the center of a set of independent estimates, and any systematic
deviation from that will tend to produce answers that are on average further away from that
center point.
It is important to note that like Simmons et al. (2010), we do not view adjustment and
accessibility as competing explanations, but rather as complementary ones. The answer given by

Running Head: PUSHING AWAY FROM ADVICE 41
a participant after exposure to advice is the result of a balance of “push” forces that push the
answer away from the advice, such as adjustment when confidence in the advice is low, and
“pull” forces that pull the answer toward the advice, such as accessibility. Our work is notable
because, to our knowledge, it contains some of the first studies to demonstrate both push and pull
within a single study, affirming the explanations as complementary, not competing.
Additionally, we believe it is helpful to characterize these forces as “push” and “pull”, for
two reasons: First, although we have provided evidence for the cognitive mechanism underlying
the push-away effect shown here, many other mechanisms can be posited for push and pull, and
this characterization allows for other mechanisms to operate. For example, pull has previously
been theorized to be caused by selective accessibility (Chapman & Johnson, 1999; Mussweiler &
Strack, 1999), scale shift (Frederick and Mochon, 2012), conversational norms (Grice, 1975), or
a deliberate weighting strategy (in independent-then-revise sequences, Soll & Larrick, 2009);
push has been theorized to be caused by adjustment (Epley & Gilovich, 2001, 2006;
Simmons et al., 2010; Tversky & Kahneman, 1974), semantic contrast (Chernev, 2011;
Mussweiler & Strack, 2000), reactance (Brehm, 1966), and need for uniqueness (Snyder &
Fromkin, 1977). Characterizing the forces as “push” and “pull” reminds us that any number of
mechanisms can underlie these forces at a given time, rather than simply assuming it is solely
adjustment or accessibility. Second, using the terms “push” and “pull” brings attention to the
fact that both push and pull can operate, and the observed effect will be the aggregate of the two
forces. At some times, push forces will dominate; at other times, pull forces will dominate. The
question therefore becomes not whether anchors can push or pull, but instead when we will
observe an aggregate push or pull, and which mechanisms are responsible in that instance (see
Mochon & Frederick, 2013, for a similar discussion).

Running Head: PUSHING AWAY FROM ADVICE 42
One reason our studies were able to bring to light the push-away phenomenon observed
here is the nature of the values used as advice. Our advice values were not irrelevant numbers
that represented extremes of a distribution of independent estimates (i.e. Chapman & Johnson,
1999; Russo & Schoemaker, 1989; Tversky & Kahneman, 1974) but rather typical responses
generated by another person that represented the central tendency of independent estimates. The
anchoring literature has often employed values that are quite different from what people say if
unanchored, such as the 15th
and 85th
percentiles (Jacowitz & Kahneman, 1995; Kahneman,
1992). Our studies show that anchors that match the modal or median response can be used to
illuminate adjustment processes that were previously hidden (Simmons et al., 2010).
Additionally, the use of large sample sizes from subject pools available on the internet allowed
us to compare judgments to the independent distribution. This made it possible to answer the
“what if” question of how the presence of the advice or anchor altered judgments compared to
the counterfactual. In a between-subjects comparison, we were able to demonstrate that there is
a net movement away from what people would have said independently. Future research
investigating the net impact of “push” and “pull” forces should exploit the powerful insights
available when reactions to advice (and anchors) are compared with a “what if” distribution of
independent judgments.
Boundary Conditions and Moderators
Given that our finding of the push-away effect differs from the pull effect traditionally
found in anchoring studies, it is important to discuss potential boundary conditions and
moderators. The moderating role of advice extremity was demonstrated in Studies 4 and 5,
which we briefly review here. We also offer some preliminary thoughts on three additional
potential moderators: nature of the stimuli, degree of knowledge, and cognitive effort.
Running Head: PUSHING AWAY FROM ADVICE 43
Advice extremity. Advice extremity moderates the balance between the push and pull
forces that determine whether or not, in the aggregate, there is an overall push-away or pull-
toward effect. In the dependent advice sequence, push forces (e.g., testing higher or lower
answers and adjusting) are likely to be more impactful for individuals who would have given
independent answers near the advice, and pull forces (e.g., accessibility of supporting evidence)
are likely to dominate for those whose independent answers would have been distant from the
advice. It is the balance of individuals who primarily push-away from the advice (relative to
what they would have said) or are pulled toward it that determines what happens in the
aggregate. We observed an overall push-away effect at median advice because answers near the
median are the most common, and therefore there are many individuals for whom push forces
dominate. The reverse happens for extreme advice—here pull-forces have the stronger effect for
most individuals. We propose that advice extremity does not alter the psychological process.
Instead, we believe that the same psychological processes, which include both push and pull
forces, produces a different net outcome as a function of whether the advice is located near the
median of the independent distribution or at an extreme. Overall, we find that post-advice
estimates are closer to advice in the independent-then-revise sequence than in the dependent
sequence when advice is at the median, but further away from the advice when it is extreme.
Stimuli. Certain properties of the stimuli could potentially act as boundary conditions on
the push away-effect. Our proposed mechanism requires that people ask themselves whether the
answer is higher or lower than the advice, choose a side based on available cues, and then recruit
evidence consistent with that direction, all of which could be affected by properties of the
stimuli. The stimuli most likely need to have rich cues for judgment to allow people to enact the
proposed mechanism. Faces, for example, have multiple features indicative of age. However, if

Running Head: PUSHING AWAY FROM ADVICE 44
the stimuli do not have rich cues to judgment, people may have a hard time choosing a side and
adjusting based on cues, which would dampen the push-away effect. Also, it may be difficult to
detect the push away effect for stimuli that have large scales, such as historic dates or distances
between cities. If individuals push away from advice in units that are small relative to the scale
of answers, the movements may be hard to detect.
Knowledge effects. We expect that the magnitude of the push-away or pull-toward effect
would also depend on the amount of knowledge possessed. At one extreme the decision maker
knows nothing. An example would be a “blindfolded” task in which the question itself is
masked (Yaniv & Choshen-Hillel, 2012). In this case advice would likely have a strong pull
effect, due to the complete absence of cues that might support alternative answers. At the other
extreme the decision maker can retrieve the correct answer from memory (Gigerenzer et al.,
1991), such as the fact that Abraham Lincoln was the 16th
President of the United States. Advice
in this situation would likely be ignored, so at the individual level there would be no push or pull.
Between these two extremes, however, we expect that judgment would depend on a balance
between push and pull forces. We expect that push-away effects would be stronger when people
believe that they know how to use the cues to adjust from the advice. With the faces,
participants already had a lifetime of experience interpreting cues such as wrinkles, sagging skin,
and baldness. However, individuals who do not believe they know how to use cues (such as with
an unfamiliar task or a complex domain) may be less critical about the advice and less certain
about which direction to adjust (Simmons et al., 2010).
Cognitive effort. The mechanism we propose for the push-away effect requires cognitive
effort: Individuals must have a sense that they are not completely confident in the advice,
consider whether the true answer is higher or lower than the advice, and then attend to cues and

Running Head: PUSHING AWAY FROM ADVICE 45
choose a final answer. If it is not possible to exert cognitive effort, we predict that the push-
away effect will not materialize. The amount of cognitive effort expended by participants could
be impacted by factors such as cognitive load, time pressure, or fatigue from completing multiple
trials. In the experiments reported here, we did not expose participants to any of these effort-
limiting factors: The majority of the studies we presented involved single trials where people saw
a single photo and estimated the person’s age, without any time limits or distractions. Therefore,
to test the impact of cognitive effort limited by fatigue, we ran two supplemental experiments
with multiple trials and found a diminished push-away effect on later trials. In light of this, it is
interesting that the talk aloud (Study 3) did show the push-away effect (at least directionally)
with multiple photos. We believe this occurred because the talk aloud task was highly engaging
and performed in the presence of an experimenter, both of which are likely to induce sustained
cognitive effort.
Alternative Explanations
We have theorized that the push-away effect occurs in dependent sequences because
people lack confidence in the advice, leading them to ask if the true answer is higher or lower
and then recruit evidence that favors the chosen side. Making a prior independent judgment
provides a frame of reference for judging advice, which boosts confidence in median advice and
leads to less search and adjustment. However, in addition to the “cold” cognitive process we
have proposed, one might speculate that “hot” affective and motivational processes such as
psychological reactance and need for uniqueness could also play a role in the push-away effect.
We ran two additional studies, described below, to investigate whether these alternative
mechanisms might have contributed to our results.

Running Head: PUSHING AWAY FROM ADVICE 46
Psychological reactance. Psychological reactance can be conceived of as both a state
elicited by a threat to freedom (Brehm, 1966) as well as a personality trait that indicates one’s
proneness to experience a state of reactance (Hong & Faedda, 1996). Reactance could result in
the patterns observed here if those in the dependent condition perceive that the presence of
advice threatens their autonomy. They could then conceivably restore autonomy by pushing
away from the advice. To test this, we ran a two-way between subjects design with an online
survey panel (N = 1473), where participants were exposed to one of three advice sequences
(dependent, independent-then-revise, or an independent sequence that never saw advice), and
completed scales for both state and trait reactance. The advice sequence did not affect the level
of state reactance, and neither type of reactance correlated with our advice taking measures,
suggesting that reactance is not an important mechanism in the paradigms we have used.
Need for uniqueness. In another study, we tested whether the push-away effect might be
explained by need-for-uniqueness (NFU), “a positive striving for differentness relative to other
people” (Snyder & Fromkin, 1977) using subjects from an online population (N = 572). As in
previous studies, we replicated the push-away effect—participants in the dependent sequence
were much less likely to report an answer near the advice. However, this pattern was unrelated
to NFU. The results in Study 5 for social versus nonsocial advice provide additional evidence
against NFU having an effect. Since NFU is defined in terms of having similar opinions or
preferences to other people, we might expect to see people push away more from social as
opposed to nonsocial sources, but in Study 5 we did not find this. Based on all of these results,
NFU does not appear to play an important role in producing the push-away effect.
Conclusion
The process by which people respond to advice (or an anchor) is complex, and potentially

Running Head: PUSHING AWAY FROM ADVICE 47
involves a multitude of push and pull mechanisms, the balance of which can lead to surprising
results. Although pull mechanisms such as selective accessibility tend to dominate for advice in
the far tails of the distribution of independent answers, what happens for central advice depends
on the advice sequence. Whereas central advice tends to have an overall validating effect in the
independent-then-revise sequence, the adjustment process in the dependent sequence produces a
push-away effect such that answers are often further from the advice than had the advice not
been received at all.
Thus, the sequence in which one receives advice matters, but in unexpected ways.
Giving advice too early, before recipients can form their initial opinion, can decrease the
confidence that the recipient has in the advice. This, in turn, decreases the chances the recipient
will give estimates close to the advice. Hence, our recommendation to would-be advisors who
want their advice to be followed closely: Remember that in advice-giving, as with many other
aspects of life, good things come to those who wait.

Running Head: PUSHING AWAY FROM ADVICE 48
References
Armstrong, J. S. (2001). Combining forecasts. In J.S. Armstrong (Ed), Principles of forecasting:
A handbook for researchers and practitioners (pp. 417-439). New York: Kluwer.
Bonaccio, S., & Dalal, R. S. (2006). Advice taking and decision-making: An integrative
literature review, and implications for the organizational sciences. Organizational
Behavior and Human Decision Processes, 101(2), 127-151. doi:
10.1016/j.obhdp.2006.07.001
Brehm, J. W. (1966). A theory of psychological reactance. San Diego, CA: Academic Press.
Budescu, D. V., & Yu, H.-T. (2007). Aggregation of opinions based on correlated cues and
advisors. Journal of Behavioral Decision Making, 20(2), 153-177. doi: 10.1002/bdm.547
Chapman, G., & Johnson, E. (1994). The limits of anchoring. Journal of Behavioral Decision
Making, 7(4), 223-242. doi: 10.1002/bdm.3960070402
Chapman, G., & Johnson, E. (1999). Anchoring, activation, and the construction of values.
Organizational Behavior and Human Decision Processes, 79, 115-153. doi:
10.1006/obhd.1999.2841
Chapman, G., & Johnson, E. J. (2002). Incorporating the irrelevant: Anchors in judgments of
belief and value. In T. Gilovich, D. Griffin & D. Kahneman (Eds.), Heuristics and
biases: The psychology of intuitive judgment (pp. 120-138). New York: Cambridge
University Press.
Chernev, A. (2011). Semantic anchoring in sequential evaluations of vices and virtues. Journal
of Consumer Research, 37(5), 761-774. doi: 10.1086/656731
Clemen, R. T. (1989). Combining forecasts: A review and annotated bibliography. International
Journal of Forecasting, 5(4), 559-583. doi: 10.1016/0169-2070(89)90012-5

Running Head: PUSHING AWAY FROM ADVICE 49
Einhorn, H., Hogarth, R., & Klempner, E. (1977). Quality of group judgment. Psychological
Bulletin, 84(1), 158-172. doi: 10.1037/0033-2909.84.1.158
Epley, N. (2004). A tale of tuned decks? Anchoring as accessibility and anchoring as adjustment.
In D. J. Koehler & N. Harvey (Eds.), The Blackwell handbook of judgment and decision
making (pp. 240–256). Malden, MA: Blackwell Publishing.
Epley, N., & Gilovich, T. (2001). Putting adjustment back in the anchoring and adjustment
heuristic: Differential processing of self-generated and experimenter-provided anchors.
Psychological Science, 12(5), 391-396. doi: 10.1111/1467-9280.00372
Epley, N., & Gilovich, T. (2006). The anchoring-and-adjustment heuristic. Psychological
Science, 17(4), 311-318.
Ericsson, K. A., & Simon, H. A. (1993). Protocol analysis. Cambridge, MA: MIT Press.
Frederick, S. W., & Mochon, D. (2012). A scale distortion theory of anchoring. Journal of
Experimental Psychology: General, 141(1), 124-133. doi: 10.1037/a0024006
Gigerenzer, G., Hoffrage, U., & Kleinbölting, H. (1991). Probabilistic mental models: A
Brunswikian theory of confidence. Psychological Review, 98(4), 506-528. doi:
10.1037/0033-295X.98.4.506
Gino, F. (2008). Do we listen to advice just because we paid for it? The impact of advice cost on
its use. Organizational Behavior and Human Decision Processes, 107(2), 234-245. doi:
10.1016/j.obhdp.2008.03.001
Gino, F., Brooks, A. W., & Schweitzer, M. E. (2012). Anxiety, advice, and the ability to discern:
Feeling anxious motivates individuals to seek and use advice. Journal of Personality and
Social Psychology, 102(3), 497-512. doi: 10.1037/a0026413

Running Head: PUSHING AWAY FROM ADVICE 50
Gino, F., & Schweitzer, M. E. (2008). Blinded by anger or feeling the love: How emotions
influence advice taking. Journal of Applied Psychology, 93(5), 1165-1173. doi:
10.1037/0021-9010.93.5.1165
Grice, H. P. (1975). Logic and conversation. In P. Cole & J. L. Morgan (Eds.), Speech acts,
syntax, and semantics. New York: Seminar Press.
Harvey, N., & Fischer, I. (1997). Taking advice: Accepting help, improving judgment, and
sharing responsibility. Organizational Behavior and Human Decision Processes, 70(2),
117-133. doi: 10.1006/obhd.1997.2697
Hastie, R. (1986). Experimental evidence on group accuracy. In B. Grofman & G. Owen (Eds.),
Decision research (Vol. 2, pp. 129-157).
Hastie, R., & Kameda, T. (2005). The robust beauty of majority rules in group decisions.
Psychological Review, 112(2), 494-508. doi: 10.1037/0033-295X.112.2.494
Hayes, A. F. (2012). PROCESS: A versatile computational tool for observed variable mediation,
moderation, and conditional process modeling. [White paper]. Retrieved from
http://www.afhayes.com/public/process2012.pdf
Heath, C., & Heath, D. (2013). Decisive: How to make better choices in life and work. New
York, NY: Random House.
Hong, S. M., & Faedda, S. (1996). Refinement of the Hong psychological reactance scale.
Educational and Psychological Measurement, 56(1), 173. doi:
10.1177/0013164496056001014
Jacowitz, K. E., & Kahneman, D. (1995). Measures of anchoring in estimation tasks. Personality
and Social Psychology Bulletin, 21(11), 1161-1166. doi: 10.1177/01461672952111004

Running Head: PUSHING AWAY FROM ADVICE 51
Janiszewski, C., & Uy, D. (2008). Precision of the anchor influences the amount of adjustment.
Psychological Science, 19(2), 121-127. doi: 10.1111/j.1467-9280.2008.02057.x
Kahneman, D. (1992). Reference points, anchors, norms, and mixed feelings. Organizational
Behavior and Human Decision Processes, 51(2), 296-312. doi: 10.1016/0749-
5978(92)90015-Y
Kennedy, K., Hope, K., & Raz, N. (2009). Life span adult faces: Norms for age, familiarity,
memorability, mood, and picture quality. Experimental Aging Research, 35(2), 268-275.
doi: 10.1080/03610730902720638
Koehler, D., & Beauregard, T. (2006). Illusion of confirmation from exposure to another's
hypothesis. Journal of Behavioral Decision Making, 19(1), 61. doi: 10.1002/bdm.513
Larrick, R. P., & Soll, J. B. (2006). Intuitions about combining opinions: Misappreciation of the
averaging principle. Management Science, 52(1), 111-127. doi: 10.1287/mnsc.1050.0459
Mannes, A. E. (2009). Are we wise about the wisdom of crowds? The use of group judgments in
belief revision. Management Science, 55(8), 1267-1279. doi: 10.1287/mnsc.1090.1031
Minear, M., & Park, D. (2004). A lifespan database of adult facial stimuli. Behavior Research
Methods, 36(4), 630-633. doi: 10.3758/BF03206543
Minson, J. A., Liberman, V., & Ross, L. (2011). Two to tango: Effects of collaboration and
disagreement on dyadic judgment. Personality and Social Psychology Bulletin, 37(10),
1325-1338. doi: 10.1177/0146167211410436
Mochon, D., & Frederick, S. (2013). Anchoring in sequential judgments. Organizational
Behavior and Human Decision Processes, 122(1), 69-79. doi:
10.1016/j.obhdp.2013.04.002

Running Head: PUSHING AWAY FROM ADVICE 52
Mussweiler, T., & Strack, F. (1999). Hypothesis-consistent testing and semantic priming in the
anchoring paradigm: A selective accessibility model. Journal of Experimental Social
Psychology, 35(2), 136-164. doi: 10.1006/jesp.1998.1364
Mussweiler, T., & Strack, F. (2000). The 'relative self': Informational and judgmental
consequences of comparative self-evaluation. Journal of Personality and Social
Psychology, 79(1), 23-38. doi: 10.1037/0022-3514.79.1.23
Russo, J., & Schoemaker, P. (1989). Decision traps: Ten barriers to brilliant decision-making
and how to overcome them. New York: Doubleday.
Schkade, D. A., & Payne, J. W. (1994). How people respond to contingent valuation questions:
A verbal protocol analysis of willingness to pay for an environmental regulation. Journal
of Environmental Economics and Management, 26(1), 88-109. doi:
10.1006/jeem.1994.1006
See, K. E., Morrison, E. W., Rothman, N. B., & Soll, J. B. (2011). The detrimental effects of
power on confidence, advice taking, and accuracy. Organizational Behavior and Human
Decision Processes, 116, 272-285. doi: 10.1016/j.obhdp.2011.07.006
Simmons, J. P. (2013). Elephants weigh more than... elephants: Intuitive biases can generate
prediction bubbles. Paper presented at the meeting of the Society for Judgment and
Decision Making, Toronto, ON.
Simmons, J. P., LeBoeuf, R. A., & Nelson, L. D. (2010). The effect of accuracy motivation on
anchoring and adjustment: Do people adjust from provided anchors? Journal of
Personality and Social Psychology, 99(6), 917. doi: 10.1037/a0021540

Running Head: PUSHING AWAY FROM ADVICE 53
Sniezek, J. A., & Buckley, T. (1995). Cueing and cognitive conflict in judge-advisor decision
making. Organizational Behavior and Human Decision Processes, 62(2), 159-174. doi:
10.1006/obhd.1995.1040
Snyder, C. R., & Fromkin, H. L. (1977). Abnormality as a positive characteristic: The
development and validation of a scale measuring need for uniqueness. Journal of
Abnormal Psychology, 86(5), 518-527. doi: 10.1037/0021-843X.86.5.518
Soll, J. B., & Larrick, R. P. (2009). Strategies for revising judgment: How, and how well, do
people use others’ opinions. Journal of Experimental Psychology: Learning, Memory,
and Cognition, 35(3), 780-805. doi: 10.1037/a0015145
Soll, J. B., & Mannes, A. E. (2011). Judgmental aggregation strategies depend on whether the
self is involved. International Journal of Forecasting, 27(1), 81-102.
doi: 10.1016/j.ijforecast.2010.05.003
Strack, F., & Mussweiler, T. (1997). Explaining the enigmatic anchoring effect: Mechanisms of
selective accessibility. Journal of Personality and Social Psychology, 73(3), 437-446.
doi: 10.1037/0022-3514.73.3.437
Tost, L. P., Gino, F., & Larrick, R. P. (2012). Power, competitiveness, and advice taking: Why
the powerful don’t listen. Organizational Behavior and Human Decision Processes,
117(1), 53-65. doi: 10.1016/j.obhdp.2011.10.001
Tost, L. P., Gino, F., & Larrick, R. P. (2013). When power makes others speechless: The
negative impact of leader power on team performance. Academy of Management Journal,
doi: 10.5465/amj.2011.0180
Tversky, A., & Kahneman, D. (1974). Judgment under uncertainty: Heuristics and biases.
Science, 185, 1124-1131. doi: 10.1126/science.185.4157.1124

Running Head: PUSHING AWAY FROM ADVICE 54
Von Winterfeldt, D., & Edwards, W. (1986). Decision analysis and behavioral research.
Cambridge, England: Cambridge University Press.
Wilson, T. D., & Brekke, N. (1994). Mental contamination and mental correction: Unwanted
influences on judgments and evaluations. Psychological Bulletin, 116(1), 117-142. doi:
10.1037/0033-2909.116.1.117
Yaniv, I. (2004). The benefit of additional opinions. Current Directions in Psychological
Science, 13(2), 75-78. doi: 10.1111/j.0963-7214.2004.00278.x
Yaniv, I., & Choshen‐Hillel, S. (2012). Exploiting the wisdom of others to make better decisions:
Suspending judgment reduces egocentrism and increases accuracy. Journal of Behavioral
Decision Making, 427-434. doi: 10.1002/bdm.740
Yaniv, I., & Kleinberger, E. (2000). Advice taking in decision making: Egocentric discounting
and reputation formation. Organizational Behavior and Human Decision Processes,
83(2), 260-281. doi: 10.1006/obhd.2000.2909

Running Head: PUSHING AWAY FROM ADVICE 55
Table 1
Percent of Estimates Close to the Advice and Absolute Distance from the Advice
n
Percent within 2
years of advice
Percent within 5
years of advice
Absolute distance
(years)a
Advice Dep/
Ind-Rev Dep Rev Ind Dep Rev Ind Dep Rev Ind
Study 1
Low 51/53 8% 17% 15% 41% 57% 36% 6.49 6.25 7.87
Median 53/54 17% 46% 41% 62% 80% 72% 5.34 3.32 3.90
High 53/53 8% 23% 11% 57% 45% 32% 5.62 6.38 7.15
Study 2c
Median 203/202 24% 47% 41% 73% 80% 64% 4.81 3.66 4.85
Study 3
Median 87/90b 46% 70% 54% 86% 94% 84% 3.20 2.11 2.84
Study 4
Median 102/103 21% 45% 39% 68% 83% 69% 4.95 3.51 4.82
25th/75th 103/103 21% 38% 23% 66% 66% 50% 4.88 4.88 6.74
10th/90th 103/99 13% 16% 14% 48% 46% 26% 6.95 7.29 9.49
5th/95th 98/102 15% 14% 9% 42% 34% 17% 7.71 8.88 11.63
1st/99th 206/208 4% 5% 1% 22% 17% 7% 11.28 13.35 16.72
Note. Dep = dependent advice sequence; Ind-Rev = independent-then-revise advice sequence;
Rev = revised estimate from independent-then-revise advice sequence; Ind = independent
estimate from independent-then-revise advice sequence.

Running Head: PUSHING AWAY FROM ADVICE 56
aFor Study 2, Study 3, and Study 4, absolute distance estimates were standardized by photo,
averaged across all photos, and then converted back into years using the average photo standard
deviation, which was 6.38 years in Study 2, 5.25 years in Study 3, and 6.88 years in Study 4.
bFor Study 3, there were 59 participants, each of whom viewed 3 photos, a total of 177
observations.
cStudy 2 also included an independent-only condition that only requested an independent
estimate, no revision (n = 200). This condition had 31% of estimates within 2 years, 60% of
estimates within 5 years, and an absolute distance of 5.70 years.
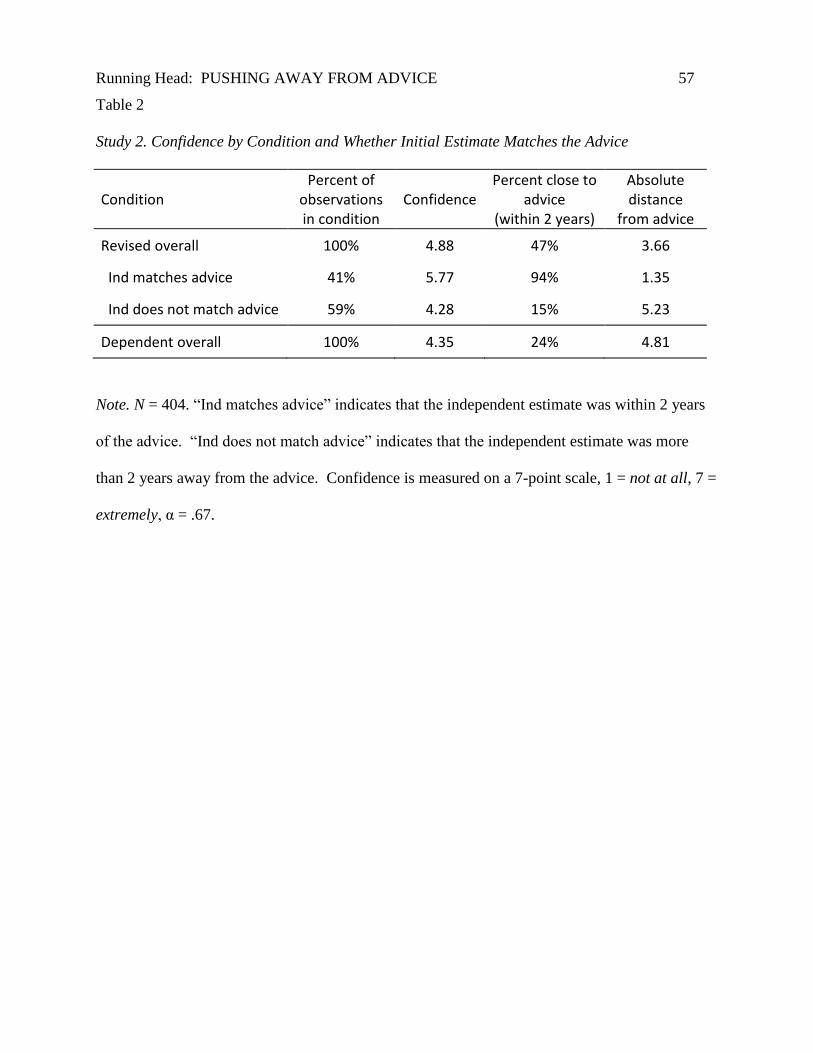
Running Head: PUSHING AWAY FROM ADVICE 57
Table 2
Study 2. Confidence by Condition and Whether Initial Estimate Matches the Advice
Condition Percent of
observations in condition
Confidence Percent close to
advice (within 2 years)
Absolute distance
from advice
Revised overall 100% 4.88 47% 3.66
Ind matches advice 41% 5.77 94% 1.35
Ind does not match advice 59% 4.28 15% 5.23
Dependent overall 100% 4.35 24% 4.81
Note. N = 404. “Ind matches advice” indicates that the independent estimate was within 2 years
of the advice. “Ind does not match advice” indicates that the independent estimate was more
than 2 years away from the advice. Confidence is measured on a 7-point scale, 1 = not at all, 7 =
extremely, α = .67.

Running Head: PUSHING AWAY FROM ADVICE 58
Table 3
Results of the Verbal Protocol Analysis Percent with
code GEE results
Code Example protocol / definition Kappa Dep Rev b eb
z p
Negative remarks about the advice
Advice is not good or advice is too high or too low
[Another survey taker said 45] "45 seems a little bit young"
0.72 39% 24% 0.68 1.97 1.75 .081
Advice is far from own estimate
"My estimate is quite different than the other survey taker’s"
0.80 0% 3% n/a n/a n/a n/a
Positive remarks about the advice
Advice looks good, could be right
[Another survey taker said 45] "Yeah, he looks about 45"
0.67 21% 18% 0.08 1.08 0.17 .866
Advice is close to own estimate
"the person guessed 41, which is pretty close to my guess"
0.81 3% 31% -2.52 0.08 -4.00 <.001
Other remarks
Mentioned cues "He’s kind of balding... He doesn’t have that much wrinkles ..."
0.93 77% 33% 1.85 6.36 4.64 <.001
Mentioned the advice, without positive or negative evaluation
"another person’s guess is 45"
0.75 62% 64% -0.12 0.89 -0.33 .741
Stated a goal to give their own estimate or not repeat advice
[Another survey taker said 25] "I would guess perhaps 24 just to be different from 25. "
1.00 2% 0% n/a n/a n/a n/a
Stated a goal to stick with their own estimate
"I think I will stay with my original estimate"
0.86 2% 54% -4.06 0.02 -5.61 <.001
Gave an estimate out loud
"So I think this guy should be 28. Yeah. 28."
0.77 93% 90% 0.38 1.46 0.52 .600

Running Head: PUSHING AWAY FROM ADVICE 59
Table 3, continued
Results of the Verbal Protocol Analysis Percent with
code GEE results
Code Example protocol / definition Kappa Dep Rev b eb
z p
Composite codes
Net positive remarks about the advice
a
Calculated as the number of positive remarks minus negative remarks about the advice
n/a -0.20 0.18 -0.38 n/a -2.46 .014
Reject-to-cue-to-estimate sequence
Value of 1 if participant said advice is not good or too high or too low, then mentioned cues, and then gave an estimate out loud. 0 otherwise. Intermediate cues could be interspersed in the sequence.
0.66 20% 2% 2.19 8.94 2.90 .004
Note. Dep = dependent advice sequence; Rev = revision segment of independent-then-revise
advice sequence. Codes are not mutually exclusive: the same protocol can receive multiple
codes. Kappa = Cohen’s kappa. GEE models use a binomial distribution with logit link function
for all codes except net positive remarks about the advice, which uses a normal distribution.
Coefficients for all models can be interpreted like logistic regression coefficients: they are the
change in log-likelihood ratio from switching from the independent-then-revise sequence to the
dependent sequence, except for net positive remarks, which can be interpreted like linear
regression coefficients. GEE models could not be run for two codes because the codes did not
occur frequently enough (the codes were the goal to give their own estimate or not repeat the
advice and mentions that the advice was far from their estimate).
aStatistics presented for net positive remarks about the advice differ somewhat from those for
other codes, because net positive remarks is a continuous variable rather than binary like the

Running Head: PUSHING AWAY FROM ADVICE 60
other codes. Rather than Kappa, we calculated ICC(2), a measure of the reliability of the mean.
ICC(2) = .86. The values for the column “percent with code” are the mean number of net
positive thoughts for each condition.

Running Head: PUSHING AWAY FROM ADVICE 61
Table 4
Study 3. Remarks by Condition and Whether Initial Estimate Matches the Advice
Negative remarks Positive remarks Neutral remarks Composite codes
Condition Percent of obs in
condition
Advice is not good,
too high or too
low
Advice is far from
own estimate
Advice looks good, could
be right
Advice is close to
own estimate
Mention of cues
Goal to stick with their own estimate
Net positive remarks
about advice
Reject-to-cue-to-
estimate sequence
Percent close to advice (within 2 years)
Revised overall 100% 24% 3% 18% 31% 33% 54% 0.18 2% 70%
Ind matches advice 54% 4% 0% 16% 47% 31% 69% 0.67 0% 100%
Ind does not match advice 46% 49% 7% 20% 12% 37% 37% -0.41 5% 34%
Dependent overall 100% 39% 0% 21% 3% 77% 2% -0.20 20% 46%
Note. N = 177. “Ind matches advice” indicates that the independent estimate was within 2 years of the advice. “Ind does not match”
indicates that the independent estimate was more than 2 years away from the advice.

Running Head: PUSHING AWAY FROM ADVICE 62
Table 5
Study 5 Percent of Estimates Close to the Prompt and Absolute Distance from the Prompt. N =2708.
Percent within 2
years of prompt
Percent within 5
years of prompt
Absolute distance (years)
Prompt (anchor/advice) Dep
Dep-
comp Rev Ind Dep
Dep-
comp Rev Ind Dep
Dep-
comp Rev Ind
Median prompt (age 25) 43%a 47%a 67%b 55%c
89%a 92%a 97%b 89%a
3.09a 3.03a 1.99b 2.62c
98th percentile prompt (age 35) 7%a 5%ab 8%a 3%b
43%a 41%a 45%a 16%b
6.19a 6.17a 6.29a 8.21b
Out of range prompt (age 45) 1%a 0%a 0%a 0%a 4%a 5%a 1%b 0%b 14.13a 14.35a 16.38b 18.31c
Note. Dep = dependent estimates; Dep-comp = dependent-comparative estimates; Rev = revised estimates; Ind = independent
estimates. For each dependent variable, values within a row with different superscripts are significantly different from one another at p
< .05. For absolute distance, all comparisons are between-subjects tests, except comparisons between revised and independent
estimates, which are within-subject tests.

Running Head: PUSHING AWAY FROM ADVICE 63
Figure 1. Advice sequences. The stick figure represents the participant in the experiment. The
face in the frame represents the stimulus – a photo of a person in the case of our experiments.
Step 1: See stimulus and give independent estimate
Independent-then-revise Dependent
Step 2: See advice
“Another survey taker said 40”
Step 3: Give revised estimate
She is 39
She is 39
Step 1: See advice
“Another survey taker said 40”
Step 2: Give dependent estimate
She is 36
“How old is this person?”
“How old is this person?” “How old is this person?”

Running Head: PUSHING AWAY FROM ADVICE 64
Figure 2. Study 1: histograms of age estimates. The vertical line in the center of each graph
indicates the zero point, which is where the estimate exactly equals the advice. The dashed line
Running Head: PUSHING AWAY FROM ADVICE 65
indicates independent estimates, which were those estimates given in the independent-then-
revise sequence before receiving advice.

Running Head: PUSHING AWAY FROM ADVICE 66
(a)
(b)
Figure 3. Study 2: Mediation analyses on the percent of estimates that are close to the advice
(panel a) and the absolute distance between the estimate and the advice (panel b) (N = 405).
Absolute distance is standardized by photo so that one unit represents one standard deviation in
independent estimates. The number in parentheses indicates the total effect of advice sequence
on the dependent variable (the percent of estimates close to the advice or absolute distance).
*p < .05. ** p < .01
Advice sequence
(Dependent vs.
Independent-then-revise)
Close to advice
(within 2 years)
Confidence in advice
-0.79** (-1.03**)
b = 0.86** a = -0.53**
Advice sequence
(Dependent vs.
Independent-then-revise)
Absolute distance
(standardized)
Confidence in advice
0.09* (0.18**)
b = -0.17** a = -0.53**
a x b 95% CI = [-0.73, -0.23]
a x b 95% CI = [0.05, 0.15]
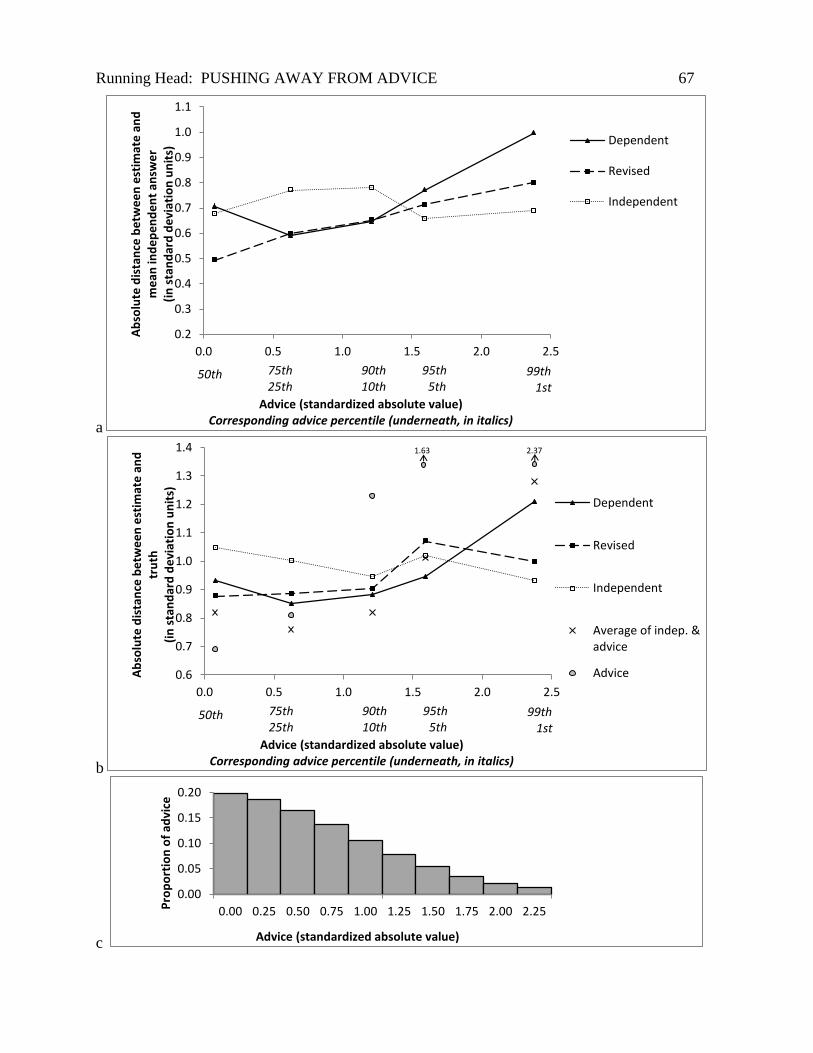
Running Head: PUSHING AWAY FROM ADVICE 67
a
b
c
0.2
0.3
0.4
0.5
0.6
0.7
0.8
0.9
1.0
1.1
0.0 0.5 1.0 1.5 2.0 2.5
Ab
solu
te d
ista
nce
be
twe
en
est
imat
e a
nd
m
ean
ind
ep
en
de
nt
answ
er
(in
sta
nd
ard
de
viat
ion
un
its)
Advice (standardized absolute value) Corresponding advice percentile (underneath, in italics)
Dependent
Revised
Independent
50th 75th 25th
90th 10th
95th 5th
99th 1st
0.6
0.7
0.8
0.9
1.0
1.1
1.2
1.3
1.4
0.0 0.5 1.0 1.5 2.0 2.5
Ab
solu
te d
ista
nce
be
twe
en
est
imat
e a
nd
tr
uth
(i
n s
tan
dar
d d
evi
atio
n u
nit
s)
Advice (standardized absolute value) Corresponding advice percentile (underneath, in italics)
Dependent
Revised
Independent
Average of indep. &advice
Advice
1.63 2.37
50th 75th 25th
90th 10th
95th 5th
99th 1st
0.00
0.05
0.10
0.15
0.20
0.00 0.25 0.50 0.75 1.00 1.25 1.50 1.75 2.00 2.25Pro
po
rtio
n o
f ad
vice
Advice (standardized absolute value)
90th 10th
95th 5th
99th 1st
90th 10th 95th
5th 99th 1st

Running Head: PUSHING AWAY FROM ADVICE 68
Figure 4. Study 4. (N = 1,227) Panel a: Absolute distance between estimate and mean of
independent estimates. Panel b: Absolute distance between estimate and true answer. Estimates
were standardized separately for each photo based on the independent pool before calculating the
absolute distances. For the independent-then-revise sequence, the accuracy of averaging the
advice with the independent estimate was also calculated (but not shown on the figure). The
averaged estimates were closer to the photo mean and truth than the revised estimates with
central advice (median and 25th
/75th
percentiles), no different with 90th
/10th
and 95th
/5th
advice,
and further from the photo mean and truth with very extreme (1st/99
th percentile) advice. For
panel b, accuracy of advice at 95th
and 99th
percentiles is off the chart, at 1.63 and 2.37 standard
deviations from the truth. Panel c: The proportion of advice that would be expected at each level
of advice centrality, assuming a normal distribution of advice. The bins are 0.25 standard
deviations wide and the labels indicate the left endpoint of the bin; thus, the first bin shows the
proportion of advice that would be expected between 0.00 and 0.25 standard deviations, the
second bin shows the proportion between 0.25 and 0.50 standard deviations, etc.

Running Head: PUSHING AWAY FROM ADVICE 69
Appendix
Instructions to Participants in Study 1
Independent-then-revise Dependent
Screen 1
How old is this person? Try to be as
accurate as possible.
[Photo]
My estimate: _____________
[no initial screen]
Screen 2
Now we will show you the answer of
another person who already took this
survey. Then, on the next page, you will
give us your final estimate.
The other survey taker's answer was 45.
You can use this answer however you wish
in forming your final estimate.
Screen 1
Before seeing the photograph, we will show
you the answer of another person who
already took this survey.
The other survey taker's answer was 45.
You can use this answer however you wish
in forming your own estimate.
Screen 3
How old is this person? Try to be as
accurate as possible.
Another survey taker said: 45
My Original Estimate: [enter number]
[Photo]
My final estimate: _____________
Screen 2
How old is this person? Try to be as
accurate as possible.
Another survey taker said: 45
[Photo]
My estimate: _____________