
Organization of Valence-Encoding and Projection … Organization of Valence-Encoding and...
15
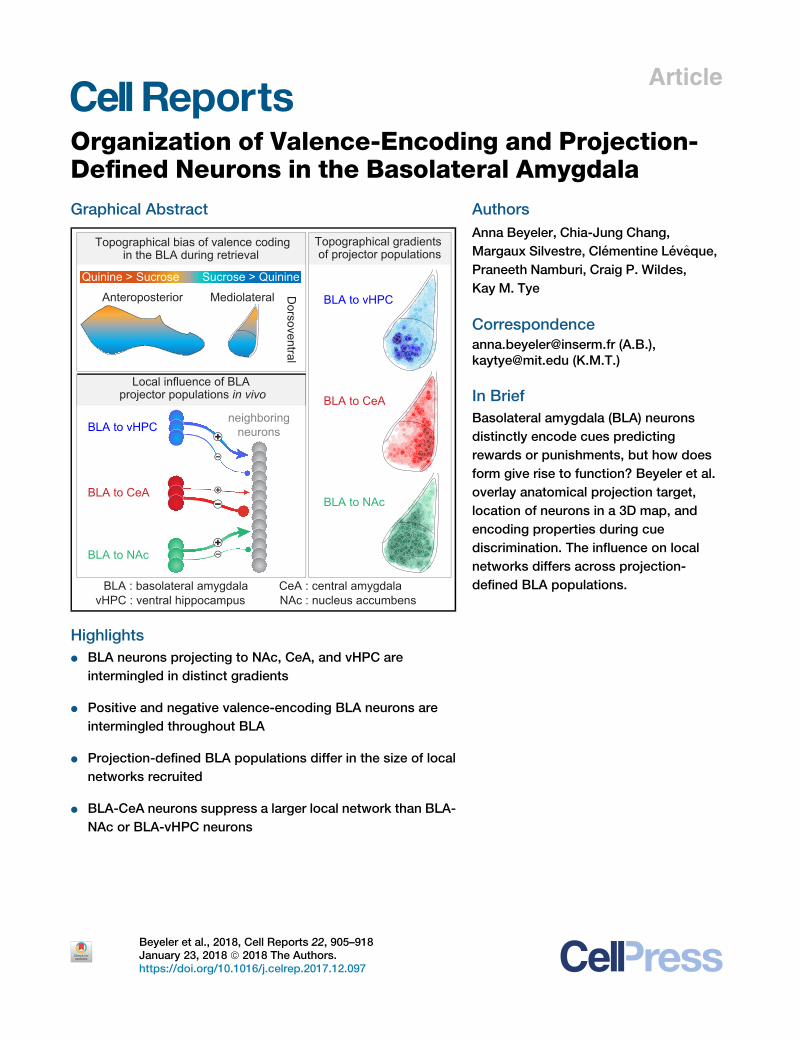
Article Organization of Valence-Encoding and Projection- Defined Neurons in the Basolateral Amygdala Graphical Abstract Highlights d BLA neurons projecting to NAc, CeA, and vHPC are intermingled in distinct gradients d Positive and negative valence-encoding BLA neurons are intermingled throughout BLA d Projection-defined BLA populations differ in the size of local networks recruited d BLA-CeA neurons suppress a larger local network than BLA- NAc or BLA-vHPC neurons Authors Anna Beyeler, Chia-Jung Chang, Margaux Silvestre, Cle ´ mentine Le ´v^ eque, Praneeth Namburi, Craig P. Wildes, Kay M. Tye Correspondence [email protected] (A.B.), [email protected] (K.M.T.) In Brief Basolateral amygdala (BLA) neurons distinctly encode cues predicting rewards or punishments, but how does form give rise to function? Beyeler et al. overlay anatomical projection target, location of neurons in a 3D map, and encoding properties during cue discrimination. The influence on local networks differs across projection- defined BLA populations. Beyeler et al., 2018, Cell Reports 22, 905–918 January 23, 2018 ª 2018 The Authors. https://doi.org/10.1016/j.celrep.2017.12.097
-
Upload
truongmien -
Category
Documents
-
view
254 -
download
1
Transcript of Organization of Valence-Encoding and Projection … Organization of Valence-Encoding and...
Article
Organization of Valence-E
ncoding and Projection-Defined Neurons in the Basolateral AmygdalaGraphical Abstract
Highlights
d BLA neurons projecting to NAc, CeA, and vHPC are
intermingled in distinct gradients
d Positive and negative valence-encoding BLA neurons are
intermingled throughout BLA
d Projection-defined BLA populations differ in the size of local
networks recruited
d BLA-CeA neurons suppress a larger local network than BLA-
NAc or BLA-vHPC neurons
Beyeler et al., 2018, Cell Reports 22, 905–918January 23, 2018 ª 2018 The Authors.https://doi.org/10.1016/j.celrep.2017.12.097
Authors
Anna Beyeler, Chia-Jung Chang,
Margaux Silvestre, Clementine Leveque,
Praneeth Namburi, Craig P. Wildes,
Kay M. Tye
[email protected] (A.B.),[email protected] (K.M.T.)
In Brief
Basolateral amygdala (BLA) neurons
distinctly encode cues predicting
rewards or punishments, but how does
form give rise to function? Beyeler et al.
overlay anatomical projection target,
location of neurons in a 3D map, and
encoding properties during cue
discrimination. The influence on local
networks differs across projection-
defined BLA populations.
Cell Reports
Article
Organization of Valence-Encodingand Projection-Defined Neuronsin the Basolateral AmygdalaAnna Beyeler,1,2,* Chia-Jung Chang,1,3 Margaux Silvestre,1,3 Clementine Leveque,1 Praneeth Namburi,1 Craig P. Wildes,1
and Kay M. Tye1,4,5,*1The Picower Institute for Learning and Memory, Department of Brain and Cognitive Sciences, Massachusetts Institute of Technology,
Cambridge, MA 02139, USA2Neurocentre Magendie, INSERM, U1215, University of Bordeaux, 146 rue Leo Saignat, 33077 Bordeaux Cedex, France3These authors contributed equally4Twitter: @kaymtye5Lead Contact
*Correspondence: [email protected] (A.B.), [email protected] (K.M.T.)https://doi.org/10.1016/j.celrep.2017.12.097
SUMMARY
The basolateral amygdala (BLA) mediates associa-tive learning for both fear and reward. Accumulatingevidence supports the notion that different BLA pro-jections distinctly alter motivated behavior, includingprojections to the nucleus accumbens (NAc), medialaspect of the central amygdala (CeM), and ventralhippocampus (vHPC). Although there is consensusregarding the existence of distinct subsets of BLAneurons encoding positive or negative valence, con-troversy remains regarding the anatomical arrange-ment of these populations. First, wemap the locationof more than 1,000 neurons distributed across theBLA and recorded during a Pavlovian discriminationtask. Next, we determine the location of projection-defined neurons labeled with retrograde tracersand use CLARITY to reveal the axonal path in3-dimensional space. Finally, we examine the localinfluence of each projection-defined populationswithin the BLA. Understanding the functional andtopographical organization of circuits underlyingvalence assignment could reveal fundamental princi-ples about emotional processing.
INTRODUCTION
The ability to attribute valence to sensory information guides our
behavior to approach rewards and avoid danger. How brain cir-
cuits achieve this function remains only partially understood. The
basolateral amygdala (BLA) complex, including the lateral amyg-
dala (LA) and the basal amygdala (BA), receives dense sensory
inputs and is necessary for the acquisition of fear conditioning
(Fanselow and Kim, 1994; LeDoux et al., 1990; Maren and Quirk,
2004; Miserendino et al., 1990; Wilensky et al., 1999) and reward
associations (Baxter and Murray, 2002; Cador et al., 1989; Car-
dinal et al., 2002; Tye et al., 2008). Electrophysiological record-
ings have revealed that BLA neurons respond to cues for both
CeThis is an open access article under the CC BY-N
positive and negative valence (Beyeler et al., 2016; Fuster and
Uyeda, 1971; Paton et al., 2006; Shabel and Janak, 2009). The
valence encoding properties of BLA neurons have been investi-
gated based upon immediate early gene expression (Gore et al.,
2015; Redondo et al., 2014) and projection target (Beyeler et al.,
2016; Burgos-Robles et al., 2017; Felix-Ortiz et al., 2013, 2016;
Namburi et al., 2015). Despite the well-appreciated role of the
BLA in valence coding (Janak and Tye, 2015), questions
regarding the anatomical organization of neurons encoding pos-
itive or negative valence remain unanswered.
Could anatomical organization of BLA neurons contribute to
selection of neurons coding for opposite valence? Throughout
the brain, motifs of anatomical segregation for functionally
defined populations of neurons have been observed, but
anatomical intermingled (salt-and-pepper) topographies of func-
tionally distinct neurons have also been reported. Several
studies focused on valence encoding in the BLA have reported
data that are indirectly suggestive of intermingled populations
(Gore et al., 2015; Namburi et al., 2015). Electrophysiological
recordings in monkeys revealed intermingled neurons encoding
positive and negative valence across the BLA (Zhang et al.,
2013).
Antagonistically, it has been proposed that two genetically
defined and topographically segregated populations of BLA
neuronsmediate valence (Kim et al., 2016). Two genetically iden-
tified populations were found to correspond to the previously
described magnocellular and parvocellular neurons (Alheid,
2003). Neurons expressing the gene Rspo2, coding for R-spon-
din 2, located in the anterior BLA correspond to magnocellular
neurons, while neurons expressing the Ppp1r1b gene, coding
for the protein phosphatase 1 regulatory inhibitor subunit 1B
(DARPP-32) are located in the posterior BLA and correspond
to parvocellular neurons (Kim et al., 2016; Lein et al., 2007).
Optogenetic stimulation of Rspo2 neurons promotes freezing
behaviors, and photostimulation of Ppp1r1b neurons supports
intra-cranial self-stimulation (Kim et al., 2016). Furthermore, a
larger proportion of Rspo2 neurons expresses c-fos after an
innately aversive experience, and a larger proportion of Ppp1r1b
neurons does so after an innately rewarding experience (Kim
et al., 2016). However, to meet our criteria for valence encoding,
ll Reports 22, 905–918, January 23, 2018 ª 2018 The Authors. 905C-ND license (http://creativecommons.org/licenses/by-nc-nd/4.0/).
B
C
E
F
Per
cent
age
of u
nits
(%)
Per
cent
age
of u
nits
(%)
BLA unitsn = 1626
BLA unitsn = 681
Recordingsin BLA
Head-fixedconditioning
A Sucrose0.5 s
Consumption Avoidance
Learning criterionCS-S
A P M L D V
A P M L D V
-1
0
1
9976
84
140
270
323
360
221
53
z-sc
ore
(CS
-S -
CS
-Q)
-2.2-2.0-1.8-1.6-1.4-1.2 2.8 2.9 3.0 3.1 3.2 3.3 3.4 -5.2-5.0-4.8-4.6-4.4-4.2-4.0-3.8
7594
157
170202
231193
146124
867276
0
10
20
30
0
10
20
30
AP position (mm) DV position (mm)ML position (mm)-2.2-2.0-1.8-1.6-1.4-1.2 2.82.7
2.7
2.9 3.0 3.1 3.2 3.3 3.4 -5.2-5.0-4.8-4.6-4.4-4.2-4.0-3.8
-1
0
1
z-sc
ore
(suc
rose
- qu
inin
e)
-2.2-2.0-1.8-1.6-1.4-1.2 2.8 2.9 3.0 3.1 3.2 3.3 3.4 -5.2-5.0-4.8-4.6-4.4-4.2-4.0-3.8
AP position (mm) DV position (mm)ML position (mm)-2.2-2.0-1.8-1.6-1.4-1.2 2.82.7
2.7
2.9 3.0 3.1 3.2 3.3 3.4 -5.2-5.0-4.8-4.6-4.4-4.2-4.0-3.8
224
311472
357
128
56
78
155
75
45149
74
83
53
4765
86
105
196
114115
467784
871068855
78
60
Quinine>70% Sucrose Cons.
>70% Quinine Av.0.5 s
CS-Q
Recordingsin BLA
Head-fixedConditioning
D Sucrose0.5 s
ConsumptionConsumption
Trial selection CS-SQuinine> 5 Quinine Consumptionmatching # Sucrose Cons.
0.5 s
CS-Q
0
0.2
CSS Q
0.4
0.6
Ave
rage
z-s
core
0.8***
0
0.2
ConsumptionSQ
0.4
0.6
Ave
rage
z-s
core
0.8
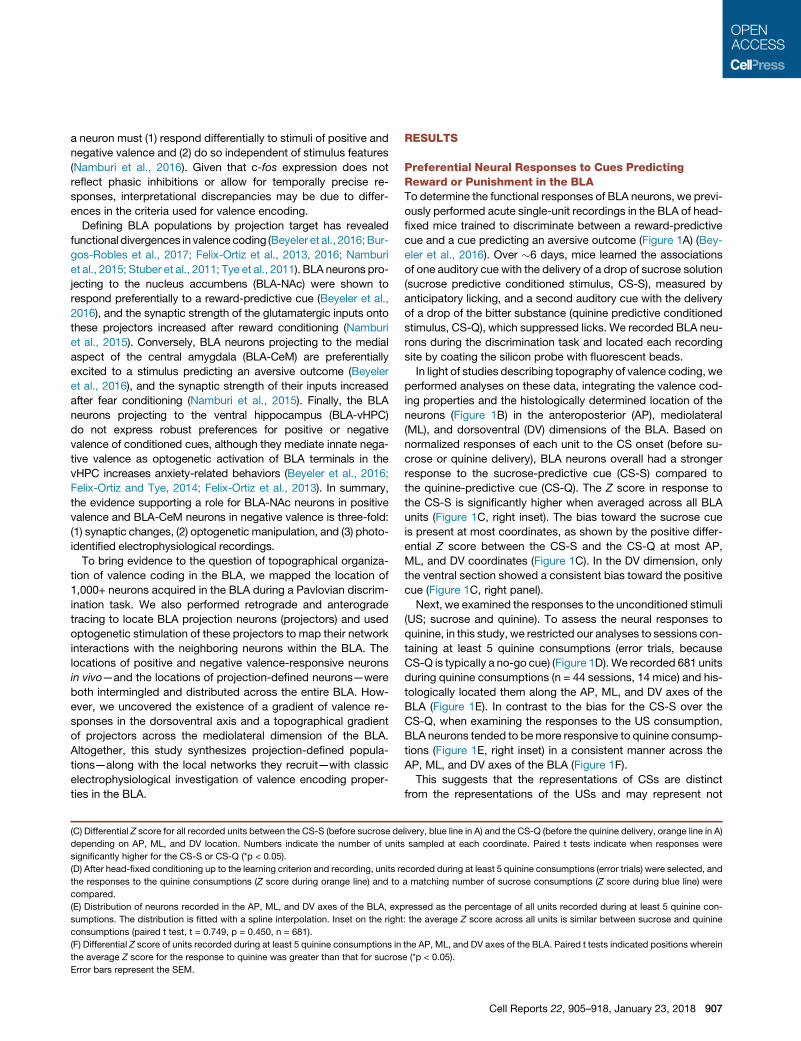
Figure 1. Mapping BLA Neuron Response to CSs and USs of Positive and Negative Valence
(A) Schematic of the Pavlovian conditioning paradigm. Head-fixed mice were trained to discriminate between one cue paired with the presentation of sucrose
(CS-S) and a second cue paired with quinine (CS-Q). After reaching the learning criterion, acute single-unit recordings were performed in the BLA.
(B) Distribution of neurons recorded in the basolateral amygdala (BLA) in the anteroposterior (AP), mediolateral (ML), and dorsoventral (DV) axes, expressed as the
percentage of all recorded units and fitted with a spline interpolation. Inset on the right: the average Z score across all units is higher during the CS-S compared to
the CS-Q (paired t test, t = 4.872, ***p < 0.001, n = 1,626).
(legend continued on next page)
906 Cell Reports 22, 905–918, January 23, 2018
a neuron must (1) respond differentially to stimuli of positive and
negative valence and (2) do so independent of stimulus features
(Namburi et al., 2016). Given that c-fos expression does not
reflect phasic inhibitions or allow for temporally precise re-
sponses, interpretational discrepancies may be due to differ-
ences in the criteria used for valence encoding.
Defining BLA populations by projection target has revealed
functional divergences in valence coding (Beyeler et al., 2016;Bur-
gos-Robles et al., 2017; Felix-Ortiz et al., 2013, 2016; Namburi
et al., 2015; Stuber et al., 2011; Tye et al., 2011). BLA neurons pro-
jecting to the nucleus accumbens (BLA-NAc) were shown to
respond preferentially to a reward-predictive cue (Beyeler et al.,
2016), and the synaptic strength of the glutamatergic inputs onto
these projectors increased after reward conditioning (Namburi
et al., 2015). Conversely, BLA neurons projecting to the medial
aspect of the central amygdala (BLA-CeM) are preferentially
excited to a stimulus predicting an aversive outcome (Beyeler
et al., 2016), and the synaptic strength of their inputs increased
after fear conditioning (Namburi et al., 2015). Finally, the BLA
neurons projecting to the ventral hippocampus (BLA-vHPC)
do not express robust preferences for positive or negative
valence of conditioned cues, although they mediate innate nega-
tive valence as optogenetic activation of BLA terminals in the
vHPC increases anxiety-related behaviors (Beyeler et al., 2016;
Felix-Ortiz and Tye, 2014; Felix-Ortiz et al., 2013). In summary,
the evidence supporting a role for BLA-NAc neurons in positive
valence and BLA-CeM neurons in negative valence is three-fold:
(1) synaptic changes, (2) optogenetic manipulation, and (3) photo-
identified electrophysiological recordings.
To bring evidence to the question of topographical organiza-
tion of valence coding in the BLA, we mapped the location of
1,000+ neurons acquired in the BLA during a Pavlovian discrim-
ination task. We also performed retrograde and anterograde
tracing to locate BLA projection neurons (projectors) and used
optogenetic stimulation of these projectors to map their network
interactions with the neighboring neurons within the BLA. The
locations of positive and negative valence-responsive neurons
in vivo—and the locations of projection-defined neurons—were
both intermingled and distributed across the entire BLA. How-
ever, we uncovered the existence of a gradient of valence re-
sponses in the dorsoventral axis and a topographical gradient
of projectors across the mediolateral dimension of the BLA.
Altogether, this study synthesizes projection-defined popula-
tions—along with the local networks they recruit—with classic
electrophysiological investigation of valence encoding proper-
ties in the BLA.
(C) Differential Z score for all recorded units between the CS-S (before sucrose de
depending on AP, ML, and DV location. Numbers indicate the number of units
significantly higher for the CS-S or CS-Q (*p < 0.05).
(D) After head-fixed conditioning up to the learning criterion and recording, units r
the responses to the quinine consumptions (Z score during orange line) and to
compared.
(E) Distribution of neurons recorded in the AP, ML, and DV axes of the BLA, exp
sumptions. The distribution is fitted with a spline interpolation. Inset on the right
consumptions (paired t test, t = 0.749, p = 0.450, n = 681).
(F) Differential Z score of units recorded during at least 5 quinine consumptions in
the average Z score for the response to quinine was greater than that for sucros
Error bars represent the SEM.
RESULTS
Preferential Neural Responses to Cues PredictingReward or Punishment in the BLATo determine the functional responses of BLA neurons, we previ-
ously performed acute single-unit recordings in the BLA of head-
fixed mice trained to discriminate between a reward-predictive
cue and a cue predicting an aversive outcome (Figure 1A) (Bey-
eler et al., 2016). Over �6 days, mice learned the associations
of one auditory cue with the delivery of a drop of sucrose solution
(sucrose predictive conditioned stimulus, CS-S), measured by
anticipatory licking, and a second auditory cue with the delivery
of a drop of the bitter substance (quinine predictive conditioned
stimulus, CS-Q), which suppressed licks. We recorded BLA neu-
rons during the discrimination task and located each recording
site by coating the silicon probe with fluorescent beads.
In light of studies describing topography of valence coding, we
performed analyses on these data, integrating the valence cod-
ing properties and the histologically determined location of the
neurons (Figure 1B) in the anteroposterior (AP), mediolateral
(ML), and dorsoventral (DV) dimensions of the BLA. Based on
normalized responses of each unit to the CS onset (before su-
crose or quinine delivery), BLA neurons overall had a stronger
response to the sucrose-predictive cue (CS-S) compared to
the quinine-predictive cue (CS-Q). The Z score in response to
the CS-S is significantly higher when averaged across all BLA
units (Figure 1C, right inset). The bias toward the sucrose cue
is present at most coordinates, as shown by the positive differ-
ential Z score between the CS-S and the CS-Q at most AP,
ML, and DV coordinates (Figure 1C). In the DV dimension, only
the ventral section showed a consistent bias toward the positive
cue (Figure 1C, right panel).
Next, we examined the responses to the unconditioned stimuli
(US; sucrose and quinine). To assess the neural responses to
quinine, in this study, we restricted our analyses to sessions con-
taining at least 5 quinine consumptions (error trials, because
CS-Q is typically a no-go cue) (Figure 1D).We recorded 681 units
during quinine consumptions (n = 44 sessions, 14 mice) and his-
tologically located them along the AP, ML, and DV axes of the
BLA (Figure 1E). In contrast to the bias for the CS-S over the
CS-Q, when examining the responses to the US consumption,
BLA neurons tended to bemore responsive to quinine consump-
tions (Figure 1E, right inset) in a consistent manner across the
AP, ML, and DV axes of the BLA (Figure 1F).
This suggests that the representations of CSs are distinct
from the representations of the USs and may represent not
livery, blue line in A) and the CS-Q (before the quinine delivery, orange line in A)
sampled at each coordinate. Paired t tests indicate when responses were
ecorded during at least 5 quinine consumptions (error trials) were selected, and
a matching number of sucrose consumptions (Z score during blue line) were
ressed as the percentage of all units recorded during at least 5 quinine con-
: the average Z score across all units is similar between sucrose and quinine
the AP, ML, and DV axes of the BLA. Paired t tests indicated positions wherein
e (*p < 0.05).
Cell Reports 22, 905–918, January 23, 2018 907
C
D
Per
cent
age
of u
nits
(%)
0
10
20
30
40n=380
CS-S (n=228)CS-Q (n=71)Both (n=119)
CS-S (n=220)CS-Q (n=74)Both (n=86)
Per
cent
age
of u
nits
(%)
0
10
20
30
40
Per
cent
age
of u
nits
(%)
0
10
20
30 CS inhibitedCS excited
A
B
A P M L D V
A P M L D V
A P D V
**CS-Q
CS-S
CS excited units
CS inhibited units
CS-Q CS-S***
***
******
AP position (mm) DV position (mm)ML position (mm)
AP position (mm) DV position (mm)ML position (mm)
n=380CS inhibited units
-2.2-2.0-1.8-1.6-1.4-1.2 2.8 3.0 3.2 3.4 3.6 -5.2-4.8-4.4-4.0
-2.2-2.0-1.8-1.6-1.4-1.2 2.8 3.0 3.2 3.4 3.6 -5.2-4.8-4.4-4.0
-2.2-2.0-1.8-1.6-1.4-1.2 2.8 3.0 3.2 3.4 3.6 -5.2-4.8-4.4-4.0
n=418
CS excited units n=418
Time (s)Time (s)0 1-1 2 0 1-1 2
Firin
g (H
z)
0
20
40
Time (s)Time (s)0 1-1 2 0 1-1 2
CS-S CS-Q CS-S CS-Q
M L
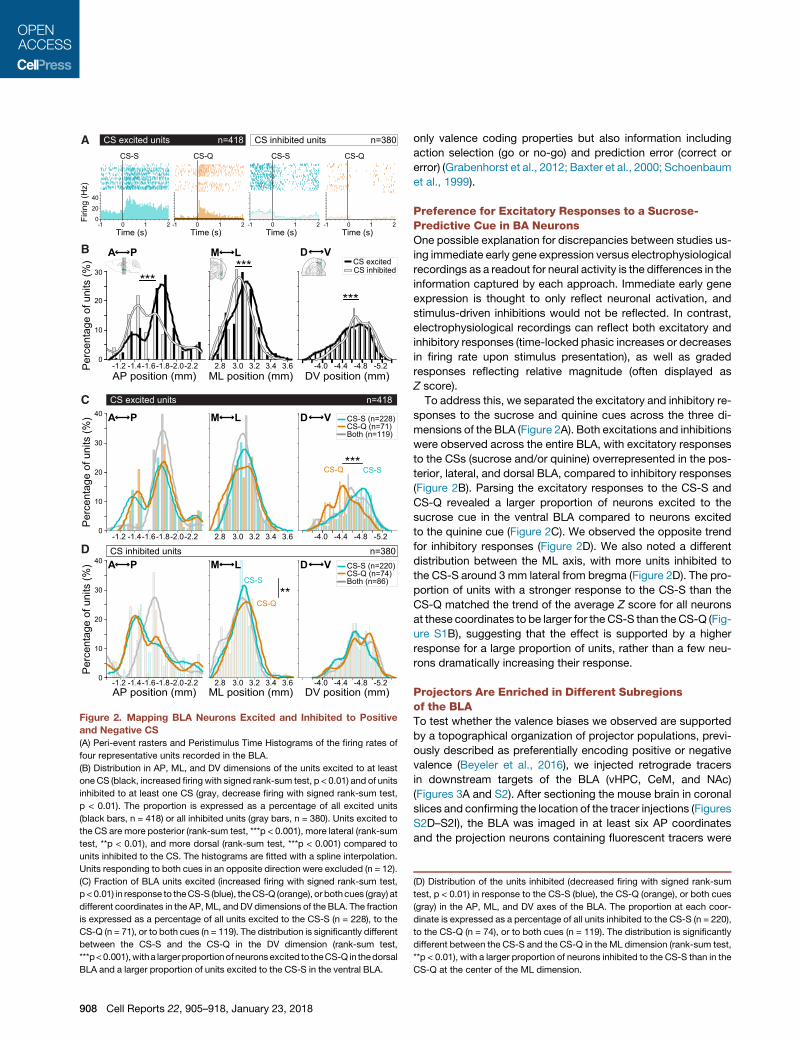
Figure 2. Mapping BLA Neurons Excited and Inhibited to Positive
and Negative CS
(A) Peri-event rasters and Peristimulus Time Histograms of the firing rates of
four representative units recorded in the BLA.
(B) Distribution in AP, ML, and DV dimensions of the units excited to at least
one CS (black, increased firing with signed rank-sum test, p < 0.01) and of units
inhibited to at least one CS (gray, decrease firing with signed rank-sum test,
p < 0.01). The proportion is expressed as a percentage of all excited units
(black bars, n = 418) or all inhibited units (gray bars, n = 380). Units excited to
the CS are more posterior (rank-sum test, ***p < 0.001), more lateral (rank-sum
test, **p < 0.01), and more dorsal (rank-sum test, ***p < 0.001) compared to
units inhibited to the CS. The histograms are fitted with a spline interpolation.
Units responding to both cues in an opposite direction were excluded (n = 12).
(C) Fraction of BLA units excited (increased firing with signed rank-sum test,
p < 0.01) in response to theCS-S (blue), theCS-Q (orange), or bothcues (gray) at
different coordinates in the AP,ML, andDV dimensions of the BLA. The fraction
is expressed as a percentage of all units excited to the CS-S (n = 228), to the
CS-Q (n = 71), or to both cues (n = 119). The distribution is significantly different
between the CS-S and the CS-Q in the DV dimension (rank-sum test,
***p<0.001),witha largerproportionof neuronsexcited to theCS-Q in thedorsal
BLA and a larger proportion of units excited to the CS-S in the ventral BLA.
908 Cell Reports 22, 905–918, January 23, 2018
only valence coding properties but also information including
action selection (go or no-go) and prediction error (correct or
error) (Grabenhorst et al., 2012; Baxter et al., 2000; Schoenbaum
et al., 1999).
Preference for Excitatory Responses to a Sucrose-Predictive Cue in BA NeuronsOne possible explanation for discrepancies between studies us-
ing immediate early gene expression versus electrophysiological
recordings as a readout for neural activity is the differences in the
information captured by each approach. Immediate early gene
expression is thought to only reflect neuronal activation, and
stimulus-driven inhibitions would not be reflected. In contrast,
electrophysiological recordings can reflect both excitatory and
inhibitory responses (time-locked phasic increases or decreases
in firing rate upon stimulus presentation), as well as graded
responses reflecting relative magnitude (often displayed as
Z score).
To address this, we separated the excitatory and inhibitory re-
sponses to the sucrose and quinine cues across the three di-
mensions of the BLA (Figure 2A). Both excitations and inhibitions
were observed across the entire BLA, with excitatory responses
to the CSs (sucrose and/or quinine) overrepresented in the pos-
terior, lateral, and dorsal BLA, compared to inhibitory responses
(Figure 2B). Parsing the excitatory responses to the CS-S and
CS-Q revealed a larger proportion of neurons excited to the
sucrose cue in the ventral BLA compared to neurons excited
to the quinine cue (Figure 2C). We observed the opposite trend
for inhibitory responses (Figure 2D). We also noted a different
distribution between the ML axis, with more units inhibited to
the CS-S around 3 mm lateral from bregma (Figure 2D). The pro-
portion of units with a stronger response to the CS-S than the
CS-Q matched the trend of the average Z score for all neurons
at these coordinates to be larger for the CS-S than the CS-Q (Fig-
ure S1B), suggesting that the effect is supported by a higher
response for a large proportion of units, rather than a few neu-
rons dramatically increasing their response.
Projectors Are Enriched in Different Subregionsof the BLATo test whether the valence biases we observed are supported
by a topographical organization of projector populations, previ-
ously described as preferentially encoding positive or negative
valence (Beyeler et al., 2016), we injected retrograde tracers
in downstream targets of the BLA (vHPC, CeM, and NAc)
(Figures 3A and S2). After sectioning the mouse brain in coronal
slices and confirming the location of the tracer injections (Figures
S2D–S2I), the BLA was imaged in at least six AP coordinates
and the projection neurons containing fluorescent tracers were
(D) Distribution of the units inhibited (decreased firing with signed rank-sum
test, p < 0.01) in response to the CS-S (blue), the CS-Q (orange), or both cues
(gray) in the AP, ML, and DV axes of the BLA. The proportion at each coor-
dinate is expressed as a percentage of all units inhibited to the CS-S (n = 220),
to the CS-Q (n = 74), or to both cues (n = 119). The distribution is significantly
different between the CS-S and the CS-Q in the ML dimension (rank-sum test,
**p < 0.01), with a larger proportion of neurons inhibited to the CS-S than in the
CS-Q at the center of the ML dimension.
BLA-vHPC (FB)
BLA-NAc (CTB 555)BLA-CeM (CTB 647)
D
F
E
G
H I
AP distance from Bregma (mm)
500 μm
Posterior BLA[-1.82 mm to -2.3 mm]
BLA
-NA
c
BLA
-CeM
BLA
-vH
PC
Anterior BLA[-0.7 mm to-1.22 mm]
Intermediate BLA[-1.34 mm to -1.70 mm]
Den
sity
in 5
0 μm
radu
is c
ylin
der
3.3
ML distance (mm)2.92.5
DV
dis
tanc
e fro
m B
LA to
p (m
m)
A C
B
Retrograde tracers
and/or and/or
NAc CeM vHPC
BLA
Cou
nted
BLA
-vH
PC
(%)
0
20
40
60
0
20
40
60
0
20
40
60
medial-BA lateral-BA LA
medial-BA lateral-BA LA
medial-BA lateral-BA LA
Cou
nted
BLA
-CeM
(%)
Cou
nted
BLA
-NA
c (%
)
***
***** *
-1.6
-1.4
-1.2
-1.0
-0.8
-0.6
-0.4
-1.5
-0.2
0
-1.6 -1.7 -1.8 -1.9 -2.0
PA
V
M
D
L
10
1
20
30
50 μm
V
M
D
L
Representative example
D-I Retrograde tracing with CTB 555 and CTB 647: 41,297 neurons, 21 injections, 78 slices,11 mice
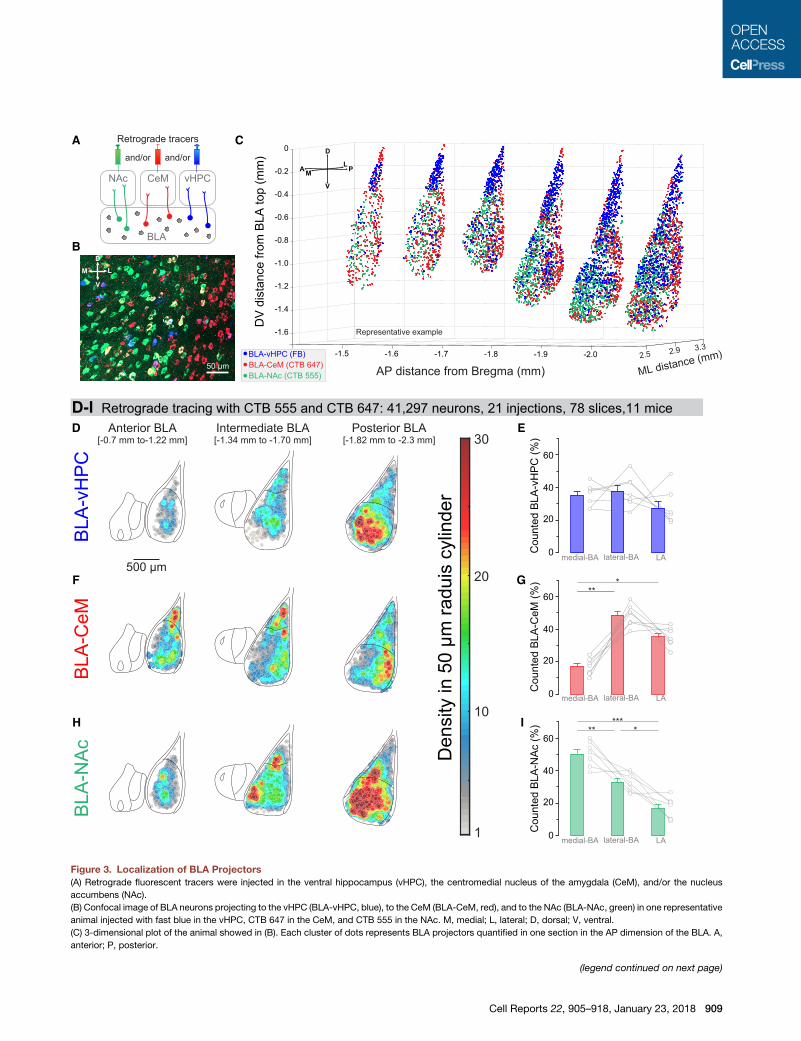
Figure 3. Localization of BLA Projectors
(A) Retrograde fluorescent tracers were injected in the ventral hippocampus (vHPC), the centromedial nucleus of the amygdala (CeM), and/or the nucleus
accumbens (NAc).
(B) Confocal image of BLA neurons projecting to the vHPC (BLA-vHPC, blue), to the CeM (BLA-CeM, red), and to the NAc (BLA-NAc, green) in one representative
animal injected with fast blue in the vHPC, CTB 647 in the CeM, and CTB 555 in the NAc. M, medial; L, lateral; D, dorsal; V, ventral.
(C) 3-dimensional plot of the animal showed in (B). Each cluster of dots represents BLA projectors quantified in one section in the AP dimension of the BLA. A,
anterior; P, posterior.
(legend continued on next page)
Cell Reports 22, 905–918, January 23, 2018 909
counted (Figures 3B and S3). Because we could not determine
the efficiency of the third tracer (fast blue), we restricted our anal-
ysis to the injections of cholera toxin subunit B conjugated with
Alexa Fluor 555 or 647 (CTB 555 or CTB 647) in two downstream
regions (Figures 3D–3I), counterbalanced across regions (Fig-
ure S2B). Neurons from each of the three BLA projector popula-
tions were present throughout the entire amygdala; however, we
did observe hotspots or subregions with a higher relative density
of projector populations (Figures 3 and S3).
To visualize the gradients of projector locations, and to deter-
mine how consistent these patterns were across animals, we
computed each population’s local density (50 mm radius cylinder
in 50 mm slices) (Figure S4A), color coded the density, and over-
laid it across all neurons, depending on their AP coordinates
(anterior, intermediate, and posterior slices) (Figures 3D–3I and
S4A–S4C). The BLA-vHPC projectors were densest in the poste-
rior-ventral BLA but were equally distributed along the lateral,
medial, and dorsal axes of the BLA complex (Figure 3E). The
BLA-CeM projectors were preferentially located in dorsal BLA
(LA), in the anterior and intermediate sections, and they were
densest in the lateral BA in the posterior sections (Figures 3F
and 3G). As for the BLA-NAc population, the density was great-
est in the medial part of the BA (Figures 3H and 3I) across the
entire AP axis (Figure S4C).
Finally, we sought to view the 3-dimensional BLA circuitry in
the intact brain by expressing a cre-dependent fluorophore
into the BLA and the retrogradely traveling canine adenovirus 2
(CAV2-cre), which allowed for the expression of cre recombinase
(Kremer et al., 2000). Using CLARITY (Chung et al., 2013), a
whole-brain clearing method, we visualized each projection
within the intact brain (Figures S4D–S4I). BLA-NAc neurons
and their axonal path are imaged in Movie S1, starting with a
sagittal view; BLA-CeM neurons are imaged in Movie S2;
and these populations (BLA-NAc and BLA-CeM) can be seen
together in Movie S3. In Movie S3, we can observe the preferen-
tial location of BLA-NAc projectors in the media BLA (green) and
of the BLA-central amygdala (CeA) projectors in the more lateral
part of the BLA (pink; see movie orientation in Figure S4F).
In Movie S4, we reveal BLA-vHPC neurons (Figure S4G). The
divergent paths for populations targeting the same general re-
gion (vHPC, CeA, and NAc) suggest distinct chemical signals
to guide axon growth during development, raising speculation
regarding functionally relevant heterogeneity within a projection
defined solely by source and target.
To test whether single neurons project to the three downstream
regions, we analyzed mice with retrograde tracer injections in
the three downstream targets andwith counterbalanceddye loca-
(D–I) Heatmaps of the density of the three types of projectors labeled with the CTB
neuron in a 50 mm cylinder of a 50 mm depth and then color coded and superimpos
intermediate, and posterior). n = 11 mice, (7 mice per injection site), 78 slices, 41
counted in the lateral amygdala (LA), the medial BA, and the lateral BA (E, G, an
mouse. (E) BLA-vHPC projectors are equally distributed in the LA, the medial BA
(G) BLA-CeM projectors are located significantly more in the LA and in the la
comparisons of medial BA versus lateral BA, **p < 0.01, and medial BA versus L
(I) BLA-NAc projectors aremainly present in themedial BLA and are denser in the la
Tukey’s multiple comparisons of medial BA versus lateral BA, **p < 0.01; medial
Error bars represent the SEM.
910 Cell Reports 22, 905–918, January 23, 2018
tions (CTB 555, CTB 647, and fast blue, FB; n = 5 mice) (Figure 4).
Becausewecould not determine the efficiencyof fast blueor iden-
tify its mechanism of transport, we decided to restrict our analysis
the injections of CTB 555 and CTB 647 (Figures S3D and S3E).
However, we refrain from drawing conclusions regarding the
proportion of neurons in the BLA that send collaterals to other
targets, given that retrograde labeling suffers from undersam-
pling errors because (1) tracers have limited efficiency in retro-
grade transport and (2) injections are performed to prioritize
specificity over coverage of the target region (injections leaking
outside of the target region are excluded, while injections that
do not spread to cover the entire target region are included).
So in all cases, we are only labeling a subset of the projectors,
and our estimates are conservative (false negatives > false pos-
itives). This retrograde-based investigation of collateralization
complements our previous anterograde-based investigation of
collateralization published in Figure S3 of Beyeler et al. (2016).
BLA Projectors Locally Influence the Firing ofNeighboring Neurons In Vivo
To characterize the influenceof BLAprojectors on the neighboring
cells within the BLA, we expressed channelrhodopsin-2 (ChR2)
specifically in each projector population (BLA-NAc, BLA-CeA,
and BLA-vHPC) using a cre-dependent dual-virus approach
(Figure 5A) (Beyeler et al., 2016). Although theCAV2-cre viral injec-
tionswere aimed at theCeMusing the samecoordinates as for the
retrograde tracers, we could not rule out the possibility of some
leak into the centrolateral amygdala and thus refer to this popula-
tion as BLA-CeA for this portion of the experiments to be conser-
vative. At least six weeks after viral vector delivery, we used 10ms
pulses of blue light (15mW, 1,910mW/mm2) to photostimulate the
projectors while recording the neural activity of neighboring cells
in vivo (Figure 5A). For each projector population, we found cells
that were phototagged and expressing ChR2 (displaying an excit-
atory response to the light stimulation with a short latency), cells
that were polysynaptically excited by the photostimulation (longer
photoresponse latency,whichwe termnetwork-excited), andcells
that were inhibited by the light stimulation (network-inhibited) (Fig-
ure 5B). The kinetics and amplitudes of the population photores-
ponses from each category (phototagged, network-excited, and
network-inhibited)weresimilar afterphotostimulationofeachpop-
ulation (BLA-vHPC, BLA-CeA, and BLA-vHPC) (Figures 5C–5E).
Across 5 mice expressing ChR2 in BLA-vHPC projectors, 46%
of neurons were photoresponsive (192/421). Of the 7 mice ex-
pressing ChR2 in BLA-CeA projectors, 38% were photorespon-
sive (211/559), and 21% (138/646) were photoresponsive units in
9 mice expressing ChR2 in BLA-NAc projectors (Figure 5F).
tracers (CTB 555 or CTB 647) (D, F, and H). The density was computed for each
ed across animals depending on the categories of the AP coordinate (anterior,
,297 neurons. Percentages of BLA-vHPC, BLA-CeM, and BLA-NAc projectors
d I). Each gray circle next to a bar reflects the percentage of projectors in one
, and the lateral BA (one-way ANOVA, F(1.62, 9.72) = 1.61, p > 0.05).
teral BA (one-way ANOVA, F(1.85, 11.07) = 33.23, p < 0.001; Tukey’s multiple
A, *p < 0.05).
teral BLA compared to the LA (one-way ANOVA, F(1.82, 10.94) = 27.52, p < 0.001;
BA versus LA, ***p < 0.001; and lateral BA versus LA, *p < 0.05).
B
C
Ave
rage
neu
ron
coun
t per
slic
eA
vera
ge n
euro
n co
unt p
er s
lice
BLA-N
Ac
BLA-C
eM
BLA-vH
PC
BLA-vH
PC0
200
400
600
BLA-vHPCBLA-vHPC
BLA-CeM
32.8 %
72.0 %
4.8 %
BLA-NAc
42.2 %
69.7 %
11.9 %
BLA-CeM
BLA-NAc
42.2 %
69.7 %
11.2 %
D
E
0
100
200
300
400
Triple tracing (CTB 555, CTB 647, FB): 29 979 neurons, 5 mice
Double tracing (CTB 555, CTB 647): 41 090 neurons, 10 mice
BLA-N
Ac
BLA-C
eM
BLA-vH
PC
BLA-C
eM
BLA
-NAc
BLA-vH
PC
BLA-N
Ac
BLA-vH
PC
B
LA-C
eM
BLA-vH
PC
BLA
-CeM
B
LA-N
Ac
BLA-NAcBLA-CeM
27.7 %
42.4 % 44.1 %
4.2%0.7
3.0%
BLA-vHPC
6.3 %
50 μm
A
BLA-vHPC (FB) BLA-NAc (CTB 555) MergeBLA-CeM (CTB 647)
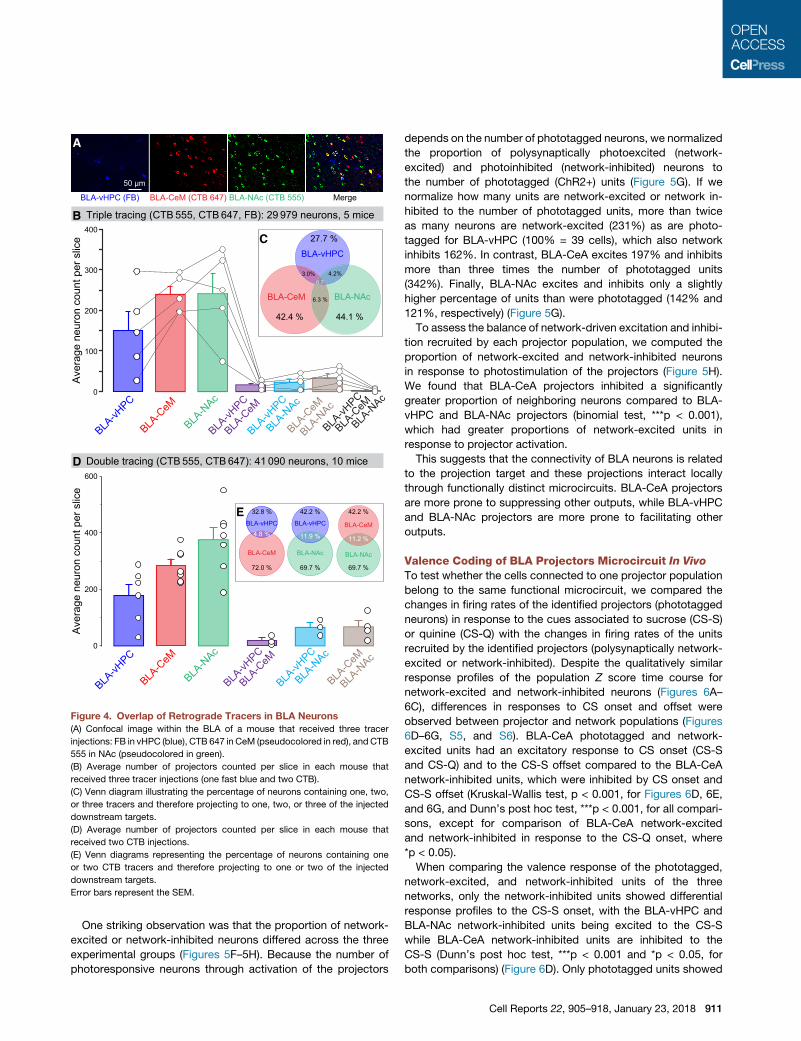
Figure 4. Overlap of Retrograde Tracers in BLA Neurons
(A) Confocal image within the BLA of a mouse that received three tracer
injections: FB in vHPC (blue), CTB 647 in CeM (pseudocolored in red), and CTB
555 in NAc (pseudocolored in green).
(B) Average number of projectors counted per slice in each mouse that
received three tracer injections (one fast blue and two CTB).
(C) Venn diagram illustrating the percentage of neurons containing one, two,
or three tracers and therefore projecting to one, two, or three of the injected
downstream targets.
(D) Average number of projectors counted per slice in each mouse that
received two CTB injections.
(E) Venn diagrams representing the percentage of neurons containing one
or two CTB tracers and therefore projecting to one or two of the injected
downstream targets.
Error bars represent the SEM.
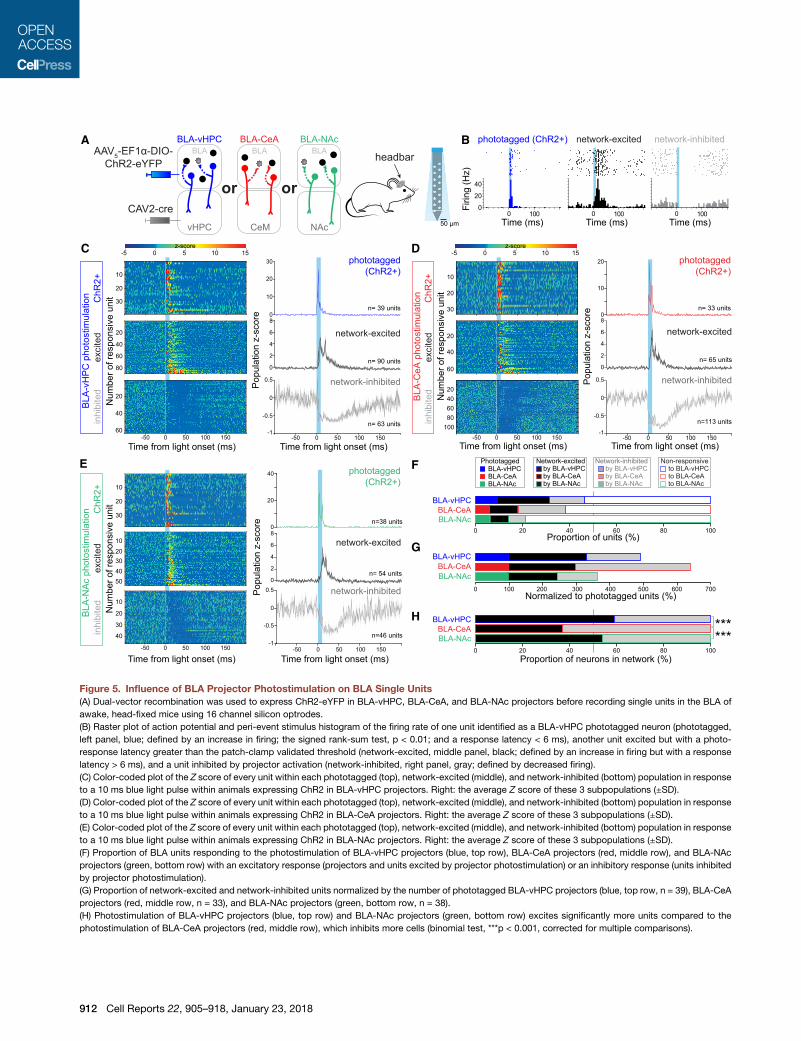
One striking observation was that the proportion of network-
excited or network-inhibited neurons differed across the three
experimental groups (Figures 5F–5H). Because the number of
photoresponsive neurons through activation of the projectors
depends on the number of phototagged neurons, we normalized
the proportion of polysynaptically photoexcited (network-
excited) and photoinhibited (network-inhibited) neurons to
the number of phototagged (ChR2+) units (Figure 5G). If we
normalize how many units are network-excited or network in-
hibited to the number of phototagged units, more than twice
as many neurons are network-excited (231%) as are photo-
tagged for BLA-vHPC (100% = 39 cells), which also network
inhibits 162%. In contrast, BLA-CeA excites 197% and inhibits
more than three times the number of phototagged units
(342%). Finally, BLA-NAc excites and inhibits only a slightly
higher percentage of units than were phototagged (142% and
121%, respectively) (Figure 5G).
To assess the balance of network-driven excitation and inhibi-
tion recruited by each projector population, we computed the
proportion of network-excited and network-inhibited neurons
in response to photostimulation of the projectors (Figure 5H).
We found that BLA-CeA projectors inhibited a significantly
greater proportion of neighboring neurons compared to BLA-
vHPC and BLA-NAc projectors (binomial test, ***p < 0.001),
which had greater proportions of network-excited units in
response to projector activation.
This suggests that the connectivity of BLA neurons is related
to the projection target and these projections interact locally
through functionally distinct microcircuits. BLA-CeA projectors
are more prone to suppressing other outputs, while BLA-vHPC
and BLA-NAc projectors are more prone to facilitating other
outputs.
Valence Coding of BLA Projectors Microcircuit In Vivo
To test whether the cells connected to one projector population
belong to the same functional microcircuit, we compared the
changes in firing rates of the identified projectors (phototagged
neurons) in response to the cues associated to sucrose (CS-S)
or quinine (CS-Q) with the changes in firing rates of the units
recruited by the identified projectors (polysynaptically network-
excited or network-inhibited). Despite the qualitatively similar
response profiles of the population Z score time course for
network-excited and network-inhibited neurons (Figures 6A–
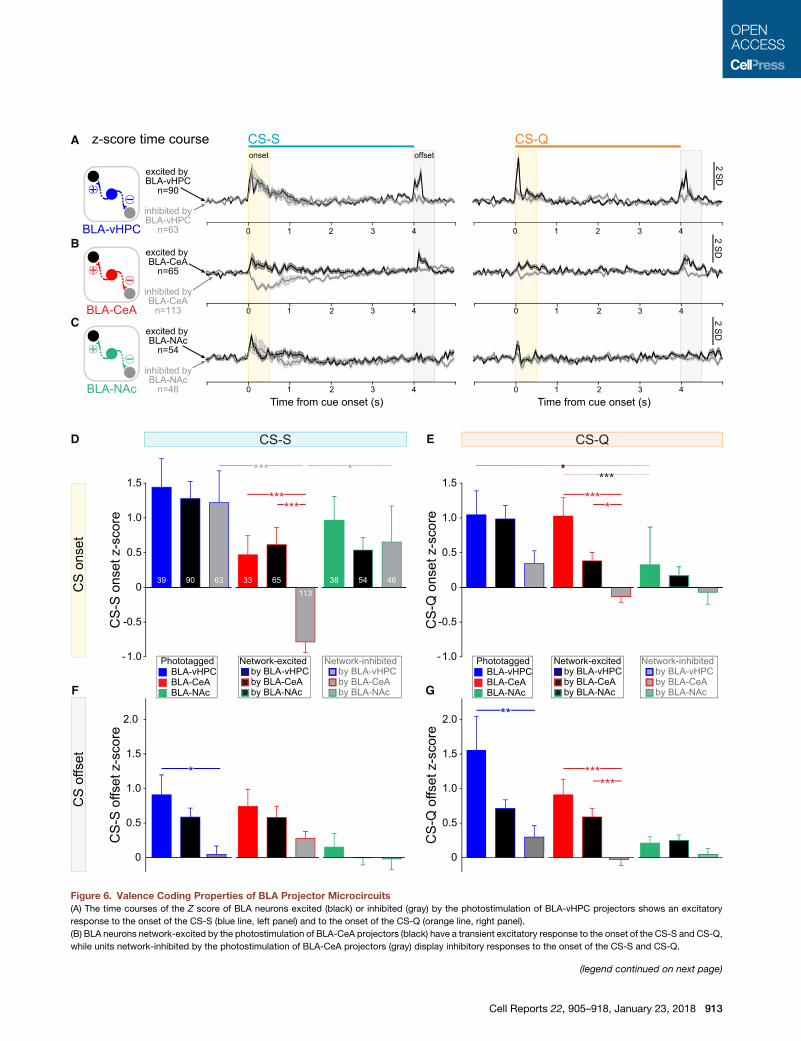
6C), differences in responses to CS onset and offset were
observed between projector and network populations (Figures
6D–6G, S5, and S6). BLA-CeA phototagged and network-
excited units had an excitatory response to CS onset (CS-S
and CS-Q) and to the CS-S offset compared to the BLA-CeA
network-inhibited units, which were inhibited by CS onset and
CS-S offset (Kruskal-Wallis test, p < 0.001, for Figures 6D, 6E,
and 6G, and Dunn’s post hoc test, ***p < 0.001, for all compari-
sons, except for comparison of BLA-CeA network-excited
and network-inhibited in response to the CS-Q onset, where
*p < 0.05).
When comparing the valence response of the phototagged,
network-excited, and network-inhibited units of the three
networks, only the network-inhibited units showed differential
response profiles to the CS-S onset, with the BLA-vHPC and
BLA-NAc network-inhibited units being excited to the CS-S
while BLA-CeA network-inhibited units are inhibited to the
CS-S (Dunn’s post hoc test, ***p < 0.001 and *p < 0.05, for
both comparisons) (Figure 6D). Only phototagged units showed
Cell Reports 22, 905–918, January 23, 2018 911
20
40
60
80
804020 60 1000
Normalized to phototagged units (%)
BLA-CeABLA-NAc
BLA-vHPC
BLA-CeABLA-NAc
BLA-vHPC
Pop
ulat
ion
z-sc
ore
-5 0 5 10 15z-score
-5 0 5 10 15z-score
ChR
2+in
hibi
ted
exci
ted
ChR
2+in
hibi
ted
exci
ted
ChR
2+in
hibi
ted
exci
ted
Num
ber o
f res
pons
ive
unit
-50 500 100 150
n= 39 units
n= 63 units
-50 500 100 150-1
-0.5
0
0.5
0
10
20
30
BLA
-vH
PC
pho
tost
imul
atio
n
20
40
60
Time from light onset (ms)
10
20
30
Time from light onset (ms)
oror
CeM
BLA
vHPC
BLABLA-vHPC BLA-CeA BLA-NAc
NAc
BLA
******
phototagged (ChR2+)
phototagged(ChR2+)
network-inhibited
network-inhibited
network-excited
network-excited
phototagged(ChR2+)
n= 33 units
phototagged(ChR2+)
headbar
50 μm
AAV5-EF1α-DIO-ChR2-eYFP
CAV2-cre
n= 90 units0
2
4
6
8
Proportion of units (%)
BLA-CeABLA-NAc
BLA-vHPC
Time (ms)0 100
Time (ms)0 100
Time (ms)0 100
Firin
g (H
z)
0
20
40
-50 500 100 150
n=113 units
-50 500 100 150-1
-0.5
0
0.5
0
10
20
BLA
-CeA
pho
tost
imul
atio
n
20406080
100
10
20
30
n= 65 units0
2
4
6
8
20
40
60
Pop
ulat
ion
z-sc
ore
Num
ber o
f res
pons
ive
unit
Time from light onset (ms) Time from light onset (ms)
n=38 units
n=46 units
-50 500 100 150-1
-0.5
0
0.5
0
20
40
BLA
-NA
c ph
otos
timul
atio
n
10
20
30
10
20
30
40
-50 500 100 150
10
3020
4050
n= 54 units0
2
4
6
8
Pop
ulat
ion
z-sc
ore
Num
ber o
f res
pons
ive
unit
Time from light onset (ms) Time from light onset (ms)
A B
C D
E F
G
H
BLA-vHPCPhototagged
BLA-CeABLA-NAc
by BLA-vHPCby BLA-CeAby BLA-NAc
Network-excited by BLA-vHPCby BLA-CeAby BLA-NAc
Network-inhibited to BLA-vHPCto BLA-CeAto BLA-NAc
Non-responsive
Proportion of neurons in network (%)
804020 60 1000
400 500 600200100 300 7000network-inhibited
network-excited
network-inhibited
network-excited
Figure 5. Influence of BLA Projector Photostimulation on BLA Single Units
(A) Dual-vector recombination was used to express ChR2-eYFP in BLA-vHPC, BLA-CeA, and BLA-NAc projectors before recording single units in the BLA of
awake, head-fixed mice using 16 channel silicon optrodes.
(B) Raster plot of action potential and peri-event stimulus histogram of the firing rate of one unit identified as a BLA-vHPC phototagged neuron (phototagged,
left panel, blue; defined by an increase in firing; the signed rank-sum test, p < 0.01; and a response latency < 6 ms), another unit excited but with a photo-
response latency greater than the patch-clamp validated threshold (network-excited, middle panel, black; defined by an increase in firing but with a response
latency > 6 ms), and a unit inhibited by projector activation (network-inhibited, right panel, gray; defined by decreased firing).
(C) Color-coded plot of the Z score of every unit within each phototagged (top), network-excited (middle), and network-inhibited (bottom) population in response
to a 10 ms blue light pulse within animals expressing ChR2 in BLA-vHPC projectors. Right: the average Z score of these 3 subpopulations (±SD).
(D) Color-coded plot of the Z score of every unit within each phototagged (top), network-excited (middle), and network-inhibited (bottom) population in response
to a 10 ms blue light pulse within animals expressing ChR2 in BLA-CeA projectors. Right: the average Z score of these 3 subpopulations (±SD).
(E) Color-coded plot of the Z score of every unit within each phototagged (top), network-excited (middle), and network-inhibited (bottom) population in response
to a 10 ms blue light pulse within animals expressing ChR2 in BLA-NAc projectors. Right: the average Z score of these 3 subpopulations (±SD).
(F) Proportion of BLA units responding to the photostimulation of BLA-vHPC projectors (blue, top row), BLA-CeA projectors (red, middle row), and BLA-NAc
projectors (green, bottom row) with an excitatory response (projectors and units excited by projector photostimulation) or an inhibitory response (units inhibited
by projector photostimulation).
(G) Proportion of network-excited and network-inhibited units normalized by the number of phototagged BLA-vHPC projectors (blue, top row, n = 39), BLA-CeA
projectors (red, middle row, n = 33), and BLA-NAc projectors (green, bottom row, n = 38).
(H) Photostimulation of BLA-vHPC projectors (blue, top row) and BLA-NAc projectors (green, bottom row) excites significantly more units compared to the
photostimulation of BLA-CeA projectors (red, middle row), which inhibits more cells (binomial test, ***p < 0.001, corrected for multiple comparisons).
912 Cell Reports 22, 905–918, January 23, 2018
A
B
C
D
F G
E
Figure 6. Valence Coding Properties of BLA Projector Microcircuits
(A) The time courses of the Z score of BLA neurons excited (black) or inhibited (gray) by the photostimulation of BLA-vHPC projectors shows an excitatory
response to the onset of the CS-S (blue line, left panel) and to the onset of the CS-Q (orange line, right panel).
(B) BLA neurons network-excited by the photostimulation of BLA-CeA projectors (black) have a transient excitatory response to the onset of the CS-S and CS-Q,
while units network-inhibited by the photostimulation of BLA-CeA projectors (gray) display inhibitory responses to the onset of the CS-S and CS-Q.
(legend continued on next page)
Cell Reports 22, 905–918, January 23, 2018 913
differential response to the CS-Q onset, with the BLA-vHPC and
BLA-CeA having a larger response to the CS-Q onset compared
to the BLA-NAc projectors (Dunn’s post hoc test, BLA-vHPC
versus BLA-NAc, *p < 0.05, and BLA-CeA versus BLA-NAc,
***p < 0.001).
Similar to BLA-vHPC phototagged units, the BLA-vHPC
network-excited population (Figure 6A, black) showedphasic ex-
citations in response to both the onset and the offset of cues,
regardless of whether they predicted sucrose or quinine (Figures
6A and S5). Although the BLA-vHPC network-inhibited popula-
tion showed similar excitation in response to the CS-S onset,
the excitations to CS-S andCS-Q offsets were significantly lower
in amplitude than for the BLA-vHPC phototagged population
(Kruskal-Wallis test, p < 0.001, and Dunn’s post hoc test, photo-
tagged versus network-inhibited, *p < 0.05, for CS-S offset and,
**p < 0.01, for CS-Q offset, for Figures 6F and 6G).
DISCUSSION
Preferential Coding of Predictive Cues of PositiveValence in the BAIn line with previous electrophysiological studies, we observed
that the distribution of positive and negative valence coding neu-
rons, as described by their preferential response to cues predict-
ing a positive or a negative outcome, was intermingled in the BLA
(Zhang et al., 2013). However, acute in vivo recordings in mice
allow us to sample a larger number of neurons, which permitted
us to unravel a valence coding bias across the DV axis of the
BLA. The BA had a stronger response to the sucrose-predictive
cue compared to the LA in terms of average response of all
neurons; in terms of numbers of units excited to the CS-S, which
were significantly more ventral than units excited to the CS-Q;
and finally, in terms of number of neurons inhibited to the
CS-Q, which tended to be more ventral.
Similar Valence Response to Predictive Cues along theAP Axis of the BLAIn contradiction to a previous study describing two genetically
defined populations segregated along the AP axis of the BLA
in the context of valence (Kim et al., 2016), we were unable
to detect a topographical gradient across the AP axis for neu-
rons encoding positive and negative valence of learned cues
or innate outcomes. One possible explanation is that electro-
physiological recordings reveal both excitatory and inhibitory
responses, which immediate early genes may not reflect.
Another experimental difference is that we quantified re-
sponses of individual neurons to stimuli of both positive and
(C) Time courses of the Z score of BLA neurons excited (black) or inhibited (gray) b
the onset of the CS-S and CS-Q.
(D) Average Z score in response to the CS-S onset (before sucrose delivery) for u
BLA-vHPC (blue), BLA-CeA (red), or BLA-NAc (green) projectors.
(E) Average Z score in response to the CS-Q onset (before sucrose delivery) for u
BLA-vHPC (blue), BLA-CeA (red), or BLA-NAc (green) projectors.
(F) Average Z score in response to the CS-S offset (after CS-S termination) for u
BLA-vHPC (blue), BLA-CeA (red), or BLA-NAc (green) projectors.
(G) Average Z score in response to the CS-Q offset (after CS-Q termination) for u
BLA-vHPC (blue), BLA-CeA (red), or BLA-NAc (green) projectors.
Error bars represent the SEM.
914 Cell Reports 22, 905–918, January 23, 2018
negative valence to meet criteria for valence encoding (Nam-
buri et al., 2016).
One caveat is that we did not record in the most posterior
section of the BLA (from �2.46 to �2.80 mm from bregma).
However, our recordings included parts of the BLA containing
a large number of neurons located in the region reported to
contain mainly parvocellular neurons (more than �2.18 mm
from bregma; 99 of 1,626 neurons in our dataset, 6%). Moreover,
the heterogeneity we observed is consistent with the expression
of c-fos in both the anterior and the posterior BLA, with the differ-
ential proportion depending on the valence of the experience
(Gore et al., 2015; Kim et al., 2016).
Anatomical definition of the sections of the BLA may also
explain discrepancies among studies. Here, we defined the
BLA from the Paxinos and Franklin (2004) mouse atlas, including
the posterior medial BLA (BLP) and excluding the anterior and
posterior parts of the basomedial amygdaloid nucleus (BMA
and BMP, respectively).
Topographical Gradients of BLA ProjectorsConsistent with the intermingling of neurons with different
valence coding properties, we found that BLA neurons projec-
ting to the vHPC, CeM, and NAc are present in the entire BLA.
However, we identified preferential locations of the three projec-
tor populations, which are correlated with the opposing valence
biases of the BLA-NAc and BLA-CeA projector populations
(Beyeler et al., 2016). In line with the preference of the BLA-
CeA population to code for negative valence, in this study, we
found a higher density of BLA-CeA units in the dorsal section
of the BLA across the entire AP axis and more units excited by
the cue predicting an aversive outcome in the dorsal BLA.
Consistently, we found that BLA-NAc projectors are more
concentrated in the ventral BLA and that BLA units in the ventral
BLA are preferentially excited by the reward-predictive cue.
However, the threeprojector populationswestudiedarepart of
a more complex BLA network containing many other anatomi-
cally defined populations, including the neurons projecting to
themedial prefrontal cortex (BLA-mPFC) and the ones projecting
to the bed nucleus of the stria terminalis (BLA-BNST) or to the
insular cortex (BLA-IC). Including the topography of these other
populationswill drastically increase the complexity of the valence
mapping in the BLA but might also bring evidence regarding our
recordings of non-specific units across the entire BLA.
Further underscoring the complexity of the BLA from the
perspective of overlaying functional role and projection target
is that even within source-to-target-defined projections, parallel
paths may be taken, as revealed with CLARITY (Movies S1, S2,
y the photostimulation of BLA-NAc projectors show an excitatory response to
nits phototagged, network-excited, or network-inhibited by photoactivation of
nits phototagged, network-excited, or network-inhibited by photoactivation of
nits phototagged, network-excited, or network-inhibited by photoactivation of
nits phototagged, network-excited, or network-inhibited by photoactivation of
S3, and S4). Our results are in agreement with prior evidence that
projections are heterogeneous in terms of the location and/or
cell type they contact within the downstream target, because
anterior BLA-NAc projectors preferentially target the anterolat-
eral NAc, whereas the posterior BLA-NAc neurons preferentially
target the posteromedial NAc (Krettek and Price, 1978). Further
investigation of the macrostructural organization of amygdalar
circuits is required to determine the significance of these parallel
pathways.
Collateralization of BLA Projector PopulationsCollateralization is a defining feature of projection neurons, and
synapses of one projection-defined population onto different
downstream regions might support diverse behavioral effects.
Stimulating the cell bodies of a population of BLA projectors
might have a different impact on behavior compared to the se-
lective stimulation of the terminals in one downstream region.
In previous studies, we showed that BLA-vHPC, BLA-CeA, and
BLA-NAc populations collateralize to one another’s downstream
targets, with up to 50% of the main downstream region’s relative
fluorescence found in collateral regions (Beyeler et al., 2016).
Again, including collateralization to other regions such as the
mPFC, BNST, or IC would increase the heterogeneity of defining
features of each BLA neuron. In addition, known and unstudied
genetic markers may correspond to defining features that map
onto the collateralization pattern and valence coding properties.
Projection-Defined Components of AmygdalaMicrocircuitsAlthough a number of studies have investigated the functional
role of BLA projections using projection-specific optogenetic
manipulations in behavior, this approach is not physiological.
Furthermore, we have drawn our conclusions based on the
assumption that these projections are working independently,
or with similar local network effects. Here, we show that the
impact of activating projection-defined populations of BLA neu-
rons recruits different extended microcircuits (which are greater
than the number of projection-defined cells activated). The dif-
ferences in the microcircuits recruited reveal a richer landscape
for network interactions within the BLA.
The BLA-vHPC projector population (n = 39), recruits more
network-excited than network-inhibited neurons (n = 90 and
n = 63, respectively) within our sample, and the network-excited
neurons are robustly excited in response to the onset and offset
of both the CS-S and the CS-Q (Figure 6A). The BLA-vHPC pro-
jector population recruits a network 392% the size of itself. This
is consistent with the notion that activation of BLA-vHPC neu-
rons can increase anxiety-related behavior in the absence of
conditioning (Felix-Ortiz et al., 2013), because activation of these
neurons may heighten responsiveness to US in a state of
increased arousal and vigilance. In contrast, the BLA-vHPC
network-inhibited population (n = 63) only shows a robust
response to the CS-S onset, with smaller responses to the
CS-S offset or the CS-Q onset or offset relative to the network-
excited population (Figure 6). Thus, BLA-vHPC neurons facilitate
activity in neurons that are more generally stimulus responsive
and suppress activity in neurons that are more selective to a
reward-predictive cue.
In contrast, our data suggest a more complex role for the
BLA-CeA population than may have been previously appreci-
ated. This may synthesize apparently conflicting studies report-
ing the role of the CeA in freezing and avoidance (Ciocchi et al.,
2010; Davis and Shi, 1999; Duvarci and Pare, 2014; Fadok et al.,
2017; Goosens and Maren, 2001; Haubensak et al., 2010; Jime-
nez and Maren, 2009; Li et al., 2013; Maren and Quirk, 2004;
Penzo et al., 2014; Sanford et al., 2017; Viviani et al., 2011)
versus appetitive or anxiolytic behaviors (Corbit and Balleine,
2005; Hall et al., 2001; Han et al., 2017; Holland and Gallagher,
2003; Kim et al., 2017; Tye et al., 2011).
BLA-CeA (primarily BLA-CeM) neurons are well positioned to
play a role in state-dependent action selection, because the
neurons that are network-excited and network-inhibited have
qualitatively opposing response profiles (Figure 6). Furthermore,
BLA-CeA neurons inhibit significantly greater proportions of neu-
rons than they excite (Figures 5F and 5G), consistent with a role
for gating action selection. Another defining feature of BLA-CeA
projectors is that the network-excited population is qualitatively
more similar to the projectors than the network-inhibited popula-
tion (Figures 6D–6G). Although future experiments are required
to elucidate the identity and function of BLA-CeA network-
inhibited cells, we speculate that these neurons (representing
539% of the phototagged population) are diverse in the projec-
tion target and behaviors they evoke. In contrast, BLA-vHPC
and BLA-NAc photoidentified neurons showed more qualita-
tively similar responses to their respective network-inhibited
populations (Figures 6D–6G).
Why would a population facilitate neurons with opposing
responses but inhibit neurons with similar response profiles?
Neurons with similar responses to stimuli do not need to all
participate in a similar manner in driving behavior—and
suppressing different behavioral actions may be precisely what
neurons that select a specific action must do.
BLA-NAc neurons show relatively balanced proportions of
neurons that are network-excited and network-inhibited (Fig-
ure 5). Furthermore, these in-network populations show remark-
ably congruent response profiles to the BLA-NAc neurons and
one another in terms of selective excitatory responses to the
CS-S onset (Figures 6C, 6D, 6F, and 6G). The accumulation of
evidence surrounding the BLA-NAc projection has consistently
supported the role of this projection in mediating positive
valence and appetitive behavior (Beyeler et al., 2016; Britt
et al., 2012; Namburi et al., 2015; Ramirez et al., 2015; Stuber
et al., 2011).
In contrast to the BLA-CeA neurons, the BLA-NAc neurons
have relatively modest impact on the local circuitry (modulating
activity of only 263% of the phototagged population). We spec-
ulate that the role of this projection across studies and conditions
may be related to the relatively restricted network that this pop-
ulation recruits and that this may be flexible depending on the in-
ternal state signaled by sources such as the paraventricular
thalamic input (Do-Monte et al., 2017; Haight et al., 2017; Livneh
et al., 2017). Altogether, these findings are consistent with evi-
dence that reward- and threat-predicting cues recruit distinct
subsets of BLA neurons (Lee et al., 2017).
In conclusion, the BLA, which is often deemed primitive due
to its lack of a laminar structure, has an intricate anatomical
Cell Reports 22, 905–918, January 23, 2018 915
architecture. Whether its function relies on the layers of topo-
graphical gradients or functions despite this vestige of disorga-
nization is yet unknown. The existing information begs for further
investigation of the microcircuit interactions on a synaptic level,
as well as the changes across different behavioral states. Both
recording and immediate early gene readouts for neural activity
and identification of both the genetic and the anatomical features
of neuronal populations will be important for a comprehensive
understanding of amygdala circuitry.
EXPERIMENTAL PROCEDURES
See the Supplemental Information for detailed procedures.
Animal Care and Surgery
All procedures for handling animals were in accordance with the guidelines
from NIH and with approval from the Massachusetts Institute of Technology
(MIT) Committee on Animal Care (CAC). Adult wild-type male C57BL/6 mice
were maintained with a reverse 12 hr light/dark cycle with ad libitum food
and water, except during behavioral training and electrophysiological record-
ings. All surgeries were performed on mice aged 8–12 weeks (Jackson Labo-
ratory, Bar Harbor, ME) and conducted under aseptic conditions using a digital
small animal stereotaxic instrument (David Kopf Instruments, Tujunga, CA).
For surgery, mice were anesthetized in a sealed box containing gaseous iso-
flurane (5%) and maintained under anesthesia in the stereotaxic frame
(1.5%–2.0% isoflurane) for the entire surgery while their body temperatures
were kept �36�C with a heating pad. After surgery, the body temperature
was maintained using an infrared heat lamp until the mice fully recovered
from anesthesia.
In Vivo Electrophysiology
A subset of these data was previously analyzed in Beyeler et al. (2016). For
additional methodology, refer to this publication. To express ChR2 fused to
enhanced yellow fluorescent protein (eYFP) only in neurons of the BLA pro-
jecting to a specific downstream target, AAV5-EF1a-DIO-ChR2-eYFP was
injected into the BLA and CAV2 carrying cre recombinase (CAV2-cre) or a
1:1 mixture of CAV2-cre and HSV-hEF1a-mCh-IRES-cre was injected into
the vHPC, the CeM, or the NAc (see Figure S2 for coordinates). Approxi-
mately 11 weeks after viral surgery, mice were head-fixed, and two auditory
cues were played in anticipation of deliveries of either sucrose or quinine
solutions (1 and 8 kHz, counterbalanced between animals). During the first
2 days, only one cue was played, and 500 ms after the onset of the auditory
cue, a drop of sucrose solution was delivered. After mice acquired this as-
sociation, indicated by anticipatory licking, we introduced the second audi-
tory cue paired with a delivery of 1 mM quinine solution. After �6 days of
training, mice reached the learning criterion (>70 success rate for each as-
sociation), and we recorded neural activity in the BLA using the silicon
optrode (A1x16-Poly2-5mm-50 s-177, Neuronexus) coated with red fluores-
cent latex microspheres to locate the recording site. Recordings were
performed using a RZ5D TDT system while presenting at least 30 sucrose
and 30 quinine interleaved trials. Following completion of the task, a photo-
identification session using a 473 nm laser was conducted (15 mW, 1 Hz,
and 10 ms). An offline sorter (Plexon) was used for sorting single units,
and neural responses of every unit in response to cues and light stimula-
tions were analyzed using MATLAB software.
Retrograde Tracing of BLA Projector Populations and Histology
To label BLA-vHPC, BLA-CeM, or BLA-NAc projectors, we injected three
fluorescent tracers in each projection target (Figure S2A). CTB 555 or
CTB 647 or fast blue (FB) were used. One week after the surgery, the
mice were deeply anesthetized and transcardially perfused with ice-cold
Ringer’s solution, followed by ice-cold 4% paraformaldehyde (PFA) in
PBS (pH 7.3). Extracted brains were fixed in 4% PFA overnight and then
equilibrated in 30% sucrose in PBS. Then, 50 mm thick coronal sections
were sliced using a sliding microtome and stored in PBS at 4�C. Sections
916 Cell Reports 22, 905–918, January 23, 2018
were mounted on microscope slides with polyvinyl alcohol (PVA)-DABCO.
Images were acquired with an Olympus FV1000 confocal laser scanning mi-
croscope. BLA projectors containing fluorescent tracers were counted and
located using Imaris software (Bitplane) and then analyzed using MATLAB
software, in which the coordinates of each spot were normalized to the
most dorsal point of the BLA. The density of projection-defined neurons
in the BLA was calculated and represented in heatmaps (Figures 3C, 3E,
and 3G). To quantify the location biases observed on the heatmaps, the
BLA was split in three subregions: LA, medial BA, and lateral BA.
Anterograde Tracing of BLA Projector Populations with CLARITY
AAV5-EF1a-DIO-eYFP was injected into the BLA and CAV2-cre, or a 1:1
mixture of CAV2-cre and HSV-hEF1a-mCh-IRES-cre was injected into the
vHPC, CeM, or vHPC (see Figure S2A for coordinates). To express eYFP
only in the BLA-NAc projector population andmCherry in BLA-CeA projectors,
we injected HSV-hEF1a-flp in the NAc, CAV2-cre in the CeM, and a mixture
(1:1) of AAV5-EF1a-fDIO-eYFP and AAV5-EF1a-cDIO-mCh in the BLA. The
clearing protocol was adapted fromChung et al. (2013). Confocal fluorescence
images were acquired from cleared half-brains using a Leica TCS SP8 white
laser confocal scanning microscope.
Statistical Analysis
The thresholds for significance were placed at *p < 0.05, **p < 0.01, and
***p < 0.001. All data are shown as mean and SEM unless stated otherwise.
Paired Student’s t test, repeated-measure ANOVA,Wilcoxon signed rank-sum
test (paired), Kruskal-Wallis ANOVA followed by a Dunn’s post hoc test,
and binomial test were performed using GraphPad Prism 6 or MATLAB. The
p values were corrected for multiple comparisons.
SUPPLEMENTAL INFORMATION
Supplemental Information includes Supplemental Experimental Procedures,
six figures, and four movies and can be found with this article online at
https://doi.org/10.1016/j.celrep.2017.12.097.
ACKNOWLEDGMENTS
We thank the entire K.M.T. laboratory for helpful discussion. We thank
K. Chung and his lab for advice regarding CLARITY. We thank E.J. Kremer
for providing the CAV2-cre vector, R. Neve for the HSV vectors, and the Univer-
sity of North Carolina (UNC) vector core for the AAV5 vectors. K.M.T. is a New
York Stem Cell Foundation Robertson Investigator and McKnight Scholar,
and this work was supported by funding from the JPB Foundation, PIIF,
PNDRF, JFDP, Whitehall Foundation, Klingenstein Foundation, NARSAD,
Alfred P. Sloan Foundation, New York Stem Cell Foundation, NIH grant R01-
MH102441 (NIMH), and NIH Director’s New Innovator Award DP2-DK-
102256 (NIDDK). A.B. was supported by a fellowship from the Swiss National
Science Foundation and NARSAD. P.N. was supported by Singleton, Leven-
thal, and Whitaker fellowships.
AUTHOR CONTRIBUTIONS
Conceptualization, K.M.T. and A.B.; Methodology, A.B. and P.N.; Investiga-
tion, A.B., M.S., and C.L.; Software, C.-J.C., P.N., M.S., and A.B.; Writing –
Original Draft, A.B., K.M.T., and C.-J.C.; Writing – Review & Editing, A.B.,
C.-J.C., M.S., P.N., C.P.W., and K.M.T.; Funding Acquisition, K.M.T., A.B.,
and P.N.; Resources, K.M.T. and C.P.W.; Supervision, K.M.T.
DECLARATION OF INTERESTS
The authors declare no competing interests.
Received: September 1, 2017
Revised: October 30, 2017
Accepted: December 26, 2017
Published: January 23, 2018
REFERENCES
Alheid, G.F. (2003). Extended amygdala and basal forebrain. Ann. N Y Acad.
Sci. 985, 185–205.
Baxter, M.G., and Murray, E.A. (2002). The amygdala and reward. Nat. Rev.
Neurosci. 3, 563–573.
Baxter, M.G., Parker, A., Lindner, C.C.C., Izquierdo, A.D., and Murray, E.A.
(2000). Control of response selection by reinforcer value requires interaction
of amygdala and orbital prefrontal cortex. J. Neurosci. 20, 4311–4319.
Beyeler, A., Namburi, P., Glober, G.F., Simonnet, C., Calhoon, G.G., Conyers,
G.F., Luck, R., Wildes, C.P., and Tye, K.M. (2016). Divergent routing of positive
and negative information from the amygdala during memory retrieval. Neuron
90, 348–361.
Britt, J.P., Benaliouad, F., McDevitt, R.A., Stuber, G.D., Wise, R.A., and Bonci,
A. (2012). Synaptic and behavioral profile of multiple glutamatergic inputs to
the nucleus accumbens. Neuron 76, 790–803.
Burgos-Robles, A., Kimchi, E.Y., Izadmehr, E.M., Porzenheim, M.J., Ramos-
Guasp,W.A., Nieh, E.H., Felix-Ortiz, A.C., Namburi, P., Leppla, C.A., Presbrey,
K.N., et al. (2017). Amygdala inputs to prefrontal cortex guide behavior amid
conflicting cues of reward and punishment. Nat. Neurosci. 20, 824–835.
Cador, M., Robbins, T.W., and Everitt, B.J. (1989). Involvement of the amyg-
dala in stimulus-reward associations: interaction with the ventral striatum.
Neuroscience 30, 77–86.
Cardinal, R.N., Parkinson, J.A., Hall, J., and Everitt, B.J. (2002). Emotion and
motivation: the role of the amygdala, ventral striatum, and prefrontal cortex.
Neurosci. Biobehav. Rev. 26, 321–352.
Chung, K., Wallace, J., Kim, S.-Y., Kalyanasundaram, S., Andalman, A.S.,
Davidson, T.J., Mirzabekov, J.J., Zalocusky, K.A., Mattis, J., Denisin, A.K.,
et al. (2013). Structural and molecular interrogation of intact biological sys-
tems. Nature 497, 332–337.
Ciocchi, S., Herry, C., Grenier, F., Wolff, S.B.E., Letzkus, J.J., Vlachos, I.,
Ehrlich, I., Sprengel, R., Deisseroth, K., Stadler, M.B., et al. (2010). Encoding
of conditioned fear in central amygdala inhibitory circuits. Nature 468,
277–282.
Corbit, L.H., and Balleine, B.W. (2005). Double dissociation of basolateral
and central amygdala lesions on the general and outcome-specific forms of
pavlovian-instrumental transfer. J. Neurosci. 25, 962–970.
Davis, M., and Shi, C. (1999). The extended amygdala: are the central nucleus
of the amygdala and the bed nucleus of the stria terminalis differentially
involved in fear versus anxiety? Ann. N Y Acad. Sci. 877, 281–291.
Do-Monte, F.H., Minier-Toribio, A., Quinones-Laracuente, K., Medina-Colon,
E.M., and Quirk, G.J. (2017). Thalamic regulation of sucrose seeking during
unexpected reward omission. Neuron 94, 388–400.
Duvarci, S., and Pare, D. (2014). Amygdala microcircuits controlling learned
fear. Neuron 82, 966–980.
Fadok, J.P., Krabbe, S., Markovic, M., Courtin, J., Xu, C., Massi, L., Botta, P.,
Bylund, K., M€uller, C., Kovacevic, A., et al. (2017). A competitive inhibitory cir-
cuit for selection of active and passive fear responses. Nature 542, 96–100.
Fanselow, M.S., and Kim, J.J. (1994). Acquisition of contextual Pavlovian
fear conditioning is blocked by application of an NMDA receptor antagonist
D,L-2-amino-5-phosphonovaleric acid to the basolateral amygdala. Behav.
Neurosci. 108, 210–212.
Felix-Ortiz, A.C., and Tye, K.M. (2014). Amygdala inputs to the ventral hippo-
campus bidirectionally modulate social behavior. J. Neurosci. 34, 586–595.
Felix-Ortiz, A.C., Beyeler, A., Seo, C., Leppla, C.A., Wildes, C.P., and Tye, K.M.
(2013). BLA to vHPC inputs modulate anxiety-related behaviors. Neuron 79,
658–664.
Felix-Ortiz, A.C., Burgos-Robles, A., Bhagat, N.D., Leppla, C.A., and Tye, K.M.
(2016). Bidirectional modulation of anxiety-related and social behaviors by
amygdala projections to the medial prefrontal cortex. Neuroscience 321,
197–209.
Fuster, J.M., and Uyeda, A.A. (1971). Reactivity of limbic neurons of the mon-
key to appetitive and aversive signals. Electroencephalogr. Clin. Neurophysiol.
30, 281–293.
Goosens, K.A., and Maren, S. (2001). Contextual and auditory fear condition-
ing are mediated by the lateral, basal, and central amygdaloid nuclei in rats.
Learn. Mem. 8, 148–155.
Gore, F., Schwartz, E.C., Brangers, B.C., Aladi, S., Stujenske, J.M., Likhtik, E.,
Russo, M.J., Gordon, J.A., Salzman, C.D., and Axel, R. (2015). Neural repre-
sentations of unconditioned stimuli in basolateral amygdala mediate innate
and learned responses. Cell 162, 134–145.
Grabenhorst, F., Hernadi, I., and Schultz, W. (2012). Prediction of economic
choice by primate amygdala neurons. Proc. Natl. Acad. Sci. USA 109, 18950–
18955.
Haight, J.L., Fuller, Z.L., Fraser, K.M., and Flagel, S.B. (2017). A food-predic-
tive cue attributed with incentive salience engages subcortical afferents and
efferents of the paraventricular nucleus of the thalamus. Neuroscience 340,
135–152.
Hall, J., Parkinson, J.A., Connor, T.M., Dickinson, A., and Everitt, B.J. (2001).
Involvement of the central nucleus of the amygdala and nucleus accumbens
core in mediating Pavlovian influences on instrumental behaviour. Eur. J. Neu-
rosci. 13, 1984–1992.
Han, W., Tellez, L.A., Rangel, M.J., Jr., Motta, S.C., Zhang, X., Perez, I.O.,
Canteras, N.S., Shammah-Lagnado, S.J., van den Pol, A.N., and de Araujo,
I.E. (2017). Integrated control of predatory hunting by the central nucleus of
the amygdala. Cell 168, 311–324.
Haubensak, W., Kunwar, P.S., Cai, H., Ciocchi, S., Wall, N.R., Ponnusamy, R.,
Biag, J., Dong, H.-W., Deisseroth, K., Callaway, E.M., et al. (2010). Genetic
dissection of an amygdala microcircuit that gates conditioned fear. Nature
468, 270–276.
Holland, P.C., and Gallagher, M. (2003). Double dissociation of the effects
of lesions of basolateral and central amygdala on conditioned stimulus-poten-
tiated feeding and Pavlovian-instrumental transfer. Eur. J. Neurosci. 17, 1680–
1694.
Janak, P.H., and Tye, K.M. (2015). From circuits to behaviour in the amygdala.
Nature 517, 284–292.
Jimenez, S.A., and Maren, S. (2009). Nuclear disconnection within the amyg-
dala reveals a direct pathway to fear. Learn. Mem. 16, 766–768.
Kim, J., Pignatelli, M., Xu, S., Itohara, S., and Tonegawa, S. (2016). Antago-
nistic negative and positive neurons of the basolateral amygdala. Nat. Neuro-
sci. 19, 1636–1646.
Kim, J., Zhang, X., Muralidhar, S., LeBlanc, S.A., and Tonegawa, S. (2017). Ba-
solateral to central amygdala neural circuits for appetitive behaviors. Neuron
93, 1464–1479.
Kremer, E.J., Boutin, S., Chillon, M., and Danos, O. (2000). Canine adenovirus
vectors: an alternative for adenovirus-mediated gene transfer. J. Virol. 74,
505–512.
Krettek, J.E., and Price, J.L. (1978). A description of the amygdaloid complex
in the rat and cat with observations on intra-amygdaloid axonal connections.
J. Comp. Neurol. 178, 255–280.
LeDoux, J.E., Cicchetti, P., Xagoraris, A., and Romanski, L.M. (1990).
The lateral amygdaloid nucleus: sensory interface of the amygdala in fear con-
ditioning. J. Neurosci. 10, 1062–1069.
Lee, S.-C., Amir, A., Haufler, D., and Pare, D. (2017). Differential recruitment
of competing valence-related amygdala networks during anxiety. Neuron 96,
81–88.
Lein, E.S., Hawrylycz, M.J., Ao, N., Ayres, M., Bensinger, A., Bernard, A., Boe,
A.F., Boguski, M.S., Brockway, K.S., Byrnes, E.J., et al. (2007). Genome-wide
atlas of gene expression in the adult mouse brain. Nature 445, 168–176.
Li, H., Penzo, M.A., Taniguchi, H., Kopec, C.D., Huang, Z.J., and Li, B. (2013).
Experience-dependent modification of a central amygdala fear circuit. Nat.
Neurosci. 16, 332–339.
Livneh, Y., Ramesh, R.N., Burgess, C.R., Levandowski, K.M., Madara, J.C.,
Fenselau, H., Goldey, G.J., Diaz, V.E., Jikomes, N., Resch, J.M., et al.
Cell Reports 22, 905–918, January 23, 2018 917
(2017). Homeostatic circuits selectively gate food cue responses in insular cor-
tex. Nature 546, 611–616.
Maren, S., and Quirk, G.J. (2004). Neuronal signalling of fear memory. Nat.
Rev. Neurosci. 5, 844–852.
Miserendino, M.J.D., Sananes, C.B., Melia, K.R., and Davis, M. (1990). Block-
ing of acquisition but not expression of conditioned fear-potentiated startle by
NMDA antagonists in the amygdala. Nature 345, 716–718.
Namburi, P., Beyeler, A., Yorozu, S., Calhoon, G.G., Halbert, S.A., Wichmann,
R., Holden, S.S., Mertens, K.L., Anahtar, M., Felix-Ortiz, A.C., et al. (2015).
A circuit mechanism for differentiating positive and negative associations.
Nature 520, 675–678.
Namburi, P., Al-Hasani, R., Calhoon, G.G., Bruchas, M.R., and Tye, K.M.
(2016). Architectural representation of valence in the limbic system. Neuropsy-
chopharmacology 41, 1697–1715.
Paton, J.J., Belova, M.A., Morrison, S.E., and Salzman, C.D. (2006). The pri-
mate amygdala represents the positive and negative value of visual stimuli dur-
ing learning. Nature 439, 865–870.
Paxinos, G., and Franklin, K.B.J. (2004). The Mouse Brain in Stereotaxic Coor-
dinates (Gulf Professional Publishing).
Penzo, M.A., Robert, V., and Li, B. (2014). Fear conditioning potentiates syn-
aptic transmission onto long-range projection neurons in the lateral subdivi-
sion of central amygdala. J. Neurosci. 34, 2432–2437.
Ramirez, S., Liu, X., MacDonald, C.J., Moffa, A., Zhou, J., Redondo, R.L., and
Tonegawa, S. (2015). Activating positive memory engrams suppresses
depression-like behaviour. Nature 522, 335–339.
Redondo, R.L., Kim, J., Arons, A.L., Ramirez, S., Liu, X., and Tonegawa, S.
(2014). Bidirectional switch of the valence associated with a hippocampal
contextual memory engram. Nature 513, 426–430.
918 Cell Reports 22, 905–918, January 23, 2018
Sanford, C.A., Soden, M.E., Baird, M.A., Miller, S.M., Schulkin, J., Palmiter,
R.D., Clark, M., and Zweifel, L.S. (2017). A central amygdala CRF circuit facil-
itates learning about weak threats. Neuron 93, 164–178.
Schoenbaum, G., Chiba, A.A., andGallagher, M. (1999). Neural encoding in or-
bitofrontal cortex and basolateral amygdala during olfactory discrimination
learning. J. Neurosci. 19, 1876–1884.
Shabel, S.J., and Janak, P.H. (2009). Substantial similarity in amygdala
neuronal activity during conditioned appetitive and aversive emotional arousal.
Proc. Natl. Acad. Sci. USA 106, 15031–15036.
Stuber, G.D., Sparta, D.R., Stamatakis, A.M., van Leeuwen, W.A., Hardjopra-
jitno, J.E., Cho, S., Tye, K.M., Kempadoo, K.A., Zhang, F., Deisseroth, K., and
Bonci, A. (2011). Excitatory transmission from the amygdala to nucleus ac-
cumbens facilitates reward seeking. Nature 475, 377–380.
Tye, K.M., Stuber, G.D., de Ridder, B., Bonci, A., and Janak, P.H. (2008). Rapid
strengthening of thalamo-amygdala synapses mediates cue-reward learning.
Nature 453, 1253–1257.
Tye, K.M., Prakash, R., Kim, S.-Y., Fenno, L.E., Grosenick, L., Zarabi, H.,
Thompson, K.R., Gradinaru, V., Ramakrishnan, C., and Deisseroth, K.
(2011). Amygdala circuitry mediating reversible and bidirectional control of
anxiety. Nature 471, 358–362.
Viviani, D., Charlet, A., van den Burg, E., Robinet, C., Hurni, N., Abatis, M.,
Magara, F., and Stoop, R. (2011). Oxytocin selectively gates fear responses
through distinct outputs from the central amygdala. Science 333, 104–107.
Wilensky, A.E., Schafe, G.E., and LeDoux, J.E. (1999). Functional inactivation
of the amygdala before but not after auditory fear conditioning prevents mem-
ory formation. J. Neurosci. 19, RC48.
Zhang, W., Schneider, D.M., Belova, M.A., Morrison, S.E., Paton, J.J., and
Salzman, C.D. (2013). Functional circuits and anatomical distribution of
response properties in the primate amygdala. J. Neurosci. 33, 722–733.