Organization-Based Taxi-Sharing: Demand, Service Design ... › Neighborhood › Documents ›...
58
Organization-Based Taxi-Sharing: Demand, Service Design, and Policy Analysis Maya Abou Zeid American University of Beirut Seminar at NYU, Abu Dhabi May 22, 2016
Transcript of Organization-Based Taxi-Sharing: Demand, Service Design ... › Neighborhood › Documents ›...

Organization-Based Taxi-Sharing: Demand, Service Design, and Policy
Analysis
Maya Abou ZeidAmerican University of Beirut
Seminar at NYU, Abu Dhabi
May 22, 2016

Research Team
• Prof. Isam Kaysi (co-PI)
• Prof. Maya Abou Zeid (co-PI)
• Prof. Cynthia Myntti (project manager of Neighborhood Initiative)
• Dr. Hani Al-Naghi (PhD student – graduated)
• Zahwa Al-Ayyash (Master’s student –graduated)
• Alisar Aoun (graduate research assistant)
2

Outline
• Introduction
• Evaluation framework
• Demand models
• Service design
• Viability for operator
• Institutional support
• Conclusion
3

Introduction
4

Introduction
• Urban commuting challenges
– High motorization rates / congestion
– Parking shortage
– Limited public transport services
• Large institutions in urban areas are major generators of traffic in their neighborhoods
5

Parking Provision
• It is widely recognized that building more parking is costly and promotes the role of the private car as a preferred mode of transport
• Example: UCLA (2001-2003)
Significantly lower cost of subsidizing transit service compared to building new parking spaces
6
Cost of subsidizing transit Cost of providing parking
$1.27 per eligible rider per month $223 per month per space

Transport Demand Management
• Institutions need to consider strategies to reduce parking demand (and reliance on private autos)
• Transport demand management strategies include:
– Compressed workweek
– Pricing / disincentives / subsidies
– Ridesharing / taxi-sharing
– More affordable housing nearby
– And others… 7
focus of this presentation

Shared-Ride Taxi: Concept
• A Shared-Ride Taxi (SRT) is a door-to-door vehicle that enables two or more individuals to be served simultaneously based on spatial and temporal matching
• Organization-based: Customers are constituents of an organization
8

Properties
• Door-to-door comfort of the private car
• Shared ride advantage of public transport
• Different modes and vehicles (taxi, minivan, etc.) may be used
• Technology-enabled (dynamic scheduling, reservations through web or SMS, location awareness through GPS, etc.)
• SRT involves deviation relative to direct trip
9

Concept of Deviation
10
C
B
A
ttAB
ttBC
ttAC
• Deviation for person A = (ttAB + ttBC) – ttAC
• Generally, travelers are not willing to accept a large deviation impose max. deviation constraint:
(ttAB + ttBC) – ttAC ≤ Max. deviation

SRT Is a Form of Ridesharing
11
Source: Chan and Shaheen (2012)

SRT Example: Google Shuttle Bus
• Corporate tech shuttles that transport company employees in the SF Bay area to work (Google, Facebook, Apple, Yahoo,…)
• Shuttle attributes:
– Comfortable air-conditioned ride
– Real-time location information
– Wi-Fi
– Bike racks
• Ridership:
– Google: 6400 per day (Google website)
– 47% of riders would drive if it weren’t for the shuttles (SF
Municipal Transportation Agency)12

The Case of the American University of Beirut (AUB)
• AUB is a private university with around 8000 students (from mostly wealthy families) and 4400 employees
• It is located in a dense and congested urban area in Ras Beirut
13

AUB Context (cont.)Main Issues
• High reliance on the private car and parking shortage– AUB contributes about 21% of peak
hour trips and 21% of carbon emissions in its neighborhood (Kassab, 2011)
– AUB’s parking demand is nearly 3,000external parking spaces in addition to the 1,105 parking spaces on campus (Aoun et al., 2013)
• Low quality public transport options with limited coverage outside Beirut
14
Private Car42%
Bus/Jitney24%
Other (Live on campus, walking, bicycle,
motorcycle)34%
Commute Mode Distribution (2013)

Public Transport in Beirut, Lebanon
15
Jitneys (‘service’) Buses
Minibuses
• Unregulated by the government• No fixed stops/bus shelters• Poor quality and stigmatized
image• Limited coverage outside the city

AUB Context (cont.)Vision
• Main challenges:
– How to apply public transport measures without existing public transport systems?
– How to shift high-income users away from private, low-occupancy modes?
• A shared-taxi service for AUB students was identified as a promising TDM option that adapts the conventional public transport model to suit the target population (Aoun et al., 2013)
16

Shared-Taxi Evaluation Framework
17
Problem Statement
• The objective is to design an organization-based SRT and assess its feasibility
• Research focus: demand and service design
18

Evaluation Framework(Al-Naghi, 2014)
19

Research Program
• Demand and policy analysis (Al-Ayyash, 2015; Al-Ayyash et al., 2016)
– Econometric demand models for SRT in an organization-based context
• Service design and feasibility (Al-Naghi, 2014)
– Vehicle routing algorithms and simulation of the operation of SRT for evaluation purposes
• Case study application to AUB
20
Demand Models(Source: Al-Ayyash, 2015; Al-Ayyash et al., 2016)
21

Factors Influencing Ridesharing Demand
• In-vehicle time / deviation and waiting time
• Cost and incentives
• Availability of computer and cell phone messaging
• Safety and security (background checks)
• User awareness
• Perceived flexibility, convenience, and privacy
• Age, employment status, difficulty in walking, etc.
22
Source: Amey, 2010; Ben-Akiva et al., 1996; Benjamin et al., 1998; Chan and Shaheen, 2012; Deakin et al., 2010; Takeuchi et al., 2003

Demand Models
• Aim: assess the market share of SRT and elasticity w.r.t. time, fare, comfort, etc.
• Since the SRT isn’t an existing mode of transport, use stated preference surveys with hypothetical scenarios
23

Example of a Choice Scenario
24
How many days per week will you use the shared-ride taxi service?
Dependent variable

Modeling Framework
• Disaggregate random utility choice model
– 6 alternatives: 0, 1, 2, 3, 4, 5 days per week of using SRT
– Utility of each alternative is function of:
• Attributes: travel time difference, cost difference, max. allowed waiting time, vehicle type, and presence of Wi-Fi in vehicle/mobile app for reservation
• Individual characteristics: Gender, attitude towards ride-sharing (latent)
• Model predicts the probability of each alternative 25
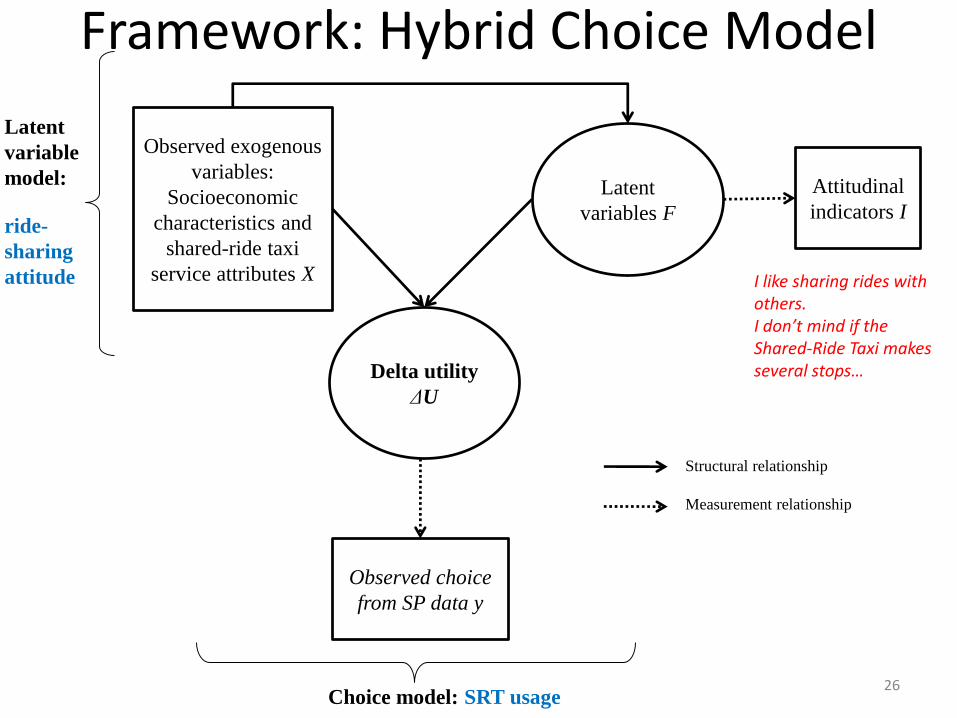
Framework: Hybrid Choice Model
26
Delta utility
ΔU
Observed exogenous
variables:
Socioeconomic
characteristics and
shared-ride taxi
service attributes X
Attitudinal
indicators I
Latent
variables F
Observed choice
from SP data y
Structural relationship
Measurement relationship
Latent
variable
model:
ride-
sharing
attitude
Choice model: SRT usage
I like sharing rides with others.I don’t mind if the Shared-Ride Taxi makes several stops…

Main Findings
27
Variable Effect on SRT ridership
Travel time deviation
Additional cost
Minivan (compared to taxi)
Max. allowed waiting time for pick-up/drop-off
Wi-Fi in vehicle
Male (for PT users)
Favorable ride-sharing attitude
• Model was estimated separately for students who commute by car and those who commute by public transport
• Car users are more time sensitive than PT users, while PT users are more cost sensitive than car users

Policy Analysis Different SRT Service Types
28

Policy Analysis (cont.)SRT Ridership by Type
29• Different service types can be offered to cater for different types
of users

Service Design(Source: Al-Naghi, 2014)
30

Problem
• Aim: formation of vehicle tours based on spatial and temporal matching
31
Output
• Assignment of students on tours from different origins to a single destination, and then back (2-way)
• Number of cars needed and car occupancy
Input
• Origins and destinations
• Schedule
• Mode of commute
• Socioeconomic characteristics
• Road network

Optimization Problem
• Special case of Vehicle Routing Problems (VRP)
– Capacitated vehicle routing problem with time windows
• Objective function: minimize total operating cost
• Constraints:
– Deviation from direct path is below a certain threshold
– Arrival/departure time is within a certain window
– Vehicle capacity 32

Optimization Problem (cont.)
• Known to be NP-Hard, and thus exact algorithms cannot solve large problems in real time
• Known heuristic algorithms: Branch-and-Bound, Clarke and Wright's Savings, Nearest Neighbor (Greedy), Column Generation, Genetic, and the Ant Colony
• Research contribution: develop computationally efficient heuristics for large-scale problems 33

Algorithms
• Basic intuition: construct a tree rooted at the depot and solve the VRP on the tree
• Tree illustration:
• Spatial hierarchy of a tree is intuitive for the sequence of packing of individuals into vehicles
34

Algorithms (cont.)
• Algorithms developed consist of three stages:
1. Cost matrix formation
2. Tree formation
• Construct Hierarchical spanning trees, rooted at the depot, from the cost matrix to structure the search of feasible ride matches.
3. Tree traversal
• Implement enumerated tree traversal algorithm to pack the feasible nodes in the tree into cars
35

Algorithms (cont.)
• Two heuristics are developed
– Proximity cluster tree (PCT)
• Idea: Groups students spatially based on the proximity of their residences to each other
– Minimum deviation tree (MDT)
• Idea: Groups students spatially based on minimum deviations (i.e. students on the way)
36

Algorithms (cont.): Tree Formation
• Proximity cluster tree (PCT)
– Each node (i) is linked to its parent node (j), where (j) is the closest to (i) and is closer to the depot than (i)
• Minimum deviation tree (MDT)
– Each node (i) is linked to its parent node (j), where (j) has the least route deviation for (i), and is closer to the depot than (i).
37

PCT and MDT Examples
38

Simulation Results for AUBSample
• Sample considered for simulation:
– 2788 students who live in Greater Beirut and commute by motorized modes
39

Simulation Results for AUB (cont.)Temporal Partitioning (One-Way)
• Hourly distribution of start/end of classes (of 2393 students who come on a Monday)
• Each hourly group of students is solved separately
– E.g. consider next the 8 AM group of students – potential SRT users: 574
40

Simulation Results for AUB (cont.)Number of Required Cars (MDT)
• Higher fare Lower demand fewer cars needed
• Higher maximum deviation fewer cars needed and lower demand
41
168151
134
5042 38
0
20
40
60
80
100
120
140
160
180
20% 30% 40%
Nu
mb
er
of
Re
qu
ire
d C
ars
Maximum Deviation
Number of Required Cars vs. Maximum Deviation (Car Cap.=3)
Fare = 30% Fare = 50%
- Fare is computed as a fraction of the Private Taxi fare.

Simulation Results for AUB (cont.)Average Car Occupancy
• Average car occupancy increases with car capacity.
42
ST fare is taken as 40% of private taxi fare.

Computational Efficiency
• Small problems (24 nodes):
– MDT/PCT: Less than 5 seconds
– CPLEX: 20-60 minutes
• Large problems (~600 students):
– MDT/PCT: Tree Derivation < 50 sec., Tree Traversal < 30 sec./scenario
43

Viability for Operators
44

Viability for Operators
• Two options may be considered:
– Option 1: Commissioning the SRT service to one or more existing private taxi companies
– Option 2: Commissioning the SRT service to a new and exclusive operator for AUB
• Testing several scenarios of maximum deviation and fare:
– Option 2 was always infeasible (large investment cost in vehicles, many of which remain idle in off-peak hours)
– Option 1 was feasible for fares exceeding 30% of private taxi fares and car capacities equal to 4
45

Options for Increasing the Viability for Operators
• Reducing vehicle fleet size by commissioning extra demand to private taxi operators
• Denying requests matching fewer than 3 passengers in the peak hours
• Imposing a higher acceptable deviation during peak hours to achieve full packing of the vehicles
• Increasing the vehicle capacity (at least during peak periods) using a heterogeneous fleet of cars and vans 46

Institutional Support
47

Institutional Context
• Institutional support is crucial for enhancing the viability of the SRT through:
– Increasing awareness
– Providing supporting policies (e.g. policies regarding parking subsidies)
– Financial subsidy
48

Effect of Subsidy on Demand
• Using the estimated demand models, 2 levels of subsidy were tested for AUB:
– 750 LL (0.5$)
– 1,500 LL (1$)
per one-way trip for a Basic service
• Subsidy increases demand by 5-20% 49
Al-Ayyash, 2015
44%
49% 53%
38%
49%
60%
0%
10%
20%
30%
40%
50%
60%
70%
Basic 750L.L. 1500L.L.
Pe
rcen
tage
of
Stu
den
ts W
illin
g to
Sh
ift
to S
RT
Private Car Public Transport
% Shifting to SRT versus Two Levels of Subsidy
on Basic Scenario

Financial Burden of Subsidy
• When a 1$ per one-way trip is offered:
– The total monthly subsidy granted to every student is 24,000 LL ($16) – assuming three round trips to AUB per week
– The annual subsidy burden would be approximately $290,000 (for around 1800 switching students).
50

Conclusion
51

SRT Impacts
• Students:
– Cost savings for current car users and time savings for current PT users
– Reduced parking needs and auto ownership (long term)
• Community:
– Less congestion in the neighborhood by reducing auto dependency and vehicle miles traveled
– Reduction in noise and air pollution
• Institution:
– Reduced need for parking expansion
– Supporting sustainable transport solutions52

SRT Impacts (cont.)
• Reduction in peak hour trips and parking spaces:
– Reduction in peak hour trips represents around 5-13% of the peak hour traffic volume on a busy street bordering the university
– Reduction in parking demand is about 11-27% of AUB’s demand
53
FarePeak Hour Trip
ReductionMid-day Parking
Reduction
30% 166 800
40% 123 592
50% 70 336

Important Factors for SRT Success
• Market studies
• Proper costing and incentives
– E.g. Enoch et al. (2006) state that “DRT projects are often not realistically costed or designed with a full understanding of the market they are to serve”.
• Technology-based systems
• Phased operation
• Cooperation of different stakeholders54

Research Contribution
• Comprehensive framework for organization-based SRT evaluation
• Development of computationally efficient routing heuristics for organization-based SRT:
– unit demand, asymmetric network, narrow time windows at departure, common arrival time at destination, etc.
• Demand models for organization-based SRT, including qualitative attributes and attitudes
• Methodology can be used by other universities or institutions considering SRT
55

Extensions
• Feedback between demand and service design
• Testing other well-known VRP heuristics in the literature
• Service design and simulation for multiple institutions (many-to-many vehicle routing problem)
56

References
• Al-Ayyash, Z., Abou-Zeid, M., and Kaysi, I. (2016) “Modeling the demand for a shared-ride taxi service: An application to an organization-based context”, Transport Policy, Vol. 48, pp. 69-182.
• Al-Ayyash, Z. (2015) Modeling the Demand for a Shared-Ride Taxi Service: An Application to an Organization-based Context. Master’s thesis, American University of Beirut.
• Al-Naghi, H. (2014) Evaluation Framework for Organization-based Ridesharing: Service Design Considerations and Potential for AUB. PhD dissertation, American University of Beirut.
• Amey, A., Attanucci, J., and Mishalani, R. (2011) “Real time ridesharing: Opportunities and challenges in using mobile phone technology to improve rideshare services”, Transportation Research Board Transit 2011, Vol. 2, pp. 103-110.
• Aoun, A., Abou-Zeid, M., Kaysi, I., and Myntti, C. (2013) “Reducing parking demand and traffic congestion at the American University of Beirut”, Transport Policy, Vol. 25, pp. 52-60.
• Ben-Akiva, M., Benjamin, J., Lauprete, G., and Polydoropoulou, A. (1996) “Impact of advanced public transportation systems on travel by dial-a-ride”, Transportation Research Record: Journal of the Transportation Research Board, No. 1557, pp. 72-79.
57

References (cont.)
• Benjamin, J., Kurauchi, S., Morikawa, T., Polydoropoulou, A., Sasaki, K., and Ben-Akiva, M. (1998) “Forecasting paratransit ridership using discrete choice models with explicit consideration of availability”, Transportation Research Record: Journal of the Transportation Research Board, No. 1618, pp. 60-65.
• Chan, N. and Shaheen, S. (2012) “Ridesharing in North America: past, present, and future”, Transport Reviews, Vol. 32, No. 1, pp. 93-112.
• Deakin, E., Frick, K. T., and Shively, K. M. (2010) “Markets for dynamic ridesharing: the case of Berkeley”, Transportation Research Record: Journal of the Transportation Research Board, No. 2187, pp. 131-137.
• Enoch, M., Potter, S., Parkhurst, G., and Smith, M. (2006),“Why do demand responsive transport systems fail?” Paper presented at the 85th Annual Meeting of the Transportation Research Board, Washington, D.C.
• Kassab, M. (2011) AUB Neighborhood Congestion Study: Scenarios to Improve Traffic Flow. Master’s thesis, American University of Beirut.
• Takeuchi, R., Okura, I., Nakamura, F., and Hiraishi, H. (2003) “Feasibility study on demand responsive transport systems (DRTS)”, Proceedings of the 5th Eastern Asia Society for Transportation Studies Conference, 5, pp. 388-397, Tokyo, Japan.
58