Organising for entitlement - gov.uk · Working paper Organising for entitlement A randomised...
50
Working paper Organising for entitlement A randomised evaluation of a homestead land rights initiative in Bihar, India Andre Nickow Sanjay Kumar December 2018 When citing this paper, please use the title and the following reference number: S-89440-INB-1
Transcript of Organising for entitlement - gov.uk · Working paper Organising for entitlement A randomised...

Working paper
Organising for entitlement
A randomised evaluation of a homestead land rights initiative in Bihar, India
Andre Nickow Sanjay Kumar
December 2018 When citing this paper, please use the title and the followingreference number:S-89440-INB-1

Organizing for Entitlement: A Randomized Evaluationof a Homestead Land Rights Initiative in Bihar, India
Andre Nickow1 and Sanjay Kumar2
1Northwestern University Global Poverty Research Lab2Deshkal Society
December 5, 2018
Abstract
Bihar state law guarantees each rural household the right to hold title over a plot of
homestead land, yet many poor households lack title. This article studies a social ac-
countability program that established, trained, and mobilized village-level community-
based organizations to assist Scheduled Caste households in obtaining homestead title.
The study employs a mixed methods design in which a survey-based field experiment
estimates the impact of the program on outcomes of interest while analysis of data from
qualitative fieldwork documents ground-level processes. We find that the program had
strong effects on perceived land security and access to government entitlements and
moderate effects on asset ownership and homestead satisfaction. However, we do not
find evidence for impacts on investment or food security. The qualitative analysis sug-
gests that a key mechanism by which the program improved entitlement access was
enabling target households to circumvent profit-seeking intermediaries. Results con-
tribute to development studies research on social accountability, government service
delivery, and land rights.
Keywords: Impact evaluation; land rights; social protection; governance; India; mixed
methods
1

1 Introduction
Many governments guarantee their citizens rights and resources aimed at helping to
ensure minimum living standards. These guarantees of social protection—referred to here as
entitlements—figure centrally in efforts to reduce poverty and increase prosperity through
the provision of food, shelter, and other basic necessities. Yet, often, those most in need
of entitlements reside in settings where state capacity to deliver services is weak. Resource
scarcity, corruption, and elite capture, among other governance ills, routinely disrupt the flow
of entitlements and render even apparently well-designed programs and policies ineffective.
In attempting to improve entitlement delivery, development practitioners have increasingly
turned to strategies that include social accountability, “the ongoing engagement of collective
actors in civil society to hold the state to account for failures [in the delivery of entitlements]”
(Joshi & Houtzager, 2012, p. 150). Social accountability strategies now figure prominently
in the portfolios of bilateral donors, philanthropic foundations, and grassroots movements
alike. But existing intervention models have shown mixed results when put into practice
thus far, and it is far from clear whether and when investments in such programs are likely
to pay off. How and under what circumstances can social accountability strategies improve
entitlement delivery?
The present study contributes to policy debates surrounding this question through a
mixed methods randomized evaluation of a social accountability intervention in Bihar known
as “Homestead Land Rights in Villages of Gaya District” (referred to henceforth as “the
Homestead Program”). Bihar state law guarantees poor, rural, and otherwise landless house-
holds a potentially critical entitlement: the right to hold title to a small plot of homestead
land. The term homestead, as used in Indian land-related policy discourse, refers to the
land on which a household’s dwelling is located. In most cases, state law provides for the
issuance of title to the land on which the household already lives. Where households live on
land that is not eligible for homestead title, legislation commits the state to providing a new
homestead plot. Yet, despite these legal provisions, many poor households in rural Bihar
2

remain without title.
The Homestead Program promotes land titling among target communities through a
strategy that centers on the formation, training, and mobilization of village-level community-
based organizations (CBOs) consisting of about 20 members each. These CBOs provide
village households with information about homestead land rights and assist them in applying
for title. CBO members also maintain contact with local government officials and mobilize
community pressure toward holding officials accountable for delivering title. The program’s
emphasis on institutionalizing higher expectations about service delivery, and knowledge
of civic and political tools with which to insist that local government officials meet these
expectations, sets it apart from the majority of social accountability programs that have
been rigorously been evaluated to date.
This paper addresses two main research questions. First, what is the impact of the
Homestead Program on perceived land security, investment in dwellings and homestead-
based income-generating activities, access to government entitlements, and livelihood and
well-being? Second, what are the processes by which the program exerts impact, or is
blocked from doing so? To address these questions, We rely on a mixed methods research
design structured around a randomized controlled trial (RCT). Survey data obtained from
a sample of 1,693 households across 144 villages is used to estimate the causal effects of the
program. A qualitative process evaluation draws on semi-structured interviews and focus
group discussions with members of target SC households and CBOs, government officials,
elite village residents, program field staff, and other stakeholders to document ground-level
processes surrounding the treatment. The qualitative analysis was used to sharpen the quan-
titative instruments and hypotheses in advance of endline data collection, to contextualize
the study within the local political economy, and especially to provide insights in interpreting
the results.
We find that the program exerted strong effects on perceived land security and access
to government entitlements, along with small to moderate effects on asset ownership and
3

homestead satisfaction. However, we do not find evidence for impacts on investment or food
security. The qualitative analysis suggests that investments in dwellings and homestead-
based livelihood were constrained by lack of cash and lack of space, respectively. The qual-
itative analysis also helped to highlight an initially unanticipated mechanism of impact in
which CBOs provided households with the technical and social resources they needed to cir-
cumvent profit-seeking intermediaries when accessing entitlements. This contrasts with the
more commonly cited mechanism by which potential program beneficiaries place pressure on
government officials.
The study constitutes the first randomized evaluation of a civic-led rural homestead
rights program. Random assignment circumvents many of the thorny causal identification
challenges that have constrained the literature thus far. Furthermore, the detailed evidence
on ground-level processes and local context obtained from the qualitative analysis provides
leverage for understanding the causal chain leading from program to impact. This will in turn
facilitate the development of empirically-grounded hypotheses about the circumstances under
which the model is likely to work more or less effectively, as well as potential improvements to
the model. Findings contribute to literature on social accountability by testing a community
organization-based model that could hold promise for a wide range of entitlement areas, and
by exploring the potential effectiveness of social accountability in a sector where it has not
previously been experimentally tested. And it contributes to literature on land rights by
testing the extent to which community mobilization surrounding titling—a key ingredient in
at least several of the most successful cases of land reform in the past—can be engendered by
a short-term development program operating on a conventional, donor-based funding cycle.
Furthermore, this study is among the first rigorous impact evaluations of a rural land rights
initiative focusing on residential rather than agricultural land. This is an important gap
to fill since the poorest social classes in Bihar and many other parts of the world are rural
laborers who do not own any agricultural land to invest in.
In the following section, we situate this evaluation within the broader literatures on
4

entitlements, social accountability, and land rights. We then explain the program and its
logic in the third section, before outlining the study’s research design in the fourth. The fifth
section presents the qualitative analysis, the sixth presents the quantitative impact analysis,
and the seventh concludes.
2 Social Accountability, Entitlements, and Land
Rights
This study builds on two main bodies of literature: first, research exploring whether, how,
and under what circumstances social accountability programs can improve the provision of
entitlements and, second, debates surrounding land security for vulnerable populations. The
present section reviews each literature in turn.
Governments seeking to reduce poverty and promote equitable growth often enact legis-
lation that promises citizens entitlements aimed at improving living standards, for example
to provide subsidized food, basic health services, and assistance with housing. Yet, the
development field has increasingly come to grapple with pervasive barriers to effective im-
plementation, in large part because governments’ capacities to effectively deliver services
tend to be weakest where entitlements are most needed. If resource constraints represented
the only significant barrier to entitlement delivery, then these problems could perhaps be
solved with well-targeted money transfers and technical assistance. But development schol-
ars broadly agree that political economy complexes like corruption, clientelism, and elite
capture also matter critically (Gans-Morse et al., 2018; Olken & Pande, 2012; Bardhan &
Mookherjee, 2000).
Development practitioners seeking to overcome capability traps in entitlement provision
have become increasingly interested in bottom-up initiatives that attempt to mobilize po-
tential beneficiaries to demand better service delivery. Potential beneficiaries have a strong
stake in seeing entitlements effectively delivered. If provided with the right information,
5

coordination assistance, and other tools, potential beneficiaries could pressure government
officials and others involved in the entitlement delivery process to more effectively fulfill state
promises (Yanez-Pagans & Machicado-Salas, 2014). Programs stemming from this general
logic have emerged under a handful of overlapping rubrics, including “citizen engagement”
(Khemani et al., 2015), “transparency and accountability initiatives” (Gaventa & Barrett,
2012; Joshi, 2013), and “participatory development” (Heller & Rao, 2015; Mansuri & Rao,
2012).
Issues explored in the present study are closely linked to those debated under the above
rubrics. However, much of this work is concerned with the policy enactment process, whereas
the present study focuses on the policy implementation process and thus fits especially with
the “social accountability” construct (Fox, 2015; Grandvoinnet, Aslam, & Raha, 2015).
While some studies define the term social accountability broadly in a way that makes it
roughly synonymous with citizen engagement, we use the term here in its narrower sense to
refer to the mobilization of citizen action toward “ensuring the implementation of existing
state obligations” (Joshi & Houtzager, 2012, p. 151). Focusing on the implementation of
existing schemes may, in many contexts, prove more feasible than enacting new ones and
then still having to implement those.
The Indian government faces significant challenges in implementing the entitlements that
it has already legislated. A case in point is the Mahatma Gandhi National Rural Employ-
ment Guarantee Scheme (MGNREGS), a monumental public employment program that
guarantees all rural citizens the right to 100 days of labor at the statutory minimum wage.
While Bihar could stand to benefit from MGNREGS perhaps more than any other state,
implementation failures have dramatically constrained utilization and impact (A. Banerjee,
Duflo, Imbert, Mathew, & Pande, 2016). Dutta, Murgai, Ravallion, and Van de Walle (2014)
estimate that MGNREGS in Bihar, if fully implemented, could reduce poverty by as much as
14 percentage points. But, because of implementation breakdowns, the program has reduced
poverty within the state by only a single percentage point (p. 16).
6
Can social accountability initiatives contribute toward alleviating such administrative
quagmires to spur more effective implementation? A recurring refrain within the empirical
research is that “information is not enough” (Fox, 2015, p. 348). In other words, mobilization
of civic effort beyond information campaigns may be necessary to make social accountability
effective (Dutta, Murgai, Ravallion, & Van de Walle, 2012; Lieberman, Posner, & Tsai,
2014). But successful cases of civic effort often involve deeply rooted legacies of engagement
arising from unique historical circumstances that cannot easily be replicated, as in Kerala in
India and Porto Alegre in Brazil (Evans, 2004; Baiocchi, Heller, & Silva, 2008). Attempts
by development agencies to “induce” participation through externally-driven projects often
fail to generate a detectable impact (Mansuri & Rao, 2012; Rao, Ananthpur, & Malik,
2017). On the other hand, where such mobilization-oriented social accountability initiatives
can succeed, their impacts may have transformative potential (Kabeer & Sulaiman, 2015).
Perhaps the most widespread alternative to models based on information alone has been
citizenship training programs. Three recent randomized evaluations, among a slew of other
studies, show some evidence of promise for these approaches but mixed and inconclusive
evidence overall (Sheely, 2015; Protik, Nichols-Barrer, Berman, & Sloan, 2018; Rao et al.,
2017).
While sharing common features with both the information and citizenship training mod-
els of social accountability, the intervention model of the program evaluated in this paper
differs in that both substantive knowledge about entitlements and procedural civic and po-
litical skills are imparted to a newly formed organization of 20 individuals in a single village.
The model is explained in depth below, but it is worth noting here that the model lever-
ages two dynamics hypothesized by two longstanding sociological theories to be effective
in mobilization. First, organizational institutionalists have argued that imbuing a specific
set of individuals with the responsibility to promote a praiseworthy cause is generally more
effective than either scorecards or training (Kalev, Dobbin, & Kelly, 2006), which roughly
map onto the information and citizneship trainng approaches to social accountability re-
7

spectively. And, second, social movement theorists contend that close social ties enabling
tight coordination are among the few resources that marginalized social groups have access
to, and so strengthening these ties through repeated small-group interaction can facilitate
powerful pressure on elites (Piven & Cloward, 2012).
One sector in which social accountability has yet to be rigorously tested is that of land
rights. This is surpising given that in most areas of the developing world, the nature of a
household’s access to and control over land heavily influences that household’s life prospects.
In India, extreme land inequalities have persisted over centuries, constraining development
(A. Banerjee & Iyer, 2005). Following independence, Indian state governments enacted land
reform legislation aimed at ameliorating these inequalities. But implementation of the re-
forms was partial and sporadic at best (Appu et al., 1997; Besley & Burgess, 2000; Deininger,
Jin, & Nagarajan, 2007), underscoring the need for attention to policy implementation be-
yond enactment.
Donors and development organizations have increasingly emphasized property rights over
plots of land too small to provide complete livelihood but potentially large enough to en-
able supplementary income-generating activities, sometimes known as “microplots” (Santos,
Fletschner, Savath, & Peterman, 2014). This relatively mild variety of land reform is thought
to be less likely to stir up the immense elite opposition that has contributed to blocking land
reform. And, although it is not expected to dramatically restructure the agrarian economy,
the provision of secure homestead rights could still substantially improve living standards at
the margins (Hanstad, Brown, & Prosterman, 2002). Benefits from improved residential land
rights have been documented in urban contexts (Field, 2007), but have yet to be thoroughly
researched in rural areas. While studies on rural land certification have abounded, existing
evaluations focus on agricultural rather than residential land.
Despite the potential benefits held by homestead and microplot strategies, they have
rarely been subjected to rigorous evaluation. Santos et al. (2014) contribute a recent ex-
ception, a quasi-experimental study of a microplot initiative in West Bengal. The study
8

finds significant effects on intermediate outcomes expected to lead to greater food security,
including subjective land security, investment, and women’s involvement in decision-making.
However, only a relatively small minority of households granted title over a microplot ac-
tually ended up moving to the new microplots they had been provided. This raises two
issues pertinent to the study at hand: first, the question of whether certification of land on
which households already live (as in the Homestead Program) can be helpful; and, second, if
stronger bottom-up channels of citizen feedback would improve results. Historical evidence
from West Bengal suggests that land reform efforts during the late 1970s and 1980s succeeded
in part by simultaneously involving top-down efforts from the state to organize an enabling
environment for land registration, and bottom-up civic mobilization aimed at ensuring that
the process was carried out equitably (Bandyopadhyay, 2003; A. V. Banerjee, Gertler, &
Ghatak, 2002). The situation was similar in Kerala during the 1960s, which was perhaps the
only other significant episode of land reform in India widely considered successful (Herring,
1983). But, as in the case of social mobility initiatives discussed above, research has yet to
demonstrate the extent to which mobilization can be productively cultivated at all, much
less through relatively brief development programs operating on donor-funded budget cycles.
3 The Homestead Program and its Context
3.1 Homestead Land Rights in Bihar
Under Bihar state law, all landless households are guaranteed provision of title protecting
their right to remain on a plot of homestead land. For most untitled households, this means
obtaining title for the land on which they already live. In the minority of cases in which
households live on land that is not eligible for settlement (for example, when the household
lives on common-use land that other households need to access), then law obligates the
government to grant the household a new homestead plot with land purchased from the
market or vested in the state through some other means.
9

Yet despite the legal assurance of homestead title for all, many poor households remain
untitled. The problem is particularly acute among Bihar’s Scheduled Caste (SC) population,
the poorest and most marginalized of the state’s major social groups. Untitled households
typically live either on government land, or on private land owned by individuals to whom
household members provide or have previously provided agricultural labor.
The Homestead Program was designed in 2006 by Deshkal Society, a Delhi-based devel-
opment Civil Society Organization (CSO). It operates in Gaya, the district of Bihar with the
state’s highest SC population share. The program spread across four blocks of Gaya over
its first decade. The present study evaluates an expansion of the project to four new blocks
that occurred beginning in the summer of 2016, with impact estimates based on a survey
conducted during the summer of 2018.
3.2 Program Motivation
Lack of homestead land rights may constrain the wellbeing of households within the
study population in several interrelated ways. Most directly, households are likely to suffer a
devastating loss of assets in case of dispossession, i.e., the forcing of a household to leave its
homestead land without compensation. Dispossession can occur because of a formal order
from the government, or can arise from pressure exerted by local elites with an interest in
the land. But even where the actual risk of dispossession is low, perceptions of insecurity can
be highly salient. These perceptions can in turn lead to negative consequences independent
of actual dispossession.
For instance, perceived homestead insecurity may disincentivize investment in the house-
hold’s physical dwelling structure, or in livelihood activities carried out on the homestead
land. A household may be reluctant to invest in repairs or improvements if members make
investment decisions against this backdrop. Relatedly, homestead insecurity may dissuade
households from investing in a homestead-based garden, or in purchasing animals and in-
vesting in the resources necessary to sustain them. Additionally, lack of formal rights may
10

inhibit households’ access to certain government entitlement schemes. In some cases, titles
are required for eligibility. Even where titles are not required, homestead insecurity may
give households a sense of precarity and exclusion that could discourage them from claim-
ing entitlements and demanding adequate service provision. Incentivizing investments in
the dwelling and homestead-based livelihood activities, as well as in claiming government
entitlements, could increase overall livelihood and prosperity.
Given that all rural households are legally guaranteed a homestead title, and that home-
stead titling could potentially be beneficial for households in the ways discussed above, why
do so many households remain untitled? Three likely barriers emerged as plausible from key
informant interviews and a review of program documents and secondary literature conducted
before the onset of the evaluation.
First, there may be a lack of information on homestead titling rights. Without targeted
outreach efforts, SC households may have no way of knowing that they have the right to
hold a homestead title. Second, even if households were aware of their right to title, they
might lack the capability to apply for it. Title applications in Bihar require filling out long
and complex forms, which may be daunting for target households given widespread illiteracy
among SC communities in the region. The process also requires endorsement by officials at
multiple level of government. Many of the relevant government officials travel frequently, and
lack a fixed address or contact number. Moreover, the relevant government official for a given
endorsement may not even exist, given widespread understaffing of Bihar’s administrative
services and delays in replacing officials who retire or resign from their posts.
Third, even when an application does reach the relevant government official, the official
may lack incentives to fairly and efficiently process the application. S/he may be overworked,
under tight time constraints, and may prioritize work to benefit more influential citizens.
Risk-averse officials may pass applications off to different offices or simply hold onto them,
which could result in lengthy delays. And officials may demand bribes that households
cannot afford in return for processing the applications. By some accounts, local elites with
11

interests in the land in question have even been known to bribe government officials not to
grant title. The Homestead Program was designed with each of these barriers in mind.
3.3 Program Model and Theory of Change
The primary aim of the Homestead Program is to help form and then train village
CBOs. These in turn are expected to help residents obtain title, and to work to protect
their land rights and other social entitlements broadly. The program was envisioned by its
leadership as follows: “Field organizers”—typically local social workers hired and trained
by Deshkal Society—visit program villages and request community meetings within these
villages’ SC communities. During the meetings, the field organizers explain the nature and
potential benefits of homestead land title. The field organizers then help to form CBOs in
villages where at least 20 or so residents express interest in joining, and provide procedural
recommendations for running them. Field organizers encourage balancing membership across
gender and other relevant social segments within the village’s SC community.
In particular, field organizers train CBO members on internal organizational operating
procedures, the homestead titling process, and strategies for holding government officials
accountable for entitlements more broadly. Each CBO elects a President and a Secretary
with divided responsibilities and checks on one another’s authority. Members are trained
on consensus-building, democratic decision-making, and transparent record-keeping. Once
up and running, CBOs identify untitled SC households within their communities and help
to complete the applications of those interested in seeking title. When a set of applications
has been prepared, the CBO delivers the forms to the appropriate local government office.
The CBO then follows up as needed until the applications have been fully processed and,
if necessary, mobilizes community members in pressuring government officials to process
the applications efficiently and fairly. For example, they may organize group trips to local
government offices because of the expectation that a large group of organized petitioners
will exert more pressure than a single individual. Additionally, field managers coach CBO
12

members on what to say when visiting a government office, and how to enter a Right to
Information filing. Although homestead titling constitutes the program’s central focus, the
civic and political skills included in the training are intended to be applicable to other social
protection entitlements as well, and field managers are encouraged to inform CBO members
about any entitlement they believe would be useful.
The program theory stipulates the following causal chain. CBO formation and training
spur an increase in applications for title, and mobilize the community around homestead land
rights and other entitlement-related issues. The increase in title applications, in conjunction
with community mobilization on behalf of fair and timely processing of those applications,
leads to an increase in homestead titling among SC residents. Holding title—along with the
CBO-led mobilization–is then expected to yield increases in homestead security, investments
in the physical dwelling and homestead-based livelihood activities, access to government
entitlements, and overall well-being. Figure 1 depicts this theory of change. Additional
details on mechanisms and assumptions underlying each step of the theory are included in
the qualitative data analysis section below.
4 Research Questions and Design
This study asks, what is the impact of the Homestead Program on perceived land security,
investment, access to government entitlements and livelihood? And what are the processes
by which the program exerts impact, or is blocked from doing so? Addressing these questions
requires employing a mix of quantitative and qualitative methods. We test program impacts
through an RCT, and complement this RCT with an analysis of data drawn from qualitative
fieldwork to address issues of process (Patton, 2014; Rossi, Lipsey, & Freeman, 2003). In
the remainder of this section, we first outline the study’s RCT structure and then provide
an overview of the qualitative research components.
13
4.1 Experimental Design
The timeline for the program and study are presented in Figure 2. Deshkal Society
had planned to implement the Homestead Program in around 72 villages, and there are
hundreds of villages within the program blocks. To facilitate randomization, Deshkal Society
selected 144 villages that it would have been roughly equally likely to expand into had
there been no evaluation, twice the villages for which sufficient funding was available for
implementation. This then allowed for randomization into a treatment group and a control
group, each consisting of 72 villages.
12 households in each of the 144 study villages were selected for inclusion in the RCT
from a sampling frame made up of rosters of untitled SC households within each village,
yielding a sample size of 1,728 households. A baseline survey was administered to all house-
holds beginning in spring 2016, after which villages were randomized by the researcher into
treatment and control groups. Deshkal Society introduced the program within each of the
treatment villages in the weeks following the randomization.
Assignment to treatment was randomized at the village rather than at the household
level despite the accompanying sacrifice in statistical power because the program logic works
at the village level. CBOs are formed to represent SC communities within villages. And a
key reason that the program is expected to run efficiently is that CBOs can draw on village
networks to maximize their impact. Randomization at the village level also reduces potential
spillover effects that could bias the estimates.
Randomization was stratified across two dimensions (as depicted in Figure 3). First,
villages were stratified according to their block of residence. Each block has an administrative
office with its own staff of officials. Because homestead applications must be reviewed by
officials working in block offices, stratifying by block should allow for more precise impact
estimates. The full village sample was drawn evenly from across four blocks, with 36 villages
drawn from each block.
Within blocks, treatment was also stratified across SC status of the mukhiya representing
14

the village, i.e., whether the mukhiya belonged to an SC community. Villages in rural India
agglomerate into administrative units called gram panchayats (GPs). Each GP consists of a
set of several adjacent villages that elects a common council of representatives. The mukhiya
is the head of this council. Because demographic and sociopolitical patterns make it difficult
for SC individuals to successfully contest open mukhiya elections, the Indian government
reserves some mukhiya seats for SC contestants on a rotating basis. The mukhiya plays an
important role in processing certain types of homestead title applications, and may influence
local socioeconomic and political conditions more broadly. Stratification by the SC status of
the mukhiya was thus, like block stratification, expected to increase precision in the impact
estimates.
4.2 Qualitative Design
While the RCT component of the research design estimates the Homestead Program’s
causal effects, the qualitative components seek to provide evidence for interpreting the quan-
titative results and explaining the mechanisms underlying them, in addition to yielding in-
sights of their own. A growing consensus within the field of evaluation methodology holds
that “theory-based evaluations” capable of providing actionable policy insights often necessi-
tate the use of qualitative as well as quantitative methods (White, 2009, 2013). Even strong
proponents of RCTs have come to acknowledge that some minimum level of qualitative re-
search engagement is essential for full-scale impact evaluations (Glennerster & Takavarasha,
2013). If a field experiment comes up with null findings in the absence of qualitative field-
work, there may be no way of knowing the extent to which these null results stem from
a failure of program implementation, versus arising from flaws in the program’s theory of
change (Bamberger, Rao, & Woolcock, 2010; White, 2013). Furthermore, qualitative meth-
ods can provide important leverage for understanding why impact did or did not arise, even
assuming full implementation of the program in question. Understanding the mechanisms
by which a program leads to impact or fails to do so constitutes a vital step in delineating
15

empirically-grounded policy insights about the contexts in which the program is or is not
likely to work (Woolcock, 2013), or about the probable effects of adjusting particular aspects
of the program.
Collecting qualitative data of sufficient detail to address this study’s research questions
would not have been feasible to carry out in more than a handful of villages. We thus selected
six qualitative focus villages for in-depth qualitative data collection. Choosing six villages
allowed for analysis across key dimensions of variation, but six remained a small enough
sample to make sufficiently detailed analysis feasible. Villages were selected to vary across
the two strata-defining dimensions, i.e., block and mukhiya’s SC status for two interrelated
reasons. First, this case selection strategy maximizes diversity along potentially influential
variables, and so if findings hold across these dimensions then they are likely to hold in a
broad range of cases within the program’s target area (Seawright & Gerring, 2008). Second,
the selection along these dimensions allows for comparisons across the different variable
categories to explore whether and how they shape the course of impact (Bennett & Elman,
2006).
5 Context, Process, and Mechanisms of Impact
The Homestead Program’s theory of change includes four interrelated sets of outcomes
through which the program may benefit target households. However, the mechanisms leading
to these outcomes each rest on a set of assumptions that must hold in order for them to remain
plausible. This section draws on qualitative data and quantitative descriptive statistics from
the study’s baseline survey to test whether and how these assumptions hold.
5.1 Qualitative Data Collection
The qualitative data collection took place primarily during September - October 2016
and April - July 2017. It consisted of semi-structured interviews and focus group discussions
16

(FGDs) in each of the six qualitative focus villages (which were audio-recorded, transcribed,
and translated). 32 semi-structured interviews were conducted for the study’s village-based
fieldwork component, six in each focus village: two with CBO members, two with represen-
tatives of untitled SC households (i.e., the program’s target population), one with a repre-
sentative of a relatively wealthy and/or high-status non-SC household (we refer to these as
elite households), and one with the mukhiya responsible for the qualitative focus village in
question. In each of the two control group qualitative focus villages, four interviews were
conducted—the same setup as for treatment villages but without the two CBO respondents,
since control villages are not expected to have a CBO.
Including respondents from each of these categories allows for an analysis of the program
and its context from a variety of perspectives, increasing the chances that the resulting data
will capture relevant nuances in the ground-level situation that might otherwise be missed.
CBO members are likely to have detailed information about the workings of the program
and the land situation within the village as a whole. But they might also be expected
to exhibit a higher level of concern with land-related issues than non-members which, left
unchecked, could bias the results. Conversely, untitled SC households who are not CBO
members represent the program’s target population, making their knowledge and perceptions
critical to the study. But they may lack detailed knowledge of the homestead situation
faced by others or the work of the CBO throughout the village. We chose additionally to
include an elite interview within each village to capture the perspective of respondents who
would not necessarily stand to gain, and might even stand to lose, from homestead titling
for SC households within their village. It was also important to capture the perspective
of the mukhiya responsible for the village, since mukhiyas are centrally involved in many
development activities at the village level in Bihar.
The inclusion of multiple distinct perspectives served two main functions. First, it
brought a much more diverse range of material into the analysis than could have been
gleaned from interviewing respondents of only one or two types. Second, including multiple
17

categories allowed me to triangulate responses when interpreting the data. Accounts backed
up by respondents from across different categories are likely to be relatively reliable, whereas
cases around which opinions diverge invite closer examination and follow-up.
In addition to the semi-structured interviews, the research team conducted a total of 22
FGDs. Specifically, three FGDs were conducted within each of the qualitative sample’s four
treatment villages—one consisting entirely of CBO members, one including only non-member
SC respondents, and one mixed-caste CBO consisting of a combination of non-member SC
respondents and non-SC village residents representing a range of the village’s other castes
and classes. CBO members were not included in this latter category to avoid the potential
bias created by other FGD participants trying not to offend the CBO members. Two FGDs
were conducted in each of the qualitative sample’s two control villages, one SC FGD and
one mixed-caste FGD. Next, the team conducted SC FGDs in four villages that are part of
the broader quantitative sample but not the qualitative focus sample, as a broad check for
generalizability. And, finally, we conducted FGDs with CBO members from two villages in
which the Homestead Program had been implemented in 2013, during a previous round of
the program. These last FGDs were aimed at gleaning insight into how CBOs might evolve
over time. Ten individuals were invited to participate in each FGD.
5.2 Analytical Approach
In the present section, qualitative data along with descriptive statistics from the base-
line household survey is analyzed to test key assumptions associated with each of the four
hypothesized sets of outcomes highlighted in the program’s theory of change. We review
potential mechanisms leading to each set of outcomes and the conditions that its occurrence
would imply, and then search each source of data—the baseline quantitative survey, along
with transcripts from the interviews and FGDs—for relevant evidence. Finally, we consider
the extent to which different sources agree or disagree and what this is likely to mean for
the workings of the program. While more extensive qualitative analysis is presented in a
18

separate paper, this section summarizes the themes most relevant to interpreting the impact
analysis.
5.3 Exploring Potential Impacts and Underlying Assumptions
5.3.1 Tenure Security
The central goal of the Homestead Program was to increase homestead land tenure se-
curity for SC households. The term “tenure security” here refers both to objective security
as defined by the actual probability of dispossession and perceived security, the beliefs and
emotions that household members hold surrounding dispossession. The hypotheses that the
program will improve these two forms of land security depend respectively on the assumptions
that actual dispossession is more or less widespread, and that the threat of dispossession is
salient in the minds of households. Qualitative and baseline quantitative data provide little
support for the former assumption, but substantial support for the latter. Data suggest that
actual cases of households being forced to leave their land within the study area are rare, so
it is unlikely that the intervention will create a significant impact by reducing cases of dis-
possession. However, threats of dispossession remain salient, and the qualitative data reveal
that those evictions that do occur are often associated with factors that may increase in the
coming years, like the building of roads and factories, and rising land values. Furthermore,
a subtler form of dispossession—encroachment—is far more widespread.
First, the study did not turn up evidence of full-scale dispossession as a widespread
phenomenon within the study area. No sample households were forced to leave their land
during the course of the study. 6.4 percent of households reported having been directly told
to leave their land in the quantitative survey, although a much greater share of households
within the qualitative sample recounted stories of having faced such demands in the form of
occasional taunts from other communities within the village, typically coupled with threats
and insults.
Participants from sample households as well as key informants—including government
19

officials—made it clear however that instances of dispossession had been rampant and
widespread until recent years. According to their accounts, landowners had exerted coercive
power over surrounding villages, and would often dispossess SC households if members of
the households demanded higher wages or if the households’ services were no longer needed.
However, although caste and class tensions remained present within many of the study vil-
lages, recent structural shifts have led to a weakening in the power of large landowners. The
following quote captures a recurring theme within respondents’ explanations of their land
rights situation, a tendency to highlight the fact that feudalism is on the decline even while
suggesting a sense of lingering vulnerability:
“Farmers used to threaten us with eviction. But nowadays no one accepts the domi-
nance of anyone. Elder generations were afraid. They did not disobey the sayings of
farmers. But now young people do not accept their sayings. Now we are not dependent
on them. We are alive due to our labor. But farmers know this fact that we do not
possess the legal paper of our homestead land. So they put undue pressure on us for
their work and. . . ”1
While actual evictions associated with the semi-feudal system are no longer rampant in
the study area, mentalities and threats associated with this system have not gone away.
Another theme within household interviews and FGDs referenced in the above quote was
that, when households were threatened, it was typically after members had refused to provide
agricultural labor. This occurred most often during the monsoon season, the part of the
agricultural calendar when labor demand is highest in southern Bihar. In the recent past,
according to respondent reports, there would have been no question of refusing such demands
given both the power of local landlords and the lack of alternative livelihood opportunities.
However, given recent booms in construction, brickmaking, and other forms of wage labor, as
well as ongoing efforts by elected state governments since the 1990s to undercut the power
of the traditional socioeconomic elite, SC households have a wider set of options. This
1CBO president, female, 40 years old
20

weakening has prompted elites to threaten SC residents in an effort to get them to work,
even as they are gradually losing the power to maintain a monopsony over local SC labor
and to credibly threaten eviction.
Furthermore, the same secular growth trends that are undercutting landlord domination
may also be precipitating a different form of dispossession, i.e., claims of eminent domain
to clear the way for infrastructure, industry, and commercial development. Most recent
evictions (as distinct from threats) that participants reported were associated with such
developmental processes and were implemented by government rather than village elites.
For instance, almost all respondents that were interviewed in a particular study village
brought up a recent incident in which around 20 untitled SC households living on the side of
a nearby road had been presented with government eviction notices so that the road could
be expanded. Even this relatively localized event caused a huge stir among hundreds of SC
households in the surrounding villages, many of whom are settled near roads or on other
lands that are potentially vulnerable to government claims for eminent domain.
The threat of dispossession associated with these economic changes is perhaps most
acute in villages closest to commercial centers. The most worried respondents lived in the
qualitative focus village closest to the town of Bodhgaya. A hostel catering to Indian tourists
had recently opened on the outskirts of the village, and some respondents expressed concern
that they would be displaced if more were built. The village’s mukhiya reported the presence
of a growing “land mafia” seeking to profit from rising land values. And several residents of
a different qualitative focus village were distraught by rumors that they would be displaced
by an incoming factory:
“. . . we have not title for this land, so risk of eviction always remains with us. Few
months ago we heard that over there a steel factory is going to be set up. It left us in
dismay. If anything really happens, then where will we go? In this community, 52-54
people have settled [built dwellings on untitled land]. If we lose this land then we will
be destroyed. . . Let us see, what happens. We have done our work but time is not in
21

our control. Time is mighty, all people are helpless before time. . . ”2
While most households are unlikely to be forced from their land, a subtler form of dis-
possession is more pervasive: atikraman, or encroachment. In the present context, the word
is used to refer to instances in which one household claims de facto control of a portion of
another household’s homestead plot. In many instances, respondents would mention atikra-
man casually when explaining their landholdings, as though it were an inevitable, if onerous,
fact of life:
“In total, we had settled two bighas [roughly 0.5 acres] of land. Out of this, a Yadav
strongman had occupied 10 kathas [roughly 0.125 acres] of land. We cannot do anything
against him. Rest of the land has been divided among [the respondent and his three
brothers].”3
In addition to the de facto transfer of land control, village elites may use atikraman
as a form of coercion to discipline SC households that they consider to be overstepping
their bounds. This was demonstrated by an incident that occurred during the study period.
One SC FGD participant from a qualitative control village who was already known as an
ambitious entrepreneur had been attempting to negotiate a sharecropping arrangement with
a local landowner. He had previously been warned against this move. The following day,
a large procession of upper-caste households marched from the center of the village to the
participant’s homestead land, where they planted a saffron flag proclaiming a site for temple
construction in the middle of his yard. If constructed, the temple would block the household’s
cattle pen and disrupt their daily activities. The participant repeatedly complained to local
government officials, who expressed sympathy but insisted there was nothing they could do.
A homestead title may have provided the individual with leverage for protection. While
even in this case the household was not forced off its land, it is likely that such acts of
coercion have far-reaching effects on the mentalities of untitled households in surrounding
2SC respondent, male, 35 years old3SC respondent, male, 37 years old
22

communities who hear about them.
5.3.2 Dwelling and Homestead-Based Livelihood Investments
Tenure security represents an important outcome in and of itself in that prolonged worry
about potentially catastrophic events like dispossession often induces stress and otherwise
harms mental health. But most research and policy discourse on tenure security draws its
motivation primarily from the changes to incentives and economic outcomes that security
is hypothesized to engender. Of these, one prominent proposition that has been widely
examined is that stronger tenure security increases investment. In the present context, if
households perceive a salient risk of homestead dispossession and then perceive a decrease
in that risk, they may be more likely to increase investment in their dwelling structure, or
in homestead-based livelihood activities.
If perceived tenure security strengthens among households but investment does not rise,
this would suggest one of at least two possible alternatives: that households do not consider
investments in these areas to be a priority, or that they would like to invest but face other
constraints instead of or in addition to tenure insecurity. This study’s qualitative data
suggest that households do find upgrading their dwellings to be an urgent priority; that
households reference land insecurity in explaining decisions not to upgrade; but that income
constraints constitute the primary binding constraint on dwelling investment. Insufficient
space and marginal land typically make homestead gardening feasible, regardless of tenure
security. Many study households do keep animals, but space typically constrains animal
husbandry as well, although intensification at the margins seems feasible for some households.
The remainder of this section lays out the qualitative evidence first on dwellings and then
livelihood activities.
In rural Bihar, dwellings are generally categorized into two broad types: kutcha and
pukka. Kutcha houses or huts are made from cheap materials like mud, straw, and scraps of
low-quality wood. The kutcha dwellings within the study area are generally flimsy, in need
23

of frequent repair, and fail to protect their residents from rain and cold. Pukka dwellings are
made from stronger and more expensive materials like bricks, concrete, and higher-quality
wood. Owning a pukka house does not necessarily imply wealth—even poor households are
sometimes able to build or acquire these through savings and/or government programs. And
the quality of pukka houses varies widely. On the other hand, living in a kutcha house in
contemporary Gaya is likely to mean severe poverty. Kutcha dwellings in study villages are
overwhelmingly concentrated in villages’ SC settlements. Dwellings can also be milajula,
meaning constructed from a mix of kutcha and pukka materials.
At baseline, most households within this study’s quantitative sample lived in kutcha (55
percent) and milajula (31 percent) dwellings, with only 14 percent living in pukka houses.
Complaints about problems arising from poor dwelling quality abounded. For instance,
many respondents complained of leaky roofs and frequent flooding:
“There are five rooms in my house, but only one of them is useable. Roofs of the other
four rooms leak. . . Roof of kitchen has been demolished. Ground of these rooms has
deepened. Road water enters in these rooms. They are of no use. These constructed
rooms were allotted to us by government three decades ago when my father-in-law was
alive. We have tried to maintain the roofs but leakages do not stop. . . In all, we have
only one room in which we all, sons, daughters, daughter in law, husband, wife, sleep
together.”4
“Roof of the rooms are unable to protect rain water. It seems that we are living
under the open sky, not in a room. Roof always leaks. Commodities kept in the room
become wet. We cannot sleep in rooms. During rain we do not sleep the whole night
and continuously rearrange our goods to protect them from rain water.”5
Given that households want to upgrade their dwellings, why do they not invest more? Ac-
cording to several SC respondents, there is a widespread perception among elites that if a
4CBO president, female, 42 years old5CBO president, female, 57 years old
24

poor household builds a pukka house, it will never move. While the discussion in the preced-
ing section showed that full-scale dispossession is rare, it is more common for elites to work
towards acquiring desired land through gradual intimidation tactics. Several reports arose
in the qualitative data of elites directly pressuring the households not to upgrade to pukka
dwellings, or to keep upgraded dwellings within a confined space. For example:
“I am facing a problem. We are three brothers. We have divided this land among
ourselves. The house in front is my brother’s. Earlier his was a clay [kutcha] house.
When he started to rebuild his house as pukka then farmer of the land behind said
spare two feet land and then build your house. My brother did not want to spare land.
But due to fear of farmer he built his house as per desire of farmer. Farmer was so
angry and he was asking us in ill manner as if we have grabbed his land. In reality,
we are settled on government land and farmer has also grabbed a major portion of
government land.”6
In another instance, the husband of the mukhiya responsible for one qualitative focus
village reported an incident that had taken place several years previously in which a cluster
of around a dozen kutcha dwellings inhabited by SC households burned down. Local gov-
ernment officials used IAY funds to purchase materials for the households to rebuild their
dwellings, this time in pukka form. However, the respondent reported: “. . . one farmer is
not allowing the construction of their pukka house. [Household members] are living on that
land in a haphazard manner. If these dalits [SC indivdiuals] were in possession of title for
the land, then today they would be living in pukka houses.”7 These comments are partic-
ularly weighty in that they come from a non-SC mukhiya who should have no incentive to
exaggerate the plight of SC households within his community.
While such instances were widespread enough to suggest a potential role for homestead
insecurity in constraining dwelling investment, by far the most common reason given for
not investing more in dwelling structures was a simple lack of money. Even the least costly
6SC respondent, female, 57 years old7Mukhiya (non-SC), male, 52 years old
25

improvements were often out of reach: “We have no income, so how can we arrange for
shutters?”8
We next turn to homestead-based livelihood activities. The Homestead Program’s design-
ers anticipated that stronger perceptions of homestead security might in some circumstances
encourage households to garden as a way of supplementing their food supply and/or income.
However, baseline survey data indicate that a negligible share of the sample (1.3 percent)
engaged in gardening, and qualitative data suggest that gardening is likely to remain con-
strained for reasons that have little to do with land rights. The overwhelming majority of
participants reported living on plots that have sandy soil, are vulnerable to flooding, or are
filled-in ponds. In other cases, there is simply insufficient space.
On the other hand, nearly half of the households in the quantitative sample keep ani-
mals. This estimate is likely to be an understatement since visiting homestead plots during
qualitative fieldwork showed that pigs are among the most commonly kept animals in sample
communities, and these had not been included in the baseline questionnaire. Animals that
did show up on the survey were cows/buffalo (37 percent), goats/sheep (35.48 percent), and
chickens (40.31 percent). Respondents typically cited lack of space as a primary reason for
not keeping animals, or, for those who kept some, their reason for not keeping more. One
respondent reported living on less than a tenth of an acre with a three-generation family of
13 members and a few buffalo.9 Respondents mentioned regularly that keeping more animals
than space allowed resulted in sick children (from living in close proximity with the animals)
and angry neighbors (because of animals grazing on neighbors’ land). Of course, not all
target households have reached capacity, and the qualitative evidence do not rule out the
potential that the increased sense of stability associated with title could encourage increased
investments in animal husbandry at the margins.
8SC respondent, female, 48 years old9SC respondent, female, 55 years old
26
5.3.3 Access to Government Entitlements
The Homestead Program’s theory holds that the program can improve access to govern-
ment entitlements in two ways: through the formation of CBOs, who may help residents to
access entitlements beyond homestead title, and through receipt of homestead title, which
may be required to access certain government services. Qualitative evidence suggests the
potential of the former, but not the latter. This section considers each set of evidence in
turn.
While policy details and administrative protocols have changed over the years, title has
often been at least officially required to obtain access to Indira Awaas Yojana (IAY), an enti-
tlement scheme offering house construction materials, and certain other programs. However,
this does not mean that title substantially affects a household’s access to these entitlements.
The baseline data show that 49 percent of the quantitative sample respondents report having
used IAY, although 98.9 percent of households reported not holding title. How were these
households accessing IAY?
While citizens in rural India are ostensibly expected to access services directly from gov-
ernment officials, this study’s qualitative data suggest that things often work differently
in practice. Instead, intermediaries that maintain networks with local politicians and bu-
reaucrats offer to deliver certain entitlements to households for a fee. These intermediaries
are sometimes referred to in Hindi as bichauliya (middle-man) or, even more commonly,
dalal (broker). There is often an assumption that a portion of the dalal’s fee goes toward
bribing government officials, but the intended recipients are typically excluded from these
transactions and deal only with the dalal.
The dalals that members of the sample interact with typically come from nearby villages
and sometimes even share familial networks with their prospective clients. This can build
bonds of trust and, in many cases, dalals faithfully deliver promised resources to their clients.
However, many households experienced incidents of dalals taking money and then never
returning with the promised goods. Even when dalals do deliver the entitlements promised,
27

recipient households lose out a great deal in the fee that they have to pay to the dalals.
Asked whether the household made use of government services, respondents would list off
various entitlements received and their approximate rupee value. During these exchanges,
respondents would casually mention fees that had gone to dalals (and, in some cases to
mukhiyas, some of whom respondents accused of working as dalals. For instance: “I was
allotted Rs. 50,000 under Indira Aawas Yojana. But out of this amount I had to pay Rs.
10,000 to the mukhiya and Rs. 2,000 to the person who has done paperwork. Besides,
few thousand was grabbed by the broker.”10 When asked more directly about the role that
dalals played in their lives, respondents’ resigned annoyance sometimes turned to anger,
e.g., “There are a lot of cheaters. Brokers and dishonest people cheat SC people in several
ways.”11 Most respondents at baseline felt that, without some sort of an advocate, the choice
was to pay dalals for their services or to not receive the services at all. For example: “I have
not got any help from IAY. Brokers are active in IAY. We keep a distance from brokers, and
so I could not get the benefit of IAY. Brokers give preference to the work of those people
from whom possibility of extracting commission is more.”12
Confidence in the near-ubiquity of this system is increased by the fact that SC and
elite respondents alike described it similarly. For example, according to one elite respon-
dent: “[IAY] is meant to provide houses for [SC households]. But they cannot get the full
amount. . . Middlemen prevail everywhere. . . They obstruct the implementation of govern-
ment schemes at the ground level.”13 These findings highlight the potential importance of
civic organizations like the Homestead Program’s CBOs in helping households bypass dalals
and associated expenses when accessing entitlements.
10SC respondent, male, 52 years old11SC respondent, female, 54 years old12SC respondent, male, 33 years old13Elite resident, male, 46 years old
28

5.3.4 Livelihood and Well-Being
The end goal of the Homestead Program is to improve the livelihood and well-being of SC
households within program villages, e.g., through growth in income and assets, more robust
food security, and greater life satisfaction. Each of the potential impact areas discussed in
this section can help to increase overall well-being in a variety of direct or indirect ways.
Reduced stress from tenure insecurity, as well as improvements in the physical dwelling struc-
ture (e.g., better protecting against moisture and cold) could improve health and produc-
tivity. Increased investments in homestead-based livelihood activities and improved access
to government services could help to increase income, consumption, and assets. Synergies
between mechanisms could exert additional effects. While no separate qualitative analysis
was conducted for this impact area, the broad rationale is stated here since it is tested in
the quantitative impact analysis, to which we turn next.
6 Quantitative Impact Analysis
6.1 Empirical Strategy and Measurement
To estimate impacts of the Homestead Program, we rely on ordinary least squares re-
gressions of the form:
Yhvt = α + β ∗ TREATv + STRATAhv + φ ∗Xh + εhvt (1)
where Yhvt is the outcome of interest for household h in village v at time t (i.e., roughly
two years after the intervention onset for the main impact estimates); β estimates the Home-
stead Program’s impact with TREATv signifying a village-level treatment dummy variable;
STRATAhv is a vector of strata fixed effects; Xh is a vector of household control variables,
including demographic variables and measures of main outcomes at baseline; and ε[hvt] is
the error term for household h in village v at time t. All standard errors are robust and
29

clustered at the village level to account for intra-cluster correlation (Duflo et al., 2008) since
villages constitute the unit of randomization for the experiment.
The study tests a broad range of outcomes and is thus susceptible to identifying false
positives (Anderson, 2008). We deal with this problem in two ways. First, we construct
a series of nine indices to represent the main outcomes of interest, one each for perceived
homestead land security; investment in the dwelling; investment in homestead-based liveli-
hood activities; knowledge of government services; use of government services; free access to
services (without having to rely on rent-seeking intermediaries); assets; food security; and
homestead satisfaction. These indices are used in the study’s main impact estimates. The
survey questions associated with each component are listed in Table 4. Indices are calculated
following Kling, Liebman, and Katz (2007)’s procedure of recoding each component variable
such that higher values correspond with higher scores in the direction of intended impact.
Impact estimates are then standardized and averaged across the index’s components, after
which the resulting scores are themselves standardized (Mueller, Billings, Mogues, Peterman,
& Wineman, 2017; A. Banerjee et al., 2015). These nine indices fit within the four outcome
categories explained above, but are kept separate because they represent conceptually dis-
tinct entities that may differ from one another.
Additionally, we use adjusted q-values obtained using the Benjamin-Hochberg procedure
(Anderson, 2008) rather than conventional p-values for the causal inference tests. For the
main index outcomes, q-values are computed based on the vector of p-values obtained for
the eight indexes. We also present impact estimates for the individual outcomes that make
up the indices, in order to check for suggestive evidence on the mechanism underlying the
impacts. For these regressions, we calculated q-values based on the p-values for treatment
effects on all 48 individual outcome variables. Alternative specifications run first with only
strata fixed effects and demographic variables and second with only strata fixed effects yield
nearly identical results, with no changes in significance among main index outcomes and
only a handful of changes in significance for individual outcomes.
30
Of the original 1,728 sample households, 35 were dropped from the analytical sample
as a result of full attrition or missing data on key questions. Results are robust to several
specifications based on differing outcome assumptions for attrited households.
6.2 Pre-Intervention Balance Test
Before presenting impact results, we review baseline balance tests to establish the level
of pre-intervention equivalence on a wide range of variables. These include demographic
and background variables, as well as nine indices constructed following the same procedures
as used for the endline outcome indexes. Table 1 presents treatment and control group
means for individual variables, and uses regressions with strata fixed effects to test for
differences. Baseline balance tests on demographic variables employ only strata fixed effects,
while baseline balance tests on pre-intervention outcome indices also include demographic
controls. Of the 21 individual variables tested, three—Hindi as the first language, parents
having owned land, and number of rooms in the dwelling—register as statistically significant
at p < 0.05. Meanwhile, Table 2 shows balance tests for the nine index outcomes at baseline.
Here, the government knowledge and food security indices show differences respectively at
p < 0.10 and p < 0.05 in favor of the control group.
Despite the handful of statistically significant differences, these comparisons indicate an
acceptable level of baseline equivalence without evidence of meaningful differences between
the experimental groups. Treatment coefficients are small to the point of being substantively
insignificant, and exhibit no identifiable patterns that would indicate systematic underlying
differences. The variables are furthermore included as controls in the main impact regres-
sions.
6.3 Results
Roughly two years after its onset, the Homestead Program seems to have achieved nearly
complete success in producing the intended proximate outcomes. While only 18 of the 848
31
control households knew of a land rights organization within their village, 817 of the 845
treatment households reported the presence of such an organization. And 826 treatment
households reported holding title, in contrast to only 27 control households. The vast ma-
jority of respondents with title reported having applied in late 2017 and received title between
January and April of 2018, more than a year and a half after program onset. Implementers
had expected the processing to take only a few months.
Table 3 presents the paper’s main impact estimates, the impact of the Homestead Pro-
gram on the nine outcome indices controlling for demographic and baseline outcome vari-
ables, in addition to strata (i.e., block x mukhiya SC status) fixed effects. Table 4 shows
these same estimates tabulated with identical specifications estimated on each component
variable. The tables indicate that the program exerted a strong impact with an effect size
of just under two standard deviations on the perceived homestead security index. Columns
2 and 3 of Table 3 reveal however that these stark increases in perceived tenure security
did not translate into increased investment in the household’s dwelling or homestead-based
livelihood activities. None of the seven variables that compose these two indices is signif-
icantly affected by the treatment, although all coefficients are positive with the exception
of pukka or milajula dwelling, which is perhaps the least likely to change in the short-term
because it may involve reconstructing sections of the dwelling’s foundation. Quantitative
results thus provide no evidence that the Homestead Program led to increased homestead
investments, or even to increased plans for investing.
We examine impacts on three indices relating to local government services: knowledge of
social protection entitlements, use of these entitlements, and direct access to these services
(all self-reported). Although each of these indices relates to the program’s goal of increasing
engagement with government and access to services, they are kept separate since they are
conceptually distinct and may be differentiated by the program. For instance, the program
could be successful in raising treatment household’s knowledge of the programs, but use may
remain unaffected if the programs are not relevant to the households, or if the programs are
32

simply not being delivered. The knowledge index asks respondents which of a list of nine
government programs he or she is familiar with, while the use index asks which of the nine
programs one or more members of a respondent’s household has used. The questions that
make up the direct access index ask whether the household would need to hire a dalal to
access each of the programs, as well as the likelihood that the household will need to hire
a dalal for any reason in the coming year. Responses are recoded such that higher scores
indicate a lower proportion of households who reported that they would need a dalal.
The Homestead Program had significant positive impacts on all three of these government
indices, with the knowledge of services coefficient the highest at just over 0.7 standard devi-
ations and the Gov – Free Access index exceeding 0.9 standard deviations. It is encouraging
that the treatment coefficient on use of government services is substantially smaller than the
others since each program is relevant to only a subset of participants. Had the index for
government program use been comparable in magnitude to the other two, this would likely
have been a sign of social desirability bias.
Column 7 shows that the Homestead Program had a more modest but still substantial
effect of just under a quarter of a standard deviation on asset ownership. The strongest
impact was an increase of 16.5 percentage points in the likelihood of stove ownership. While
the data are not equipped to prove this assertion, the fact that stoves are also the least
mobile of the assets measured may be a reflection of the increase in perceived homestead
security at the heart of the intervention. The program increased the likelihood of owning
a chair or having savings at the time of the interview by just under 10 percentage points,
while the program showed no effect of ownership on a pressure cooker or television.
The program registers no impact on food security variables, with none of the three
component variables showing significance and coefficients going in both directions. This lack
of evident impact could result from the relatively coarse measures, which were used as a result
of the infeasibility of systematic nutritional accounting in the survey instrument. However,
in light of the lack of increased investment in livelihood activities and qualitative evidence
33

to the contrary, it is perhaps most likely that the effect is simply not there. In contrast, the
program did show a sizable impact of 0.19 standard deviations on both dwelling and plot
satisfaction.
7 Discussion and Conclusions
In the above analysis, we employed a mixed methods evaluation design structured around
a cluster RCT to address the question of whether and how a social accountability program
following a CBO model can improve land security, investment, and access to government
entitlements, as well as overall livelihood and well-being. The qualitative analysis demon-
strated that, while full-scale land dispossession is uncommon, risks relating to tenure inse-
curity weigh heavily on the minds of many untitled village residents. Impact estimates show
that the program exerted strong positive effects on perceived tenure security. The study’s
experimental design does not allow for quantitatively untangling the independent effects of
the CBO’s operations from the receipt of title in shaping this outcome. However, qualitative
evidence points toward an essential role played by CBOs in this process.
Before the program, target households had limited access to information on and low
confidence in government documents like title. In this context, it seems unlikely that partic-
ipants would have experienced a perceived security boost of the same degree had someone
simply handed them a title. Interviews and FGDs highlighted the central importance of
the information on rights and grievance redressal tools provided by the CBOs, in addition
to respondents’ awareness of the regular meetings the CBOs were holding in the village on
rights protection. Participants were accustomed to receiving documents and certifications
of various types, including certificates respectively showing SC and below poverty line sta-
tus, and the “job cards” used to track MGNREGA work days. Sometimes the certificates
came directly from government officials, and sometimes respondents would obtain them for
a fee through dalals on the promise that the documents would make them eligible for ma-
34

terial assistance. Participants regaled the interviewers with stories of the arbitrariness of
these documents’ utility. Sometimes promised entitlement benefits would materialize, and
sometimes they would not. Given relatively frequent changes in the administrative policy of
Bihar’s social welfare system, this arbitrariness seems to have arisen from a combination of
changing policies on one hand, and government officials and/or dalals intentionally gener-
ating confusion from which to profit on the other. However, receipt of title is likely also to
have played an important role because it was seen as an acknowledgement and legitimation
of households’ rights by the state, a physical manifestation of the social contract. Further-
more CBO members and village residents would likely have at some point lost interest in
the organization if no concrete benefits like title were to materialize.
In contrast to land security, the program showed no effects on investment, either in the
dwelling structure or in homestead-based livelihood activities. Qualitative evidence indicates
this lack of impact may have arisen from cash constraints preventing dwelling improvements,
and space constraints preventing homestead gardening or keeping more than a few animals.
While interviews and FGDs do provide ample indications that issues of homestead security
weighed on household decision-making, this study is not equipped to demonstrate whether
land insecurity would have bound investment in the absence of cash constraints. A productive
future course of research would be to cross-randomize cash grants and CBO formation (or
another land security intervention) in a factorial experiment to better understand households’
priorities through marginal expenditure patterns and to see whether increased land security
alters these patterns in favor of homestead-based investments.
Not surprisingly given the lack of impact on investment in livelihood activities, no im-
provements in food security were detected. However the increase in asset ownership—as
picked up by significant effects on owning a chair or bench, having savings, and especially
owning a stove—could reflect an increased willingness to store wealth within the physical
dwelling space. This of course remains a hypothesis for future research rather than a defini-
tive conclusion. Finally, the moderate positive impact on plot and dwelling satisfaction, while
35

they should not be overinterpreted, lend weight to the notion that households perceived some
gain as a result of changes arising from the intervention.
Among the study’s most noteworthy and unexpected findings was the role played by
the CBOs in helping community residents to bypass dalals. While the quantitative analysis
was limited by feasibility constraints that precluded a detailed accounting of entitlement
resource receipt and leakage to intermediaries, the magnitude of the impacts suggests a
substantial change in mentality about the need for intermediaries in the social welfare delivery
process. Furthermore, while effects were consistent across several important government
programs, a few showed no effects and magnitudes for the others varied, which may indicate
that respondents were able to distinguish between the distinct systems associated with the
different entitlement programs and consider levels of access separately for each.
In contrast to dalals, who draw their legitimacy from particularistic clientele networks,
field organizers drew their legitimacy in the eyes of CBO members by clearly and consistently
explaining the nature of residents’ rights to entitlements, and by regularly returning to the
village without asking for payment or even accepting unsolicited gifts. Most CBO members
reported beginning to trust the field organizers and to take an interest in their program
only after the organizers continued to show up for bimonthly meetings for several months.
And other village residents typically trusted CBO members since they were members of
the same community facing similar issues. It is these relationships of trust that lie at the
heart of the Homestead Program’s model. A better understanding of the means through
and circumstances under which interventions can help to cultivate these ties of trust and the
capacity for collective action that they unlock may prove to be a powerful tool in ongoing
struggles to improve entitlement delivery
36

References
Anderson, M. L. (2008). Multiple inference and gender differences in the effects of early
intervention: A reevaluation of the abecedarian, perry preschool, and early training
projects. Journal of the American statistical Association, 103 (484), 1481–1495.
Appu, P. S., et al. (1997). Land reforms in india: a survey of policy, legislation and
implementation. Vikas.
Baiocchi, G., Heller, P., & Silva, M. K. (2008). Making space for civil society: institutional
reforms and local democracy in brazil. Social Forces , 86 (3), 911–936.
Bamberger, M., Rao, V., & Woolcock, M. (2010). Using mixed methods in monitoring and
evaluation: experiences from international development.
Bandyopadhyay, D. (2003). Land reforms and agriculture: the west bengal experience.
Economic and Political Weekly , 879–884.
Banerjee, A., Duflo, E., Goldberg, N., Karlan, D., Osei, R., Pariente, W., . . . Udry, C.
(2015). A multifaceted program causes lasting progress for the very poor: Evidence
from six countries. Science, 348 (6236), 1260799.
Banerjee, A., Duflo, E., Imbert, C., Mathew, S., & Pande, R. (2016). E-governance, ac-
countability, and leakage in public programs: Experimental evidence from a financial
management reform in india (Tech. Rep.). National Bureau of Economic Research.
Banerjee, A., & Iyer, L. (2005). History, institutions, and economic performance: The legacy
of colonial land tenure systems in india. American economic review , 95 (4), 1190–1213.
Banerjee, A. V., Gertler, P. J., & Ghatak, M. (2002). Empowerment and efficiency: Tenancy
reform in west bengal. Journal of political economy , 110 (2), 239–280.
Bardhan, P. K., & Mookherjee, D. (2000). Capture and governance at local and national
levels. American Economic Review , 90 (2), 135–139.
Bennett, A., & Elman, C. (2006). Qualitative research: Recent developments in case study
methods. Annu. Rev. Polit. Sci., 9 , 455–476.
Besley, T., & Burgess, R. (2000). Land reform, poverty reduction, and growth: Evidence
37

from india. The Quarterly Journal of Economics , 115 (2), 389–430.
Deininger, K., Jin, S., & Nagarajan, H. K. (2007). Efficiency and equity impacts of rural
land rental restrictions: Evidence from india. The World Bank.
Dutta, P., Murgai, R., Ravallion, M., & Van de Walle, D. (2012). Does india’s employment
guarantee scheme guarantee employment? The World Bank.
Dutta, P., Murgai, R., Ravallion, M., & Van de Walle, D. (2014). Right to work?: Assessing
india’s employment guarantee scheme in bihar. The World Bank.
Evans, P. (2004). Development as institutional change: the pitfalls of monocropping and the
potentials of deliberation. Studies in comparative international development , 38 (4),
30–52.
Field, E. (2007). Entitled to work: Urban property rights and labor supply in peru. The
Quarterly Journal of Economics , 122 (4), 1561–1602.
Fox, J. A. (2015). Social accountability: what does the evidence really say? World Devel-
opment , 72 , 346–361.
Gans-Morse, J., Borges, M., Makarin, A., Mannah-Blankson, T., Nickow, A., & Zhang,
D. (2018). Reducing bureaucratic corruption: Interdisciplinary perspectives on what
works. World Development , 105 , 171–188.
Gaventa, J., & Barrett, G. (2012). Mapping the outcomes of citizen engagement. World
Development , 40 (12), 2399–2410.
Glennerster, R., & Takavarasha, K. (2013). Running randomized evaluations: A practical
guide. Princeton University Press.
Grandvoinnet, H., Aslam, G., & Raha, S. (2015). Opening the black box: The contextual
drivers of social accountability. The World Bank.
Hanstad, T., Brown, J., & Prosterman, R. (2002). Larger homestead plots as land reform?
international experience and analysis from karnataka. Economic and Political Weekly ,
3053–3062.
Heller, P., & Rao, V. (2015). Deliberation and development: rethinking the role of voice and
38

collective action in unequal societies. The World Bank.
Herring, R. J. (1983). Land to the tiller: The political economy of agrarian reform in south
asia. Yale University Press New Haven.
Joshi, A. (2013). Do they work? assessing the impact of transparency and accountability
initiatives in service delivery. Development Policy Review , 31 , s29–s48.
Joshi, A., & Houtzager, P. P. (2012). Widgets or watchdogs? conceptual explorations in
social accountability. Public Management Review , 14 (2), 145–162.
Kabeer, N., & Sulaiman, M. (2015). Assessing the impact of social mobilization: Nijera kori
and the construction of collective capabilities in rural bangladesh. Journal of Human
Development and Capabilities , 16 (1), 47–68.
Kalev, A., Dobbin, F., & Kelly, E. (2006). Best practices or best guesses? assessing the
efficacy of corporate affirmative action and diversity policies. American sociological
review , 71 (4), 589–617.
Kling, J. R., Liebman, J. B., & Katz, L. F. (2007). Experimental analysis of neighborhood
effects. Econometrica, 75 (1), 83–119.
Lieberman, E. S., Posner, D. N., & Tsai, L. L. (2014). Does information lead to more
active citizenship? evidence from an education intervention in rural kenya. World
Development , 60 , 69–83.
Mansuri, G., & Rao, V. (2012). Localizing development: Does participation work? The
World Bank.
Mueller, V., Billings, L., Mogues, T., Peterman, A., & Wineman, A. (2017). Filling the
legal void? impacts of a community-based legal aid program on women’s land-related
knowledge, attitudes, and practices. Oxford Development Studies , 1–17.
Olken, B. A., & Pande, R. (2012). Corruption in developing countries. Annu. Rev. Econ.,
4 (1), 479–509.
Patton, M. Q. (2014). Qualitative research & evaluation methods. 2001 sage publications.
Thousand Oaks, California.
39

Piven, F. F., & Cloward, R. (2012). Poor people’s movements: Why they succeed, how they
fail. Vintage.
Protik, A. E., Nichols-Barrer, I., Berman, J., & Sloan, M. (2018). Bridging the informa-
tion gap between citizens and local governments: Evidence from a civic participation
strengthening program in rwanda. World Development , 108 , 145–156.
Rao, V., Ananthpur, K., & Malik, K. (2017). The anatomy of failure: An ethnography
of a randomized trial to deepen democracy in rural india. World Development , 99 ,
481–497.
Rossi, P. H., Lipsey, M. W., & Freeman, H. E. (2003). Evaluation: A systematic approach.
Sage publications.
Santos, F., Fletschner, D., Savath, V., & Peterman, A. (2014). Can government-allocated
land contribute to food security? intrahousehold analysis of west bengal’s microplot
allocation program. World Development , 64 , 860–872.
Seawright, J., & Gerring, J. (2008). Case selection techniques in case study research: A menu
of qualitative and quantitative options. Political Research Quarterly , 61 (2), 294–308.
Sheely, R. (2015). Mobilization, participatory planning institutions, and elite capture:
Evidence from a field experiment in rural kenya. World Development , 67 , 251–266.
White, H. (2009). Theory-based impact evaluation: principles and practice. Journal of
development effectiveness , 1 (3), 271–284.
White, H. (2013). The use of mixed methods in randomized control trials. New Directions
for Evaluation, 2013 (138), 61–73.
Woolcock, M. (2013). Using case studies to explore the external validity of ‘com-
plex’development interventions. Evaluation, 19 (3), 229–248.
Yanez-Pagans, M., & Machicado-Salas, G. (2014). Bureaucratic delay, local-level monitoring,
and delivery of small infrastructure projects: Evidence from a field experiment in
bolivia. World Development , 59 , 394–407.
40

Figure 1: Theory of Change
Community mobilization
Security Investment
Entitlements Livelihood
Applications for title
Receipt of title
CBOs operateCBO formation/
training
Inputs Outputs Outcomes Impacts

Figure 2: Timeline
Program Events
CBOs trained
Research Events
Baseline survey
Applications submitted Titles received
Randomization Endline survey
Spring 2016 Fall 2016 Winter 2018 Fall 2018
42

Figure 3: Stratification Procedure
43

Table 1. Baseline Descriptive Statistics and Balance Tests
Control Mean Treatment Mean Coefficient Standard Error
Number of hh members - total 5.249 5.051 0.199 0.147Number of hh members - female 2.518 2.467 0.055 0.087Hindi is first language 0.118 0.059 0.057** 0.023Identifies as Bhuiyan 0.705 0.749 -0.042 0.054Parents owned land 0.118 0.180 -0.065** 0.031Has applied for title 0.033 0.044 -0.010 0.015Settled on private land 0.195 0.265 -0.066 0.052Keeps garden 0.014 0.012 0.003 0.006Keeps animals 0.657 0.647 0.008 0.029Land org in village 0.001 0.006 -0.005 0.005Pukka or mixed dwelling 0.446 0.448 -0.003 0.057Number of rooms 2.807 2.594 0.212** 0.104Electricty 0.417 0.393 0.030 0.052Home improvement - past year 0.573 0.630 -0.054 0.038Home improvement - plans 0.121 0.131 -0.009 0.022Currently has money saved 0.511 0.555 -0.044 0.039Currently owes money 0.344 0.381 -0.042 0.031Owns television 0.037 0.035 0.001 0.011Owns cellphone 0.625 0.654 -0.033 0.032Owns chair 0.046 0.063 -0.016 0.012Owns bicycle 0.206 0.212 -0.006 0.022
Households 848 845 1693 1693Villages 72 72 144 144
Notes: ∗p < 0.1, ∗ ∗ p < 0.05, ∗ ∗ ∗p < 0.01. Coefficient column reports treatment coefficients atbaseline from regressions for each outcome variable. All regressions include strata fixed effects.Standard errors are robust and clustered at the village level.
44

Table 2. Outcome Indices at Baseline
(1) (2) (3) (4) (5) (6) (7) (8) (9)Land
SecurityDwelling
InvestmentCrops andAnimals
Gov -Knowledge
Gov -Prog Use
Gov -Free Access
AssetsFood
SecurityHomesteadSatisfaction
Treatment 0.055 0.028 0.032 -0.135* -0.093 0.026 -0.060 -0.164* -0.042Standard error (0.073) (0.082) (0.060) (0.081) (0.068) (0.087) (0.063) (0.089) (0.075)P-Value 0.455 0.733 0.590 0.098 0.171 0.770 0.337 0.069 0.575
R2 0.008 0.042 0.019 0.127 0.096 0.037 0.019 0.014 0.015Households 1,693 1,693 1,693 1,693 1,693 1,693 1,693 1,693 1,693Villages 144 144 144 144 144 144 144 144 144
Notes: ∗p < 0.1, ∗ ∗ p < 0.05, ∗ ∗ ∗p < 0.01. Treatment row contains coefficients from OLSregressions of each of the main index outcomes on treatment status with strata fixed effects.Standard errors are robust and clustered at the village level.
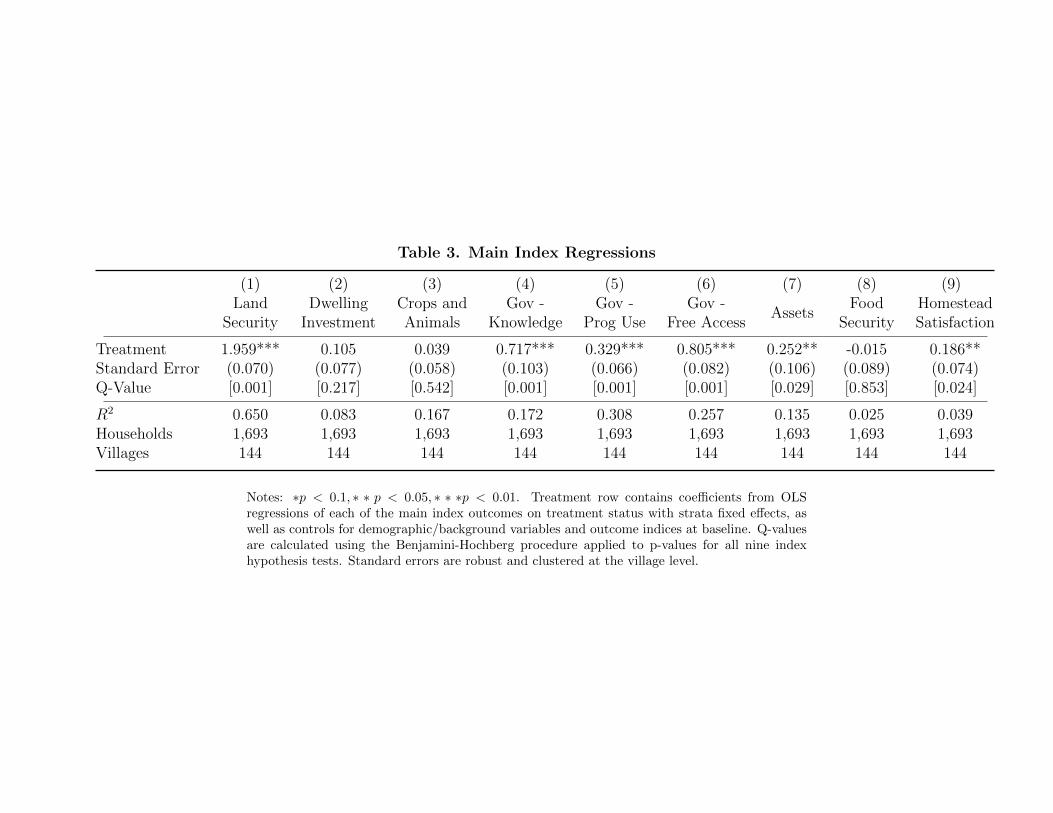
Table 3. Main Index Regressions
(1) (2) (3) (4) (5) (6) (7) (8) (9)Land
SecurityDwelling
InvestmentCrops andAnimals
Gov -Knowledge
Gov -Prog Use
Gov -Free Access
AssetsFood
SecurityHomesteadSatisfaction
Treatment 1.959*** 0.105 0.039 0.717*** 0.329*** 0.805*** 0.252** -0.015 0.186**Standard Error (0.070) (0.077) (0.058) (0.103) (0.066) (0.082) (0.106) (0.089) (0.074)Q-Value [0.001] [0.217] [0.542] [0.001] [0.001] [0.001] [0.029] [0.853] [0.024]
R2 0.650 0.083 0.167 0.172 0.308 0.257 0.135 0.025 0.039Households 1,693 1,693 1,693 1,693 1,693 1,693 1,693 1,693 1,693Villages 144 144 144 144 144 144 144 144 144
Notes: ∗p < 0.1, ∗ ∗ p < 0.05, ∗ ∗ ∗p < 0.01. Treatment row contains coefficients from OLSregressions of each of the main index outcomes on treatment status with strata fixed effects, aswell as controls for demographic/background variables and outcome indices at baseline. Q-valuesare calculated using the Benjamini-Hochberg procedure applied to p-values for all nine indexhypothesis tests. Standard errors are robust and clustered at the village level.
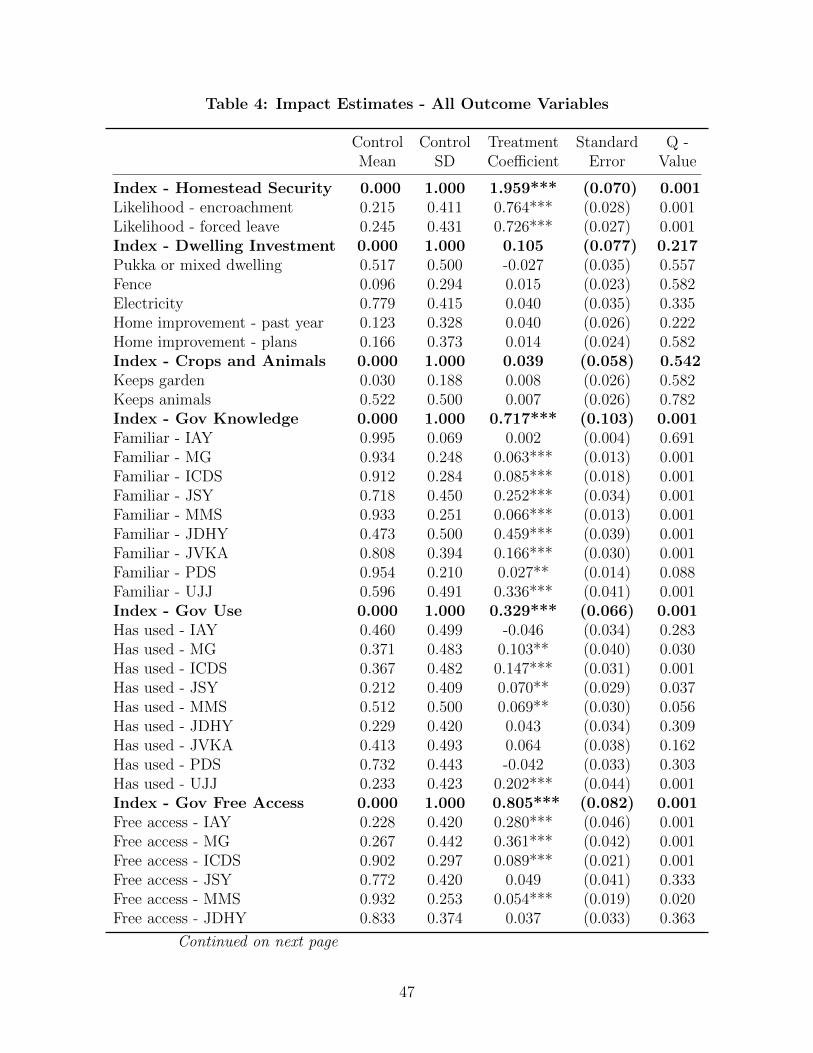
Table 4: Impact Estimates - All Outcome Variables
ControlMean
ControlSD
TreatmentCoefficient
StandardError
Q -Value
Index - Homestead Security 0.000 1.000 1.959*** (0.070) 0.001Likelihood - encroachment 0.215 0.411 0.764*** (0.028) 0.001Likelihood - forced leave 0.245 0.431 0.726*** (0.027) 0.001Index - Dwelling Investment 0.000 1.000 0.105 (0.077) 0.217Pukka or mixed dwelling 0.517 0.500 -0.027 (0.035) 0.557Fence 0.096 0.294 0.015 (0.023) 0.582Electricity 0.779 0.415 0.040 (0.035) 0.335Home improvement - past year 0.123 0.328 0.040 (0.026) 0.222Home improvement - plans 0.166 0.373 0.014 (0.024) 0.582Index - Crops and Animals 0.000 1.000 0.039 (0.058) 0.542Keeps garden 0.030 0.188 0.008 (0.026) 0.582Keeps animals 0.522 0.500 0.007 (0.026) 0.782Index - Gov Knowledge 0.000 1.000 0.717*** (0.103) 0.001Familiar - IAY 0.995 0.069 0.002 (0.004) 0.691Familiar - MG 0.934 0.248 0.063*** (0.013) 0.001Familiar - ICDS 0.912 0.284 0.085*** (0.018) 0.001Familiar - JSY 0.718 0.450 0.252*** (0.034) 0.001Familiar - MMS 0.933 0.251 0.066*** (0.013) 0.001Familiar - JDHY 0.473 0.500 0.459*** (0.039) 0.001Familiar - JVKA 0.808 0.394 0.166*** (0.030) 0.001Familiar - PDS 0.954 0.210 0.027** (0.014) 0.088Familiar - UJJ 0.596 0.491 0.336*** (0.041) 0.001Index - Gov Use 0.000 1.000 0.329*** (0.066) 0.001Has used - IAY 0.460 0.499 -0.046 (0.034) 0.283Has used - MG 0.371 0.483 0.103** (0.040) 0.030Has used - ICDS 0.367 0.482 0.147*** (0.031) 0.001Has used - JSY 0.212 0.409 0.070** (0.029) 0.037Has used - MMS 0.512 0.500 0.069** (0.030) 0.056Has used - JDHY 0.229 0.420 0.043 (0.034) 0.309Has used - JVKA 0.413 0.493 0.064 (0.038) 0.162Has used - PDS 0.732 0.443 -0.042 (0.033) 0.303Has used - UJJ 0.233 0.423 0.202*** (0.044) 0.001Index - Gov Free Access 0.000 1.000 0.805*** (0.082) 0.001Free access - IAY 0.228 0.420 0.280*** (0.046) 0.001Free access - MG 0.267 0.442 0.361*** (0.042) 0.001Free access - ICDS 0.902 0.297 0.089*** (0.021) 0.001Free access - JSY 0.772 0.420 0.049 (0.041) 0.333Free access - MMS 0.932 0.253 0.054*** (0.019) 0.020Free access - JDHY 0.833 0.374 0.037 (0.033) 0.363
Continued on next page
47

Table 4 Continued
ControlMean
ControlSD
TreatmentCoefficient
StandardError
Q -Value
Free access - JVKA 0.883 0.321 -0.002 (0.030) 0.919Free access - PDS 0.910 0.286 0.064*** (0.021) 0.011Free access - UJJ 0.684 0.465 0.154*** (0.038) 0.001Expects to hire intermediary 0.331 0.471 0..625*** (0.043) 0.001Index - Assets 0.000 1.000 0.252** (0.106) 0.029Stove 0.313 0.464 0.162*** (0.052) 0.006Television 0.136 0.343 0.038 (0.031) 0.333Pressure cooker 0.278 0.448 -0.041 (0.049) 0.490Electric fan 0.376 0.485 0.052 (0.052) 0.420Chair or bench 0.445 0.497 0.095** (0.045) 0.071Has savings 0.570 0.495 0.085** (0.042) 0.080Index - Food Security 0.000 1.000 -0.015 (0.089) 0.853Not enough food 0.370 0.483 -0.002 (0.051) 0.969No food 0.067 0.251 0.008 (0.023) 0.959Borrow from family 0.106 0.308 -0.020 (0.028) 0.782Index - Satisfaction 0.000 1.000 0.186*** (0.074) 0.024Dwelling satisfaction 3.402 0.975 0.146** (0.067) 0.059Hmstd plot satisfaction 3.265 0.938 0.166** (0.074) 0.056
Households 848 848 1693 1693 1693Villages 72 72 144 144 144
Notes: ∗p < 0.1, ∗ ∗ p < 0.05, ∗ ∗ ∗p < 0.01. Treatment column contains coefficients from OLSregressions of each of all x outcomes on treatment status with strata fixed effects, as well as controlsfor demographic/background variables and outcome indices at baseline. Q-values are calculatedusing the Benjamini-Hochberg procedure applied to p-values for all nine index hypothesis tests.Standard errors are robust and clustered at the village level.
48

Designed by soapbox.co.uk
The International Growth Centre (IGC) aims to promote sustainable growth in developing countries by providing demand-led policy advice based on frontier research.
Find out more about our work on our website www.theigc.org
For media or communications enquiries, please contact [email protected]
Subscribe to our newsletter and topic updates www.theigc.org/newsletter
Follow us on Twitter @the_igc
Contact us International Growth Centre, London School of Economic and Political Science, Houghton Street, London WC2A 2AE