Organisational preparedness for the physical risks of ...
60
Organisational preparedness for the physical risks of climate change in the UK Headline findings from a UK-wide survey (April–May 2021) Denyse S. Dookie, Declan Conway and Suraje Dessai
Transcript of Organisational preparedness for the physical risks of ...
Organisational preparedness for the physical risks of climate change in the UK
Headline findings from a UK-wide survey (April–May 2021)
Denyse S. Dookie, Declan Conway and Suraje Dessai
The Centre for Climate Change Economics and Policy (CCCEP) was established in 2008 to advance public and private action on climate change through rigorous, innovative research. The Centre is hosted jointly by the University of Leeds and the London School of Economics and Political Science. It is funded by the UK Economic and Social Research Council. www.cccep.ac.uk
The Grantham Research Institute on Climate Change and the Environment was established in 2008 at the London School of Economics and Political Science. The Institute brings together international expertise on economics, as well as finance, geography, the environment, international development and political economy to establish a world-leading centre for policy-relevant research, teaching and training in climate change and the environment. It is funded by the Grantham Foundation for the Protection of the Environment, which also funds the Grantham Institute – Climate Change and Environment at Imperial College London. www.lse.ac.uk/grantham
About the authors
Dr Denyse Dookie is a Research Officer at the Grantham Research Institute on Climate Change and the Environment. Denyse’s research and interests focus on the benefits and challenges of using climate information for adaptation, resilience and disaster preparedness in the UK, insular Caribbean, and other small island developing states.
Professor Declan Conway is Interim Deputy Director of the Grantham Research Institute on Climate Change and the Environment. Declan’s research cuts across water, climate and society, with a focus on adaptation and the water–energy–food nexus.
Professor Suraje Dessai is Chair of Climate Change Adaptation at the Sustainability Research Institute, School of Earth and Environment at the University of Leeds. His research focuses on the management of climate change uncertainties, perception of climate risks and the science–policy interface in climate change science, adaptation and services. Suraje is a Champion of the Strategic Priorities Fund UK Climate Resilience Programme.
Acknowledgements
Funding from the UK Economic and Social Research Council (ESRC) (ES/R009708/1) through the Centre for Climate Change Economics and Policy and Research England QR-SPF at the University of Leeds is gratefully acknowledged. Denyse Dookie and Declan Conway also acknowledge funding from the Grantham Foundation for the Protection of the Environment and Suraje Dessai from the SPF UK Climate Resilience Programme. Thanks to Swenja Surminski, Kate Lonsdale, Nicola Ranger, Louise Wilson and Vivian Dépoues for comments on the draft report and to Kate Gannon, Candice Howarth, Swenja Surminski, Julie Mair, Kate Lonsdale and Susanne Lorenz for comments on survey questions. Thanks to Jouni Kuha for methodological/statistical advice, Evan Oliner for preparing many of the figures and Georgina Kyriacou and Stevie Shephard for editing and formatting.
The market research company Lucid administered the survey this report describes, on behalf of the authors, using the online platform Decipher.
The views expressed in this report represent those of the authors and do not necessarily represent those of the host institutions or funders. No conflict of interest was reported by the authors.
This paper was first published in October 2021 by the Grantham Research Institute on Climate Change and the Environment and the Centre for Climate Change Economics and Policy.
© The authors, 2021
Permissions requests should be directed to the Grantham Research Institute.
Suggested citation: Dookie DS, Conway D and Dessai S (2021) Organisational preparedness for the physical risks of climate change in the UK: Headline findings from a UK-wide survey (April–May 2021). London: Grantham Research Institute on Climate Change and the Environment and Centre for Climate Change Economics and Policy, London School of Economics and Political Science.
Contents
List of abbreviations 1
Summary and recommendations 2
1. Introduction 5
2. Methodology 9
3. Headline findings 14 i) Concerns about general/wider organisational risks 14
ii) Personal awareness of climate change 16
iii) Perceptions of threats and opportunities from extreme weather events 18
iv) Recent experiences of impacts from extreme weather events 22
v) Managing the impacts of extreme weather events 27
vi) Perceptions of and need for planning for climate change 31
vii) Information needed to adjust to a changing climate 32
viii) Planning for climate change 33
ix) Climate emergency declarations 34
x) Use of climate information for decision-making 34
xi) Approaches to climate change adaptation 38
4. Discussion and recommendations 46
References 51
Appendix: Additional methodology detail and results 52
1
List of abbreviations AR4, AR5 Fourth Assessment Report, Fifth Assessment Report [of the IPCC – see below]
AR6 WGI/II Sixth Assessment Report Working Group I/II [of the IPCC]
ARP Adaptation Reporting Power
BEIS Department for Business, Energy and Industrial Strategy
CBI Confederation of British Industry
CCC Climate Change Committee
CCRA Climate Change Risk Assessment
CDP Carbon Disclosure Project
COP26 26th session of the Conference of the Parties to the United Nations Framework Convention on Climate Change
Defra Department for Environment, Food & Rural Affairs
EA Environment Agency
IPCC Intergovernmental Panel on Climate Change
LCCP London Climate Change Partnership
NAP National Adaptation Programme
NGO non-governmental organisation
PREPARE Programme of Research on Preparedness, Adaptation and Risk
SEPA Scottish Environment Protection Agency
TCFD Task Force on Climate-related Financial Disclosures
UKCP United Kingdom climate projections
WHO World Health Organization

2
Summary and recommendations This report presents the headline findings from a national survey of UK-based organisations’ perceptions about adapting to a changing climate. Called ‘PREPARE-3’, the survey was carried out in 2021, with 2,400 individuals. It covers awareness among organisations of climate change, its physical risks and how organisations are taking action to prepare for perceived risks. The survey follows earlier surveys in 2010 and 2013 (PREPARE-1 and PREPARE-2, respectively). PREPARE stands for Programme of Research on Preparedness, Adaptation and Risk.
Perceptions of risks and opportunities
The effects of climate change on the UK were ranked fifth by the survey respondents out of 11 issues across all UK nations and sectors as a concern faced by organisations (with 58% identifying it as a concern). This places climate change impacts above the issue of Brexit (ranked sixth, identified by 57%). Notably, the implications of government policy to reduce greenhouse gas emissions ranked highly, too (seventh, 55%). The top-ranking issue was concern about the ongoing Coronavirus pandemic (83%).
The proportion of respondents expressing concern about the effects of climate change on the UK fell from 79% in 2010 to 65% in 2013 and to 58% in 2021. Concern about being prepared in case of extreme weather also fell across the three surveys, from 75% in 2010 to 71% in 2013 and to 40% in 2021. The marked decline in concern between 2013 and 2021 is hard to account for but is possibly associated with organisations feeling more prepared for climate change, Coronavirus crowding-out the immediacy of the issue, or some combination of these two factors.
The three weather-related extremes of most concern to organisations in the 2021 survey were “a heavy downpour causing localised flooding” (66%), “severe flooding at the nearest coastline” (50%), and “an intense heatwave lasting a week” (47%). “A very mild winter” was perceived as a small opportunity across all sectors, locations and surveys.
Recommendations
• Because heavy downpours causing localised flooding, severe flooding at the nearest coastline and intense heat waves lasting a week are the extremes that over time consistently draw most concern – also aligning with other findings (from past Climate Change Risk Assessments) and projections of future climate – these types of risks should provide a focus for communication campaigns and greater adaptation preparedness and action.
• The marked decline in concern about being prepared for extreme events requires further analysis.
• There are some differences between sectoral and regional concerns about climate risk (and in some cases perceptions of opportunity) and therefore communications and actions need to be carefully targeted and designed for different situations.
Experiences of extreme weather events
Fifty-eight per cent of respondents said their organisations had been significantly affected by extreme weather events during the previous three years. In most cases these effects were negative and some have been long-lasting or have cross-cut sectors and geographical scales. The frequency and intensity of such events are very likely to increase in the future, as indicated in the UK climate projections.
Photo: William Topa, Unsplash
3
The two most mentioned events were “a heavy downpour causing localised flooding” and “an intense heatwave lasting a week”. For England only, between 2013 and 2021, there was a 28% increase in respondents experiencing significant effects of extreme weather.
Many of the impacted organisations (45%) followed a pre-designed plan to deal with the extreme weather event (the detail was unspecified), suggesting there could be potential to develop adaptation plans from existing risk management plans.
Recommendations
• Constructing a more detailed assessment of the economic impacts of extreme weather events will help build the case for adaptation action and for targeting initiatives. Case studies of events/sectors or value chains could provide a useful focus (health sector experiences of heat waves and organisations having pre-designed plans for extremes are highlighted by this survey).
• The nature and implications of delays in weather-related impacts, and cross-sectoral or cascading impacts, require further study.
Risk response and planning
Our survey results support a picture of UK organisations that are taking steps to prepare for similar extreme weather events in the future, with the top three actions being capacity training or some form of knowledge transfer, investment in new technologies, and making an insurance claim. Many of the less frequent responses recorded are quite significant in terms of their requirements or impacts; they include decreasing production capacity and increasing or decreasing the size of the workforce, which could have possibly substantial cost implications. Action appears to be strongly informed by dealing with the effects of extremes already experienced, with a much smaller proportion of organisations taking measures to deal with the physical risks of future climate change. Only 12% of organisations have comprehensively assessed present and future risks.
Recommendation
• The types of extreme weather events already experienced provide the main mental model for action targeted at future risk. This high salience of recent experiences provides a strong foundation for promoting more action, particularly establishing a more detailed evidence base to make the case for the cost-effectiveness of taking action now.
Information on adjusting to a changing climate
Perceptions of the availability of information about adaptation were very positive, although the proportion of positive responses decreased between the 2010 and 2021 surveys. The main sources of information used by respondents were internet searches, government literature, the UK Met Office, colleagues, and the UK climate projections (UKCP). Responses about the use of climate information were generally quite positive, particularly relating to ease of understanding and reliability. However, most organisations said they are only thinking about or starting plans and are therefore at the earliest stages of engaging with climate information. As they advance, perceptions of information relevance, quality and usability may evolve considerably; this is a situation that needs to be monitored.
Recommendation
• Since many organisations are just starting to address future risk, it would be useful to track in more detail how exactly information is being used and for what purposes, linking with providers (UKCP processes) and demand-side mechanisms (such as the Task Force on Climate-related Financial Disclosures and the newly established UK Centre for Greening Finance and Investment).
Promoting and taking responsibility for adaptation
Adaptation consists of many stages and actions and our results suggest a situation in the UK that is evolving, but with most organisations only starting the process. Respondents who reported that their

4
organisation had at least begun looking at present and future threats (67% of the full sample) were most often considering flooding from heavy rain (67%) and then heatwaves (56%).
About 16% of organisations reported having an adaptation plan, and a considerable proportion (37%) said their organisation did not but that plans were being made to develop one. A majority (64%) of those with plans noted that it was their first one. Many factors appear to influence decisions to develop plans, suggesting a complex situation with no overriding reasons.
Barriers to adapting to physical impacts that were ranked highly by respondents include: [insufficient] financial resources (ranked highest by a considerable margin); complacent organisational or staff attitudes towards climate change; difficulty identifying effective measures; lack of access to, or awareness of, new technologies; and not considering adaptation a priority/other matters taking higher priority/having competing priorities.
Over 80% of respondents indicated a view that responsibility for managing the impacts of climate change should be shared by national government and the international community, as many as 88% felt that the national government should have either full or partial responsibility, and close to 85% said the responsibility should lie with the international community.
Recommendation
• Most respondents felt that the Government should provide more information about the effects of climate change in the UK, plus funding, subsidies or tax breaks for adaptation, and that the Government should demonstrate how climate change is relevant to specific kinds of organisations. Organisations see a strong role for leadership from government and collective responsibility for adaptation, which should be recognised in efforts to promote adaptation.
National surveys of adaptation
Adaptation is highlighted by the UK as one of four crucial goals to be addressed at the international climate conference COP26 in November 2021. The PREPARE surveys offer an opportunity to compare long-term changes in organisational perspectives on adaptation, alongside other initiatives tracking organisational and public perceptions and behaviours. The results of the 2021 survey come at a time when adaptation is becoming more salient across society, as extreme weather events raise awareness and cause direct impacts.
A large sample of more than 2,400 individuals was surveyed by PREPARE-3, which gives confidence in the representivity of the results. However, most of the answers are short-format, which limits how much we can currently infer about the reasons behind the findings. Due to differences in sample collection methods between the surveys and some changes in how the sectors were defined, there are limitations to statistical comparison of the survey phases and therefore the results should be seen as snapshots in time, not as a longitudinal study.
Recommendations
• Organisations with a cross-cutting role, such as the Adaptation Committee of the UK’s Climate Change Committee or the Confederation of British Industry (CBI), could promote the coordination of periodic surveys. These could be harmonised with regular review processes, including the UK Climate Change Risk Assessment (CCRA) and the Adaptation Reporting Power (ARP), and disclosure efforts such as Carbon Disclosure Project (CDP) and the Task Force on Climate-related Financial Disclosures (TCFD).
• Future surveys should include new questions that capture the measures required to facilitate a shift from adaptation awareness and planning to action, and to track progress therein.
• Funding should be considered for longitudinal surveys complemented with qualitative data collection to expand upon survey findings.

5
1. Introduction The ‘PREPARE-3’ survey and its relevance
This report summarises the headline findings of a survey, known as ‘PREPARE-3’, carried out from April to May 2021 on awareness among organisations of climate change, its physical risks and how organisations are taking action to prepare for perceived risks. The analysis is relevant for the private sector and related associations, and the public sector and policymakers focused on improving the role and inclusion of adaptation, preparedness and risk resilience initiatives within organisational planning.
Respondents to PREPARE-3 consisted of 2,429 individuals from a range of organisations in different sectors, including businesses, public health authorities, local authorities, public educational establishments, and third sector or charitable organisations, from across all four UK nations. The study is a revisit of the 2009/10 and 2012/13 quantitative surveys on preparedness, adaptation and risk (referred to hereafter as PREPARE-1 and PREPARE-2) (Ipsos MORI, 2020; Evans, 2013). The first two surveys were commissioned by the UK Government’s Department for Environment, Food & Rural Affairs (Defra) and conducted by Ipsos MORI. This, the third round of the PREPARE survey, was commissioned and funded independently through the ESRC Centre for Climate Change Economics and Policy (CCCEP). It has the potential for future replication to provide a longer-term perspective of climate change awareness, preparedness and adaptation across organisations in the UK. (More background to the three surveys is provided on p8.)
PREPARE-3 repeated all the questions from the previous two surveys and therefore there is scope to identify changes over time in organisational/sectoral perspectives on climate change awareness and responses in the UK. However, the 2021 survey includes new questions too, and in our analysis we focus on additional questions that give attention to the understanding and utilisation of climate information in decision-making, including the utility of the UK climate projections 2018 (UKCP18) and the challenges of dealing with uncertainty. As such, in this report we provide insights into a wide range of factors relating to UK-wide organisational and sectoral perspectives on preparedness, risk and adaptation to climate change, considering changes over time and give specific attention to perceptions recorded in spring 2021.
The motivation for this new report and the expanded 2021 survey come from the extensive institutional, political, policy, national, regional and global changes that have occurred since the PREPARE-2 survey of 2013, and from the limited analysis and accessibility of the initial PREPARE-1 quantitative survey results.
The 2021 survey was designed to address the following research questions: • What types of extreme weather and scale of disruption have already been experienced
by organisations? • Do organisations profess better preparation now for a changing climate compared with their
responses to the previous surveys of 2009/10 and 2012/13? • Where are organisations currently getting climate information from? How has this changed
over time? • What are organisations planning to do to adapt to climate change? • What do organisations require to successfully adapt to climate change? • Are there observable differences between nations and regions and sectors?
These questions will be addressed further, in more detail, in follow-on analysis and academic articles.
The initial survey results described in this report contribute timely insights relevant to ongoing organisational adaptation initiatives such as the Adaptation Reporting Power (ARP) mechanism (Jude et al., 2017), the forthcoming Third National Adaptation Programme (NAP, 2023–28) and the Government’s Roadmap towards mandatory climate-related disclosures (HM Treasury, 2020). Moreover, they are relevant for the UK’s COP26 team: the UK is hosting the 2021 United Nations Climate Change Conference (COP26) in Glasgow in November, which highlights adaptation to protect communities and natural habitats as one of its four key goals.

6
The adaptation policy context
Since the first PREPARE survey, the numerous national and international policy and reporting processes relating to climate adaptation and mitigation have evolved. Figure 1.1 shows the timing of a selection of the most high-profile of these, which provides some context for the interpretation of the survey findings.
National processes include the UK Climate Change Act of 2008, the development of the UK Climate Change Committee (CCC), two (soon to be three) Climate Change Risk Assessment (CCRA) reports, two iterations of the UK’s National Adaptation Programme (NAP), and two (soon to be three) rounds of the Adaptation Reporting Power (ARP) mechanism. And before a change of government in 2010, local authorities reported on a set of 198 National Indicators (NIs), one of which focused on adaptation – indicator NI188, “Planning to adapt to climate change”. While NI188 was only prioritised by one-third of local authorities, it was viewed as a strong driver of action (Boyd et al., 2011). These processes should be considered in tandem with sectoral developments, such as in the financial sector with the Task Force on Climate-related Financial Disclosures (TCFD), the UK’s Green Finance Strategy and UK Government’s Green Financing Framework (HM Treasury, 2021), and the Roadmap towards mandatory climate-related disclosures (HM Treasury, 2020).
Figure 1.1 also highlights several international processes, including the Paris Agreement and the various IPCC Assessment Reports.
Taken together, the notable weather extremes/trends, high profile events and sometimes directly relevant policy processes (e.g. the ARP reaches out to organisations and requires that they report on adaptation) provide a changing mix of potential influences on the experiences and perceptions of the survey respondents.
Figure 1.1. Selection of adaptation-related processes (UK and international) and influences, 2006–2023
Note: Abbreviations defined on p1. Source: Authors
7
Influences such as those shown in Figure 1.1 may act to either raise or reduce awareness and concern and enable action through supply (e.g. the provision of new information such as UK climate projections) or demand (e.g. the requirement for reporting such as the NI188 and ARP). For example, after the financial crisis in 2008, the UK implemented a series of cuts to local government and services, which eroded the institutional capacity and political will to prioritise long-term climate vulnerabilities (Porter et al., 2015). Between 2010 and 2015 the regulatory and planning framework underwent substantial changes with, among other things, decentralisation, a decline in specific guidance on climate change and major budget cuts (Lorenz et al., 2017). This included the closure of the Environment Agency’s Climate Ready service in 2016, just four years after its establishment in 2012.
High profile weather-related events and experiences may influence people’s beliefs about climate change, although effects are complex. 2020 marked the end of the warmest decade on record and 2020 itself was the second warmest year on record (Met Office, 2020). The UK experienced record-breaking temperatures during the summer of 2018, which was declared by the UK Met Office as the joint hottest on record alongside 2006, 2003 and 1976 (Met Office, 2018), and there were high-profile international climate impacts such as wildfires in California during October 2019. However, based on the results of the PREPARE-2 national public survey, Taylor et al. (2014) found respondents’ perceptions of changes in wet-weather-related events were a stronger predictor of climate change beliefs than hot-weather-related events.
Other notable possible influences include the direct-action campaign organised by Extinction Rebellion, a group that was particularly active in the UK during 2018 and 2019, and the high-profile School Strikes for Climate initiated by Greta Thunberg and actively supported in the UK.
A further possible factor is that in June 2019 the UK became the first high-emitting country to legislate for a net-zero target for carbon emissions by 2050.
It is not possible to control for any of these contextual factors and so we are unable to attribute any direct cause and effects within the results. However, they provide useful reference points when discussing the observed changes in perception over time and between regions and sectors (see Section 4).
Background to the PREPARE surveys Photo: Dylan Gillis, Unsplash
7
8
PREPARE – additional background
The Programme of Research on Preparedness, Adaptation and Risk (PREPARE) that ran between 2012 and 2013 was designed to support the UK Government in developing its strategy on climate change adaptation policy, in particular its statutory programme of adaptation policies under the Climate Change Act (2008), through building understanding of the:
• Barriers and enablers to organisational and sectoral adaptive capacity • Contribution and role of local and household-level adaptation • Climate risk resilience and adaptation expectations and motivations of the public • Public acceptability of adaptation approaches and implications for public communication • Equity and distributional impacts of climate change risks and adaptation options for citizens.
The work on organisational and sectoral adaptive capacity included a quantitative survey that built on a baseline survey carried out in 2009/10. The three surveys are described below, together with notable features of weather and climate and a summary of major policy processes and events that may have influenced the responses.
• PREPARE-1: 2010 quantitative survey, 8 December 2009–15 January 2010. A baseline survey conducted with 612 individuals in organisations across five sectors in England only. The 2013 PREPARE report notes that this was a period of heavy snowfall and very low temperatures throughout the UK. (The PREPARE-1 report is available online here.)
• PREPARE-2: 2013 quantitative survey, 10 December 2012–18 January 2013. This repeat survey was conducted with 1,976 individuals in organisations across five sectors (businesses, health authorities, local authorities, educational establishments, and third sector organisations) in all four UK nations. The period prior to PREPARE-2 was noted for widespread heavy flooding: the UK National Climate Information Centre notes that, for the UK overall, December 2012 was provisionally the wettest since 1999 with rainfall well above average (150%), and there was considerable disruption from flooding events in the run-up to Christmas (National Climate Information Centre, 2013). (The PREPARE-2 reports are available online here.)
• PREPARE-3: 2021 quantitative survey, 10 April–10 May 2021. This revisit survey was conducted with 2,429 individuals in organisations across five sectors in all four UK nations (but 2,164 of the respondents were located in England). The month of April 2021 was unusually cold, dry and sunny, noted for the number of air frosts, and likely the UK’s fourth driest April in a series from 1862 (Met Office, 2021). During this period the UK was just emerging from a third lockdown put in place to mitigate the ongoing Coronavirus pandemic, with 12 April being a key date in the calendar for the reopening of non-essential retail services. In general, the Coronavirus pandemic was playing an overriding role in global economic and social activities in this period, causing great concern to and impact on a wide range of sectors and services across all UK nations.

9
2. Methodology Survey design
To examine change over time, the PREPARE-3 survey repeated the questions from earlier PREPARE surveys that focused on understanding, awareness and action on climate change and adaptation. Whereas the 2013 PREPARE-2 survey was conducted using targeted telephone surveys, the PREPARE-3 survey used a market research online platform (see ‘Data collection’ in the Appendix). Twenty-two questions from the PREPARE-2 survey were retained for PREPARE-3, and only minimal changes made in places to the original wording. Since the original was a telephone survey, we adapted the response options to best suit multiple choice options for the 2021 online survey, maintaining open-ended questions where possible.
The 2021 PREPARE-3 survey consisted of 54 closed and open-ended questions. New questions addressed the availability and utility of climate information for organisational decision-making, perceptions on uncertainty in climate projections and views on organisational adaptive capacity. We also added questions that put climate change risks in the context of other risks that organisations faced. As in the earlier PREPARE surveys, the concepts of extreme weather event, adaptive capacity, uncertainty and impact were not defined, to reduce cognitive demand at the start of the survey and to avoid priming. However, we did include a brief description of the survey:
This survey is interested in organisations’ perceptions of risk, threats, and opportunities, as it relates to climate change and climate change adaptation. The results of this survey will be aggregated for use in academic research and journal publications.
In an optional/click-to text box, we included the following:
Different from the concept of climate change mitigation, which focuses on reducing carbon emissions, climate change adaptation means anticipating the adverse effects of climate change and taking appropriate action to prevent or minimise the damage these effects can cause, or taking advantage of opportunities that may arise.
The market research company was tasked with targeting respondents with functions/titles related to organisational planning (e.g. Planning or Risk Manager, Environmental Manager), with screening questions to identify suitable people. After piloting and quality control checks, post-survey screening and removals, the full sample was 2,429 individuals (48% identified as female, 52% identified as male and 0.1% opted not to indicate a gender). Due to differences in the sample collection methods between the 2013 and 2021 surveys and some changes in exactly how each of the five sectors is defined, there are limitations to comparing findings across the different survey phases (particularly with respect to applying statistical tests). Therefore, the surveys should be seen as snapshots in time, not as a longitudinal study.
Key features of the 2021 survey
• Conducted online
• 54 closed and open-ended questions
• Full sample of 2,429 individuals after piloting and quality control
• Targeted respondents with functions/titles related to organisational planning
• Repeated questions from 2013 survey and added new ones
- Repeated questions on understanding, awareness and action on climate change and adaptation
- New questions on availability and utility of climate information, perceptions of uncertainty in climate projections and views on organisational adaptive capacity
10
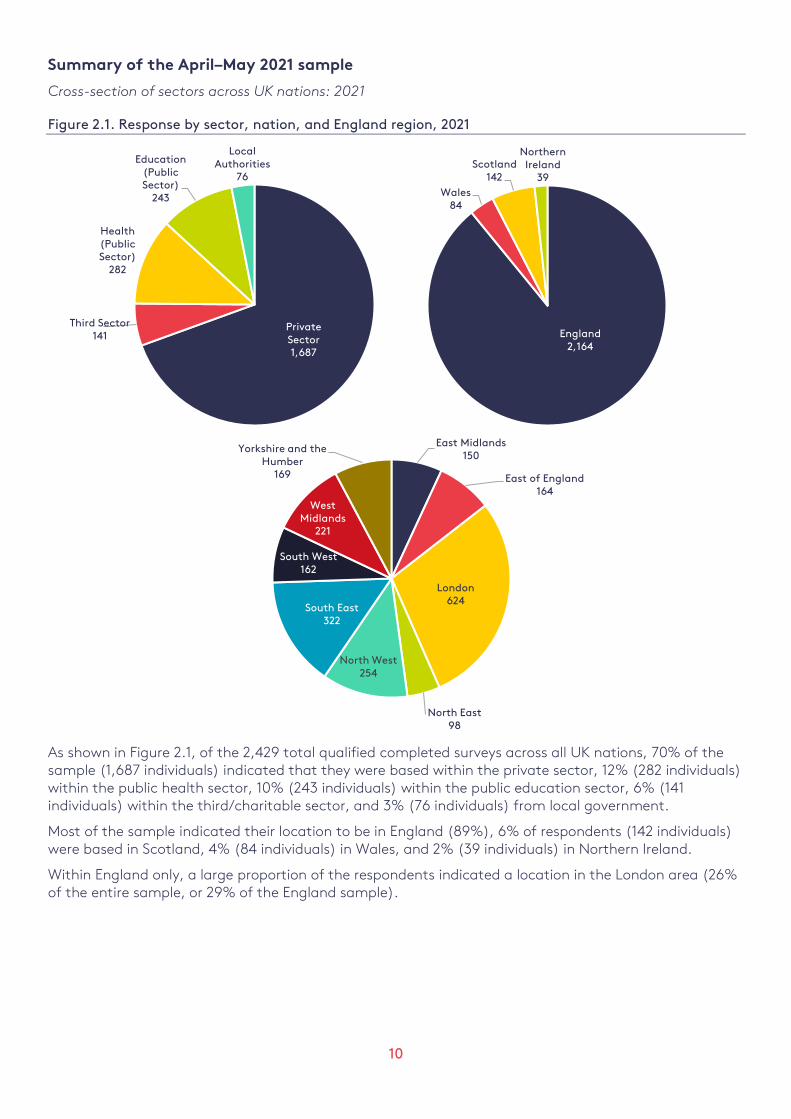
Summary of the April–May 2021 sample
Cross-section of sectors across UK nations: 2021
Figure 2.1. Response by sector, nation, and England region, 2021
As shown in Figure 2.1, of the 2,429 total qualified completed surveys across all UK nations, 70% of the sample (1,687 individuals) indicated that they were based within the private sector, 12% (282 individuals) within the public health sector, 10% (243 individuals) within the public education sector, 6% (141 individuals) within the third/charitable sector, and 3% (76 individuals) from local government.
Most of the sample indicated their location to be in England (89%), 6% of respondents (142 individuals) were based in Scotland, 4% (84 individuals) in Wales, and 2% (39 individuals) in Northern Ireland.
Within England only, a large proportion of the respondents indicated a location in the London area (26% of the entire sample, or 29% of the England sample).
Private Sector1,687
Third Sector141
Health (Public Sector)
282
Education (Public Sector)
243
Local Authorities
76
England2,164
Wales84
Scotland142
Northern Ireland
39
East Midlands150
East of England164
London624
North East98
North West254
South East322
South West162
West Midlands
221
Yorkshire and the Humber
169
11
Comparison of sectors across England: 2010, 2013, 2021
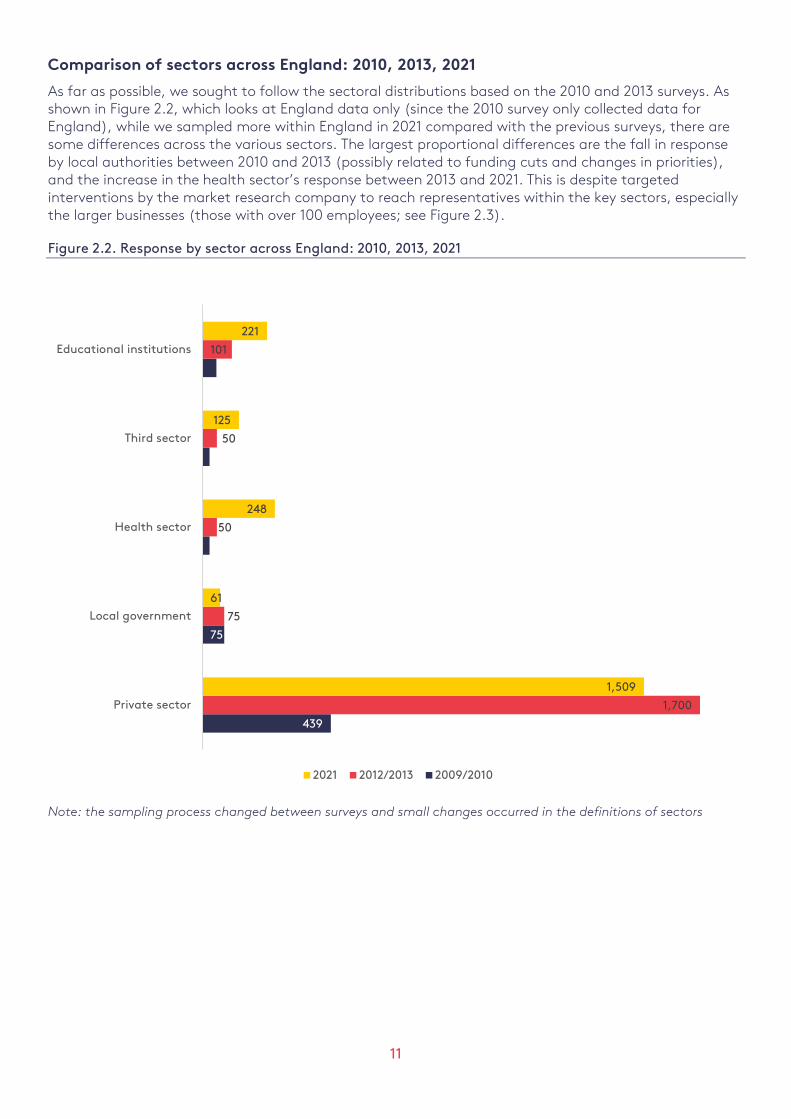
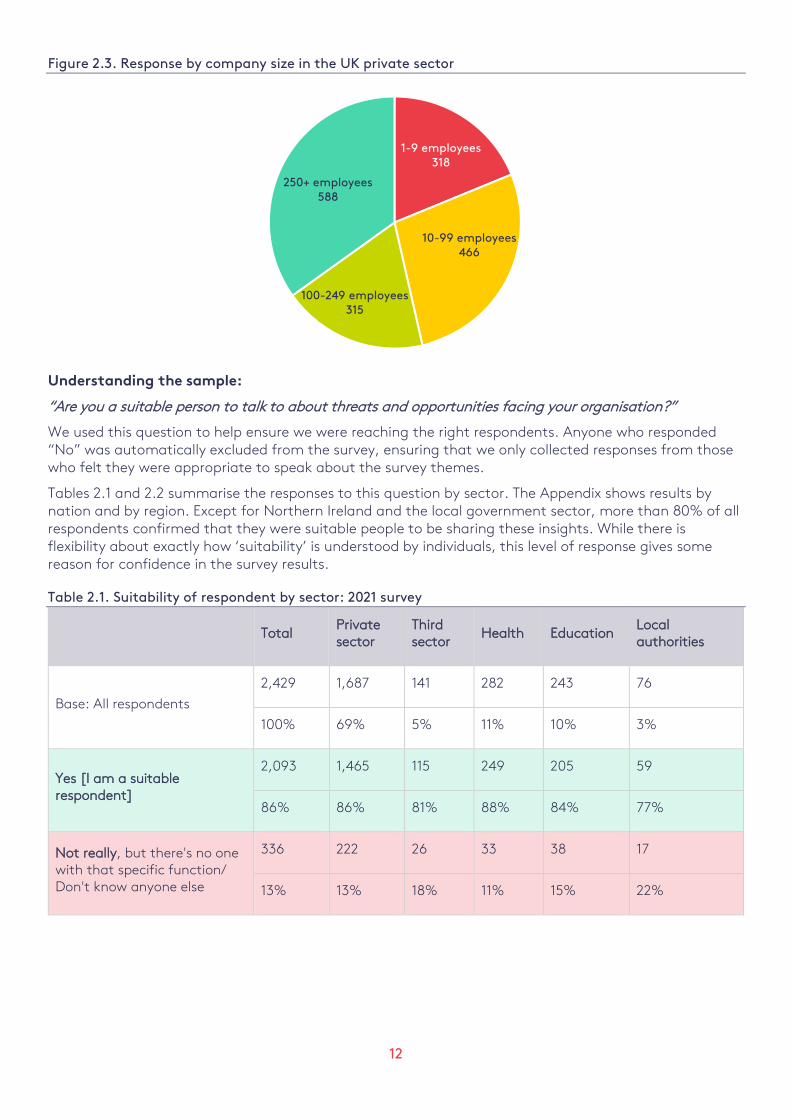
As far as possible, we sought to follow the sectoral distributions based on the 2010 and 2013 surveys. As shown in Figure 2.2, which looks at England data only (since the 2010 survey only collected data for England), while we sampled more within England in 2021 compared with the previous surveys, there are some differences across the various sectors. The largest proportional differences are the fall in response by local authorities between 2010 and 2013 (possibly related to funding cuts and changes in priorities), and the increase in the health sector’s response between 2013 and 2021. This is despite targeted interventions by the market research company to reach representatives within the key sectors, especially the larger businesses (those with over 100 employees; see Figure 2.3).
Figure 2.2. Response by sector across England: 2010, 2013, 2021
Note: the sampling process changed between surveys and small changes occurred in the definitions of sectors
439
75
25
25
48
1,700
75
50
50
101
1,509
61
248
125
221
Private sector
Local government
Health sector
Third sector
Educational institutions
2021 2012/2013 2009/2010
12
Figure 2.3. Response by company size in the UK private sector
Understanding the sample:
“Are you a suitable person to talk to about threats and opportunities facing your organisation?”
We used this question to help ensure we were reaching the right respondents. Anyone who responded “No” was automatically excluded from the survey, ensuring that we only collected responses from those who felt they were appropriate to speak about the survey themes.
Tables 2.1 and 2.2 summarise the responses to this question by sector. The Appendix shows results by nation and by region. Except for Northern Ireland and the local government sector, more than 80% of all respondents confirmed that they were suitable people to be sharing these insights. While there is flexibility about exactly how ‘suitability’ is understood by individuals, this level of response gives some reason for confidence in the survey results.
Table 2.1. Suitability of respondent by sector: 2021 survey
Total Private sector
Third sector
Health Education Local authorities
Base: All respondents
2,429 1,687 141 282 243 76
100% 69% 5% 11% 10% 3%
Yes [I am a suitable respondent]
2,093 1,465 115 249 205 59
86% 86% 81% 88% 84% 77%
Not really, but there's no one with that specific function/ Don't know anyone else
336 222 26 33 38 17
13% 13% 18% 11% 15% 22%
1-9 employees318
10-99 employees466
100-249 employees315
250+ employees588

13
Understanding the sample:
“What is your level of confidence in answering these questions?”
At the end of the 2021 survey, we asked respondents to self-assess their level of confidence in answering the questions. Table 2.2 highlights that 61% felt very confident in their responses, although there were some variations between sector and regions (see Appendix – although no major issues are apparent). Low confidence in answers was expressed by only 2% of the total sample. Given the demands of the survey and presence of some technical or obscure material, this gives further assurance of the suitability of the sample respondents.
Table 2.2. Confidence of respondent by sector: 2021 survey
Total Private sector
Third sector
Health Education Local authorities
Base: All respondents
2,429 1,687 141 282 243 76
100% 69% 5% 11% 10% 3%
I am very confident in my responses
1,489 1,056 87 174 132 40
61% 62% 61% 61% 54% 52%
I am somewhat confident in my responses
878 590 49 105 101 33
36% 35% 34% 37% 41% 43%
I am not very confident in my responses
56 37 3 3 10 3
2% 2% 2% 1% 4% 3%
Don't know
6 4 2 - - -
0.2% 0.2% 1% - - -
14
3. Headline findings This section presents the main findings for a selection of survey questions asked in the PREPARE-3 survey, 2021. We first highlight the 2021 results for the four UK nations (England, Scotland, Wales and Northern Ireland) across all five sectors (private sector/businesses, third sector, public health, public education, and third sector/charitable organisations). Next, where of interest, we indicate the breakdown by sector. If the question was a repeat of the 2013 PREPARE-2 survey, we compare results across the three surveys. In a few cases, we also show the 2021 data by region (i.e. across the UK as well as across England).
Below, we cover results on:
• General risk awareness
• Extreme weather event risk and impact
• Use of climate information
• Perceptions of adaptation planning and action
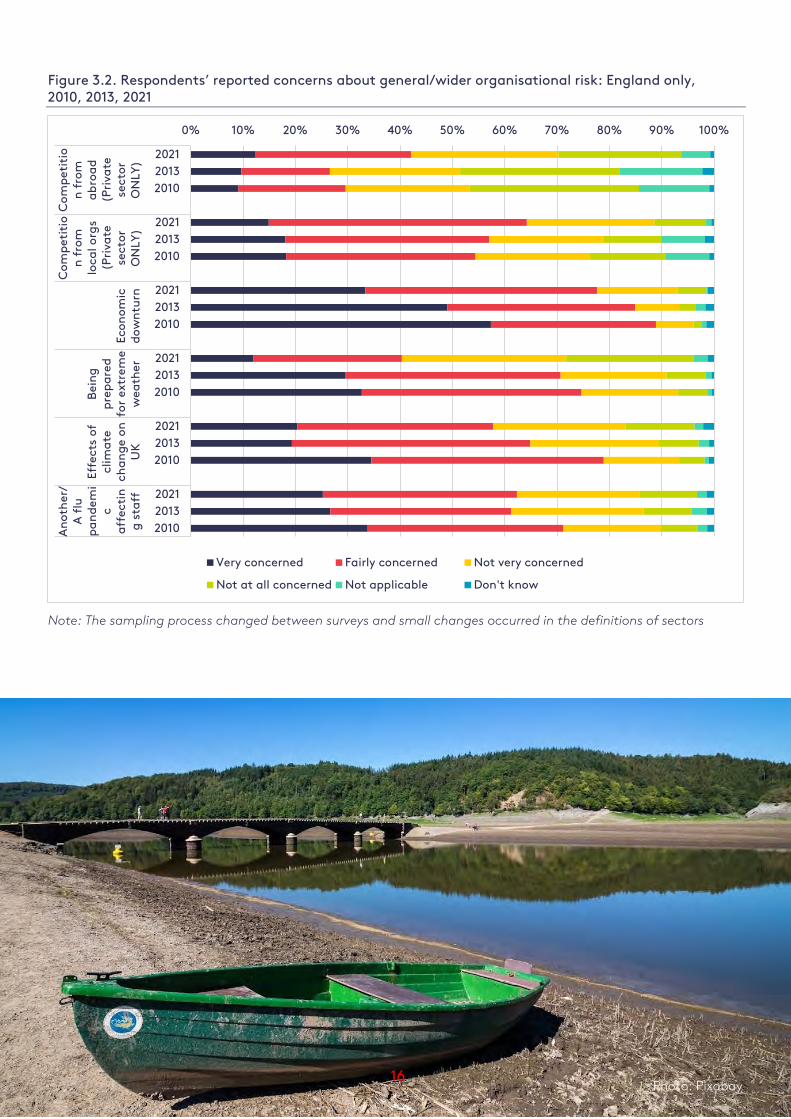
i) Concerns about general/wider organisational risks
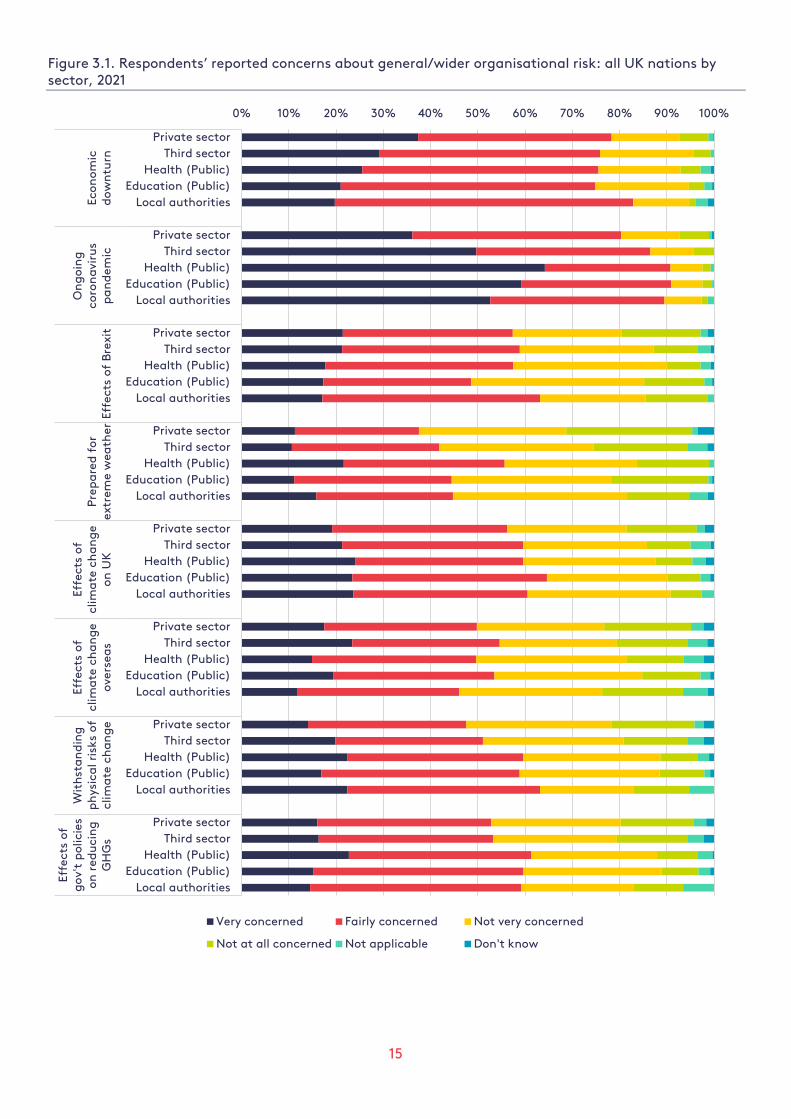
The first question on the survey focused on general/wider organisational risks, asking: To what extent, if at all, is your organisation currently concerned about the following [risks]? As shown in Figure 3.1, for all UK nations and all sectors in 2021, 83% of the full sample of respondents indicated that their organisation was either very or fairly concerned about the ongoing Coronavirus pandemic. 78% of respondents mentioned concern about the economic downturn, and 54% of private sector respondents noted concern about competition from local organisations. Concern for the effects of climate change on the UK was indicated by 58%.
By sector, as shown in Figure 3.1 (2021 data for all UK nations), respondents from organisations in all five sectors indicated the most concern – high or fair – about the Coronavirus pandemic, with concern about the economic downturn coming a close second. Slight differences between concerns by sector are also noted, with the private sector respondents showing relatively less concern than the public sector respondents about environmental/climate change issues such as the effects of climate change in the UK, being prepared for extreme weather, the ability to withstand the physical risks of climate change, and the effects of government policy to reduce greenhouse gas emissions (e.g. net-zero targets). While the different sectors show fairly similar levels of concern about these risks, preparedness for extreme weather was specifically indicated by the public health sector as a concern.
Over time, as shown in Figure 3.2 (for England only), while the private sector indicates marked increases in concern about competition, both from abroad and from local organisations (which could be likely due to the fallout from Brexit and the uncertainty of new/unknown trade deal details), there was a moderate decrease in concern about the economic downturn. Particular declines in concern about environmental/climate change issues can be seen, too. Overall, concern about the effects of climate change on the UK fell from a high of 79% in 2010, to 65% in 2013, to a low of 58% in 2021. In addition, concern about being prepared in case of extreme weather was at its highest in 2010 (75%), tapering slightly in 2013 to 71%, before declining to the 2021 level of 40%. Responses to new questions in PREPARE-3 showed levels of concern ranked as follows: the Coronavirus pandemic received the highest level of concern out of all issues, the effects of government policy to reduce greenhouse gas emissions (e.g. net-zero targets) came next, and the ability to withstand the physical risks of climate change (e.g. flooding and heat), and then the effects of climate change overseas, followed.
15
Figure 3.1. Respondents’ reported concerns about general/wider organisational risk: all UK nations by sector, 2021
0% 10% 20% 30% 40% 50% 60% 70% 80% 90% 100%
Private sectorThird sector
Health (Public)Education (Public)
Local authorities
Private sectorThird sector
Health (Public)Education (Public)
Local authorities
Private sectorThird sector
Health (Public)Education (Public)
Local authorities
Private sectorThird sector
Health (Public)Education (Public)
Local authorities
Private sectorThird sector
Health (Public)Education (Public)
Local authorities
Private sectorThird sector
Health (Public)Education (Public)
Local authorities
Private sectorThird sector
Health (Public)Education (Public)
Local authorities
Private sectorThird sector
Health (Public)Education (Public)
Local authorities
Econ
omic
dow
ntu
rn
On
goi
ng
coro
na
viru
sp
an
dem
icEf
fect
s of
Bre
xit
Pre
pa
red
for
extr
eme
wea
ther
Effe
cts
ofcl
ima
te c
ha
ng
eon
UK
Effe
cts
ofcl
ima
te c
ha
ng
eov
erse
as
Wit
hst
an
din
gp
hys
ica
l ris
ks o
fcl
ima
te c
ha
ng
e
Effe
cts
ofg
ov't
pol
icie
son
red
uci
ng
GH
Gs
Very concerned Fairly concerned Not very concerned
Not at all concerned Not applicable Don't know
16
Figure 3.2. Respondents’ reported concerns about general/wider organisational risk: England only, 2010, 2013, 2021
Note: The sampling process changed between surveys and small changes occurred in the definitions of sectors
ii) Personal awareness of climate change
0% 10% 20% 30% 40% 50% 60% 70% 80% 90% 100%
202120132010
202120132010
202120132010
202120132010
202120132010
202120132010
Com
pet
itio
n f
rom
ab
roa
d(P
riva
tese
ctor
ON
LY)
Com
pet
itio
n f
rom
loca
l org
s(P
riva
tese
ctor
ON
LY)
Econ
omic
dow
ntu
rn
Bei
ng
pre
pa
red
for
extr
eme
wea
ther
Effe
cts
ofcl
ima
tech
an
ge
onU
K
An
oth
er/
A f
lup
an
dem
ic
aff
ecti
ng
sta
ff
Very concerned Fairly concerned Not very concerned
Not at all concerned Not applicable Don't know
16 Photo: Pixabay
17
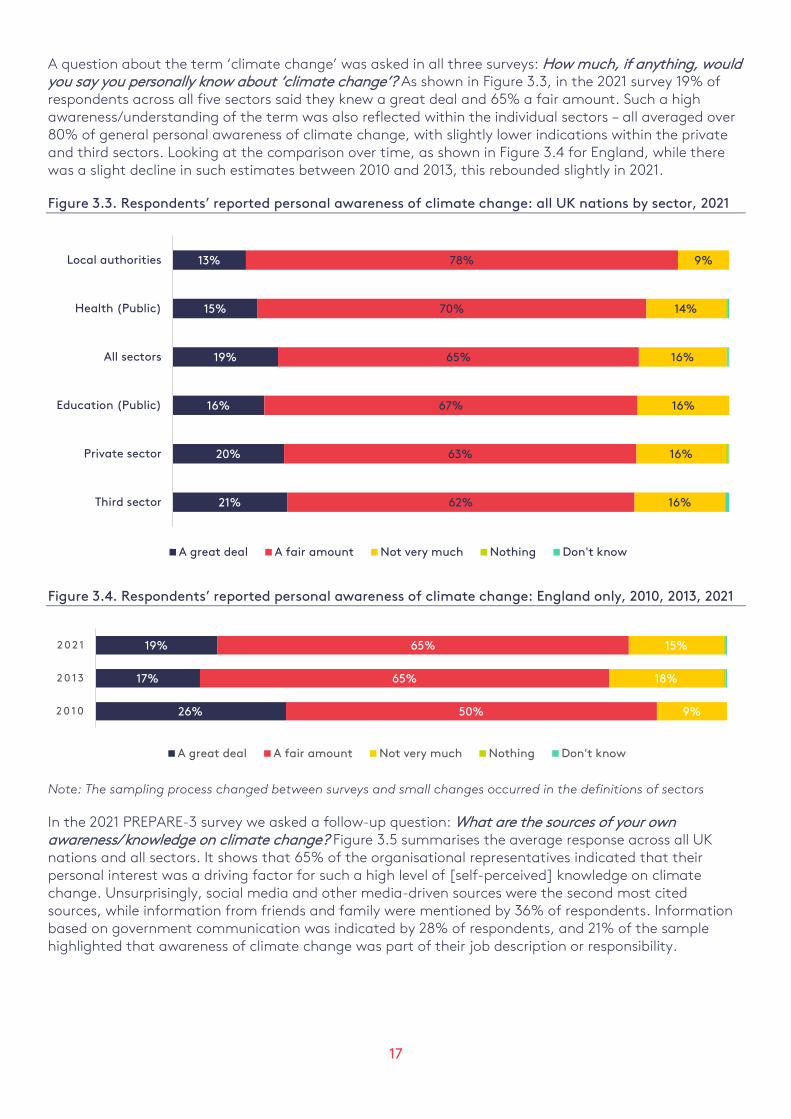
A question about the term ‘climate change’ was asked in all three surveys: How much, if anything, would you say you personally know about ‘climate change’? As shown in Figure 3.3, in the 2021 survey 19% of respondents across all five sectors said they knew a great deal and 65% a fair amount. Such a high awareness/understanding of the term was also reflected within the individual sectors – all averaged over 80% of general personal awareness of climate change, with slightly lower indications within the private and third sectors. Looking at the comparison over time, as shown in Figure 3.4 for England, while there was a slight decline in such estimates between 2010 and 2013, this rebounded slightly in 2021.
Figure 3.3. Respondents’ reported personal awareness of climate change: all UK nations by sector, 2021
Figure 3.4. Respondents’ reported personal awareness of climate change: England only, 2010, 2013, 2021
Note: The sampling process changed between surveys and small changes occurred in the definitions of sectors
In the 2021 PREPARE-3 survey we asked a follow-up question: What are the sources of your own awareness/knowledge on climate change? Figure 3.5 summarises the average response across all UK nations and all sectors. It shows that 65% of the organisational representatives indicated that their personal interest was a driving factor for such a high level of [self-perceived] knowledge on climate change. Unsurprisingly, social media and other media-driven sources were the second most cited sources, while information from friends and family were mentioned by 36% of respondents. Information based on government communication was indicated by 28% of respondents, and 21% of the sample highlighted that awareness of climate change was part of their job description or responsibility.
13%
15%
19%
16%
20%
21%
78%
70%
65%
67%
63%
62%
9%
14%
16%
16%
16%
16%
Local authorities
Health (Public)
All sectors
Education (Public)
Private sector
Third sector
A great deal A fair amount Not very much Nothing Don't know
26%
17%
19%
50%
65%
65%
9%
18%
15%
2 0 1 0
2 0 1 3
2 0 2 1
A great deal A fair amount Not very much Nothing Don't know
18
Figure 3.5. Sources of personal awareness of climate change: all UK nations, all sectors, 2021
iii) Perceptions of threats and opportunities from extreme weather events
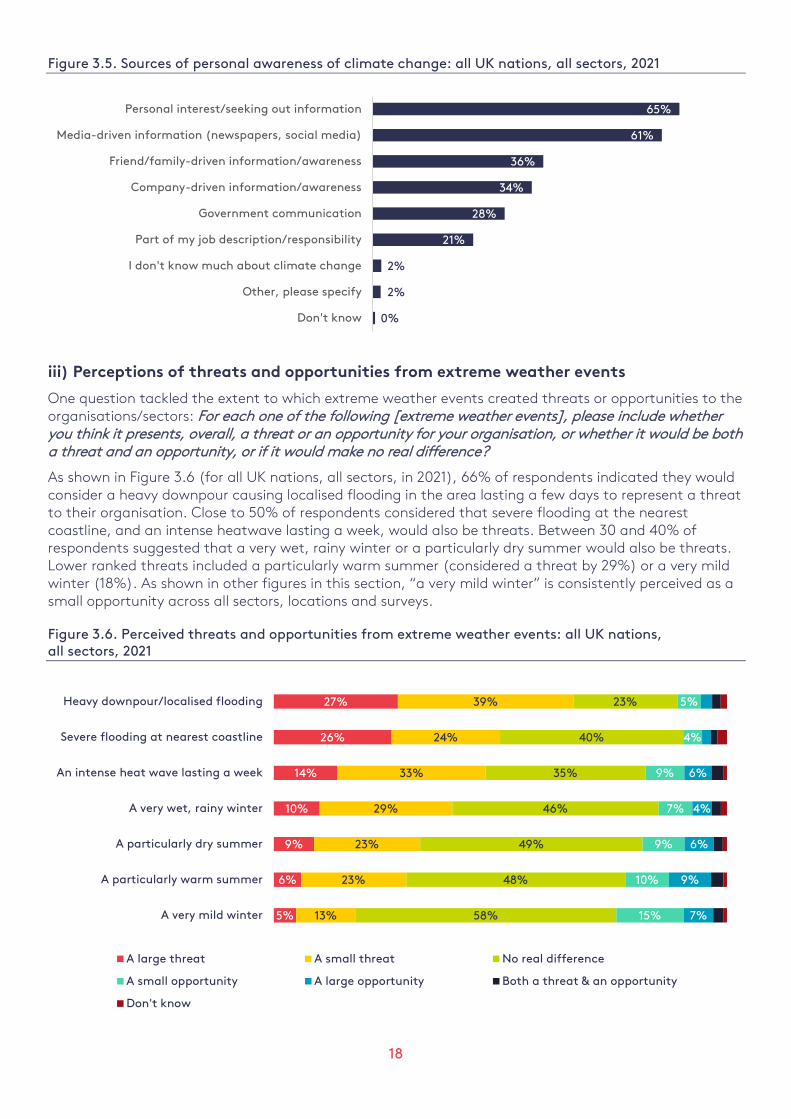
One question tackled the extent to which extreme weather events created threats or opportunities to the organisations/sectors: For each one of the following [extreme weather events], please include whether you think it presents, overall, a threat or an opportunity for your organisation, or whether it would be both a threat and an opportunity, or if it would make no real difference?
As shown in Figure 3.6 (for all UK nations, all sectors, in 2021), 66% of respondents indicated they would consider a heavy downpour causing localised flooding in the area lasting a few days to represent a threat to their organisation. Close to 50% of respondents considered that severe flooding at the nearest coastline, and an intense heatwave lasting a week, would also be threats. Between 30 and 40% of respondents suggested that a very wet, rainy winter or a particularly dry summer would also be threats. Lower ranked threats included a particularly warm summer (considered a threat by 29%) or a very mild winter (18%). As shown in other figures in this section, “a very mild winter” is consistently perceived as a small opportunity across all sectors, locations and surveys.
Figure 3.6. Perceived threats and opportunities from extreme weather events: all UK nations, all sectors, 2021
65%
61%
36%
34%
28%
21%
2%
2%
0%
Personal interest/seeking out information
Media-driven information (newspapers, social media)
Friend/family-driven information/awareness
Company-driven information/awareness
Government communication
Part of my job description/responsibility
I don't know much about climate change
Other, please specify
Don't know
27%
26%
14%
10%
9%
6%
5%
39%
24%
33%
29%
23%
23%
13%
23%
40%
35%
46%
49%
48%
58%
5%
4%
9%
7%
9%
10%
15%
6%
4%
6%
9%
7%
Heavy downpour/localised flooding
Severe flooding at nearest coastline
An intense heat wave lasting a week
A very wet, rainy winter
A particularly dry summer
A particularly warm summer
A very mild winter
A large threat A small threat No real difference
A small opportunity A large opportunity Both a threat & an opportunity
Don't know
19
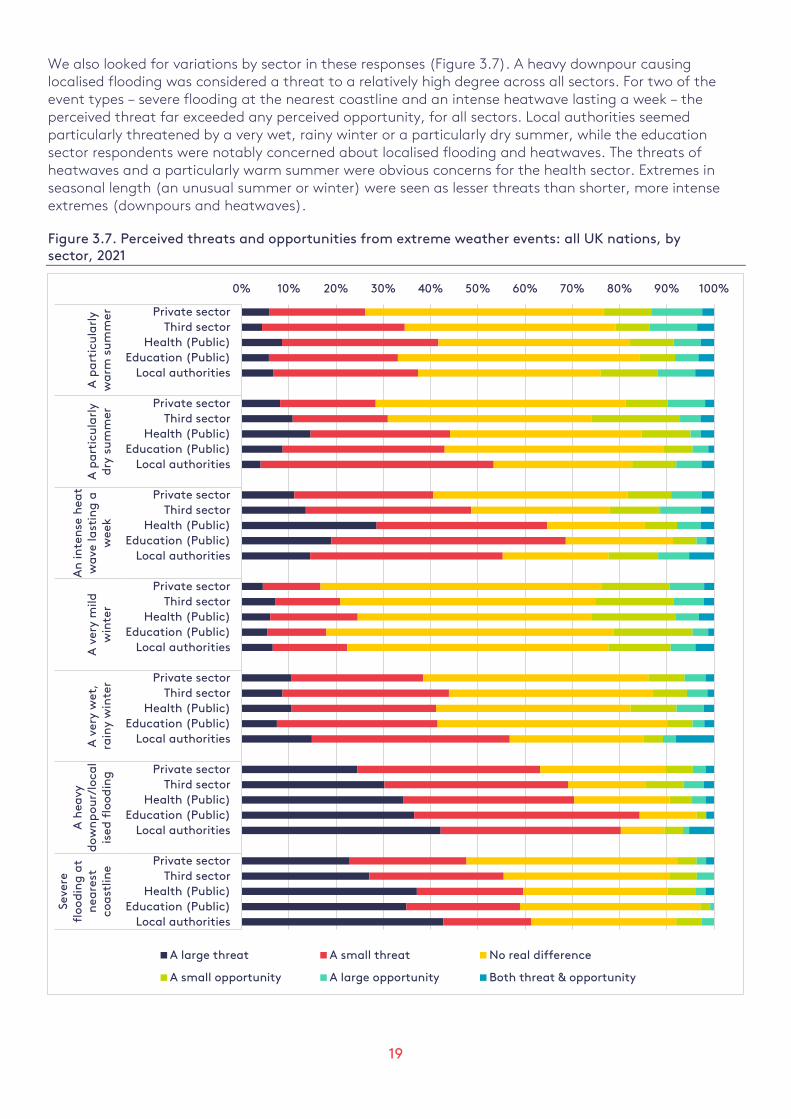
We also looked for variations by sector in these responses (Figure 3.7). A heavy downpour causing localised flooding was considered a threat to a relatively high degree across all sectors. For two of the event types – severe flooding at the nearest coastline and an intense heatwave lasting a week – the perceived threat far exceeded any perceived opportunity, for all sectors. Local authorities seemed particularly threatened by a very wet, rainy winter or a particularly dry summer, while the education sector respondents were notably concerned about localised flooding and heatwaves. The threats of heatwaves and a particularly warm summer were obvious concerns for the health sector. Extremes in seasonal length (an unusual summer or winter) were seen as lesser threats than shorter, more intense extremes (downpours and heatwaves).
Figure 3.7. Perceived threats and opportunities from extreme weather events: all UK nations, by sector, 2021
0% 10% 20% 30% 40% 50% 60% 70% 80% 90% 100%
Private sectorThird sector
Health (Public)Education (Public)
Local authorities
Private sectorThird sector
Health (Public)Education (Public)
Local authorities
Private sectorThird sector
Health (Public)Education (Public)
Local authorities
Private sectorThird sector
Health (Public)Education (Public)
Local authorities
Private sectorThird sector
Health (Public)Education (Public)
Local authorities
Private sectorThird sector
Health (Public)Education (Public)
Local authorities
Private sectorThird sector
Health (Public)Education (Public)
Local authorities
A p
art
icu
larl
yw
arm
su
mm
erA
pa
rtic
ula
rly
dry
su
mm
er
An
inte
nse
hea
tw
ave
last
ing
aw
eek
A v
ery
mild
win
ter
A v
ery
wet
,ra
iny
win
ter
A h
eavy
dow
np
our/
loca
lis
ed f
lood
ing
Seve
refl
ood
ing
at
nea
rest
coa
stlin
e
A large threat A small threat No real difference
A small opportunity A large opportunity Both threat & opportunity
20
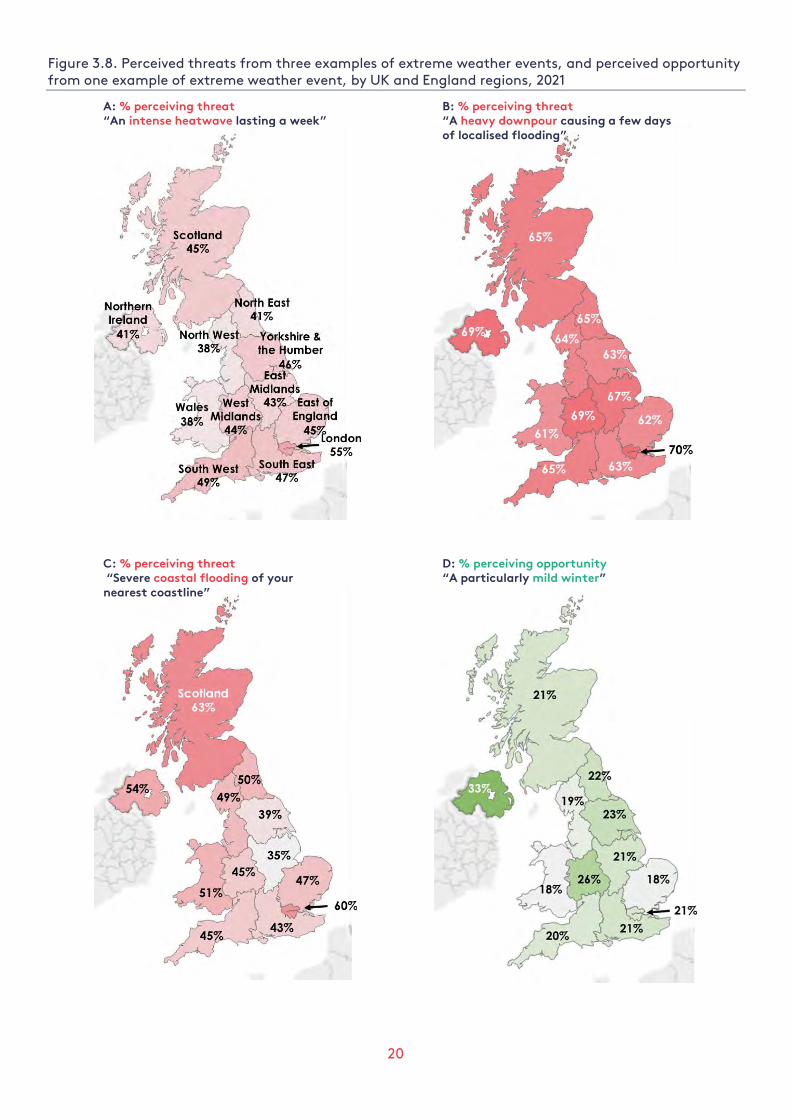
Figure 3.8. Perceived threats from three examples of extreme weather events, and perceived opportunity from one example of extreme weather event, by UK and England regions, 2021
A: % perceiving threat “An intense heatwave lasting a week”
B: % perceiving threat “A heavy downpour causing a few days of localised flooding”
C: % perceiving threat “Severe coastal flooding of your nearest coastline”
D: % perceiving opportunity “A particularly mild winter”

21
Figure 3.8 above illustrates the percentage of respondents in the different UK nations and English regions who said they perceived three examples of extreme weather to be a threat and the percentage perceiving another example to be an opportunity. Respondents based in Northern Ireland showed a particularly high level of concern about the threats from localised flooding and particularly dry summers compared with those in the other UK nations. Respondents from Scotland showed particular concern about threats from coastal flooding and very wet rainy winters; very wet winters were also especially mentioned by respondents from Wales, and regionally, from the South East and West Midlands. Respondents from the London area were more (in many cases much more) likely to perceive all extreme events as threats relative to respondents from other regions in England. While heavy downpour events were consistently considered to be the highest threat across all English regions, there was particular concern about this type of event in the West Midlands. Perception of the threat of severe coastal flooding was lowest in East Midlands and Yorkshire and the Humber.
Figure 3.9 shows responses over time from the three surveys, for England only. In 2021, there was a notable increase in the threat perceived to come from severe flooding at the nearest coastline. More respondents in 2021 also indicated a particularly dry summer, an intense heatwave lasting a week, a particularly warm summer, and a very mild winter to be threats (mild winters received the lowest threat rating in all three surveys). Interestingly, there were declines in the perception of threats of events such as localised flooding and a very wet rainy winter, perhaps due to April 2021 being described as an unusually cold, dry and sunny month.
Figure 3.9. Perceived threats and opportunities from extreme weather events: England only, 2010, 2013, 2021
Note: The sampling process changed between surveys and small changes occurred in the definitions of sectors
0% 10% 20% 30% 40% 50% 60% 70% 80% 90% 100%
2021
2013
2010
2021
2013
2010
2021
2013
2010
2021
2013
2010
2021
2013
2010
2021
2013
2010
2021
2013
2010
Ap
art
icul
arly
wa
rmsu
mm
er
Ap
art
icul
arly
dry
sum
mer
An
inte
nse
hea
t w
ave
last
ing
aw
eek
A v
ery
mild
win
ter
A v
ery
wet
,ra
iny
win
ter
A h
eavy
dow
np
our
/lo
calis
edfl
ood
ing
Seve
refl
ood
ing
at
nea
rest
coa
stlin
e
A large threat A small threat No real difference
A small opportunity A large opportunity Both threat & opportunity
22
iv) Recent experiences of impacts from extreme weather events
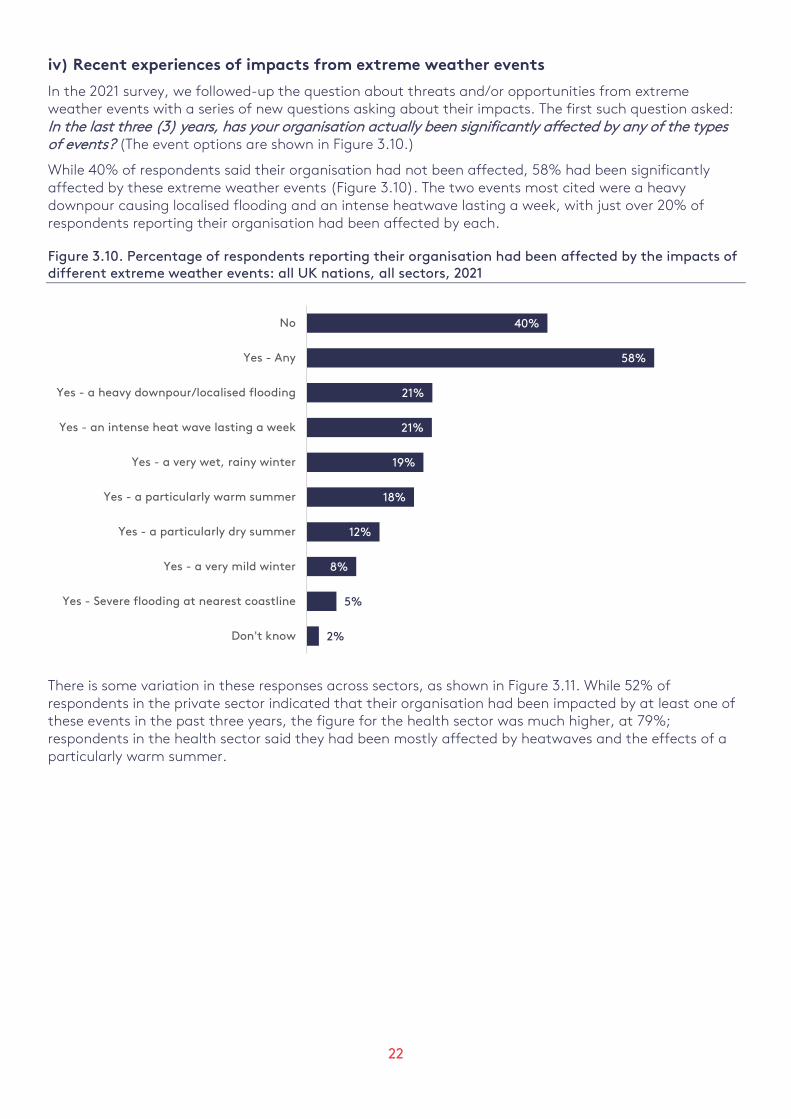
In the 2021 survey, we followed-up the question about threats and/or opportunities from extreme weather events with a series of new questions asking about their impacts. The first such question asked: In the last three (3) years, has your organisation actually been significantly affected by any of the types of events? (The event options are shown in Figure 3.10.)
While 40% of respondents said their organisation had not been affected, 58% had been significantly affected by these extreme weather events (Figure 3.10). The two events most cited were a heavy downpour causing localised flooding and an intense heatwave lasting a week, with just over 20% of respondents reporting their organisation had been affected by each.
Figure 3.10. Percentage of respondents reporting their organisation had been affected by the impacts of different extreme weather events: all UK nations, all sectors, 2021
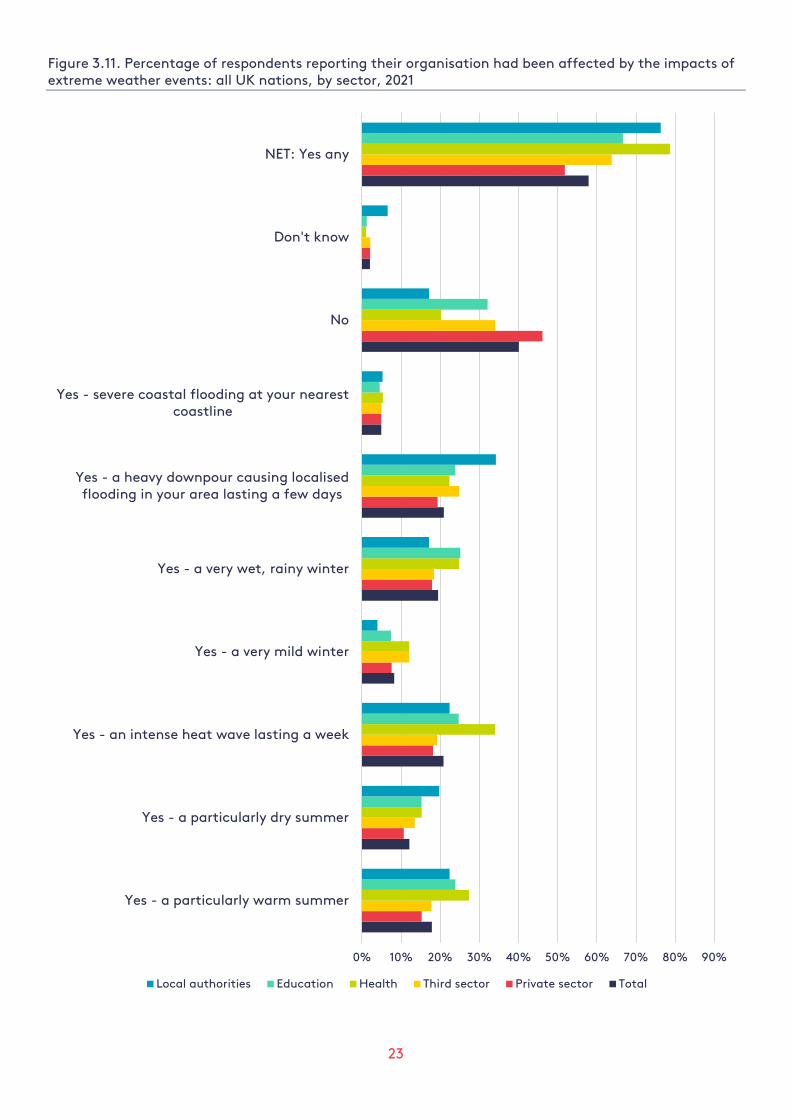
There is some variation in these responses across sectors, as shown in Figure 3.11. While 52% of respondents in the private sector indicated that their organisation had been impacted by at least one of these events in the past three years, the figure for the health sector was much higher, at 79%; respondents in the health sector said they had been mostly affected by heatwaves and the effects of a particularly warm summer.
40%
58%
21%
21%
19%
18%
12%
8%
5%
2%
No
Yes - Any
Yes - a heavy downpour/localised flooding
Yes - an intense heat wave lasting a week
Yes - a very wet, rainy winter
Yes - a particularly warm summer
Yes - a particularly dry summer
Yes - a very mild winter
Yes - Severe flooding at nearest coastline
Don't know
23
Figure 3.11. Percentage of respondents reporting their organisation had been affected by the impacts of extreme weather events: all UK nations, by sector, 2021
0% 10% 20% 30% 40% 50% 60% 70% 80% 90%
Yes - a particularly warm summer
Yes - a particularly dry summer
Yes - an intense heat wave lasting a week
Yes - a very mild winter
Yes - a very wet, rainy winter
Yes - a heavy downpour causing localisedflooding in your area lasting a few days
Yes - severe coastal flooding at your nearestcoastline
No
Don't know
NET: Yes any
Local authorities Education Health Third sector Private sector Total
24
Figure 3.12. Percentage of respondents reporting their organisation had been affected by the impacts of extreme weather events: England, all sectors, 2021 and 2013
Note: The sampling process changed between surveys and small changes occurred in the definitions of sectors
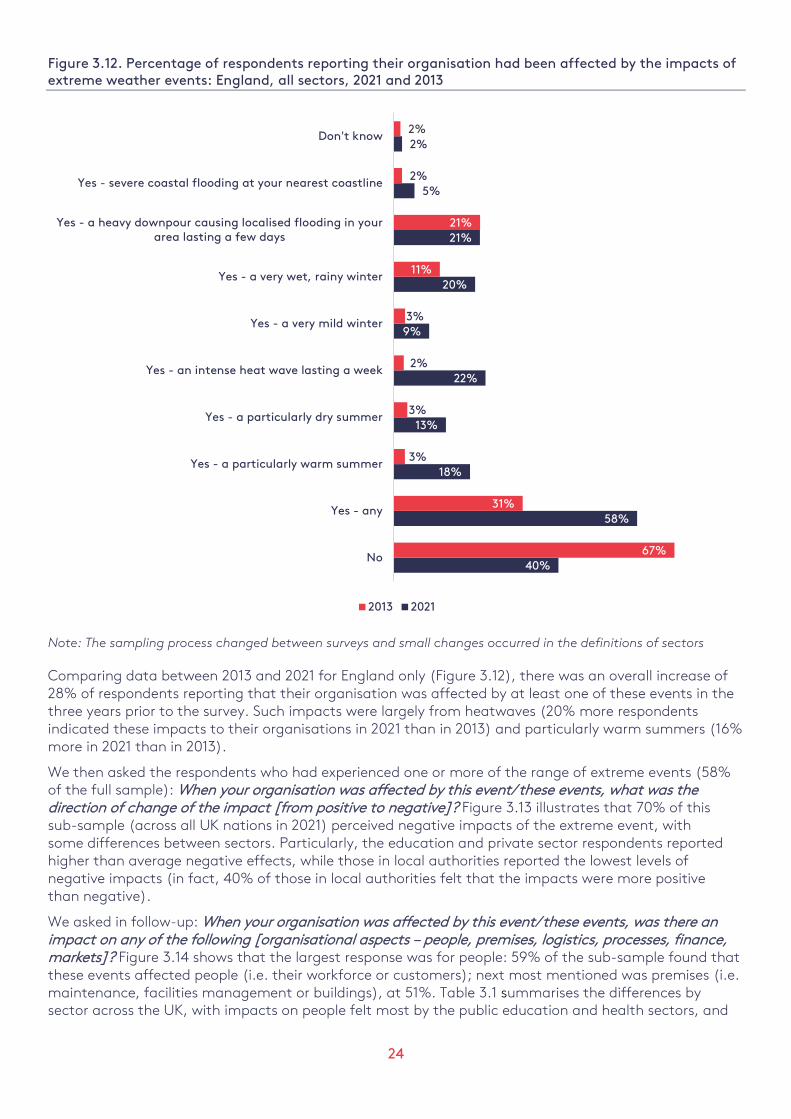
Comparing data between 2013 and 2021 for England only (Figure 3.12), there was an overall increase of 28% of respondents reporting that their organisation was affected by at least one of these events in the three years prior to the survey. Such impacts were largely from heatwaves (20% more respondents indicated these impacts to their organisations in 2021 than in 2013) and particularly warm summers (16% more in 2021 than in 2013).
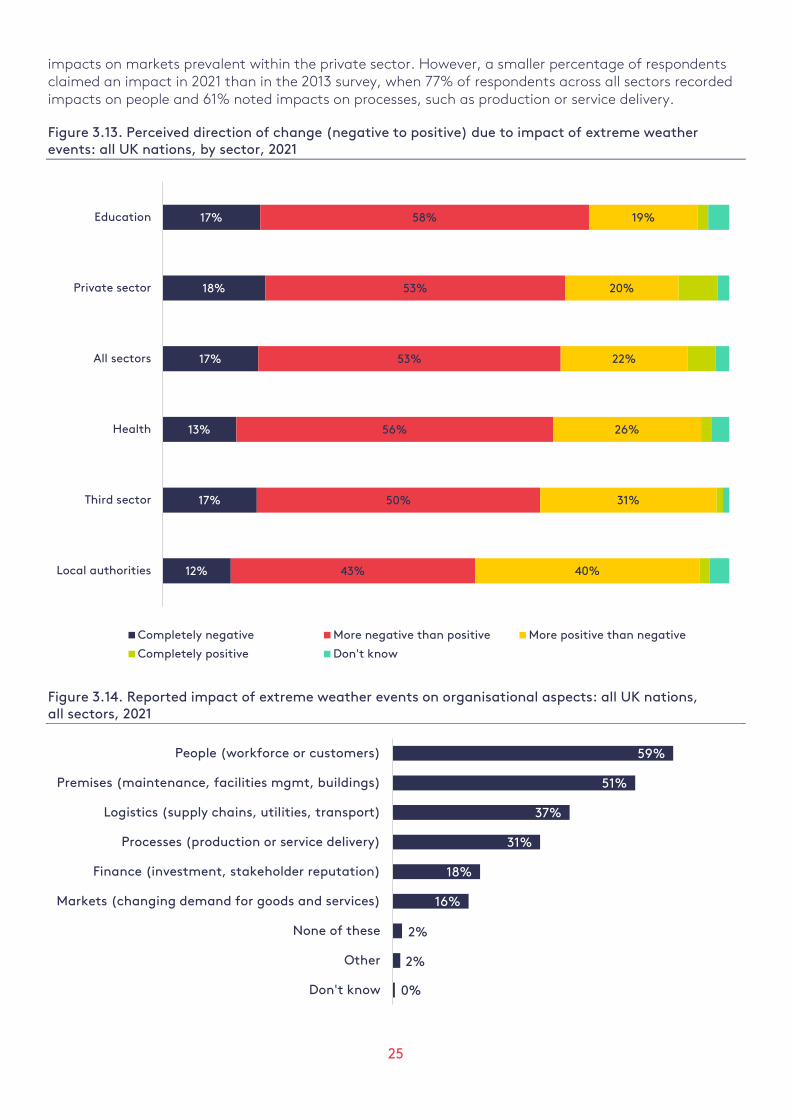
We then asked the respondents who had experienced one or more of the range of extreme events (58% of the full sample): When your organisation was affected by this event/ these events, what was the direction of change of the impact [from positive to negative]? Figure 3.13 illustrates that 70% of this sub-sample (across all UK nations in 2021) perceived negative impacts of the extreme event, with some differences between sectors. Particularly, the education and private sector respondents reported higher than average negative effects, while those in local authorities reported the lowest levels of negative impacts (in fact, 40% of those in local authorities felt that the impacts were more positive than negative).
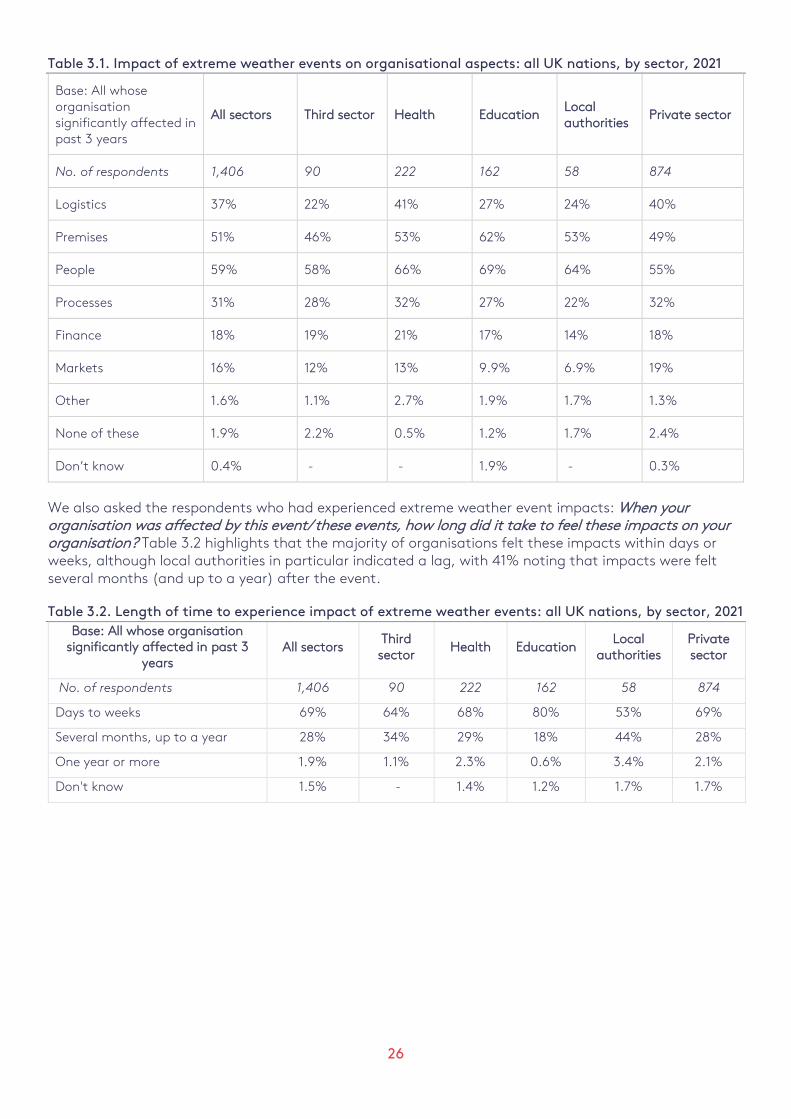
We asked in follow-up: When your organisation was affected by this event/these events, was there an impact on any of the following [organisational aspects – people, premises, logistics, processes, finance, markets]? Figure 3.14 shows that the largest response was for people: 59% of the sub-sample found that these events affected people (i.e. their workforce or customers); next most mentioned was premises (i.e. maintenance, facilities management or buildings), at 51%. Table 3.1 summarises the differences by sector across the UK, with impacts on people felt most by the public education and health sectors, and
40%
58%
18%
13%
22%
9%
20%
21%
5%
2%
67%
31%
3%
3%
2%
3%
11%
21%
2%
2%
No
Yes - any
Yes - a particularly warm summer
Yes - a particularly dry summer
Yes - an intense heat wave lasting a week
Yes - a very mild winter
Yes - a very wet, rainy winter
Yes - a heavy downpour causing localised flooding in yourarea lasting a few days
Yes - severe coastal flooding at your nearest coastline
Don't know
2013 2021
25
impacts on markets prevalent within the private sector. However, a smaller percentage of respondents claimed an impact in 2021 than in the 2013 survey, when 77% of respondents across all sectors recorded impacts on people and 61% noted impacts on processes, such as production or service delivery.
Figure 3.13. Perceived direction of change (negative to positive) due to impact of extreme weather events: all UK nations, by sector, 2021
Figure 3.14. Reported impact of extreme weather events on organisational aspects: all UK nations, all sectors, 2021
17%
18%
17%
13%
17%
12%
58%
53%
53%
56%
50%
43%
19%
20%
22%
26%
31%
40%
Education
Private sector
All sectors
Health
Third sector
Local authorities
Completely negative More negative than positive More positive than negative
Completely positive Don't know
59%
51%
37%
31%
18%
16%
2%
2%
0%
People (workforce or customers)
Premises (maintenance, facilities mgmt, buildings)
Logistics (supply chains, utilities, transport)
Processes (production or service delivery)
Finance (investment, stakeholder reputation)
Markets (changing demand for goods and services)
None of these
Other
Don't know
26
Table 3.1. Impact of extreme weather events on organisational aspects: all UK nations, by sector, 2021
Base: All whose organisation significantly affected in past 3 years
All sectors Third sector Health Education Local authorities
Private sector
No. of respondents 1,406 90 222 162 58 874
Logistics 37% 22% 41% 27% 24% 40%
Premises 51% 46% 53% 62% 53% 49%
People 59% 58% 66% 69% 64% 55%
Processes 31% 28% 32% 27% 22% 32%
Finance 18% 19% 21% 17% 14% 18%
Markets 16% 12% 13% 9.9% 6.9% 19%
Other 1.6% 1.1% 2.7% 1.9% 1.7% 1.3%
None of these 1.9% 2.2% 0.5% 1.2% 1.7% 2.4%
Don’t know 0.4% - - 1.9% - 0.3%
We also asked the respondents who had experienced extreme weather event impacts: When your organisation was affected by this event/ these events, how long did it take to feel these impacts on your organisation? Table 3.2 highlights that the majority of organisations felt these impacts within days or weeks, although local authorities in particular indicated a lag, with 41% noting that impacts were felt several months (and up to a year) after the event.
Table 3.2. Length of time to experience impact of extreme weather events: all UK nations, by sector, 2021 Base: All whose organisation
significantly affected in past 3 years
All sectors Third sector
Health Education Local
authorities Private sector
No. of respondents 1,406 90 222 162 58 874
Days to weeks 69% 64% 68% 80% 53% 69%
Several months, up to a year 28% 34% 29% 18% 44% 28%
One year or more 1.9% 1.1% 2.3% 0.6% 3.4% 2.1%
Don't know 1.5% - 1.4% 1.2% 1.7% 1.7%
27
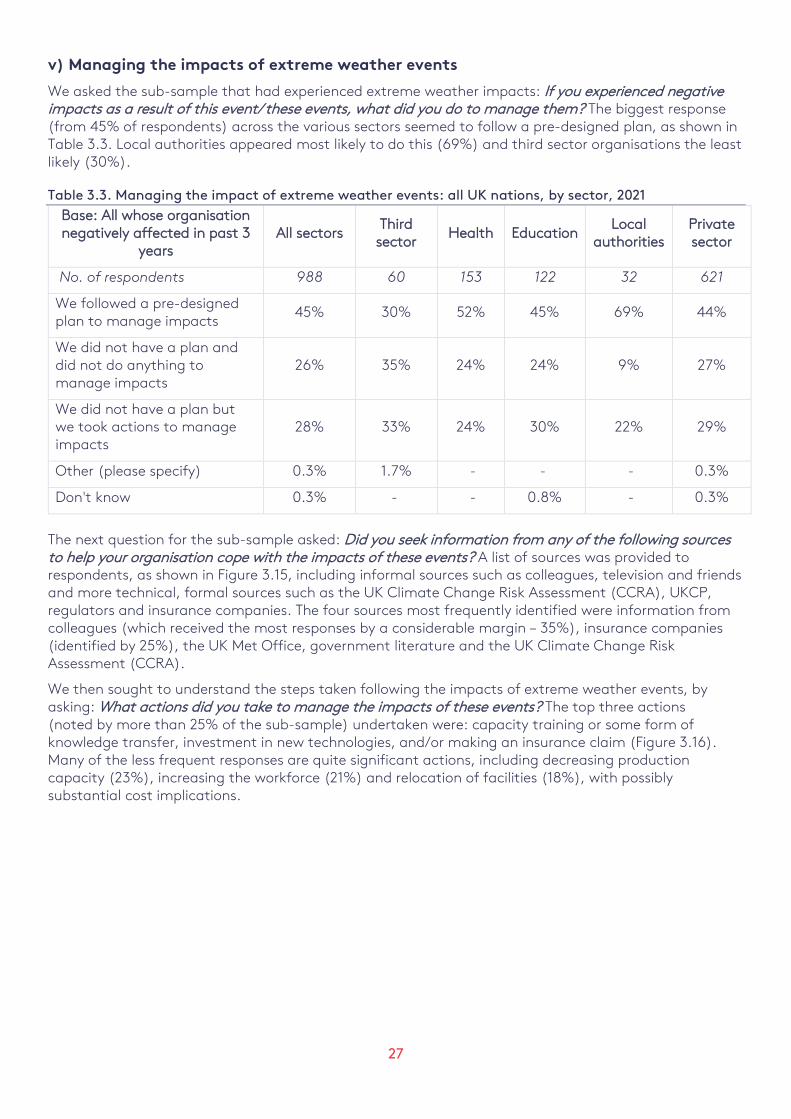
v) Managing the impacts of extreme weather events
We asked the sub-sample that had experienced extreme weather impacts: If you experienced negative impacts as a result of this event/ these events, what did you do to manage them? The biggest response (from 45% of respondents) across the various sectors seemed to follow a pre-designed plan, as shown in Table 3.3. Local authorities appeared most likely to do this (69%) and third sector organisations the least likely (30%).
Table 3.3. Managing the impact of extreme weather events: all UK nations, by sector, 2021 Base: All whose organisation negatively affected in past 3
years All sectors
Third sector
Health Education Local
authorities Private sector
No. of respondents 988 60 153 122 32 621
We followed a pre-designed plan to manage impacts
45% 30% 52% 45% 69% 44%
We did not have a plan and did not do anything to manage impacts
26% 35% 24% 24% 9% 27%
We did not have a plan but we took actions to manage impacts
28% 33% 24% 30% 22% 29%
Other (please specify) 0.3% 1.7% - - - 0.3%
Don't know 0.3% - - 0.8% - 0.3%
The next question for the sub-sample asked: Did you seek information from any of the following sources to help your organisation cope with the impacts of these events? A list of sources was provided to respondents, as shown in Figure 3.15, including informal sources such as colleagues, television and friends and more technical, formal sources such as the UK Climate Change Risk Assessment (CCRA), UKCP, regulators and insurance companies. The four sources most frequently identified were information from colleagues (which received the most responses by a considerable margin – 35%), insurance companies (identified by 25%), the UK Met Office, government literature and the UK Climate Change Risk Assessment (CCRA).
We then sought to understand the steps taken following the impacts of extreme weather events, by asking: What actions did you take to manage the impacts of these events? The top three actions (noted by more than 25% of the sub-sample) undertaken were: capacity training or some form of knowledge transfer, investment in new technologies, and/or making an insurance claim (Figure 3.16). Many of the less frequent responses are quite significant actions, including decreasing production capacity (23%), increasing the workforce (21%) and relocation of facilities (18%), with possibly substantial cost implications.

28
Figure 3.15. Sources of information to cope with impact of events: all UK nations, all sectors, 2021
Note: Abbreviations are defined on p1.
35%
26%
25%
22%
20%
20%
19%
18%
18%
17%
15%
15%
14%
14%
12%
10%
10%
10%
9%
8%
7%
7%
6%
6%
3%
1%
Colleagues
Insurance companies
Met Office
Government literature
CCRA -- UK Climate Change Risk Assessment
Climate change partnerships (e.g. LCCP)
Environmental regulator (e.g., EA, SEPA)
Department for Environment, Food & Rural Affairs
Internet search Engines (e.g. Google)
Academic sources
Local Government Association
Company reports and surveys (e.g., TCFD, CDP)
Social Media (e.g., Facebook, Twitter, LinkedIn)
Friends
Department for Business, Energy & Industrial Strategy
Local business associations/Trade Associations/IndustryBody/Industry Initiatives (Corporate Leaders Group), etc.
Met Office UK Climate Projections (2002, 2009, 2018)
International agencies (e.g., Intergovernmental Panel onClimate Change, World Health Organisation)
Newspapers
Adaptation Committee
Non-governmental organisations
Specialist consultancy
Television
Other climate projections (not Met Office UKCP)
Specialist or trade publications or magazines
Other

29
Figure 3.16. Actions taken to manage impacts of extreme events: all UK nations, all sectors, 2021
The following question explored responses to events in terms of future planning for extremes: Since experiencing these extreme weather events, do you agree or disagree that your organisation has taken more steps to prepare for similar events that may occur in the future? A large majority (78%) of the sub-sample recorded strong agreement or a tendency to agree this was the case, with the local government sector showing the least overall agreement (possibly related to having a reduced budget to respond due to cuts) (Figure 3.17).
Lastly, we asked: As far as you are aware, is your organisation generally taking any measures to deal with the physical risks of future climate change? The summary results shown in Figure 3.18 show that less than 25% of respondents across all sectors said their organisation is taking measures. A large majority (65%) in the private sector said their organisation was likely not taking any measures to deal with the physical risks of future climate change.
29%
28%
26%
23%
21%
21%
21%
18%
17%
16%
14%
14%
5%
3%
Capacity training or knowledge transfer
Invested in new technologies
Made an insurance claim
Decreased production capacity
Increased the workforce
Built new business relationships
Diversified organisational activities
Relocated facilities
Increased production capacity
Identified or invested in new markets and customers
Reduced the workforce
Sourced products, services or goods from newsuppliers
Sold, rented or mortgaged assets
Took out a loan

30
Figure 3.17. Level of agreement on the need to prepare for future extreme events: all UK nations, by sector, 2021
Figure 3.18. Percentage of organisations with and without measures to deal with future climate change: all UK nations, by sector, 2021
30%
26%
25%
18%
20%
25%
54%
53%
53%
60%
54%
41%
12%
14%
14%
13%
16%
31%
Health
Private sector
All sectors
Third sector
Education
Local authorities
Strongly agree Tend to agree Neither agree nor disagree Tend to disagree Strongly disagree
26%
24%
23%
23%
22%
22%
52%
37%
56%
52%
61%
65%
22%
39%
21%
24%
17%
14%
Health
Local authorities
Education
Third sector
All sectors
Private sector
Yes No Don't Know
31
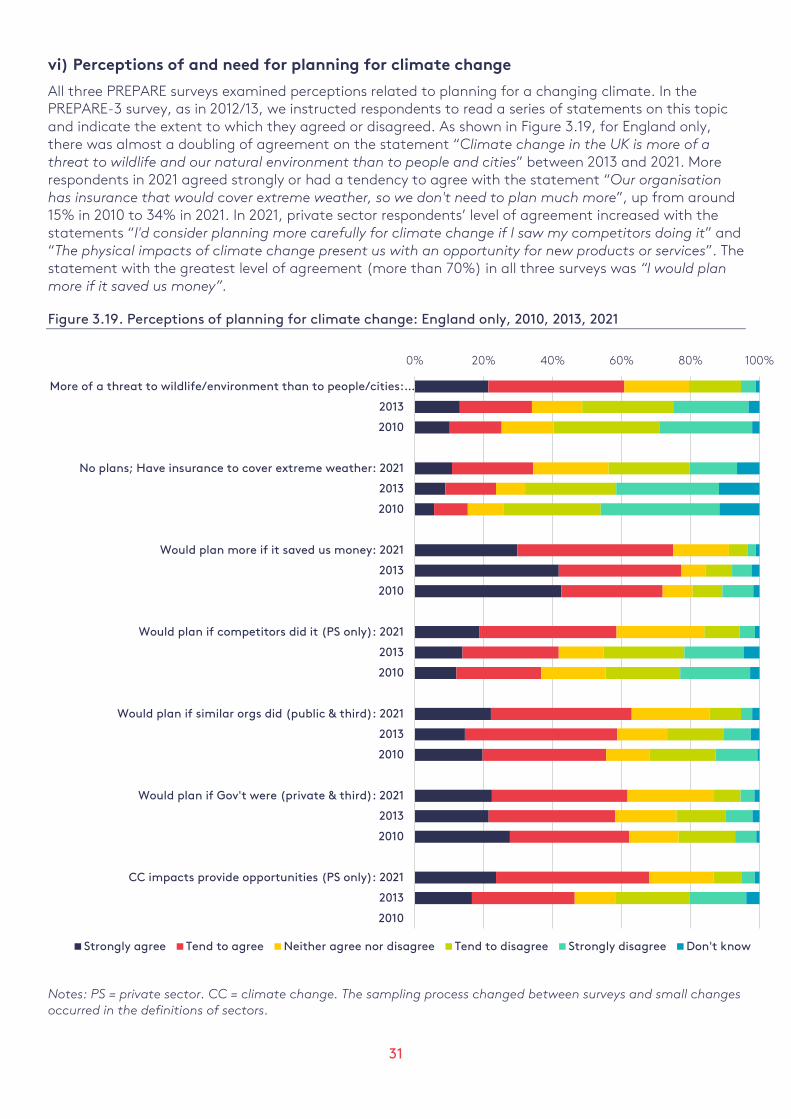
vi) Perceptions of and need for planning for climate change
All three PREPARE surveys examined perceptions related to planning for a changing climate. In the PREPARE-3 survey, as in 2012/13, we instructed respondents to read a series of statements on this topic and indicate the extent to which they agreed or disagreed. As shown in Figure 3.19, for England only, there was almost a doubling of agreement on the statement “Climate change in the UK is more of a threat to wildlife and our natural environment than to people and cities” between 2013 and 2021. More respondents in 2021 agreed strongly or had a tendency to agree with the statement “Our organisation has insurance that would cover extreme weather, so we don't need to plan much more”, up from around 15% in 2010 to 34% in 2021. In 2021, private sector respondents’ level of agreement increased with the statements “I'd consider planning more carefully for climate change if I saw my competitors doing it” and “The physical impacts of climate change present us with an opportunity for new products or services”. The statement with the greatest level of agreement (more than 70%) in all three surveys was “I would plan more if it saved us money”.
Figure 3.19. Perceptions of planning for climate change: England only, 2010, 2013, 2021
Notes: PS = private sector. CC = climate change. The sampling process changed between surveys and small changes occurred in the definitions of sectors.
0% 20% 40% 60% 80% 100%
More of a threat to wildlife/environment than to people/cities:…
2013
2010
No plans; Have insurance to cover extreme weather: 2021
2013
2010
Would plan more if it saved us money: 2021
2013
2010
Would plan if competitors did it (PS only): 2021
2013
2010
Would plan if similar orgs did (public & third): 2021
2013
2010
Would plan if Gov't were (private & third): 2021
2013
2010
CC impacts provide opportunities (PS only): 2021
2013
2010
Strongly agree Tend to agree Neither agree nor disagree Tend to disagree Strongly disagree Don't know
32
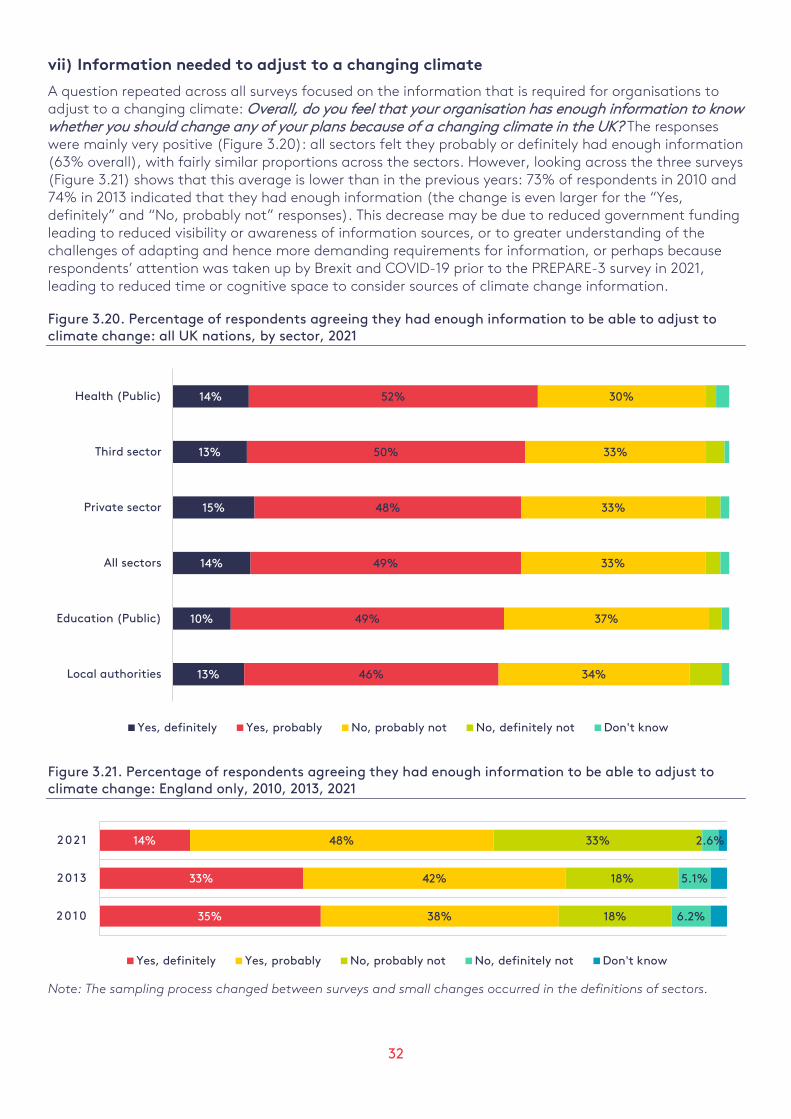
vii) Information needed to adjust to a changing climate
A question repeated across all surveys focused on the information that is required for organisations to adjust to a changing climate: Overall, do you feel that your organisation has enough information to know whether you should change any of your plans because of a changing climate in the UK? The responses were mainly very positive (Figure 3.20): all sectors felt they probably or definitely had enough information (63% overall), with fairly similar proportions across the sectors. However, looking across the three surveys (Figure 3.21) shows that this average is lower than in the previous years: 73% of respondents in 2010 and 74% in 2013 indicated that they had enough information (the change is even larger for the “Yes, definitely” and “No, probably not” responses). This decrease may be due to reduced government funding leading to reduced visibility or awareness of information sources, or to greater understanding of the challenges of adapting and hence more demanding requirements for information, or perhaps because respondents’ attention was taken up by Brexit and COVID-19 prior to the PREPARE-3 survey in 2021, leading to reduced time or cognitive space to consider sources of climate change information.
Figure 3.20. Percentage of respondents agreeing they had enough information to be able to adjust to climate change: all UK nations, by sector, 2021
Figure 3.21. Percentage of respondents agreeing they had enough information to be able to adjust to climate change: England only, 2010, 2013, 2021
Note: The sampling process changed between surveys and small changes occurred in the definitions of sectors.
14%
13%
15%
14%
10%
13%
52%
50%
48%
49%
49%
46%
30%
33%
33%
33%
37%
34%
Health (Public)
Third sector
Private sector
All sectors
Education (Public)
Local authorities
Yes, definitely Yes, probably No, probably not No, definitely not Don't know
35%
33%
14%
38%
42%
48%
18%
18%
33%
6.2%
5.1%
2.6%
2010
2013
2021
Yes, definitely Yes, probably No, probably not No, definitely not Don't know

33
viii) Planning for climate change
Another set of statements considered planning for risks or opportunities from climate change, asking Which of these statements best describes how much your organisation has thought about the kinds of risks or opportunities a changing climate could present? As Figure 3.22 shows, just 12% of respondents in all sectors within the UK indicated that their organisations had comprehensively assessed present and future risks and opportunities of climate change and made plans for action. The highest response (at 22%) was to the statement that the respondents’ organisations had only just started to look at the risks and opportunities. Table A7 (Appendix) also shows some small sectoral variations; of interest is that about 12% of respondents from the private sector mentioned that not only had their organisation not yet thought about climate change, but nor are they planning to.
For added context, when considering 2013 data for England only, about 47% of respondents indicated that their organisations were in the preliminary phases of planning for climate change: this includes those saying they have not yet thought about it but plan to, those that have just begun looking at climate change, and those that have looked at threats and opportunities and are starting to think about what to do (the proportion of respondents in 2021 was 59% for all of the UK). Further, for England-based respondents in 2013, about 14% indicated that they don’t plan to think about climate change (compared with 10% for all UK in 2021). And in 2013 about 35% of respondents indicated they had at least identified priorities and started action, but 2021 data for all of the UK indicate that a smaller proportion (28%) of organisations had begun to take action on climate change plans.
Figure 3.22. Consideration of threats/opportunities of climate change: all UK nations, 2021
14%
12%
19%
16%
21%
9%
5%
4%
10%
19%
22%
17%
16%
8%
4%
4%
We haven't thought at all about climate change, anddon't plan to
We haven't thought about it, but plan to in the future
We have begun looking at it, but are just getting started
We have looked at present and future threats andopportunities and thought about what to do about them
We have looked at present and future threats andopportunities, identified priorities, and have started
acting on these
We have comprehensively assessed current and futurethreats and opportunities, and have fully planned actions,
are taking action on priorities and made this part of theway we plan generally
We have comprehensively assessed present and futurethreats and opportunities, have fully planned and takenaction, made it part of how we plan and systematically
monitor and implement our actions.
Don't know
2021 2013
34
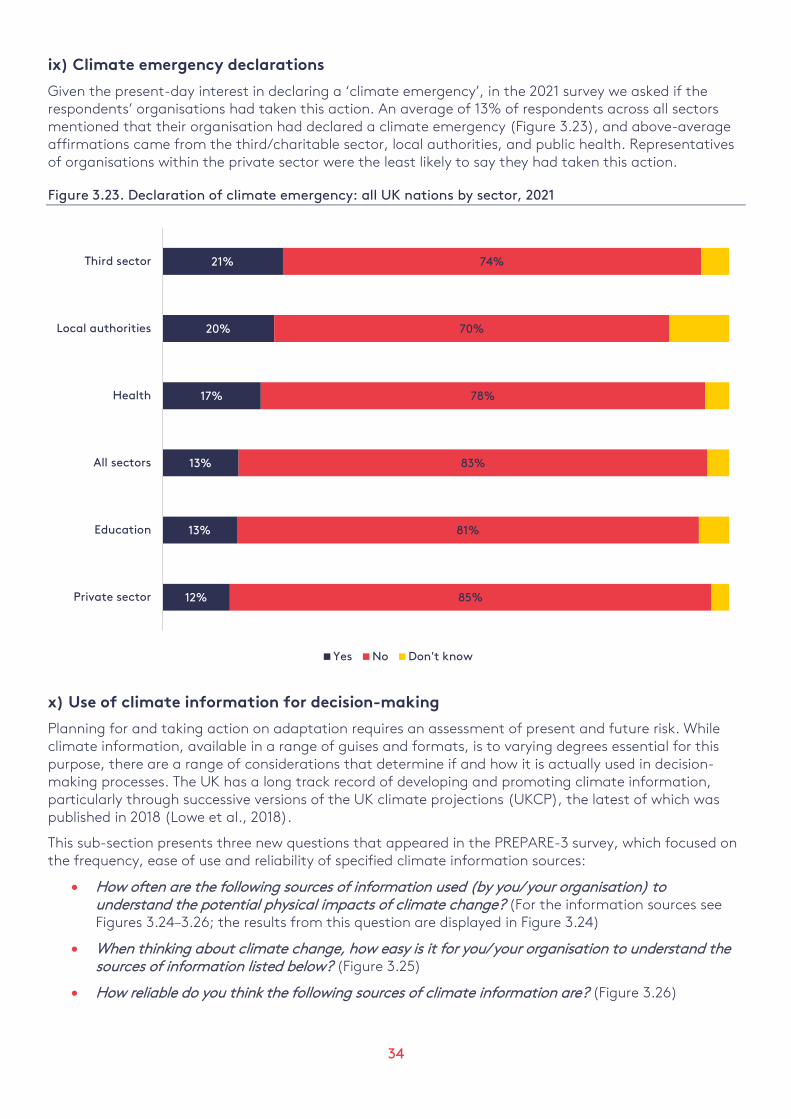
ix) Climate emergency declarations
Given the present-day interest in declaring a ‘climate emergency’, in the 2021 survey we asked if the respondents’ organisations had taken this action. An average of 13% of respondents across all sectors mentioned that their organisation had declared a climate emergency (Figure 3.23), and above-average affirmations came from the third/charitable sector, local authorities, and public health. Representatives of organisations within the private sector were the least likely to say they had taken this action.
Figure 3.23. Declaration of climate emergency: all UK nations by sector, 2021
x) Use of climate information for decision-making
Planning for and taking action on adaptation requires an assessment of present and future risk. While climate information, available in a range of guises and formats, is to varying degrees essential for this purpose, there are a range of considerations that determine if and how it is actually used in decision-making processes. The UK has a long track record of developing and promoting climate information, particularly through successive versions of the UK climate projections (UKCP), the latest of which was published in 2018 (Lowe et al., 2018).
This sub-section presents three new questions that appeared in the PREPARE-3 survey, which focused on the frequency, ease of use and reliability of specified climate information sources:
• How often are the following sources of information used (by you/your organisation) to understand the potential physical impacts of climate change? (For the information sources see Figures 3.24–3.26; the results from this question are displayed in Figure 3.24)
• When thinking about climate change, how easy is it for you/your organisation to understand the sources of information listed below? (Figure 3.25)
• How reliable do you think the following sources of climate information are? (Figure 3.26)
21%
20%
17%
13%
13%
12%
74%
70%
78%
83%
81%
85%
Third sector
Local authorities
Health
All sectors
Education
Private sector
Yes No Don't know

35
The top five sources of climate information that respondents indicated that they “always” consulted were, in descending order: internet searches, government literature, the Met Office, colleagues, and the UKCP (roughly 20% identified these five). The top five sources that respondents (roughly 20%) found “very easy” to understand were, in order: colleagues, friends, internet searches, television and social media. In contrast, respondents found the following sources the most “difficult” to understand: insurance companies, academic sources, company reports/strategies, the UK Climate Change Risk Assessments (CCRAs), and environmental regulators. The top five sources that respondents (roughly 30%) indicated they considered to be “very reliable” were, in order: academic sources, the Met Office, international agencies, the UK CCRAs, and the UKCP.
Responses across the three questions were generally quite positive, particularly in relation to ease of understanding and reliability. Unfortunately, we only have these answers from the 2021 survey, and although it covered a large sample, the results do not tell us about precisely how or why this climate information is used – for example, in a cursory way, or in detail: a respondent might have found it easy to use the information for a brief update on current thinking, but might have found it more difficult to try, for example, to factor quantitative information into an investment decision.
Figure 3.24. Frequency of use of climate information sources by respondents: all UK nations, all sectors, 2021
0% 10% 20% 30% 40% 50% 60% 70% 80% 90% 100%
Gov't literature
Internet searches
Colleagues
Academic sources
Met Office
Int'l agencies (IPCC, WHO)
Defra
Television
Local gov't association
Insurance companies
Newspapers
Met Office UKCP
Dept BEIS
Environmental regulator
UK CCRA
Company reports/strategies
Friends
Local business/trade associations
Climate change partnerships
NGOs
Social media
Other climate projections
Specialist consultancy
Specialist or trade publication
Adaptation Committee
Other
Always Sometimes Never Don't Know Not Applicable
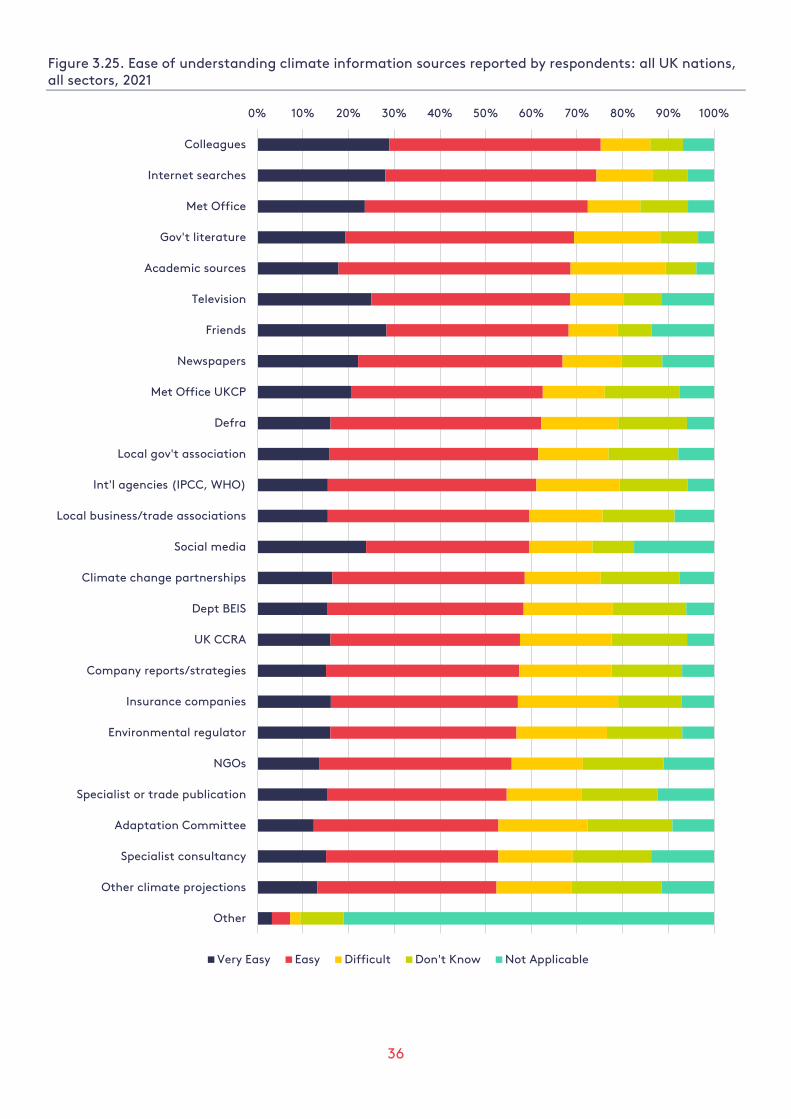
36
Figure 3.25. Ease of understanding climate information sources reported by respondents: all UK nations, all sectors, 2021
0% 10% 20% 30% 40% 50% 60% 70% 80% 90% 100%
Colleagues
Internet searches
Met Office
Gov't literature
Academic sources
Television
Friends
Newspapers
Met Office UKCP
Defra
Local gov't association
Int'l agencies (IPCC, WHO)
Local business/trade associations
Social media
Climate change partnerships
Dept BEIS
UK CCRA
Company reports/strategies
Insurance companies
Environmental regulator
NGOs
Specialist or trade publication
Adaptation Committee
Specialist consultancy
Other climate projections
Other
Very Easy Easy Difficult Don't Know Not Applicable

37
Figure 3.26. Reliability of climate information sources perceived by respondents: all UK nations, all sectors, 2021
0% 10% 20% 30% 40% 50% 60% 70% 80% 90% 100%
Academic sources
Met Office
UK CCRA
Int'l agencies (IPCC, WHO)
Environmental regulator
Climate change partnerships
Defra
Met Office UKCP
Gov't literature
Dept BEIS
Company reports/strategies
Local gov't association
Adaptation Committee
Specialist consultancy
Local business/trade Associations
Specialist or trade publication
Insurance companies
Other climate projections
Internet searches
NGOs
Television
Colleagues
Newspapers
Friends
Social media
Other
Very Reliable Reliable Not Reliable Don't know Not Applicable

38
xi) Approaches to climate change adaptation
In this sub-section we focus on responses to questions related to the various approaches to adaptation and planning for the risks and opportunities caused by a changing climate.
One of the first questions posed in this area was: When your organisation has looked at the risks or opportunities of a changing climate which, if any, of the following did the assessment consider? This question was presented to respondents who previously identified that their organisation had begun looking at present and future threats (70% of the full sample).
Figure 3.27 highlights that the event types that have most received consideration by respondents’ organisations are flooding from heavy rain (identified by 67%) and heatwaves (56%). These events rank as first and third, respectively, in the extreme event types that respondents view as threats (see Figure 3.10 above). For added context, in the results from the 2013 survey (for England only, data not shown), respondents mentioned that their organisations had given consideration to: flooding from heavy rain (72% of respondents, similar to 2021), snow and ice (72%, much higher than 2021), flooding from rivers (56%), storms (54%), heatwaves (54%, similar to 2021), drought or availability of water (50%, roughly 10% higher than 2021), and flooding from the sea (24%, roughly 5% lower than 2021).
Figure 3.27. Percentage of respondents’ organisations giving consideration to different types of weather event and climate impacts when planning: all UK nations, all sectors, 2021
We then asked the sub-sample of respondents who previously identified that their organisation had begun looking at present and future threats: Has your organisation allocated any budget and/or staff time to plan for and manage the risks of a changing climate? Figure 3.28 shows that more than 40% of respondents in almost all sectors (except for local authorities) indicated that their organisation had allocated both budget and staff time for planning. On average, about 16% of respondents said their organisation allocated mostly budgetary resources, and about 19% on average said that staff time was allocated to planning for and managing the risks of climate change. The proportion of respondents who said their organisation had allocated neither budget nor staff time averaged 15% across all sectors. This is considerably less than in the 2013 survey (England only; data not shown), where about 41% of respondents said their organisation had not made allocations to planning for climate change.
67%
55%
46%
44%
43%
40%
29%
3%
2%
2%
Flooding from heavy rain
Heatwaves
Storms
Snow and ice
Flooding from rivers
Drought or availability of water
Flooding from the sea
Other climate impacts
None of these
Don't know
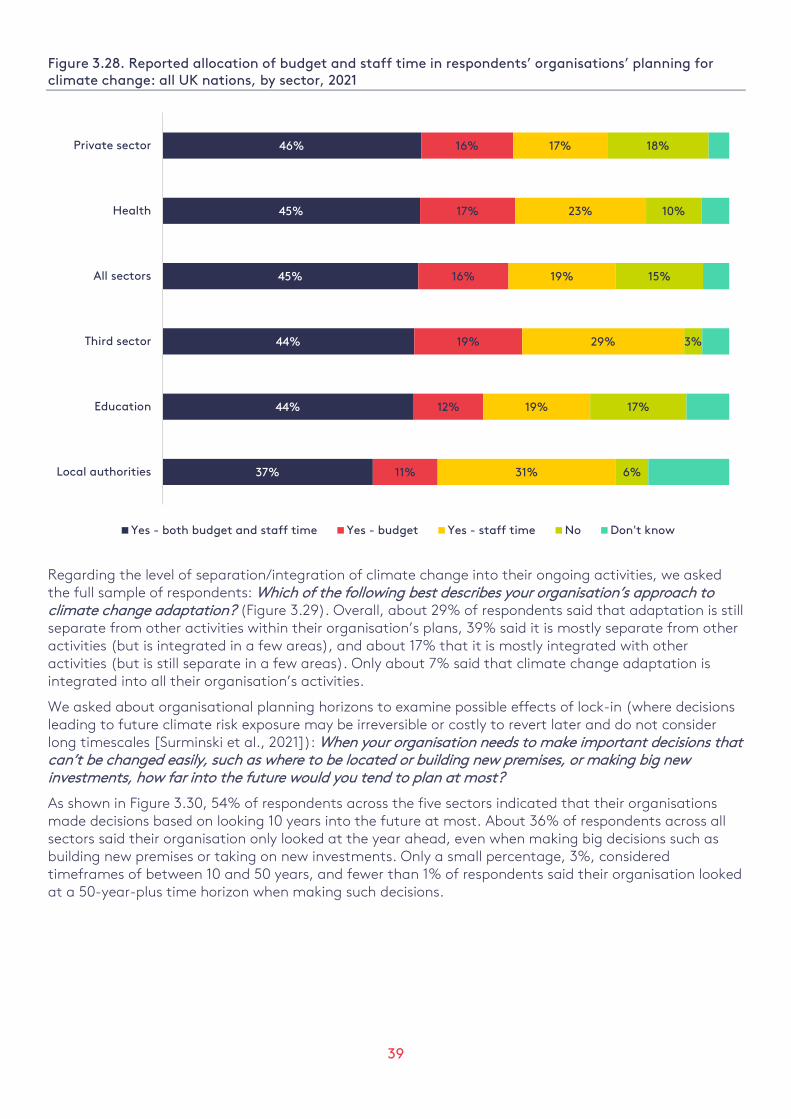
39
Figure 3.28. Reported allocation of budget and staff time in respondents’ organisations’ planning for climate change: all UK nations, by sector, 2021
Regarding the level of separation/integration of climate change into their ongoing activities, we asked the full sample of respondents: Which of the following best describes your organisation’s approach to climate change adaptation? (Figure 3.29). Overall, about 29% of respondents said that adaptation is still separate from other activities within their organisation’s plans, 39% said it is mostly separate from other activities (but is integrated in a few areas), and about 17% that it is mostly integrated with other activities (but is still separate in a few areas). Only about 7% said that climate change adaptation is integrated into all their organisation’s activities.
We asked about organisational planning horizons to examine possible effects of lock-in (where decisions leading to future climate risk exposure may be irreversible or costly to revert later and do not consider long timescales [Surminski et al., 2021]): When your organisation needs to make important decisions that can’t be changed easily, such as where to be located or building new premises, or making big new investments, how far into the future would you tend to plan at most?
As shown in Figure 3.30, 54% of respondents across the five sectors indicated that their organisations made decisions based on looking 10 years into the future at most. About 36% of respondents across all sectors said their organisation only looked at the year ahead, even when making big decisions such as building new premises or taking on new investments. Only a small percentage, 3%, considered timeframes of between 10 and 50 years, and fewer than 1% of respondents said their organisation looked at a 50-year-plus time horizon when making such decisions.
46%
45%
45%
44%
44%
37%
16%
17%
16%
19%
12%
11%
17%
23%
19%
29%
19%
31%
18%
10%
15%
3%
17%
6%
Private sector
Health
All sectors
Third sector
Education
Local authorities
Yes - both budget and staff time Yes - budget Yes - staff time No Don't know

40
Figure 3.29. Reported levels of separation or integration of climate change adaptation in respondents’ organisational planning: all UK nations, by sector, 2021
Note: CCA = climate change adaptation
Figure 3.30. Respondents’ organisations’ planning horizons: all UK nations, by sector, 2021
31%
30%
29%
26%
23%
22%
37%
44%
40%
49%
49%
46%
17%
13%
17%
17%
16%
22%
Private sector
Third sector
All sectors
Local authorities
Education
Health
CCA separate CCA mostly separate/some integrationCCA mostly integrated/some separation CCA integratedDon't know
54%
52%
53%
61%
67%
53%
37%
35%
37%
30%
16%
38%
All sectors
Third sector
Health
Education
Local authorities
Private sector
50 years or more Less than 50 years Less than 10 years Less than 1 year
Less than a month Other Don't know
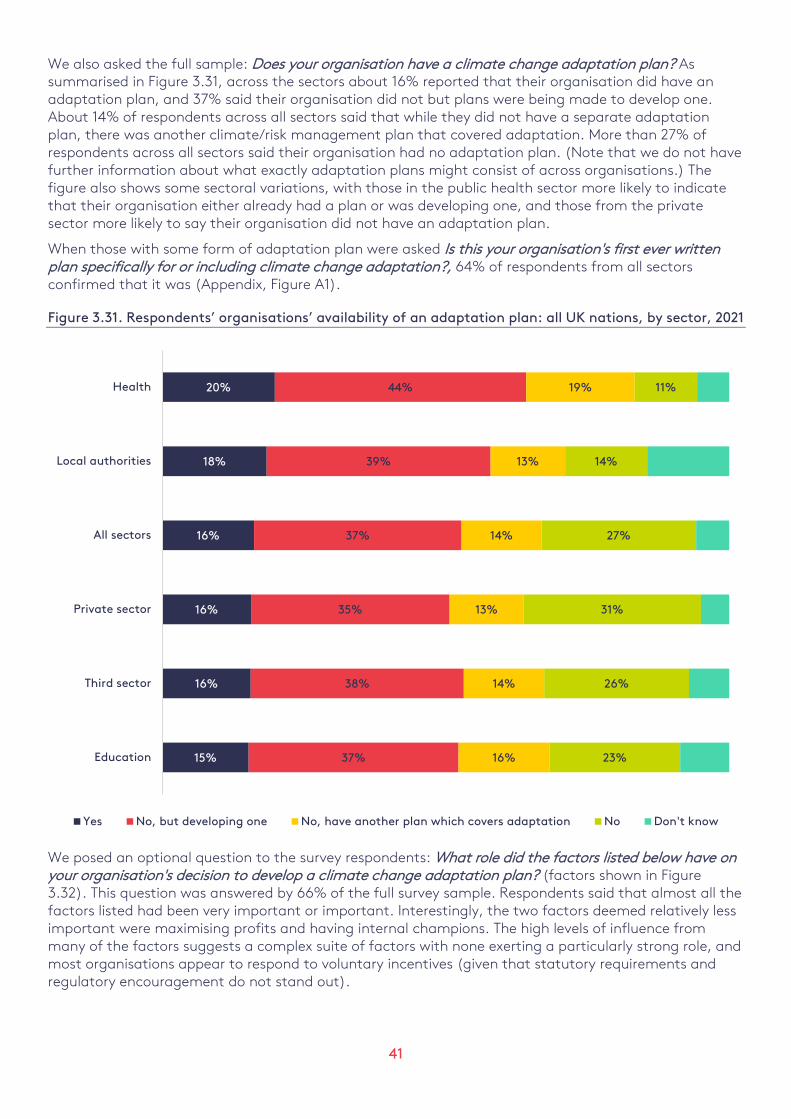
41
We also asked the full sample: Does your organisation have a climate change adaptation plan? As summarised in Figure 3.31, across the sectors about 16% reported that their organisation did have an adaptation plan, and 37% said their organisation did not but plans were being made to develop one. About 14% of respondents across all sectors said that while they did not have a separate adaptation plan, there was another climate/risk management plan that covered adaptation. More than 27% of respondents across all sectors said their organisation had no adaptation plan. (Note that we do not have further information about what exactly adaptation plans might consist of across organisations.) The figure also shows some sectoral variations, with those in the public health sector more likely to indicate that their organisation either already had a plan or was developing one, and those from the private sector more likely to say their organisation did not have an adaptation plan.
When those with some form of adaptation plan were asked Is this your organisation's first ever written plan specifically for or including climate change adaptation?, 64% of respondents from all sectors confirmed that it was (Appendix, Figure A1).
Figure 3.31. Respondents’ organisations’ availability of an adaptation plan: all UK nations, by sector, 2021
We posed an optional question to the survey respondents: What role did the factors listed below have on your organisation's decision to develop a climate change adaptation plan? (factors shown in Figure 3.32). This question was answered by 66% of the full survey sample. Respondents said that almost all the factors listed had been very important or important. Interestingly, the two factors deemed relatively less important were maximising profits and having internal champions. The high levels of influence from many of the factors suggests a complex suite of factors with none exerting a particularly strong role, and most organisations appear to respond to voluntary incentives (given that statutory requirements and regulatory encouragement do not stand out).
20%
18%
16%
16%
16%
15%
44%
39%
37%
35%
38%
37%
19%
13%
14%
13%
14%
16%
11%
14%
27%
31%
26%
23%
Health
Local authorities
All sectors
Private sector
Third sector
Education
Yes No, but developing one No, have another plan which covers adaptation No Don't know

42
Figure 3.32. Respondents’ perceived level of influence of different factors in their organisations’ adaptation plan development: all UK nations, 2021
Focusing again on the full sample of respondents, we asked: Which of these [factors] would you consider as barriers to adapting to the physical impacts of climate change at your organisation? (with the full range of barriers shown in Figure 3.33). The five barriers most identified were: [insufficient] financial resources (highest by a considerable margin); complacency/staff attitude towards climate change; difficulty identifying effective measures; [lack of] access to, or awareness of, new technologies; and climate adaptation not being a priority/other things take higher priority/having competing priorities.
42%
41%
35%
37%
34%
28%
33%
30%
28%
29%
21%
44%
44%
50%
46%
48%
53%
48%
50%
51%
41%
45%
10%
10%
11%
12%
13%
13%
13%
13%
12%
20%
23%
5%
8%
7%
6% 81%
Improving performance
Moral/ethical concerns
Industry best practice
Improving reputation
Cost savings
Management ethos
Statutory requirements
Regulatory encouragement
Consultants' advice
Maximising profits
Internal champions
Other
Very important Important Not very important Irrelevant Don't know

43
Figure 3.33. Barriers to adapting to the physical risks of climate change, identified by respondents: all UK nations, all sectors, 2021
Further, we asked all respondents: What resources do you think would help your organisation to better adapt to the physical impacts of climate change? The top three priorities, as shown in Figure 3.34, were: financial resources (highest by a considerable margin), improved awareness of climate projections/impacts of changing climate, and legal obligations.
45%
29%
28%
28%
21%
17%
16%
16%
16%
16%
15%
15%
14%
13%
13%
12%
9%
6%
1%
Financial resources
Complacency/staff attitude towards climate change
Difficulty identifying effective measures
Access to, or awareness of, new technologies
Not a priority
Not enough staff with right skills or qualifications
Time limitations
Lack of buy-in from senior management
Limited availability of climate impact projections
Legislation
No customer demand
Issues or limitations with business/operational structure
Uncertainty of projections/impacts of changing climate
Short term business pressures/hard to plan
Not enough staff
Lack of stakeholder buy-in
The regulatory framework
Don't know
Other
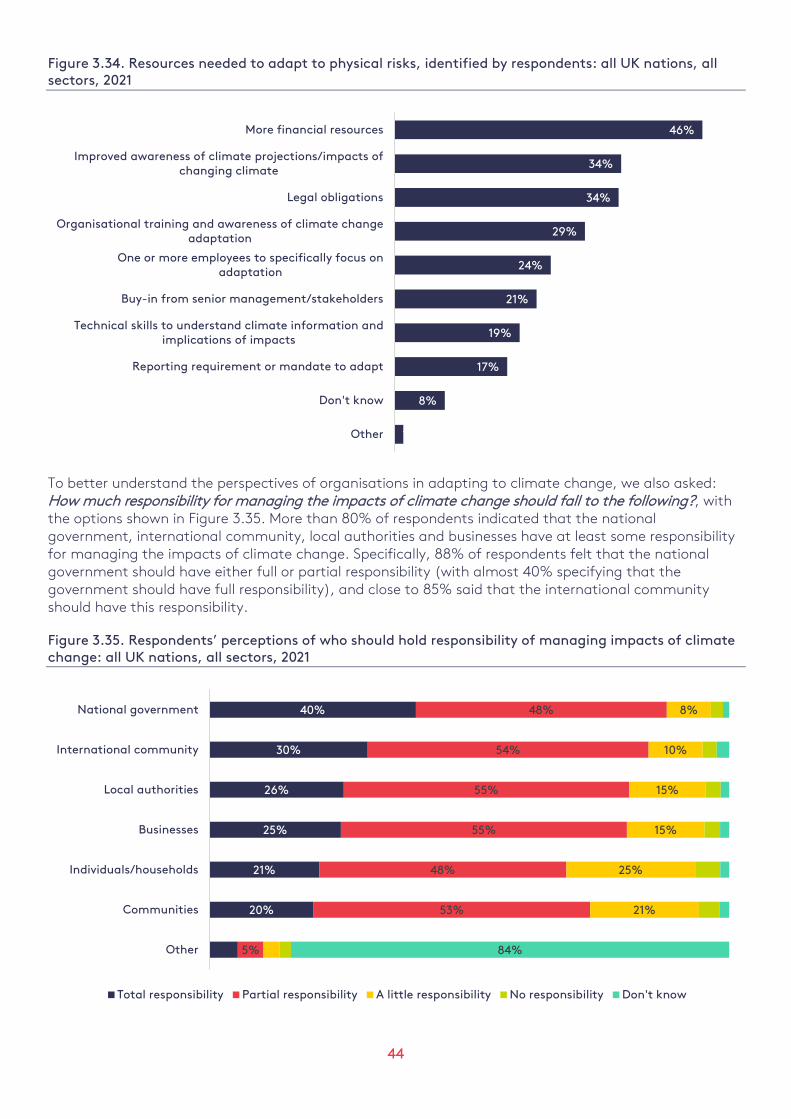
44
Figure 3.34. Resources needed to adapt to physical risks, identified by respondents: all UK nations, all sectors, 2021
To better understand the perspectives of organisations in adapting to climate change, we also asked: How much responsibility for managing the impacts of climate change should fall to the following?, with the options shown in Figure 3.35. More than 80% of respondents indicated that the national government, international community, local authorities and businesses have at least some responsibility for managing the impacts of climate change. Specifically, 88% of respondents felt that the national government should have either full or partial responsibility (with almost 40% specifying that the government should have full responsibility), and close to 85% said that the international community should have this responsibility.
Figure 3.35. Respondents’ perceptions of who should hold responsibility of managing impacts of climate change: all UK nations, all sectors, 2021
46%
34%
34%
29%
24%
21%
19%
17%
8%
1%
More financial resources
Improved awareness of climate projections/impacts ofchanging climate
Legal obligations
Organisational training and awareness of climate changeadaptation
One or more employees to specifically focus onadaptation
Buy-in from senior management/stakeholders
Technical skills to understand climate information andimplications of impacts
Reporting requirement or mandate to adapt
Don't know
Other
40%
30%
26%
25%
21%
20%
48%
54%
55%
55%
48%
53%
5%
8%
10%
15%
15%
25%
21%
84%
National government
International community
Local authorities
Businesses
Individuals/households
Communities
Other
Total responsibility Partial responsibility A little responsibility No responsibility Don't know

45
Following up on responsibility for managing the impacts of climate change, we then asked the full sample: In your view, what would be the most useful ways the Government could help organisations like yours to do this? Most respondents felt that out of the options given, the Government should provide more information about the effects of climate change in the UK, and funding, subsidies and tax breaks, and should demonstrate how climate change is relevant to specific kinds of organisation (Figure 3.36).
When asked: And which, in your opinion [of these options], is the most useful?, more than 20% said that having more information about the effects of climate change in the UK, and having funding, subsidies and tax breaks, were the most useful government interventions to help organisations in managing the impacts of climate change (see Figure 3.37).
Figure 3.36. Respondents’ views on the most useful avenues of government support for adaptation: all UK nations, all sectors, 2021
Figure 3.37. Forms of government support deemed most useful by respondents: all UK nations, all sectors, 2021
57%
54%
44%
40%
40%
35%
33%
23%
3%
1%
Provide more information about the effects of climatechange in the UK
Funding / subsidies / Tax breaks
Show how climate change is relevant to my kind oforganisation
Say what the effects of climate change will be, not whatthey might be
Use less jargon and scientific language
Reduce red tape / bureaucracy / regulation
Show how climate change offers opportunities
Promote new minimum standards
Don’t know
Other
26%
22%
13%
11%
8%
6%
5%
4%
2%
0%
Funding / subsidies / Tax breaks
Provide more information about the effects of climatechange in the UK
Show how climate change is relevant to my kind oforganisation
Say what the effects of climate change will be, not whatthey might be
Use less jargon and scientific language
Reduce red tape / bureaucracy / regulation
Promote new minimum standards
Show how climate change offers opportunities
Don't know
Other
46
4. Discussion and recommendations Surveying awareness of the physical risks of climate change and the need to adapt
As we have set out above, the PREPARE-3 survey was conducted in April to May 2021 of 2,429 individuals from a range of organisations in five different sectors – businesses, health authorities, local authorities, educational establishments, and third sector organisations – from across all four UK nations. The survey was designed to examine awareness among organisations of climate change, its physical risks to the UK, and the degree to which organisations have taken action to prepare for its consequences.
The survey duplicates and expands on questions in earlier surveys conducted in 2010 and 2013, commissioned by the Department for Environment, Food & Rural Affairs (Defra).
The respondents came predominantly from the private sector, comprising 70% of the full sample. The sector representation and distribution were chosen to be similar to those in the earlier two PREPARE surveys to enable descriptive comparison. However, due to differences in the sample collection methods between the 2013 and 2021 surveys, and minor changes in how the sectors are defined, the surveys should be seen as snapshots in time rather than a longitudinal study.
Recommendations
• Organisations with a cross-cutting role, such as the Adaptation Committee of the UK’s Climate Change Committee or the Confederation for British Industry (CBI), could promote coordination of periodic surveys. These could be harmonised with regular review processes including the UK Climate Change Risk Assessment (CCRA) and the Adaptation Reporting Power (ARP), and disclosure efforts such as Carbon Disclosure Project (CDP) and the Task Force on Climate-related Financial Disclosures (TCFD).
• Future surveys should include new questions that capture the measures required to facilitate a shift from adaptation awareness and planning to action, and to track progress therein.
• Funding should be considered for longitudinal surveys complemented with qualitative data collection to expand upon survey findings.
Flooding on the London Underground. Photo: Pixabay
46
47
Confidence in results
Respondents were asked to self-report their suitability and level of confidence in answering the questions and in both cases reported strongly positive answers, which gives confidence in the survey results. When asked about personal awareness of climate change, 84% of respondents said that they knew either a great deal or a fair amount, a level similar to both earlier PREPARE surveys. Moreover, 65% of respondents indicated that their personal interest was a driving factor for their perceived high degree of knowledge about climate change, suggesting an important role for individual staff members’ agency and heuristics in influencing how organisations source information on the topic.
While the large and balanced sample size gives confidence in the representivity of the results, the questions primarily give very short format answers based on subjective interpretation of their meaning and on ranking of responses by respondents. This limits how much we can infer beyond the headline findings at this stage. We plan to supplement the survey with a complementary sample of longer format interviews with willing participants identified from the original survey and deeper analysis of the collected quantitative data (e.g. by examining the relationships between different variables).
Perceptions of risks and opportunities
For all UK nations and all sectors, when asked whether their organisation was either very or fairly concerned about the effects of specific issues on the UK, 58% of respondents said that climate change was a concern, which led this issue to be ranked fifth in the 2021 survey. This places climate change impacts just above the issues of Brexit (identified by 57%) and the implications of government policy to reduce greenhouse gas emissions (55%) (note that a new, high profile policy on net-zero was announced in June 2019). The top-ranking issue, about which 83% said they were very or fairly concerned, was, unsurprisingly, the Coronavirus pandemic and the second-ranking issue (78%) was the economic downturn.
There are generally minor differences between rankings of concern by sector. Exceptions include the private sector showing relatively less concern than the public sector for environmental/climate change issues and the public health sector indicating more concern about preparedness for extreme weather than other sectors. In the Independent Assessment of UK Climate Risk, Surminski et al. (2021) found low awareness of adaptation as a business issue, with some confusion between mitigation and adaptation.
The proportion of the sample expressing concern about the effects of climate change on the UK fell from 79% in 2010, to 65% in 2013, to 58% in 2021. Similarly, concern about being prepared in case of extreme weather fell from 75% in 2010, to 71% in 2013, to 40% in 2021.
Overall, the levels of concern reported in 2021 were broadly similar to those reported in the two earlier surveys. However, the new and heightened concern about Coronavirus and ongoing uncertainty surrounding Brexit outcomes may be producing temporary shifts in perceptions of climate change. Either it could take several years before more established stable patterns of perceptions emerge (post- Coronavirus and -Brexit), or we may be entering a longer period of turbulence in views. We will investigate this further with more analysis of the survey data and follow-up interviews with respondents.
The private sector respondents indicated marked increases in concern about competition in 2021, both from abroad and from local organisations (which could be likely due to the fallout from Brexit and the uncertainty of new/unknown trade deal details), and a moderate decrease in concern about the economic downturn.
Fifty-eight per cent of our sample said their organisations had been significantly affected by extreme weather events during the previous three years. This suggests that extreme events – all of which incorporate an element of global warming effects although they result from a combination of influences, some changing over time (such as land cover) – are now widely impacting organisations in the UK. The frequency and intensity of these events are very likely to increase in the future, as indicated in the UKCP headlines: warmer and wetter winters, hotter and drier summers, and more frequent and intense weather extremes.

48
The two events most reported to have had impacts were “a heavy downpour causing localised flooding” and “an intense heatwave lasting a week” (both reported by over 20% of respondents). The highest response by sector was 79% in the health sector, from which the majority recorded impacts associated with heatwaves and the effects of a particularly warm summer.
For England only, between 2013 and 2021 there was a 28% increase in respondents saying their organisation had been significantly affected by such an event in the previous three years.
Follow-on questions about the direction of change of the impact showed 70% of those that experienced significant disruption from an extreme weather event had perceived negative impacts, that impacts affected people, as opposed to premises, logistics etc., the most (reported by more than 50% of respondents) and that most organisations felt these impacts within days or weeks. However, local authorities indicated a lag, in some cases as long as several months (and up to a year) after the event. Many of the impacted organisations (45%) followed a pre-designed plan, suggesting there could be good potential to develop adaptation plans from existing risk management plans. Delays in impacts and cross-sectoral or cascading impacts are interesting areas for follow-up work.
Recommendations
• Because heavy downpours causing localised flooding, severe flooding at the nearest coastline and intense heat waves lasting a week are the extremes that over time consistently draw most concern – also aligning with other findings (from past Climate Change Risk Assessments) and projections of future climate – these types of risks provide a focus for communication campaigns and greater adaptation preparedness and action.
• The marked decline in concern about being prepared for extreme events requires further analysis.
• There are some differences between sectoral and regional concerns about climate risk (and in some cases perceptions of opportunity) and therefore communications and actions need to be carefully targeted and designed for different situations.
• Constructing a more detailed assessment of the economic impacts of extreme weather events will help build the case for adaptation action and for targeting initiatives. Case studies of events/sectors or value chains could provide a useful focus (health sector experiences of heat waves and organisations having pre-designed plans for extremes are highlighted by this survey).
• The nature and implications of delays in impacts and cross-sectoral or cascading impacts require further study.
Risk response and planning
Our survey results support a picture of organisations in the UK taking steps to prepare for extreme weather events in the future (78% of the sub-sample indicated strong agreement or a tendency to agree that they were doing this). The top three actions are: capacity training or some form of knowledge transfer, investment in new technologies, and making an insurance claim. Many of the less frequent responses recorded are quite significant, such as decreasing production capacity and increasing or decreasing the size of the workforce, which could have possibly substantial cost implications.
Action appears to be strongly informed by dealing with the effects of extreme events that have already been experienced, with a much smaller proportion of the sub-sample (25%) saying they were taking measures to deal with the physical risks of future climate change. Furthermore, on future planning only 11% of respondents in all sectors, UK-wide, indicated that their organisations had comprehensively assessed the present and future risks and opportunities of climate change and made plans for action. Where there were reports of taking action, organisations were only just beginning to look at the risks and opportunities. Similarly, evidence of only a low level of corporate adaptation was reported in the Technical Report of the Third UK Climate Change Risk Assessment (Surminski et al., 2021).
A comparison of responses across all three PREPARE surveys on perceptions related to several aspects of planning for climate change shows some change over time. Notably, there is increased agreement over time with the statements “Our organisation has insurance that would cover extreme weather, so we
49
don't need to plan much more” and “Climate change in the UK is more of a threat to wildlife and our natural environment than to people and cities”. In contrast, in the 2019 RESiL-RISK national survey of public perceptions of the risks posed by climate change and views on climate adaptation options and risk communication strategies, 1 there was low recognition of the risk to wildlife and the natural environment (Steentjes et al., 2020).
The highest level of agreement was given to statements about cost-saving considerations, with more than 70% of respondents saying they ‘would plan more if it saved us money’ in all three PREPARE surveys.
Recommendation
• The types of extreme weather events already experienced provide the main mental model for action targeted at future risk. This high salience of recent experiences provides a strong foundation for promoting more action, particularly establishing a more detailed evidence base to make the case for the cost-effectiveness of taking action now.
Information on adjusting to a changing climate
Perceptions of the availability of information about adaptation were very positive, although the proportion of positive responses decreased between the 2010 and 2021 surveys. This decline may be due to reduced funding leading to lower visibility or awareness of information sources, greater understanding of the challenges of adapting and hence more demanding requirements for information, or perhaps respondents’ attention being taken up by Brexit and COVID-19 prior to the PREPARE-3 survey in 2021, leading to reduced time or cognitive space to consider sources of climate change information.
The main sources of information used by respondents were internet searches, government literature, the Met Office, colleagues, and the UK climate projections (UKCP). Responses about using climate information were generally quite positive, particularly in relation to ease of understanding and reliability. Unfortunately, we only have these answers from the 2021 survey, and although it covered a large sample, the results do not tell us precisely how or why this climate information is used – for example, in a cursory way, or in detail: a respondent might have found it easy to use the information for a brief update on current thinking, but might have found it more difficult to try to factor quantitative information into an investment decision, for example. Indeed, responses below suggest that most organisations are just thinking about or starting plans and therefore are likely at the earliest stages of engaging with climate information. As this proceeds, perceptions of information relevance and usability may evolve considerably, a situation that needs to be monitored.
Recommendation
• Since many organisations are just starting to address future risk, it would be useful to track in more detail how exactly information is being used and for what purposes, linking with providers (UKCP processes) and demand-side mechanisms (such as the Task Force on Climate-related Financial Disclosures and the newly established UK Centre for Greening Finance and Investment).
Promoting and taking responsibility for adaptation
Adaptation consists of many stages and actions and our results suggest a situation in the UK that is evolving, with many organisations only starting the process. Of the 67% of respondents who reported that their organisation had at least begun looking at present and future threats, most often they were considering flooding from heavy rain (67%) and heatwaves (56%), and more than 40% of respondents reported having allocated both budget and staff time for planning. Roughly one-third of respondents said that adaptation was still separate from other activities within their organisation’s plans, with only about 7% saying that adaptation was integrated into all their organisation’s activities.
1 The RESiL-RISK survey provides some basis for comparison with the PREPARE surveys but was aimed at the general public rather than
organisations. See https://www.ukclimateresilience.org/projects/resilrisk-understanding-uk-perceptions-of-climate-risk-and-resilience/
50
About 16% of organisations reported having an adaptation plan, and a considerable proportion (37%) said their organisation did not but that plans were being made to develop one. A majority (64%) of those with plans noted that it was their first one. Many factors appear to influence decisions to develop plans, suggesting a complex situation with no overriding reasons, and organisations were more likely to respond to voluntary incentives (statutory requirements/encouragement did not stand out as a reason – or perhaps these are just lacking).
Surminski et al. (2021) found the adaptation actions that businesses take are dependent on “size, sector, location, past experience, access to information and resources, extent of a public-facing customer base, policy and regulatory frameworks in place, stakeholder and shareholder expectations, risk management processes, competitive advantage and company culture”.
Barriers to adapting to physical impacts that were ranked highly by respondents include: [insufficient] financial resources (highest by a considerable margin); complacency/staff attitude towards climate change; difficulty identifying effective measures; [lack of] access to, or awareness of, new technologies; and climate adaptation not being a priority/other things taking higher priority/having competing priorities. Respondents’ priorities for addressing these barriers were: having the financial resources to do so (highest by a considerable margin), improving their awareness of climate projections/impacts of changing climate (although, as already noted, responses about availability and ease of use were quite positive), and establishing legal obligations to require action. These results align with those from other surveys on climate information use and adaptation (e.g. Tang and Dessai, 2012) and suggest the need for a stronger evidence base on the economic and social benefits of taking risk reduction measures, complemented by greater use of policy instruments to promote action.
Over 80% of respondents indicated that responsibility for managing the impacts of climate change should be shared by national government and the international community, as many as 88% felt that the national government should have either full or partial responsibility and close to 85% said the responsibility should lie with the international community. This highlights a perceived strong role for leadership from government and collective responsibilities for adaptation.
Recommendation
• Most respondents felt that the Government should provide more information about the effects of climate change in the UK, plus funding/subsidies/tax breaks for adaptation, and that the Government should demonstrate how climate change is relevant to specific kinds of organisations. Organisations see a strong role for leadership from government and collective responsibility for adaptation, which should be recognised in efforts to promote adaptation.

51
References Boyd E, Street R, Gawith M, Lonsdale K, Newton L, Johnstone K, Metcalf G (2011) Leading the UK adaptation
agenda: a landscape of stakeholders and networked organizations for adaptation to climate change. In: Ford JD, Berrang-Ford L (eds) Climate change adaptation in developed nations: from theory to practice. Springer, Dordrecht. doi:10.1007/978-94-007-0567-8_6
Evans M (2013) PREPARE - Barriers and enablers to organisational and sectoral adaptive capacity - quantitative study, Part of the PREPARE Programme of research on preparedness, adaptation and risk, Final Report for project ERG1211 by Ricardo-AEA for Defra. Report reference Ricardo-AEA/R/ED58163/PREPARE R1b/Issue 1.1. http://randd.defra.gov.UK/Document.aspx?Document=11255_PREPARECA0513BusinessandLocalAuthoritysurvey-Finalreport.pdf
HM Treasury (2020) A Roadmap towards mandatory climate-related disclosures. https://assets.publishing.service.gov.uk/government/uploads/system/uploads/attachment_data/file/933783/FINAL_TCFD_ROADMAP.pdf
Institute for Government (2021) Timeline of UK government coronavirus lockdowns March 2020 to June 2021. https://www.instituteforgovernment.org.UK/charts/UK-government-coronavirus-lockdowns
IPSOS-Mori (2010) Climate Change Adaptation: A Survey of Private, Public and Third Sector Organisations [PREPARE-1 survey] http://sciencesearch.defra.gov.UK/Document.aspx?Document=GA0406_9458_FRP.pdf
Jude S R, Drew G H, Pollard S J, Rocks S A, Jenkinson K, Lamb R (2017) Delivering organisational adaptation through legislative mechanisms: Evidence from the Adaptation Reporting Power (Climate Change Act 2008). Science of the Total Environment 574: 858-871.
Lorenz S, Dessai S, Forster P M and Paavola J (2017) Adaptation planning and the use of climate change projections in local government in England and Germany. Regional Environmental Change, 17(2): 425-435.
Lowe et al. (2018) UKCP18 Science Overview Report. Met Office.
Met Office (2018) Was summer 2018 the hottest on record? Press release. https://www.metoffice.gov.UK/about-us/press-office/news/weather-and-climate/2018/end-of-summer-stats
Met Office (2020) 2020 ends earth’s warmest 10 years on record. Press release. https://www.metoffice.gov.UK/about-us/press-office/news/weather-and-climate/2021/2020-ends-earths-warmest-10-years-on-record
Met Office (2021) NCIC Monthly Summary: April 2021. https://www.metoffice.gov.UK/binaries/content/assets/metofficegovUK/pdf/weather/learn-about/UK-past-events/summaries/UK_monthly_climate_summary_202104.pdf
National Climate Information Centre (2013) UK Seasonal Weather Summary: Winter 2012/2013. Weather, 68: 99-99. https://doi.org/10.1002/wea.2117
Nuffield Trust (2021) Health & social care explained. https://www.nuffieldtrust.org.UK/health-and-social-care-explained/nhs-reform-timeline/
Porter J J, Demeritt D and Dessai S (2015) The right stuff? Informing adaptation to climate change in British local government. Global Environmental Change, 35, 411-422.
Ramírez R and Wilkinson A, (2016) Strategic reframing: the Oxford scenario planning approach. Oxford University Press.
Steentjes, K., Demski, C., Seabrook, A., Corner, A. & Pidgeon, N. (2020). British Public Perceptions of Climate Risk, Adaptation Options and Resilience (RESiL RISK): Topline findings of a GB survey conducted in October 2019. Cardiff: Cardiff University.
Surminski, S. (2021) Business and industry. In: The Third UK Climate Change Risk Assessment Technical Report [Betts, R.A., Haward, A.B. and Pearson, K.V. (eds.)]. Prepared for the Climate Change Committee, London.
Tang S and Dessai S (2012) Usable Science? The U.K. Climate Projections 2009 and Decision Support for Adaptation Planning. Weather, Climate, and Society 4(4): 300-313.
Taylor A, Bruine de Bruin W and Dessai S (2014) Climate Change Beliefs and Perceptions of Weather-Related Changes in the United Kingdom. Risk Analysis 34.11 (2014): 1995-2004.
https://www.metoffice.gov.uk/about-us/press-office/news/weather-and-climate/2018/end-of-summer-stats

52
Appendix: Additional methodology detail and results Data collection
While PREPARE-2 was conducted using targeted telephone surveys, PREPARE-3 was administered using an online platform. To best target individuals of organisations within the relevant sectors and regions, we contracted the services of a market research company, Lucid, to administer the survey on our behalf using the online platform Decipher. Decipher was preferred over similar platforms such as Qualtrics, due to ease of implementing logic within the survey as well as data processing, cleaning and reporting. Lucid managed the survey within the platform and offered several targeting, recruitment, screening and quality control methods, including questions to check respondents’ attention during the survey. Lucid concentrated on collecting responses from the same five sectors covered within the 2010 and 2013 PREPARE surveys (private sector, public health, public education, local authorities, and third sector). Some of the sectors had seen change since 2013: for example, a reform and new architecture for the National Health Service, from April 2013, which formed clusters from the pre-existing Primary Care Trusts and reduced the number of Strategic Health Authorities to four regional bodies (Nuffield Trust, 2021).
The 2013 PREPARE-2 survey had utilised a purposive sampling approach and aimed to interview one person per organisation by considering a range of functions/titles related to organisational planning (e.g. Planning or Risk Manager, Environmental Manager, and other planning and strategy-related job titles or headteachers within the education sector). For the 2021 survey Lucid was tasked with targeting respondents with such roles and titles across all four UK nations. To further ensure we were getting responses from suitable people, we included screening questions within the online survey relating to the rank/title of the person. As well, just as the 2013 PREPARE-2 study did, we specifically asked if the respondent was “suitable to discuss threats and opportunities facing their organisation”.
A pilot sample of 200 respondents was initially collected to test the questions and ensure sufficient data quality before proceeding with the full survey sample. Individuals who did not meet minimum qualitative thresholds were excluded from the survey and their responses were not included. Final data screening was performed by Lucid to ensure good-quality responses and minimise non-responses.
According to Lucid’s data, a total of 6,629 people clicked through to the survey and 3,056 completed it; the final number of qualified completes, after quality control checks, post-survey screening and removals, was 2,429. Respondents took a median average of just over 17 minutes to complete the survey. Full questionnaire and data tables are not included in this report but these will be uploaded to a UKRI data repository when the main research articles are submitted for publication.
Due to differences in the sample collection methods between the 2013 and 2021 surveys, and changes in the nature of the samples (e.g. how the sectors were described or defined), there are caveats to the use of inferential statistical techniques across time, mainly due to issues of representativeness of the different populations of interest. To minimise potential issues, we have limited temporal comparisons to examining the direction of changes in the corresponding proportions across time. We also note that while we have not attempted to follow the sampling quotas used within the 2009/10 and 2012/13 surveys, the 2021 sample did not include nationally representative quotas nor weighting criteria, due to practical challenges in using this approach and collecting this data, and since we wanted to ensure a wide sample base through a simplified sampling approach. No personally identifiable information was collected from any of the survey respondents, who remain completely anonymous. We did, however, ask for respondents’ gender in the 2021 survey, and report that of the 2,429 respondents, 1,163 (48%) identified as female, while 1,263 (52%) identified as male. Three individuals (0.1%) opted to not indicate a gender.
Suitability of and confidence in respondents
A screening question included in the 2013 survey was “Can I just check, are you the best person to talk about threats and opportunities facing the organisation at this particular workplace – this is sometimes called risk management?” We also used this question as part of a purposive sampling technique to ensure that we were reaching the right audiences. Anyone who responded “No” was automatically excluded from the survey, ensuring that we only used the responses from those who felt they were
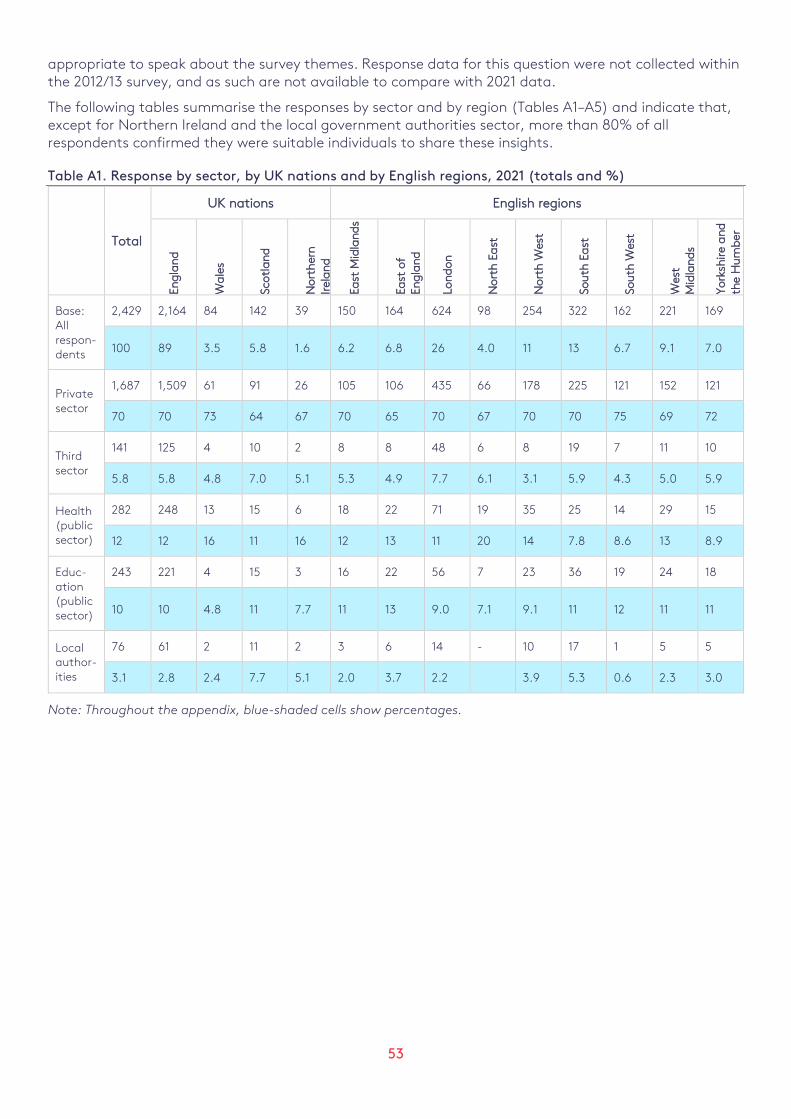
53
appropriate to speak about the survey themes. Response data for this question were not collected within the 2012/13 survey, and as such are not available to compare with 2021 data.
The following tables summarise the responses by sector and by region (Tables A1–A5) and indicate that, except for Northern Ireland and the local government authorities sector, more than 80% of all respondents confirmed they were suitable individuals to share these insights.
Table A1. Response by sector, by UK nations and by English regions, 2021 (totals and %)
Total
UK nations English regions
Engl
and
Wal
es
Scot
land
Nor
ther
n Ir
elan
d
East
Mid
land
s
East
of
Engl
and
Lond
on
Nor
th E
ast
Nor
th W
est
Sout
h Ea
st
Sout
h W
est
Wes
t M
idla
nds
York
shire
and
th
e H
umbe
r
Base: All respon-dents
2,429 2,164 84 142 39 150 164 624 98 254 322 162 221 169
100 89 3.5 5.8 1.6 6.2 6.8 26 4.0 11 13 6.7 9.1 7.0
Private sector
1,687 1,509 61 91 26 105 106 435 66 178 225 121 152 121
70 70 73 64 67 70 65 70 67 70 70 75 69 72
Third sector
141 125 4 10 2 8 8 48 6 8 19 7 11 10
5.8 5.8 4.8 7.0 5.1 5.3 4.9 7.7 6.1 3.1 5.9 4.3 5.0 5.9
Health (public sector)
282 248 13 15 6 18 22 71 19 35 25 14 29 15
12 12 16 11 16 12 13 11 20 14 7.8 8.6 13 8.9
Educ-ation (public sector)
243 221 4 15 3 16 22 56 7 23 36 19 24 18
10 10 4.8 11 7.7 11 13 9.0 7.1 9.1 11 12 11 11
Local author-ities
76 61 2 11 2 3 6 14 - 10 17 1 5 5
3.1 2.8 2.4 7.7 5.1 2.0 3.7 2.2 3.9 5.3 0.6 2.3 3.0
Note: Throughout the appendix, blue-shaded cells show percentages.
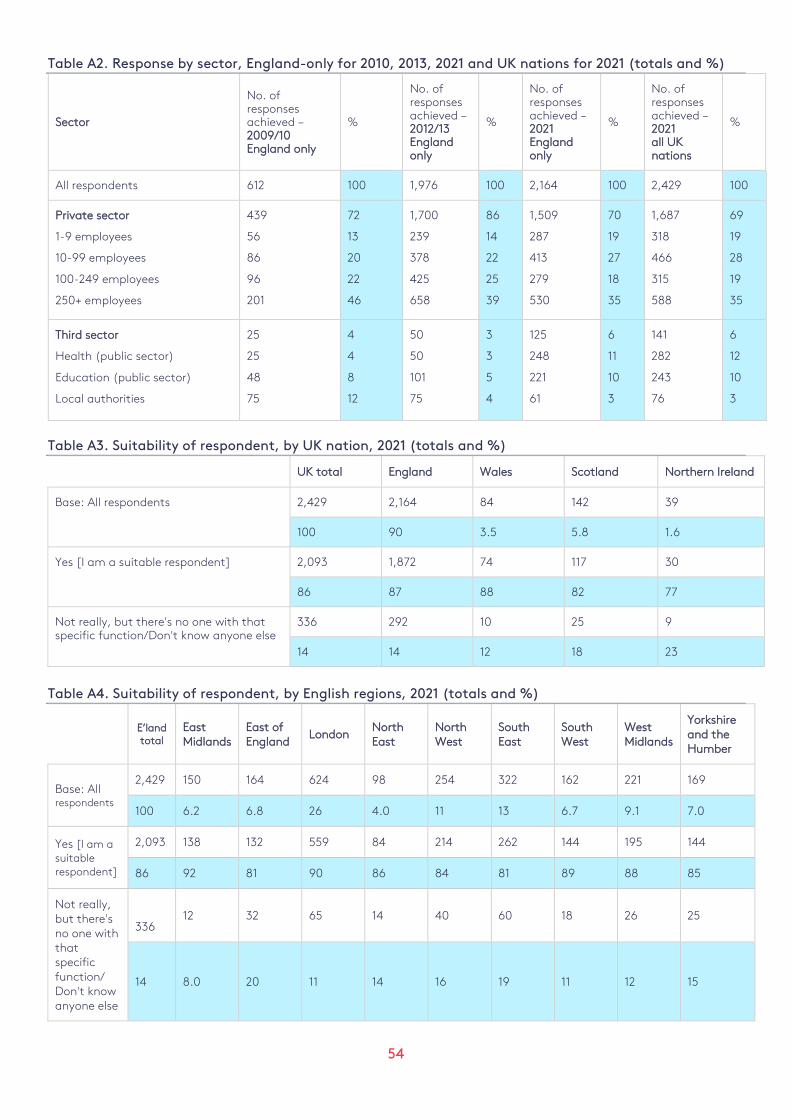
54
Table A2. Response by sector, England-only for 2010, 2013, 2021 and UK nations for 2021 (totals and %)
Sector
No. of responses achieved – 2009/10 England only
%
No. of responses achieved – 2012/13 England only
%
No. of responses achieved – 2021 England only
%
No. of responses achieved – 2021 all UK nations
%
All respondents 612 100 1,976 100 2,164 100 2,429 100
Private sector
1-9 employees
10-99 employees
100-249 employees
250+ employees
439
56
86
96
201
72
13
20
22
46
1,700
239
378
425
658
86
14
22
25
39
1,509
287
413
279
530
70
19
27
18
35
1,687
318
466
315
588
69
19
28
19
35
Third sector
Health (public sector)
Education (public sector)
Local authorities
25
25
48
75
4
4
8
12
50
50
101
75
3
3
5
4
125
248
221
61
6
11
10
3
141
282
243
76
6
12
10
3
Table A3. Suitability of respondent, by UK nation, 2021 (totals and %)
UK total England Wales Scotland Northern Ireland
Base: All respondents 2,429 2,164 84 142 39
100 90 3.5 5.8 1.6
Yes [I am a suitable respondent] 2,093 1,872 74 117 30
86 87 88 82 77
Not really, but there's no one with that specific function/Don't know anyone else
336 292 10 25 9
14 14 12 18 23
Table A4. Suitability of respondent, by English regions, 2021 (totals and %)
E’land total
East Midlands
East of England
London North East
North West
South East
South West
West Midlands
Yorkshire and the Humber
Base: All respondents
2,429 150 164 624 98 254 322 162 221 169
100 6.2 6.8 26 4.0 11 13 6.7 9.1 7.0
Yes [I am a suitable respondent]
2,093 138 132 559 84 214 262 144 195 144
86 92 81 90 86 84 81 89 88 85
Not really, but there's no one with that specific function/ Don't know anyone else
336
12 32 65 14 40 60 18 26 25
14 8.0 20 11 14 16 19 11 12 15
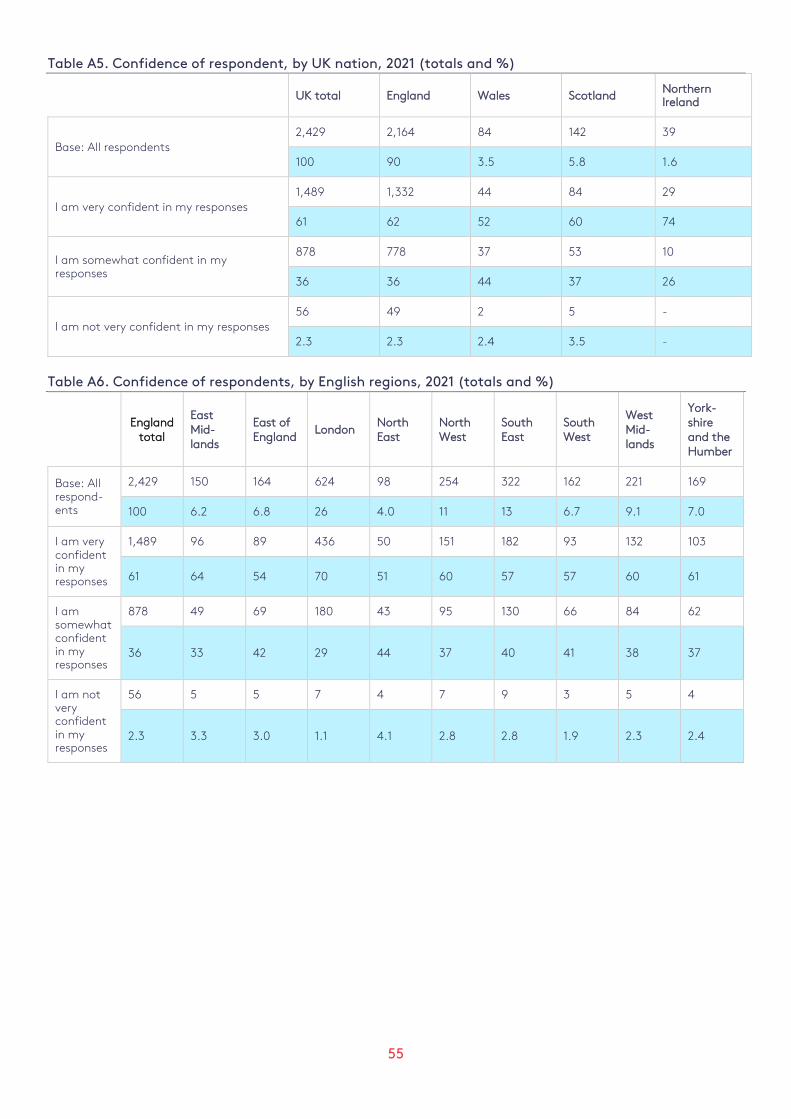
55
Table A5. Confidence of respondent, by UK nation, 2021 (totals and %)
UK total England Wales Scotland Northern Ireland
Base: All respondents 2,429 2,164 84 142 39
100 90 3.5 5.8 1.6
I am very confident in my responses 1,489 1,332 44 84 29
61 62 52 60 74
I am somewhat confident in my responses
878 778 37 53 10
36 36 44 37 26
I am not very confident in my responses 56 49 2 5 -
2.3 2.3 2.4 3.5 -
Table A6. Confidence of respondents, by English regions, 2021 (totals and %)
England total
East Mid-lands
East of England
London North East
North West
South East
South West
West Mid-lands
York-shire and the Humber
Base: All respond-ents
2,429 150 164 624 98 254 322 162 221 169
100 6.2 6.8 26 4.0 11 13 6.7 9.1 7.0
I am very confident in my responses
1,489 96 89 436 50 151 182 93 132 103
61 64 54 70 51 60 57 57 60 61
I am somewhat confident in my responses
878 49 69 180 43 95 130 66 84 62
36 33 42 29 44 37 40 41 38 37
I am not very confident in my responses
56 5 5 7 4 7 9 3 5 4
2.3 3.3 3.0 1.1 4.1 2.8 2.8 1.9 2.3 2.4
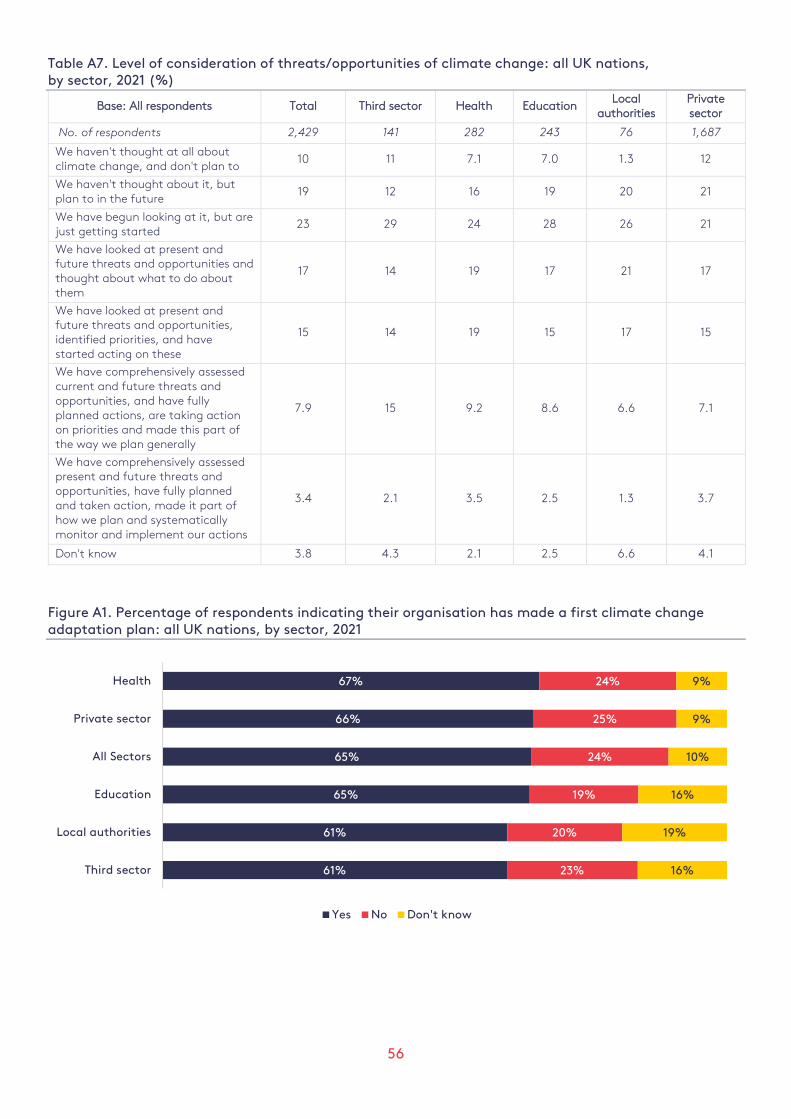
56
Table A7. Level of consideration of threats/opportunities of climate change: all UK nations, by sector, 2021 (%)
Base: All respondents Total Third sector Health Education Local
authorities Private sector
No. of respondents 2,429 141 282 243 76 1,687
We haven't thought at all about climate change, and don't plan to
10 11 7.1 7.0 1.3 12
We haven't thought about it, but plan to in the future
19 12 16 19 20 21
We have begun looking at it, but are just getting started
23 29 24 28 26 21
We have looked at present and future threats and opportunities and thought about what to do about them
17 14 19 17 21 17
We have looked at present and future threats and opportunities, identified priorities, and have started acting on these
15 14 19 15 17 15
We have comprehensively assessed current and future threats and opportunities, and have fully planned actions, are taking action on priorities and made this part of the way we plan generally
7.9 15 9.2 8.6 6.6 7.1
We have comprehensively assessed present and future threats and opportunities, have fully planned and taken action, made it part of how we plan and systematically monitor and implement our actions
3.4 2.1 3.5 2.5 1.3 3.7
Don't know 3.8 4.3 2.1 2.5 6.6 4.1
Figure A1. Percentage of respondents indicating their organisation has made a first climate change adaptation plan: all UK nations, by sector, 2021
67%
66%
65%
65%
61%
61%
24%
25%
24%
19%
20%
23%
9%
9%
10%
16%
19%
16%
Health
Private sector
All Sectors
Education
Local authorities
Third sector
Yes No Don't know

This report summarises the headline findings of a survey, known as ‘PREPARE-3’, carried out from April to May 2021 on awareness among organisations of climate change, its physical risks and how organisations are taking action to prepare for perceived risks.
The analysis is relevant for the private sector and related associations, and the public sector and policymakers focused on improving the role and inclusion of adaptation, preparedness and risk resilience initiatives within organisational planning.
The study is a revisit of two previous PREPARE surveys, from 2009/10 and 2012/13. The motivation for the expanded 2021 survey and this new report come from the extensive institutional, political, policy, national, regional and global changes that have occurred since the original two surveys.
Front cover photo: Chris Gallagher, Unsplash
www.cccep.ac.uk
www.lse.ac.uk/granthaminstitute