
Multi-functional Extreme Environment Surfaces: Nanotribology for

UNIVERSITAgrave DEGLI STUDI DI NAPOLI ldquoFEDERICO IIrdquo
Corso di dottorato in Ingegneria dei Prodotti e dei Processi
Industriali (XXIX ciclo)
Organic and Inorganic Material-Based
Functional Surfaces for Sensors and
Biosensors Synthesis and Design
Dottorando
Aldobenedetto Zotti
Coordinatore Relatori
Chmo Prof Dottssa
Giuseppe Mensitieri Anna Borriello
Chmo
Prof Giuseppe Mensitieri
ANNO ACCADEMICO 20162017
1
In memory of my father
Aldo Zotti (1951-2016)
2
List of Content
List of abbreviations 3
1 Introduction 4
2 State of art on sensor and biosensors 7
21 VOCs and GPL sensors 10
References 24
3 Long Period Gratings 26
31 Principle of Operation 26
32 LPGs Typologies 31
References 34
4 Methods and Instrumentations 36
41 LPG reflection probes and optoelectronic set-up 36
42 Silver Mirror Deposition 38
43 Dip-Coating Technique 39
References 41
5 GPL sensors based on a-PS coatings 43
51 Introduction 43
52 Materials and GPL sensing test set-up 45
53 Results and discussion 49
References 60
6 Humidity sensors based on TiO2 coatings 61
61 Introduction 61
62 Materials and climatic chamber 63
63 Results and discussion 65
References 81
7 Drug resistant bacteria biosensor based on a-PSPMMA coatings 83
71 Introduction 83
72 Materials and SRI characterization 85
73 Results and discussion 87
74 Data analysis interpretation 100
75 Design and realization of an automated robotic arm 107
References 110
8 Conclusion 111
3
List of abbreviations
EI - electromagnetic interference
RI ndash Refractive Index
FBG ndash Fiber Bragg Grating
LPG ndash Long Period Grating
GPL ndash Liquefied Petroleum Gas
a-PS ndash Atactic Polystyrene
VOC - Volatile Organic Compounds
ppm ndash Part per million
RH ndash Relative Humidity
AAO - Anodic Aluminum Oxide
QCM ndash Quartz Crystal Microbalance
PEI - Poly (ethylenimine)
PAA - poly (acrylic acid)
GOD - glucose oxidase
SRI - Surrounding Medium RI
MFC ndash Mass Flow Controller
LHC - Large Hadron Collider
BL - β-lactamases
ESBL - Extended-spectrum BL
3-APBA ndash 3 Aminophenyl boronic acid
EDC - N-ethyl-Nrsquo-(3- (dimethylamino)propyl)carbodiimide
NHS - N-hydroxysuccinimide
4
1 Introduction
Advancement of sensor technology over the past few decades has led to significant
progress in all scientific and technological fields such as environmental and atmospheric
monitoring agriculture industrial processing medicine and biotechnology
Environmental and atmospheric monitoring ie the control of air pollution caused by
industry and exhaust gases from automobiles has become a critical issue In agriculture
sensors can be used for animal and plant disease diagnostics detection of contaminants
and pathogens in milk meat and other foods and determination of product quality such
as the ripeness and flavors of fruits and vegetables in the field Medicine is another
important field for sensor applications emerging requirements for sensors in the medical
and healthcare sector are being driven by movement toward the continuous monitoring
of patients Breath analysis is one of the possible applications of gas sensors in medicine
At present there are a wide variety of devices based on different materials and operating
on diverse principles which can be applied for analytes detection Physics chemistry and
technology of sensors require a better understanding of both the bulk and surface
properties of the sensing materials One expects that a sensing material should have high
sensitivity and selectivity small response and recovery times minimum environmental
degradations room temperature operation and low power consumption Therefore the
selection and development of an active material is a challenge The active sensing
materials acts as a catalyst for sensing a particular analyte or a set of analytes The recent
development in the nanotechnology has paved the way for large number of new materials
and devices of desirable properties which have useful functions for numerous chemical
sensor and biosensor applications Basically by creating nanostructure it is possible to
control the fundamental properties of materials even without changing their chemical
composition
5
The study of the interface between the analyte and the sensitive material represents a
fundamental step in the design development and understanding of any chemical and
biological analysis In first approximation the problem of compatibility is solved by
operating an appropriate choice of materials which act as an interface and are adapted to
the interaction of molecules and macromolecules
The interface is designed not only as a measuring environment but as an integral part of
the measurement system Modern chemical sensors are focused on the study of
applications in which analyte sensor and elaboration unit are integrated in order to
achieve measuring elements that are portable and easy to use In this context it is
fundamental the engineering of the interface ie the part that interacts with the analyte
and which can be modified by means of different techniques in order to obtain specific
characteristics these concern not only the compatibility but also other surface properties
that may be required by the application (wettability surface tension chemical reactivity
etc)
The sensing material is the main component of a sensor but without an appropriate
transducer it is not possible to convert the sensible material property change in a readable
signal On the other hand the transducer itself is not able of interacting with the external
medium the sensor is then blind Therefore to develop an efficient sensor different
aspects must be considered the sensible material the transducer typology and the
interaction between material and transducer
During the last decades the technology and applications of optical fibers have evolved
very quickly Sensors employing optical fibers as transducers exhibit many advantages
over their electrical counterparts including higher responsivity higher detection
bandwidth capability of operating in a wide temperature range immunity to EI
possibility of using any material as sensing film regardless of its dielectric nature greater
environmental resistance and flexibility Moreover in applications where the working
6
space is stringent or where physical intrusion must be minimized it become highly
desirable to develop ultra-compact sensors that can maintain the level of performances
despite the miniaturization Among all fiber-based optical sensors Long Period Gratings
are the most popular devices used for developing chemical sensors and biosensors
The thesis is focuses on the realization of integrated optical biosensors by the engineering
of materials and interfaces and by means of innovation of the transduction platforms The
transducer is the Long Period Gratings (LPGs) with different organic andor inorganic
materials as sensitive elements The careful study of the sensing materials as well as the
optimization of the deposition process can lead to an improved sensor (chemical and
biological) in term of compactness responsivity detection bandwidth and response time
compared to commercial sensors In particular three different devices as been developed
during these three years
- GPL sensor based on a-PS coatings in the framework of the OPTOFER Project
(Cap 5)
- Cryogenic humidity sensors based on Titanium Oxide coatings during a
collaboration agreement with CERN (Cap6)
- Drug resistant bacteria biosensor based on a-PSPMMA coatings in the framework
of the OPTOBACTERIA European Project (Cap 7)
All results in this thesis derived by integrating knowledges in different scientific areas
(optical engineering biochemistry polymer materials etc) fulfil the interdisciplinary
scope
7
2 State of art on sensor and biosensors
Recently gas sensing as a typical application in intelligent systems is receiving
increasing attention in both industry and science Sensing technology has become more
significant because of its widespread and common applications in the following areas
industrial production (eg methane detection in mines) [1] automotive industry (eg
detection of polluting gases from vehicles) [2] medical applications (eg electronic
noses simulating the human olfactory system) [3] indoor air quality supervision (eg
detection of carbon monoxide) [4] environmental studies (eg greenhouse gas
monitoring) [5]
To evaluate the performance of gas sensing methods or gas sensors several indicators
should be considered sensitivity - the minimum target gases volume detectable
selectivity - the ability of gas sensors to identify a specific gas among a gas mixture
response time - the period from the time when gas concentration reaches a specific value
to that when sensor signal reaches a plateau value energy consumption reversibility -
whether the sensing materials could return to its original state after detection adsorptive
capacity (also affects sensitivity and selectivity) fabrication cost
Sensors are classified on the basis of the property that is measured in presence of the
analyte Fig 1 shows the classification proposed by Liu et al [6] As it is evident the
most developed class of sensor is that of the electrochemical sensors in which the
transducing signal is the electric conductivity change in presence of the analyte Most of
the electrochemical sensors are based on metal oxide semiconductor which exhibit
significantly greater sensitivity to inorganic gases like ammonia and a few kinds of VOCs
like alcohol (C2H5OH) and formaldehyde [6] However metal oxide semiconductor-
based sensors are not able to detect VOCs with high selectivity and their inability to
discriminate between different gasses is a remarkable drawback As humans could easily
8
breathe VOCs since they are commonly used as ingredients in household products or in
industrial processes it is important to selectively monitor the concentration of these
vapors to safeguard the health of residents and workers and to keep atmospheric
emissions under control in order to avoid environmental hazards Unlike metal oxide
semiconductors polymer are suitable to discriminate between different gasses and vapors
classes Furthermore these inorganic materials need high operative temperature (over
300degC)
Figure 1 Sensor classification proposed by Liu et al [6]
For these reasons polymers have begun to be studied and employed in the sensing area
Although conductive polymers are also used as electrochemical sensors the area where
polymers find most successful is the optical sensing in fact they are extensively used as
sensible coating for optical fiber sensors
The optical fiber sensors have advantages that include immunity to EI lightweight small
size large bandwidth and ease in implementing multiplexed or distributed sensors
Moreover optical fiber sensors could achieve higher sensitivity selectivity stability and
lower response time (which enables on-line real time detection) than non-optical methods
with much longer lifetime Strain temperature and pressure are the most widely studied
measurands and the fiber grating sensor represents the most widely studied technology
for optical fiber sensors as shown in Fig 2 which shows the technologies involved in the
optical fiber sensors presented at 15th Optical Fiber Sensors Conference (OFS-15) [7]
9
Figure 2 Distribution of OFS-15 papers according to technologies [7]
Although the formation of fiber gratings had been reported in 1978 [8] intensive study
on fiber gratings began after a controllable and effective method for their fabrication
developed in 1989 [9] Extensive studies have been performed on fiber grating sensors
and some of which have now reached commercialization stages Fig 3 shows some types
of fiber gratings Under phase matching conditions a FBG couples the forward
propagating core mode to the backward propagating core mode A LPG can couple the
forward propagating core mode to one or a few of the forward propagating cladding
modes
Figure 3 Types of fiber gratings (a) Fiber Bragg grating (b) long-period fiber grating [7]
In particular LPG has been used as a RI sensor because of its high RI sensitivity If the
coating or jacket is removed from the optical fiber the evanescent field of the cladding
mode that exists outside the cladding experiences the RI change of the outside material
The selectivity and sensitivity can be tuned by depositing a thin film overlay on the
grating region as reported by Rees et al [10] he has coated an LPG with an organic film
by the LamgmuirndashBlodgett technique and studied the influence of the overlay material
10
thickness on the LPG response the film has been proved to be chemically sensitive so
the LPG film sensors could be used as species-specific chemical sensors
21 VOCs and GPL sensors
VOCs are organic chemical compounds that have a high vapor pressure at ordinary room
temperature Their high vapor pressure results from a low boiling point which causes
large numbers of molecules to evaporate from the liquid form of the compound and enter
the surrounding air VOCs are numerous varied and some examples are the followers
aromatic and aliphatic hydrocarbons (such as methane propane butane and benzene)
aldehydes (such as formaldehyde) alcohol (such as ethanol and propanol) and
chlorofluorocarbons In addition GPL is classified as a VOC
GPL or liquid petroleum gas are flammable mixtures of hydrocarbon gases used as fuel
in heating appliances cooking equipment and vehicles Varieties of GPL bought and sold
include mixes that are mostly propane (C3H8) mostly butane (C4H10) and most
commonly mixes including both propane and butane Propylene butylene and various
other hydrocarbons are usually also present in small concentrations LPG is prepared by
refining petroleum or wet natural gas and is almost entirely derived from fossil fuel
sources being manufactured during the refining of petroleum (crude oil) or extracted
from petroleum or natural gas streams as they emerge from the ground
As reported in the previous paragraph metal oxide semiconductor are the most common
materials used to develop electrochemical VOCs sensors Generally the used oxide are n
type semiconductors [11-13] (charge carrier are electrons) but this is not a general rule
because NiOx oxides that are p type semiconductors (charge carrier are holes) result
widely employed in VOCs detection The most employed oxides as sensing material in
VOCs sensors are iron oxide (Fe2O3) [11] tin oxide (SnO2) [12] and titanium oxide
(TiO2) [13] Thin Fe2O3 layers deposited using catodic sputtering have been employed
11
by Siroky et al [11] to realize an hydrogen and VOCs detector the operative temperature
is 350-400degC In order to obtain a device able to discriminate between toluene and o-
xylene in 1997 Llobet et al [12] developed a sensors array based on SnO2 films the
simultaneous tracking of the stationary (response absolute value) and in time (response
time) signal has allowed to evaluate the device selectivity Using different sol-gel
methods is possible to realize TiO2 based sensors with different sensing performances as
studied by Garzella et al [13] in 2000 In this work developed devices have shown
promising response toward ethanol and methanol although operative temperature are
very high (400-500degC) Fig 4 shows the performances obtained in the cited
Figure 4 (a) Response as function of hydrogen concentration (ppm) for the Fe2O3 sensor at
different operative temperature [11] (b) in time response for the SnO2 sensors array [12] (c)
response as function of ethanol and methanol concentration (ppm) for the TiO2 sensor at
different operative temperature [13]
GPL has characterized by a boiling point lower than room temperature It is heavier than
air unlike natural gas and thus it flows along floors and tend to settle in low spots such
as basements GPL results very dangerous for two reasons the first is the risk of explosion
if the mixture of gas and air is within the explosive limits and there is an ignition source
the second is suffocation due to gas displacing air causing a decrease in oxygen
concentration
For these reasons great efforts are done to obtain sensible and selective GPL sensors At
now commercial GPL sensors are based on metal oxide semiconductor in particular
pure oxides (eg ZnO [14] SnO2 [15] Fe2O3 [16]) mixed oxides (eg NiFe2O4 [17]) and
heterojunctions [18] In 2011 Chaisitsak et al [15] have developed a GPL sensor based
12
on SnO2 layers doped with F as shown in Fig 5 operative temperature is a critical
parameter in device sensing performance
Figure 5 Resistance variation as function of time for SnO2F sensor in presence of either pure
N2 or N2GPL mixture at (a) 300degC and (b) 400degC [15]
Although GPL sensors are generally realized using planar architecture (the sensing
meaurand is the electrical conductibility variation) some researchers have proposed to
develop sensors using optical fibers An example is the work of Abdelghani et al [16]
who have coated optical fibers with porous silica (realized with a sol-gel method) Results
are shown in Fig 6 and it is evident the sensor ability to discriminate between chlorinated
hydrocarbons and alkanes (main components in GPL) The firsts have higher RI than the
optical fiber cladding (nclad = 14) while the seconds are characterized by a lower RI and
that justify the selectivity of the sensor
Figure 6 Response as function of analyte concentration analyte is (a) chlorinated hydrocarbons
and (b) alkanes [16]
13
22 Humidity sensors
Humidity and temperature are among the most frequently measured physical quantities
in measurement science Whereas the measurement of temperature can nowadays be done
with a satisfactory accuracy measurement of the water vapor content of gaseous
atmospheres ie hygrometry appears much more complex Water vapor is a natural
component of air and it plays an important role in a wide and various range of practical
measurement situations Today different humidity sensors exist for miscellaneous
applications [19 20] Recent achievements in miniaturization have certainly encouraged
the development of miniaturized humidity sensors Today roughly 75 of the humidity
sensors in commerce are based on the capacitive technique [21] There are on the other
hand multitudes of other hygrometers based on different transducing techniques such as
gravimetric and optical techniques
Figure 7 a) Honeycomb structure of AAO [22] b) Capacitance (mdash) and resistance (- - - -)
response of the Al2O3 sensor to RH at 11degC 25degC and 40degC [23]
Capacitive sensors are based on dielectric changes of thin films in presence of water
vapors Al2O3 is one of the most favorable ceramic sensing materials due to its negligible
dependence of temperature at nearly all range of RH from 25degC to 80degC [24] The small
pore radius makes Al2O3 sensitive to very low water vapor pressure The discovery of the
AAO sensibility toward humidity dates back to 1950 but it was practically employed
only in 1978 when researcher discover that it could form regular microstructure [25]
Low voltage anodization at certain conditions in acidic electrolyte solution forms Al2O3
14
layer consisting of hexagonal closepacked cylindrical pores perpendicular to the metal
surface (Fig 7a) Figure 7b shows the electrical characteristics of the Al2O3 sensors
versus RH at various temperatures [23]
TiO2 has three phases anatase rutile and brookite The third one is seldom used in
humidity sensing When heated strongly (sim1000degC) anatase automatically transforms to
the rutile structure Rutile is the most common phase of TiO2 while anatase is very rare
in nature For humidity sensing applications anatase TiO2 are usually made by solndashgel
method The sintering must be at low temperatures (eg lt500degC) for short time
Otherwise TiO2 may be turned into rutile Due to its higher water adsorption capacity
anatase is a preferred humidity sensing material However most TiO2-based sensors are
not sensitive at low humidity levels and have limited detection ranges from 10 to 30RH
[26 27] A newly developed TiO2 nanowireNafion composite sensor is capable to detect
RH levels between 12 and 98RH (Fig 8) with low hysteresis and good stability [28]
Figure 8 Humidity response curve of TiO2nanowiresNafion [28]
The most widely known gravimetric humidity sensor is the QCM Thin plates of
pietzoelectric quartz have resonance frequencies in the MHz- range Coated with a
hygroscopic layer the change of frequency acts as a measure of the humidity In 2009 a
novel humidity sensor was fabricated by electrospinning deposition of nanofibrous
polyelectrolyte membranes as sensitive coatings on a quartz crystal microbalance (QCM)
The results of sensing experiments indicated that the response of the sensors increased by
15
more than two orders of magnitude with increasing RH from 6 to 95RH (Fig 9a) at
room temperature exhibiting high sensitivity and that in the range of 20ndash95 RH the
Log(Δf) showed good linearity (Fig 9b) [29]
Figure 9 a) Frequency shifts of polyelectrolyte coated QCM humidity sensors as a function of
the RH b) The dependence of the frequency shifts of sensors on RH (20ndash95) and the
calibration curves obtained from (a) [29]
All the sensors discussed so far are generally not suitable to be employed in an
environment of a potentially hazardous or explosive nature and also in situations where
requirements such as immunity to electromagnetic interference multi sensor operation
in situ and remote monitoring are for example required Fiber optics offers a new
approach to this new measurement problem The fiber grating sensor represents a class
of intrinsic fiber optic sensor that has gained widespread popularity in recent years and
as previously stated they are generally classified into two main categories ie FBG and
LPG
As an example work reported by Yeo et al [30] demonstrates the applicability of
polymer-coated FBG as humidity sensors The swelling of the polyimide coating as a
result of the moisture absorption changes the Bragg wavelength of the FBG thus giving
a direct indication of the humidity level The results obtained are plotted in Fig 10
showing the Bragg wavelength shift of the PI-coated sensors with different coating
thickness used For each the RH response of the sensors was found to be linear with
increasing RH from 23 to 97RH
16
Figure 10 RH response of the sensors with different coating thicknesses from 23 to 97RH at
constant room temperature [30]
Recent studies by Venugopalan et al [31] have shown the use of polyvinyl alcohol (PVA)
film as a sensing material for LPG-based humidity detection In this work a ~4μm thick
PVA layer was deposited onto the grating of an LPG with a 300μm period The sensor
was evaluated over a relative humidity range from 33 to 97 using the resonance loss
band at 1500 nm where the change in transmission dip was monitored and calibrated
against humidity change The results are shown in Fig 11 the change of the spectral
characteristics of the sensor with RH leads to the calibration graph of resonance loss
vs RH
Figure 11 a) Spectral characteristics of PVA-coated LPG at 1500 nm b) Transmission dip
variation at various RH levels [31]
17
23 Biosensors
A biosensor is a device for the detection of an analyte that combines a biological
component with a physicochemical detector component It consists of 3 parts (see Fig
12)
A sensitive biological element (a biological material eg tissue microorganisms
organelles cell receptors enzymes antibodies nucleic acids etc)
A transducer or the detector element (optical piezoelectric electrochemical etc)
that transforms the measurand variation due to the interaction of the analyte with
the biological element into a measurable signal
A signal processors that are primarily responsible for the display of the results in
a user-friendly way
Figure 12 A schematic representation of biosensors
A biosensor is any device able to convert the interaction between its surface and a
biological element into a readable signal rejecting any other nonspecific signal
Table 1 Elements of a biosensor
Biosensors
Biological element
Sensor element
Enzyme Electric conductivity
Antibody Electromagnetic radiation
Nucleic Acid Mass
Tissue Temperature
Microbial Viscosity
Polysaccharide
Affinity biosensors are based on interaction between the immobilized biological
components on the transducer surface and target molecules The bioelement is very
specific to the analyte to which it is sensitive and it does not recognize other analytes
Biological elements used in affinity biosensors are for example antibody DNA and
18
receptor protein A detailed list of different possible bioelements and sensor-elements is
shown in table 1 These sensors can provide high sensitivity selectivity and low detection
limit
Biosensors can have a variety of biomedical industry and military applications as shown
in Fig 14 A major application is in blood glucose sensing because of its abundant market
potential However biosensors have tremendous potential for commercialization in other
fields of application such as biosensor-based instruments in food and beverage
production environmental sampling and noninvasive instruments for clinical analysis
However commercial adoption has been slow because of several technological
difficulties For example due to the presence of biomolecules along with semiconductor
materials biosensor contamination is a major issue
Figure 13 Biosensors application fields
The history of biosensors started in 1962 with the development of enzyme electrodes by
scientist Clark et al [32] Since then research communities from various fields such as
very large scale integration (VLSI) physics chemistry and material science have come
together to develop more sophisticated reliable and mature biosensing devices
Various types of biosensors being used are enzymebased tissue-based immunosensors
DNA biosensors and thermal and piezoelectric biosensors Updike et al [33] reported
the first enzyme-based sensor in 1967 Enzyme biosensors have been devised on
19
immobilization methods ie adsorption of enzymes by van der Waals forces ionic
bonding or covalent bonding The commonly used enzymes for this purpose are
oxidoreductases polyphenol oxidases peroxidases and aminooxidases [34]
An enzyme is a large protein molecule that acts as a catalyst in chemical reactions but
remains unchanged at the end of the reaction its working principle is illustrated in Fig
14a An enzyme upon reaction with a substrate forms a complex molecule that under
appropriate conditions forms the desirable product molecule releasing the enzyme at the
end The enzymes are extremely specific in their action enzyme X will change a specific
substance A to another specific substance B as illustrated in Fig 14b This extremely
specific action of the enzymes is the basis of biosensors
Figure 14 a) Working principle of enzymes b) Specificity of enzymes
The first microbe-based or cell-based sensor was actualized by Diviegraves et al [35] The
tissues for tissue-based sensors arise from plant and animal sources The analyte of
interest can be an inhibitor or a substrate of these processes However for this type of
biosensor the stability was high but the detection time was longer and the specificity
was reduced
Immunosensors were established on the fact that antibodies have high affinity towards
their respective antigens ie the antibodies specifically bind to pathogens or toxins or
interact with components of the hosts immune system The DNA biosensors were devised
on the property that single-strand nucleic acid molecule is able to recognize and bind to
20
its complementary strand in a sample The interaction is due to the formation of stable
hydrogen bonds between the two nucleic acid strands [36]
As reported in table 1 there are different types of transducing signals (sensor elements)
which define as many types of biosensors In resonant biosensors an acoustic wave
transducer is coupled with an antibody or bioelement When the analyte molecule or
antigen gets attached to the membrane the mass of the membrane changes The resulting
change in the mass subsequently changes the resonant frequency of the transducer This
frequency change is then measured
Since the anthrax spore bioterrorism attacks in America in 2001 the early detection of
Bacillus anthracis spores and vegetative cells has gained significant interest In 2008
Hao et al [37] have developed a novel QCM sensors for detection of Bacillus anthracis
This biosensor is based on a QCM sensor functionalized with an anti-Bacillus anthracis
monoclonal antibody designated to 8G3 (mAb 8G3 IgG) Optimized mAb 8G3 was
immobilized onto the Au electrode with protein A on a mixed self-assembled monolayer
(SAM) of 11-mercaptoundecanoic acid (11-MUA) and 6-mercaptohexan-1-ol (6-MHO)
as adhesive layer The schematic illustration of mAb functionalized QCM sensor is
depicted in Fig 15
Figure 15 Schematic illustration of mAb functionalized QCM sensor [37]
In Fig 16 is shown the response of the QCM biosensor to a range of concentrations of
Bacillus anthracis vegetative cells from 7times102 to 7times108 CFUml and their calibration
curve in logndashlog plot It was shown that the frequency shift of the QCM biosensor
increased along with the concentration of Bacillus anthracis vegetative cells
21
Figure 16 Changes of frequencies of mAb functionalized QCM biosensor response to
Bacillus anthracis vegetative cells in range of concentrations [37]
Another wide class of biosensors is based on the optical fibers fibers are a convenient
material for optical sensor design because they can be inexpensive and provide easy and
efficient signal delivery LPGs have attracted a great deal of attention in recent years for
biochemical sensing applications although the advantages of LPGs have been known
since the early 1990rsquos The earliest demonstration of biomolecule detection with LPGs
was in 2000 when etched LPGs were used to detect antibodies [38] where goat anti-
human IgG antibodies were linked to the fiber surface with glutaraldehyde and were then
used to detect aqueous human IgG These results showed repeatable detection down to
2microgmL with a dynamic range of 2ndash100microgmL
Figure 17 a) Spectral evolution of LPG resonance peak with different hemoglobin
concentrations b) wavelength shifts against hemoglobin concentration [39]
In 2007 Chen et al [39] were able to use etched LPGs for detection of hemoglobin In
this work the hemoglobin was allowed to adsorb non-specifically yielding an estimated
DL of around 0005 for hemoglobin in water Fig 17a shows the spectra of the
22
resonance peak under different solutions and Fig 17b plots its central wavelength shift
against the hemoglobin concentration
In 2016 Yin et al [40] have developed an highly sensitive glucose microfluidic chip
integrated with specialty optical fiber LPG sensor (inscribed in a small-diameter single-
mode fiber) A layer-by-layer self-assembly technique has been successfully applied to
prepare PEIPAA multilayers on the surface of the LPG sensor The negatively charged
GOD layer was then immobilized on the multilayer film for glucose sensing (Fig 18)
Figure 18 The layer-by-layer self-assembly scheme for the preparation of multilayer sensing
film [40]
Figure 20 (a) Response of the SDSMF-LPG biosensor to different glucose concentrations The
inset shows the measured transmission spectra (b) the measured dynamic response of the
biosensor [40]
When the glucose is oxidized with the GOD catalyst gluconic acid will be produced and
the pH of mixture solution changes with it Since the swelling degree of the (PEIPAA)n
multilayer sensing film depends on the pH of surrounding medium the sensing film will
23
swell with glucose concentration increasing and the induced RI change leads to a spectra
shift of the LPG sensor [41 42]
The fabricated glucose biosensors were tested in glucose solutions with different
concentrations Fig 20a shows the response of the LPG (with (PEIPAA)9(PEIGOD)1
multilayer film) to different glucose concentrations It can be seen that the resonant
wavelength shifts to longer values when the concentration of glucose increases in
accordance with the previous explanation The spectral dip stops red shift when the
glucose concentration increases to 2 μM It is mainly because that the pH no longer
changes after reacting for a specific period of time The dynamic response of the LPG
sensor is shown in Fig 20b and two aspect are evident 1) the response time is about 6
mins (time needed by the sensor to reach a stable signal) 2) the detection limit is 1 nM
24
References
[1] Y Wang MM Tong D Zhang Sensors 11 19ndash31 (2011)
[2] R Frodl T Tille IEEE Sens J 6 1697ndash1705 (2006)
[3] J Qu Y Chai SX Yang Sensors 9 895ndash908 (2009)
[4] E Cordos L Ferenczi S Cadar In Proceedings of 2006 IEEE International
Conference on Automation Quality and Testing Robotics pp 208ndash211 Romania 25ndash
28 May 2006
[5] GF Fine LM Cavanagh A Afonja Sensors 10 5469ndash5502 (2010)
[6] X Liu S Cheng H Liu Sensors 12 9635-9665 (2012)
[7] L Byoungho Optical Fiber Technology 9 57ndash79 (2003)
[8] KO Hill Y Fujii DC Johnson Appl Phys Lett 32 647ndash649 (1978)
[9] G Meltz WW Morey Opt Lett 14 823ndash825 (1989)
[10] N D Rees S W James R P Tatam Opt Lett 27 686 (2002)
[11] K Siroky J Jiresova L Hudec Thin Solid Films 245 211-214 (1994)
[12] E Llobet J Brezmes X Vilanova Sensors and Actuator B 41 13-21 (1997)
[13] C Garzella E Comini E Tempesti Sensors and Actuators B 68 189ndash196 (2000)
[14] P Mitra AP Chatterjee HS Maiti Materials Letters 35 33ndash38 (1998)
[15] S Chaisitsak Sensors 11 7127-7140 (2011)
[16] D Patil V Patil P Patil Sensors and Actuators B 152 299ndash306 (2011)
[17] L Satyanarayana KM Reddya SV Manorama Materials Chemistry and Physics
82 21ndash26 (2003)
[18] DS Dhawale RR Salunkhe UM Patil Sensors and Actuators B 134 988ndash992
(2008)
[19] Y Ma S Ma W Fang Sensors and Actuators A 49 47-50 (1995)
[20] V Matko D Donlagic Sensors and Actuators A 61 331-334 (1997)
25
[21] G Scholz Technisches Messen 59 88-109 (1992)
[22] Z Chen C Lu Sensors Letters 3 274-295 (2005)
[23] Z Chen M-C Jin in Proc 27th Annual Conf IEEE Industry Appl Soc 2 pp
1668 Houston(TX) 1992
[24] S Chakraborty K Nemoto K Hara Smart Materials and Structure 8 274 (1999)
[25] G E Thompson R C Furneaux G C Wood Nature 272 433 (1978)
[26] LL Chow MMF Yuen PCH Chan Sensors and Actuators B 76 310 (2001)
[27] MK Jain MC Bhatnagar GL Sharma Sensors and Actuators B 55 180 (1999)
[28] R Wu Y Sun C Lin Sensors and Actuators B 115 198-204 (2006)
[29] X Wang B Ding J Yu Nanotechnology 21 55502-55508 (2010)
[30] TL Yeo T Suna KTV Grattan Sensors and Actuators B 110 148ndash155 (2005)
[31] T Venugopalan TL Yeo T Sun In Proceedings Third European Workshop on
Optical Fibre Sensors 6619 pp 661925-1ndash661925-4 Naples (Italy) (2007)
[32] LC Clark C Lyons Annals New York Academy of Sciences 102 29-45 (1962)
[33] SJ Updike GP Hicks Nature 214 986-988 (1967)
[34] J Wang Chem Rev 108 (2) 814-825 (2008)
[35] C Diviegraves Ann Microbiol 126A 175-186 (1975)
[36] J Wang Biosensors and Bioelectronics 13(7-8) 757-762 (1998)
[37] R Hao D Wang X Zhang Biosensors and Bioelectronics 24 1330ndash1335 (2009)
[38] MP DeLisa Z Zhang M Shiloach Anal Chem 72 2895 (2000)
[39] X Chen K Zhou L Zhang Appl Opt 46 451 (2007)
[40] M Yin B Huang S Gao Biomedical Optics Express 7(5) 2067-2077 (2016)
[41] MJ Yin BB Gu JW Qian Anal Methods 4(5) 1292-1297 (2012)
[42] I Tokarev I Tokareva V Gopishetty Adv Mater 22(12) 1412ndash1416 (2010)
26
3 Long Period Gratings
31 Principle of Operation
Long Period Fiber Gratings are photonic devices realized by inducing a periodic
refractive index modulation (Λ=100‐500 μm) of the core of a single mode optical fiber
along few centimeters (L=2‐3 cm) of its length [1] This periodic perturbation makes
possible the power transfer from the fundamental guided core mode to a discrete number
of forward propagating cladding modes and to each of them at a distinct wavelength
where the so‐called phase matching condition is satisfied
λres0i = (neffco ndash neff0i
cl) Λ (eq 1)
where neffco and neff0i
cl are the core and ith cladding mode effective indices respectively
Λ is the grating period (see Fig 1a) As a result of this process referred to as mode
coupling the LPG transmission spectrum shows several attenuation bands or dips related
to the different excited optical fields the cladding modes (see Fig 1b) LPGs are
sensitive to a number of environmental parameters (temperature strain bending ambient
refractive index) which affect the phase matching condition changing in turn the
attenuation bands spectral position [2] However appropriate simple countermeasures
can be used to minimize the effect of the parameters not of interest
Figure 1 a) Pictorial description of mode coupling in LPGs b) typical LPG transmission
spectrum
27
The dependence of LPGs spectral features on SRI changes is what makes them very
attractive for chemical and biomolecular sensing applications [3 4] However bare LPGs
show the highest sensitivity for SRIs close to cladding refractive index (approx 145)
while they have poor performance in gaseous and watery environments [5] Moreover
they lack any chemical selectivity
The influence of SRI changes for a bare LPG is expressed by
dλres0i
dnsur=
dλres0i
dneffcl0i
dneffcl0i
dnsur (eq 2)
where nsur is the refractive index of the external medium The factor dneff0i
cldnsur is
different for each cladding mode and hence the spectral response of an LPG depends
strongly on the order of the coupled cladding mode The higher sensitivity is shown by
the higher order modes and as stated previously it occurs at refractive indexes
approaching that of the cladding For a given cladding mode the wavelength shift resulted
from the refractive index changes may be positive or negative depending on the local
slope of the phase matching curve dλdΛ where for low order modes it is typically
negative Although it is possible to enhance the sensitivity of an LPG by manipulating
the fiber parameters to obtain the appropriate order of the coupled cladding mode
however it is not possible to provide chemical selectivity with a bare LPG
It was recently demonstrated that the sensitivity of LPGs can be greatly enhanced by the
deposition of a thin overlay onto the cladding along the grating region provided that the
overlay has higher refractive index than the cladding [6] Moreover the sensitivity can be
optimized for a specific working environment by acting on thickness (ranging in hundreds
of nanometers) of the high RI layer which is in contact with the surface of the LPG itself
Therefore the deposition of thin high RI overlay of suitable thickness allows the
enhancement and optimization of the device sensitivity against SRI changes and
parametrical variations of the overlay features (RI and thickness) In addition if the
28
overlay is made of a material able to respond to chemicalphysical stimuli the coated
LPG can operate as an extremely sensitive sensor
When a thin high RI overlay is deposited onto a LPG the effective index of the cladding
modes increases and as it follows from eq 1 the attenuation bands experience a blue
shift (see Fig 2) By increasing the overlay thickness the attenuation bands move from
their initial position toward that initially occupied by the adjacent cladding mode of lower
order and this migration follows a transition function trend (see Fig 3) [7]
Figure 2 a) Sketch of a LPG coated with a high RI overlayer b) spectral changes against an
increasing overlayer thickness
When the attenuation bands of the coated LPG are tuned at the center of the spectral
separation of two consecutive attenuation bands as defined by the original bare device
then the device is working in the transition region or in transition mode A LPG working
in transition mode has the highest sensitivity to parametrical variations of the overlay
(thickness and RI) and to the SRI changes (see Fig 3b) From the physical point of view
the high RI overlay draws the optical field towards the external medium extending its
evanescent wave As a result there is an increased sensitivity of the device to the SRI
changes At the same time an increasing evanescent wave in the surrounding medium
corresponds to an increasing optical power fraction confined in the overlay
Therefore the sensitivity to the refractive index changes of the high RI overlay is even
bigger than that to the SRI changes High RI coated LPGs have been successfully
29
exploited for chemical and biomolecular sensing applications and are expected to become
a key technology in the sensing field within the next few years [8-10]
Figure 3 a) Conceptual plot explaining the wavelength shift of the attenuation bands as function
of the overlay thickness of a fixed SRI and given material b) sensitivity trend as a function of
the overlay thickness
Figure 4 Modal dispersion diagram for the first 20 cladding modes
Figure 4 shows the so called modal dispersion diagram for the cladding modes relative
to a generic optical fiber Each curve in the plot is related to a different cladding mode
and the mode order increases moving from right to left in the plot in particular the
dispersion curves for the first 20 cladding modes is reported The wavelength range
reported on the y‐axis is 1200‐1800 nm that is the common wavelength range for optical
spectrum analyzers (OSA) These curves are the result of a complex numerical
processing obtained solving the coupled mode equation that is a system of differential
equations derived by the coupled mode theory [11]
30
This plot is useful to determine the central wavelengths of the attenuation bands present
in the transmission spectrum and to which cladding mode they are related given a
specific grating period As an example in Fig 5 it is reported the same modal dispersion
diagram with a vertical line corresponding to a period Λ=400 μm This line intercepts the
modal curves of the first 5 cladding modes at the wavelengths 13028 nm 13259 nm
13696 nm 14443 nm 1581 nm respectively
Figure 5 Modal dispersion diagram with intercept at 400 μm period
The complete solution of the coupled mode equations for the device under consideration
leads to the spectral features reported in Fig 6
Figure 6 Transmission spectrum for a LPG with grating period at 400 μm
31
32 LPGs Typologies
The fabrication of LPGs relies upon the introduction of a periodic modulation of the
optical properties of the fiber This may be achieved by permanent modification of the
refractive index of the core of the optical fiber or by physical deformation of the fiber
321 UV-Induced LPGs
LPG fabrication method based on UV radiation is the most common approach for grating
fabrication and thus most of the results reported in literature are referred to this type of
fabrication The UV-induced index modulation is typically achieved in Ge-doped silica
fibers using wavelengths between 193 and 266 nm [12] This is the most widely utilized
method for the fabrication of LPGs The refractive index change is associated with the
formation of Ge-related glass defects Fibers with high photosensitivity have been
developed by co-doping the core with boron and germanium [13] The refractive index
modulation may be built up on a point-by-point basis or the entire length of the LPG may
be formed simultaneously by exposure of the fiber though an amplitude mask [14] via a
patterned mirror [15] or using a microlens array [16] facilitating rapid and reproducible
LPG fabrication
Figure 7 LPG fabrication using a UV laser [17]
32
A typical LPG fabrication configuration using UV irradiation through an amplitude
mask is shown in figure 7 The output from a UV laser source is used to illuminate the
optical fiber through an amplitude mask of appropriate period which may be fabricated
in chrome-plated silica or from a metal foil for example by milling a copper foil using a
Cu vapor laser The cylindrical lens produces a line focus oriented parallel to the axis of
the fiber
322 Arc-Induced LPGs
In LPG fabrication method based on Electric arc discharge the grating is written by
periodical local heating of the fiber using electric arc discharges and by applying lateral
stress on a standard fiber this provides good performances as well as high thermal
stability to the LPG [18] The electrical arc technique is much simpler and does not need
expensive laser equipment Typically the electrodes of a fusion-splicing machine are
used exposing a region of fiber with a length of the order of 100 μm to the arc limiting
the minimum period of LPG that may be fabricated
Figure 8 a) Apparatus for manufacturing of taperd LPG 1) broadband light source 2) optical
fiber 3) motorized translation stage 4) arc-generating electrodes 5) pulley 6) weight 7) optical
spectrum analyzer (OSA) 8) computer b) microscope image of the investigated tapered LPG
with Λ=600 μm [19]
When a tensile load is applied to the fiber the periodic variation in the diameter of the
fibre results in a periodic strain variation across the corrugated structure with a
concomitant periodic refractive index induced via the photoelastic effect The grating
33
period in arc-induced LPGs is determined by the moving step of the translation stage
(controlled by a computer) and by some other factors such as arc intensity arc duration
time and pulling weight A schematic diagram of the fabrication setup is plotted in Fig
8
34
References
[1] A M Vengsarkar PJ Lemaire JH Judkins J Lightwave Technol 14(1) 58-65
(1996)
[2] SW James RP Tatam Meas Sci Technol 14(5) 49-61 (2003)
[3] R Falciai AG Mignani A Vannini Sens Actuators B 74(1-3) 74-77 (2001)
[4] MP DeLisa Z Zhang M Shiloach Anal Chem 72(13) 2895-2900 (2000)
[5] H J Patrick A D Kersey F Bucholtz J Light Technol 16(9) 1606-1612 (1998)
[6] A Cusano A Iadicicco P Pilla Opt Express 14(1) 19-34 (2006)
[7] A Cusano A Iadicicco P Pilla Appl Phys Lett 89(20) 2011161-3 (2006)
[8] A Cusano A Iadicicco P Pilla J Lightwave Technol 24(4) 1776-1786 (2006)
[9] A Cusano P Pilla M Giordano Advanced Photonic Structure for Biological and
Chemical Detection Ed X Fan pp 35-75 (Springer 2009)
[10] P Pilla P Foglia Manzillo V Malachovska Opt Express 17(22) 20039-20050
(2009)
[11] T Erdogan J Opt Soc Am 14(8) 1760-1773 (1997)
[12] R Kashyap Fibre Bragg Gratings (London Academic) (1999)
[13] DL Williams BJ Ainslie JR Armitage Electron Lett 29 45-47 (1993)
[14] AM Vengsarkar PJ Lemaire JB Judkins J Lightwave Technol 14 58-64
(1996)
[15] HJ Patrick CG Askins RW Mcelhanon Electron Lett 33 1167-1168 (1997)
[16] SY Lu HY Tan MS Demokan Electron Lett 35 79ndash80 (1999)
[17] SW James RP Tatam Meas Sci Technol 14 49-61 (2003)
[18] G Rego O Okhotnikov E Dianov Journal Lightwave Technology 19(10) 1574-
1579 (2001)
35
[19] A Iadicicco S Campopiano A Cutolo International Journal On Smart Sensing
And Intelligent Systems 1(2) 354-369 (2008)
36
4 Methods and Instrumentations
41 LPG reflection probes and optoelectronic set-up
Generally LPGs are interrogated in transmission configuration ie the light enters from
a side of the fiber and come out of the other side Through the manipulation of the fiber
it is possible to interrogate the LPG in reflection mode in order to transform an LPG-
based device in a more practical probe As schematically represented in Fig 1a this
requires the integration of a selective mirror at the end of the optical fiber To this aim
the optical fiber inside which the LPG is written has to be properly cut and the fiber end-
face has to be coated by a reflecting metallic layer acting as a mirror
Figure 1 a) Schematic representation of an LPG working in reflection configuration and b) of
the consequent visibility increase in its attenuation bands
A key aspect in this step relies on the identification of the precise LPG position within
the optical fiber which is of fundamental importance in order to cut the fiber just after
the grating To understand this concern it must be considered that when the metallic layer
is realized on the fiber facet light passing through the LPG is reflected back and passes
through it for the second time This means that if the optical fiber containing the LPG is
cut immediately after the grating this will be equivalent to an LPG working in
transmission configuration and having a double length which also leads to the positive
implication of an increased resonance visibility as schematically represented in Fig 1b
37
Differently if the optical fiber is not cut just after the grating but at a distance L from it
the LPG will result in the cascade of two identical LPGs spaced by a distance d=2L This
would lead to the formation of interference fringes within the attenuation bands similarly
to those observed in a MachndashZehnder interferometer as schematically illustrated in Fig
2 [1] In light of these considerations a correct identification of the LPG position inside
the optical fiber is mandatory
Figure 2 a) Schematic representation of an LPG working in reflection configuration with the
mirror integrated at a distance L from the grating and b) of the consequent interference fringes
in the attenuation bands [2]
After having identified the LPG position a high precision fiber cleaver (Fujikura CT-30
Series) is used to cut the optical fiber just after the grating followed by the integration of
an Ag reflecting layer (ie the mirror) on the terminal face of the cut optical fiber
Figure 3 Schematic of the optoelectronic set-up used for the LPG transducer
Fig 3 shows a schematic of the optoelectronic set-up used during the LPG based sensors
manufacturing and for the SRI characterization of the final device It mainly comprises
38
a broadband light source (with bandwidth 1200-1700nm) a 2x1 directional coupler and
an optical spectrum analyzer connected to a PC
42 Silver Mirror Deposition
There are different method to deposit a reflective layer on the tip of the LPG To this aim
a silver mirror reaction (Tollensrsquo test) was adopted [3] Tollensrsquo test (or Tollensrsquo reagent)
is a chemical reagent used to determine the presence of an aldehyde functional groups in
a solution A positive test with Tollens reagent is indicated by the precipitation of
elemental silver often producing a characteristic silver mirror on the inner surface of
the reaction vessel
Specifically silver nitrate (AgNO3 01M) was dissolved in aqueous solution of potassium
hydroxide (KOH 08M) the brown precipitate formed was dissolved in two drops of
ammonia (NH3 30 ww) with stirring The Ag+ ions reacted with OH- to produce a
brown precipitate of Ag2O which was dissolved in an excess of aqueous ammonia
forming [Ag(NH3)2]+ The resulting silver diamine complex was reduced in dextrose
solution (025 M) to obtain the metallic silver Successively the LPG fiber tip was dipped
into the Tollensrsquo reagent for about 35 minutes after which an uniform Ag coating formed
on the tip of the optical fiber
Figure 4 Mirror formation on the inner surface of the reaction vessel during a Tollensrsquo test
39
43 Dip-Coating Technique
In order to obtain homogeneous and defect-free layers on the optical fiber grating it was
used the dip-coating technique which provides a substrate to be immersed in a liquid
solution and then withdrawn with a well-defined extraction speed under controlled
temperature and atmospheric conditions The steps through which a thin film is deposited
onto a substrate by this technique are essentially five immersion extraction wet layer
formation drainage and solvent evaporation They are schematically reported in Fig 5
The film thickness depends upon many parameters such as the withdrawal speed the solid
content and the viscosity of the liquid If the withdrawal speed is chosen such that the
shear rates keep the system in the Newtonian regime then the coating thickness depends
upon the aforementioned parameters by the Landau-Levich equation [4]
119905ℎ = 094 (η ν)23
γLV (ρ g)16 (eq 1)
where th is the coating thickness η the solution viscosity ρ the density γLV the liquid-
vapor surface tension g the gravity and ν is the withdrawal speed
Figure 5 a) Schematic view of the deposition setup b) Dip coating process
This deposition technique is relatively simple and less time consuming compared to
electrostatic self-assembly and Langmuir-Blodgett and has been demonstrated to provide
a lower roughness of the layer which in turn determines its higher optical quality [5]
Moreover this technique can be realized with much less expensive equipment than the
40
sophisticated physical vapor deposition or chemical vapor deposition A drawback of the
technique is the not accurate control of the thickness compared to electrostatic self-
assembly or Langmuir-Blodgett techniques since it depends on too many parameters
which are not easily controlled
41
References
[1] P Pilla C Trono F Baldini Opt Lett 37 4152-4154 (2012)
[2] RP Murphy SW James RP Tatam Journal of Lightwave Technology 25 825-
829 (2007)
[3] Y Yin Z Li Z Zhong S J Mater Chem 12 522-527 (2002)
[4] LE Scriven Mater Res Soc Symp Proc 121 717-729 (1988)
[5] I Del Villar IR Matias FJ Arregui J Lightwave Technol 23 4192 (2005)
42
GAS SENSORS
43
5 GPL sensors based on a-PS coatings
51 Introduction
In the framework of the OPTOFER project ldquoInnovative Optoelectronic Technologies for
the Monitoring and Diagnostics of Railway Infrastructurerdquo (PON 03PE_00155) it has
been developed an optoelectronic device for the detection and monitoring of GPL in
railway tunnels
The present situation of the Italian railway tunnels is characterized by a remarkable
heterogeneity in term of typology building year and management (ordinary and high
speed railway network) When a tunnel is designed it is necessary an accurate study of
the possible accident scenarios as only providing for the risks it is possible to establish
an emergency plan
Besides the obvious risk associated with the derailment which can start a fire inside the
tunnel another source of danger is the accidental release of hazardous substances either
during the train travel or as a result of an accident Many of the daily transported
substances on rail track can be potentially fatal if dispersed in the environment especially
in a closed environment Examples are flammable explosive radioactive and
carcinogenic substances Gasses are among the most hazardous substances that can be
released in a gallery as they can spread rapidly can be flammable explosive andor toxic
and in the better situation can be asphyxiating
Actually GPL is the most transported hazardous substances in Italy with a frequency of
6-12 trains per day The Viareggio train derailment occurred in 2009 is an example of
the GPL transport dangerousness In this dangerous scenario it is necessary to have
sophisticated monitoring instruments which must have the following properties 1) short
response time (for an early warning) 2) on-line monitoring (in order to monitor in real
44
time the gallery status also during the disaster) 3) integrability with the preexisting
warning alarms
Optical sensing is one of the most suitable technique able to provide these features to a
sensor In this work different LPGs have been coated with atactic polystyrene in order to
develop a novel GPL sensor This polymer has been chosen for two reason
1) the chemical affinity between its hydrophobic chains and the short hydrocarbons
molecules constituting the GPL
2) the ability to quickly depositing homogeneous and defect-free films on optical
fibers making the sensor easy to manufacture
45
52 Materials and GPL sensing test set-up
521 Materials
Polystyrene is a synthetic aromatic polymer made from the monomer styrene (Fig 1)
This polymer with a higher refractive index compared to the cladding one exhibits high
sorption capacity and an improved selectivity toward low molecular weight substances
if compared to other polymers As a thermoplastic polymer polystyrene is in a solid
(glassy) state at room temperature but flows if heated above about 100 degC its glass
transition temperature
Figure 1 (left) Styrene and (right) Polystyrene chemical structure
Ordinary a-PS is one of the most common plastics in everyday life and it can be deposited
on optical fibers in the form of thin films by dip-coating from a solution The structure of
this atactic polymer is shown in Fig 2 Thin films of polystyrene are an ideal choice from
the point of view of the device optical design since they are easily deposited by dip-
coating have excellent optical quality with low losses and have a suitable high refractive
index that enables the modal transition [1-3]
Figure 2 a-PS chemical structure
46
Dip-coating technique was used to deposit thin films of a-PS (Mw = 280000 Aldrich ndash
RI = 1555 [4]) onto the grating region of different LPGs
In the framework of OPTOFER Project two different type of LPGs has been employed
commercial UV-induced LPGs (bought by OE Land Inc Canada) and arc-induced LPGs
(manufactured by the researchers of the University of Naples Parthenope) These optical
devices has been used in reflection mode and therefore a silver mirror was deposited on
the tip of the fiber The manufactured devices have been tested in presence of
butanenitrogen mixtures at different concentration butane was chosen as analyte because
is the main component of GPL together with propane
522 GPL sensing test set-up
In order to obtain the calibration curve of the manufactured devices ie the curve of the
optical shift as function of the gas concentration it is necessary to perform GPL sensing
tests with an appropriate set-up For that purpose it has been designed and purchased a
gas sensing apparatus schematized in Fig 3 and showed in Fig 4
Figure 3 (left) frontal and (right) top view of the gas sensing apparatus
47
Figure 4 Gas sensing apparatus project
Set-up is constituted of two lines and in them flows nitrogen and butane respectively In
the butane channel flows a mixture of nitrogen and butane with a 1vol of butane in
nitrogen The gas flow is tuned using Mass Flow Controller The line where flows the
butane is divided in two sub-lines the first that contains a low flow range MFC (50 sppm)
and the second that contains an high flow range MFC (500 sppm)
Using MFC it is possible to evaluate the gas concentration (expressed in ppm) which enter
in the test chamber A software has been designed and realized (in Labview) in order to
set the MFCs flows and to calculate the gas concentration on the basis of the MFCs
readings The developed software is shown in Fig 5
Figure 4 Software Control Panel
48
Through this software is possible to set the operative range of the MFCs (MFC1 MFC2
and MFC3) the starting butane concentration and the gas flows (Flux C1 C2 and C3)
In particular channel C1 is relative to nitrogen line while channels C2 and C3 are relative
to the butane lines On the right side of the panel are plotted the fluxes and the chamber
pressure as function of time On the basis of these readings the software calculates the
concentration of the output gas and plot it on the bottom-right side of the panel
49
53 Results and discussion
531 Fabrication of coated LPGs
The main manufacturing steps (summarized in the table below) refer to three main
objectives to achieve such as the realization of a reflection type LPG transducer the
realization of the coated LPG working in transition mode and the characterization and
validation of the manufactured LPG probe
Table 1 Manufacturing steps of the a-PS coated LPG
Objective Manufacturing steps
Reflection type LPG transducer - Cleaning of the LPGs surface - mirror integration at the end-face of the
cut optical fiber
Coated LPG working in transition mode
- a-PS deposition
LPG probe characterization and validation
- butane sensing characterization
The surface of the grating must be accurately cleaned to avoid that impurities (dust andor
fingerprints) can affect the homogeneity of the deposited film Because a mechanical
cleaning could damage the grating it is necessary to use a chemical etching to perform
the fiber treatment In this case a basic (ldquopiranhardquo) etching is performed A solution of
water ammonia (NH4O4) and hydrogen peroxide (H2O2) in the ratio of 311 is wormed
up to the boiling point (80 degC) The basic reaction and the boiling bubbles clean the
surface from impurities leaving the glass surface perfectly smooth and scratch free
Before the application of the piranha solution the optical fiber is dipped in chloroform
for about 30 minutes to remove the any polymeric coating traces
To obtain a reflection probe it is necessary to deposit a silver mirror on the tip of the LPG
This mirror is obtained using a Tollensrsquo reagent as reported in the previous chapter
Fig 5 shows the signal just after the cleaning step (black curve) and the signal after the
mirror deposition (red curve) It can be seen that before the mirror deposition baseline is
very low and that occurs because the light passing through the LPG is mostly transmitted
50
at the fiberair interface and only a small portion (~3-4) of it is reflected back into the
fiber as a consequence of the small refractive index contrast between the two media
Nevertheless as soon as the Ag reflecting metallic layer is formed at the fiber termination
almost all the initial power is recovered These curves refer to an arc-induced LPG with
a grating period Λ = 470μm
Figure 5 Baseline variation due to the silver mirror deposition
Figure 6 Optical micrographs of the a-PS coated fibers
As reported in table 1 the next step to the mirror formation is the sensible layer deposition
using the dip-coating technique Polymeric film is deposited starting from a solution of
a-PS in chloroform (95ww) The deposition technique employed ensures the
formation of a thin and homogenous a-PS film on the grating surface as reported in Fig
6 Comparing figs 6a and 6b it is evident that the presence of the polymeric film gives
51
an iridescent color to the fiber likely due to the homogeneity and the low thickness of the
layer
In order to obtain the highest sensibility toward the analyite LPG devices must be
properly designed There are two methods to increase the sensibility of the device
1) Inducing the modal transition phenomenon
2) Reducing the grating period Λ it is possible to excite the higher order cladding
modes in order to make them appear in the optical analysis region (1200-1700
nm) as reported in chapter 3 higher order cladding modes show higher sensitivity
to the SRI variations
To induce the modal transition phenomenon the thickness of a-PS must be tuned
accurately (as reported in chapter 3) The dip-coating technique allows this thickness
tuning process in a simple and repeatable way in fact varying the withdrawal speed or
the solution temperature it is possible to quickly change the layer thickness As reported
in Fig 7 increasing the withdraw speed (50 to 200 mmmin) increases the shift undergone
by the ith order cladding mode which is consequence of the a-PS layer thickening Fig 7
refers to an arc-induced LPG with a grating period Λ = 470μm (the same of Fig 5)
Figure 7 LPG Spectra during the a-PS deposition
52
According simulation in Fig 8 the a-PS layer thickness with a withdrawn speed of 100
mmmin is ~280-300 nm It is noteworthy that using a too high withdrawn speed (200
mmmin) the layer becomes too thick and the device exceed the transition region this
effect is evident in the cyan curve where the shift is so high that the 7th cladding mode
appears in the optical analysis region (black arrow)
Figure 8 Simulation of the wavelength shift (Δλ) as function of coating thickness (a-PS
refractive index = 1555)
The reduction of the grating period is another efficient method to increase the sensibility
of the LPG device Fig 9 shows two a-PS coated LPGs with different grating periods ie
630μm (Fig 9a) and 470μm (Fig 9b) The device with a grating period of 630μm shows
a 12nm blue shift of the 4th order cladding mode instead the total shift undergone by the
6th order cladding mode in the LPG with Λ=470μm is 40nm This implies that to obtain
a more sensible device it is preferable to use LPGs with grating period of 470μm
Figure 9 Shifts undergone by LPGs with different grating period Λ with the same a-PS coating
thickness a) Λ = 630μm and b) 470μm blue and red curves are relative to the signal before and
after the a-PS deposition respectively
53
Results have shown that to obtain an LPG probe with high sensibility toward butane it is
necessary
1) To work in transition mode with dip-coating technique using a withdrawn speed
of 100 mmmin it is possible to obtain a ~300 nm thick a-PS layer this thickness
allows to work in transition mode with the employed LPG
2) To use LPGs with shorter grating period reducing Λ up to 470μm it is possible to
move the 6th order cladding mode inside the this cladding mode is extremely more
sensitive to the SRI variation compared to the 4th order cladding mode excited in
the LPG with Λ=630μm
Figure 10 Shift undergone by the commercial LPG after the a-PS deposition blue and red
curves are relative to the signal before and after the a-PS deposition respectively
Also commercial UV-induced LPG has been coated with an a-PS layer The total shift
due to the presence of the polymeric coating is shown in Fig 10 It is evident that the shift
is comparable to that undergone by the arc-induced LPG with Λ=470μm
532 Butane Sensing Characterization
The manufactured fibers have been tested in presence of butane to evaluate the sensitivity
toward this gas
Preliminary tests have been carried out without a gas concentration control in order to
verify the maximum shift undergone by the device in presence of the analyte Fig 11
shows the shift undergone by the 6th order cladding mode (in an arc-induced LPG with
54
Λ=470μm and a-PS thickness of about 300nm) in presence of butane vapors The curve
behavior indicates an absorptiondesorption trend with a response time of about 4 mins
After exposition to air the total shift come back to zero indicating device reversibility
Figure 11 Butane sensor behavior of the a-PS coated device (arc-induced LPG with Λ=470μm
and a-PS thickness of about 300nm)
Test has been conducted using a three-necked flask filled with two spray of commercial
butane the fiber is placed in one of the necks and the flask is filled with two sprays of
commercial butane after the spraying the system is closed in order to evaluate the
response at a constant gas concentration Butane has removed from the flask by a fan
The same test is performed on a couple of UV-induced LPG coated with a-PS as reported
in Fig 12 It is evident that the maximum response is of the same order of magnitude as
the device in Fig 11 During this test temperature has been monitored with a FBG
Moreover a bare LPG has been employed to verify the response of the device without
the sensible coating results show that the butane devices sensitivity is entirely due to the
a-PS coating as bare LPG response is not affected by the gas presence
The difference in response value between these two devices (~1nm) could be attributable
to minimum difference in a-PS thickness in fact because the devices operate in the
55
transition region (maximum sensitivity region) minor variations in the coating thickness
can cause large variation of the gas sensing response Also in this case there is an
absorptiondesorption trend with response time similar to that of the device in Fig 11
Figure 12 Butane sensor behavior of two a-PS coated devices (UV-induced LPG with a-PS
thickness of about 300nm)
Because arc-induced and UV-induced LPG show essentially the same gas sensing
behavior (Figs 11 and 12) next tests have been performed only on the UV-induced LPG
this choice is due both to the lower optical losses after the layer deposition and to the
more uniformity of the UV-induced LPG optical spectrum
Other tests has been done to evaluate the instantaneous sensor response toward butane in
an open environment goal of these tests is to study the device response in a real situation
(GPL leak after the train transit) where the gas run over the fiber and then expand in the
surrounding environment moving away from the device To perform this test the set-up
in Fig 13 was employed It consisting of an aluminum package used to bear and protect
the devices on which is sprayed butane with the help of a syringe The latter is employed
because if the gas is sprayed directly with the spray can the nebulized butane drops could
condense onto the probes polluting it
56
Figure 13 a) Butane transfer in the syringe b) butane spraying on the device packaging c)
package without protective cover
Results of this test are shown in Fig 14 As it is evident the under examination device
(UV-induced LPG coated with 300nm thick a-PS) undergoes an initial shift of about
07nm which gradually reduces over the time following the desorption material kinetic
It is noteworthy that such kinetic results slower compared to those obtained in Figs 11
and 12 This effect is attributable to the fact that here the gas removal is spontaneous
contrarily to the previous tests in which butane was removed using the convective motion
of a fan
Figure 14 Butane sensor behavior of a-PS coated device (UV-induced LPG with a-PS thickness
of about 300nm)
57
In all performed tests the gas concentration was not known but to obtain a calibration
curve it is necessary to study the relationship between gas concentration and consequent
signal shift Calibration curve (Fig 15) of the selected device has been obtained using the
GPL sensing test set-up previously described The curve is not linear but rather it has a
polynomial behavior
Figure 15 Shift as function of gas concentration (Calibration curve) for the a-PS coated device
(UV-induced LPG with a-PS thickness of about 300nm)
In order to completely characterize the developed GPL sensor its humidity and
temperature sensibilities have been evaluated As reported in fig 16a the device results
sensible to temperature this behavior is not attributable to the material but to the intrinsic
sensibility to temperature of the employed transducer Despite the hydrophobicity of the
a-PS film the sensor results sensible to the humidity over 70 RH probably because the
water condensation on the polymer surface instead up to 70 RH the device is
completely insensible to the vapor presence
As required by the OPTOFER Project the sensor has been installed under the railway
tunnel near the Porta Rufina station (in Benevento) Fig 17 shows the picture of the GPL
sensor package installed under the tunnel
58
Figure 16 Temperature and humidity for the a-PS coated device (UV-induced LPG with a-PS
thickness of about 300nm)
Figure 17 GPL sensor package installed under the railway tunnel near Porta Rufina Station
(BN) package without (left) and with (right) the protection cover
After the installation the device has been tested in presence of GPL the gas was sprayed
directly on the package in order to simulate a real condition of accidentally GPL leak
during rail transport The measured output signal is the shift of the analyzed LPG peak as
function of time but the PC connected to the transducer convert this signal in GPL
concentration (in ppm) thanks to the calibration curve previously obtained Fig 18
reports the results of the performed tests
59
Figure 18 (left) Shift as function of time for the sensor during the test and (right) consequent
concentration calculated by the connected PC using the calibration curve
60
References
[1] A Cusano A Iadicicco P Pilla Opt Express 14(1) 19-34 (2006)
[2] A Cusano A Iadicicco P Pilla Appl Phys Lett 89(20) 2011161-3 (2006)
[3] A Cusano P Pilla M Giordano Advanced Photonic Structure for Biological and
Chemical Detection Ed X Fan pp 35-75 (Springer 2009)
[4] P Pilla C Trono F Baldini Opt Lett 37 4152-4154 (2012)
61
6 Humidity sensors based on TiO2 coatings
61 Introduction
Collaboration agreement with CERN (Conseil Europeacuteen pour la Recherche Nucleacuteaire -
European Organization for Nuclear Research) named ldquoRelative humidity fiber optic
sensors based on Long Period Gratingsrdquo led to the development of optoelectronic
humidity sensors working in cryogenic environment
The Compact Muon Solenoid (CMS) is one of the two large general-purpose particle
detectors built on the Large Hadron Collider accelerator running at the European CERN
in Geneva Its innermost detector immersed in a 4 Tesla magnetic field is a particle
tracker where silicon pixel and microstrip sensors measure the momentum and trajectory
of particles emerging from the LHC collisions In order to reduce the radiation-induced
loss of the sensors the subdetectors are cooled at minus20degC∕minus25degC To avoid water
condensation and ice formation the volume needs to be kept sealed and dry A distributed
thermal and hygrometric monitoring of the air is however required in the external area
surrounding the tracker where cold services are distributed in complex geometries and a
safe control of the environmental parameters is more difficult In addition each tracking
detector needs to be as much as possible transparent to particles requiring mass
minimization of the devices to be installed in situ radiation resistance from 1 to 100 Mrad
doses and magnetic field insensitivity All the commercial miniaturized RH sensors used
by CMS are capacitive multiwired and not designed with radiation hard characteristics
[1] On the other hand fiber optic sensors are able to provide many attractive features that
overcome the electrical sensors limitations In addition modern fabrication technologies
allow us to obtain fibers tolerating high radiations levels [2] and this promoted renewed
interest in their use in high-energy physics environments
62
During this collaboration titanium dioxide (TiO2) has been used as a sensitive element
for the development of high-sensitivity LPG based humidity sensors due to its high RI
(n = 196) [3] and hygrosensitive characteristics [4 5] Furthermore the use of an oxide
is expected to avoid the typical aging problems characteristic of polymeric overlays
63
62 Materials and climatic chamber
Titanium dioxide (or titania) with formula TiO2 exists at room temperature in three forms
rutile anatase and brookite each of which occurs naturally Rutile is the only stable phase
of coarse-grained titania whereas anatase and brookite are metastable at all temperatures
and convert to rutile when heated The rutile structure is based on a slightly distorted
hexagonal close packed (hcp) of oxygen atoms with half the octahedral interstices being
occupied by titanium atoms The tridimensional structure can be seen in Fig 1
Figure 1 Titanium oxide TiO2 a) sample in powder form b) 3D crystal structure
Titanium oxide thin film is one of the most commonly used materials for optical thin
films due to its good durability and high transmittance in the visible spectral region It is
commonly used as high index layer to achieve the high‐low index contrast for multiple
layer interference films [6] Thin film properties including refractive index are very
much dependent on film structure that is controllable by the deposition method and
parameters fixing the operational wavelength
The sol-gel dip coating method has been selected for the integration of nanoscale TiO2
layers onto the LPG surface mainly due to its ability to guarantee a good optical quality
a ring-shaped symmetry and an adequate longitudinal uniformity over the grating length
For TiO2 sol preparation titanium (IV) isopropoxide (Ti(OR)4) has been used as titania
precursor it needs a solvent and a reaction activator when the reaction activator is mixed
to the precursor the reaction starts and the oxide is obtained Several dilutions of titania
precursor in ethanol have been experimented in order to obtain a layer as smooth and
64
homogeneous as possible The activator also plays a key role different solutions
involving different activators (water or acid) have been prepared to get an appropriate
(and optimized) procedure During this collaboration UV-induced LPGs were bought by
OE Land Inc a company based in Quegravebec (Canada) that is one of the leader in the
manufacturing of fiber gratings devices These optical devices has been used in reflection
mode and therefore a silver mirror was deposited on the tip of the fiber
Figure 2 Schematic representation of the experimental setup used for LPG sensor
characterization
The experimental tests have been performed in a climatic chamber (Angelantoni
Challenge 1200) Temperature and relative humidity can be controlled using the front
panel buttons with an uncertainty of +- 01 degC and +- 1 respectively A chamber
internal temperature of 25 degC has been fixed for measurements The LPG sample is placed
inside the climatic chamber letting the fiber patch-cord coming out from the front door
(see Fig 2)
65
63 Results and discussion
631 Sol-Gel Process Optimization
Different sols has been prepared In the following the experimented solutions are listed
The first solution (here indicated as P1t) 6 ml of ethanol 252 ml of Ti(OR)4 and vapours
of hydrochloric acid (HCl)
The second solution (P2t) 585 ml of ethanol 252 ml di Ti(OR)4 and 015 ml of
bidistilled water (H2O) When the water is added in the container some precipitations
appear (Fig 3) thus meaning that this solution is not useful for sol-gel depositions
Figure 3 Sol-gel solutions with precipitation (P2t)
The third solution (here indicated as P3t) 585 ml of ethanol 005 ml of bidistilled water
252 ml of Ti(OR)4 and vapours of hydrochloric acid
The fourth solution (P4t) 585 ml of ethanol 005 ml of hydrochloric acid and 252 ml
of Ti(OR)4
The fifth solution (P5t) 225 ml of ethanol 005 ml of hydrochloric acid and 625 ml of
Ti(OR)4
The sixth solution (P6t) 907 ml of ethanol 00765 ml of bidistilled water and 385 ml of
Ti(OR)4
A reaction time of 12 hours has been waited before using the prepared solutions for the
deposition procedure Preliminary deposition has been performed on glass planar
substrates in order to evaluate the solution that provide the best titania films in term of
homogeneity and uniformity
66
A quality analysis of the deposited layers is obtained by an optical microscope inspection
of the films For each of the prepared solutions a table is reported in the first column a
schematic picture of the deposited substrate is shown on which the observed area (red
square) is highlighted second column contains the film pictures respectively In the third
column the magnification zoom of the microscope is indicated Finally in the fourth
column it is specified the solution used for the deposition
Table 1 Microscope images of a titania layer deposited on a planar glass substrate using the
solution P1t (Black circular shadows are due to impurities on microscope lenses)
Selected area Micrograph Zoom Solution
5X P1t
5X P1t
20X P1t
5X P1t
5X P1t
67
The TiO2 deposition results on planar glass substrates using the solution P1t are shown in
Table 1 As can be seen the deposited films show a cracked surface with isolated
domains The various colors are due to the different thicknesses of the domains From
these results it is possible to conclude that the P1t solution does not result in high quality
film especially in terms of homogeneity and uniformity
Table 2 Microscope images of a titania layer deposited on a planar glass substrate using the
solution P3t (Black circular shadows are due to impurities on microscope lenses)
Selected area Micrograph Zoom Solution
5X P3t
5X P3t
20X P3t
5X P3t
5X P3t
68
The TiO2 deposition results on planar glass substrates using the solution P3t are shown in
Table 2 Also in this case the deposited films show a cracked surface It is evident that
films deposited from P3t solution result in bad quality layers and thus cannot be
employed for deposition on LPGs
The TiO2 deposition results on planar glass substrates using the solution P4t are shown in
Table 3
Table 3 Microscope images of a titania layer deposited on a planar glass substrate using the
solution P4t (Black circular shadows are due to impurities on microscope lenses)
Selected area Micrograph Zoom Solution
5X P4t
5X P4t
20X P4t
5X P4t
5X P4t
69
The deposited film shows a slightly cracked surface with small domains The quite good
uniformity of the layer is shown by the pinkish homogeneous color of the whole surface
From these results we can therefore conclude that the P4t solution can be effectively used
for obtaining high quality layers
The TiO2 deposition results on planar glass substrates using the solution P5t are shown in
Table 4
Table 4 Microscope images of a titania layer deposited on a planar glass substrate using the
solution P5t (Black circular shadows are due to impurities on microscope lenses)
Selected area Micrograph Zoom Solution
5X P5t
5X P5t
20X P5t
5X P5t
5X P5t
70
When using the P5t solution the deposited film results to be discontinuous with large
void areas These results exclude the P5t from the possible solutions for dip-coating
deposition
Similar (bad) results were also obtained in the case of P6t solution (see Table 5) that led
to a cracked surface with small domains
Table 5 Microscope images of a titania layer deposited on a planar glass substrate using the
solution P6t (Black circular shadows are due to impurities on microscope lenses)
Selected area Micrograph Zoom Solution
5X P6t
5X P6t
20X P6t
5X P6t
By resuming the results previously shown it is possible to state that on planar substrates
the best titania layers in terms of homogeneity uniformity and dimensions of cracks
were obtained using the solution P4t
71
Another aspect that was considered is the reaction time of the sol During sol-gel process
the oxide precursor is hydrolyzed and then the hydroxide molecules react forming oxide
macromolecules If the reaction time is brief the resultant macromolecules are short
reducing the mechanical properties of the relative wet film Conversely it is possible the
formation coalescence and consequent precipitation of oxide particles if the reaction
time are too long that induces the formation of layers of particles which do not result
very homogeneous
To obtain the optimized reaction time 3 glass substrate have been coated with a P4t sol
deposition has been performed after exactly 3 time interval 1hour 1 day and 7 days
Table 6 shows the samples micrographs It is evident that the sample coated with 7 day
after the sol synthesis results inhomogeneous due to the particles that constitute it
Table 6 Microscope images of a titania layer deposited on planar glass substrate at different
reaction times
Selected area Micrograph Sol Reaction time
1 hour
1 day
7 days
72
The other samples are instead homogeneous and defect free For this reason TiO2 sol
has been deposited on the lateral surface of an optical fiber results (Fig 4) shows the
comparison between the fiber coated after 1 hour from the sol synthesis and the fiber
coated after a day The first shows large fracture due to the shrinkage during the drying
process making it unusable as LPG coating The last is instead very homogeneous and
consequently the optimized reaction time is 24 hours
Figure 4 P4t sol deposited on optical fibers with different reaction time a) 1 hour and b) 24
hours
632 Fabrication of coated LPGs
Established that the best titania layer has been obtained using the P4t sol it is possible to
precede to the LPG manufacturing The main manufacturing steps (summarized in the
table below) refer to three main objectives to achieve such as the realization of a
reflection type LPG transducer the realization of the coated LPG working in transition
mode and the characterization and validation of the manufactured LPG probe
Table 7 Manufacturing steps of the titania coated LPG
Objective Manufacturing steps
Reflection type LPG transducer - Cleaning of the LPGs surface - mirror integration at the end-face of the
cut optical fiber
Coated LPG working in transition mode
- titania deposition
LPG probe characterization and validation
- humidity sensing characterization
The surface of the grating must be accurately cleaned to avoid that impurities (dust andor
fingerprints) can affect the homogeneity of the deposited film Because a mechanical
cleaning could damage the grating it is necessary to use a chemical etching to perform
73
the fiber treatment In this case a basic (ldquopiranhardquo) etching is performed A solution of
water ammonia (NH4O4) and hydrogen peroxide (H2O2) in the ratio of 311 is wormed
up to the boiling point (80 degC) The basic reaction and the boiling bubbles clean the
surface from impurities leaving the glass surface perfectly smooth and scratch free
Before the application of the piranha solution the optical fiber is dipped in chloroform
for about 30 minutes to remove the any polymeric coating traces
As done for the GPL sensors also in the case of humidity sensor it is necessary to work
in reflection mode For this purpose tollensrsquo reactant was employed to deposit the silver
mirror on the tip of the LPG Fig5 reports the increase in optical transmission signal after
the mirror deposition
Figure 5 Baseline variation due to the silver mirror deposition
After the silver deposition LPGs has been coated with titania layer As previously stated
this inorganic material was deposited using the dip-coating technique The solution
selected for the integration of TiO2 layers with optical fiber substrates (P4t) has been used
for the integration of TiO2 overlays on the LPGs (Fig 6) In this case it can be seen that
74
the obtained TiO2 layer is homogeneous and only few imperfections are visible along the
fiber This result thus confirms the capability of the solution P4t of producing films with
good optical quality and high uniformity as already observed also in the case of glass
planar substrates
Figure 6 Microscope image of a titania layer deposited on the optical fiber using the solution
P4t
To work in transition mode multiple depositions are performed in order to get thicker
final layers (of approximately 100 nm) since TiO2 layers result very thin In case of
multilayer depositions a thermal annealing (10 mins 150degC) between the deposition of
two consecutive layers has been proposed
Table 8 Microscope images of 6 titania layers deposited on two LPGs and shift undergone by
the device after deposition
Sample Zoom Micrographs Shift
LPG1
5x
20x
LPG2
5x
20x
75
As starting point two UV-Induced LPGs have been coated with 6 layers of titania
Table 8 contains the micrographs of the coated fibers and the shift undergone by the
device after the 6 layers deposition It is evident that the number of layer deposited does
not affect the homogeneity of the film being it as smooth as that obtained with only on
layer (Fig 6)
However it is noteworthy that the shift undergone by the fibers is very low (only 2-3 nm
after 6 TiO2 layers) This result could be attributable to the thermal annealing between
the deposition of two consecutive layers the high temperature of the annealing process
(150degC) can increase the hydrophobicity of the deposited layer making the deposition of
the next layer harder (being the titania sol an alcoholic solution) The change in
hydrophobicity could be attributable to chemical andor morphological transformation
undergone by the titania layer after the increase in temperature
Figure 7 Contact angle goniometer
To verify this hypothesis a contact angle test has been performed using a contact angle
goniometer (Fig 7) Titania was deposited on two glass planar substrates but only one of
these samples has been thermal annealed 150degC Comparison between the contact
angles of these two layers is shown in Fig 8 It is evident that the sample without
temperature annealing shows high hydrophilicity with a contact angle significantly lower
76
than 90deg (contact angle = 136deg) on the other hand annealed titania is characterized by a
hydrophobic behavior with a contact angle higher than 90deg (contact angle = 1312deg)
Figure 8 Contact angle of the titania layers a) without and b) with annealing 150degC for 10
mins
On the basis of this observation the procedure to manufacture the humidity sensors is
changed removing the annealing process between consecutive layer depositions and
replacing it with a drying cycle performed in oven for 10 mins at room temperature under
vacuum vacuum allows to dry the titania film without chemical and morphological
transformations that can affect the layer hydrophilicity
The final manufacturing scheme is shown in Fig 9 Higher is the thickness needed to
operate in transition mode higher is the value of N
Figure 9 Humidity sensor manufacturing procedure
77
Using this procedure an LPG based device has been manufactured In fig 10 is shown
the LPG spectrum during the deposition of titania it is evident that with 12 layers (12
dips) there is a remarkable change in the shape of the curve with a shift of the 6th order
cladding mode of about 37nm Simulations estimate a TiO2 thickness of about 88nm
associated to this shift
Figure 10 LPG optical spectrum during TiO2 deposition
Figure 11 LPG optical spectrum during TiO2 deposition zoom in the region 1460-1630 nm
78
Fig 11 shows a zoom of the optical region that contains the 6th order cladding mode
(1460-1630 nm) The loss in depth of the attenuation band is ~75dB
633 Preliminary humidity characterization
In this section are reported the first experimental results of a preliminary RH test carried
out using the realized LPG sensor coated with a 12 layer TiO2 overlay (with thickness of
approximately 88nm) Information about its performances in detecting RH changes in the
range 10-80 RH at 25degC (Fig 12) is detailed in the following
Figure 12 Settings of the climate chamber
Figure 13 shows the typical spectral variations of the TiO2-coated LPG sensor during a
characterization test carried out at 25degC As theoretically expected increasing the
humidity content inside the test chamber causes a blueshift the 6th order cladding mode
This is due to the TiO2 coating RI increase caused by the higher amount of adsorbed water
molecules which in turn leads to an increase of n0ieffcl The loss in depth of the attenuation
band is ~1dB
In Fig 13 it is plot the time variation of the barycentral wavelength of the resonance dip
occurred upon RH changes within the chamber from 10 to 80 with 20 steps
79
Figure 13 Transmittance spectra of LPG1 acquired at different RH values
Figure 13 Time evolution of central and barycentral wavelengths variation occurred for
different RH values for TiO2 sample
As can be noted the response time of the sensor to a humidity variation is related to the
setting time of the chamber Thin TiO2 layers on the LPG results in an instantaneous
response of the sensor to humidity variations Each RH step is kept for several minutes
and the small variations illustrated in Figure 13 are related to humidity control of the
chamber and cannot be attributed to LPG sensor instability In Table 9 the relative
wavelength shift for each RH step is resumed
Table 9 Microscope images of 6 titania layers deposited
RH Step |Δλ| [pm]
20-40 1840
40-60 1240
60-80 1090
80
The barycentral wavelength variations of the resonance dip versus the RH values are
plotted in Figure 14 It is evident that the wavelength shift is higher for lower RH values
from RH=20 to RH=40 the shift is about 1840 pm while from RH=60 to RH=80
the shift is 1090 pm
Figure 14 Barycentral wavelength variations of the resonance dip versus the RH values during
two different tests (1deg and 2deg)
81
References
[1] M Fossa P Petagna ldquoUse and calibration of capacitive RH sensors for hygrometric
control of the CMS trackerrdquo CMS Note 200324 (2003)
[2] A Cusano A Cutolo J Albert Fiber Bragg Grating Sensors Recent Advancements
Industrial Applications and Market Exploitation Ed Bentham Science pp 218-237
(2011)
[3] E Davies R Viitala M Salomaumlki J Opt A Pure Appl Opt 11 015501 (2009)
[4] G Montesperelli A Pumo E Traversa Sens Actuators B 25 705 (1995)
[5] B C Yadav N K Pandey A K Srivastava Meas Sci Technol 18 260 (2007)
[6] H Xie XT Zeng WK Yeo Temperature dependent properties of titanium oxide
thin films by spectroscopic ellipsometry SIMTech technical reports vol 9 (2008)
82
B IOSENSORS
83
7 Drug resistant bacteria biosensor based on a-
PSPMMA coatings
71 Introduction
This work deals with the development of advanced optical biosensors able to perform a
rapid detection of drug resistant bacteria carried out within the FP7 European project
Multianalyte automatic system for the detection of drug resistant bacteria -
OPTObacteria[1] Resistance to infecting microorganism represents a key threat to
human health and cause high human and socio-economic burden Among the largest
diffused infections β-lactamases expressing pathogens methicillin-resistant
Staphylococcus aureus and gram-negative hospital opportunistic pathogens are among
the most aggressive ones In particular Extended-spectrum BL have emerged as an
important mechanism of resistance in Gram-negative bacteria Delay in appropriate
therapy for infections with ESBL producers not only prolongs hospital stay but is
associated with increased mortality Methods currently known for detecting ESBLs are
expensive and generally used to only test pre-screened individuals In addition 24-48
hours are typically needed before having a resistance profile thus meaning that they
cannot be used to obtain rapid results which would allow infection control measures to
be implemented at the earliest possible opportunity [2]
Highly sensitive optical probes able to detect unlabeled biomolecules are of great interest
in this concerns as they would enable a true real-time (and in situ) screening with minimal
sample consumption and treatment Among all LPGs are the most promising fiber optic
refractive index (RI) transducers to be employed for unlabeled biochemical assays [3]
The number of biosensing applications exploiting different designs of LPGs is rapidly
growing and they are expected to become a key technology in next few years [4-6] A
strong impulse to this growth was recently given by the integration on the LPG surface
84
of nano-scale polymer overlays and by the discovery of the modal transition phenomenon
As previously stated it is well known that the SRI sensitivity of LPGs can be optimized
at the desired working point through the deposition of a high RI (HRI) layer by acting on
its thickness (ranging in hundreds of nanometers) Shifts of the spectral features as high
as thousands of nanometers for a unitary change of SRI can be easily obtained thus
making HRI-coated LPGs very much exploited for chemical and biomolecular sensing
applications [7] However essential condition to fully exploit the benefits of transition
mode LPGs is that the attenuation bands would not loose visibility while working in
transition mode This is not verified for some materials and related deposition techniques
[8-9] and it is achieved only when high optical quality overlays (low absorption and
roughness) are used Up to now the best results have been obtained with thin polymer
layers deposited by dip-coating in particular with ordinary a-PS [7] It is worth pointing
out that the quality of a biosensing system not solely relies on the sensitivity of the
transducer (the a-PS coated LPG) but also involves its interfacial properties where
suitable bioactive species (ie the bioreceptors) are immobilized providing the final
sensitivity and specificity to the target molecules
In the framework of OPTOBACTERIA Project due to the difficulty to directly
biofunctionalize the a-PS overlay it has been used a recently proposed multilayer strategy
[10] where the a-PS overlay serves to tune the working point of the device in the
transition region while a second thinner overlay of poly(methyl methacrylate-co-
methacrylic acid) (PMMA-co-MA) provides the desired interfacial properties for a stable
bioreceptor immobilization The LPG biosensors manufacturing is reported from the
realization of the reflection type LPG transducer working in transition mode to the
biochemical functionalization of its surface Finally preliminary experimental results
revealing the biosensor capability to successfully detect the binding of a specific BL
(AmpC) are also reported
85
72 Materials and SRI characterization
As previously stated using a multilayer approach for the coating of the LPG allow to
independently tune the working point in transition region and achieve an efficient surface
functionalization without incurring the problem of the attenuation bands fading In
particular a-PS is a primary HRI coating which tunes the working point of the device in
transition region A secondary very thin layer of PMMA-co-MA whose refractive index
is 149 was then deposited to provide a caroboxyl-containing surface minimizing at the
same time its impact on the optical design of the device
A-PS and PMMA (see Fig 1) are probably the most exploited polymers for optical
waveguide fabrication so far [11 12] They are inexpensive easily processable and highly
transparent
Figure 1 PMMA chemical structure
It should be possible to use only a thick PMMA layer (without using a-PS layer) to
achieve the maximum sensitivity and the desired functionality of the interface but there
are different drawbacks that does not allow to use this approach First of all although the
PMMA-co-MA has a slightly higher RI than the cladding that enables the modal transition
phenomenon nonetheless it has a much lower RI than PS This would result both in a
thicker overlay (approx 27 times thicker than a single a-PS overlay) to tune the LPG in
the transition region and in a less steep transition region (peak sensitivity approx 23
times lower than with a single a-PS overlay) as determined from a numerical analysis
based on the theory reported in [13] Moreover thicker overlays to be deposited require
high density solutions (up to 20 by weight of PMMA-co-MA) which can be difficult to
86
prepare In addition PMMA-co-MA absorbs a small amount of water which anyway can
cause a considerable change of the optical properties of the polymer
In light of these considerations it is convenient to use a double-layer approach and
minimize the thickness of the outer PMMA-co-MA layer
UV-induced LPGs have been used in the framework of this project three different grating
periods (350μm 370μm and 390μm) were employed to study its effect on the sensitivity
of the final device
The SRI characterization was performed by submerging the realized LPG transducer into
aqueous glycerol solutions characterized by different refractive index in the range 1335-
146 The refractive index of each solution was measured by means of an Abbe
refractometer working at 589 nm
87
73 Results and discussion
731 Fabrication of multilayer coated LPG reflection probes working
in transition mode
In order to obtain the multilayer coated LPG ready to the next step ie the biochemical
functionalization a specific procedure has to be performed As done in the previous
chapter the main manufacturing steps are summarized in the table below
Table 1 Manufacturing steps of the multilayer coated LPG transducers prototypes
Objective Manufacturing steps
Reflection type LPG transducer - mirror integration at the end-face of
the cut optical fiber
Multilayer coated LPG working in transition mode
- a-PS layer deposition - PMMA-co-MA layer deposition
LPG probe characterization and validation
- SRI characterization - prototype acceptance
After the deposition of silver mirror on the tip of the LPG the optical fiber has been
coated with an a-PS layer For the deposition of the ordinary a-PS film (RI=1555) the
fiber containing the LPG was first immersed into a PS solution and successively
withdrawn with a well-controlled speed The extraction step was 100 mmmin Before the
deposition the LPG was thoroughly cleaned in boiling chloroform Deposition solution
was 95 (ww) of PS in chloroform
Figure 2 Optical microscopy images of a double-layer coated optical fiber Clock wise bare PS
(pink) transition from PS to PMMA-co-MA on PS central zone with the double layer of
PMMA-co-MA on PS (violet)
88
The PS coated LPG was subsequently dip-coated into a solution 10 (ww) PMMA-co-
MA (Mw = 34000 - Aldrich) in chloroformisopropanol (13 vv) for the formation of
the secondary very thin layer of PMMSA-co-MA Considering the relatively small
amount (16) of methacrylic acid in this PMMA co-polymer we assume its RI to be the
same as the homopolymer ie 149
In Fig 2 are reported some typical optical microscopy images of an optical fiber coated
with the polymer double-layer in different positions along the fiber axis The pictures
reveal smooth and homogenous layers Since a-PS and PMMA-co-MA are transparent
polymers the apparent colors are due to interference of the light reflected back from the
different interfaces
It is important at this point to highlight that the deposition of a second layer by DC implies
the need for a solventnonsolvent strategy In other words the second layer should be
deposited from a solution whose solvents would not damage the underlying layer One
important difficulty to consider in this system is that a-PS is an highly hydrophobic
polymer while PMMA-co-MA has an hydrophilic nature therefore the use of solvents
with a higher polarity with respect to chloroform could prevent the good adhesion of the
secondary layer and cause its slipping as well as de-wetting defects as it was
experimentally verified in the case of acetone acetic acid ethanolwater (11 vv)
MEKisopropanol (11) The problem was solved by using a mixture of solvents
containing a small amount of a mutual solvent for both polymers in our case chloroform
and a major part of mutual nonsolvent in our case isopropanol in a volumetric ratio 13
In this way the integrity of the first layer was preserved and good adhesion and
uniformity of the secondary layer was ensured
Once the realized LPG transducer has been realized and characterized the final step
before the prototype acceptance relies on the comparison between expected (ie from
simulations) and experimental performances in terms of SRI sensitivity at an SRI=134
89
(because biological measurements will be conducted in a PH7 aqueous solution which is
characterized by a refractive index ~134) In the following paragraph it is reported the
results obtained for the manufacturing of the first three prototypes carried out by using
LPG 1 LPG 2 and LPG 3 (Λ = 350μm 370μm and 390μm respectively)
Prototype 1 Manufacturing characterization and validation
In this paragraphs the manufacturing characterization and functional validation of
Prototype 1 has been reported According simulations for this device to work in transition
region the a-PS layer thickness must be 280 nm enabling to reach a sensitivity as high as
1738nmRIU
The first manufacturing step relies on the realization of the reflection type LPG To this
aim in Fig 3 is shown the spectra in air of LPG 1 acquired just before the optical fiber
cut (ie in transmission configuration) just after the optical fiber cut (ie in reflectance
configuration before the mirror formation) and after the mirror integration at the end of
the cut fiber (with Tollensrsquo reactant)
Figure 3 Experimental spectra acquired in air for LPG 1 before the optical fiber cut (ie in
transmission configuration) just after the optical fiber cut (ie in reflectance configuration
before the mirror formation) and after the mirror integration at the fiber termination
90
It can be seen that after the optical fiber cut a strong baseline reduction occurs
Nevertheless as soon as the Ag mirror is formed at the fiber termination almost all the
initial power is recovered
The prototype manufacturing continued with the double layer (a-PS and PMMA-co-MA)
deposition onto the LPG surface Figure 4 shows the spectral position of the attenuation
band related to the 6th order cladding mode for the bare LPG and for the a-PS coated
device (both in reflection configuration) In particular the resulting overlay thickness after
DC from the 95 a-PS solution was ~260 nm while the secondary layer obtained from
the 10 PMMA-co-MA solution was estimated to be ~30 nm as inferred by numerical
simulations carried out by means of the developed virtual environment
As previously described when an HRI overlay is deposited onto the grating the effective
RI of the cladding modes is increased therefore the central wavelengths of the attenuation
bands experience a blue shift which for the 6th order cladding mode in Fig 4 was about
138 nm The second layer of PMMA-co-MA produced a cumulative effect of 42 nm on
the attenuation band shift The goodness of the deposition process is also testified by the
subsistence of the attenuation band visibility In fact a secondary layer with defects would
have determined a dramatic decrease of the attenuation bands depth due to scattering
losses [14]
Figure 4 Effect of the a-PS and PMMA-co-MA overlays deposition on the sixth order cladding
mode attenuation band of LPG 1
91
The spectral characterization to SRI changes obtained with Prototype 1 is reported in Fig
5a in terms of central wavelengths of the attenuation bands position It refers to the sixth
order cladding mode Experimental data were fitted with a Lorentzian-Cumulative
function The resonance-shaped sensitivity characteristic of the coated device is reported
in Fig 5b as extrapolated from the experimental results
In particular it can be seen that the SRI sensitivity in correspondence of an SRI=134
turned out to be ~1918nmRIU This experimental value resulted slightly higher than the
expected one (1738nmRIU) this is probably due to the slight differences between
numerical and experimental values of the refractive indexes of the a-PS and PMMA-co-
MA layer as well as of the glycerol solution used for the SRI sensitivity characteristic
However the realized prototypes was clearly accepted as it performs even better than the
designed device
Figure 5 a) SRI characterization in terms of attenuation bands minima position for the 6th order
cladding mode b) SRI sensitivity (|partλrespartSRI|) of the sixth order cladding modes extrapolated
from data reported in (a)
Prototype 2 Manufacturing characterization and validation
In this paragraphs the manufacturing characterization and functional validation of
Prototype 2 has been reported According simulations for this device to work in transition
region the a-PS layer thickness must be 270 nm enabling to reach a sensitivity as high as
1304 nmRIU The spectra in air of LPG 2 acquired before the optical fiber cut after the
optical fiber cut (ie in reflectance configuration before the mirror formation) and after
the mirror integration are reported in Fig 6
92
Figure 6 Experimental spectra acquired in air for LPG 2 before the optical fiber cut (ie in
transmission configuration) just after the optical fiber cut (ie in reflectance configuration
before the mirror formation) and after the mirror integration at the fiber termination
Also in this case a strong baseline reduction is observed when cutting the fiber containing
the LPG 2 which is almost recovered after the integration of the Ag reflecting metallic
layer
Figure 7 Effect of the a-PS and PMMA-co-MA overlays deposition on the 5th order cladding
mode attenuation band of LPG 2
Figure 7 shows the spectral position of the attenuation band related to the fifth order
cladding mode for the bare LPG and for the a-PS coated device The resulting overlay
thickness after DC from the PS solution was estimated to be ~270 nm while the secondary
layer obtained from the 10 PMMA-co-MA solution was estimated to be ~40 nm The
93
a-PS deposition caused the central wavelengths of the attenuation bands of the fifth order
mode to blue shift of about 115 nm while the second layer of PMMA-co-MA produced
a cumulative effect of about 40 nm on the attenuation band shift
Fig 8a reports the spectral characterization to SRI changes obtained with the fifth order
mode of Prototype 2 whereas its sensitivity vs SRI is reported in Fig 8b Also in this
case the experimental results are slightly better than the expected ones indeed a
sensitivity for an SRI=134 of ~1498nmRIU was estimated with respect to the expected
1304nmRIU
Figure 8 a) SRI characterization in terms of attenuation bands minima position for the 5th order
cladding mode b) SRI sensitivity (|partλrespartSRI|) of the 5th order cladding modes extrapolated
from data reported in (a)
Prototype 3 Manufacturing characterization and validation
In this paragraphs the manufacturing characterization and functional validation of
Prototype 2 has been reported According simulations for this device to work in transition
region the a-PS layer thickness must be 270 nm enabling to reach a sensitivity as high as
1146 nmRIU The spectra in air of LPG 3 acquired before the optical fiber cut after the
optical fiber cut (ie in reflectance configuration before the mirror formation) and after
the mirror integration are reported in Fig 9
94
Figure 9 Experimental spectra acquired in air for LPG 3 before the optical fiber cut (ie in
transmission configuration) just after the optical fiber cut (ie in reflectance configuration
before the mirror formation) and after the mirror integration at the fiber termination
Figure 10 Effect of the a-PS and PMMA-co-MA overlays deposition on the 5th order cladding
mode attenuation band of LPG 3
Figure 10 shows the spectral position of the attenuation band related to the 5th order
cladding mode for the bare LPG and for the a-PS coated device The resulting overlay
thickness after DC from the PS solution was estimated to be ~260 nm while the secondary
layer obtained from the 10 PMMA-co-MA solution was estimated to be ~30 nm The
a-PS deposition caused the central wavelengths of the attenuation bands of the 5th order
95
mode to blue shift of about 94 nm while the second layer of PMMA-co-MA produced a
cumulative effect of about 258 nm on the attenuation band shift
Fig 11a reports the spectral characterization to SRI changes obtained with the 5th order
cladding mode of Prototype 3 whereas its sensitivity vs SRI is reported in Fig 11b
Figure 11 a) SRI characterization in terms of attenuation bands minima position for the 5th
order cladding mode b) SRI sensitivity (|partλrespartSRI|) of the 5th order cladding modes
extrapolated from data reported in (a)
Once more the experimental performances are slightly better than the expected ones
since a sensitivity for an SRI=134 of ~1188 nmRIU was estimated with respect to the
expected value of 1146 nmRIU
732 Chemical functionalization of sensor surface
After a ligand-BL (3-APBA) was chosen anchoring of the ligand was carried out
exploiting established covalent coupling techniques The proper linkage chemistry was
carried out to anchor the bioreceptor to the external layer of the probe With the carboxylic
functions chosen as anchoring points on the probe surface and -NH2 groups presents on
the ligand the linkage chemistry is consisted in well-established protocols developed for
solid-phase peptide synthesis These is consisted in the initial activation of the carboxyl
group through a reaction with EDC and NHS leading to an amine-reactive ester and a
successive reaction with a primary amino group present on the ligand Once the probe
surface had been functionalized by the ligand the retention of its biological activity is
evaluated carrying out the interaction studies with the complementary BL also taking
96
into consideration local parameters that may influence the binding such as aggregation
pH and ionic strength
The a-PS and PMMA-co-MA coated sensor (Prototype 2) surface was immersed in a
phosphate buffer solution at pH=5 After the optical stabilization of the sensor a solution
of 005M of EDC (~98 Sigma-Aldrich) with 003M of NHS (~98 Sigma- Aldrich)
was added to activate the carboxylic groups (-COOH) of PMMA-co-MA In Fig 12 it is
reported the chemical reaction
Figure 12 The chemical reaction of the ndashCOOH groups of the sensor surface with the
EDCNHS to obtain the esterification of carboxyl group
After the stabilization of the optical signal the sensor was immersed in a clean buffer
solution at pH=5 It is worth observing that each time grating is extractedsubmerged into
an aqueous environment there is a sort of acclimation of the polymeric layer expressed
through a quite fast red wavelength shift Dynamics of chemical functionalization were
continuously monitored through automated spectral acquisition
Figure 13 Baricentral wavelength variation vs time due to the chemical functionalization of
sensor surface
97
In Fig 13 it can be observed the dynamic of the barycentral wavelength shift of sensor
surface during the time in the first step the sensor surface was immersed in a phosphate
buffer solution at pH=5 for about 40 min after the stabilization of the optical signal the
sensor surface was immersed in the EDCNHS solution for about 40 min In the second
step the sensor surface was immersed in a clean buffer phosphate solution at pH=5
The so functionalized sensor surface was immersed in a phosphate buffer solution at
pH=7 after the stabilization of the optical signal a 3-APBA solution was added In Fig
14 it is reported the chemical reaction
Figure 14 The covalent attachment of the chosen ligand of 3APBA
Figure 15 A scheme of the sensor surface
Figure 16 Barycentral wavelength variation vs time due to the bioanchoring of 3-APBA at (a)
29 mM and (b) 58 mM
98
The 3-APBA solutions used are at different concentrations of 29 and 58 mM Dynamics
of chemical binding of ligand were continuously monitored through automated spectral
acquisition After the chemical functionalization by means of EDCNHS solution the
LPGs sensor surface was immersed into a phosphate buffer solution at pH=7
In Fig 16a it can observe the dynamic of the barycentral wavelength shift of sensor
surface during the time in the first step the sensor surface was immersed in a phosphate
buffer solution at pH=7 after the stabilization of the optical signal the sensor surface was
immersed in the 3-APBA solution at 29 mM In the second step the sensor surface was
immersed in a clean buffer phosphate solution at pH=7 In Fig 16b it can observe the
dynamic of the barycentral wavelength shift of sensor surface during the time in the first
step the sensor surface was immersed in a phosphate buffer solution at pH=7 after the
stabilization of the optical signal the sensor surface was immersed in the 3-APBA
solution at 58 mM Also in this case the sensor surface was immersed in a clean buffer
phosphate solution at pH=7
733 First verification of the preservation of 3-APBA capability of
binding the BL
Figure 17 Barycentral wavelength variation vs time related to the affinity binding of the ligand
to the β-lactamase
99
After optical stabilization the coated LPG was immersed in a phosphate buffer solution
at pH=7 after the stabilization of the optical signal the β-lactamase solution (69 μM) was
added In Fig 17 is reported the dynamic related to the affinity binding of the ligand to
the β-lactamase In Figure 11 it is possible to note that there was a wavelength shift when
the β-lactamase was added that means that the protein is binding
100
74 Data analysis interpretation
741 Analysis of the LPG biosensor response to the permanent
attachment of 3-APBA
In this section it is provided an analysis of the LPG biosensor (Prototype 2) response to
the permanent attachment of the 3-APBA onto its chemically functionalize surface In
particular here we analyze the barycentral wavelength variation of the attenuation band
of the LPG biosensor that occurs when it is immersed in 3-APBA solutions with two
different concentrations namely 29 and 58 mM
As described in the previous sections the test of ligand attachment essentially consists of
three main steps
1) the LPG probe (after the EDCNHS coupling chemistry) is first immersed in a vial
containing a phosphate buffer solution at pH=7 After a sort of acclimation of the
polymeric layers the biosensor response reaches a plateau value (λpH7)
2) successively a varying volume of ligand solution is added to the vial so as to obtain
the desired 3-APBA concentration the whole ligand binding kinetic is monitored
until the LPG response reaches a baseline value (λligand) this is carried out by
means of an automated spectral acquisition system enabling a continuous tracking
of the LPG attenuation band as well as the recovery of its baricentral wavelength
3) finally the probe is extracted from the vial and is immersed in a clean phosphate
buffer solution at pH=7 (the same solution used in the step 1 ) in order to remove
the ligand molecules that are not permanently bound to the probe surface Once
completed the washing procedure the LPG signal reach a new plateau (henceforth
referred to as λpH7washing)
As evident from Figure 18 where the sensorgram (ie the baricentral wavelength
variation of the LPG attenuation band vs time) of a generic test of ligand attachment has
been reported it is possible to identify two different LPG output signal variations
101
Δbefore-washing = λligand - λpH7 (red arrow)
and
∆after-washing = λpH7 washing - λpH7 (green arrow)
Figure 18 Generic test of ligand attachment
λbefore-washing is the baricentral wavelength shift of the LPG attenuation band due to the
attachment of ligand on the sensor surface evaluated before the washing procedure ie
when the probe is still immersed into the 3-APBA ligand solution In the most general
case in absence of thermal variations this quantity can be expressed as the sum of three
contributions
∆before-washing = ∆bulk + ∆Permanent + ∆not-Permanent
where Δbulk is the output signal variations (wavelength shift of the attenuation band) due
to the difference between the refractive indices of the clean pH=7 solution (used in the
step 1) and the ligand one (used in the step 2) ΔPermanent is the wavelength shift due to the
ligand permanently bound to the chemically functionalized surface of the LPG (or better
to the formation of a layer of ligand permanently bound to the LPG surface) Δnot-Permanent
102
is the wavelength shift due to the adsorption of ligand that is not permanently bound to
the sensor surface
On the other hand Δafter-washing is the barycentral wavelength shift of the LPG attenuation
band due to the ligand attachment on the sensor surface evaluated after the washing
procedure ie when the probe is immersed into a clean phosphate buffer solution at
pH=7 In absence of thermal variations it can be expressed as
∆after-washing = ∆permanent
Figure 19 Baricentral wavelength variation vs time obtained by two ligand attachment tests
using a 3-APBA solution concentration of 29 mM (a) and 58 mM (b) respectively
103
In this case indeed the ligand not-permanently bound to the surface is completely
removed by the washing cycles (∆not-Permanent = 0) and the refractive indices of the
phosphate buffer solutions at pH=7 before and after the ligand insertion are the same
(∆bulk = 0)
Therefore on the basis of these considerations it is clear that by evaluating the ∆after-washing
for each ligand solution concentration it is possible to evaluate the LPG signal variation
due exclusively to the formation of an ultra-thin layer of 3-APBA (of the order of a few
nanometers) that is permanently attached on the chemically functionalized LPG surface
After this brief introduction useful to elucidate the analysis methodologies and the
quantities under investigations let analyze further in detail the LPG biosensor response
to the permanent attachment of the 3-APBA occurred by using two ligand solutions with
different concentrations namely 29 and 58 mM
In Fig 19 the sensorgrams obtained by using a 3-APBA solution with concentration of
29 mM (a) and 58 mM (b) have been reported In particular Fig 19a refers to a first
test where a 3-APBA concentration of 29 mM has been used As it can be seen the
baseline of the sensor response when the LPG is immersed into the phosphate buffer
solution at pH=7 (before the ligand addiction) is λpH7=14600 nm As soon as the 3-APBA
solution is added to the buffer solution the LPG output signal decreases (the attenuation
band undergoes a blue-shift) until it reaches a plateau level at λligand=14521 nm During
the washing procedure the ligand molecules not permanently bound to the probe surface
tend to detach from it (and the ∆bulk become equal to 0) thus leading to a recovery (the
attenuation band red-shifts) of the sensor response until the plateau value
λpH7washing=14559 nm The observed values for ∆before-washing and ∆after-washing are 79 nm
and 41 nm respectively in correspondence of a 3-APBA solution concentration of
29mM When a higher 3-APBA solution concentration (58 mM) was used the λpH7
104
λligand and λpH7washing were respectively 14561 nm 14491 nm and 14522 nm with a
∆before-washing equal to 70 nm and a ∆after-washing of 39 nm
From the reported results it is possible to state that the signal recovery is not complete
(∆afterwashing ne 0) demonstrating that an ultrathin layer of 3-APBA effectively remains
permanently attached on the functionalized LPG surface
These results confirm that
- the chemical functionalization allows the carboxylic groups activation and
enables the permanently attachment of the 3-APBA ligand onto the coated LPG
surface
- the high surface sensitivity of the coated-functionalized LPG allows the detection
of a 3-APBA ligand ultrathin layer permanently attached onto the LPG probe
surface It is important to remark that the ligand size is significantly lower than
the size of the target β-lactamase protein
The following table summarizes the ∆before-washing and ∆after-washing values for the two used
3-APBA ligand concentrations
Table 1 Resume of the ∆before-washing and ∆after-washing obtained for the two used 3-APBA ligand
concentrations
3-APBA solution concentration ∆before-washing ∆after-washing
29 mM 79 nm 41 nm
58 mM 70 nm 39 nm
It is worth considering at this point that the ligand attachment in the test so far reported
takes place in successive addictions ie the 3-APBA attachment occurring in case of the
highest concentration (58 mM) takes place on the LPG functionalized surface already
covered (completely or only partially) by an ultra-thin ligand layer (ie the one formed
when the lowest concentration was used)
Therefore in this case it is preferable defining two further quantities (∆before-washing_cumulative
and ∆after-washing_cumulative) enabling to take into account this cumulative effect
∆before-washing_cumulative =sumi=1-n ∆before-washing(concentration_i)
105
∆after-washing_cumulative =sumi=1-n ∆after-washing(concentration_i)
In Figure 20 it is plotted these cumulative quantities ∆before-washing_cumulative (blak squares)
and ∆after-wahing_cumulative (red circles) as a function of the 3-APBA cumulative
concentration It can be observed that they both increase with the cumulative ligand
concentration with the ∆afterwahing_cumulative in particular showing a quadratic trend
Figure 19 ∆before-washing_cumulative and ∆after-wahing_cumulative as a funtion of the 3-APBA ligand
cumulative concentration
742 Analysis of the LPG biosensor response to the 3-APBA capability
of binding the BL
After previously analysis devoted to investigates the LPG biosensor response to the
permanent attachment of 3-APBA let analyze further in detail the sensor response to the
binding capability of the β-lactamase In Fig 20 the sensorgrams obtained by using a β-
lactamase with concentration of 69 μM has been reported As it can be seen the baseline
of the sensor response when the LPG is immersed into the phosphate buffer solution at
pH=7 (after the ligand attachment procedure) is λpH7=14476 nm As soon as the β-
lactamse solution is added to the buffer solution the LPG output signal increases (the
attenuation band undergoes a red-shift) until it reaches a plateau level at λβ- lactamase=1450
nm During the washing procedure the β-lactamase molecules not permanently bound to
the probe surface tend to detach from it (the ∆bulk become equal to 0) and the sensor
response until the plateau value λpH7washing=14448 nm
106
Figure 20 Baricentral wavelength variation vs time obtained by the β-lactamase binding with
the 3APBA ligand
The calculated values for ∆before-washing and ∆after-washing are respectively 24 nm and 28 nm
In particular the ∆after-washing is the wavelength shift due to the β-lactamase molecules
permanently attached onto the LPG surface
These results confirm that
- the attachment of the 3-APBA ligand onto the chemical functionalized surface of
the LPG probe (as described in the previously section) allows the β-lactamase
protein binding
- the proposed biosensor is able to detect the β-lactamase binding onto the
biofunctionalized LPG surface
107
75 Design and realization of an automated robotic arm
Aim of the OPTOBACTERIA Project was the design of an Automated Laboratory
Detector (ALD) mainly consisting on an automatic robot able to perform repetitive and
controlled tests on a series of biological samples by using multiple LPG biosensors
simultaneously The design phase started from a general view of the ALD a schematic
representation of which is shown in Figure 51 Here the ALD has been conceived as
composed of
1) a sensing head holder allowing the control of up to eight fiber optic biosensors
simultaneously
2) a couvettes carousel having Functionalization Samples and Rinse areas divided
according to the specific needs in order supply the ALD with the additional
functionality of being able to automatically realize the chemical functionalization
the ligand immobilization along with the biological tests starting from a general
purpose probe (ie from the LPG transducer with the a-PS and the PMMA
coatings)
Figure 21 General view of the ALD
108
3) a proper optoelectronic unit for the interrogation of the LPGndashbased reflection
probes
4) a PC with dedicated software for command and control of the Robotic work
The designed system is composed of two main parts the test chamber containing a
sensor mount able to hold up to eight LPG biosensor a couvette carousel holding a 96-
well plate and two linear actuators responsible for the movements of the well-plate along
the vertical and the horizontal directions and the rear region hosting the optoelectronic
interrogation unit and the electronic circuits for the control of the entire system the
connection with the host PC and the power supply
Once defined the design criteria the ALD system has been assembled and all its
components have been included in a suitable enclosure The test chamber where the
biological tests take place is shown in Fig 22 where the enclosure has been opened to
show the inside It is possible to distinguish the two-dimensional translation stages
(horizontal X and vertical Z) the sensor holder with eight LPG transducers mounted
and the couvettes carousel with a 96-well plate
Figure 22 A view of the manufactured ALD showing the test chamber
The developed ALD comprising both the mechanical stages and the optoelectronic
interrogation unit and its related software has been subjected to a phase of test and
debugging Once carried out the test of the single parts the whole system operation was
109
tested for making simultaneous biological tests with up to eight LPG probes The
complete kinetics of the binding of a ligand on the surface of each LPG probe and a typical
β-lactamase detection tests have been monitored
110
References
[1] httpwwwoptobacteriaeu
[2] NM Mitchell GG Rao J Wong ESBL Detection Kit and Method US Patent
20100203567 (2010)
[3] X Fan IM White SI Shopova Analytica Chimica Acta 620(1-2) 8-26 (2008)
[4] X Chen L Zhang K Zhou Opt Lett 32 2541-2543 (2007)
[5] M Smietana WJ Bock P Mikulic Opt Express 19 7971-7978 (2011)
[6] Z Wang JR Heflin KV Cott Sensors and Actuators B Chemical 139(2-4) 618-
623 (2009)
[7] A Cusano A Iadicicco P Pilla Opt Express 14(1) 19ndash34 (2006)
[8] P Pilla P Foglia Manzillo V Malachovska Opt Express 17 20039ndash20050 (2009)
[9] I Del Villar I R Matiacuteas FJ Arregui Opt Express 13(1) 56ndash69 (2005)
[10] P Pilla V Malachovskaacute A Borriello Opt Express 19 512ndash526 (2011)
[11] KM Stoeffler C Dubois A Ajji Polym Eng Sci 50 1122-1127 (2010)
[12] H Ma AKY Jen LR Dalton Adv Mater 14 1339-1365 (2002)
[13] D Ennis H Betz H Ade J Polym Sci Part B Polym Phys 44 3234-3244
(2006)
[14] I Del Villar IR Matias FJ Arregui J Lightwave Technol 23 4192 (2005)
111
8 Conclusion
The aim of this thesis is the realization of integrated optic sensors based on fiber grating
devices In order to obtain chemical and biological sensors a Long Period Gratings
transducer was used as transduction platform Different organic and inorganic materials
were used as sensitive elements at the interface between the LPGs and the external
environment Since the selectivity and sensitivity of a LPGs based sensor depend upon
the interface materials careful study of the sensing materials as well as of the deposition
process was done
Results of this PhD work has been obtained thanks to the integration of interdisciplinary
knowledges in different scientific and technological areas such as optical engineering
biochemistry polymer materials synthetic chemistry
In the framework of the OPTOFER Project it has been manufactured a GPL sensor based
on LPGs coated with a-PS thin films This polymeric film has been chosen for the
physical affinity between the hydrophobic polystyrene chains and the short aliphatic
molecules that constitute GPL Preliminary results have shown the good sensitivity of the
devices in presence of unknown GPL concentrations the signal is stable and the sensor
is characterized by fast response time and reversibility (absence of hysteresis in
consecutive gas ongas off cycles) An accurate study both of the material and of the
interaction between the LPG transducer and the a-PS film has allowed the development
of a device able to clearly detect GPL concentration between 1000 to 30000 ppm These
sensors have been installed and tested under the railway tunnel of Porta Rufina station in
Benevento
ldquoRelative humidity fiber optic sensors based on Long Period Gratingsrdquo is the name of the
collaboration agreement with CERN during which have been designed developed and
manufactured humidity sensors resistant to radiation and to cryogenic temperature LPGs
112
used as transducers were coated with thin film of sol-gel synthesized titania an inorganic
oxide that shows different interesting features 1) hygrosensitive characteristics 2) ageing
and high energy radiation resistance and 3) thermal stability The sol-gel synthesis and
the deposition process optimization has led to the development of humidity sensors with
good sensibility and reversibility and the inorganic nature of the titania coating
guarantees the mechanical and thermal stability of the device
In the framework of the OPTOBACTERIA Project has been developed a highly-
sensitive reflection-type LPG biosensor useful for the detection of antibiotic resistance
bacteria The reflection-type LPG was coated by a primary a-PS layer and by a secondary
very thin overlay of PMMA-co-MA a-PS was used has HRI layer in order to tune the
LPG to operate in the transition region PMMA-co-MA has been employed as thin film
to provide carboxylic groups on the external surface of the fiber A standard linkage
chemistry has been carried out to anchor the bioreceptors to the probe surface
Preliminary experimental results demonstrate the capability of the fabricated LPG
biosensor to successfully monitor all the steps of the biochemical immobilization strategy
as well as to detect the BL binding to its functionalized surface
113
Acknowledgement
Firstly I would like to express my sincere gratitude to my PhD tutor Dr Anna Borriello
for the continuous support of my PhD study and related research for her patience
motivation and immense knowledge Her guidance helped me in all the time of research
and writing of this thesis both from the scientific and human point of view
I would also like to thank my PhD tutor Prof Giuseppe Mensitieri for the support given
to me during these three years and for the useful scientific discussion
My sincere thanks also goes to Eng Mauro Zarrelli for encouraging my research and for
allowing me to grow as a research scientist your advice on both research as well as on
my career have been priceless
I would like to thank also Miss Paola Desidery who has always answered my
administrative questions with patient and courtesy and Miss Mariarosaria Marcedula
who has constantly helped me in samples manufacturing and characterization
Moreover I would like to thank my mother for supporting me spiritually throughout the
PhD period for teaching me to endure until the achievement of my goals and to share
my work results with the people who helped me
A special thanks goes to the love of my life P M who made me understand the true
meaning of love making me feel happier than I thought was possible I will never stop to
thank you for the patience that you have had and for the love you show me every day
Finally I dedicate this work to the memory of my father who until the last day of his life
has always been able to counsel and help me Thanks for all you have done for mom and
me

8
breathe VOCs since they are commonly used as ingredients in household products or in
industrial processes it is important to selectively monitor the concentration of these
vapors to safeguard the health of residents and workers and to keep atmospheric
emissions under control in order to avoid environmental hazards Unlike metal oxide
semiconductors polymer are suitable to discriminate between different gasses and vapors
classes Furthermore these inorganic materials need high operative temperature (over
300degC)
Figure 1 Sensor classification proposed by Liu et al [6]
For these reasons polymers have begun to be studied and employed in the sensing area
Although conductive polymers are also used as electrochemical sensors the area where
polymers find most successful is the optical sensing in fact they are extensively used as
sensible coating for optical fiber sensors
The optical fiber sensors have advantages that include immunity to EI lightweight small
size large bandwidth and ease in implementing multiplexed or distributed sensors
Moreover optical fiber sensors could achieve higher sensitivity selectivity stability and
lower response time (which enables on-line real time detection) than non-optical methods
with much longer lifetime Strain temperature and pressure are the most widely studied
measurands and the fiber grating sensor represents the most widely studied technology
for optical fiber sensors as shown in Fig 2 which shows the technologies involved in the
optical fiber sensors presented at 15th Optical Fiber Sensors Conference (OFS-15) [7]
9
Figure 2 Distribution of OFS-15 papers according to technologies [7]
Although the formation of fiber gratings had been reported in 1978 [8] intensive study
on fiber gratings began after a controllable and effective method for their fabrication
developed in 1989 [9] Extensive studies have been performed on fiber grating sensors
and some of which have now reached commercialization stages Fig 3 shows some types
of fiber gratings Under phase matching conditions a FBG couples the forward
propagating core mode to the backward propagating core mode A LPG can couple the
forward propagating core mode to one or a few of the forward propagating cladding
modes
Figure 3 Types of fiber gratings (a) Fiber Bragg grating (b) long-period fiber grating [7]
In particular LPG has been used as a RI sensor because of its high RI sensitivity If the
coating or jacket is removed from the optical fiber the evanescent field of the cladding
mode that exists outside the cladding experiences the RI change of the outside material
The selectivity and sensitivity can be tuned by depositing a thin film overlay on the
grating region as reported by Rees et al [10] he has coated an LPG with an organic film
by the LamgmuirndashBlodgett technique and studied the influence of the overlay material
10
thickness on the LPG response the film has been proved to be chemically sensitive so
the LPG film sensors could be used as species-specific chemical sensors
21 VOCs and GPL sensors
VOCs are organic chemical compounds that have a high vapor pressure at ordinary room
temperature Their high vapor pressure results from a low boiling point which causes
large numbers of molecules to evaporate from the liquid form of the compound and enter
the surrounding air VOCs are numerous varied and some examples are the followers
aromatic and aliphatic hydrocarbons (such as methane propane butane and benzene)
aldehydes (such as formaldehyde) alcohol (such as ethanol and propanol) and
chlorofluorocarbons In addition GPL is classified as a VOC
GPL or liquid petroleum gas are flammable mixtures of hydrocarbon gases used as fuel
in heating appliances cooking equipment and vehicles Varieties of GPL bought and sold
include mixes that are mostly propane (C3H8) mostly butane (C4H10) and most
commonly mixes including both propane and butane Propylene butylene and various
other hydrocarbons are usually also present in small concentrations LPG is prepared by
refining petroleum or wet natural gas and is almost entirely derived from fossil fuel
sources being manufactured during the refining of petroleum (crude oil) or extracted
from petroleum or natural gas streams as they emerge from the ground
As reported in the previous paragraph metal oxide semiconductor are the most common
materials used to develop electrochemical VOCs sensors Generally the used oxide are n
type semiconductors [11-13] (charge carrier are electrons) but this is not a general rule
because NiOx oxides that are p type semiconductors (charge carrier are holes) result
widely employed in VOCs detection The most employed oxides as sensing material in
VOCs sensors are iron oxide (Fe2O3) [11] tin oxide (SnO2) [12] and titanium oxide
(TiO2) [13] Thin Fe2O3 layers deposited using catodic sputtering have been employed
11
by Siroky et al [11] to realize an hydrogen and VOCs detector the operative temperature
is 350-400degC In order to obtain a device able to discriminate between toluene and o-
xylene in 1997 Llobet et al [12] developed a sensors array based on SnO2 films the
simultaneous tracking of the stationary (response absolute value) and in time (response
time) signal has allowed to evaluate the device selectivity Using different sol-gel
methods is possible to realize TiO2 based sensors with different sensing performances as
studied by Garzella et al [13] in 2000 In this work developed devices have shown
promising response toward ethanol and methanol although operative temperature are
very high (400-500degC) Fig 4 shows the performances obtained in the cited
Figure 4 (a) Response as function of hydrogen concentration (ppm) for the Fe2O3 sensor at
different operative temperature [11] (b) in time response for the SnO2 sensors array [12] (c)
response as function of ethanol and methanol concentration (ppm) for the TiO2 sensor at
different operative temperature [13]
GPL has characterized by a boiling point lower than room temperature It is heavier than
air unlike natural gas and thus it flows along floors and tend to settle in low spots such
as basements GPL results very dangerous for two reasons the first is the risk of explosion
if the mixture of gas and air is within the explosive limits and there is an ignition source
the second is suffocation due to gas displacing air causing a decrease in oxygen
concentration
For these reasons great efforts are done to obtain sensible and selective GPL sensors At
now commercial GPL sensors are based on metal oxide semiconductor in particular
pure oxides (eg ZnO [14] SnO2 [15] Fe2O3 [16]) mixed oxides (eg NiFe2O4 [17]) and
heterojunctions [18] In 2011 Chaisitsak et al [15] have developed a GPL sensor based
12
on SnO2 layers doped with F as shown in Fig 5 operative temperature is a critical
parameter in device sensing performance
Figure 5 Resistance variation as function of time for SnO2F sensor in presence of either pure
N2 or N2GPL mixture at (a) 300degC and (b) 400degC [15]
Although GPL sensors are generally realized using planar architecture (the sensing
meaurand is the electrical conductibility variation) some researchers have proposed to
develop sensors using optical fibers An example is the work of Abdelghani et al [16]
who have coated optical fibers with porous silica (realized with a sol-gel method) Results
are shown in Fig 6 and it is evident the sensor ability to discriminate between chlorinated
hydrocarbons and alkanes (main components in GPL) The firsts have higher RI than the
optical fiber cladding (nclad = 14) while the seconds are characterized by a lower RI and
that justify the selectivity of the sensor
Figure 6 Response as function of analyte concentration analyte is (a) chlorinated hydrocarbons
and (b) alkanes [16]
13
22 Humidity sensors
Humidity and temperature are among the most frequently measured physical quantities
in measurement science Whereas the measurement of temperature can nowadays be done
with a satisfactory accuracy measurement of the water vapor content of gaseous
atmospheres ie hygrometry appears much more complex Water vapor is a natural
component of air and it plays an important role in a wide and various range of practical
measurement situations Today different humidity sensors exist for miscellaneous
applications [19 20] Recent achievements in miniaturization have certainly encouraged
the development of miniaturized humidity sensors Today roughly 75 of the humidity
sensors in commerce are based on the capacitive technique [21] There are on the other
hand multitudes of other hygrometers based on different transducing techniques such as
gravimetric and optical techniques
Figure 7 a) Honeycomb structure of AAO [22] b) Capacitance (mdash) and resistance (- - - -)
response of the Al2O3 sensor to RH at 11degC 25degC and 40degC [23]
Capacitive sensors are based on dielectric changes of thin films in presence of water
vapors Al2O3 is one of the most favorable ceramic sensing materials due to its negligible
dependence of temperature at nearly all range of RH from 25degC to 80degC [24] The small
pore radius makes Al2O3 sensitive to very low water vapor pressure The discovery of the
AAO sensibility toward humidity dates back to 1950 but it was practically employed
only in 1978 when researcher discover that it could form regular microstructure [25]
Low voltage anodization at certain conditions in acidic electrolyte solution forms Al2O3
14
layer consisting of hexagonal closepacked cylindrical pores perpendicular to the metal
surface (Fig 7a) Figure 7b shows the electrical characteristics of the Al2O3 sensors
versus RH at various temperatures [23]
TiO2 has three phases anatase rutile and brookite The third one is seldom used in
humidity sensing When heated strongly (sim1000degC) anatase automatically transforms to
the rutile structure Rutile is the most common phase of TiO2 while anatase is very rare
in nature For humidity sensing applications anatase TiO2 are usually made by solndashgel
method The sintering must be at low temperatures (eg lt500degC) for short time
Otherwise TiO2 may be turned into rutile Due to its higher water adsorption capacity
anatase is a preferred humidity sensing material However most TiO2-based sensors are
not sensitive at low humidity levels and have limited detection ranges from 10 to 30RH
[26 27] A newly developed TiO2 nanowireNafion composite sensor is capable to detect
RH levels between 12 and 98RH (Fig 8) with low hysteresis and good stability [28]
Figure 8 Humidity response curve of TiO2nanowiresNafion [28]
The most widely known gravimetric humidity sensor is the QCM Thin plates of
pietzoelectric quartz have resonance frequencies in the MHz- range Coated with a
hygroscopic layer the change of frequency acts as a measure of the humidity In 2009 a
novel humidity sensor was fabricated by electrospinning deposition of nanofibrous
polyelectrolyte membranes as sensitive coatings on a quartz crystal microbalance (QCM)
The results of sensing experiments indicated that the response of the sensors increased by
15
more than two orders of magnitude with increasing RH from 6 to 95RH (Fig 9a) at
room temperature exhibiting high sensitivity and that in the range of 20ndash95 RH the
Log(Δf) showed good linearity (Fig 9b) [29]
Figure 9 a) Frequency shifts of polyelectrolyte coated QCM humidity sensors as a function of
the RH b) The dependence of the frequency shifts of sensors on RH (20ndash95) and the
calibration curves obtained from (a) [29]
All the sensors discussed so far are generally not suitable to be employed in an
environment of a potentially hazardous or explosive nature and also in situations where
requirements such as immunity to electromagnetic interference multi sensor operation
in situ and remote monitoring are for example required Fiber optics offers a new
approach to this new measurement problem The fiber grating sensor represents a class
of intrinsic fiber optic sensor that has gained widespread popularity in recent years and
as previously stated they are generally classified into two main categories ie FBG and
LPG
As an example work reported by Yeo et al [30] demonstrates the applicability of
polymer-coated FBG as humidity sensors The swelling of the polyimide coating as a
result of the moisture absorption changes the Bragg wavelength of the FBG thus giving
a direct indication of the humidity level The results obtained are plotted in Fig 10
showing the Bragg wavelength shift of the PI-coated sensors with different coating
thickness used For each the RH response of the sensors was found to be linear with
increasing RH from 23 to 97RH
16
Figure 10 RH response of the sensors with different coating thicknesses from 23 to 97RH at
constant room temperature [30]
Recent studies by Venugopalan et al [31] have shown the use of polyvinyl alcohol (PVA)
film as a sensing material for LPG-based humidity detection In this work a ~4μm thick
PVA layer was deposited onto the grating of an LPG with a 300μm period The sensor
was evaluated over a relative humidity range from 33 to 97 using the resonance loss
band at 1500 nm where the change in transmission dip was monitored and calibrated
against humidity change The results are shown in Fig 11 the change of the spectral
characteristics of the sensor with RH leads to the calibration graph of resonance loss
vs RH
Figure 11 a) Spectral characteristics of PVA-coated LPG at 1500 nm b) Transmission dip
variation at various RH levels [31]
17
23 Biosensors
A biosensor is a device for the detection of an analyte that combines a biological
component with a physicochemical detector component It consists of 3 parts (see Fig
12)
A sensitive biological element (a biological material eg tissue microorganisms
organelles cell receptors enzymes antibodies nucleic acids etc)
A transducer or the detector element (optical piezoelectric electrochemical etc)
that transforms the measurand variation due to the interaction of the analyte with
the biological element into a measurable signal
A signal processors that are primarily responsible for the display of the results in
a user-friendly way
Figure 12 A schematic representation of biosensors
A biosensor is any device able to convert the interaction between its surface and a
biological element into a readable signal rejecting any other nonspecific signal
Table 1 Elements of a biosensor
Biosensors
Biological element
Sensor element
Enzyme Electric conductivity
Antibody Electromagnetic radiation
Nucleic Acid Mass
Tissue Temperature
Microbial Viscosity
Polysaccharide
Affinity biosensors are based on interaction between the immobilized biological
components on the transducer surface and target molecules The bioelement is very
specific to the analyte to which it is sensitive and it does not recognize other analytes
Biological elements used in affinity biosensors are for example antibody DNA and
18
receptor protein A detailed list of different possible bioelements and sensor-elements is
shown in table 1 These sensors can provide high sensitivity selectivity and low detection
limit
Biosensors can have a variety of biomedical industry and military applications as shown
in Fig 14 A major application is in blood glucose sensing because of its abundant market
potential However biosensors have tremendous potential for commercialization in other
fields of application such as biosensor-based instruments in food and beverage
production environmental sampling and noninvasive instruments for clinical analysis
However commercial adoption has been slow because of several technological
difficulties For example due to the presence of biomolecules along with semiconductor
materials biosensor contamination is a major issue
Figure 13 Biosensors application fields
The history of biosensors started in 1962 with the development of enzyme electrodes by
scientist Clark et al [32] Since then research communities from various fields such as
very large scale integration (VLSI) physics chemistry and material science have come
together to develop more sophisticated reliable and mature biosensing devices
Various types of biosensors being used are enzymebased tissue-based immunosensors
DNA biosensors and thermal and piezoelectric biosensors Updike et al [33] reported
the first enzyme-based sensor in 1967 Enzyme biosensors have been devised on
19
immobilization methods ie adsorption of enzymes by van der Waals forces ionic
bonding or covalent bonding The commonly used enzymes for this purpose are
oxidoreductases polyphenol oxidases peroxidases and aminooxidases [34]
An enzyme is a large protein molecule that acts as a catalyst in chemical reactions but
remains unchanged at the end of the reaction its working principle is illustrated in Fig
14a An enzyme upon reaction with a substrate forms a complex molecule that under
appropriate conditions forms the desirable product molecule releasing the enzyme at the
end The enzymes are extremely specific in their action enzyme X will change a specific
substance A to another specific substance B as illustrated in Fig 14b This extremely
specific action of the enzymes is the basis of biosensors
Figure 14 a) Working principle of enzymes b) Specificity of enzymes
The first microbe-based or cell-based sensor was actualized by Diviegraves et al [35] The
tissues for tissue-based sensors arise from plant and animal sources The analyte of
interest can be an inhibitor or a substrate of these processes However for this type of
biosensor the stability was high but the detection time was longer and the specificity
was reduced
Immunosensors were established on the fact that antibodies have high affinity towards
their respective antigens ie the antibodies specifically bind to pathogens or toxins or
interact with components of the hosts immune system The DNA biosensors were devised
on the property that single-strand nucleic acid molecule is able to recognize and bind to
20
its complementary strand in a sample The interaction is due to the formation of stable
hydrogen bonds between the two nucleic acid strands [36]
As reported in table 1 there are different types of transducing signals (sensor elements)
which define as many types of biosensors In resonant biosensors an acoustic wave
transducer is coupled with an antibody or bioelement When the analyte molecule or
antigen gets attached to the membrane the mass of the membrane changes The resulting
change in the mass subsequently changes the resonant frequency of the transducer This
frequency change is then measured
Since the anthrax spore bioterrorism attacks in America in 2001 the early detection of
Bacillus anthracis spores and vegetative cells has gained significant interest In 2008
Hao et al [37] have developed a novel QCM sensors for detection of Bacillus anthracis
This biosensor is based on a QCM sensor functionalized with an anti-Bacillus anthracis
monoclonal antibody designated to 8G3 (mAb 8G3 IgG) Optimized mAb 8G3 was
immobilized onto the Au electrode with protein A on a mixed self-assembled monolayer
(SAM) of 11-mercaptoundecanoic acid (11-MUA) and 6-mercaptohexan-1-ol (6-MHO)
as adhesive layer The schematic illustration of mAb functionalized QCM sensor is
depicted in Fig 15
Figure 15 Schematic illustration of mAb functionalized QCM sensor [37]
In Fig 16 is shown the response of the QCM biosensor to a range of concentrations of
Bacillus anthracis vegetative cells from 7times102 to 7times108 CFUml and their calibration
curve in logndashlog plot It was shown that the frequency shift of the QCM biosensor
increased along with the concentration of Bacillus anthracis vegetative cells
21
Figure 16 Changes of frequencies of mAb functionalized QCM biosensor response to
Bacillus anthracis vegetative cells in range of concentrations [37]
Another wide class of biosensors is based on the optical fibers fibers are a convenient
material for optical sensor design because they can be inexpensive and provide easy and
efficient signal delivery LPGs have attracted a great deal of attention in recent years for
biochemical sensing applications although the advantages of LPGs have been known
since the early 1990rsquos The earliest demonstration of biomolecule detection with LPGs
was in 2000 when etched LPGs were used to detect antibodies [38] where goat anti-
human IgG antibodies were linked to the fiber surface with glutaraldehyde and were then
used to detect aqueous human IgG These results showed repeatable detection down to
2microgmL with a dynamic range of 2ndash100microgmL
Figure 17 a) Spectral evolution of LPG resonance peak with different hemoglobin
concentrations b) wavelength shifts against hemoglobin concentration [39]
In 2007 Chen et al [39] were able to use etched LPGs for detection of hemoglobin In
this work the hemoglobin was allowed to adsorb non-specifically yielding an estimated
DL of around 0005 for hemoglobin in water Fig 17a shows the spectra of the
22
resonance peak under different solutions and Fig 17b plots its central wavelength shift
against the hemoglobin concentration
In 2016 Yin et al [40] have developed an highly sensitive glucose microfluidic chip
integrated with specialty optical fiber LPG sensor (inscribed in a small-diameter single-
mode fiber) A layer-by-layer self-assembly technique has been successfully applied to
prepare PEIPAA multilayers on the surface of the LPG sensor The negatively charged
GOD layer was then immobilized on the multilayer film for glucose sensing (Fig 18)
Figure 18 The layer-by-layer self-assembly scheme for the preparation of multilayer sensing
film [40]
Figure 20 (a) Response of the SDSMF-LPG biosensor to different glucose concentrations The
inset shows the measured transmission spectra (b) the measured dynamic response of the
biosensor [40]
When the glucose is oxidized with the GOD catalyst gluconic acid will be produced and
the pH of mixture solution changes with it Since the swelling degree of the (PEIPAA)n
multilayer sensing film depends on the pH of surrounding medium the sensing film will
23
swell with glucose concentration increasing and the induced RI change leads to a spectra
shift of the LPG sensor [41 42]
The fabricated glucose biosensors were tested in glucose solutions with different
concentrations Fig 20a shows the response of the LPG (with (PEIPAA)9(PEIGOD)1
multilayer film) to different glucose concentrations It can be seen that the resonant
wavelength shifts to longer values when the concentration of glucose increases in
accordance with the previous explanation The spectral dip stops red shift when the
glucose concentration increases to 2 μM It is mainly because that the pH no longer
changes after reacting for a specific period of time The dynamic response of the LPG
sensor is shown in Fig 20b and two aspect are evident 1) the response time is about 6
mins (time needed by the sensor to reach a stable signal) 2) the detection limit is 1 nM
24
References
[1] Y Wang MM Tong D Zhang Sensors 11 19ndash31 (2011)
[2] R Frodl T Tille IEEE Sens J 6 1697ndash1705 (2006)
[3] J Qu Y Chai SX Yang Sensors 9 895ndash908 (2009)
[4] E Cordos L Ferenczi S Cadar In Proceedings of 2006 IEEE International
Conference on Automation Quality and Testing Robotics pp 208ndash211 Romania 25ndash
28 May 2006
[5] GF Fine LM Cavanagh A Afonja Sensors 10 5469ndash5502 (2010)
[6] X Liu S Cheng H Liu Sensors 12 9635-9665 (2012)
[7] L Byoungho Optical Fiber Technology 9 57ndash79 (2003)
[8] KO Hill Y Fujii DC Johnson Appl Phys Lett 32 647ndash649 (1978)
[9] G Meltz WW Morey Opt Lett 14 823ndash825 (1989)
[10] N D Rees S W James R P Tatam Opt Lett 27 686 (2002)
[11] K Siroky J Jiresova L Hudec Thin Solid Films 245 211-214 (1994)
[12] E Llobet J Brezmes X Vilanova Sensors and Actuator B 41 13-21 (1997)
[13] C Garzella E Comini E Tempesti Sensors and Actuators B 68 189ndash196 (2000)
[14] P Mitra AP Chatterjee HS Maiti Materials Letters 35 33ndash38 (1998)
[15] S Chaisitsak Sensors 11 7127-7140 (2011)
[16] D Patil V Patil P Patil Sensors and Actuators B 152 299ndash306 (2011)
[17] L Satyanarayana KM Reddya SV Manorama Materials Chemistry and Physics
82 21ndash26 (2003)
[18] DS Dhawale RR Salunkhe UM Patil Sensors and Actuators B 134 988ndash992
(2008)
[19] Y Ma S Ma W Fang Sensors and Actuators A 49 47-50 (1995)
[20] V Matko D Donlagic Sensors and Actuators A 61 331-334 (1997)
25
[21] G Scholz Technisches Messen 59 88-109 (1992)
[22] Z Chen C Lu Sensors Letters 3 274-295 (2005)
[23] Z Chen M-C Jin in Proc 27th Annual Conf IEEE Industry Appl Soc 2 pp
1668 Houston(TX) 1992
[24] S Chakraborty K Nemoto K Hara Smart Materials and Structure 8 274 (1999)
[25] G E Thompson R C Furneaux G C Wood Nature 272 433 (1978)
[26] LL Chow MMF Yuen PCH Chan Sensors and Actuators B 76 310 (2001)
[27] MK Jain MC Bhatnagar GL Sharma Sensors and Actuators B 55 180 (1999)
[28] R Wu Y Sun C Lin Sensors and Actuators B 115 198-204 (2006)
[29] X Wang B Ding J Yu Nanotechnology 21 55502-55508 (2010)
[30] TL Yeo T Suna KTV Grattan Sensors and Actuators B 110 148ndash155 (2005)
[31] T Venugopalan TL Yeo T Sun In Proceedings Third European Workshop on
Optical Fibre Sensors 6619 pp 661925-1ndash661925-4 Naples (Italy) (2007)
[32] LC Clark C Lyons Annals New York Academy of Sciences 102 29-45 (1962)
[33] SJ Updike GP Hicks Nature 214 986-988 (1967)
[34] J Wang Chem Rev 108 (2) 814-825 (2008)
[35] C Diviegraves Ann Microbiol 126A 175-186 (1975)
[36] J Wang Biosensors and Bioelectronics 13(7-8) 757-762 (1998)
[37] R Hao D Wang X Zhang Biosensors and Bioelectronics 24 1330ndash1335 (2009)
[38] MP DeLisa Z Zhang M Shiloach Anal Chem 72 2895 (2000)
[39] X Chen K Zhou L Zhang Appl Opt 46 451 (2007)
[40] M Yin B Huang S Gao Biomedical Optics Express 7(5) 2067-2077 (2016)
[41] MJ Yin BB Gu JW Qian Anal Methods 4(5) 1292-1297 (2012)
[42] I Tokarev I Tokareva V Gopishetty Adv Mater 22(12) 1412ndash1416 (2010)
26
3 Long Period Gratings
31 Principle of Operation
Long Period Fiber Gratings are photonic devices realized by inducing a periodic
refractive index modulation (Λ=100‐500 μm) of the core of a single mode optical fiber
along few centimeters (L=2‐3 cm) of its length [1] This periodic perturbation makes
possible the power transfer from the fundamental guided core mode to a discrete number
of forward propagating cladding modes and to each of them at a distinct wavelength
where the so‐called phase matching condition is satisfied
λres0i = (neffco ndash neff0i
cl) Λ (eq 1)
where neffco and neff0i
cl are the core and ith cladding mode effective indices respectively
Λ is the grating period (see Fig 1a) As a result of this process referred to as mode
coupling the LPG transmission spectrum shows several attenuation bands or dips related
to the different excited optical fields the cladding modes (see Fig 1b) LPGs are
sensitive to a number of environmental parameters (temperature strain bending ambient
refractive index) which affect the phase matching condition changing in turn the
attenuation bands spectral position [2] However appropriate simple countermeasures
can be used to minimize the effect of the parameters not of interest
Figure 1 a) Pictorial description of mode coupling in LPGs b) typical LPG transmission
spectrum
27
The dependence of LPGs spectral features on SRI changes is what makes them very
attractive for chemical and biomolecular sensing applications [3 4] However bare LPGs
show the highest sensitivity for SRIs close to cladding refractive index (approx 145)
while they have poor performance in gaseous and watery environments [5] Moreover
they lack any chemical selectivity
The influence of SRI changes for a bare LPG is expressed by
dλres0i
dnsur=
dλres0i
dneffcl0i
dneffcl0i
dnsur (eq 2)
where nsur is the refractive index of the external medium The factor dneff0i
cldnsur is
different for each cladding mode and hence the spectral response of an LPG depends
strongly on the order of the coupled cladding mode The higher sensitivity is shown by
the higher order modes and as stated previously it occurs at refractive indexes
approaching that of the cladding For a given cladding mode the wavelength shift resulted
from the refractive index changes may be positive or negative depending on the local
slope of the phase matching curve dλdΛ where for low order modes it is typically
negative Although it is possible to enhance the sensitivity of an LPG by manipulating
the fiber parameters to obtain the appropriate order of the coupled cladding mode
however it is not possible to provide chemical selectivity with a bare LPG
It was recently demonstrated that the sensitivity of LPGs can be greatly enhanced by the
deposition of a thin overlay onto the cladding along the grating region provided that the
overlay has higher refractive index than the cladding [6] Moreover the sensitivity can be
optimized for a specific working environment by acting on thickness (ranging in hundreds
of nanometers) of the high RI layer which is in contact with the surface of the LPG itself
Therefore the deposition of thin high RI overlay of suitable thickness allows the
enhancement and optimization of the device sensitivity against SRI changes and
parametrical variations of the overlay features (RI and thickness) In addition if the
28
overlay is made of a material able to respond to chemicalphysical stimuli the coated
LPG can operate as an extremely sensitive sensor
When a thin high RI overlay is deposited onto a LPG the effective index of the cladding
modes increases and as it follows from eq 1 the attenuation bands experience a blue
shift (see Fig 2) By increasing the overlay thickness the attenuation bands move from
their initial position toward that initially occupied by the adjacent cladding mode of lower
order and this migration follows a transition function trend (see Fig 3) [7]
Figure 2 a) Sketch of a LPG coated with a high RI overlayer b) spectral changes against an
increasing overlayer thickness
When the attenuation bands of the coated LPG are tuned at the center of the spectral
separation of two consecutive attenuation bands as defined by the original bare device
then the device is working in the transition region or in transition mode A LPG working
in transition mode has the highest sensitivity to parametrical variations of the overlay
(thickness and RI) and to the SRI changes (see Fig 3b) From the physical point of view
the high RI overlay draws the optical field towards the external medium extending its
evanescent wave As a result there is an increased sensitivity of the device to the SRI
changes At the same time an increasing evanescent wave in the surrounding medium
corresponds to an increasing optical power fraction confined in the overlay
Therefore the sensitivity to the refractive index changes of the high RI overlay is even
bigger than that to the SRI changes High RI coated LPGs have been successfully
29
exploited for chemical and biomolecular sensing applications and are expected to become
a key technology in the sensing field within the next few years [8-10]
Figure 3 a) Conceptual plot explaining the wavelength shift of the attenuation bands as function
of the overlay thickness of a fixed SRI and given material b) sensitivity trend as a function of
the overlay thickness
Figure 4 Modal dispersion diagram for the first 20 cladding modes
Figure 4 shows the so called modal dispersion diagram for the cladding modes relative
to a generic optical fiber Each curve in the plot is related to a different cladding mode
and the mode order increases moving from right to left in the plot in particular the
dispersion curves for the first 20 cladding modes is reported The wavelength range
reported on the y‐axis is 1200‐1800 nm that is the common wavelength range for optical
spectrum analyzers (OSA) These curves are the result of a complex numerical
processing obtained solving the coupled mode equation that is a system of differential
equations derived by the coupled mode theory [11]
30
This plot is useful to determine the central wavelengths of the attenuation bands present
in the transmission spectrum and to which cladding mode they are related given a
specific grating period As an example in Fig 5 it is reported the same modal dispersion
diagram with a vertical line corresponding to a period Λ=400 μm This line intercepts the
modal curves of the first 5 cladding modes at the wavelengths 13028 nm 13259 nm
13696 nm 14443 nm 1581 nm respectively
Figure 5 Modal dispersion diagram with intercept at 400 μm period
The complete solution of the coupled mode equations for the device under consideration
leads to the spectral features reported in Fig 6
Figure 6 Transmission spectrum for a LPG with grating period at 400 μm
31
32 LPGs Typologies
The fabrication of LPGs relies upon the introduction of a periodic modulation of the
optical properties of the fiber This may be achieved by permanent modification of the
refractive index of the core of the optical fiber or by physical deformation of the fiber
321 UV-Induced LPGs
LPG fabrication method based on UV radiation is the most common approach for grating
fabrication and thus most of the results reported in literature are referred to this type of
fabrication The UV-induced index modulation is typically achieved in Ge-doped silica
fibers using wavelengths between 193 and 266 nm [12] This is the most widely utilized
method for the fabrication of LPGs The refractive index change is associated with the
formation of Ge-related glass defects Fibers with high photosensitivity have been
developed by co-doping the core with boron and germanium [13] The refractive index
modulation may be built up on a point-by-point basis or the entire length of the LPG may
be formed simultaneously by exposure of the fiber though an amplitude mask [14] via a
patterned mirror [15] or using a microlens array [16] facilitating rapid and reproducible
LPG fabrication
Figure 7 LPG fabrication using a UV laser [17]
32
A typical LPG fabrication configuration using UV irradiation through an amplitude
mask is shown in figure 7 The output from a UV laser source is used to illuminate the
optical fiber through an amplitude mask of appropriate period which may be fabricated
in chrome-plated silica or from a metal foil for example by milling a copper foil using a
Cu vapor laser The cylindrical lens produces a line focus oriented parallel to the axis of
the fiber
322 Arc-Induced LPGs
In LPG fabrication method based on Electric arc discharge the grating is written by
periodical local heating of the fiber using electric arc discharges and by applying lateral
stress on a standard fiber this provides good performances as well as high thermal
stability to the LPG [18] The electrical arc technique is much simpler and does not need
expensive laser equipment Typically the electrodes of a fusion-splicing machine are
used exposing a region of fiber with a length of the order of 100 μm to the arc limiting
the minimum period of LPG that may be fabricated
Figure 8 a) Apparatus for manufacturing of taperd LPG 1) broadband light source 2) optical
fiber 3) motorized translation stage 4) arc-generating electrodes 5) pulley 6) weight 7) optical
spectrum analyzer (OSA) 8) computer b) microscope image of the investigated tapered LPG
with Λ=600 μm [19]
When a tensile load is applied to the fiber the periodic variation in the diameter of the
fibre results in a periodic strain variation across the corrugated structure with a
concomitant periodic refractive index induced via the photoelastic effect The grating
33
period in arc-induced LPGs is determined by the moving step of the translation stage
(controlled by a computer) and by some other factors such as arc intensity arc duration
time and pulling weight A schematic diagram of the fabrication setup is plotted in Fig
8
34
References
[1] A M Vengsarkar PJ Lemaire JH Judkins J Lightwave Technol 14(1) 58-65
(1996)
[2] SW James RP Tatam Meas Sci Technol 14(5) 49-61 (2003)
[3] R Falciai AG Mignani A Vannini Sens Actuators B 74(1-3) 74-77 (2001)
[4] MP DeLisa Z Zhang M Shiloach Anal Chem 72(13) 2895-2900 (2000)
[5] H J Patrick A D Kersey F Bucholtz J Light Technol 16(9) 1606-1612 (1998)
[6] A Cusano A Iadicicco P Pilla Opt Express 14(1) 19-34 (2006)
[7] A Cusano A Iadicicco P Pilla Appl Phys Lett 89(20) 2011161-3 (2006)
[8] A Cusano A Iadicicco P Pilla J Lightwave Technol 24(4) 1776-1786 (2006)
[9] A Cusano P Pilla M Giordano Advanced Photonic Structure for Biological and
Chemical Detection Ed X Fan pp 35-75 (Springer 2009)
[10] P Pilla P Foglia Manzillo V Malachovska Opt Express 17(22) 20039-20050
(2009)
[11] T Erdogan J Opt Soc Am 14(8) 1760-1773 (1997)
[12] R Kashyap Fibre Bragg Gratings (London Academic) (1999)
[13] DL Williams BJ Ainslie JR Armitage Electron Lett 29 45-47 (1993)
[14] AM Vengsarkar PJ Lemaire JB Judkins J Lightwave Technol 14 58-64
(1996)
[15] HJ Patrick CG Askins RW Mcelhanon Electron Lett 33 1167-1168 (1997)
[16] SY Lu HY Tan MS Demokan Electron Lett 35 79ndash80 (1999)
[17] SW James RP Tatam Meas Sci Technol 14 49-61 (2003)
[18] G Rego O Okhotnikov E Dianov Journal Lightwave Technology 19(10) 1574-
1579 (2001)
35
[19] A Iadicicco S Campopiano A Cutolo International Journal On Smart Sensing
And Intelligent Systems 1(2) 354-369 (2008)
36
4 Methods and Instrumentations
41 LPG reflection probes and optoelectronic set-up
Generally LPGs are interrogated in transmission configuration ie the light enters from
a side of the fiber and come out of the other side Through the manipulation of the fiber
it is possible to interrogate the LPG in reflection mode in order to transform an LPG-
based device in a more practical probe As schematically represented in Fig 1a this
requires the integration of a selective mirror at the end of the optical fiber To this aim
the optical fiber inside which the LPG is written has to be properly cut and the fiber end-
face has to be coated by a reflecting metallic layer acting as a mirror
Figure 1 a) Schematic representation of an LPG working in reflection configuration and b) of
the consequent visibility increase in its attenuation bands
A key aspect in this step relies on the identification of the precise LPG position within
the optical fiber which is of fundamental importance in order to cut the fiber just after
the grating To understand this concern it must be considered that when the metallic layer
is realized on the fiber facet light passing through the LPG is reflected back and passes
through it for the second time This means that if the optical fiber containing the LPG is
cut immediately after the grating this will be equivalent to an LPG working in
transmission configuration and having a double length which also leads to the positive
implication of an increased resonance visibility as schematically represented in Fig 1b
37
Differently if the optical fiber is not cut just after the grating but at a distance L from it
the LPG will result in the cascade of two identical LPGs spaced by a distance d=2L This
would lead to the formation of interference fringes within the attenuation bands similarly
to those observed in a MachndashZehnder interferometer as schematically illustrated in Fig
2 [1] In light of these considerations a correct identification of the LPG position inside
the optical fiber is mandatory
Figure 2 a) Schematic representation of an LPG working in reflection configuration with the
mirror integrated at a distance L from the grating and b) of the consequent interference fringes
in the attenuation bands [2]
After having identified the LPG position a high precision fiber cleaver (Fujikura CT-30
Series) is used to cut the optical fiber just after the grating followed by the integration of
an Ag reflecting layer (ie the mirror) on the terminal face of the cut optical fiber
Figure 3 Schematic of the optoelectronic set-up used for the LPG transducer
Fig 3 shows a schematic of the optoelectronic set-up used during the LPG based sensors
manufacturing and for the SRI characterization of the final device It mainly comprises
38
a broadband light source (with bandwidth 1200-1700nm) a 2x1 directional coupler and
an optical spectrum analyzer connected to a PC
42 Silver Mirror Deposition
There are different method to deposit a reflective layer on the tip of the LPG To this aim
a silver mirror reaction (Tollensrsquo test) was adopted [3] Tollensrsquo test (or Tollensrsquo reagent)
is a chemical reagent used to determine the presence of an aldehyde functional groups in
a solution A positive test with Tollens reagent is indicated by the precipitation of
elemental silver often producing a characteristic silver mirror on the inner surface of
the reaction vessel
Specifically silver nitrate (AgNO3 01M) was dissolved in aqueous solution of potassium
hydroxide (KOH 08M) the brown precipitate formed was dissolved in two drops of
ammonia (NH3 30 ww) with stirring The Ag+ ions reacted with OH- to produce a
brown precipitate of Ag2O which was dissolved in an excess of aqueous ammonia
forming [Ag(NH3)2]+ The resulting silver diamine complex was reduced in dextrose
solution (025 M) to obtain the metallic silver Successively the LPG fiber tip was dipped
into the Tollensrsquo reagent for about 35 minutes after which an uniform Ag coating formed
on the tip of the optical fiber
Figure 4 Mirror formation on the inner surface of the reaction vessel during a Tollensrsquo test
39
43 Dip-Coating Technique
In order to obtain homogeneous and defect-free layers on the optical fiber grating it was
used the dip-coating technique which provides a substrate to be immersed in a liquid
solution and then withdrawn with a well-defined extraction speed under controlled
temperature and atmospheric conditions The steps through which a thin film is deposited
onto a substrate by this technique are essentially five immersion extraction wet layer
formation drainage and solvent evaporation They are schematically reported in Fig 5
The film thickness depends upon many parameters such as the withdrawal speed the solid
content and the viscosity of the liquid If the withdrawal speed is chosen such that the
shear rates keep the system in the Newtonian regime then the coating thickness depends
upon the aforementioned parameters by the Landau-Levich equation [4]
119905ℎ = 094 (η ν)23
γLV (ρ g)16 (eq 1)
where th is the coating thickness η the solution viscosity ρ the density γLV the liquid-
vapor surface tension g the gravity and ν is the withdrawal speed
Figure 5 a) Schematic view of the deposition setup b) Dip coating process
This deposition technique is relatively simple and less time consuming compared to
electrostatic self-assembly and Langmuir-Blodgett and has been demonstrated to provide
a lower roughness of the layer which in turn determines its higher optical quality [5]
Moreover this technique can be realized with much less expensive equipment than the
40
sophisticated physical vapor deposition or chemical vapor deposition A drawback of the
technique is the not accurate control of the thickness compared to electrostatic self-
assembly or Langmuir-Blodgett techniques since it depends on too many parameters
which are not easily controlled
41
References
[1] P Pilla C Trono F Baldini Opt Lett 37 4152-4154 (2012)
[2] RP Murphy SW James RP Tatam Journal of Lightwave Technology 25 825-
829 (2007)
[3] Y Yin Z Li Z Zhong S J Mater Chem 12 522-527 (2002)
[4] LE Scriven Mater Res Soc Symp Proc 121 717-729 (1988)
[5] I Del Villar IR Matias FJ Arregui J Lightwave Technol 23 4192 (2005)
42
GAS SENSORS
43
5 GPL sensors based on a-PS coatings
51 Introduction
In the framework of the OPTOFER project ldquoInnovative Optoelectronic Technologies for
the Monitoring and Diagnostics of Railway Infrastructurerdquo (PON 03PE_00155) it has
been developed an optoelectronic device for the detection and monitoring of GPL in
railway tunnels
The present situation of the Italian railway tunnels is characterized by a remarkable
heterogeneity in term of typology building year and management (ordinary and high
speed railway network) When a tunnel is designed it is necessary an accurate study of
the possible accident scenarios as only providing for the risks it is possible to establish
an emergency plan
Besides the obvious risk associated with the derailment which can start a fire inside the
tunnel another source of danger is the accidental release of hazardous substances either
during the train travel or as a result of an accident Many of the daily transported
substances on rail track can be potentially fatal if dispersed in the environment especially
in a closed environment Examples are flammable explosive radioactive and
carcinogenic substances Gasses are among the most hazardous substances that can be
released in a gallery as they can spread rapidly can be flammable explosive andor toxic
and in the better situation can be asphyxiating
Actually GPL is the most transported hazardous substances in Italy with a frequency of
6-12 trains per day The Viareggio train derailment occurred in 2009 is an example of
the GPL transport dangerousness In this dangerous scenario it is necessary to have
sophisticated monitoring instruments which must have the following properties 1) short
response time (for an early warning) 2) on-line monitoring (in order to monitor in real
44
time the gallery status also during the disaster) 3) integrability with the preexisting
warning alarms
Optical sensing is one of the most suitable technique able to provide these features to a
sensor In this work different LPGs have been coated with atactic polystyrene in order to
develop a novel GPL sensor This polymer has been chosen for two reason
1) the chemical affinity between its hydrophobic chains and the short hydrocarbons
molecules constituting the GPL
2) the ability to quickly depositing homogeneous and defect-free films on optical
fibers making the sensor easy to manufacture
45
52 Materials and GPL sensing test set-up
521 Materials
Polystyrene is a synthetic aromatic polymer made from the monomer styrene (Fig 1)
This polymer with a higher refractive index compared to the cladding one exhibits high
sorption capacity and an improved selectivity toward low molecular weight substances
if compared to other polymers As a thermoplastic polymer polystyrene is in a solid
(glassy) state at room temperature but flows if heated above about 100 degC its glass
transition temperature
Figure 1 (left) Styrene and (right) Polystyrene chemical structure
Ordinary a-PS is one of the most common plastics in everyday life and it can be deposited
on optical fibers in the form of thin films by dip-coating from a solution The structure of
this atactic polymer is shown in Fig 2 Thin films of polystyrene are an ideal choice from
the point of view of the device optical design since they are easily deposited by dip-
coating have excellent optical quality with low losses and have a suitable high refractive
index that enables the modal transition [1-3]
Figure 2 a-PS chemical structure
46
Dip-coating technique was used to deposit thin films of a-PS (Mw = 280000 Aldrich ndash
RI = 1555 [4]) onto the grating region of different LPGs
In the framework of OPTOFER Project two different type of LPGs has been employed
commercial UV-induced LPGs (bought by OE Land Inc Canada) and arc-induced LPGs
(manufactured by the researchers of the University of Naples Parthenope) These optical
devices has been used in reflection mode and therefore a silver mirror was deposited on
the tip of the fiber The manufactured devices have been tested in presence of
butanenitrogen mixtures at different concentration butane was chosen as analyte because
is the main component of GPL together with propane
522 GPL sensing test set-up
In order to obtain the calibration curve of the manufactured devices ie the curve of the
optical shift as function of the gas concentration it is necessary to perform GPL sensing
tests with an appropriate set-up For that purpose it has been designed and purchased a
gas sensing apparatus schematized in Fig 3 and showed in Fig 4
Figure 3 (left) frontal and (right) top view of the gas sensing apparatus
47
Figure 4 Gas sensing apparatus project
Set-up is constituted of two lines and in them flows nitrogen and butane respectively In
the butane channel flows a mixture of nitrogen and butane with a 1vol of butane in
nitrogen The gas flow is tuned using Mass Flow Controller The line where flows the
butane is divided in two sub-lines the first that contains a low flow range MFC (50 sppm)
and the second that contains an high flow range MFC (500 sppm)
Using MFC it is possible to evaluate the gas concentration (expressed in ppm) which enter
in the test chamber A software has been designed and realized (in Labview) in order to
set the MFCs flows and to calculate the gas concentration on the basis of the MFCs
readings The developed software is shown in Fig 5
Figure 4 Software Control Panel
48
Through this software is possible to set the operative range of the MFCs (MFC1 MFC2
and MFC3) the starting butane concentration and the gas flows (Flux C1 C2 and C3)
In particular channel C1 is relative to nitrogen line while channels C2 and C3 are relative
to the butane lines On the right side of the panel are plotted the fluxes and the chamber
pressure as function of time On the basis of these readings the software calculates the
concentration of the output gas and plot it on the bottom-right side of the panel
49
53 Results and discussion
531 Fabrication of coated LPGs
The main manufacturing steps (summarized in the table below) refer to three main
objectives to achieve such as the realization of a reflection type LPG transducer the
realization of the coated LPG working in transition mode and the characterization and
validation of the manufactured LPG probe
Table 1 Manufacturing steps of the a-PS coated LPG
Objective Manufacturing steps
Reflection type LPG transducer - Cleaning of the LPGs surface - mirror integration at the end-face of the
cut optical fiber
Coated LPG working in transition mode
- a-PS deposition
LPG probe characterization and validation
- butane sensing characterization
The surface of the grating must be accurately cleaned to avoid that impurities (dust andor
fingerprints) can affect the homogeneity of the deposited film Because a mechanical
cleaning could damage the grating it is necessary to use a chemical etching to perform
the fiber treatment In this case a basic (ldquopiranhardquo) etching is performed A solution of
water ammonia (NH4O4) and hydrogen peroxide (H2O2) in the ratio of 311 is wormed
up to the boiling point (80 degC) The basic reaction and the boiling bubbles clean the
surface from impurities leaving the glass surface perfectly smooth and scratch free
Before the application of the piranha solution the optical fiber is dipped in chloroform
for about 30 minutes to remove the any polymeric coating traces
To obtain a reflection probe it is necessary to deposit a silver mirror on the tip of the LPG
This mirror is obtained using a Tollensrsquo reagent as reported in the previous chapter
Fig 5 shows the signal just after the cleaning step (black curve) and the signal after the
mirror deposition (red curve) It can be seen that before the mirror deposition baseline is
very low and that occurs because the light passing through the LPG is mostly transmitted
50
at the fiberair interface and only a small portion (~3-4) of it is reflected back into the
fiber as a consequence of the small refractive index contrast between the two media
Nevertheless as soon as the Ag reflecting metallic layer is formed at the fiber termination
almost all the initial power is recovered These curves refer to an arc-induced LPG with
a grating period Λ = 470μm
Figure 5 Baseline variation due to the silver mirror deposition
Figure 6 Optical micrographs of the a-PS coated fibers
As reported in table 1 the next step to the mirror formation is the sensible layer deposition
using the dip-coating technique Polymeric film is deposited starting from a solution of
a-PS in chloroform (95ww) The deposition technique employed ensures the
formation of a thin and homogenous a-PS film on the grating surface as reported in Fig
6 Comparing figs 6a and 6b it is evident that the presence of the polymeric film gives
51
an iridescent color to the fiber likely due to the homogeneity and the low thickness of the
layer
In order to obtain the highest sensibility toward the analyite LPG devices must be
properly designed There are two methods to increase the sensibility of the device
1) Inducing the modal transition phenomenon
2) Reducing the grating period Λ it is possible to excite the higher order cladding
modes in order to make them appear in the optical analysis region (1200-1700
nm) as reported in chapter 3 higher order cladding modes show higher sensitivity
to the SRI variations
To induce the modal transition phenomenon the thickness of a-PS must be tuned
accurately (as reported in chapter 3) The dip-coating technique allows this thickness
tuning process in a simple and repeatable way in fact varying the withdrawal speed or
the solution temperature it is possible to quickly change the layer thickness As reported
in Fig 7 increasing the withdraw speed (50 to 200 mmmin) increases the shift undergone
by the ith order cladding mode which is consequence of the a-PS layer thickening Fig 7
refers to an arc-induced LPG with a grating period Λ = 470μm (the same of Fig 5)
Figure 7 LPG Spectra during the a-PS deposition
52
According simulation in Fig 8 the a-PS layer thickness with a withdrawn speed of 100
mmmin is ~280-300 nm It is noteworthy that using a too high withdrawn speed (200
mmmin) the layer becomes too thick and the device exceed the transition region this
effect is evident in the cyan curve where the shift is so high that the 7th cladding mode
appears in the optical analysis region (black arrow)
Figure 8 Simulation of the wavelength shift (Δλ) as function of coating thickness (a-PS
refractive index = 1555)
The reduction of the grating period is another efficient method to increase the sensibility
of the LPG device Fig 9 shows two a-PS coated LPGs with different grating periods ie
630μm (Fig 9a) and 470μm (Fig 9b) The device with a grating period of 630μm shows
a 12nm blue shift of the 4th order cladding mode instead the total shift undergone by the
6th order cladding mode in the LPG with Λ=470μm is 40nm This implies that to obtain
a more sensible device it is preferable to use LPGs with grating period of 470μm
Figure 9 Shifts undergone by LPGs with different grating period Λ with the same a-PS coating
thickness a) Λ = 630μm and b) 470μm blue and red curves are relative to the signal before and
after the a-PS deposition respectively
53
Results have shown that to obtain an LPG probe with high sensibility toward butane it is
necessary
1) To work in transition mode with dip-coating technique using a withdrawn speed
of 100 mmmin it is possible to obtain a ~300 nm thick a-PS layer this thickness
allows to work in transition mode with the employed LPG
2) To use LPGs with shorter grating period reducing Λ up to 470μm it is possible to
move the 6th order cladding mode inside the this cladding mode is extremely more
sensitive to the SRI variation compared to the 4th order cladding mode excited in
the LPG with Λ=630μm
Figure 10 Shift undergone by the commercial LPG after the a-PS deposition blue and red
curves are relative to the signal before and after the a-PS deposition respectively
Also commercial UV-induced LPG has been coated with an a-PS layer The total shift
due to the presence of the polymeric coating is shown in Fig 10 It is evident that the shift
is comparable to that undergone by the arc-induced LPG with Λ=470μm
532 Butane Sensing Characterization
The manufactured fibers have been tested in presence of butane to evaluate the sensitivity
toward this gas
Preliminary tests have been carried out without a gas concentration control in order to
verify the maximum shift undergone by the device in presence of the analyte Fig 11
shows the shift undergone by the 6th order cladding mode (in an arc-induced LPG with
54
Λ=470μm and a-PS thickness of about 300nm) in presence of butane vapors The curve
behavior indicates an absorptiondesorption trend with a response time of about 4 mins
After exposition to air the total shift come back to zero indicating device reversibility
Figure 11 Butane sensor behavior of the a-PS coated device (arc-induced LPG with Λ=470μm
and a-PS thickness of about 300nm)
Test has been conducted using a three-necked flask filled with two spray of commercial
butane the fiber is placed in one of the necks and the flask is filled with two sprays of
commercial butane after the spraying the system is closed in order to evaluate the
response at a constant gas concentration Butane has removed from the flask by a fan
The same test is performed on a couple of UV-induced LPG coated with a-PS as reported
in Fig 12 It is evident that the maximum response is of the same order of magnitude as
the device in Fig 11 During this test temperature has been monitored with a FBG
Moreover a bare LPG has been employed to verify the response of the device without
the sensible coating results show that the butane devices sensitivity is entirely due to the
a-PS coating as bare LPG response is not affected by the gas presence
The difference in response value between these two devices (~1nm) could be attributable
to minimum difference in a-PS thickness in fact because the devices operate in the
55
transition region (maximum sensitivity region) minor variations in the coating thickness
can cause large variation of the gas sensing response Also in this case there is an
absorptiondesorption trend with response time similar to that of the device in Fig 11
Figure 12 Butane sensor behavior of two a-PS coated devices (UV-induced LPG with a-PS
thickness of about 300nm)
Because arc-induced and UV-induced LPG show essentially the same gas sensing
behavior (Figs 11 and 12) next tests have been performed only on the UV-induced LPG
this choice is due both to the lower optical losses after the layer deposition and to the
more uniformity of the UV-induced LPG optical spectrum
Other tests has been done to evaluate the instantaneous sensor response toward butane in
an open environment goal of these tests is to study the device response in a real situation
(GPL leak after the train transit) where the gas run over the fiber and then expand in the
surrounding environment moving away from the device To perform this test the set-up
in Fig 13 was employed It consisting of an aluminum package used to bear and protect
the devices on which is sprayed butane with the help of a syringe The latter is employed
because if the gas is sprayed directly with the spray can the nebulized butane drops could
condense onto the probes polluting it
56
Figure 13 a) Butane transfer in the syringe b) butane spraying on the device packaging c)
package without protective cover
Results of this test are shown in Fig 14 As it is evident the under examination device
(UV-induced LPG coated with 300nm thick a-PS) undergoes an initial shift of about
07nm which gradually reduces over the time following the desorption material kinetic
It is noteworthy that such kinetic results slower compared to those obtained in Figs 11
and 12 This effect is attributable to the fact that here the gas removal is spontaneous
contrarily to the previous tests in which butane was removed using the convective motion
of a fan
Figure 14 Butane sensor behavior of a-PS coated device (UV-induced LPG with a-PS thickness
of about 300nm)
57
In all performed tests the gas concentration was not known but to obtain a calibration
curve it is necessary to study the relationship between gas concentration and consequent
signal shift Calibration curve (Fig 15) of the selected device has been obtained using the
GPL sensing test set-up previously described The curve is not linear but rather it has a
polynomial behavior
Figure 15 Shift as function of gas concentration (Calibration curve) for the a-PS coated device
(UV-induced LPG with a-PS thickness of about 300nm)
In order to completely characterize the developed GPL sensor its humidity and
temperature sensibilities have been evaluated As reported in fig 16a the device results
sensible to temperature this behavior is not attributable to the material but to the intrinsic
sensibility to temperature of the employed transducer Despite the hydrophobicity of the
a-PS film the sensor results sensible to the humidity over 70 RH probably because the
water condensation on the polymer surface instead up to 70 RH the device is
completely insensible to the vapor presence
As required by the OPTOFER Project the sensor has been installed under the railway
tunnel near the Porta Rufina station (in Benevento) Fig 17 shows the picture of the GPL
sensor package installed under the tunnel
58
Figure 16 Temperature and humidity for the a-PS coated device (UV-induced LPG with a-PS
thickness of about 300nm)
Figure 17 GPL sensor package installed under the railway tunnel near Porta Rufina Station
(BN) package without (left) and with (right) the protection cover
After the installation the device has been tested in presence of GPL the gas was sprayed
directly on the package in order to simulate a real condition of accidentally GPL leak
during rail transport The measured output signal is the shift of the analyzed LPG peak as
function of time but the PC connected to the transducer convert this signal in GPL
concentration (in ppm) thanks to the calibration curve previously obtained Fig 18
reports the results of the performed tests
59
Figure 18 (left) Shift as function of time for the sensor during the test and (right) consequent
concentration calculated by the connected PC using the calibration curve
60
References
[1] A Cusano A Iadicicco P Pilla Opt Express 14(1) 19-34 (2006)
[2] A Cusano A Iadicicco P Pilla Appl Phys Lett 89(20) 2011161-3 (2006)
[3] A Cusano P Pilla M Giordano Advanced Photonic Structure for Biological and
Chemical Detection Ed X Fan pp 35-75 (Springer 2009)
[4] P Pilla C Trono F Baldini Opt Lett 37 4152-4154 (2012)
61
6 Humidity sensors based on TiO2 coatings
61 Introduction
Collaboration agreement with CERN (Conseil Europeacuteen pour la Recherche Nucleacuteaire -
European Organization for Nuclear Research) named ldquoRelative humidity fiber optic
sensors based on Long Period Gratingsrdquo led to the development of optoelectronic
humidity sensors working in cryogenic environment
The Compact Muon Solenoid (CMS) is one of the two large general-purpose particle
detectors built on the Large Hadron Collider accelerator running at the European CERN
in Geneva Its innermost detector immersed in a 4 Tesla magnetic field is a particle
tracker where silicon pixel and microstrip sensors measure the momentum and trajectory
of particles emerging from the LHC collisions In order to reduce the radiation-induced
loss of the sensors the subdetectors are cooled at minus20degC∕minus25degC To avoid water
condensation and ice formation the volume needs to be kept sealed and dry A distributed
thermal and hygrometric monitoring of the air is however required in the external area
surrounding the tracker where cold services are distributed in complex geometries and a
safe control of the environmental parameters is more difficult In addition each tracking
detector needs to be as much as possible transparent to particles requiring mass
minimization of the devices to be installed in situ radiation resistance from 1 to 100 Mrad
doses and magnetic field insensitivity All the commercial miniaturized RH sensors used
by CMS are capacitive multiwired and not designed with radiation hard characteristics
[1] On the other hand fiber optic sensors are able to provide many attractive features that
overcome the electrical sensors limitations In addition modern fabrication technologies
allow us to obtain fibers tolerating high radiations levels [2] and this promoted renewed
interest in their use in high-energy physics environments
62
During this collaboration titanium dioxide (TiO2) has been used as a sensitive element
for the development of high-sensitivity LPG based humidity sensors due to its high RI
(n = 196) [3] and hygrosensitive characteristics [4 5] Furthermore the use of an oxide
is expected to avoid the typical aging problems characteristic of polymeric overlays
63
62 Materials and climatic chamber
Titanium dioxide (or titania) with formula TiO2 exists at room temperature in three forms
rutile anatase and brookite each of which occurs naturally Rutile is the only stable phase
of coarse-grained titania whereas anatase and brookite are metastable at all temperatures
and convert to rutile when heated The rutile structure is based on a slightly distorted
hexagonal close packed (hcp) of oxygen atoms with half the octahedral interstices being
occupied by titanium atoms The tridimensional structure can be seen in Fig 1
Figure 1 Titanium oxide TiO2 a) sample in powder form b) 3D crystal structure
Titanium oxide thin film is one of the most commonly used materials for optical thin
films due to its good durability and high transmittance in the visible spectral region It is
commonly used as high index layer to achieve the high‐low index contrast for multiple
layer interference films [6] Thin film properties including refractive index are very
much dependent on film structure that is controllable by the deposition method and
parameters fixing the operational wavelength
The sol-gel dip coating method has been selected for the integration of nanoscale TiO2
layers onto the LPG surface mainly due to its ability to guarantee a good optical quality
a ring-shaped symmetry and an adequate longitudinal uniformity over the grating length
For TiO2 sol preparation titanium (IV) isopropoxide (Ti(OR)4) has been used as titania
precursor it needs a solvent and a reaction activator when the reaction activator is mixed
to the precursor the reaction starts and the oxide is obtained Several dilutions of titania
precursor in ethanol have been experimented in order to obtain a layer as smooth and
64
homogeneous as possible The activator also plays a key role different solutions
involving different activators (water or acid) have been prepared to get an appropriate
(and optimized) procedure During this collaboration UV-induced LPGs were bought by
OE Land Inc a company based in Quegravebec (Canada) that is one of the leader in the
manufacturing of fiber gratings devices These optical devices has been used in reflection
mode and therefore a silver mirror was deposited on the tip of the fiber
Figure 2 Schematic representation of the experimental setup used for LPG sensor
characterization
The experimental tests have been performed in a climatic chamber (Angelantoni
Challenge 1200) Temperature and relative humidity can be controlled using the front
panel buttons with an uncertainty of +- 01 degC and +- 1 respectively A chamber
internal temperature of 25 degC has been fixed for measurements The LPG sample is placed
inside the climatic chamber letting the fiber patch-cord coming out from the front door
(see Fig 2)
65
63 Results and discussion
631 Sol-Gel Process Optimization
Different sols has been prepared In the following the experimented solutions are listed
The first solution (here indicated as P1t) 6 ml of ethanol 252 ml of Ti(OR)4 and vapours
of hydrochloric acid (HCl)
The second solution (P2t) 585 ml of ethanol 252 ml di Ti(OR)4 and 015 ml of
bidistilled water (H2O) When the water is added in the container some precipitations
appear (Fig 3) thus meaning that this solution is not useful for sol-gel depositions
Figure 3 Sol-gel solutions with precipitation (P2t)
The third solution (here indicated as P3t) 585 ml of ethanol 005 ml of bidistilled water
252 ml of Ti(OR)4 and vapours of hydrochloric acid
The fourth solution (P4t) 585 ml of ethanol 005 ml of hydrochloric acid and 252 ml
of Ti(OR)4
The fifth solution (P5t) 225 ml of ethanol 005 ml of hydrochloric acid and 625 ml of
Ti(OR)4
The sixth solution (P6t) 907 ml of ethanol 00765 ml of bidistilled water and 385 ml of
Ti(OR)4
A reaction time of 12 hours has been waited before using the prepared solutions for the
deposition procedure Preliminary deposition has been performed on glass planar
substrates in order to evaluate the solution that provide the best titania films in term of
homogeneity and uniformity
66
A quality analysis of the deposited layers is obtained by an optical microscope inspection
of the films For each of the prepared solutions a table is reported in the first column a
schematic picture of the deposited substrate is shown on which the observed area (red
square) is highlighted second column contains the film pictures respectively In the third
column the magnification zoom of the microscope is indicated Finally in the fourth
column it is specified the solution used for the deposition
Table 1 Microscope images of a titania layer deposited on a planar glass substrate using the
solution P1t (Black circular shadows are due to impurities on microscope lenses)
Selected area Micrograph Zoom Solution
5X P1t
5X P1t
20X P1t
5X P1t
5X P1t
67
The TiO2 deposition results on planar glass substrates using the solution P1t are shown in
Table 1 As can be seen the deposited films show a cracked surface with isolated
domains The various colors are due to the different thicknesses of the domains From
these results it is possible to conclude that the P1t solution does not result in high quality
film especially in terms of homogeneity and uniformity
Table 2 Microscope images of a titania layer deposited on a planar glass substrate using the
solution P3t (Black circular shadows are due to impurities on microscope lenses)
Selected area Micrograph Zoom Solution
5X P3t
5X P3t
20X P3t
5X P3t
5X P3t
68
The TiO2 deposition results on planar glass substrates using the solution P3t are shown in
Table 2 Also in this case the deposited films show a cracked surface It is evident that
films deposited from P3t solution result in bad quality layers and thus cannot be
employed for deposition on LPGs
The TiO2 deposition results on planar glass substrates using the solution P4t are shown in
Table 3
Table 3 Microscope images of a titania layer deposited on a planar glass substrate using the
solution P4t (Black circular shadows are due to impurities on microscope lenses)
Selected area Micrograph Zoom Solution
5X P4t
5X P4t
20X P4t
5X P4t
5X P4t
69
The deposited film shows a slightly cracked surface with small domains The quite good
uniformity of the layer is shown by the pinkish homogeneous color of the whole surface
From these results we can therefore conclude that the P4t solution can be effectively used
for obtaining high quality layers
The TiO2 deposition results on planar glass substrates using the solution P5t are shown in
Table 4
Table 4 Microscope images of a titania layer deposited on a planar glass substrate using the
solution P5t (Black circular shadows are due to impurities on microscope lenses)
Selected area Micrograph Zoom Solution
5X P5t
5X P5t
20X P5t
5X P5t
5X P5t
70
When using the P5t solution the deposited film results to be discontinuous with large
void areas These results exclude the P5t from the possible solutions for dip-coating
deposition
Similar (bad) results were also obtained in the case of P6t solution (see Table 5) that led
to a cracked surface with small domains
Table 5 Microscope images of a titania layer deposited on a planar glass substrate using the
solution P6t (Black circular shadows are due to impurities on microscope lenses)
Selected area Micrograph Zoom Solution
5X P6t
5X P6t
20X P6t
5X P6t
By resuming the results previously shown it is possible to state that on planar substrates
the best titania layers in terms of homogeneity uniformity and dimensions of cracks
were obtained using the solution P4t
71
Another aspect that was considered is the reaction time of the sol During sol-gel process
the oxide precursor is hydrolyzed and then the hydroxide molecules react forming oxide
macromolecules If the reaction time is brief the resultant macromolecules are short
reducing the mechanical properties of the relative wet film Conversely it is possible the
formation coalescence and consequent precipitation of oxide particles if the reaction
time are too long that induces the formation of layers of particles which do not result
very homogeneous
To obtain the optimized reaction time 3 glass substrate have been coated with a P4t sol
deposition has been performed after exactly 3 time interval 1hour 1 day and 7 days
Table 6 shows the samples micrographs It is evident that the sample coated with 7 day
after the sol synthesis results inhomogeneous due to the particles that constitute it
Table 6 Microscope images of a titania layer deposited on planar glass substrate at different
reaction times
Selected area Micrograph Sol Reaction time
1 hour
1 day
7 days
72
The other samples are instead homogeneous and defect free For this reason TiO2 sol
has been deposited on the lateral surface of an optical fiber results (Fig 4) shows the
comparison between the fiber coated after 1 hour from the sol synthesis and the fiber
coated after a day The first shows large fracture due to the shrinkage during the drying
process making it unusable as LPG coating The last is instead very homogeneous and
consequently the optimized reaction time is 24 hours
Figure 4 P4t sol deposited on optical fibers with different reaction time a) 1 hour and b) 24
hours
632 Fabrication of coated LPGs
Established that the best titania layer has been obtained using the P4t sol it is possible to
precede to the LPG manufacturing The main manufacturing steps (summarized in the
table below) refer to three main objectives to achieve such as the realization of a
reflection type LPG transducer the realization of the coated LPG working in transition
mode and the characterization and validation of the manufactured LPG probe
Table 7 Manufacturing steps of the titania coated LPG
Objective Manufacturing steps
Reflection type LPG transducer - Cleaning of the LPGs surface - mirror integration at the end-face of the
cut optical fiber
Coated LPG working in transition mode
- titania deposition
LPG probe characterization and validation
- humidity sensing characterization
The surface of the grating must be accurately cleaned to avoid that impurities (dust andor
fingerprints) can affect the homogeneity of the deposited film Because a mechanical
cleaning could damage the grating it is necessary to use a chemical etching to perform
73
the fiber treatment In this case a basic (ldquopiranhardquo) etching is performed A solution of
water ammonia (NH4O4) and hydrogen peroxide (H2O2) in the ratio of 311 is wormed
up to the boiling point (80 degC) The basic reaction and the boiling bubbles clean the
surface from impurities leaving the glass surface perfectly smooth and scratch free
Before the application of the piranha solution the optical fiber is dipped in chloroform
for about 30 minutes to remove the any polymeric coating traces
As done for the GPL sensors also in the case of humidity sensor it is necessary to work
in reflection mode For this purpose tollensrsquo reactant was employed to deposit the silver
mirror on the tip of the LPG Fig5 reports the increase in optical transmission signal after
the mirror deposition
Figure 5 Baseline variation due to the silver mirror deposition
After the silver deposition LPGs has been coated with titania layer As previously stated
this inorganic material was deposited using the dip-coating technique The solution
selected for the integration of TiO2 layers with optical fiber substrates (P4t) has been used
for the integration of TiO2 overlays on the LPGs (Fig 6) In this case it can be seen that
74
the obtained TiO2 layer is homogeneous and only few imperfections are visible along the
fiber This result thus confirms the capability of the solution P4t of producing films with
good optical quality and high uniformity as already observed also in the case of glass
planar substrates
Figure 6 Microscope image of a titania layer deposited on the optical fiber using the solution
P4t
To work in transition mode multiple depositions are performed in order to get thicker
final layers (of approximately 100 nm) since TiO2 layers result very thin In case of
multilayer depositions a thermal annealing (10 mins 150degC) between the deposition of
two consecutive layers has been proposed
Table 8 Microscope images of 6 titania layers deposited on two LPGs and shift undergone by
the device after deposition
Sample Zoom Micrographs Shift
LPG1
5x
20x
LPG2
5x
20x
75
As starting point two UV-Induced LPGs have been coated with 6 layers of titania
Table 8 contains the micrographs of the coated fibers and the shift undergone by the
device after the 6 layers deposition It is evident that the number of layer deposited does
not affect the homogeneity of the film being it as smooth as that obtained with only on
layer (Fig 6)
However it is noteworthy that the shift undergone by the fibers is very low (only 2-3 nm
after 6 TiO2 layers) This result could be attributable to the thermal annealing between
the deposition of two consecutive layers the high temperature of the annealing process
(150degC) can increase the hydrophobicity of the deposited layer making the deposition of
the next layer harder (being the titania sol an alcoholic solution) The change in
hydrophobicity could be attributable to chemical andor morphological transformation
undergone by the titania layer after the increase in temperature
Figure 7 Contact angle goniometer
To verify this hypothesis a contact angle test has been performed using a contact angle
goniometer (Fig 7) Titania was deposited on two glass planar substrates but only one of
these samples has been thermal annealed 150degC Comparison between the contact
angles of these two layers is shown in Fig 8 It is evident that the sample without
temperature annealing shows high hydrophilicity with a contact angle significantly lower
76
than 90deg (contact angle = 136deg) on the other hand annealed titania is characterized by a
hydrophobic behavior with a contact angle higher than 90deg (contact angle = 1312deg)
Figure 8 Contact angle of the titania layers a) without and b) with annealing 150degC for 10
mins
On the basis of this observation the procedure to manufacture the humidity sensors is
changed removing the annealing process between consecutive layer depositions and
replacing it with a drying cycle performed in oven for 10 mins at room temperature under
vacuum vacuum allows to dry the titania film without chemical and morphological
transformations that can affect the layer hydrophilicity
The final manufacturing scheme is shown in Fig 9 Higher is the thickness needed to
operate in transition mode higher is the value of N
Figure 9 Humidity sensor manufacturing procedure
77
Using this procedure an LPG based device has been manufactured In fig 10 is shown
the LPG spectrum during the deposition of titania it is evident that with 12 layers (12
dips) there is a remarkable change in the shape of the curve with a shift of the 6th order
cladding mode of about 37nm Simulations estimate a TiO2 thickness of about 88nm
associated to this shift
Figure 10 LPG optical spectrum during TiO2 deposition
Figure 11 LPG optical spectrum during TiO2 deposition zoom in the region 1460-1630 nm
78
Fig 11 shows a zoom of the optical region that contains the 6th order cladding mode
(1460-1630 nm) The loss in depth of the attenuation band is ~75dB
633 Preliminary humidity characterization
In this section are reported the first experimental results of a preliminary RH test carried
out using the realized LPG sensor coated with a 12 layer TiO2 overlay (with thickness of
approximately 88nm) Information about its performances in detecting RH changes in the
range 10-80 RH at 25degC (Fig 12) is detailed in the following
Figure 12 Settings of the climate chamber
Figure 13 shows the typical spectral variations of the TiO2-coated LPG sensor during a
characterization test carried out at 25degC As theoretically expected increasing the
humidity content inside the test chamber causes a blueshift the 6th order cladding mode
This is due to the TiO2 coating RI increase caused by the higher amount of adsorbed water
molecules which in turn leads to an increase of n0ieffcl The loss in depth of the attenuation
band is ~1dB
In Fig 13 it is plot the time variation of the barycentral wavelength of the resonance dip
occurred upon RH changes within the chamber from 10 to 80 with 20 steps
79
Figure 13 Transmittance spectra of LPG1 acquired at different RH values
Figure 13 Time evolution of central and barycentral wavelengths variation occurred for
different RH values for TiO2 sample
As can be noted the response time of the sensor to a humidity variation is related to the
setting time of the chamber Thin TiO2 layers on the LPG results in an instantaneous
response of the sensor to humidity variations Each RH step is kept for several minutes
and the small variations illustrated in Figure 13 are related to humidity control of the
chamber and cannot be attributed to LPG sensor instability In Table 9 the relative
wavelength shift for each RH step is resumed
Table 9 Microscope images of 6 titania layers deposited
RH Step |Δλ| [pm]
20-40 1840
40-60 1240
60-80 1090
80
The barycentral wavelength variations of the resonance dip versus the RH values are
plotted in Figure 14 It is evident that the wavelength shift is higher for lower RH values
from RH=20 to RH=40 the shift is about 1840 pm while from RH=60 to RH=80
the shift is 1090 pm
Figure 14 Barycentral wavelength variations of the resonance dip versus the RH values during
two different tests (1deg and 2deg)
81
References
[1] M Fossa P Petagna ldquoUse and calibration of capacitive RH sensors for hygrometric
control of the CMS trackerrdquo CMS Note 200324 (2003)
[2] A Cusano A Cutolo J Albert Fiber Bragg Grating Sensors Recent Advancements
Industrial Applications and Market Exploitation Ed Bentham Science pp 218-237
(2011)
[3] E Davies R Viitala M Salomaumlki J Opt A Pure Appl Opt 11 015501 (2009)
[4] G Montesperelli A Pumo E Traversa Sens Actuators B 25 705 (1995)
[5] B C Yadav N K Pandey A K Srivastava Meas Sci Technol 18 260 (2007)
[6] H Xie XT Zeng WK Yeo Temperature dependent properties of titanium oxide
thin films by spectroscopic ellipsometry SIMTech technical reports vol 9 (2008)
82
B IOSENSORS
83
7 Drug resistant bacteria biosensor based on a-
PSPMMA coatings
71 Introduction
This work deals with the development of advanced optical biosensors able to perform a
rapid detection of drug resistant bacteria carried out within the FP7 European project
Multianalyte automatic system for the detection of drug resistant bacteria -
OPTObacteria[1] Resistance to infecting microorganism represents a key threat to
human health and cause high human and socio-economic burden Among the largest
diffused infections β-lactamases expressing pathogens methicillin-resistant
Staphylococcus aureus and gram-negative hospital opportunistic pathogens are among
the most aggressive ones In particular Extended-spectrum BL have emerged as an
important mechanism of resistance in Gram-negative bacteria Delay in appropriate
therapy for infections with ESBL producers not only prolongs hospital stay but is
associated with increased mortality Methods currently known for detecting ESBLs are
expensive and generally used to only test pre-screened individuals In addition 24-48
hours are typically needed before having a resistance profile thus meaning that they
cannot be used to obtain rapid results which would allow infection control measures to
be implemented at the earliest possible opportunity [2]
Highly sensitive optical probes able to detect unlabeled biomolecules are of great interest
in this concerns as they would enable a true real-time (and in situ) screening with minimal
sample consumption and treatment Among all LPGs are the most promising fiber optic
refractive index (RI) transducers to be employed for unlabeled biochemical assays [3]
The number of biosensing applications exploiting different designs of LPGs is rapidly
growing and they are expected to become a key technology in next few years [4-6] A
strong impulse to this growth was recently given by the integration on the LPG surface
84
of nano-scale polymer overlays and by the discovery of the modal transition phenomenon
As previously stated it is well known that the SRI sensitivity of LPGs can be optimized
at the desired working point through the deposition of a high RI (HRI) layer by acting on
its thickness (ranging in hundreds of nanometers) Shifts of the spectral features as high
as thousands of nanometers for a unitary change of SRI can be easily obtained thus
making HRI-coated LPGs very much exploited for chemical and biomolecular sensing
applications [7] However essential condition to fully exploit the benefits of transition
mode LPGs is that the attenuation bands would not loose visibility while working in
transition mode This is not verified for some materials and related deposition techniques
[8-9] and it is achieved only when high optical quality overlays (low absorption and
roughness) are used Up to now the best results have been obtained with thin polymer
layers deposited by dip-coating in particular with ordinary a-PS [7] It is worth pointing
out that the quality of a biosensing system not solely relies on the sensitivity of the
transducer (the a-PS coated LPG) but also involves its interfacial properties where
suitable bioactive species (ie the bioreceptors) are immobilized providing the final
sensitivity and specificity to the target molecules
In the framework of OPTOBACTERIA Project due to the difficulty to directly
biofunctionalize the a-PS overlay it has been used a recently proposed multilayer strategy
[10] where the a-PS overlay serves to tune the working point of the device in the
transition region while a second thinner overlay of poly(methyl methacrylate-co-
methacrylic acid) (PMMA-co-MA) provides the desired interfacial properties for a stable
bioreceptor immobilization The LPG biosensors manufacturing is reported from the
realization of the reflection type LPG transducer working in transition mode to the
biochemical functionalization of its surface Finally preliminary experimental results
revealing the biosensor capability to successfully detect the binding of a specific BL
(AmpC) are also reported
85
72 Materials and SRI characterization
As previously stated using a multilayer approach for the coating of the LPG allow to
independently tune the working point in transition region and achieve an efficient surface
functionalization without incurring the problem of the attenuation bands fading In
particular a-PS is a primary HRI coating which tunes the working point of the device in
transition region A secondary very thin layer of PMMA-co-MA whose refractive index
is 149 was then deposited to provide a caroboxyl-containing surface minimizing at the
same time its impact on the optical design of the device
A-PS and PMMA (see Fig 1) are probably the most exploited polymers for optical
waveguide fabrication so far [11 12] They are inexpensive easily processable and highly
transparent
Figure 1 PMMA chemical structure
It should be possible to use only a thick PMMA layer (without using a-PS layer) to
achieve the maximum sensitivity and the desired functionality of the interface but there
are different drawbacks that does not allow to use this approach First of all although the
PMMA-co-MA has a slightly higher RI than the cladding that enables the modal transition
phenomenon nonetheless it has a much lower RI than PS This would result both in a
thicker overlay (approx 27 times thicker than a single a-PS overlay) to tune the LPG in
the transition region and in a less steep transition region (peak sensitivity approx 23
times lower than with a single a-PS overlay) as determined from a numerical analysis
based on the theory reported in [13] Moreover thicker overlays to be deposited require
high density solutions (up to 20 by weight of PMMA-co-MA) which can be difficult to
86
prepare In addition PMMA-co-MA absorbs a small amount of water which anyway can
cause a considerable change of the optical properties of the polymer
In light of these considerations it is convenient to use a double-layer approach and
minimize the thickness of the outer PMMA-co-MA layer
UV-induced LPGs have been used in the framework of this project three different grating
periods (350μm 370μm and 390μm) were employed to study its effect on the sensitivity
of the final device
The SRI characterization was performed by submerging the realized LPG transducer into
aqueous glycerol solutions characterized by different refractive index in the range 1335-
146 The refractive index of each solution was measured by means of an Abbe
refractometer working at 589 nm
87
73 Results and discussion
731 Fabrication of multilayer coated LPG reflection probes working
in transition mode
In order to obtain the multilayer coated LPG ready to the next step ie the biochemical
functionalization a specific procedure has to be performed As done in the previous
chapter the main manufacturing steps are summarized in the table below
Table 1 Manufacturing steps of the multilayer coated LPG transducers prototypes
Objective Manufacturing steps
Reflection type LPG transducer - mirror integration at the end-face of
the cut optical fiber
Multilayer coated LPG working in transition mode
- a-PS layer deposition - PMMA-co-MA layer deposition
LPG probe characterization and validation
- SRI characterization - prototype acceptance
After the deposition of silver mirror on the tip of the LPG the optical fiber has been
coated with an a-PS layer For the deposition of the ordinary a-PS film (RI=1555) the
fiber containing the LPG was first immersed into a PS solution and successively
withdrawn with a well-controlled speed The extraction step was 100 mmmin Before the
deposition the LPG was thoroughly cleaned in boiling chloroform Deposition solution
was 95 (ww) of PS in chloroform
Figure 2 Optical microscopy images of a double-layer coated optical fiber Clock wise bare PS
(pink) transition from PS to PMMA-co-MA on PS central zone with the double layer of
PMMA-co-MA on PS (violet)
88
The PS coated LPG was subsequently dip-coated into a solution 10 (ww) PMMA-co-
MA (Mw = 34000 - Aldrich) in chloroformisopropanol (13 vv) for the formation of
the secondary very thin layer of PMMSA-co-MA Considering the relatively small
amount (16) of methacrylic acid in this PMMA co-polymer we assume its RI to be the
same as the homopolymer ie 149
In Fig 2 are reported some typical optical microscopy images of an optical fiber coated
with the polymer double-layer in different positions along the fiber axis The pictures
reveal smooth and homogenous layers Since a-PS and PMMA-co-MA are transparent
polymers the apparent colors are due to interference of the light reflected back from the
different interfaces
It is important at this point to highlight that the deposition of a second layer by DC implies
the need for a solventnonsolvent strategy In other words the second layer should be
deposited from a solution whose solvents would not damage the underlying layer One
important difficulty to consider in this system is that a-PS is an highly hydrophobic
polymer while PMMA-co-MA has an hydrophilic nature therefore the use of solvents
with a higher polarity with respect to chloroform could prevent the good adhesion of the
secondary layer and cause its slipping as well as de-wetting defects as it was
experimentally verified in the case of acetone acetic acid ethanolwater (11 vv)
MEKisopropanol (11) The problem was solved by using a mixture of solvents
containing a small amount of a mutual solvent for both polymers in our case chloroform
and a major part of mutual nonsolvent in our case isopropanol in a volumetric ratio 13
In this way the integrity of the first layer was preserved and good adhesion and
uniformity of the secondary layer was ensured
Once the realized LPG transducer has been realized and characterized the final step
before the prototype acceptance relies on the comparison between expected (ie from
simulations) and experimental performances in terms of SRI sensitivity at an SRI=134
89
(because biological measurements will be conducted in a PH7 aqueous solution which is
characterized by a refractive index ~134) In the following paragraph it is reported the
results obtained for the manufacturing of the first three prototypes carried out by using
LPG 1 LPG 2 and LPG 3 (Λ = 350μm 370μm and 390μm respectively)
Prototype 1 Manufacturing characterization and validation
In this paragraphs the manufacturing characterization and functional validation of
Prototype 1 has been reported According simulations for this device to work in transition
region the a-PS layer thickness must be 280 nm enabling to reach a sensitivity as high as
1738nmRIU
The first manufacturing step relies on the realization of the reflection type LPG To this
aim in Fig 3 is shown the spectra in air of LPG 1 acquired just before the optical fiber
cut (ie in transmission configuration) just after the optical fiber cut (ie in reflectance
configuration before the mirror formation) and after the mirror integration at the end of
the cut fiber (with Tollensrsquo reactant)
Figure 3 Experimental spectra acquired in air for LPG 1 before the optical fiber cut (ie in
transmission configuration) just after the optical fiber cut (ie in reflectance configuration
before the mirror formation) and after the mirror integration at the fiber termination
90
It can be seen that after the optical fiber cut a strong baseline reduction occurs
Nevertheless as soon as the Ag mirror is formed at the fiber termination almost all the
initial power is recovered
The prototype manufacturing continued with the double layer (a-PS and PMMA-co-MA)
deposition onto the LPG surface Figure 4 shows the spectral position of the attenuation
band related to the 6th order cladding mode for the bare LPG and for the a-PS coated
device (both in reflection configuration) In particular the resulting overlay thickness after
DC from the 95 a-PS solution was ~260 nm while the secondary layer obtained from
the 10 PMMA-co-MA solution was estimated to be ~30 nm as inferred by numerical
simulations carried out by means of the developed virtual environment
As previously described when an HRI overlay is deposited onto the grating the effective
RI of the cladding modes is increased therefore the central wavelengths of the attenuation
bands experience a blue shift which for the 6th order cladding mode in Fig 4 was about
138 nm The second layer of PMMA-co-MA produced a cumulative effect of 42 nm on
the attenuation band shift The goodness of the deposition process is also testified by the
subsistence of the attenuation band visibility In fact a secondary layer with defects would
have determined a dramatic decrease of the attenuation bands depth due to scattering
losses [14]
Figure 4 Effect of the a-PS and PMMA-co-MA overlays deposition on the sixth order cladding
mode attenuation band of LPG 1
91
The spectral characterization to SRI changes obtained with Prototype 1 is reported in Fig
5a in terms of central wavelengths of the attenuation bands position It refers to the sixth
order cladding mode Experimental data were fitted with a Lorentzian-Cumulative
function The resonance-shaped sensitivity characteristic of the coated device is reported
in Fig 5b as extrapolated from the experimental results
In particular it can be seen that the SRI sensitivity in correspondence of an SRI=134
turned out to be ~1918nmRIU This experimental value resulted slightly higher than the
expected one (1738nmRIU) this is probably due to the slight differences between
numerical and experimental values of the refractive indexes of the a-PS and PMMA-co-
MA layer as well as of the glycerol solution used for the SRI sensitivity characteristic
However the realized prototypes was clearly accepted as it performs even better than the
designed device
Figure 5 a) SRI characterization in terms of attenuation bands minima position for the 6th order
cladding mode b) SRI sensitivity (|partλrespartSRI|) of the sixth order cladding modes extrapolated
from data reported in (a)
Prototype 2 Manufacturing characterization and validation
In this paragraphs the manufacturing characterization and functional validation of
Prototype 2 has been reported According simulations for this device to work in transition
region the a-PS layer thickness must be 270 nm enabling to reach a sensitivity as high as
1304 nmRIU The spectra in air of LPG 2 acquired before the optical fiber cut after the
optical fiber cut (ie in reflectance configuration before the mirror formation) and after
the mirror integration are reported in Fig 6
92
Figure 6 Experimental spectra acquired in air for LPG 2 before the optical fiber cut (ie in
transmission configuration) just after the optical fiber cut (ie in reflectance configuration
before the mirror formation) and after the mirror integration at the fiber termination
Also in this case a strong baseline reduction is observed when cutting the fiber containing
the LPG 2 which is almost recovered after the integration of the Ag reflecting metallic
layer
Figure 7 Effect of the a-PS and PMMA-co-MA overlays deposition on the 5th order cladding
mode attenuation band of LPG 2
Figure 7 shows the spectral position of the attenuation band related to the fifth order
cladding mode for the bare LPG and for the a-PS coated device The resulting overlay
thickness after DC from the PS solution was estimated to be ~270 nm while the secondary
layer obtained from the 10 PMMA-co-MA solution was estimated to be ~40 nm The
93
a-PS deposition caused the central wavelengths of the attenuation bands of the fifth order
mode to blue shift of about 115 nm while the second layer of PMMA-co-MA produced
a cumulative effect of about 40 nm on the attenuation band shift
Fig 8a reports the spectral characterization to SRI changes obtained with the fifth order
mode of Prototype 2 whereas its sensitivity vs SRI is reported in Fig 8b Also in this
case the experimental results are slightly better than the expected ones indeed a
sensitivity for an SRI=134 of ~1498nmRIU was estimated with respect to the expected
1304nmRIU
Figure 8 a) SRI characterization in terms of attenuation bands minima position for the 5th order
cladding mode b) SRI sensitivity (|partλrespartSRI|) of the 5th order cladding modes extrapolated
from data reported in (a)
Prototype 3 Manufacturing characterization and validation
In this paragraphs the manufacturing characterization and functional validation of
Prototype 2 has been reported According simulations for this device to work in transition
region the a-PS layer thickness must be 270 nm enabling to reach a sensitivity as high as
1146 nmRIU The spectra in air of LPG 3 acquired before the optical fiber cut after the
optical fiber cut (ie in reflectance configuration before the mirror formation) and after
the mirror integration are reported in Fig 9
94
Figure 9 Experimental spectra acquired in air for LPG 3 before the optical fiber cut (ie in
transmission configuration) just after the optical fiber cut (ie in reflectance configuration
before the mirror formation) and after the mirror integration at the fiber termination
Figure 10 Effect of the a-PS and PMMA-co-MA overlays deposition on the 5th order cladding
mode attenuation band of LPG 3
Figure 10 shows the spectral position of the attenuation band related to the 5th order
cladding mode for the bare LPG and for the a-PS coated device The resulting overlay
thickness after DC from the PS solution was estimated to be ~260 nm while the secondary
layer obtained from the 10 PMMA-co-MA solution was estimated to be ~30 nm The
a-PS deposition caused the central wavelengths of the attenuation bands of the 5th order
95
mode to blue shift of about 94 nm while the second layer of PMMA-co-MA produced a
cumulative effect of about 258 nm on the attenuation band shift
Fig 11a reports the spectral characterization to SRI changes obtained with the 5th order
cladding mode of Prototype 3 whereas its sensitivity vs SRI is reported in Fig 11b
Figure 11 a) SRI characterization in terms of attenuation bands minima position for the 5th
order cladding mode b) SRI sensitivity (|partλrespartSRI|) of the 5th order cladding modes
extrapolated from data reported in (a)
Once more the experimental performances are slightly better than the expected ones
since a sensitivity for an SRI=134 of ~1188 nmRIU was estimated with respect to the
expected value of 1146 nmRIU
732 Chemical functionalization of sensor surface
After a ligand-BL (3-APBA) was chosen anchoring of the ligand was carried out
exploiting established covalent coupling techniques The proper linkage chemistry was
carried out to anchor the bioreceptor to the external layer of the probe With the carboxylic
functions chosen as anchoring points on the probe surface and -NH2 groups presents on
the ligand the linkage chemistry is consisted in well-established protocols developed for
solid-phase peptide synthesis These is consisted in the initial activation of the carboxyl
group through a reaction with EDC and NHS leading to an amine-reactive ester and a
successive reaction with a primary amino group present on the ligand Once the probe
surface had been functionalized by the ligand the retention of its biological activity is
evaluated carrying out the interaction studies with the complementary BL also taking
96
into consideration local parameters that may influence the binding such as aggregation
pH and ionic strength
The a-PS and PMMA-co-MA coated sensor (Prototype 2) surface was immersed in a
phosphate buffer solution at pH=5 After the optical stabilization of the sensor a solution
of 005M of EDC (~98 Sigma-Aldrich) with 003M of NHS (~98 Sigma- Aldrich)
was added to activate the carboxylic groups (-COOH) of PMMA-co-MA In Fig 12 it is
reported the chemical reaction
Figure 12 The chemical reaction of the ndashCOOH groups of the sensor surface with the
EDCNHS to obtain the esterification of carboxyl group
After the stabilization of the optical signal the sensor was immersed in a clean buffer
solution at pH=5 It is worth observing that each time grating is extractedsubmerged into
an aqueous environment there is a sort of acclimation of the polymeric layer expressed
through a quite fast red wavelength shift Dynamics of chemical functionalization were
continuously monitored through automated spectral acquisition
Figure 13 Baricentral wavelength variation vs time due to the chemical functionalization of
sensor surface
97
In Fig 13 it can be observed the dynamic of the barycentral wavelength shift of sensor
surface during the time in the first step the sensor surface was immersed in a phosphate
buffer solution at pH=5 for about 40 min after the stabilization of the optical signal the
sensor surface was immersed in the EDCNHS solution for about 40 min In the second
step the sensor surface was immersed in a clean buffer phosphate solution at pH=5
The so functionalized sensor surface was immersed in a phosphate buffer solution at
pH=7 after the stabilization of the optical signal a 3-APBA solution was added In Fig
14 it is reported the chemical reaction
Figure 14 The covalent attachment of the chosen ligand of 3APBA
Figure 15 A scheme of the sensor surface
Figure 16 Barycentral wavelength variation vs time due to the bioanchoring of 3-APBA at (a)
29 mM and (b) 58 mM
98
The 3-APBA solutions used are at different concentrations of 29 and 58 mM Dynamics
of chemical binding of ligand were continuously monitored through automated spectral
acquisition After the chemical functionalization by means of EDCNHS solution the
LPGs sensor surface was immersed into a phosphate buffer solution at pH=7
In Fig 16a it can observe the dynamic of the barycentral wavelength shift of sensor
surface during the time in the first step the sensor surface was immersed in a phosphate
buffer solution at pH=7 after the stabilization of the optical signal the sensor surface was
immersed in the 3-APBA solution at 29 mM In the second step the sensor surface was
immersed in a clean buffer phosphate solution at pH=7 In Fig 16b it can observe the
dynamic of the barycentral wavelength shift of sensor surface during the time in the first
step the sensor surface was immersed in a phosphate buffer solution at pH=7 after the
stabilization of the optical signal the sensor surface was immersed in the 3-APBA
solution at 58 mM Also in this case the sensor surface was immersed in a clean buffer
phosphate solution at pH=7
733 First verification of the preservation of 3-APBA capability of
binding the BL
Figure 17 Barycentral wavelength variation vs time related to the affinity binding of the ligand
to the β-lactamase
99
After optical stabilization the coated LPG was immersed in a phosphate buffer solution
at pH=7 after the stabilization of the optical signal the β-lactamase solution (69 μM) was
added In Fig 17 is reported the dynamic related to the affinity binding of the ligand to
the β-lactamase In Figure 11 it is possible to note that there was a wavelength shift when
the β-lactamase was added that means that the protein is binding
100
74 Data analysis interpretation
741 Analysis of the LPG biosensor response to the permanent
attachment of 3-APBA
In this section it is provided an analysis of the LPG biosensor (Prototype 2) response to
the permanent attachment of the 3-APBA onto its chemically functionalize surface In
particular here we analyze the barycentral wavelength variation of the attenuation band
of the LPG biosensor that occurs when it is immersed in 3-APBA solutions with two
different concentrations namely 29 and 58 mM
As described in the previous sections the test of ligand attachment essentially consists of
three main steps
1) the LPG probe (after the EDCNHS coupling chemistry) is first immersed in a vial
containing a phosphate buffer solution at pH=7 After a sort of acclimation of the
polymeric layers the biosensor response reaches a plateau value (λpH7)
2) successively a varying volume of ligand solution is added to the vial so as to obtain
the desired 3-APBA concentration the whole ligand binding kinetic is monitored
until the LPG response reaches a baseline value (λligand) this is carried out by
means of an automated spectral acquisition system enabling a continuous tracking
of the LPG attenuation band as well as the recovery of its baricentral wavelength
3) finally the probe is extracted from the vial and is immersed in a clean phosphate
buffer solution at pH=7 (the same solution used in the step 1 ) in order to remove
the ligand molecules that are not permanently bound to the probe surface Once
completed the washing procedure the LPG signal reach a new plateau (henceforth
referred to as λpH7washing)
As evident from Figure 18 where the sensorgram (ie the baricentral wavelength
variation of the LPG attenuation band vs time) of a generic test of ligand attachment has
been reported it is possible to identify two different LPG output signal variations
101
Δbefore-washing = λligand - λpH7 (red arrow)
and
∆after-washing = λpH7 washing - λpH7 (green arrow)
Figure 18 Generic test of ligand attachment
λbefore-washing is the baricentral wavelength shift of the LPG attenuation band due to the
attachment of ligand on the sensor surface evaluated before the washing procedure ie
when the probe is still immersed into the 3-APBA ligand solution In the most general
case in absence of thermal variations this quantity can be expressed as the sum of three
contributions
∆before-washing = ∆bulk + ∆Permanent + ∆not-Permanent
where Δbulk is the output signal variations (wavelength shift of the attenuation band) due
to the difference between the refractive indices of the clean pH=7 solution (used in the
step 1) and the ligand one (used in the step 2) ΔPermanent is the wavelength shift due to the
ligand permanently bound to the chemically functionalized surface of the LPG (or better
to the formation of a layer of ligand permanently bound to the LPG surface) Δnot-Permanent
102
is the wavelength shift due to the adsorption of ligand that is not permanently bound to
the sensor surface
On the other hand Δafter-washing is the barycentral wavelength shift of the LPG attenuation
band due to the ligand attachment on the sensor surface evaluated after the washing
procedure ie when the probe is immersed into a clean phosphate buffer solution at
pH=7 In absence of thermal variations it can be expressed as
∆after-washing = ∆permanent
Figure 19 Baricentral wavelength variation vs time obtained by two ligand attachment tests
using a 3-APBA solution concentration of 29 mM (a) and 58 mM (b) respectively
103
In this case indeed the ligand not-permanently bound to the surface is completely
removed by the washing cycles (∆not-Permanent = 0) and the refractive indices of the
phosphate buffer solutions at pH=7 before and after the ligand insertion are the same
(∆bulk = 0)
Therefore on the basis of these considerations it is clear that by evaluating the ∆after-washing
for each ligand solution concentration it is possible to evaluate the LPG signal variation
due exclusively to the formation of an ultra-thin layer of 3-APBA (of the order of a few
nanometers) that is permanently attached on the chemically functionalized LPG surface
After this brief introduction useful to elucidate the analysis methodologies and the
quantities under investigations let analyze further in detail the LPG biosensor response
to the permanent attachment of the 3-APBA occurred by using two ligand solutions with
different concentrations namely 29 and 58 mM
In Fig 19 the sensorgrams obtained by using a 3-APBA solution with concentration of
29 mM (a) and 58 mM (b) have been reported In particular Fig 19a refers to a first
test where a 3-APBA concentration of 29 mM has been used As it can be seen the
baseline of the sensor response when the LPG is immersed into the phosphate buffer
solution at pH=7 (before the ligand addiction) is λpH7=14600 nm As soon as the 3-APBA
solution is added to the buffer solution the LPG output signal decreases (the attenuation
band undergoes a blue-shift) until it reaches a plateau level at λligand=14521 nm During
the washing procedure the ligand molecules not permanently bound to the probe surface
tend to detach from it (and the ∆bulk become equal to 0) thus leading to a recovery (the
attenuation band red-shifts) of the sensor response until the plateau value
λpH7washing=14559 nm The observed values for ∆before-washing and ∆after-washing are 79 nm
and 41 nm respectively in correspondence of a 3-APBA solution concentration of
29mM When a higher 3-APBA solution concentration (58 mM) was used the λpH7
104
λligand and λpH7washing were respectively 14561 nm 14491 nm and 14522 nm with a
∆before-washing equal to 70 nm and a ∆after-washing of 39 nm
From the reported results it is possible to state that the signal recovery is not complete
(∆afterwashing ne 0) demonstrating that an ultrathin layer of 3-APBA effectively remains
permanently attached on the functionalized LPG surface
These results confirm that
- the chemical functionalization allows the carboxylic groups activation and
enables the permanently attachment of the 3-APBA ligand onto the coated LPG
surface
- the high surface sensitivity of the coated-functionalized LPG allows the detection
of a 3-APBA ligand ultrathin layer permanently attached onto the LPG probe
surface It is important to remark that the ligand size is significantly lower than
the size of the target β-lactamase protein
The following table summarizes the ∆before-washing and ∆after-washing values for the two used
3-APBA ligand concentrations
Table 1 Resume of the ∆before-washing and ∆after-washing obtained for the two used 3-APBA ligand
concentrations
3-APBA solution concentration ∆before-washing ∆after-washing
29 mM 79 nm 41 nm
58 mM 70 nm 39 nm
It is worth considering at this point that the ligand attachment in the test so far reported
takes place in successive addictions ie the 3-APBA attachment occurring in case of the
highest concentration (58 mM) takes place on the LPG functionalized surface already
covered (completely or only partially) by an ultra-thin ligand layer (ie the one formed
when the lowest concentration was used)
Therefore in this case it is preferable defining two further quantities (∆before-washing_cumulative
and ∆after-washing_cumulative) enabling to take into account this cumulative effect
∆before-washing_cumulative =sumi=1-n ∆before-washing(concentration_i)
105
∆after-washing_cumulative =sumi=1-n ∆after-washing(concentration_i)
In Figure 20 it is plotted these cumulative quantities ∆before-washing_cumulative (blak squares)
and ∆after-wahing_cumulative (red circles) as a function of the 3-APBA cumulative
concentration It can be observed that they both increase with the cumulative ligand
concentration with the ∆afterwahing_cumulative in particular showing a quadratic trend
Figure 19 ∆before-washing_cumulative and ∆after-wahing_cumulative as a funtion of the 3-APBA ligand
cumulative concentration
742 Analysis of the LPG biosensor response to the 3-APBA capability
of binding the BL
After previously analysis devoted to investigates the LPG biosensor response to the
permanent attachment of 3-APBA let analyze further in detail the sensor response to the
binding capability of the β-lactamase In Fig 20 the sensorgrams obtained by using a β-
lactamase with concentration of 69 μM has been reported As it can be seen the baseline
of the sensor response when the LPG is immersed into the phosphate buffer solution at
pH=7 (after the ligand attachment procedure) is λpH7=14476 nm As soon as the β-
lactamse solution is added to the buffer solution the LPG output signal increases (the
attenuation band undergoes a red-shift) until it reaches a plateau level at λβ- lactamase=1450
nm During the washing procedure the β-lactamase molecules not permanently bound to
the probe surface tend to detach from it (the ∆bulk become equal to 0) and the sensor
response until the plateau value λpH7washing=14448 nm
106
Figure 20 Baricentral wavelength variation vs time obtained by the β-lactamase binding with
the 3APBA ligand
The calculated values for ∆before-washing and ∆after-washing are respectively 24 nm and 28 nm
In particular the ∆after-washing is the wavelength shift due to the β-lactamase molecules
permanently attached onto the LPG surface
These results confirm that
- the attachment of the 3-APBA ligand onto the chemical functionalized surface of
the LPG probe (as described in the previously section) allows the β-lactamase
protein binding
- the proposed biosensor is able to detect the β-lactamase binding onto the
biofunctionalized LPG surface
107
75 Design and realization of an automated robotic arm
Aim of the OPTOBACTERIA Project was the design of an Automated Laboratory
Detector (ALD) mainly consisting on an automatic robot able to perform repetitive and
controlled tests on a series of biological samples by using multiple LPG biosensors
simultaneously The design phase started from a general view of the ALD a schematic
representation of which is shown in Figure 51 Here the ALD has been conceived as
composed of
1) a sensing head holder allowing the control of up to eight fiber optic biosensors
simultaneously
2) a couvettes carousel having Functionalization Samples and Rinse areas divided
according to the specific needs in order supply the ALD with the additional
functionality of being able to automatically realize the chemical functionalization
the ligand immobilization along with the biological tests starting from a general
purpose probe (ie from the LPG transducer with the a-PS and the PMMA
coatings)
Figure 21 General view of the ALD
108
3) a proper optoelectronic unit for the interrogation of the LPGndashbased reflection
probes
4) a PC with dedicated software for command and control of the Robotic work
The designed system is composed of two main parts the test chamber containing a
sensor mount able to hold up to eight LPG biosensor a couvette carousel holding a 96-
well plate and two linear actuators responsible for the movements of the well-plate along
the vertical and the horizontal directions and the rear region hosting the optoelectronic
interrogation unit and the electronic circuits for the control of the entire system the
connection with the host PC and the power supply
Once defined the design criteria the ALD system has been assembled and all its
components have been included in a suitable enclosure The test chamber where the
biological tests take place is shown in Fig 22 where the enclosure has been opened to
show the inside It is possible to distinguish the two-dimensional translation stages
(horizontal X and vertical Z) the sensor holder with eight LPG transducers mounted
and the couvettes carousel with a 96-well plate
Figure 22 A view of the manufactured ALD showing the test chamber
The developed ALD comprising both the mechanical stages and the optoelectronic
interrogation unit and its related software has been subjected to a phase of test and
debugging Once carried out the test of the single parts the whole system operation was
109
tested for making simultaneous biological tests with up to eight LPG probes The
complete kinetics of the binding of a ligand on the surface of each LPG probe and a typical
β-lactamase detection tests have been monitored
110
References
[1] httpwwwoptobacteriaeu
[2] NM Mitchell GG Rao J Wong ESBL Detection Kit and Method US Patent
20100203567 (2010)
[3] X Fan IM White SI Shopova Analytica Chimica Acta 620(1-2) 8-26 (2008)
[4] X Chen L Zhang K Zhou Opt Lett 32 2541-2543 (2007)
[5] M Smietana WJ Bock P Mikulic Opt Express 19 7971-7978 (2011)
[6] Z Wang JR Heflin KV Cott Sensors and Actuators B Chemical 139(2-4) 618-
623 (2009)
[7] A Cusano A Iadicicco P Pilla Opt Express 14(1) 19ndash34 (2006)
[8] P Pilla P Foglia Manzillo V Malachovska Opt Express 17 20039ndash20050 (2009)
[9] I Del Villar I R Matiacuteas FJ Arregui Opt Express 13(1) 56ndash69 (2005)
[10] P Pilla V Malachovskaacute A Borriello Opt Express 19 512ndash526 (2011)
[11] KM Stoeffler C Dubois A Ajji Polym Eng Sci 50 1122-1127 (2010)
[12] H Ma AKY Jen LR Dalton Adv Mater 14 1339-1365 (2002)
[13] D Ennis H Betz H Ade J Polym Sci Part B Polym Phys 44 3234-3244
(2006)
[14] I Del Villar IR Matias FJ Arregui J Lightwave Technol 23 4192 (2005)
111
8 Conclusion
The aim of this thesis is the realization of integrated optic sensors based on fiber grating
devices In order to obtain chemical and biological sensors a Long Period Gratings
transducer was used as transduction platform Different organic and inorganic materials
were used as sensitive elements at the interface between the LPGs and the external
environment Since the selectivity and sensitivity of a LPGs based sensor depend upon
the interface materials careful study of the sensing materials as well as of the deposition
process was done
Results of this PhD work has been obtained thanks to the integration of interdisciplinary
knowledges in different scientific and technological areas such as optical engineering
biochemistry polymer materials synthetic chemistry
In the framework of the OPTOFER Project it has been manufactured a GPL sensor based
on LPGs coated with a-PS thin films This polymeric film has been chosen for the
physical affinity between the hydrophobic polystyrene chains and the short aliphatic
molecules that constitute GPL Preliminary results have shown the good sensitivity of the
devices in presence of unknown GPL concentrations the signal is stable and the sensor
is characterized by fast response time and reversibility (absence of hysteresis in
consecutive gas ongas off cycles) An accurate study both of the material and of the
interaction between the LPG transducer and the a-PS film has allowed the development
of a device able to clearly detect GPL concentration between 1000 to 30000 ppm These
sensors have been installed and tested under the railway tunnel of Porta Rufina station in
Benevento
ldquoRelative humidity fiber optic sensors based on Long Period Gratingsrdquo is the name of the
collaboration agreement with CERN during which have been designed developed and
manufactured humidity sensors resistant to radiation and to cryogenic temperature LPGs
112
used as transducers were coated with thin film of sol-gel synthesized titania an inorganic
oxide that shows different interesting features 1) hygrosensitive characteristics 2) ageing
and high energy radiation resistance and 3) thermal stability The sol-gel synthesis and
the deposition process optimization has led to the development of humidity sensors with
good sensibility and reversibility and the inorganic nature of the titania coating
guarantees the mechanical and thermal stability of the device
In the framework of the OPTOBACTERIA Project has been developed a highly-
sensitive reflection-type LPG biosensor useful for the detection of antibiotic resistance
bacteria The reflection-type LPG was coated by a primary a-PS layer and by a secondary
very thin overlay of PMMA-co-MA a-PS was used has HRI layer in order to tune the
LPG to operate in the transition region PMMA-co-MA has been employed as thin film
to provide carboxylic groups on the external surface of the fiber A standard linkage
chemistry has been carried out to anchor the bioreceptors to the probe surface
Preliminary experimental results demonstrate the capability of the fabricated LPG
biosensor to successfully monitor all the steps of the biochemical immobilization strategy
as well as to detect the BL binding to its functionalized surface
113
Acknowledgement
Firstly I would like to express my sincere gratitude to my PhD tutor Dr Anna Borriello
for the continuous support of my PhD study and related research for her patience
motivation and immense knowledge Her guidance helped me in all the time of research
and writing of this thesis both from the scientific and human point of view
I would also like to thank my PhD tutor Prof Giuseppe Mensitieri for the support given
to me during these three years and for the useful scientific discussion
My sincere thanks also goes to Eng Mauro Zarrelli for encouraging my research and for
allowing me to grow as a research scientist your advice on both research as well as on
my career have been priceless
I would like to thank also Miss Paola Desidery who has always answered my
administrative questions with patient and courtesy and Miss Mariarosaria Marcedula
who has constantly helped me in samples manufacturing and characterization
Moreover I would like to thank my mother for supporting me spiritually throughout the
PhD period for teaching me to endure until the achievement of my goals and to share
my work results with the people who helped me
A special thanks goes to the love of my life P M who made me understand the true
meaning of love making me feel happier than I thought was possible I will never stop to
thank you for the patience that you have had and for the love you show me every day
Finally I dedicate this work to the memory of my father who until the last day of his life
has always been able to counsel and help me Thanks for all you have done for mom and
me


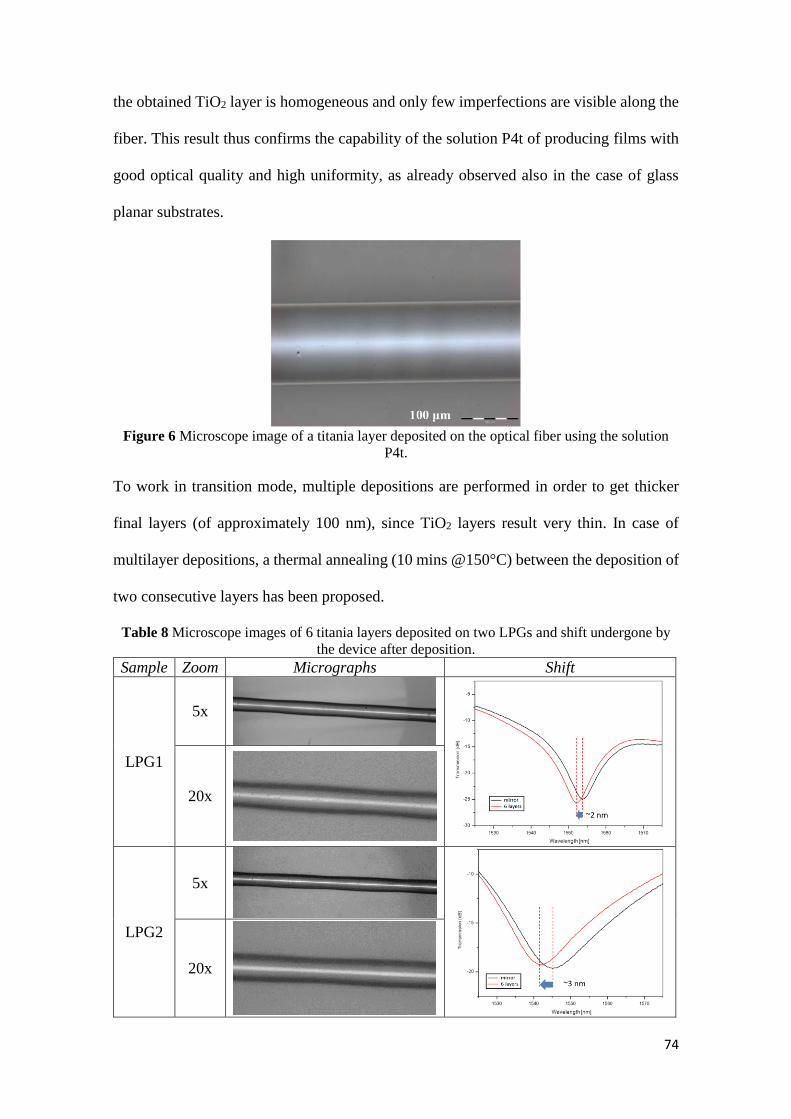


![Studies of Hybrid Organic-Inorganic [2] and [3] Rotaxanes ... · 1 Supporting Information for Studies of Hybrid Organic-Inorganic [2] and [3] Rotaxanes Bound to Au Surfaces Harapriya](https://static.fdocuments.net/doc/165x107/5e9bfc632cc4263f092a1e2c/studies-of-hybrid-organic-inorganic-2-and-3-rotaxanes-1-supporting-information.jpg)


