Oregon Travel Impacts - Industry Resources...The Oregon Travel Industry is A Leading Export-Oriented...
254
Oregon Travel Impacts Statewide Estimates 1992 - 2018p Prepared for the Oregon Tourism Commission Portland, Oregon March 2019
Transcript of Oregon Travel Impacts - Industry Resources...The Oregon Travel Industry is A Leading Export-Oriented...
Oregon Travel ImpactsStatewide Estimates1992 - 2018p
Prepared for the
Oregon Tourism CommissionPortland, Oregon
March 2019

This page is intentionally blank
OREGON TRAVEL IMPACTS, 1992-2018p
STATEWIDE PRELIMINARY ESTIMATES
DETAILED COUNTY ESTIMATES
OVERNIGHT VISITOR VOLUME
Prepared for
Oregon Tourism Commission319 SW. Washington Street
Suite 700Portland, Oregon 97204
503.967.1560www.traveloregon.com
Prepared by
Dean Runyan Associates833 SW Eleventh Avenue, Suite 920
Portland, Oregon 97205503/226-2973
www.deanrunyan.com
March 2019

This page is intentionally blank
Executive SummaryThis report provides detailed statewide, regional and county travel impact estimates for Oregon from 1992 to 2018. The report also provides average spending and volume estimates for overnight visitors for most counties. The estimates for 2018 are preliminary. Secondary impacts and travel industry GDP are provided at the state level.
Travel Spending, Employment and earnings continue to expandThe Oregon travel industry continued to exhibit strong growth in 2018, as all measures of travel activity were up over 2017.
· Spending. Total direct travel spending in Oregon was $12.3 billion in 2018. The annual increase from 2017 was 4.2 percent in current dollars. In real, inflation-adjusted, dollars travel spending increased by 1.9 percent. Visitor spending, excluding transportation, increased by 2.5 percent in current dollars. This is the ninth consecutive year of growth in travel spending following the recession.
· Travel Activity. An estimated 29.1 million overnight visitors traveled to Oregon destinations in 2018 (preliminary). This represents a 1.1 percent increase over 2017. Since 2010, overnight person-trips have increased by 2.1 percent per year. Domestic visitor air arrivals to Oregon (4.2 million) increased by 5.2 percent for the year. Room demand, as measured by STR, Inc., increased by 1.4 percent for the year.[1]
· Employment. Total travel generated employment was 115,400 in 2018. This represents a 2.9 percent increase over 2017, the eighth consecutive year of employment growth following the steep decline from 2008 to 2010. Employment has increased by 3.2 percent per year since 2010.
· Secondary Impacts. The re-spending of travel-generated revenues by businesses and employees generates additional impacts. In 2018, these secondary impacts were equivalent to 59,960 jobs with earnings of $3.1 billion. Most of these jobs were in various professional and business services.
· GDP. The Gross Domestic Product of the travel industry was $5.5 billion in 2018. Overall, the travel industry is one of the three largest export-oriented industries in rural Oregon counties (the other two being agriculture/food processing and logging/wood products).
1. The STR reports were prepared for the Oregon Tourism Commission
DEAN RUNYAN ASSOCIATES PAGE i
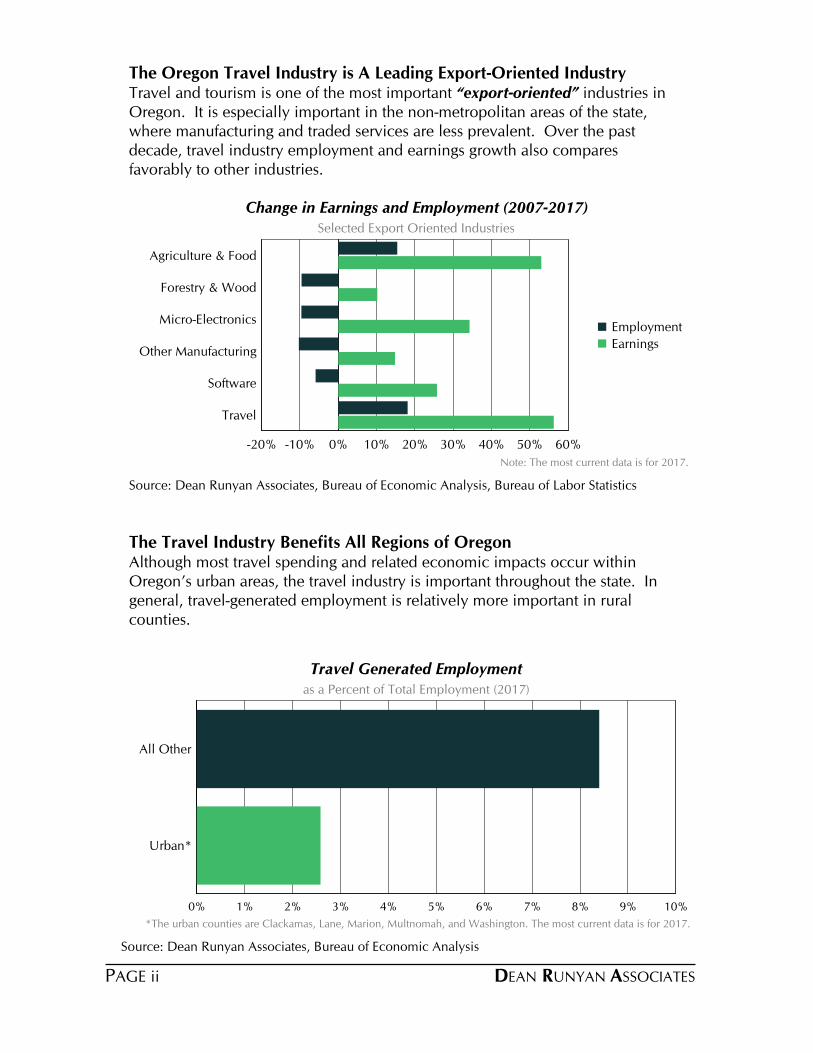
The Oregon Travel Industry is A Leading Export-Oriented IndustryTravel and tourism is one of the most important “export-oriented” industries in Oregon. It is especially important in the non-metropolitan areas of the state, where manufacturing and traded services are less prevalent. Over the past decade, travel industry employment and earnings growth also compares favorably to other industries.
-20% -10% 0% 10% 20% 30% 40% 50% 60%
Agriculture & Food
Forestry & Wood
Micro-Electronics
Other Manufacturing
Software
Travel
Employment
Earnings
Change in Earnings and Employment (2007-2017)Selected Export Oriented Industries
Note: The most current data is for 2017.
Source: Dean Runyan Associates, Bureau of Economic Analysis, Bureau of Labor Statistics
The Travel Industry Benefits All Regions of Oregon Although most travel spending and related economic impacts occur within Oregon’s urban areas, the travel industry is important throughout the state. In general, travel-generated employment is relatively more important in rural counties.
0% 1% 2% 3% 4% 5% 6% 7% 8% 9% 10%
All Other
Urban*
Travel Generated Employmentas a Percent of Total Employment (2017)
*The urban counties are Clackamas, Lane, Marion, Multnomah, and Washington. The most current data is for 2017.
Source: Dean Runyan Associates, Bureau of Economic Analysis
DEAN RUNYAN ASSOCIATESPAGE ii
Oregon Travel Impacts, 1992-2018
List of Tables & FiguresPreface
I Oregon TravelSummary of Oregon TravelAnnual Travel TrendsOvernight Visitor Volume and Average SpendingOregon Travel Industry Gross Domestic ProductA Comparison of Oregon Export-Oriented IndustriesSecondary Impacts
II Oregon's Tourism Regions
III Oregon's Counties
IV Oregon Day Travel
V Local Transient Lodging Tax Receipts
Appendices A Travel Impact and Visitor Volume Estimates B Key Terms and Definitions C Regional Travel Impact Model D Travel Industry Accounts E Earnings & Employment by Industry Sector F Industry Groups G Split County Trends
iv1
234678
10
16
58
203
205
221222225226227237238242
DEAN RUNYAN ASSOCIATES PAGE iii
Oregon TravelDirect Travel Impacts, 2010-2018pOregon Direct Travel Spending in Real and Current DollarsAir Passenger Visitor Arrivals to Oregon, US Air CarriersOregon Overnight Person TripsAverage Expenditures for Oregon Overnight Visitors, 2018pOvernight Overnight Visitor Volume, 2016-2018pOregon Travel Industry Gross Domestic Product, 2018pOregon Gross Domestic Product, 2017 (Selected Export-Oriented Industries)Change in Oregon GDP, 2003-2017 (Selected Export-Oriented Industries)Change in Earnings and Employment, 2003-2017 (Selected Export-Oriented Industries)Total Employment and Earnings Generated by Travel Spending in Oregon, 2018pDirect & Secondary Employment Generated by Travel Spending, 2018p (graph)Direct & Secondary Earnings Generated by Travel Spending, 2018p (graph)Direct & Secondary Employment Generated by Travel Spending, 2018p (table)Direct & Secondary Earnings Generated by Travel Spending, 2018p (table)Oregon Travel Impacts, 1992-2018p (detail)
Oregon's Tourism RegionsOregon Travel Impacts by Region, 2018pCentral Oregon Travel Impacts, Spending & Volume TablesCentral Coast Travel Impacts, Spending & Volume TablesEastern Oregon Travel Impacts, Spending & Volume TablesMt. Hood/Gorge Travel Impacts, Spending & Volume TablesNorth Coast Travel Impacts, Spending & Volume TablesOregon Coast Travel Impacts, Spending & Volume TablesPortland Metro Travel Impacts, Spending & Volume TablesSouth Coast Travel Impacts, Spending & Volume TablesSouthern Oregon Travel Impacts, Spending & Volume TablesWilliamette Valley Travel Impacts, Spending & Volume Tables
24555667899
111212131314
1617182226303438424650
List of Tables & Figures
DEAN RUNYAN ASSOCIATESPAGE iv
Counties2018p County Travel Impacts2018p County Overnight Visitor VolumeBaker County Travel Impacts, Spending & Volume TablesBenton County Travel Impacts, Spending & Volume TablesClackamas County Travel Impacts, Spending & Volume TablesClatsop County Travel Impacts, Spending & Volume TablesColumbia County Travel Impacts, Spending & Volume TablesCoos County Travel Impacts, Spending & Volume TablesCrook County Travel Impacts, Spending & Volume TablesCurry County Travel Impacts, Spending & Volume TablesDeschutes County Travel Impacts, Spending & Volume TablesDouglas County Travel Impacts, Spending & Volume TablesGilliam & Sherman County Travel Impacts, Spending & Volume TablesGrant County Travel Impacts, Spending & Volume TablesHarney County Travel Impacts, Spending & Volume TablesHood River County Travel Impacts, Spending & Volume TablesJackson County Travel Impacts, Spending & Volume TablesJefferson County Travel Impacts, Spending & Volume TablesJosephine County Travel Impacts, Spending & Volume TablesKlamath County Travel Impacts, Spending & Volume TablesLake County Travel Impacts, Spending & Volume TablesLane County Travel Impacts, Spending & Volume TablesLincoln County Travel Impacts, Spending & Volume TablesLinn County Travel Impacts, Spending & Volume TablesMalheur County Travel Impacts, Spending & Volume TablesMarion County Travel Impacts, Spending & Volume TablesMorrow County Travel Impacts, Spending & Volume TablesMultnomah County Travel Impacts, Spending & Volume TablesPolk County Travel Impacts, Spending & Volume TablesSherman County (see Gilliam and Sherman Counties)Tillamook County Travel Impacts, Spending & Volume TablesUmatilla County Travel Impacts, Spending & Volume TablesUnion County Travel Impacts, Spending & Volume TablesWallowa County Travel Impacts, Spending & Volume TablesWasco County Travel Impacts, Spending & Volume TablesWashington County Travel Impacts, Spending & Volume TablesWheeler County Travel Impacts, Spending & Volume Tables
58596061656973778185899397
101105109113117121125129133137141145149153157161165169173177181185189193197
List Tables & Figures
DEAN RUNYAN ASSOCIATES PAGE v
Day TravelDay Trip ActivitiesPurpose of Day Trip
Transient Lodging Tax TablesOregon Local Lodging Tax ReceiptsLocal Lodging Tax Receipts by Jurisdiction, 2006-2018 FY
AppendicesA. 2018 Travel Impact and Visitor Volume EstimatesB. Key Terms and DefinitionsC. Relationship Between Spending and VolumeD. Regional Travel Impact ModelE. Oregon Earnings and Employment by Industry SectorF. Industry GroupsG. Split County Trends
205205206
207207208
216217220221222232233237
List of Tables & Figures
DEAN RUNYAN ASSOCIATESPAGE vi
Preface
The purpose of this study is to document the economic significance of the travel industry in Oregon and its thirty-six counties and seven tourism regions from 1992 to 2018. These findings show the level of travel spending by visitors traveling to and within the state, and the impact this spending had on the economy in terms of earnings, employment and tax revenue. Estimates of overnight visitor volume and average spending are also provided for all tourism regions and most counties. The estimates for 2018 are preliminary.
Dean Runyan Associates prepared this study for the Travel Oregon. Dean Runyan Associates has specialized in research and planning services for the travel, tourism and recreation industry since 1984. With respect to economic impact analysis, the firm developed and currently maintains the Regional Travel Impact Model (RTIM), a proprietary model for analyzing travel economic impacts at the state, regional and local level. Dean Runyan Associates also has extensive experience in project feasibility analysis, market evaluation, survey research and travel and tourism planning.
Many individuals and agencies provided information and advice for this report. The state agencies that provided essential information were the Parks and Recreation Department and the Department of Revenue. At the federal level, data was obtained from the U.S. Forest Service, the Department of Labor and the Bureau of Economic Analysis. Additionally, numerous local governments and visitor bureaus throughout Oregon provided information.
Finally, special thanks are due to Ladan Ghahramani, Research Manager, Michael Sturdevant, Director of Global Marketing Services , and Todd Davidson, Chief Executive Officer of Travel Oregon, for their support and assistance.
Dean Runyan Associates, Inc.833 SW 11th Ave., Suite 920
Portland, OR 97205
DEAN RUNYAN ASSOCIATES PAGE 1
I. OREGON TRAVEL IMPACTS
DEAN RUNYAN ASSOCIATESPAGE 2
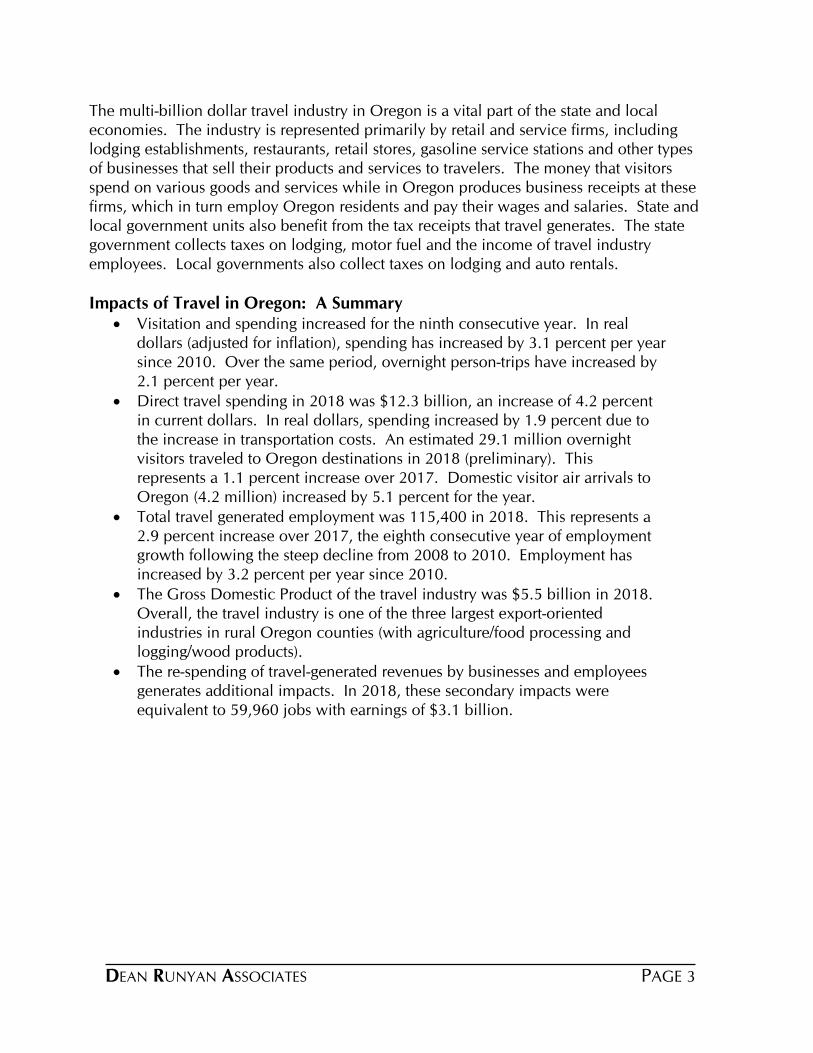
The multi-billion dollar travel industry in Oregon is a vital part of the state and local economies. The industry is represented primarily by retail and service firms, including lodging establishments, restaurants, retail stores, gasoline service stations and other types of businesses that sell their products and services to travelers. The money that visitors spend on various goods and services while in Oregon produces business receipts at these firms, which in turn employ Oregon residents and pay their wages and salaries. State and local government units also benefit from the tax receipts that travel generates. The state government collects taxes on lodging, motor fuel and the income of travel industry employees. Local governments also collect taxes on lodging and auto rentals.
Impacts of Travel in Oregon: A Summary· Visitation and spending increased for the ninth consecutive year. In real
dollars (adjusted for inflation), spending has increased by 3.1 percent per year since 2010. Over the same period, overnight person-trips have increased by 2.1 percent per year.
· Direct travel spending in 2018 was $12.3 billion, an increase of 4.2 percent in current dollars. In real dollars, spending increased by 1.9 percent due to the increase in transportation costs. An estimated 29.1 million overnight visitors traveled to Oregon destinations in 2018 (preliminary). This represents a 1.1 percent increase over 2017. Domestic visitor air arrivals to Oregon (4.2 million) increased by 5.1 percent for the year.
· Total travel generated employment was 115,400 in 2018. This represents a 2.9 percent increase over 2017, the eighth consecutive year of employment growth following the steep decline from 2008 to 2010. Employment has increased by 3.2 percent per year since 2010.
· The Gross Domestic Product of the travel industry was $5.5 billion in 2018. Overall, the travel industry is one of the three largest export-oriented industries in rural Oregon counties (with agriculture/food processing and logging/wood products).
· The re-spending of travel-generated revenues by businesses and employees generates additional impacts. In 2018, these secondary impacts were equivalent to 59,960 jobs with earnings of $3.1 billion.
DEAN RUNYAN ASSOCIATES PAGE 3
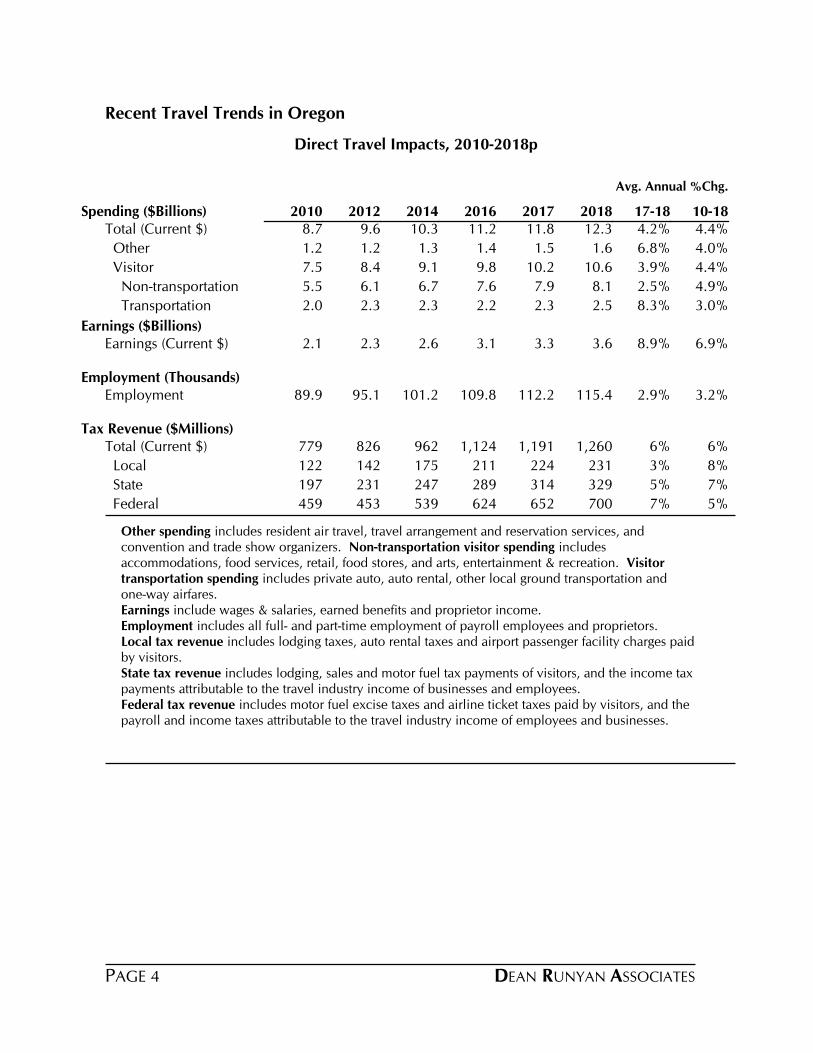
Direct Travel Impacts, 2010-2018p
Recent Travel Trends in Oregon
Avg. Annual %Chg.
2010 2012 2014 2016 2017 2018 17-18 10-18Total (Current $) 8.7 9.6 10.3 11.2 11.8 12.3 4.2% 4.4%
Other 1.2 1.2 1.3 1.4 1.5 1.6 6.8% 4.0%
Visitor 7.5 8.4 9.1 9.8 10.2 10.6 3.9% 4.4%
Non-transportation 5.5 6.1 6.7 7.6 7.9 8.1 2.5% 4.9%
Transportation 2.0 2.3 2.3 2.2 2.3 2.5 8.3% 3.0%
Spending ($Billions)
Earnings (Current $) 2.1 2.3 2.6 3.1 3.3 3.6 8.9% 6.9%Earnings ($Billions)
Employment 89.9 95.1 101.2 109.8 112.2 115.4 2.9% 3.2%Employment (Thousands)
Total (Current $) 779 826 962 1,124 1,191 1,260 6% 6%
Local 122 142 175 211 224 231 3% 8%
State 197 231 247 289 314 329 5% 7%
Federal 459 453 539 624 652 700 7% 5%
Tax Revenue ($Millions)
Other spending includes resident air travel, travel arrangement and reservation services, and convention and trade show organizers. Non-transportation visitor spending includes accommodations, food services, retail, food stores, and arts, entertainment & recreation. Visitor transportation spending includes private auto, auto rental, other local ground transportation and one-way airfares.Earnings include wages & salaries, earned benefits and proprietor income.Employment includes all full- and part-time employment of payroll employees and proprietors.Local tax revenue includes lodging taxes, auto rental taxes and airport passenger facility charges paid by visitors.State tax revenue includes lodging, sales and motor fuel tax payments of visitors, and the income tax payments attributable to the travel industry income of businesses and employees.Federal tax revenue includes motor fuel excise taxes and airline ticket taxes paid by visitors, and the payroll and income taxes attributable to the travel industry income of employees and businesses.
DEAN RUNYAN ASSOCIATESPAGE 4
$5.0
$6.0
$7.0
$8.0
$9.0
$10.0
$11.0
$12.0
$13.0
$14.0
0001
0203
0405
0607
0809
1011
1213
1415
1617
18p
Real Current
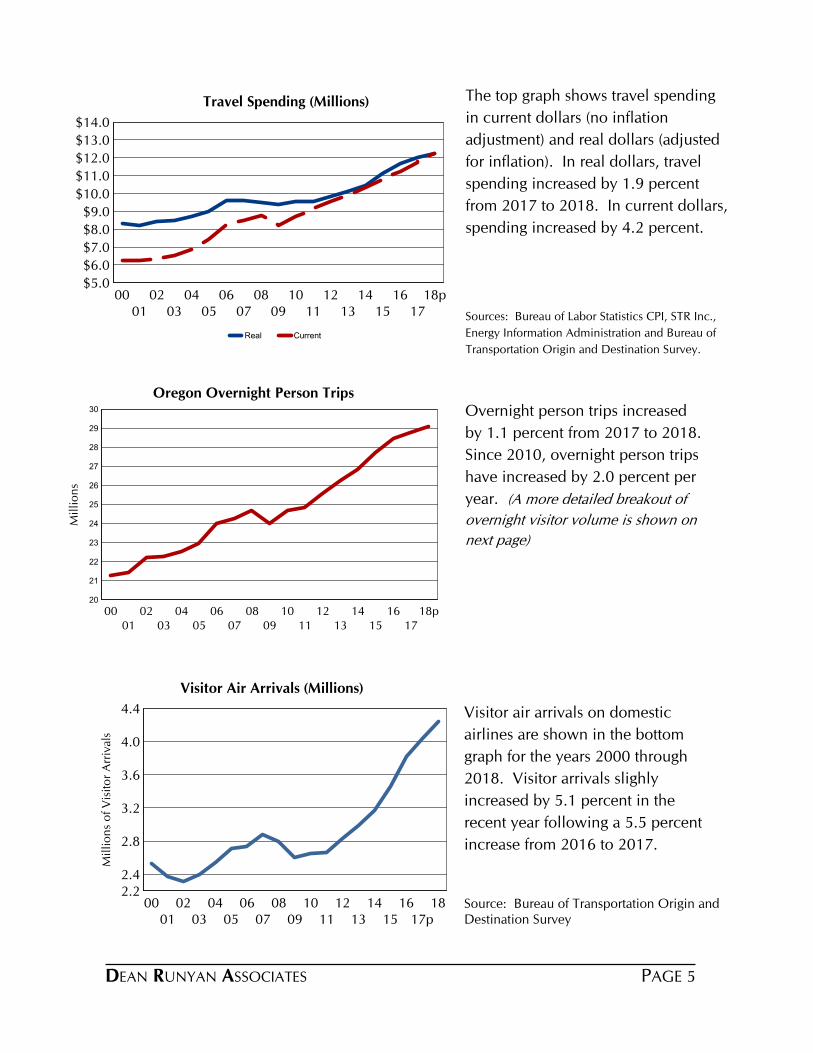
Travel Spending (Millions) The top graph shows travel spending
in current dollars (no inflation
adjustment) and real dollars (adjusted
for inflation). In real dollars, travel
spending increased by 1.9 percent
from 2017 to 2018. In current dollars,
spending increased by 4.2 percent.
Sources: Bureau of Labor Statistics CPI, STR Inc.,
Energy Information Administration and Bureau of
Transportation Origin and Destination Survey.
Overnight person trips increased
by 1.1 percent from 2017 to 2018.
Since 2010, overnight person trips
have increased by 2.0 percent per
year. (A more detailed breakout of
overnight visitor volume is shown on
next page)
20
21
22
23
24
25
26
27
28
29
30
0001
0203
0405
0607
0809
1011
1213
1415
1617
18p
Mil
lio
ns
Oregon Overnight Person Trips
2.22.4
2.8
3.2
3.6
4.0
4.4
0001
0203
0405
0607
0809
1011
1213
1415
1617p
18
Mil
lio
ns
of
Vis
ito
r A
rriv
als
Visitor Air Arrivals (Millions)
Visitor air arrivals on domestic
airlines are shown in the bottom
graph for the years 2000 through
2018. Visitor arrivals slighly
increased by 5.1 percent in the
recent year following a 5.5 percent
increase from 2016 to 2017.
Source: Bureau of Transportation Origin and Destination Survey
DEAN RUNYAN ASSOCIATES PAGE 5
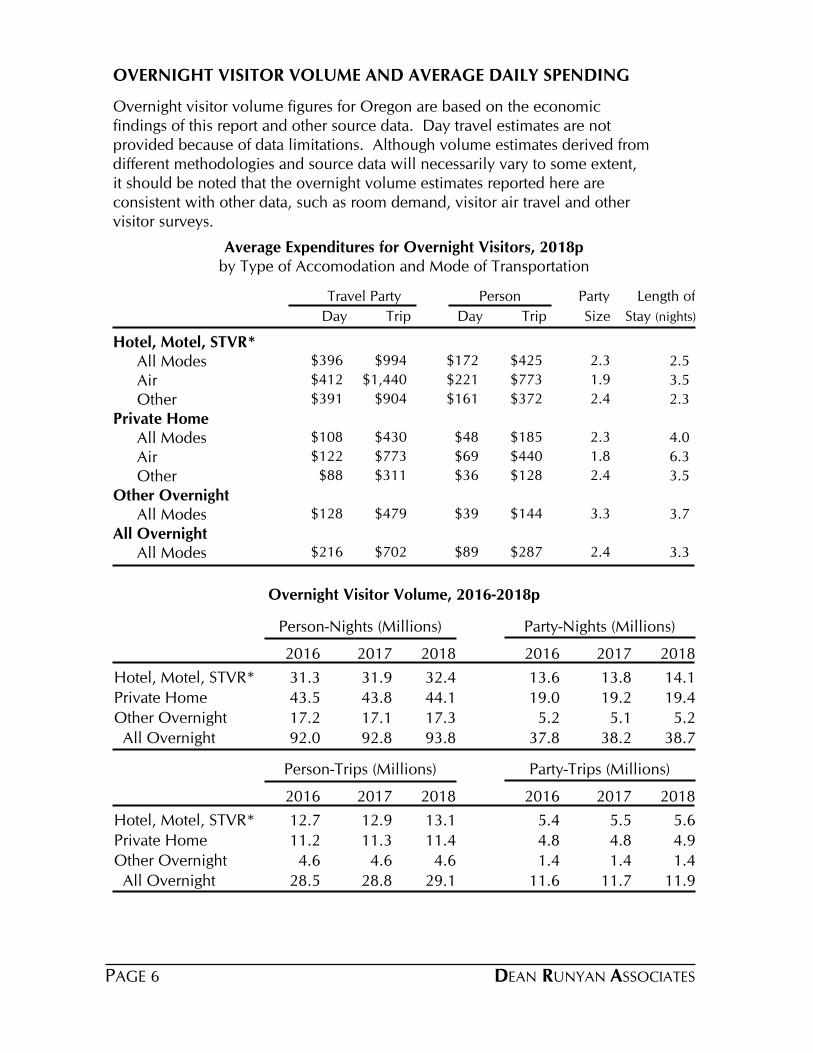
OVERNIGHT VISITOR VOLUME AND AVERAGE DAILY SPENDING
Overnight visitor volume figures for Oregon are based on the economic findings of this report and other source data. Day travel estimates are not provided because of data limitations. Although volume estimates derived from different methodologies and source data will necessarily vary to some extent, it should be noted that the overnight volume estimates reported here are consistent with other data, such as room demand, visitor air travel and other visitor surveys.
Average Expenditures for Overnight Visitors, 2018pby Type of Accomodation and Mode of Transportation
Travel Party Person Party Length of
Day Trip Day Trip Size Stay (nights)
Hotel, Motel, STVR*$396 $994 $172 $425 2.3 2.5All Modes$412 $1,440 $221 $773 1.9 3.5Air$391 $904 $161 $372 2.4 2.3Other
Private Home$108 $430 $48 $185 2.3 4.0All Modes$122 $773 $69 $440 1.8 6.3Air
$88 $311 $36 $128 2.4 3.5OtherOther Overnight
$128 $479 $39 $144 3.3 3.7All ModesAll Overnight
$216 $702 $89 $287 2.4 3.3All Modes
Overnight Visitor Volume, 2016-2018p
Person-Nights (Millions) Party-Nights (Millions)
2016 2017 2018 2016 2017 2018
Hotel, Motel, STVR* 31.3 31.9 32.4 13.6 13.8 14.1
Private Home 43.5 43.8 44.1 19.0 19.2 19.4
Other Overnight 17.2 17.1 17.3 5.2 5.1 5.2
All Overnight 92.0 92.8 93.8 37.8 38.2 38.7
Person-Trips (Millions) Party-Trips (Millions)
2016 2017 2018 2016 2017 2018
Hotel, Motel, STVR* 12.7 12.9 13.1 5.4 5.5 5.6
Private Home 11.2 11.3 11.4 4.8 4.8 4.9
Other Overnight 4.6 4.6 4.6 1.4 1.4 1.4
All Overnight 28.5 28.8 29.1 11.6 11.7 11.9
DEAN RUNYAN ASSOCIATESPAGE 6
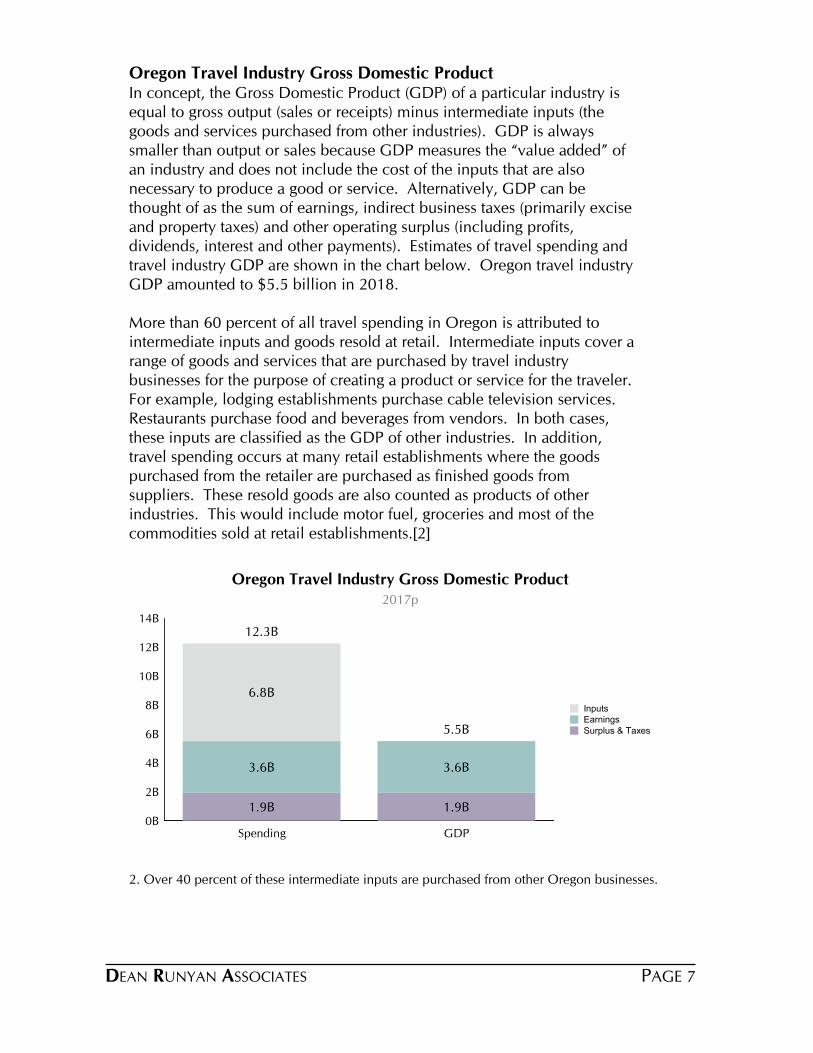
Oregon Travel Industry Gross Domestic ProductIn concept, the Gross Domestic Product (GDP) of a particular industry is equal to gross output (sales or receipts) minus intermediate inputs (the goods and services purchased from other industries). GDP is always smaller than output or sales because GDP measures the “value added” of an industry and does not include the cost of the inputs that are also necessary to produce a good or service. Alternatively, GDP can be thought of as the sum of earnings, indirect business taxes (primarily excise and property taxes) and other operating surplus (including profits, dividends, interest and other payments). Estimates of travel spending and travel industry GDP are shown in the chart below. Oregon travel industry GDP amounted to $5.5 billion in 2018. More than 60 percent of all travel spending in Oregon is attributed to intermediate inputs and goods resold at retail. Intermediate inputs cover a range of goods and services that are purchased by travel industry businesses for the purpose of creating a product or service for the traveler. For example, lodging establishments purchase cable television services. Restaurants purchase food and beverages from vendors. In both cases, these inputs are classified as the GDP of other industries. In addition, travel spending occurs at many retail establishments where the goods purchased from the retailer are purchased as finished goods from suppliers. These resold goods are also counted as products of other industries. This would include motor fuel, groceries and most of the commodities sold at retail establishments.[2]
0B
2B
4B
6B
8B
10B
12B
14B
Spending GDP
1.9B 1.9B
3.6B 3.6B
6.8B
12.3B
5.5B
InputsEarningsSurplus & Taxes
Oregon Travel Industry Gross Domestic Product2017p
2. Over 40 percent of these intermediate inputs are purchased from other Oregon businesses.
DEAN RUNYAN ASSOCIATES PAGE 7
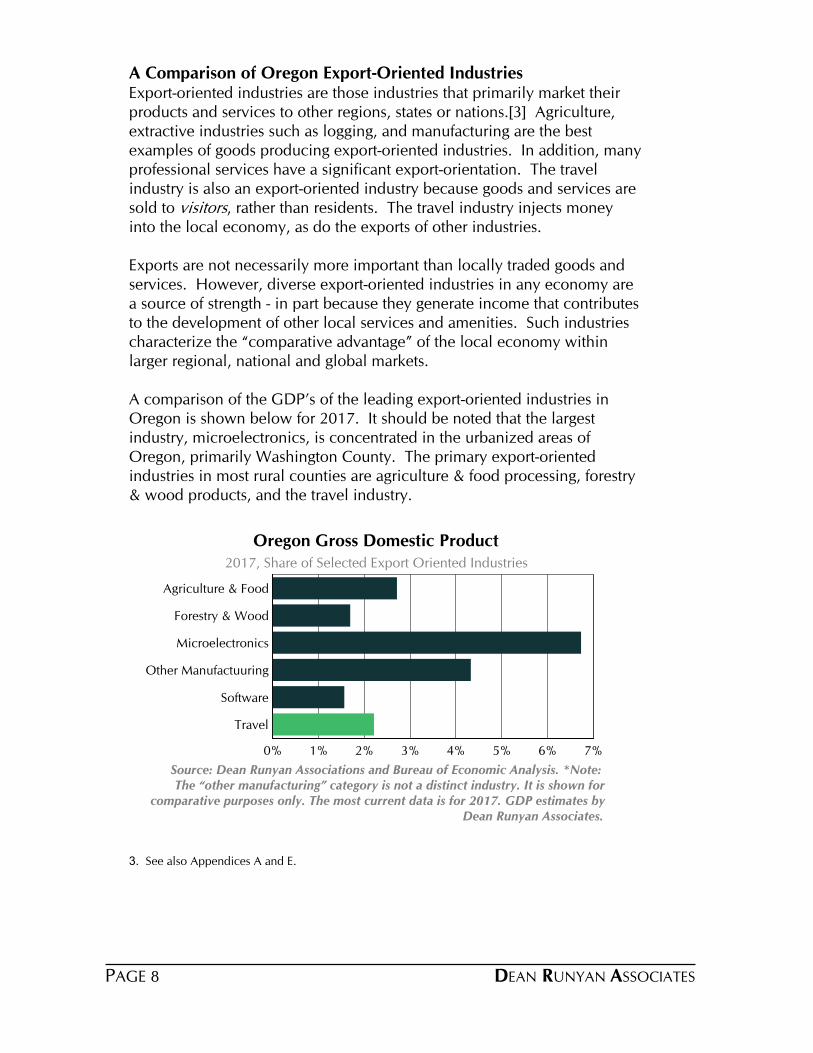
A Comparison of Oregon Export-Oriented IndustriesExport-oriented industries are those industries that primarily market their products and services to other regions, states or nations.[3] Agriculture, extractive industries such as logging, and manufacturing are the best examples of goods producing export-oriented industries. In addition, many professional services have a significant export-orientation. The travel industry is also an export-oriented industry because goods and services are sold to visitors, rather than residents. The travel industry injects money into the local economy, as do the exports of other industries. Exports are not necessarily more important than locally traded goods and services. However, diverse export-oriented industries in any economy are a source of strength - in part because they generate income that contributes to the development of other local services and amenities. Such industries characterize the “comparative advantage” of the local economy within larger regional, national and global markets. A comparison of the GDP’s of the leading export-oriented industries in Oregon is shown below for 2017. It should be noted that the largest industry, microelectronics, is concentrated in the urbanized areas of Oregon, primarily Washington County. The primary export-oriented industries in most rural counties are agriculture & food processing, forestry & wood products, and the travel industry.
0% 1% 2% 3% 4% 5% 6% 7%
Agriculture & Food
Forestry & Wood
Microelectronics
Other Manufactuuring
Software
Travel
Oregon Gross Domestic Product2017, Share of Selected Export Oriented Industries
Source: Dean Runyan Associations and Bureau of Economic Analysis. *Note: The “other manufacturing” category is not a distinct industry. It is shown for
comparative purposes only. The most current data is for 2017. GDP estimates byDean Runyan Associates.
3. See also Appendices A and E.
DEAN RUNYAN ASSOCIATESPAGE 8
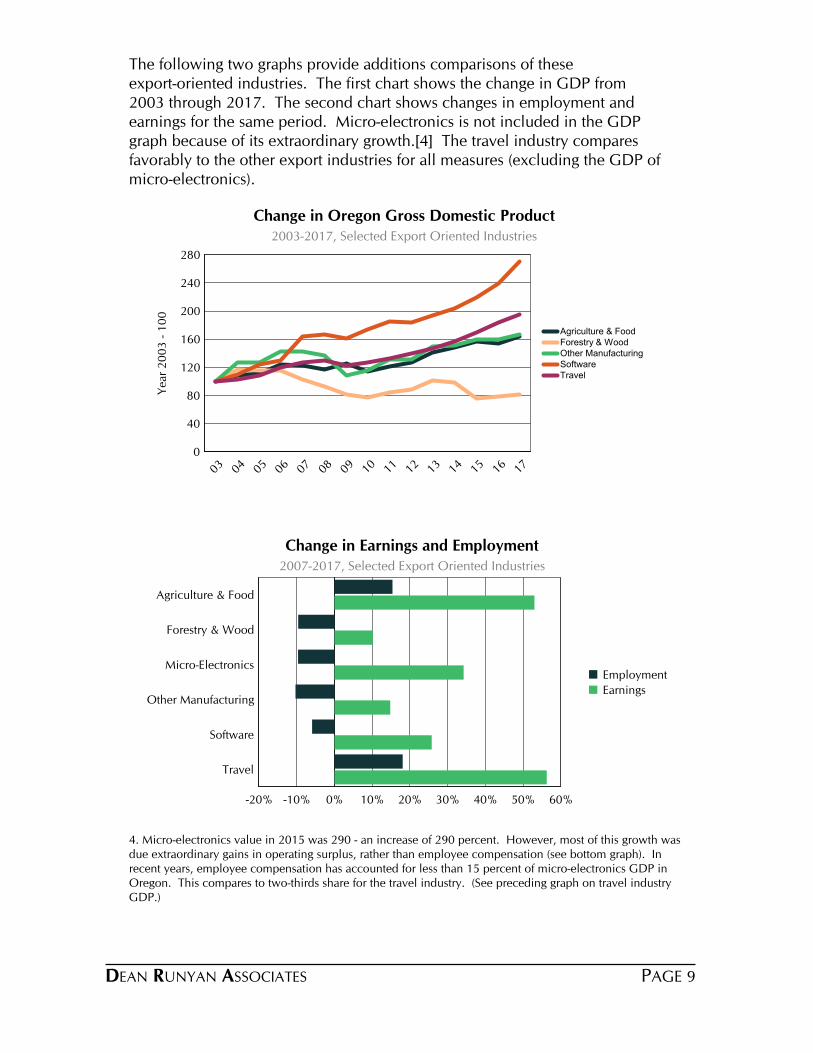
The following two graphs provide additions comparisons of these export-oriented industries. The first chart shows the change in GDP from 2003 through 2017. The second chart shows changes in employment and earnings for the same period. Micro-electronics is not included in the GDP graph because of its extraordinary growth.[4] The travel industry compares favorably to the other export industries for all measures (excluding the GDP of micro-electronics).
0
40
80
120
160
200
240
280
03 04 05 06 07 08 09 10 11 12 13 14 15 16 17
Agriculture & FoodForestry & WoodOther ManufacturingSoftwareTravel
Yea
r 2
00
3 -
10
0
Change in Oregon Gross Domestic Product2003-2017, Selected Export Oriented Industries
-20% -10% 0% 10% 20% 30% 40% 50% 60%
Agriculture & Food
Forestry & Wood
Micro-Electronics
Other Manufacturing
Software
Travel
Employment
Earnings
Change in Earnings and Employment2007-2017, Selected Export Oriented Industries
4. Micro-electronics value in 2015 was 290 - an increase of 290 percent. However, most of this growth was due extraordinary gains in operating surplus, rather than employee compensation (see bottom graph). In recent years, employee compensation has accounted for less than 15 percent of micro-electronics GDP in Oregon. This compares to two-thirds share for the travel industry. (See preceding graph on travel industry GDP.)
DEAN RUNYAN ASSOCIATES PAGE 9
Direct, Secondary and Total ImpactsTravel spending within Oregon brings money into many Oregon communities in
the form of business receipts. Portions of these receipts are spent within the state
for labor and supplies. Employees, in turn, spend a portion of their earnings on
goods and services in the state. This re-spending of travel-related revenues creates
indirect and induced impacts. To summarize:
· Direct impacts represent the employment and earnings attributable to travel
expenditures made directly by travelers at businesses throughout the state.
· Indirect impacts represent the employment and earnings associated with
industries that supply goods and services to the direct businesses (i.e., those
that receive money directly from travelers throughout the state).
· Induced impacts represent the employment and earnings that result from
purchases for food, housing, transportation, recreation, and other goods and
services made by travel industry employees, and the employees of the
indirectly affected industries.
The impacts in this section are presented in terms of the employment and earnings of eleven major industry groups. These industry groups are similar, but not identical to the business service (or commodity) categories presented elsewhere in this report. (The specific industries that comprise these major groups are listed in Appendix D.) Direct travel impacts, such as those discussed in the first part of this section and the regional and county impacts presented elsewhere in this report are found in the following industry groups:
· Accommodations & Food Services· Arts, Entertainment and Recreation· Trade· Transportation
As is indicated in the following tables and graphs, the total direct employment and earnings of these four industry groups is identical to the total direct employment and earnings shown in the first part of this section. The only difference is that these industry groups represent industry groupings (firms) rather than commodity or business service groupings. The indirect and induced impacts of travel spending are found in all thirteen industry groupings shown in the following tables and graphs. To summarize the primary secondary impacts:
DEAN RUNYAN ASSOCIATESPAGE 10
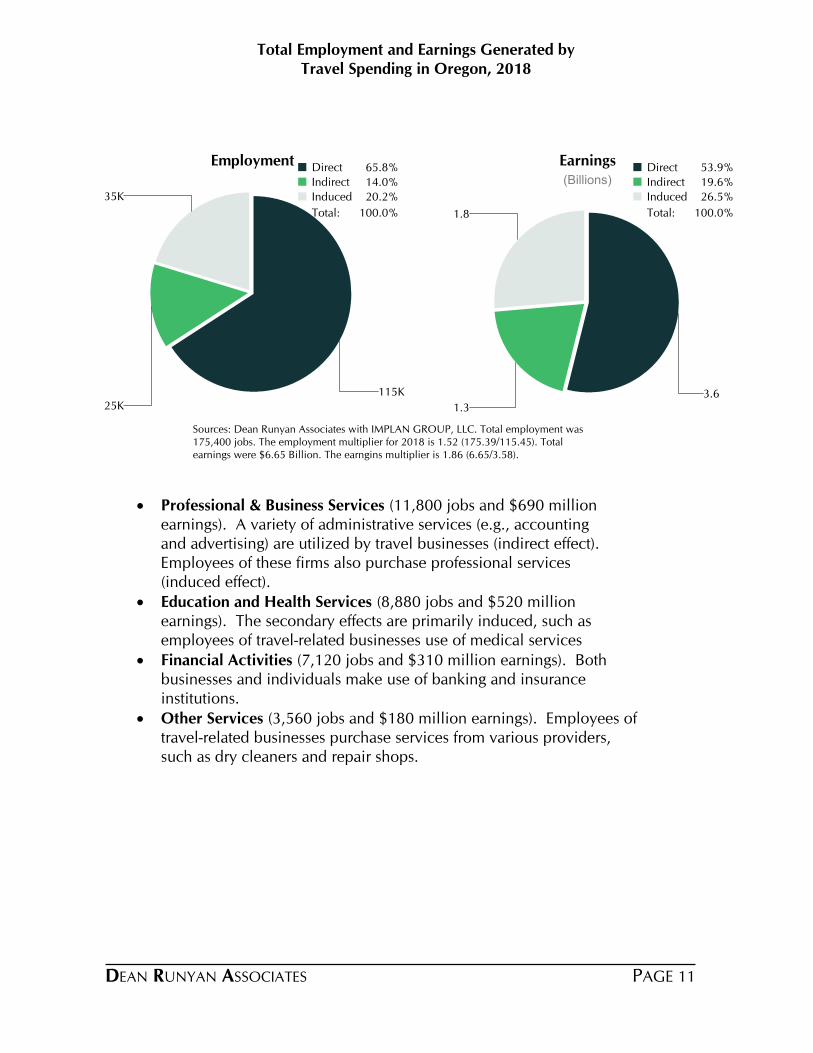
Total Employment and Earnings Generated byTravel Spending in Oregon, 2018
115K25K
35K
Direct 65.8%
Indirect 14.0%
Induced 20.2%
Total: 100.0%
Employment
3.61.3
1.8
Direct 53.9%
Indirect 19.6%
Induced 26.5%
Total: 100.0%
Earnings(Billions)
Sources: Dean Runyan Associates with IMPLAN GROUP, LLC. Total employment was 175,400 jobs. The employment multiplier for 2018 is 1.52 (175.39/115.45). Total earnings were $6.65 Billion. The earngins multiplier is 1.86 (6.65/3.58).
· Professional & Business Services (11,800 jobs and $690 million earnings). A variety of administrative services (e.g., accounting and advertising) are utilized by travel businesses (indirect effect). Employees of these firms also purchase professional services (induced effect).
· Education and Health Services (8,880 jobs and $520 million earnings). The secondary effects are primarily induced, such as employees of travel-related businesses use of medical services
· Financial Activities (7,120 jobs and $310 million earnings). Both businesses and individuals make use of banking and insurance institutions.
· Other Services (3,560 jobs and $180 million earnings). Employees of travel-related businesses purchase services from various providers, such as dry cleaners and repair shops.
DEAN RUNYAN ASSOCIATES PAGE 11
0K 10K 20K 30K 40K 50K 60K 70K 80K 90K
Accommodation & Food Services
Arts, Entertainment & Recreation
Construction
Education and Health Services
Financial Activities
Information
Manufacturing & Utilities
Natural Resources & Mining
Other Services
Professional & Business Services
Public Administration
Trade
Transportation
Direct
Secondary
Direct and Secondary Employment
Generated by Travel Spending in Oregon, 2018
0 0.4 0.8 1.2 1.6 2 2.4
Accommodation & Food Services
Arts, Entertainment & Recreation
Construction
Education and Health Services
Financial Activities
Information
Manufacturing & Utilities
Natural Resources & Mining
Other Services
Professional & Business Services
Public Administration
Trade
Transportation
Direct
Secondary
Direct and Secondary Earnings
Generated by Travel Spending in Oregon, 2018
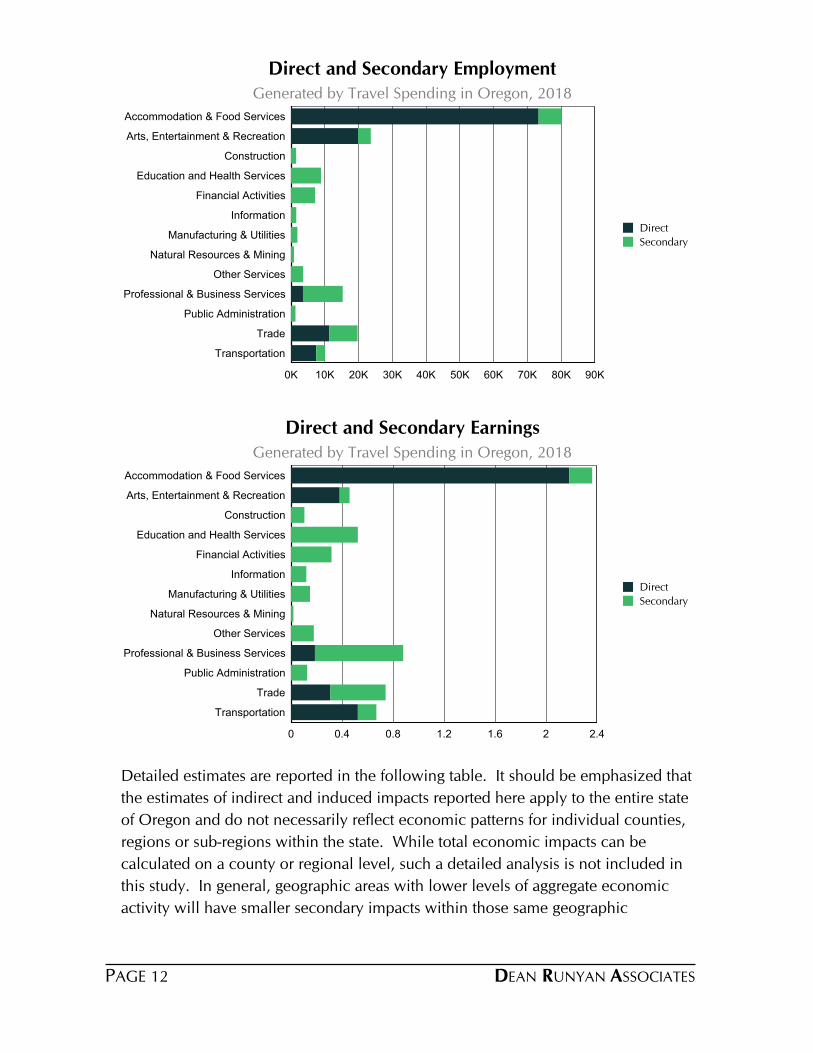
Detailed estimates are reported in the following table. It should be emphasized that
the estimates of indirect and induced impacts reported here apply to the entire state
of Oregon and do not necessarily reflect economic patterns for individual counties,
regions or sub-regions within the state. While total economic impacts can be
calculated on a county or regional level, such a detailed analysis is not included in
this study. In general, geographic areas with lower levels of aggregate economic
activity will have smaller secondary impacts within those same geographic
DEAN RUNYAN ASSOCIATESPAGE 12
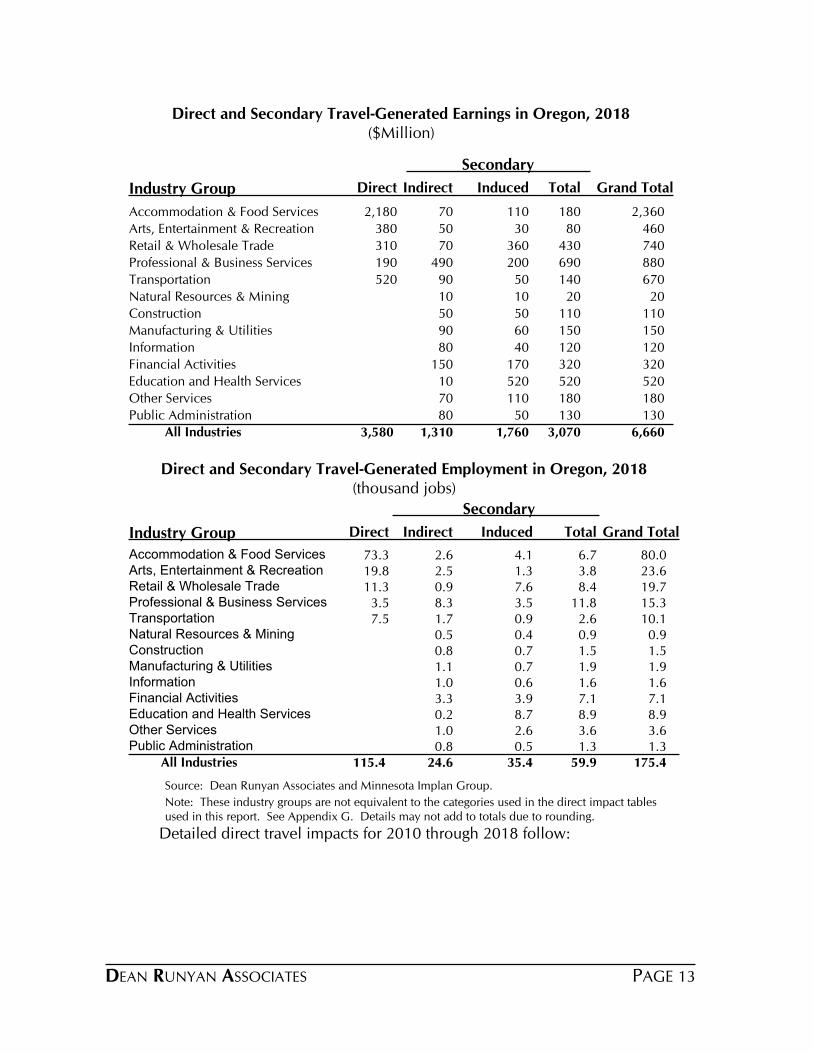
Direct and Secondary Travel-Generated Earnings in Oregon, 2018($Million)
Direct Grand TotalIndirect Induced Total
Secondary
Industry Group
2,180 2,360 70 110 180Accommodation & Food Services
380 460 50 30 80Arts, Entertainment & Recreation
310 740 70 360 430Retail & Wholesale Trade
190 880 490 200 690Professional & Business Services
520 670 90 50 140Transportation
20 10 10 20Natural Resources & Mining
110 50 50 110Construction
150 90 60 150Manufacturing & Utilities
120 80 40 120Information
320 150 170 320Financial Activities
520 10 520 520Education and Health Services
180 70 110 180Other Services
130 80 50 130Public Administration
3,580All Industries 1,310 1,760 3,070 6,660
Direct and Secondary Travel-Generated Employment in Oregon, 2018(thousand jobs)
Direct Indirect Induced Total Grand Total
Secondary
Industry Group
73.3 2.6 4.1 6.7 80.0Accommodation & Food Services 19.8 2.5 1.3 3.8 23.6Arts, Entertainment & Recreation 11.3 0.9 7.6 8.4 19.7Retail & Wholesale Trade
3.5 8.3 3.5 11.8 15.3Professional & Business Services 7.5 1.7 0.9 2.6 10.1Transportation
0.5 0.4 0.9 0.9Natural Resources & Mining 0.8 0.7 1.5 1.5Construction 1.1 0.7 1.9 1.9Manufacturing & Utilities 1.0 0.6 1.6 1.6Information 3.3 3.9 7.1 7.1Financial Activities 0.2 8.7 8.9 8.9Education and Health Services 1.0 2.6 3.6 3.6Other Services 0.8 0.5 1.3 1.3Public Administration
Source: Dean Runyan Associates and Minnesota Implan Group.
Note: These industry groups are not equivalent to the categories used in the direct impact tables used in this report. See Appendix G. Details may not add to totals due to rounding.
Detailed direct travel impacts for 2010 through 2018 follow:
115.4 24.6 35.4 59.9 175.4All Industries
DEAN RUNYAN ASSOCIATES PAGE 13
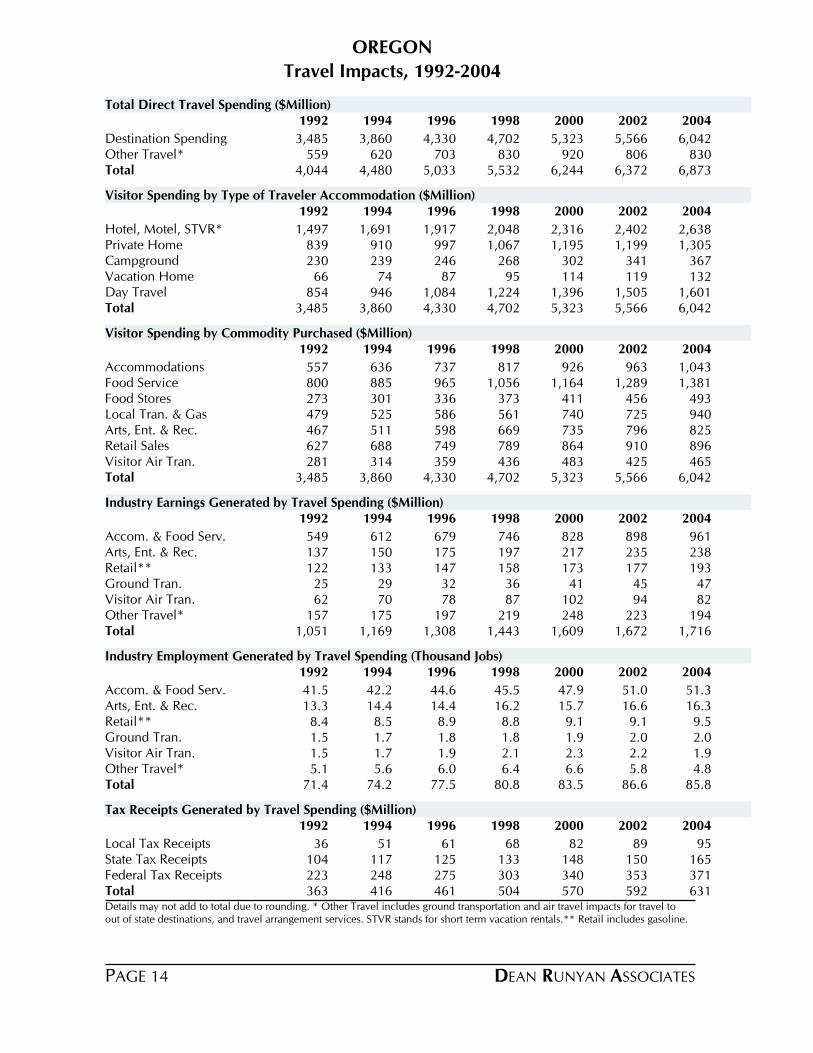
OREGON
Travel Impacts, 1992-2004
1992 1994 1996 1998 2000 2002 2004
Destination Spending 3,485 3,860 4,330 4,702 5,323 5,566 6,042Other Travel* 559 620 703 830 920 806 830Total 4,044 4,480 5,033 5,532 6,244 6,372 6,873
Total Direct Travel Spending ($Million)
1992 1994 1996 1998 2000 2002 2004
Hotel, Motel, STVR* 1,497 1,691 1,917 2,048 2,316 2,402 2,638Private Home 839 910 997 1,067 1,195 1,199 1,305Campground 230 239 246 268 302 341 367Vacation Home 66 74 87 95 114 119 132Day Travel 854 946 1,084 1,224 1,396 1,505 1,601Total 3,485 3,860 4,330 4,702 5,323 5,566 6,042
Visitor Spending by Type of Traveler Accommodation ($Million)
1992 1994 1996 1998 2000 2002 2004
Accommodations 557 636 737 817 926 963 1,043Food Service 800 885 965 1,056 1,164 1,289 1,381Food Stores 273 301 336 373 411 456 493Local Tran. & Gas 479 525 586 561 740 725 940Arts, Ent. & Rec. 467 511 598 669 735 796 825Retail Sales 627 688 749 789 864 910 896Visitor Air Tran. 281 314 359 436 483 425 465Total 3,485 3,860 4,330 4,702 5,323 5,566 6,042
Visitor Spending by Commodity Purchased ($Million)
1992 1994 1996 1998 2000 2002 2004
Accom. & Food Serv. 549 612 679 746 828 898 961Arts, Ent. & Rec. 137 150 175 197 217 235 238Retail** 122 133 147 158 173 177 193Ground Tran. 25 29 32 36 41 45 47Visitor Air Tran. 62 70 78 87 102 94 82Other Travel* 157 175 197 219 248 223 194Total 1,051 1,169 1,308 1,443 1,609 1,672 1,716
Industry Earnings Generated by Travel Spending ($Million)
1992 1994 1996 1998 2000 2002 2004
Accom. & Food Serv. 41.5 42.2 44.6 45.5 47.9 51.0 51.3Arts, Ent. & Rec. 13.3 14.4 14.4 16.2 15.7 16.6 16.3Retail** 8.4 8.5 8.9 8.8 9.1 9.1 9.5Ground Tran. 1.5 1.7 1.8 1.8 1.9 2.0 2.0Visitor Air Tran. 1.5 1.7 1.9 2.1 2.3 2.2 1.9Other Travel* 5.1 5.6 6.0 6.4 6.6 5.8 4.8Total 71.4 74.2 77.5 80.8 83.5 86.6 85.8
Industry Employment Generated by Travel Spending (Thousand Jobs)
1992 1994 1996 1998 2000 2002 2004
Local Tax Receipts 36 51 61 68 82 89 95State Tax Receipts 104 117 125 133 148 150 165Federal Tax Receipts 223 248 275 303 340 353 371Total 363 416 461 504 570 592 631
Tax Receipts Generated by Travel Spending ($Million)
Details may not add to total due to rounding. * Other Travel includes ground transportation and air travel impacts for travel to out of state destinations, and travel arrangement services. STVR stands for short term vacation rentals.** Retail includes gasoline.
DEAN RUNYAN ASSOCIATESPAGE 14
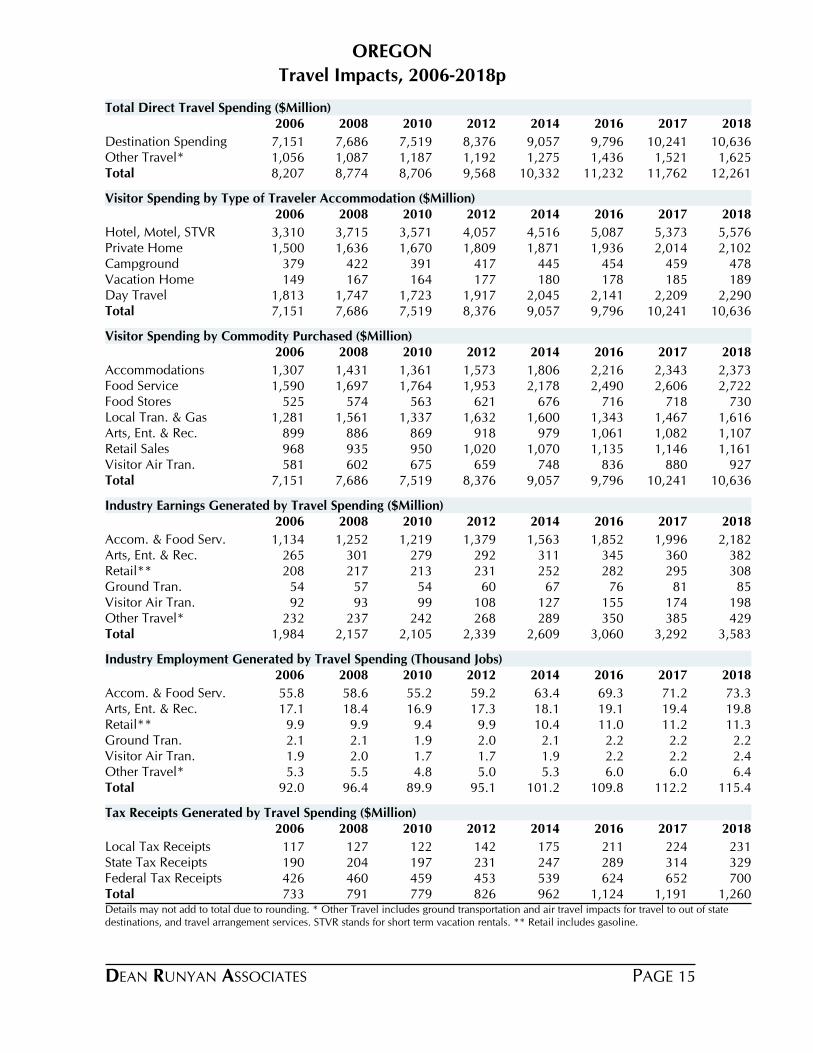
OREGON
Travel Impacts, 2006-2018p
2006 2008 2010 2012 2014 2016 2017 2018
Destination Spending 7,151 7,686 7,519 8,376 9,057 9,796 10,241 10,636Other Travel* 1,056 1,087 1,187 1,192 1,275 1,436 1,521 1,625Total 8,207 8,774 8,706 9,568 10,332 11,232 11,762 12,261
Total Direct Travel Spending ($Million)
2006 2008 2010 2012 2014 2016 2017 2018
Hotel, Motel, STVR 3,310 3,715 3,571 4,057 4,516 5,087 5,373 5,576Private Home 1,500 1,636 1,670 1,809 1,871 1,936 2,014 2,102Campground 379 422 391 417 445 454 459 478Vacation Home 149 167 164 177 180 178 185 189Day Travel 1,813 1,747 1,723 1,917 2,045 2,141 2,209 2,290Total 7,151 7,686 7,519 8,376 9,057 9,796 10,241 10,636
Visitor Spending by Type of Traveler Accommodation ($Million)
2006 2008 2010 2012 2014 2016 2017 2018
Accommodations 1,307 1,431 1,361 1,573 1,806 2,216 2,343 2,373Food Service 1,590 1,697 1,764 1,953 2,178 2,490 2,606 2,722Food Stores 525 574 563 621 676 716 718 730Local Tran. & Gas 1,281 1,561 1,337 1,632 1,600 1,343 1,467 1,616Arts, Ent. & Rec. 899 886 869 918 979 1,061 1,082 1,107Retail Sales 968 935 950 1,020 1,070 1,135 1,146 1,161Visitor Air Tran. 581 602 675 659 748 836 880 927Total 7,151 7,686 7,519 8,376 9,057 9,796 10,241 10,636
Visitor Spending by Commodity Purchased ($Million)
2006 2008 2010 2012 2014 2016 2017 2018
Accom. & Food Serv. 1,134 1,252 1,219 1,379 1,563 1,852 1,996 2,182Arts, Ent. & Rec. 265 301 279 292 311 345 360 382Retail** 208 217 213 231 252 282 295 308Ground Tran. 54 57 54 60 67 76 81 85Visitor Air Tran. 92 93 99 108 127 155 174 198Other Travel* 232 237 242 268 289 350 385 429Total 1,984 2,157 2,105 2,339 2,609 3,060 3,292 3,583
Industry Earnings Generated by Travel Spending ($Million)
2006 2008 2010 2012 2014 2016 2017 2018
Accom. & Food Serv. 55.8 58.6 55.2 59.2 63.4 69.3 71.2 73.3Arts, Ent. & Rec. 17.1 18.4 16.9 17.3 18.1 19.1 19.4 19.8Retail** 9.9 9.9 9.4 9.9 10.4 11.0 11.2 11.3Ground Tran. 2.1 2.1 1.9 2.0 2.1 2.2 2.2 2.2Visitor Air Tran. 1.9 2.0 1.7 1.7 1.9 2.2 2.2 2.4Other Travel* 5.3 5.5 4.8 5.0 5.3 6.0 6.0 6.4Total 92.0 96.4 89.9 95.1 101.2 109.8 112.2 115.4
Industry Employment Generated by Travel Spending (Thousand Jobs)
2006 2008 2010 2012 2014 2016 2017 2018
Local Tax Receipts 117 127 122 142 175 211 224 231State Tax Receipts 190 204 197 231 247 289 314 329Federal Tax Receipts 426 460 459 453 539 624 652 700Total 733 791 779 826 962 1,124 1,191 1,260
Tax Receipts Generated by Travel Spending ($Million)
Details may not add to total due to rounding. * Other Travel includes ground transportation and air travel impacts for travel to out of state destinations, and travel arrangement services. STVR stands for short term vacation rentals. ** Retail includes gasoline.
DEAN RUNYAN ASSOCIATES PAGE 15
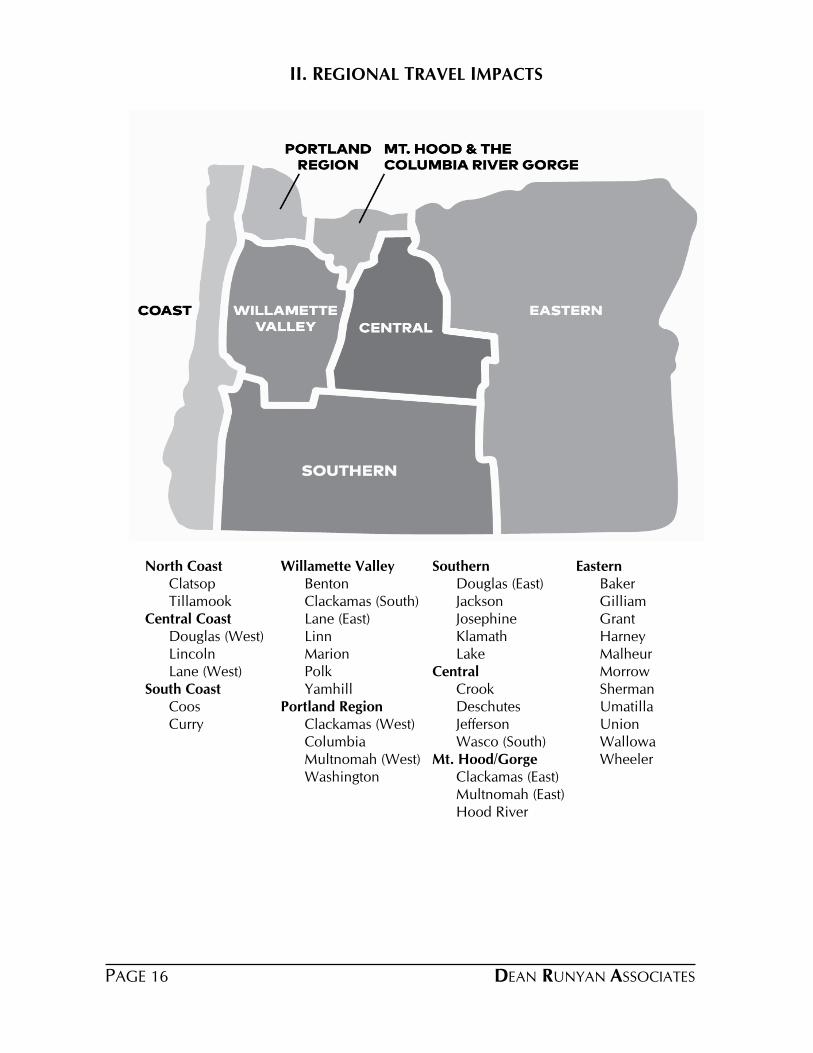
II. REGIONAL TRAVEL IMPACTS
North CoastClatsopTillamook
Central CoastDouglas (West)LincolnLane (West)
South CoastCoosCurry
Willamette ValleyBentonClackamas (South)Lane (East)LinnMarionPolkYamhill
Portland RegionClackamas (West)ColumbiaMultnomah (West)Washington
SouthernDouglas (East)JacksonJosephineKlamathLake
CentralCrookDeschutesJeffersonWasco (South)
Mt. Hood/GorgeClackamas (East)Multnomah (East)Hood River
EasternBakerGilliamGrantHarneyMalheurMorrowShermanUmatillaUnionWallowaWheeler
DEAN RUNYAN ASSOCIATESPAGE 16
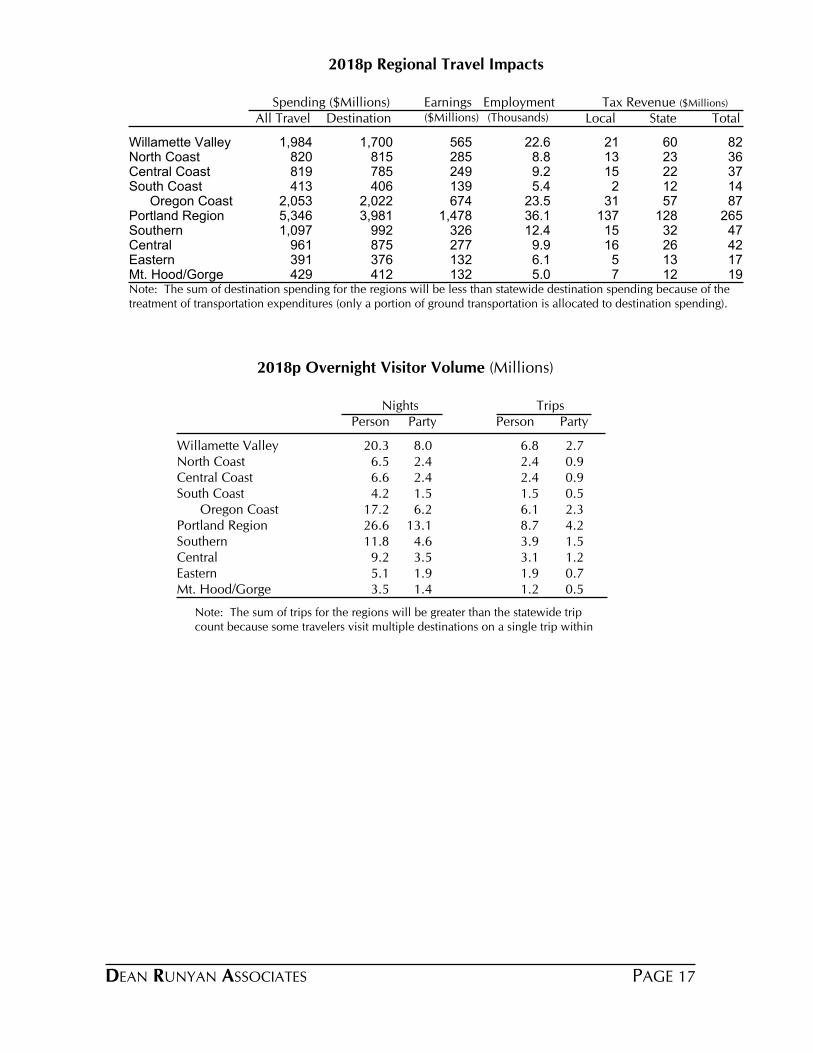
2018p Regional Travel Impacts
TotalStateLocalTax Revenue ($Millions)Employment
($Millions)Earnings
DestinationAll TravelSpending ($Millions)
(Thousands)
Willamette Valley 1,984 1,700 565 22.6 21 60 82North Coast 820 815 285 8.8 13 23 36Central Coast 819 785 249 9.2 15 22 37South Coast 413 406 139 5.4 2 12 14
Oregon Coast 2,053 2,022 674 23.5 31 57 87Portland Region 5,346 3,981 1,478 36.1 137 128 265Southern 1,097 992 326 12.4 15 32 47Central 961 875 277 9.9 16 26 42Eastern 391 376 132 6.1 5 13 17Mt. Hood/Gorge 429 412 132 5.0 7 12 19Note: The sum of destination spending for the regions will be less than statewide destination spending because of the treatment of transportation expenditures (only a portion of ground transportation is allocated to destination spending).
2018p Overnight Visitor Volume (Millions)
PersonPerson Party PartyNights Trips
Willamette Valley 20.3 8.0 6.8 2.7North Coast 6.5 2.4 2.4 0.9Central Coast 6.6 2.4 2.4 0.9South Coast 4.2 1.5 1.5 0.5
Oregon Coast 17.2 6.2 6.1 2.3Portland Region 26.6 13.1 8.7 4.2Southern 11.8 4.6 3.9 1.5Central 9.2 3.5 3.1 1.2Eastern 5.1 1.9 1.9 0.7Mt. Hood/Gorge 3.5 1.4 1.2 0.5
Note: The sum of trips for the regions will be greater than the statewide trip count because some travelers visit multiple destinations on a single trip within
DEAN RUNYAN ASSOCIATES PAGE 17
Central Oregon Travel Impacts and Visitor Volume
Travel Indicators
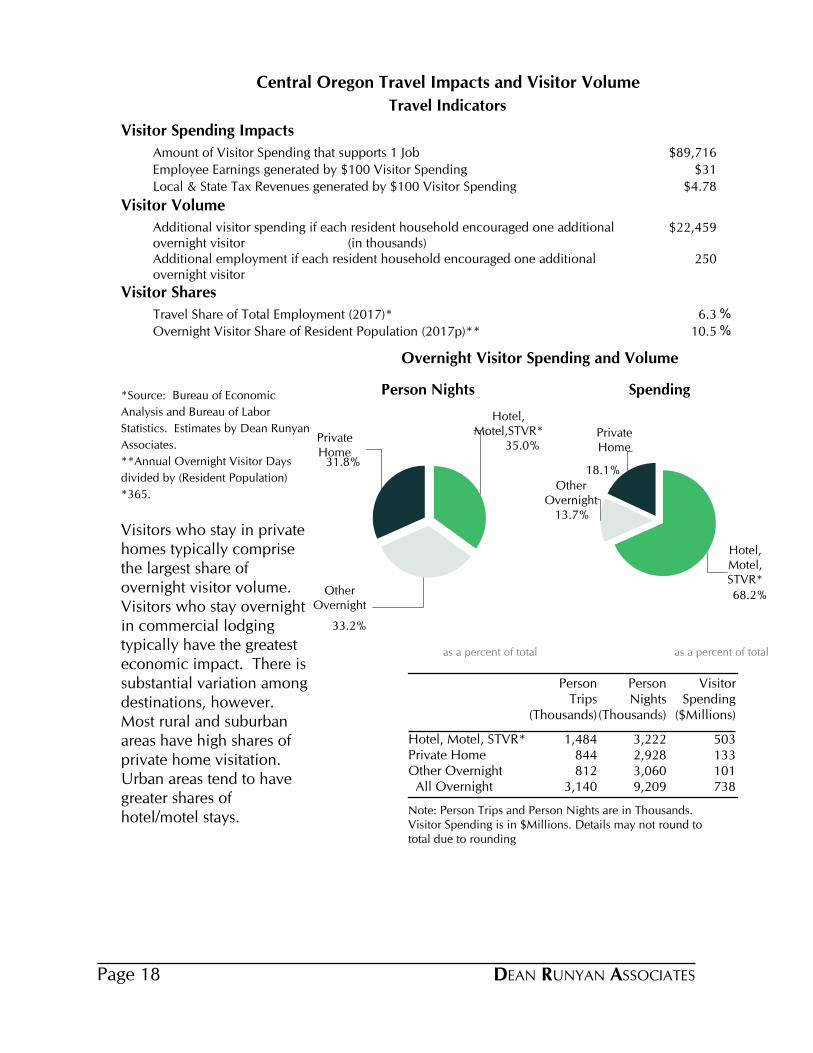
Visitor Spending Impacts
Amount of Visitor Spending that supports 1 Job $89,716
Employee Earnings generated by $100 Visitor Spending $31
Local & State Tax Revenues generated by $100 Visitor Spending $4.78
Visitor Volume
Additional visitor spending if each resident household encouraged one additional overnight visitor (in thousands)
$22,459
Additional employment if each resident household encouraged one additional overnight visitor
250
Visitor Shares
Travel Share of Total Employment (2017)* 6.3%
Overnight Visitor Share of Resident Population (2017p)** 10.5%
*Source: Bureau of Economic
Analysis and Bureau of Labor
Statistics. Estimates by Dean Runyan
Associates.
**Annual Overnight Visitor Days
divided by (Resident Population)
*365.
Visitors who stay in private homes typically comprise the largest share of overnight visitor volume. Visitors who stay overnight in commercial lodging typically have the greatest economic impact. There is substantial variation among destinations, however. Most rural and suburban areas have high shares of private home visitation. Urban areas tend to have greater shares of hotel/motel stays.
Note: Person Trips and Person Nights are in Thousands. Visitor Spending is in $Millions. Details may not round to total due to rounding
Person Trips
(Thousands)
Person Nights
(Thousands)
Visitor Spending
($Millions)
Hotel, Motel, STVR* 1,484 3,222 503Private Home 844 2,928 133Other Overnight 812 3,060 101 All Overnight 3,140 9,209 738
35.0%
Hotel,Motel,STVR*
33.2%
OtherOvernight
31.8%
PrivateHome
Person Nights
as a percent of total
68.2%
Hotel,Motel,STVR*
13.7%
OtherOvernight
18.1%
PrivateHome
Spending
as a percent of total
Overnight Visitor Spending and Volume
DEAN RUNYAN ASSOCIATESPage 18

Direct Travel Impacts, 2010-2018p
Central Oregon
Avg. Annual Chg.
Spending ($M) 2010 2012 2014 2016 2017 2018 17-18 10-18Total (Current $) 617 674 749 853 902 961 6.5% 5.7% Other 59 52 57 63 72 86 19.8% 4.7% Visitor 557 622 692 789 831 875 5.4% 5.8% Non-transportation 461 515 583 686 712 741 4.0% 6.1% Transportation 96 107 109 103 118 135 13.8% 4.2%
Earnings ($M)Earnings (Current $) 146 163 193 232 250 277 10.8% 8.3%
Employment (Jobs)Employment 7,020 7,510 8,370 9,260 9,400 9,920 5.6% 4.4%
Tax Revenue ($M)Total (Current $) 22 26 30 37 40 42 5.4% 8.3% Local 8 9 11 14 15 16 4.2% 8.8% State 14 17 19 23 25 26 6.1% 8.1%
Other spending includes resident air travel, travel arrangement and reservation services, and convention and trade show organizers. Non-transportation visitor spending includes accommodations, food services, retail, food stores, and arts, entertainment & recreation. Visitor transportation spending includes private auto, auto rental, other local ground transportation and one-way airfares.Earnings include wages & salaries, earned benefits and proprietor income.Employment includes all full- and part-time employment of payroll employees and proprietors.Local tax revenue includes lodging taxes, auto rental taxes and airport passenger facility charges paid by visitors.State tax revenue includes lodging, and motor fuel tax payments of visitors, and the income tax payments attributable to the travel industry income of businesses and employees.Federal tax revenue includes motor fuel excise taxes and airline ticket taxes paid by visitors, and the payroll and income taxes attributable to the travel industry income of employees and businesses.
DEAN RUNYAN ASSOCIATES Page 19

Travel Impacts, 2006-2018p
Central Oregon
2006 2008 2010 2012 2014 2016 2017 2018
Destination Spending 526.2 572.9 557.3 621.7 692.1 789.3 830.5 875.4Other Travel* 43.6 49.1 59.3 52.0 56.5 63.2 71.6 85.8Total 569.8 622.1 616.6 673.7 748.6 852.5 902.2 961.2
Total Direct Travel Spending ($Million)
2006 2008 2010 2012 2014 2016 2017 2018
Accommodations 133.3 138.1 131.2 150.0 179.7 227.5 239.9 246.6Food Service 125.5 139.2 141.9 160.0 181.5 214.8 224.9 238.9Food Stores 46.3 52.1 49.7 55.4 60.9 66.0 66.5 68.3Local Tran. & Gas 66.4 84.2 69.9 87.9 85.5 71.7 79.4 89.1Arts, Ent. & Rec. 67.3 69.9 67.5 73.0 79.2 88.8 90.9 94.4Retail Sales 69.8 70.9 70.5 76.6 81.4 88.9 90.1 92.6Visitor Air Tran. 17.6 18.6 26.5 18.7 23.9 31.6 38.8 45.4Total 526.2 572.9 557.3 621.7 692.1 789.3 830.5 875.4
Visitor Spending By Commodity Purchased ($Million)
2006 2008 2010 2012 2014 2016 2017 2018
Accom. & Food Serv. 96.5 107.1 102.1 115.3 137.0 167.6 181.9 201.7Arts, Ent. & Rec. 20.1 24.1 21.9 23.5 29.0 32.4 34.0 38.4Retail** 15.4 16.8 16.1 17.7 19.5 22.4 23.5 24.9Ground Tran. 2.0 2.2 2.1 2.4 2.8 3.4 3.6 3.9Visitor Air Tran. 0.6 0.6 0.6 0.6 0.8 1.0 1.1 1.2Other Travel* 3.1 3.5 3.5 3.7 4.0 5.6 5.8 6.7Total 137.7 154.3 146.3 163.2 193.0 232.3 249.9 276.8
Industry Earnings Generated by Travel Spending ($Million)
2006 2008 2010 2012 2014 2016 2017 2018
Accom. & Food Serv. 4,540 4,950 4,710 4,990 5,570 6,220 6,320 6,650Arts, Ent. & Rec. 1,230 1,530 1,400 1,540 1,760 1,890 1,930 2,080Retail** 750 760 720 770 830 870 880 910Ground Tran. 70 70 70 80 80 90 100 100Visitor Air Tran. 20 20 20 20 20 30 30 30Other Travel* 110 110 100 100 110 160 150 170Total 6,720 7,450 7,020 7,510 8,370 9,260 9,400 9,920
Industry Employment Generated by Travel Spending (Jobs)
2006 2008 2010 2012 2014 2016 2017 2018
Local Tax Receipts 9.5 8.4 7.9 9.0 11.0 14.1 15.0 15.6State Tax Receipts 13.6 14.9 14.1 16.7 18.6 22.6 24.7 26.2Total 23.1 23.2 22.0 25.7 29.6 36.7 39.7 41.8
Tax Receipts Generated by Travel Spending ($Million)
Details may not add to total due to rounding. * Other Travel includes ground transportation and air travel impacts for travel to other Oregon visitor destinations and travel arrangement services.** Retail includes gasoline.Federal tax receipts not included.
DEAN RUNYAN ASSOCIATESPage 20

Central Oregon Visitor Spending and Visitor Volume
Visitor Spending by Type of Traveler Accommodation ($Million), 2018p
2008 2010 2012 2014 2017 2018
Total Destination Spending 573 557 622 692 831 875All Overnight 476 463 515 577 700 738
Hotel, Motel, STVR* 297 286 328 378 477 503
Private Home 91 93 98 105 124 133
Other Overnight 89 83 89 94 99 101
Day Travel 97 95 107 115 131 138
Day Travel 97 95 107 115 131 138
Average Expenditures for Overnight Visitors, 2018p
Travel Party PersonParty Length of
Day Trip Day Trip Size Stay (Nights)
$374 $818 $156 $339Hotel, Motel, STVR* 2.4 2.2
$110 $393 $46 $158Private Home 2.4 3.6
$108 $406 $33 $125Other Overnight 3.3 3.8
$211 $613 $80 $235 All Overnight 2.6 2.9
Overnight Visitor Volume, 2016-2018p
Person-Nights (000) Party-Nights (000)
2016 2017 2018 2016 2017 2018
Hotel, Motel, STVR* 3,077 3,100 3,222 1,279 1,293 1,348
Private Home 2,834 2,871 2,928 1,151 1,180 1,215
Other Overnight 3,038 3,058 3,060 932 940 939
All Overnight 8,948 9,029 9,209 3,362 3,414 3,502
Person-Trips (000) Party-Trips (000)
2016 2017 2018 2016 2017 2018
Hotel, Motel, STVR* 1,417 1,428 1,484 585 591 616
Private Home 816 827 844 324 330 339
Other Overnight 806 811 812 247 249 249
All Overnight 3,039 3,066 3,140 1,156 1,171 1,203
"Hotel, Motel, STVR" category includes all lodging where a lodging tax is collected except campgrounds. "Other Overnight" category includes campgrounds and vacation homes.
DEAN RUNYAN ASSOCIATES Page 21
Central Coast Travel Impacts and Visitor Volume
Travel Indicators
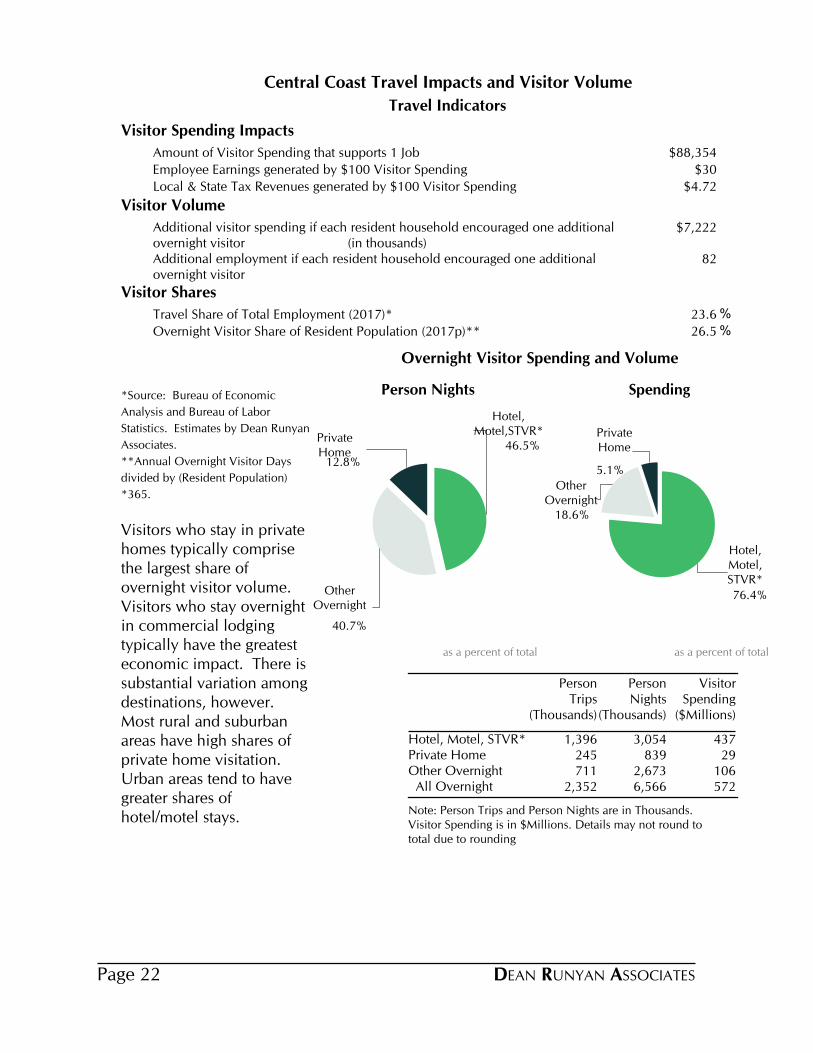
Visitor Spending Impacts
Amount of Visitor Spending that supports 1 Job $88,354
Employee Earnings generated by $100 Visitor Spending $30
Local & State Tax Revenues generated by $100 Visitor Spending $4.72
Visitor Volume
Additional visitor spending if each resident household encouraged one additional overnight visitor (in thousands)
$7,222
Additional employment if each resident household encouraged one additional overnight visitor
82
Visitor Shares
Travel Share of Total Employment (2017)* 23.6%
Overnight Visitor Share of Resident Population (2017p)** 26.5%
*Source: Bureau of Economic
Analysis and Bureau of Labor
Statistics. Estimates by Dean Runyan
Associates.
**Annual Overnight Visitor Days
divided by (Resident Population)
*365.
Visitors who stay in private homes typically comprise the largest share of overnight visitor volume. Visitors who stay overnight in commercial lodging typically have the greatest economic impact. There is substantial variation among destinations, however. Most rural and suburban areas have high shares of private home visitation. Urban areas tend to have greater shares of hotel/motel stays.
Note: Person Trips and Person Nights are in Thousands. Visitor Spending is in $Millions. Details may not round to total due to rounding
Person Trips
(Thousands)
Person Nights
(Thousands)
Visitor Spending
($Millions)
Hotel, Motel, STVR* 1,396 3,054 437Private Home 245 839 29Other Overnight 711 2,673 106 All Overnight 2,352 6,566 572
46.5%
Hotel,Motel,STVR*
40.7%
OtherOvernight
12.8%
PrivateHome
Person Nights
as a percent of total
76.4%
Hotel,Motel,STVR*
18.6%
OtherOvernight
5.1%
PrivateHome
Spending
as a percent of total
Overnight Visitor Spending and Volume
DEAN RUNYAN ASSOCIATESPage 22

Direct Travel Impacts, 2010-2018p
Central Coast
Avg. Annual Chg.
Spending ($M) 2010 2012 2014 2016 2017 2018 17-18 10-18Total (Current $) 587 605 687 769 788 819 4.0% 4.3% Other 16 20 23 27 29 34 17.6% 9.8% Visitor 571 585 664 741 759 785 3.4% 4.1% Non-transportation 509 514 592 680 693 712 2.7% 4.3% Transportation 62 71 72 61 67 74 10.8% 2.2%
Earnings ($M)Earnings (Current $) 161 168 188 216 227 249 9.6% 5.6%
Employment (Jobs)Employment 7,830 7,790 8,330 8,780 8,860 9,160 3.4% 2.0%
Tax Revenue ($M)Total (Current $) 24 25 28 33 35 37 4.6% 5.6% Local 10 10 12 14 15 15 3.3% 5.3% State 14 15 16 19 21 22 5.6% 5.9%
Other spending includes resident air travel, travel arrangement and reservation services, and convention and trade show organizers. Non-transportation visitor spending includes accommodations, food services, retail, food stores, and arts, entertainment & recreation. Visitor transportation spending includes private auto, auto rental, other local ground transportation and one-way airfares.Earnings include wages & salaries, earned benefits and proprietor income.Employment includes all full- and part-time employment of payroll employees and proprietors.Local tax revenue includes lodging taxes, auto rental taxes and airport passenger facility charges paid by visitors.State tax revenue includes lodging, and motor fuel tax payments of visitors, and the income tax payments attributable to the travel industry income of businesses and employees.Federal tax revenue includes motor fuel excise taxes and airline ticket taxes paid by visitors, and the payroll and income taxes attributable to the travel industry income of employees and businesses.
DEAN RUNYAN ASSOCIATES Page 23
Travel Impacts, 2006-2018p
Central Coast
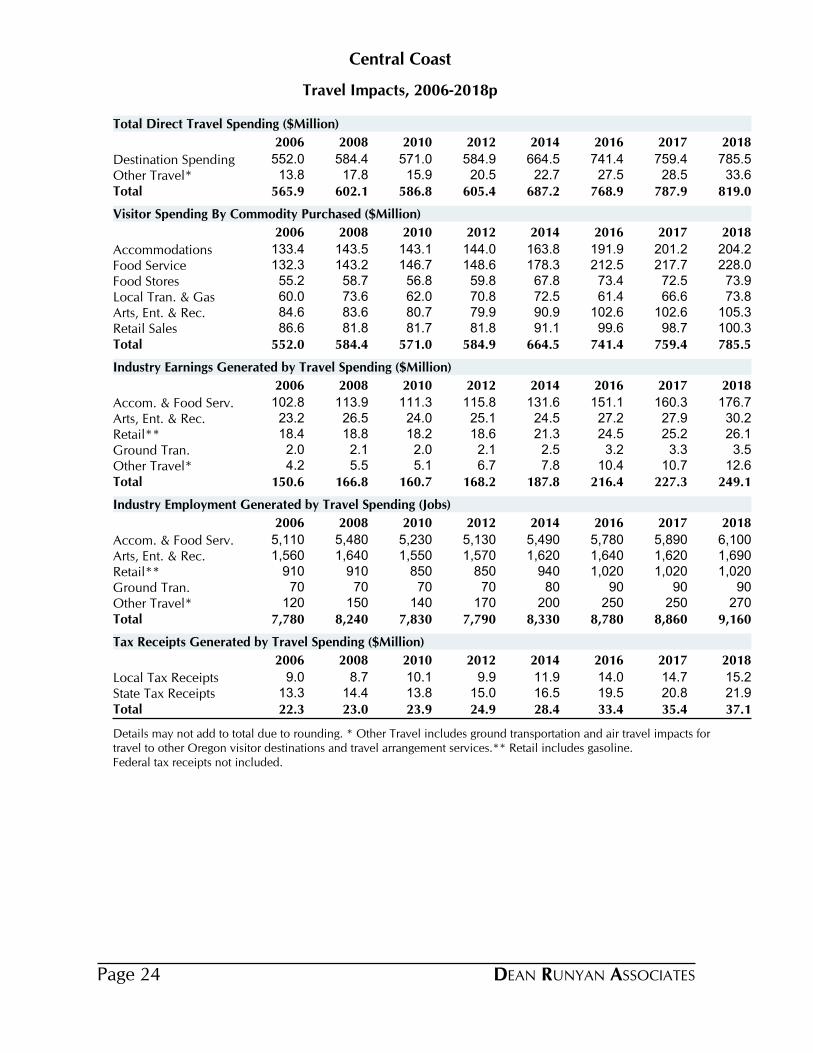
2006 2008 2010 2012 2014 2016 2017 2018
Destination Spending 552.0 584.4 571.0 584.9 664.5 741.4 759.4 785.5Other Travel* 13.8 17.8 15.9 20.5 22.7 27.5 28.5 33.6Total 565.9 602.1 586.8 605.4 687.2 768.9 787.9 819.0
Total Direct Travel Spending ($Million)
2006 2008 2010 2012 2014 2016 2017 2018
Accommodations 133.4 143.5 143.1 144.0 163.8 191.9 201.2 204.2Food Service 132.3 143.2 146.7 148.6 178.3 212.5 217.7 228.0Food Stores 55.2 58.7 56.8 59.8 67.8 73.4 72.5 73.9Local Tran. & Gas 60.0 73.6 62.0 70.8 72.5 61.4 66.6 73.8Arts, Ent. & Rec. 84.6 83.6 80.7 79.9 90.9 102.6 102.6 105.3Retail Sales 86.6 81.8 81.7 81.8 91.1 99.6 98.7 100.3Total 552.0 584.4 571.0 584.9 664.5 741.4 759.4 785.5
Visitor Spending By Commodity Purchased ($Million)
2006 2008 2010 2012 2014 2016 2017 2018
Accom. & Food Serv. 102.8 113.9 111.3 115.8 131.6 151.1 160.3 176.7Arts, Ent. & Rec. 23.2 26.5 24.0 25.1 24.5 27.2 27.9 30.2Retail** 18.4 18.8 18.2 18.6 21.3 24.5 25.2 26.1Ground Tran. 2.0 2.1 2.0 2.1 2.5 3.2 3.3 3.5Other Travel* 4.2 5.5 5.1 6.7 7.8 10.4 10.7 12.6Total 150.6 166.8 160.7 168.2 187.8 216.4 227.3 249.1
Industry Earnings Generated by Travel Spending ($Million)
2006 2008 2010 2012 2014 2016 2017 2018
Accom. & Food Serv. 5,110 5,480 5,230 5,130 5,490 5,780 5,890 6,100Arts, Ent. & Rec. 1,560 1,640 1,550 1,570 1,620 1,640 1,620 1,690Retail** 910 910 850 850 940 1,020 1,020 1,020Ground Tran. 70 70 70 70 80 90 90 90Other Travel* 120 150 140 170 200 250 250 270Total 7,780 8,240 7,830 7,790 8,330 8,780 8,860 9,160
Industry Employment Generated by Travel Spending (Jobs)
2006 2008 2010 2012 2014 2016 2017 2018
Local Tax Receipts 9.0 8.7 10.1 9.9 11.9 14.0 14.7 15.2State Tax Receipts 13.3 14.4 13.8 15.0 16.5 19.5 20.8 21.9Total 22.3 23.0 23.9 24.9 28.4 33.4 35.4 37.1
Tax Receipts Generated by Travel Spending ($Million)
Details may not add to total due to rounding. * Other Travel includes ground transportation and air travel impacts for travel to other Oregon visitor destinations and travel arrangement services.** Retail includes gasoline.Federal tax receipts not included.
DEAN RUNYAN ASSOCIATESPage 24

Central Coast Visitor Spending and Visitor Volume
Visitor Spending by Type of Traveler Accommodation ($Million), 2018p
2008 2010 2012 2014 2017 2018
Total Destination Spending 584 571 585 664 759 785All Overnight 419 410 416 475 553 572
Hotel, Motel, STVR* 305 298 298 350 422 437
Private Home 24 24 26 27 28 29
Other Overnight 90 88 92 98 103 106
Day Travel 165 161 169 190 206 214
Day Travel 165 161 169 190 206 214
Average Expenditures for Overnight Visitors, 2018p
Travel Party PersonParty Length of
Day Trip Day Trip Size Stay (Nights)
$350 $765 $143 $313Hotel, Motel, STVR* 2.4 2.2
$90 $307 $35 $118Private Home 2.6 3.4
$132 $495 $40 $149Other Overnight 3.3 3.8
$240 $650 $87 $243 All Overnight 2.8 2.7
Overnight Visitor Volume, 2016-2018p
Person-Nights (000) Party-Nights (000)
2016 2017 2018 2016 2017 2018
Hotel, Motel, STVR* 3,028 3,001 3,054 1,238 1,227 1,249
Private Home 825 823 839 318 317 323
Other Overnight 2,657 2,650 2,673 801 799 806
All Overnight 6,510 6,474 6,566 2,357 2,344 2,378
Person-Trips (000) Party-Trips (000)
2016 2017 2018 2016 2017 2018
Hotel, Motel, STVR* 1,384 1,371 1,396 566 561 571
Private Home 241 240 245 93 93 94
Other Overnight 707 705 711 213 212 214
All Overnight 2,332 2,316 2,352 872 866 879
"Hotel, Motel, STVR" category includes all lodging where a lodging tax is collected except campgrounds. "Other Overnight" category includes campgrounds and vacation homes.
DEAN RUNYAN ASSOCIATES Page 25
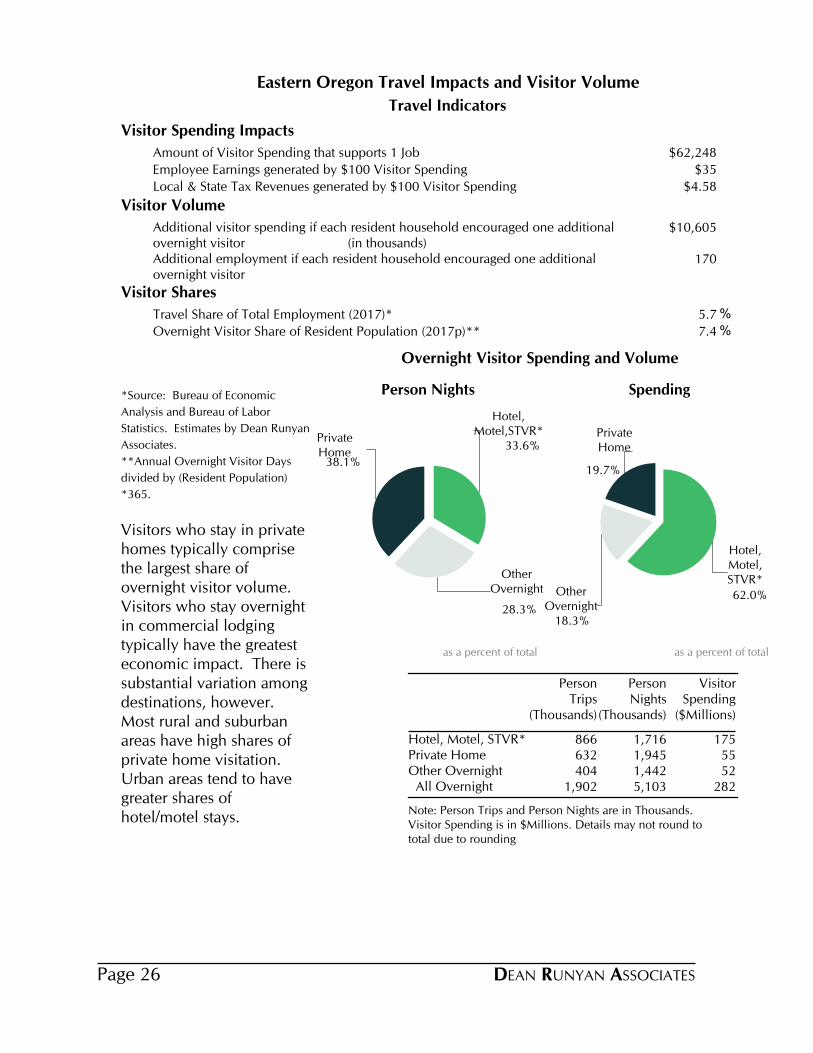
Eastern Oregon Travel Impacts and Visitor Volume
Travel Indicators
Visitor Spending Impacts
Amount of Visitor Spending that supports 1 Job $62,248
Employee Earnings generated by $100 Visitor Spending $35
Local & State Tax Revenues generated by $100 Visitor Spending $4.58
Visitor Volume
Additional visitor spending if each resident household encouraged one additional overnight visitor (in thousands)
$10,605
Additional employment if each resident household encouraged one additional overnight visitor
170
Visitor Shares
Travel Share of Total Employment (2017)* 5.7%
Overnight Visitor Share of Resident Population (2017p)** 7.4%
*Source: Bureau of Economic
Analysis and Bureau of Labor
Statistics. Estimates by Dean Runyan
Associates.
**Annual Overnight Visitor Days
divided by (Resident Population)
*365.
Visitors who stay in private homes typically comprise the largest share of overnight visitor volume. Visitors who stay overnight in commercial lodging typically have the greatest economic impact. There is substantial variation among destinations, however. Most rural and suburban areas have high shares of private home visitation. Urban areas tend to have greater shares of hotel/motel stays.
Note: Person Trips and Person Nights are in Thousands. Visitor Spending is in $Millions. Details may not round to total due to rounding
Person Trips
(Thousands)
Person Nights
(Thousands)
Visitor Spending
($Millions)
Hotel, Motel, STVR* 866 1,716 175Private Home 632 1,945 55Other Overnight 404 1,442 52 All Overnight 1,902 5,103 282
33.6%
Hotel,Motel,STVR*
28.3%
OtherOvernight
38.1%
PrivateHome
Person Nights
as a percent of total
62.0%
Hotel,Motel,STVR*
18.3%
OtherOvernight
19.7%
PrivateHome
Spending
as a percent of total
Overnight Visitor Spending and Volume
DEAN RUNYAN ASSOCIATESPage 26

Direct Travel Impacts, 2010-2018p
Eastern Oregon
Avg. Annual Chg.
Spending ($M) 2010 2012 2014 2016 2017 2018 17-18 10-18Total (Current $) 316 335 346 352 379 391 3.0% 2.7% Other 14 16 15 12 14 15 10.6% 1.0% Visitor 302 319 330 340 366 376 2.7% 2.8% Non-transportation 257 266 281 302 322 327 1.6% 3.1% Transportation 45 54 50 38 44 48 10.9% 0.8%
Earnings ($M)Earnings (Current $) 87 96 103 116 123 132 7.9% 5.4%
Employment (Jobs)Employment 5,050 5,310 5,470 5,710 5,930 6,100 2.9% 2.4%
Tax Revenue ($M)Total (Current $) 12 13 14 15 17 17 2.7% 4.9% Local 3 3 4 4 5 5 0.6% 4.8% State 8 10 10 11 12 13 3.4% 5.0%
Other spending includes resident air travel, travel arrangement and reservation services, and convention and trade show organizers. Non-transportation visitor spending includes accommodations, food services, retail, food stores, and arts, entertainment & recreation. Visitor transportation spending includes private auto, auto rental, other local ground transportation and one-way airfares.Earnings include wages & salaries, earned benefits and proprietor income.Employment includes all full- and part-time employment of payroll employees and proprietors.Local tax revenue includes lodging taxes, auto rental taxes and airport passenger facility charges paid by visitors.State tax revenue includes lodging, and motor fuel tax payments of visitors, and the income tax payments attributable to the travel industry income of businesses and employees.Federal tax revenue includes motor fuel excise taxes and airline ticket taxes paid by visitors, and the payroll and income taxes attributable to the travel industry income of employees and businesses.
DEAN RUNYAN ASSOCIATES Page 27
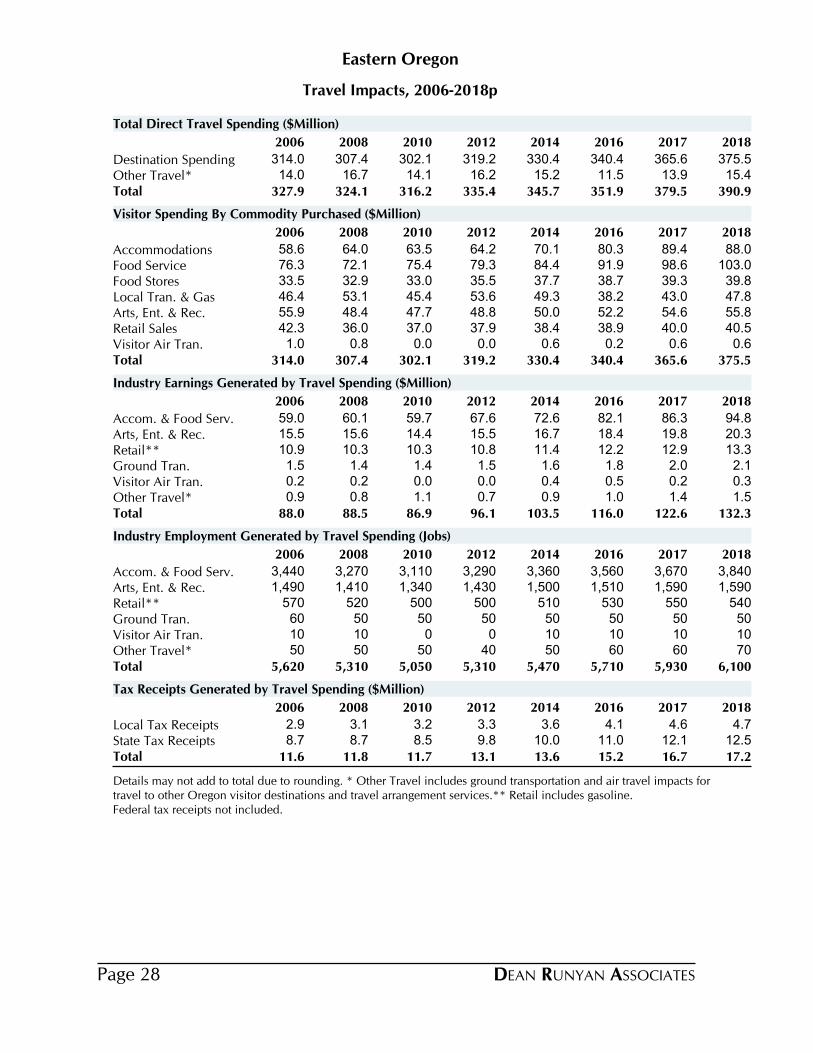
Travel Impacts, 2006-2018p
Eastern Oregon
2006 2008 2010 2012 2014 2016 2017 2018
Destination Spending 314.0 307.4 302.1 319.2 330.4 340.4 365.6 375.5Other Travel* 14.0 16.7 14.1 16.2 15.2 11.5 13.9 15.4Total 327.9 324.1 316.2 335.4 345.7 351.9 379.5 390.9
Total Direct Travel Spending ($Million)
2006 2008 2010 2012 2014 2016 2017 2018
Accommodations 58.6 64.0 63.5 64.2 70.1 80.3 89.4 88.0Food Service 76.3 72.1 75.4 79.3 84.4 91.9 98.6 103.0Food Stores 33.5 32.9 33.0 35.5 37.7 38.7 39.3 39.8Local Tran. & Gas 46.4 53.1 45.4 53.6 49.3 38.2 43.0 47.8Arts, Ent. & Rec. 55.9 48.4 47.7 48.8 50.0 52.2 54.6 55.8Retail Sales 42.3 36.0 37.0 37.9 38.4 38.9 40.0 40.5Visitor Air Tran. 1.0 0.8 0.0 0.0 0.6 0.2 0.6 0.6Total 314.0 307.4 302.1 319.2 330.4 340.4 365.6 375.5
Visitor Spending By Commodity Purchased ($Million)
2006 2008 2010 2012 2014 2016 2017 2018
Accom. & Food Serv. 59.0 60.1 59.7 67.6 72.6 82.1 86.3 94.8Arts, Ent. & Rec. 15.5 15.6 14.4 15.5 16.7 18.4 19.8 20.3Retail** 10.9 10.3 10.3 10.8 11.4 12.2 12.9 13.3Ground Tran. 1.5 1.4 1.4 1.5 1.6 1.8 2.0 2.1Visitor Air Tran. 0.2 0.2 0.0 0.0 0.4 0.5 0.2 0.3Other Travel* 0.9 0.8 1.1 0.7 0.9 1.0 1.4 1.5Total 88.0 88.5 86.9 96.1 103.5 116.0 122.6 132.3
Industry Earnings Generated by Travel Spending ($Million)
2006 2008 2010 2012 2014 2016 2017 2018
Accom. & Food Serv. 3,440 3,270 3,110 3,290 3,360 3,560 3,670 3,840Arts, Ent. & Rec. 1,490 1,410 1,340 1,430 1,500 1,510 1,590 1,590Retail** 570 520 500 500 510 530 550 540Ground Tran. 60 50 50 50 50 50 50 50Visitor Air Tran. 10 10 0 0 10 10 10 10Other Travel* 50 50 50 40 50 60 60 70Total 5,620 5,310 5,050 5,310 5,470 5,710 5,930 6,100
Industry Employment Generated by Travel Spending (Jobs)
2006 2008 2010 2012 2014 2016 2017 2018
Local Tax Receipts 2.9 3.1 3.2 3.3 3.6 4.1 4.6 4.7State Tax Receipts 8.7 8.7 8.5 9.8 10.0 11.0 12.1 12.5Total 11.6 11.8 11.7 13.1 13.6 15.2 16.7 17.2
Tax Receipts Generated by Travel Spending ($Million)
Details may not add to total due to rounding. * Other Travel includes ground transportation and air travel impacts for travel to other Oregon visitor destinations and travel arrangement services.** Retail includes gasoline.Federal tax receipts not included.
DEAN RUNYAN ASSOCIATESPage 28

Eastern Oregon Visitor Spending and Visitor Volume
Visitor Spending by Type of Traveler Accommodation ($Million), 2018p
2008 2010 2012 2014 2017 2018
Total Destination Spending 307 302 319 330 366 376All Overnight 231 226 237 246 275 282
Hotel, Motel, STVR* 141 135 140 145 171 175
Private Home 48 49 52 53 54 55
Other Overnight 43 42 45 48 50 52
Day Travel 76 76 82 85 91 94
Day Travel 76 76 82 85 91 94
Average Expenditures for Overnight Visitors, 2018p
Travel Party PersonParty Length of
Day Trip Day Trip Size Stay (Nights)
$249 $494 $102 $201Hotel, Motel, STVR* 2.5 2.0
$73 $225 $29 $88Private Home 2.6 3.1
$120 $428 $36 $128Other Overnight 3.4 3.6
$149 $391 $55 $148 All Overnight 2.7 2.6
Overnight Visitor Volume, 2016-2018p
Person-Nights (000) Party-Nights (000)
2016 2017 2018 2016 2017 2018
Hotel, Motel, STVR* 1,583 1,688 1,716 645 688 700
Private Home 1,906 1,946 1,945 744 759 759
Other Overnight 1,435 1,420 1,442 426 422 429
All Overnight 4,924 5,054 5,103 1,815 1,869 1,887
Person-Trips (000) Party-Trips (000)
2016 2017 2018 2016 2017 2018
Hotel, Motel, STVR* 799 852 866 326 347 353
Private Home 620 633 632 242 247 247
Other Overnight 401 398 404 120 119 120
All Overnight 1,820 1,882 1,902 687 713 720
"Hotel, Motel, STVR" category includes all lodging where a lodging tax is collected except campgrounds. "Other Overnight" category includes campgrounds and vacation homes.
DEAN RUNYAN ASSOCIATES Page 29

Mt. Hood/Gorge Travel Impacts and Visitor Volume
Travel Indicators
Visitor Spending Impacts
Amount of Visitor Spending that supports 1 Job $84,408
Employee Earnings generated by $100 Visitor Spending $31
Local & State Tax Revenues generated by $100 Visitor Spending $4.69
Visitor Volume
Additional visitor spending if each resident household encouraged one additional overnight visitor (in thousands)
$8,467
Additional employment if each resident household encouraged one additional overnight visitor
100
Visitor Shares
Travel Share of Total Employment (2017)* 6.6%
Overnight Visitor Share of Resident Population (2017p)** 9.7%
*Source: Bureau of Economic
Analysis and Bureau of Labor
Statistics. Estimates by Dean Runyan
Associates.
**Annual Overnight Visitor Days
divided by (Resident Population)
*365.
Visitors who stay in private homes typically comprise the largest share of overnight visitor volume. Visitors who stay overnight in commercial lodging typically have the greatest economic impact. There is substantial variation among destinations, however. Most rural and suburban areas have high shares of private home visitation. Urban areas tend to have greater shares of hotel/motel stays.
Note: Person Trips and Person Nights are in Thousands. Visitor Spending is in $Millions. Details may not round to total due to rounding
Person Trips
(Thousands)
Person Nights
(Thousands)
Visitor Spending
($Millions)
Hotel, Motel, STVR* 672 1,459 202Private Home 346 1,194 40Other Overnight 227 864 31 All Overnight 1,245 3,517 273
41.5%
Hotel,Motel,STVR*
24.6%
OtherOvernight
33.9%
PrivateHome
Person Nights
as a percent of total
73.9%
Hotel,Motel,STVR*
11.3%
OtherOvernight
14.7%
PrivateHome
Spending
as a percent of total
Overnight Visitor Spending and Volume
DEAN RUNYAN ASSOCIATESPage 30
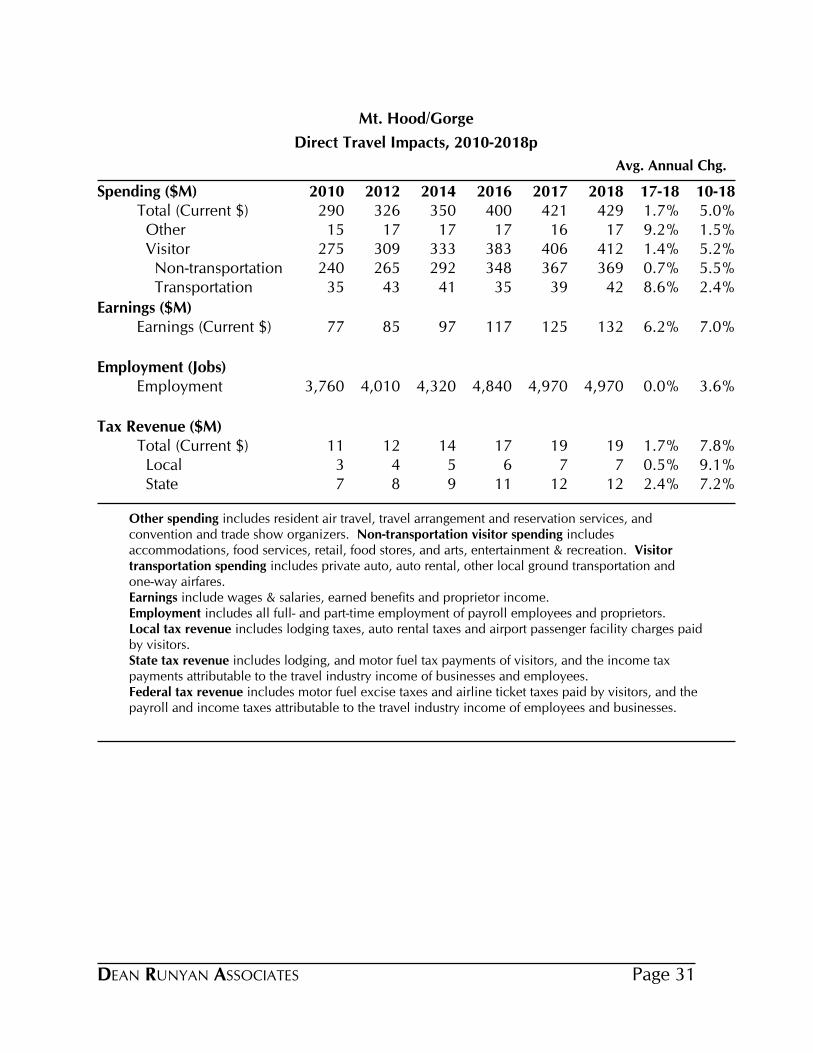
Direct Travel Impacts, 2010-2018p
Mt. Hood/Gorge
Avg. Annual Chg.
Spending ($M) 2010 2012 2014 2016 2017 2018 17-18 10-18Total (Current $) 290 326 350 400 421 429 1.7% 5.0% Other 15 17 17 17 16 17 9.2% 1.5% Visitor 275 309 333 383 406 412 1.4% 5.2% Non-transportation 240 265 292 348 367 369 0.7% 5.5% Transportation 35 43 41 35 39 42 8.6% 2.4%
Earnings ($M)Earnings (Current $) 77 85 97 117 125 132 6.2% 7.0%
Employment (Jobs)Employment 3,760 4,010 4,320 4,840 4,970 4,970 0.0% 3.6%
Tax Revenue ($M)Total (Current $) 11 12 14 17 19 19 1.7% 7.8% Local 3 4 5 6 7 7 0.5% 9.1% State 7 8 9 11 12 12 2.4% 7.2%
Other spending includes resident air travel, travel arrangement and reservation services, and convention and trade show organizers. Non-transportation visitor spending includes accommodations, food services, retail, food stores, and arts, entertainment & recreation. Visitor transportation spending includes private auto, auto rental, other local ground transportation and one-way airfares.Earnings include wages & salaries, earned benefits and proprietor income.Employment includes all full- and part-time employment of payroll employees and proprietors.Local tax revenue includes lodging taxes, auto rental taxes and airport passenger facility charges paid by visitors.State tax revenue includes lodging, and motor fuel tax payments of visitors, and the income tax payments attributable to the travel industry income of businesses and employees.Federal tax revenue includes motor fuel excise taxes and airline ticket taxes paid by visitors, and the payroll and income taxes attributable to the travel industry income of employees and businesses.
DEAN RUNYAN ASSOCIATES Page 31
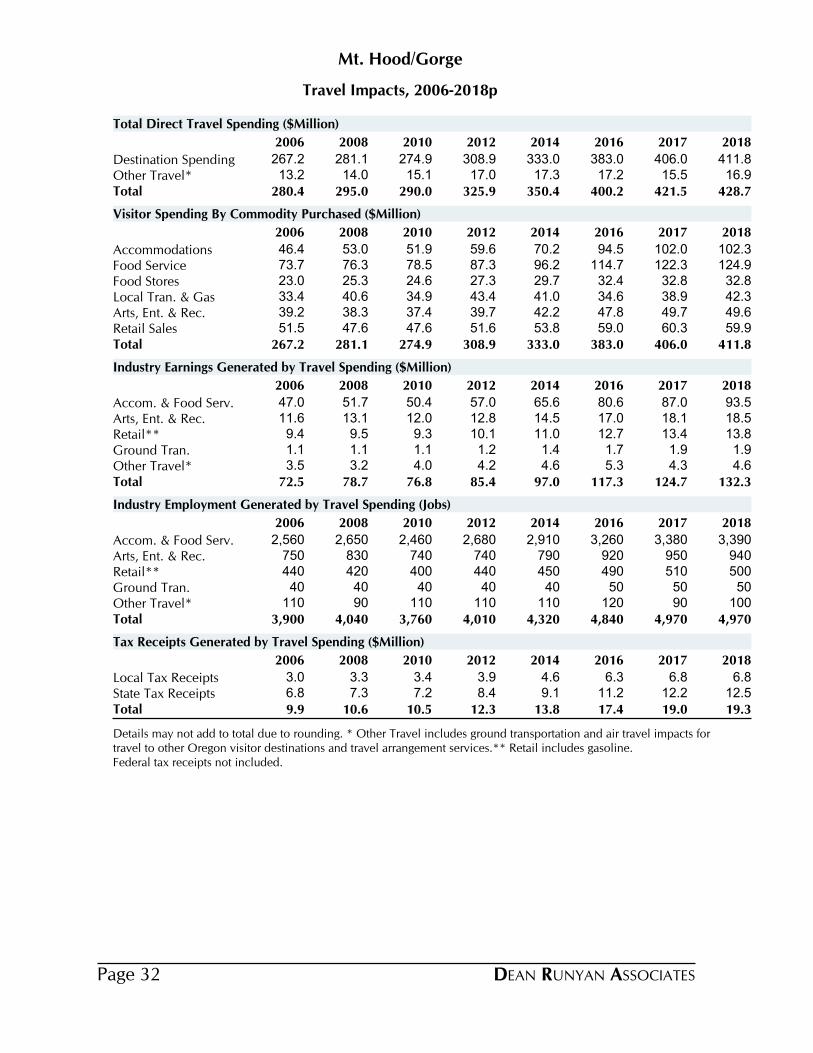
Travel Impacts, 2006-2018p
Mt. Hood/Gorge
2006 2008 2010 2012 2014 2016 2017 2018
Destination Spending 267.2 281.1 274.9 308.9 333.0 383.0 406.0 411.8Other Travel* 13.2 14.0 15.1 17.0 17.3 17.2 15.5 16.9Total 280.4 295.0 290.0 325.9 350.4 400.2 421.5 428.7
Total Direct Travel Spending ($Million)
2006 2008 2010 2012 2014 2016 2017 2018
Accommodations 46.4 53.0 51.9 59.6 70.2 94.5 102.0 102.3Food Service 73.7 76.3 78.5 87.3 96.2 114.7 122.3 124.9Food Stores 23.0 25.3 24.6 27.3 29.7 32.4 32.8 32.8Local Tran. & Gas 33.4 40.6 34.9 43.4 41.0 34.6 38.9 42.3Arts, Ent. & Rec. 39.2 38.3 37.4 39.7 42.2 47.8 49.7 49.6Retail Sales 51.5 47.6 47.6 51.6 53.8 59.0 60.3 59.9Total 267.2 281.1 274.9 308.9 333.0 383.0 406.0 411.8
Visitor Spending By Commodity Purchased ($Million)
2006 2008 2010 2012 2014 2016 2017 2018
Accom. & Food Serv. 47.0 51.7 50.4 57.0 65.6 80.6 87.0 93.5Arts, Ent. & Rec. 11.6 13.1 12.0 12.8 14.5 17.0 18.1 18.5Retail** 9.4 9.5 9.3 10.1 11.0 12.7 13.4 13.8Ground Tran. 1.1 1.1 1.1 1.2 1.4 1.7 1.9 1.9Other Travel* 3.5 3.2 4.0 4.2 4.6 5.3 4.3 4.6Total 72.5 78.7 76.8 85.4 97.0 117.3 124.7 132.3
Industry Earnings Generated by Travel Spending ($Million)
2006 2008 2010 2012 2014 2016 2017 2018
Accom. & Food Serv. 2,560 2,650 2,460 2,680 2,910 3,260 3,380 3,390Arts, Ent. & Rec. 750 830 740 740 790 920 950 940Retail** 440 420 400 440 450 490 510 500Ground Tran. 40 40 40 40 40 50 50 50Other Travel* 110 90 110 110 110 120 90 100Total 3,900 4,040 3,760 4,010 4,320 4,840 4,970 4,970
Industry Employment Generated by Travel Spending (Jobs)
2006 2008 2010 2012 2014 2016 2017 2018
Local Tax Receipts 3.0 3.3 3.4 3.9 4.6 6.3 6.8 6.8State Tax Receipts 6.8 7.3 7.2 8.4 9.1 11.2 12.2 12.5Total 9.9 10.6 10.5 12.3 13.8 17.4 19.0 19.3
Tax Receipts Generated by Travel Spending ($Million)
Details may not add to total due to rounding. * Other Travel includes ground transportation and air travel impacts for travel to other Oregon visitor destinations and travel arrangement services.** Retail includes gasoline.Federal tax receipts not included.
DEAN RUNYAN ASSOCIATESPage 32

Mt. Hood/Gorge Oregon Visitor Spending and Visitor Volume
Visitor Spending by Type of Traveler Accommodation ($Million), 2018p
2008 2010 2012 2014 2017 2018
Total Destination Spending 281 275 309 333 406 412All Overnight 182 176 198 214 269 273
Hotel, Motel, STVR* 122 118 134 148 200 202
Private Home 32 33 36 37 39 40
Other Overnight 27 25 27 29 30 31
Day Travel 100 99 111 119 137 139
Day Travel 100 99 111 119 137 139
Average Expenditures for Overnight Visitors, 2018p
Travel Party PersonParty Length of
Day Trip Day Trip Size Stay (Nights)
$317 $705 $138 $300Hotel, Motel, STVR* 2.3 2.2
$80 $287 $34 $116Private Home 2.4 3.6
$120 $457 $36 $136Other Overnight 3.3 3.8
$196 $553 $78 $219 All Overnight 2.5 2.8
Overnight Visitor Volume, 2016-2018p
Person-Nights (000) Party-Nights (000)
2016 2017 2018 2016 2017 2018
Hotel, Motel, STVR* 1,407 1,490 1,459 613 648 636
Private Home 1,203 1,204 1,194 500 502 500
Other Overnight 859 852 864 257 255 258
All Overnight 3,469 3,546 3,517 1,370 1,405 1,394
Person-Trips (000) Party-Trips (000)
2016 2017 2018 2016 2017 2018
Hotel, Motel, STVR* 648 686 672 276 292 286
Private Home 349 349 346 140 141 140
Other Overnight 226 224 227 67 67 68
All Overnight 1,223 1,260 1,245 484 499 493
"Hotel, Motel, STVR" category includes all lodging where a lodging tax is collected except campgrounds. "Other Overnight" category includes campgrounds and vacation homes.
DEAN RUNYAN ASSOCIATES Page 33

North Coast Travel Impacts and Visitor Volume
Travel Indicators
Visitor Spending Impacts
Amount of Visitor Spending that supports 1 Job $92,880
Employee Earnings generated by $100 Visitor Spending $35
Local & State Tax Revenues generated by $100 Visitor Spending $4.39
Visitor Volume
Additional visitor spending if each resident household encouraged one additional overnight visitor (in thousands)
$6,104
Additional employment if each resident household encouraged one additional overnight visitor
66
Visitor Shares
Travel Share of Total Employment (2017)* 21.9%
Overnight Visitor Share of Resident Population (2017p)** 26.6%
*Source: Bureau of Economic
Analysis and Bureau of Labor
Statistics. Estimates by Dean Runyan
Associates.
**Annual Overnight Visitor Days
divided by (Resident Population)
*365.
Visitors who stay in private homes typically comprise the largest share of overnight visitor volume. Visitors who stay overnight in commercial lodging typically have the greatest economic impact. There is substantial variation among destinations, however. Most rural and suburban areas have high shares of private home visitation. Urban areas tend to have greater shares of hotel/motel stays.
Note: Person Trips and Person Nights are in Thousands. Visitor Spending is in $Millions. Details may not round to total due to rounding
Person Trips
(Thousands)
Person Nights
(Thousands)
Visitor Spending
($Millions)
Hotel, Motel, STVR* 1,447 3,118 402Private Home 231 777 22Other Overnight 723 2,578 91 All Overnight 2,401 6,473 515
48.2%
Hotel,Motel,STVR*
39.8%
OtherOvernight
12.0%
PrivateHome
Person Nights
as a percent of total
78.0%
Hotel,Motel,STVR*
17.7%
OtherOvernight
4.3%
PrivateHome
Spending
as a percent of total
Overnight Visitor Spending and Volume
DEAN RUNYAN ASSOCIATESPage 34

Direct Travel Impacts, 2010-2018p
North Coast
Avg. Annual Chg.
Spending ($M) 2010 2012 2014 2016 2017 2018 17-18 10-18Total (Current $) 591 639 737 778 794 820 3.3% 4.2% Other 17 19 6 4 4 5 11.5% -15.2% Visitor 574 620 731 774 790 815 3.3% 4.5% Non-transportation 513 547 654 713 723 742 2.7% 4.7% Transportation 61 73 78 62 67 73 9.9% 2.3%
Earnings ($M)Earnings (Current $) 174 185 208 237 255 285 11.7% 6.4%
Employment (Jobs)Employment 7,110 7,050 7,620 8,170 8,430 8,790 4.2% 2.7%
Tax Revenue ($M)Total (Current $) 22 24 28 32 34 36 5.3% 6.5% Local 8 9 11 12 13 13 3.2% 6.7% State 14 15 17 20 21 23 6.6% 6.4%
Other spending includes resident air travel, travel arrangement and reservation services, and convention and trade show organizers. Non-transportation visitor spending includes accommodations, food services, retail, food stores, and arts, entertainment & recreation. Visitor transportation spending includes private auto, auto rental, other local ground transportation and one-way airfares.Earnings include wages & salaries, earned benefits and proprietor income.Employment includes all full- and part-time employment of payroll employees and proprietors.Local tax revenue includes lodging taxes, auto rental taxes and airport passenger facility charges paid by visitors.State tax revenue includes lodging, and motor fuel tax payments of visitors, and the income tax payments attributable to the travel industry income of businesses and employees.Federal tax revenue includes motor fuel excise taxes and airline ticket taxes paid by visitors, and the payroll and income taxes attributable to the travel industry income of employees and businesses.
DEAN RUNYAN ASSOCIATES Page 35
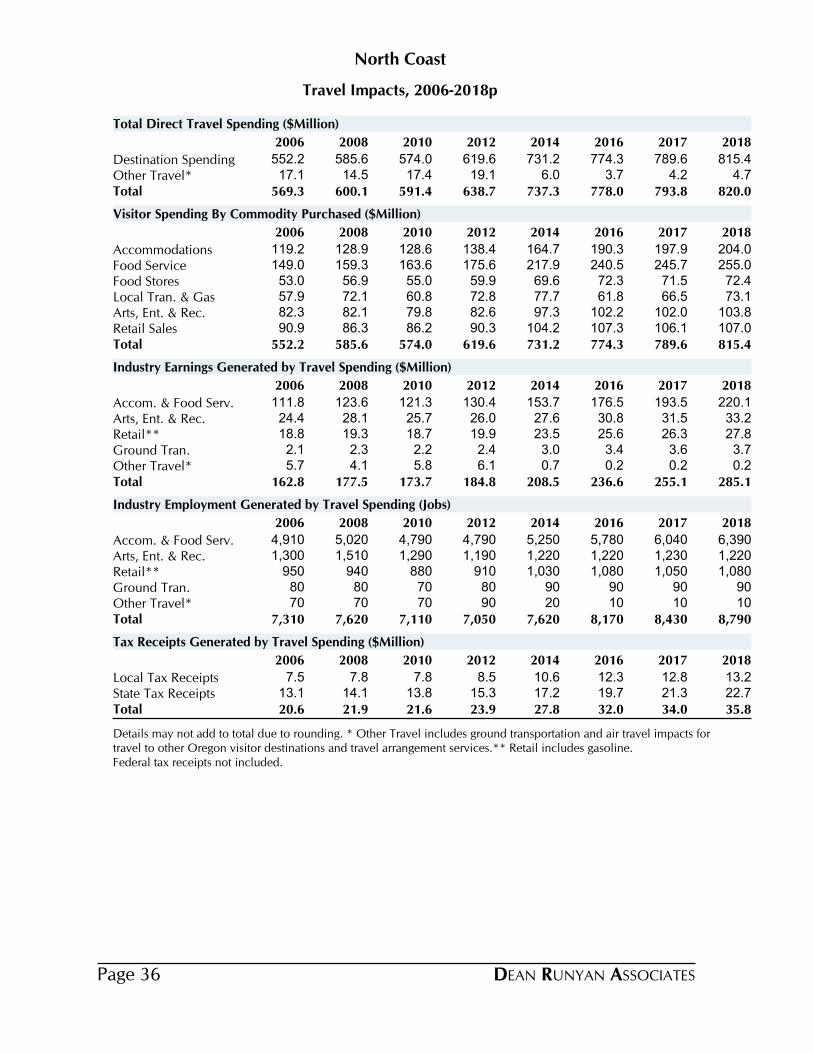
Travel Impacts, 2006-2018p
North Coast
2006 2008 2010 2012 2014 2016 2017 2018
Destination Spending 552.2 585.6 574.0 619.6 731.2 774.3 789.6 815.4Other Travel* 17.1 14.5 17.4 19.1 6.0 3.7 4.2 4.7Total 569.3 600.1 591.4 638.7 737.3 778.0 793.8 820.0
Total Direct Travel Spending ($Million)
2006 2008 2010 2012 2014 2016 2017 2018
Accommodations 119.2 128.9 128.6 138.4 164.7 190.3 197.9 204.0Food Service 149.0 159.3 163.6 175.6 217.9 240.5 245.7 255.0Food Stores 53.0 56.9 55.0 59.9 69.6 72.3 71.5 72.4Local Tran. & Gas 57.9 72.1 60.8 72.8 77.7 61.8 66.5 73.1Arts, Ent. & Rec. 82.3 82.1 79.8 82.6 97.3 102.2 102.0 103.8Retail Sales 90.9 86.3 86.2 90.3 104.2 107.3 106.1 107.0Total 552.2 585.6 574.0 619.6 731.2 774.3 789.6 815.4
Visitor Spending By Commodity Purchased ($Million)
2006 2008 2010 2012 2014 2016 2017 2018
Accom. & Food Serv. 111.8 123.6 121.3 130.4 153.7 176.5 193.5 220.1Arts, Ent. & Rec. 24.4 28.1 25.7 26.0 27.6 30.8 31.5 33.2Retail** 18.8 19.3 18.7 19.9 23.5 25.6 26.3 27.8Ground Tran. 2.1 2.3 2.2 2.4 3.0 3.4 3.6 3.7Other Travel* 5.7 4.1 5.8 6.1 0.7 0.2 0.2 0.2Total 162.8 177.5 173.7 184.8 208.5 236.6 255.1 285.1
Industry Earnings Generated by Travel Spending ($Million)
2006 2008 2010 2012 2014 2016 2017 2018
Accom. & Food Serv. 4,910 5,020 4,790 4,790 5,250 5,780 6,040 6,390Arts, Ent. & Rec. 1,300 1,510 1,290 1,190 1,220 1,220 1,230 1,220Retail** 950 940 880 910 1,030 1,080 1,050 1,080Ground Tran. 80 80 70 80 90 90 90 90Other Travel* 70 70 70 90 20 10 10 10Total 7,310 7,620 7,110 7,050 7,620 8,170 8,430 8,790
Industry Employment Generated by Travel Spending (Jobs)
2006 2008 2010 2012 2014 2016 2017 2018
Local Tax Receipts 7.5 7.8 7.8 8.5 10.6 12.3 12.8 13.2State Tax Receipts 13.1 14.1 13.8 15.3 17.2 19.7 21.3 22.7Total 20.6 21.9 21.6 23.9 27.8 32.0 34.0 35.8
Tax Receipts Generated by Travel Spending ($Million)
Details may not add to total due to rounding. * Other Travel includes ground transportation and air travel impacts for travel to other Oregon visitor destinations and travel arrangement services.** Retail includes gasoline.Federal tax receipts not included.
DEAN RUNYAN ASSOCIATESPage 36

North Coast Visitor Spending and Visitor Volume
Visitor Spending by Type of Traveler Accommodation ($Million), 2018p
2008 2010 2012 2014 2017 2018
Total Destination Spending 586 574 620 731 790 815All Overnight 365 357 382 454 498 515
Hotel, Motel, STVR* 268 263 283 349 388 402
Private Home 19 18 20 21 21 22
Other Overnight 78 75 79 84 88 91
Day Travel 221 217 237 277 292 300
Day Travel 221 217 237 277 292 300
Average Expenditures for Overnight Visitors, 2018p
Travel Party PersonParty Length of
Day Trip Day Trip Size Stay (Nights)
$315 $680 $129 $278Hotel, Motel, STVR* 2.4 2.2
$74 $250 $29 $96Private Home 2.6 3.4
$117 $415 $35 $126Other Overnight 3.3 3.6
$219 $572 $80 $215 All Overnight 2.7 2.6
Overnight Visitor Volume, 2016-2018p
Person-Nights (000) Party-Nights (000)
2016 2017 2018 2016 2017 2018
Hotel, Motel, STVR* 3,152 3,098 3,118 1,289 1,266 1,274
Private Home 750 763 777 290 295 300
Other Overnight 2,561 2,559 2,578 777 777 783
All Overnight 6,464 6,420 6,473 2,355 2,338 2,357
Person-Trips (000) Party-Trips (000)
2016 2017 2018 2016 2017 2018
Hotel, Motel, STVR* 1,463 1,438 1,447 598 588 591
Private Home 223 227 231 86 88 89
Other Overnight 718 718 723 218 219 220
All Overnight 2,403 2,382 2,401 902 894 901
"Hotel, Motel, STVR" category includes all lodging where a lodging tax is collected except campgrounds. "Other Overnight" category includes campgrounds and vacation homes.
DEAN RUNYAN ASSOCIATES Page 37
Oregon Coast Travel Impacts and Visitor Volume
Travel Indicators
Visitor Spending Impacts
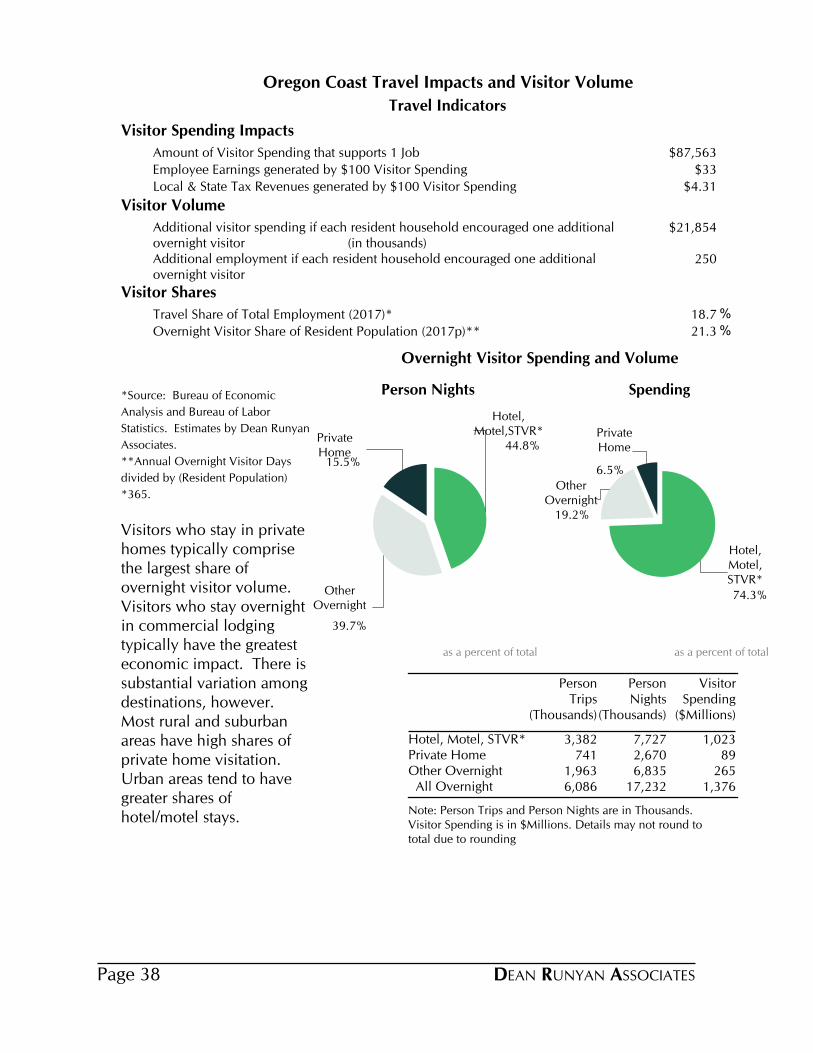
Amount of Visitor Spending that supports 1 Job $87,563
Employee Earnings generated by $100 Visitor Spending $33
Local & State Tax Revenues generated by $100 Visitor Spending $4.31
Visitor Volume
Additional visitor spending if each resident household encouraged one additional overnight visitor (in thousands)
$21,854
Additional employment if each resident household encouraged one additional overnight visitor
250
Visitor Shares
Travel Share of Total Employment (2017)* 18.7%
Overnight Visitor Share of Resident Population (2017p)** 21.3%
*Source: Bureau of Economic
Analysis and Bureau of Labor
Statistics. Estimates by Dean Runyan
Associates.
**Annual Overnight Visitor Days
divided by (Resident Population)
*365.
Visitors who stay in private homes typically comprise the largest share of overnight visitor volume. Visitors who stay overnight in commercial lodging typically have the greatest economic impact. There is substantial variation among destinations, however. Most rural and suburban areas have high shares of private home visitation. Urban areas tend to have greater shares of hotel/motel stays.
Note: Person Trips and Person Nights are in Thousands. Visitor Spending is in $Millions. Details may not round to total due to rounding
Person Trips
(Thousands)
Person Nights
(Thousands)
Visitor Spending
($Millions)
Hotel, Motel, STVR* 3,382 7,727 1,023Private Home 741 2,670 89Other Overnight 1,963 6,835 265 All Overnight 6,086 17,232 1,376
44.8%
Hotel,Motel,STVR*
39.7%
OtherOvernight
15.5%
PrivateHome
Person Nights
as a percent of total
74.3%
Hotel,Motel,STVR*
19.2%
OtherOvernight
6.5%
PrivateHome
Spending
as a percent of total
Overnight Visitor Spending and Volume
DEAN RUNYAN ASSOCIATESPage 38

Direct Travel Impacts, 2010-2018p
Oregon Coast
Avg. Annual Chg.
Spending ($M) 2010 2012 2014 2016 2017 2018 17-18 10-18Total (Current $) 1,500 1,592 1,801 1,943 1,985 2,053 3.4% 4.0% Other 28 31 20 25 26 30 17.1% 1.1% Visitor 1,472 1,561 1,780 1,917 1,959 2,022 3.2% 4.0% Non-transportation 1,291 1,347 1,562 1,740 1,768 1,811 2.5% 4.3% Transportation 181 214 218 178 192 211 10.1% 1.9%
Earnings ($M)Earnings (Current $) 427 452 506 580 614 674 9.8% 5.9%
Employment (Jobs)Employment 19,690 19,670 20,830 22,320 22,710 23,460 3.3% 2.2%
Tax Revenue ($M)Total (Current $) 55 60 68 79 83 87 4.6% 5.9% Local 20 20 24 28 30 31 3.1% 5.7% State 36 40 43 50 54 57 5.4% 6.0%
Other spending includes resident air travel, travel arrangement and reservation services, and convention and trade show organizers. Non-transportation visitor spending includes accommodations, food services, retail, food stores, and arts, entertainment & recreation. Visitor transportation spending includes private auto, auto rental, other local ground transportation and one-way airfares.Earnings include wages & salaries, earned benefits and proprietor income.Employment includes all full- and part-time employment of payroll employees and proprietors.Local tax revenue includes lodging taxes, auto rental taxes and airport passenger facility charges paid by visitors.State tax revenue includes lodging, and motor fuel tax payments of visitors, and the income tax payments attributable to the travel industry income of businesses and employees.Federal tax revenue includes motor fuel excise taxes and airline ticket taxes paid by visitors, and the payroll and income taxes attributable to the travel industry income of employees and businesses.
DEAN RUNYAN ASSOCIATES Page 39
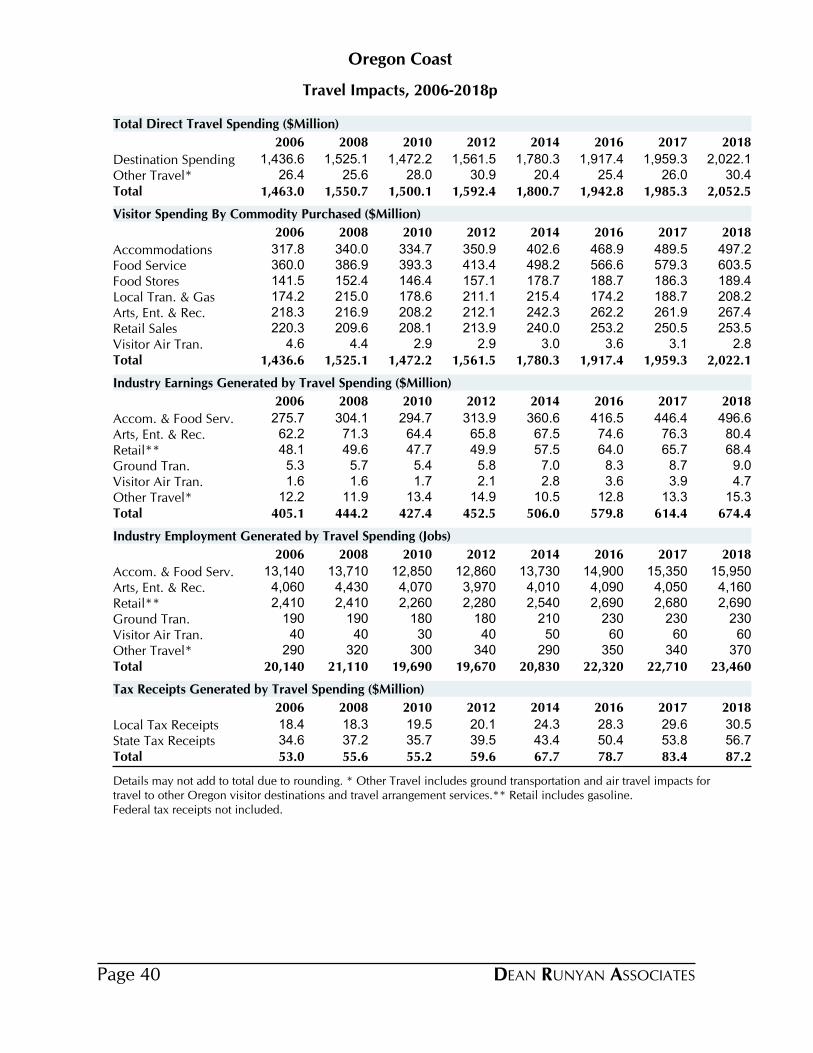
Travel Impacts, 2006-2018p
Oregon Coast
2006 2008 2010 2012 2014 2016 2017 2018
Destination Spending 1,436.6 1,525.1 1,472.2 1,561.5 1,780.3 1,917.4 1,959.3 2,022.1Other Travel* 26.4 25.6 28.0 30.9 20.4 25.4 26.0 30.4Total 1,463.0 1,550.7 1,500.1 1,592.4 1,800.7 1,942.8 1,985.3 2,052.5
Total Direct Travel Spending ($Million)
2006 2008 2010 2012 2014 2016 2017 2018
Accommodations 317.8 340.0 334.7 350.9 402.6 468.9 489.5 497.2Food Service 360.0 386.9 393.3 413.4 498.2 566.6 579.3 603.5Food Stores 141.5 152.4 146.4 157.1 178.7 188.7 186.3 189.4Local Tran. & Gas 174.2 215.0 178.6 211.1 215.4 174.2 188.7 208.2Arts, Ent. & Rec. 218.3 216.9 208.2 212.1 242.3 262.2 261.9 267.4Retail Sales 220.3 209.6 208.1 213.9 240.0 253.2 250.5 253.5Visitor Air Tran. 4.6 4.4 2.9 2.9 3.0 3.6 3.1 2.8Total 1,436.6 1,525.1 1,472.2 1,561.5 1,780.3 1,917.4 1,959.3 2,022.1
Visitor Spending By Commodity Purchased ($Million)
2006 2008 2010 2012 2014 2016 2017 2018
Accom. & Food Serv. 275.7 304.1 294.7 313.9 360.6 416.5 446.4 496.6Arts, Ent. & Rec. 62.2 71.3 64.4 65.8 67.5 74.6 76.3 80.4Retail** 48.1 49.6 47.7 49.9 57.5 64.0 65.7 68.4Ground Tran. 5.3 5.7 5.4 5.8 7.0 8.3 8.7 9.0Visitor Air Tran. 1.6 1.6 1.7 2.1 2.8 3.6 3.9 4.7Other Travel* 12.2 11.9 13.4 14.9 10.5 12.8 13.3 15.3Total 405.1 444.2 427.4 452.5 506.0 579.8 614.4 674.4
Industry Earnings Generated by Travel Spending ($Million)
2006 2008 2010 2012 2014 2016 2017 2018
Accom. & Food Serv. 13,140 13,710 12,850 12,860 13,730 14,900 15,350 15,950Arts, Ent. & Rec. 4,060 4,430 4,070 3,970 4,010 4,090 4,050 4,160Retail** 2,410 2,410 2,260 2,280 2,540 2,690 2,680 2,690Ground Tran. 190 190 180 180 210 230 230 230Visitor Air Tran. 40 40 30 40 50 60 60 60Other Travel* 290 320 300 340 290 350 340 370Total 20,140 21,110 19,690 19,670 20,830 22,320 22,710 23,460
Industry Employment Generated by Travel Spending (Jobs)
2006 2008 2010 2012 2014 2016 2017 2018
Local Tax Receipts 18.4 18.3 19.5 20.1 24.3 28.3 29.6 30.5State Tax Receipts 34.6 37.2 35.7 39.5 43.4 50.4 53.8 56.7Total 53.0 55.6 55.2 59.6 67.7 78.7 83.4 87.2
Tax Receipts Generated by Travel Spending ($Million)
Details may not add to total due to rounding. * Other Travel includes ground transportation and air travel impacts for travel to other Oregon visitor destinations and travel arrangement services.** Retail includes gasoline.Federal tax receipts not included.
DEAN RUNYAN ASSOCIATESPage 40
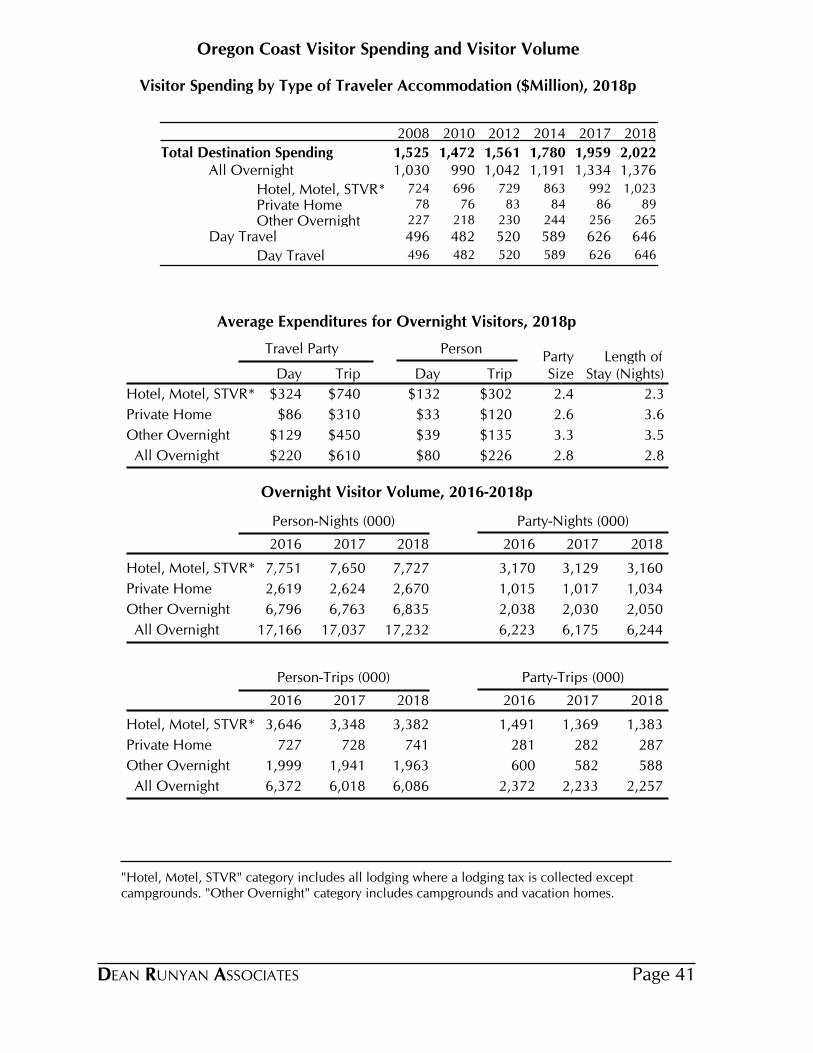
Oregon Coast Visitor Spending and Visitor Volume
Visitor Spending by Type of Traveler Accommodation ($Million), 2018p
2008 2010 2012 2014 2017 2018
Total Destination Spending 1,525 1,472 1,561 1,780 1,959 2,022All Overnight 1,030 990 1,042 1,191 1,334 1,376
Hotel, Motel, STVR* 724 696 729 863 992 1,023
Private Home 78 76 83 84 86 89
Other Overnight 227 218 230 244 256 265
Day Travel 496 482 520 589 626 646
Day Travel 496 482 520 589 626 646
Average Expenditures for Overnight Visitors, 2018p
Travel Party PersonParty Length of
Day Trip Day Trip Size Stay (Nights)
$324 $740 $132 $302Hotel, Motel, STVR* 2.4 2.3
$86 $310 $33 $120Private Home 2.6 3.6
$129 $450 $39 $135Other Overnight 3.3 3.5
$220 $610 $80 $226 All Overnight 2.8 2.8
Overnight Visitor Volume, 2016-2018p
Person-Nights (000) Party-Nights (000)
2016 2017 2018 2016 2017 2018
Hotel, Motel, STVR* 7,751 7,650 7,727 3,170 3,129 3,160
Private Home 2,619 2,624 2,670 1,015 1,017 1,034
Other Overnight 6,796 6,763 6,835 2,038 2,030 2,050
All Overnight 17,166 17,037 17,232 6,223 6,175 6,244
Person-Trips (000) Party-Trips (000)
2016 2017 2018 2016 2017 2018
Hotel, Motel, STVR* 3,646 3,348 3,382 1,491 1,369 1,383
Private Home 727 728 741 281 282 287
Other Overnight 1,999 1,941 1,963 600 582 588
All Overnight 6,372 6,018 6,086 2,372 2,233 2,257
"Hotel, Motel, STVR" category includes all lodging where a lodging tax is collected except campgrounds. "Other Overnight" category includes campgrounds and vacation homes.
DEAN RUNYAN ASSOCIATES Page 41
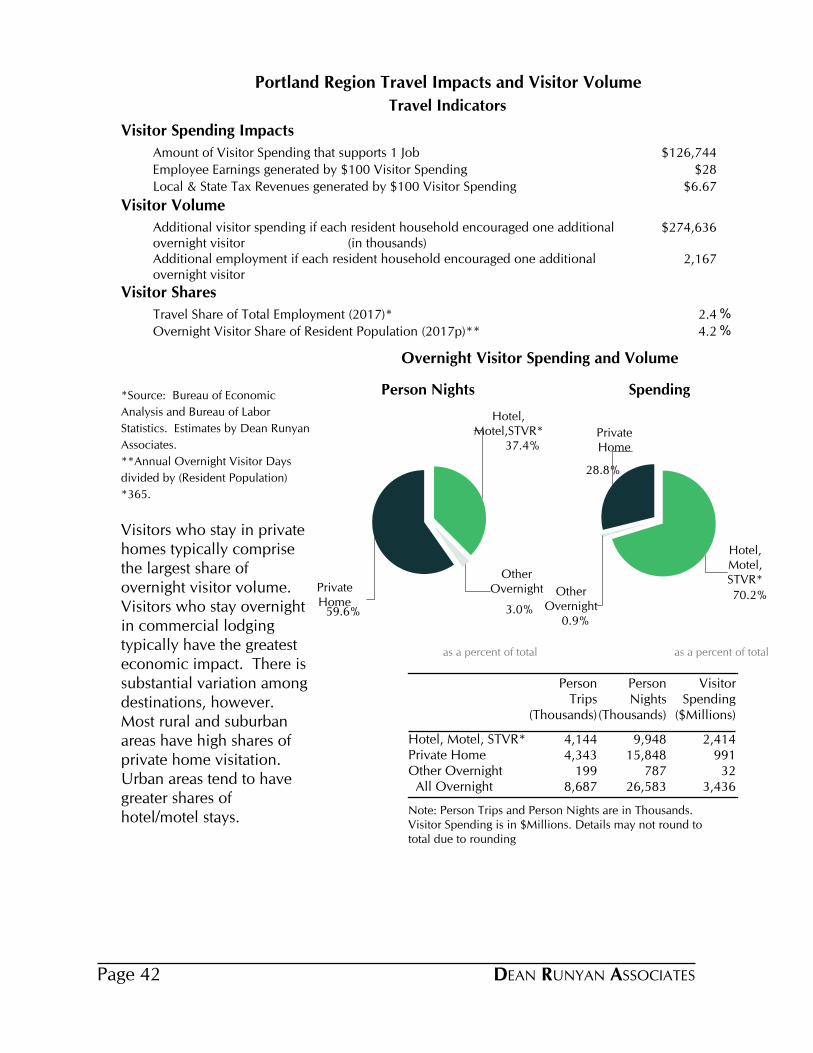
Portland Region Travel Impacts and Visitor Volume
Travel Indicators
Visitor Spending Impacts
Amount of Visitor Spending that supports 1 Job $126,744
Employee Earnings generated by $100 Visitor Spending $28
Local & State Tax Revenues generated by $100 Visitor Spending $6.67
Visitor Volume
Additional visitor spending if each resident household encouraged one additional overnight visitor (in thousands)
$274,636
Additional employment if each resident household encouraged one additional overnight visitor
2,167
Visitor Shares
Travel Share of Total Employment (2017)* 2.4%
Overnight Visitor Share of Resident Population (2017p)** 4.2%
*Source: Bureau of Economic
Analysis and Bureau of Labor
Statistics. Estimates by Dean Runyan
Associates.
**Annual Overnight Visitor Days
divided by (Resident Population)
*365.
Visitors who stay in private homes typically comprise the largest share of overnight visitor volume. Visitors who stay overnight in commercial lodging typically have the greatest economic impact. There is substantial variation among destinations, however. Most rural and suburban areas have high shares of private home visitation. Urban areas tend to have greater shares of hotel/motel stays.
Note: Person Trips and Person Nights are in Thousands. Visitor Spending is in $Millions. Details may not round to total due to rounding
Person Trips
(Thousands)
Person Nights
(Thousands)
Visitor Spending
($Millions)
Hotel, Motel, STVR* 4,144 9,948 2,414Private Home 4,343 15,848 991Other Overnight 199 787 32 All Overnight 8,687 26,583 3,436
37.4%
Hotel,Motel,STVR*
3.0%
OtherOvernight
59.6%
PrivateHome
Person Nights
as a percent of total
70.2%
Hotel,Motel,STVR*
0.9%
OtherOvernight
28.8%
PrivateHome
Spending
as a percent of total
Overnight Visitor Spending and Volume
DEAN RUNYAN ASSOCIATESPage 42
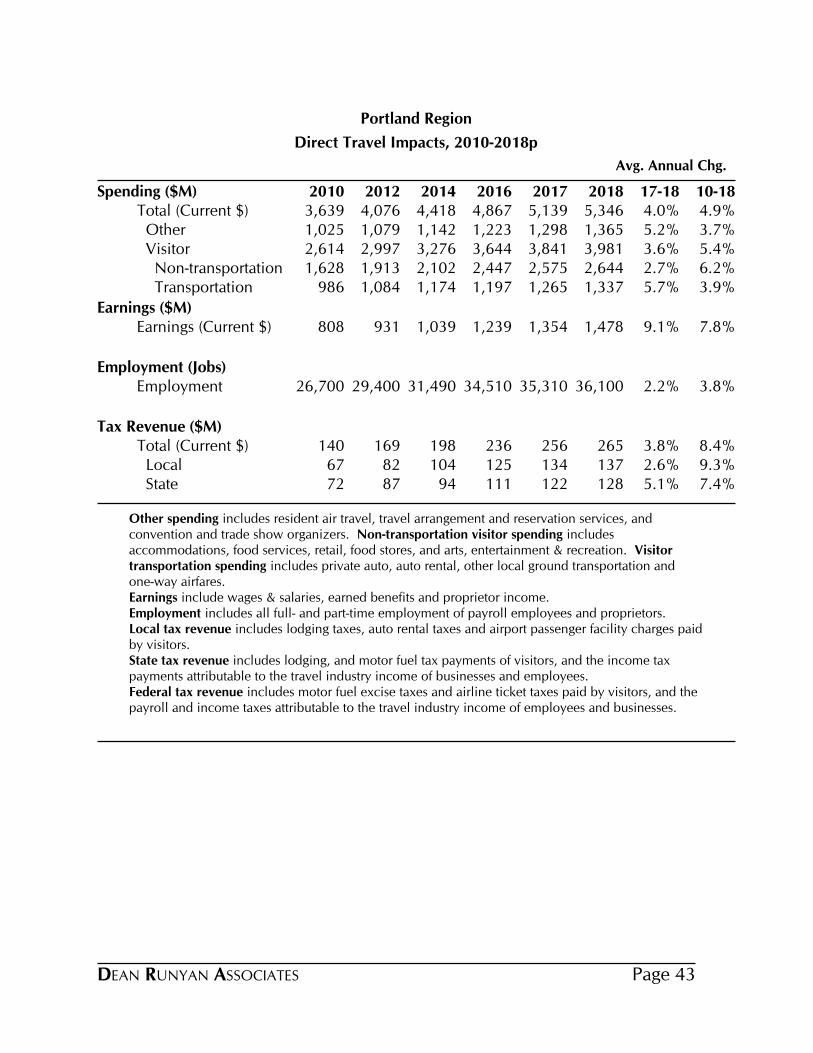
Direct Travel Impacts, 2010-2018p
Portland Region
Avg. Annual Chg.
Spending ($M) 2010 2012 2014 2016 2017 2018 17-18 10-18Total (Current $) 3,639 4,076 4,418 4,867 5,139 5,346 4.0% 4.9% Other 1,025 1,079 1,142 1,223 1,298 1,365 5.2% 3.7% Visitor 2,614 2,997 3,276 3,644 3,841 3,981 3.6% 5.4% Non-transportation 1,628 1,913 2,102 2,447 2,575 2,644 2.7% 6.2% Transportation 986 1,084 1,174 1,197 1,265 1,337 5.7% 3.9%
Earnings ($M)Earnings (Current $) 808 931 1,039 1,239 1,354 1,478 9.1% 7.8%
Employment (Jobs)Employment 26,700 29,400 31,490 34,510 35,310 36,100 2.2% 3.8%
Tax Revenue ($M)Total (Current $) 140 169 198 236 256 265 3.8% 8.4% Local 67 82 104 125 134 137 2.6% 9.3% State 72 87 94 111 122 128 5.1% 7.4%
Other spending includes resident air travel, travel arrangement and reservation services, and convention and trade show organizers. Non-transportation visitor spending includes accommodations, food services, retail, food stores, and arts, entertainment & recreation. Visitor transportation spending includes private auto, auto rental, other local ground transportation and one-way airfares.Earnings include wages & salaries, earned benefits and proprietor income.Employment includes all full- and part-time employment of payroll employees and proprietors.Local tax revenue includes lodging taxes, auto rental taxes and airport passenger facility charges paid by visitors.State tax revenue includes lodging, and motor fuel tax payments of visitors, and the income tax payments attributable to the travel industry income of businesses and employees.Federal tax revenue includes motor fuel excise taxes and airline ticket taxes paid by visitors, and the payroll and income taxes attributable to the travel industry income of employees and businesses.
DEAN RUNYAN ASSOCIATES Page 43
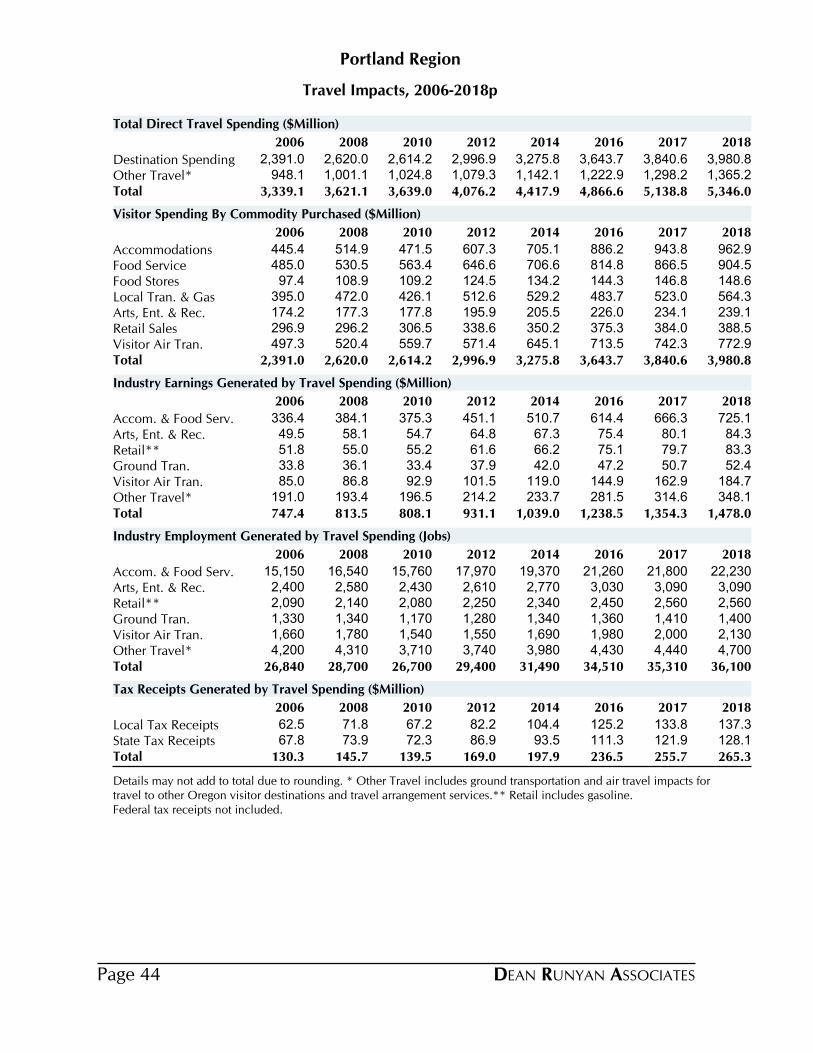
Travel Impacts, 2006-2018p
Portland Region
2006 2008 2010 2012 2014 2016 2017 2018
Destination Spending 2,391.0 2,620.0 2,614.2 2,996.9 3,275.8 3,643.7 3,840.6 3,980.8Other Travel* 948.1 1,001.1 1,024.8 1,079.3 1,142.1 1,222.9 1,298.2 1,365.2Total 3,339.1 3,621.1 3,639.0 4,076.2 4,417.9 4,866.6 5,138.8 5,346.0
Total Direct Travel Spending ($Million)
2006 2008 2010 2012 2014 2016 2017 2018
Accommodations 445.4 514.9 471.5 607.3 705.1 886.2 943.8 962.9Food Service 485.0 530.5 563.4 646.6 706.6 814.8 866.5 904.5Food Stores 97.4 108.9 109.2 124.5 134.2 144.3 146.8 148.6Local Tran. & Gas 395.0 472.0 426.1 512.6 529.2 483.7 523.0 564.3Arts, Ent. & Rec. 174.2 177.3 177.8 195.9 205.5 226.0 234.1 239.1Retail Sales 296.9 296.2 306.5 338.6 350.2 375.3 384.0 388.5Visitor Air Tran. 497.3 520.4 559.7 571.4 645.1 713.5 742.3 772.9Total 2,391.0 2,620.0 2,614.2 2,996.9 3,275.8 3,643.7 3,840.6 3,980.8
Visitor Spending By Commodity Purchased ($Million)
2006 2008 2010 2012 2014 2016 2017 2018
Accom. & Food Serv. 336.4 384.1 375.3 451.1 510.7 614.4 666.3 725.1Arts, Ent. & Rec. 49.5 58.1 54.7 64.8 67.3 75.4 80.1 84.3Retail** 51.8 55.0 55.2 61.6 66.2 75.1 79.7 83.3Ground Tran. 33.8 36.1 33.4 37.9 42.0 47.2 50.7 52.4Visitor Air Tran. 85.0 86.8 92.9 101.5 119.0 144.9 162.9 184.7Other Travel* 191.0 193.4 196.5 214.2 233.7 281.5 314.6 348.1Total 747.4 813.5 808.1 931.1 1,039.0 1,238.5 1,354.3 1,478.0
Industry Earnings Generated by Travel Spending ($Million)
2006 2008 2010 2012 2014 2016 2017 2018
Accom. & Food Serv. 15,150 16,540 15,760 17,970 19,370 21,260 21,800 22,230Arts, Ent. & Rec. 2,400 2,580 2,430 2,610 2,770 3,030 3,090 3,090Retail** 2,090 2,140 2,080 2,250 2,340 2,450 2,560 2,560Ground Tran. 1,330 1,340 1,170 1,280 1,340 1,360 1,410 1,400Visitor Air Tran. 1,660 1,780 1,540 1,550 1,690 1,980 2,000 2,130Other Travel* 4,200 4,310 3,710 3,740 3,980 4,430 4,440 4,700Total 26,840 28,700 26,700 29,400 31,490 34,510 35,310 36,100
Industry Employment Generated by Travel Spending (Jobs)
2006 2008 2010 2012 2014 2016 2017 2018
Local Tax Receipts 62.5 71.8 67.2 82.2 104.4 125.2 133.8 137.3State Tax Receipts 67.8 73.9 72.3 86.9 93.5 111.3 121.9 128.1Total 130.3 145.7 139.5 169.0 197.9 236.5 255.7 265.3
Tax Receipts Generated by Travel Spending ($Million)
Details may not add to total due to rounding. * Other Travel includes ground transportation and air travel impacts for travel to other Oregon visitor destinations and travel arrangement services.** Retail includes gasoline.Federal tax receipts not included.
DEAN RUNYAN ASSOCIATESPage 44
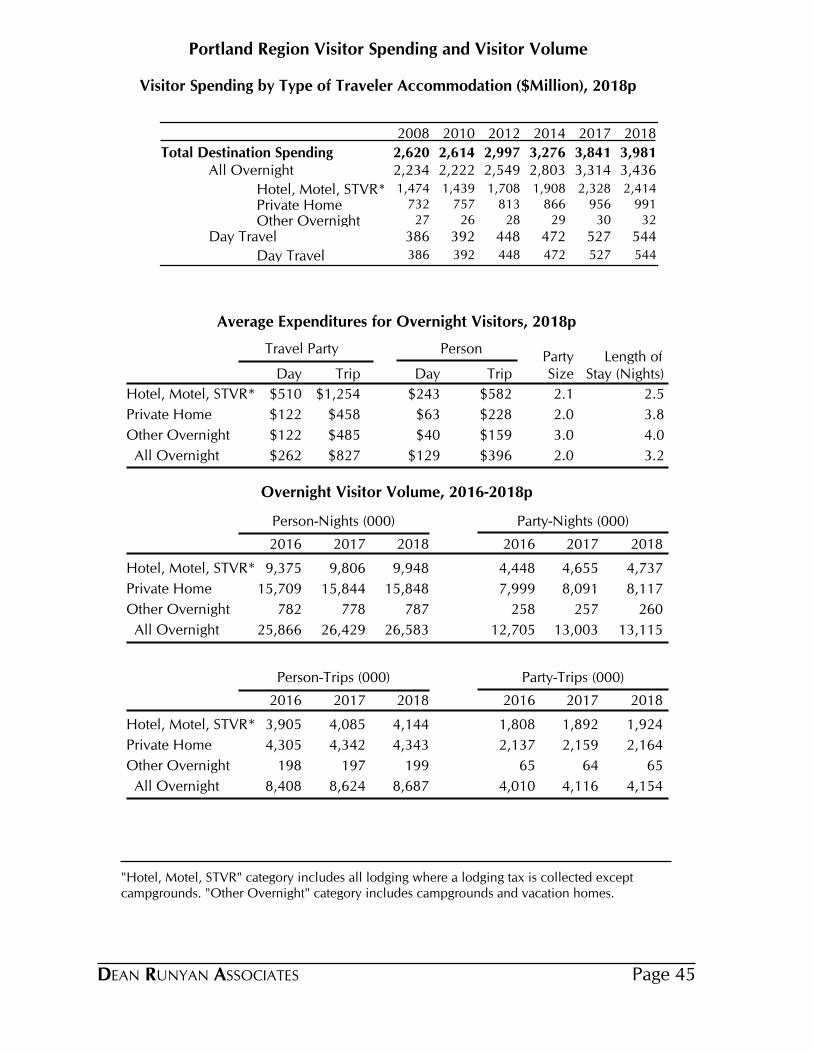
Portland Region Visitor Spending and Visitor Volume
Visitor Spending by Type of Traveler Accommodation ($Million), 2018p
2008 2010 2012 2014 2017 2018
Total Destination Spending 2,620 2,614 2,997 3,276 3,841 3,981All Overnight 2,234 2,222 2,549 2,803 3,314 3,436
Hotel, Motel, STVR* 1,474 1,439 1,708 1,908 2,328 2,414
Private Home 732 757 813 866 956 991
Other Overnight 27 26 28 29 30 32
Day Travel 386 392 448 472 527 544
Day Travel 386 392 448 472 527 544
Average Expenditures for Overnight Visitors, 2018p
Travel Party PersonParty Length of
Day Trip Day Trip Size Stay (Nights)
$510 $1,254 $243 $582Hotel, Motel, STVR* 2.1 2.5
$122 $458 $63 $228Private Home 2.0 3.8
$122 $485 $40 $159Other Overnight 3.0 4.0
$262 $827 $129 $396 All Overnight 2.0 3.2
Overnight Visitor Volume, 2016-2018p
Person-Nights (000) Party-Nights (000)
2016 2017 2018 2016 2017 2018
Hotel, Motel, STVR* 9,375 9,806 9,948 4,448 4,655 4,737
Private Home 15,709 15,844 15,848 7,999 8,091 8,117
Other Overnight 782 778 787 258 257 260
All Overnight 25,866 26,429 26,583 12,705 13,003 13,115
Person-Trips (000) Party-Trips (000)
2016 2017 2018 2016 2017 2018
Hotel, Motel, STVR* 3,905 4,085 4,144 1,808 1,892 1,924
Private Home 4,305 4,342 4,343 2,137 2,159 2,164
Other Overnight 198 197 199 65 64 65
All Overnight 8,408 8,624 8,687 4,010 4,116 4,154
"Hotel, Motel, STVR" category includes all lodging where a lodging tax is collected except campgrounds. "Other Overnight" category includes campgrounds and vacation homes.
DEAN RUNYAN ASSOCIATES Page 45
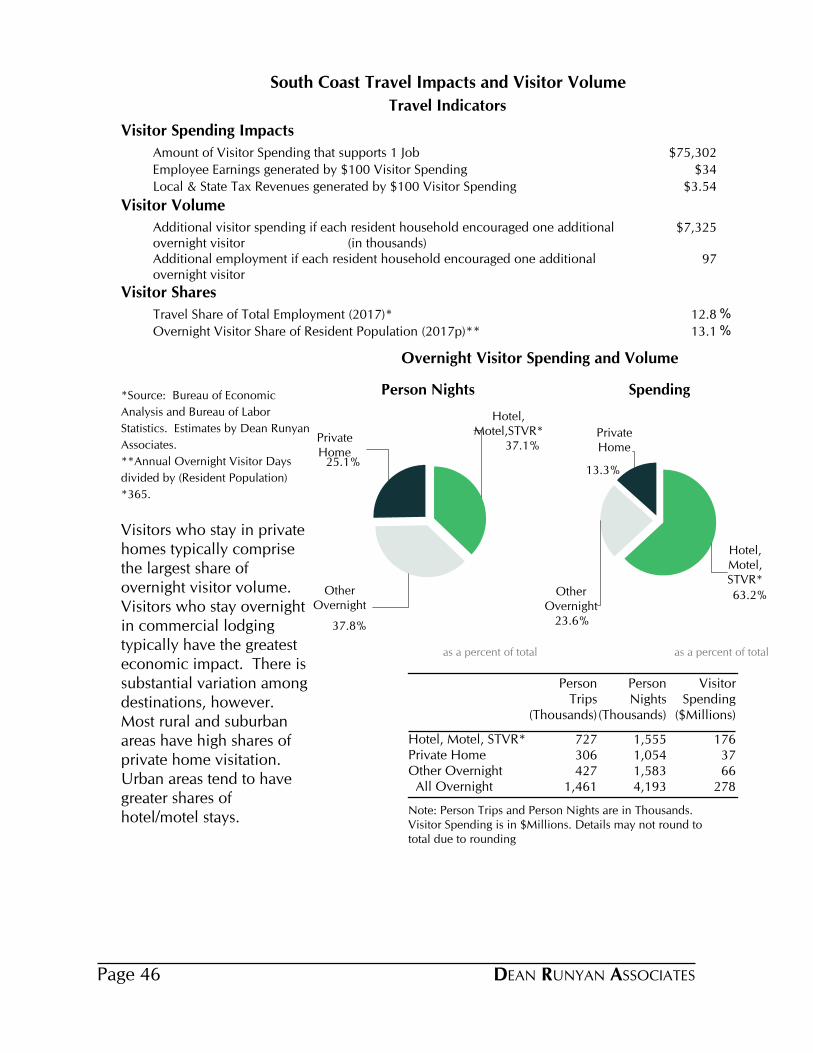
South Coast Travel Impacts and Visitor Volume
Travel Indicators
Visitor Spending Impacts
Amount of Visitor Spending that supports 1 Job $75,302
Employee Earnings generated by $100 Visitor Spending $34
Local & State Tax Revenues generated by $100 Visitor Spending $3.54
Visitor Volume
Additional visitor spending if each resident household encouraged one additional overnight visitor (in thousands)
$7,325
Additional employment if each resident household encouraged one additional overnight visitor
97
Visitor Shares
Travel Share of Total Employment (2017)* 12.8%
Overnight Visitor Share of Resident Population (2017p)** 13.1%
*Source: Bureau of Economic
Analysis and Bureau of Labor
Statistics. Estimates by Dean Runyan
Associates.
**Annual Overnight Visitor Days
divided by (Resident Population)
*365.
Visitors who stay in private homes typically comprise the largest share of overnight visitor volume. Visitors who stay overnight in commercial lodging typically have the greatest economic impact. There is substantial variation among destinations, however. Most rural and suburban areas have high shares of private home visitation. Urban areas tend to have greater shares of hotel/motel stays.
Note: Person Trips and Person Nights are in Thousands. Visitor Spending is in $Millions. Details may not round to total due to rounding
Person Trips
(Thousands)
Person Nights
(Thousands)
Visitor Spending
($Millions)
Hotel, Motel, STVR* 727 1,555 176Private Home 306 1,054 37Other Overnight 427 1,583 66 All Overnight 1,461 4,193 278
37.1%
Hotel,Motel,STVR*
37.8%
OtherOvernight
25.1%
PrivateHome
Person Nights
as a percent of total
63.2%
Hotel,Motel,STVR*
23.6%
OtherOvernight
13.3%
PrivateHome
Spending
as a percent of total
Overnight Visitor Spending and Volume
DEAN RUNYAN ASSOCIATESPage 46
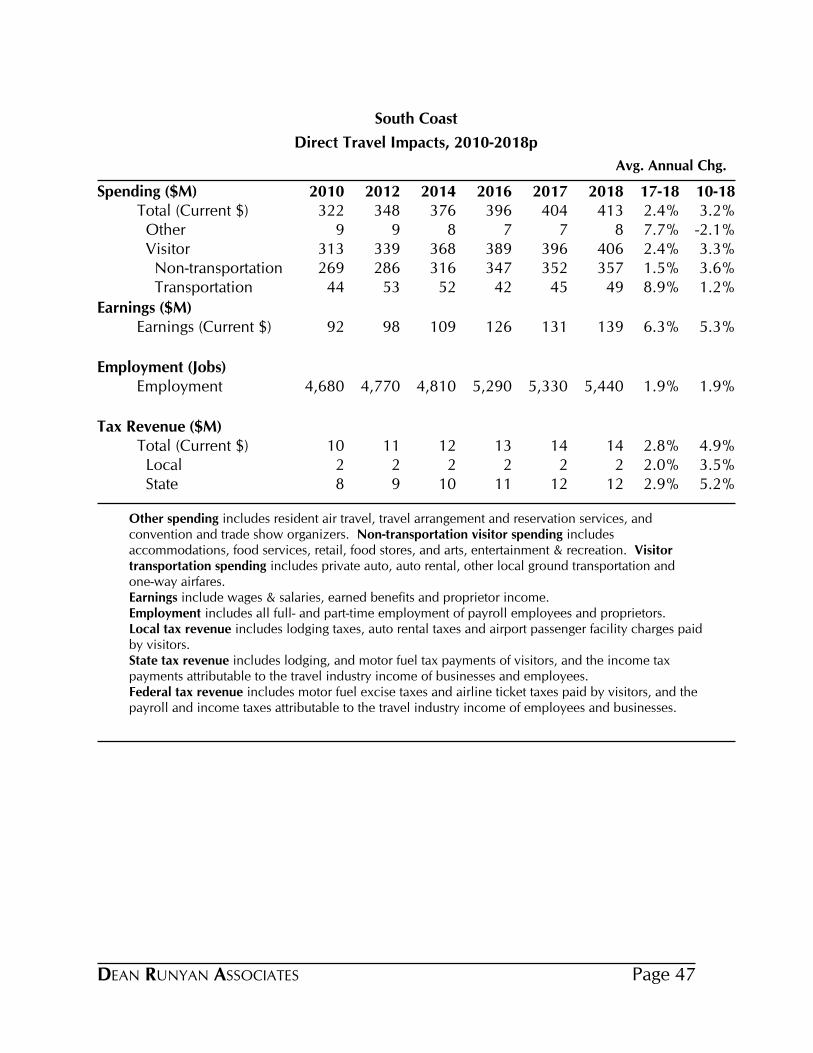
Direct Travel Impacts, 2010-2018p
South Coast
Avg. Annual Chg.
Spending ($M) 2010 2012 2014 2016 2017 2018 17-18 10-18Total (Current $) 322 348 376 396 404 413 2.4% 3.2% Other 9 9 8 7 7 8 7.7% -2.1% Visitor 313 339 368 389 396 406 2.4% 3.3% Non-transportation 269 286 316 347 352 357 1.5% 3.6% Transportation 44 53 52 42 45 49 8.9% 1.2%
Earnings ($M)Earnings (Current $) 92 98 109 126 131 139 6.3% 5.3%
Employment (Jobs)Employment 4,680 4,770 4,810 5,290 5,330 5,440 1.9% 1.9%
Tax Revenue ($M)Total (Current $) 10 11 12 13 14 14 2.8% 4.9% Local 2 2 2 2 2 2 2.0% 3.5% State 8 9 10 11 12 12 2.9% 5.2%
Other spending includes resident air travel, travel arrangement and reservation services, and convention and trade show organizers. Non-transportation visitor spending includes accommodations, food services, retail, food stores, and arts, entertainment & recreation. Visitor transportation spending includes private auto, auto rental, other local ground transportation and one-way airfares.Earnings include wages & salaries, earned benefits and proprietor income.Employment includes all full- and part-time employment of payroll employees and proprietors.Local tax revenue includes lodging taxes, auto rental taxes and airport passenger facility charges paid by visitors.State tax revenue includes lodging, and motor fuel tax payments of visitors, and the income tax payments attributable to the travel industry income of businesses and employees.Federal tax revenue includes motor fuel excise taxes and airline ticket taxes paid by visitors, and the payroll and income taxes attributable to the travel industry income of employees and businesses.
DEAN RUNYAN ASSOCIATES Page 47

Travel Impacts, 2006-2018p
South Coast
2006 2008 2010 2012 2014 2016 2017 2018
Destination Spending 317.5 337.1 312.7 339.1 368.1 389.2 396.4 405.7Other Travel* 10.2 11.3 9.1 9.2 8.1 6.7 7.2 7.7Total 327.8 348.5 321.9 348.3 376.2 395.9 403.6 413.5
Total Direct Travel Spending ($Million)
2006 2008 2010 2012 2014 2016 2017 2018
Accommodations 65.3 67.6 63.0 68.4 74.1 86.7 90.5 89.0Food Service 78.7 84.4 83.0 89.2 102.1 113.7 116.0 120.5Food Stores 33.3 36.8 34.6 37.4 41.3 43.0 42.4 43.1Local Tran. & Gas 41.5 51.3 41.3 49.7 48.7 38.5 41.6 45.8Arts, Ent. & Rec. 51.4 51.1 47.7 49.6 54.1 57.4 57.3 58.3Retail Sales 42.8 41.5 40.2 41.9 44.7 46.3 45.7 46.2Visitor Air Tran. 4.6 4.4 2.9 2.9 3.0 3.6 3.1 2.8Total 317.5 337.1 312.7 339.1 368.1 389.2 396.4 405.7
Visitor Spending By Commodity Purchased ($Million)
2006 2008 2010 2012 2014 2016 2017 2018
Accom. & Food Serv. 61.1 66.5 62.2 67.6 75.3 88.8 92.6 99.8Arts, Ent. & Rec. 14.5 16.7 14.7 14.8 15.4 16.6 17.0 17.0Retail** 10.4 11.0 10.3 11.0 12.1 13.3 13.6 13.8Ground Tran. 1.2 1.3 1.2 1.3 1.5 1.7 1.8 1.9Visitor Air Tran. 1.6 1.6 1.7 2.1 2.8 3.6 3.9 4.7Other Travel* 1.7 1.8 2.0 1.6 1.4 1.5 1.8 1.7Total 90.6 98.9 92.1 98.3 108.5 125.5 130.6 138.8
Industry Earnings Generated by Travel Spending ($Million)
2006 2008 2010 2012 2014 2016 2017 2018
Accom. & Food Serv. 3,130 3,210 2,830 2,940 2,990 3,340 3,420 3,460Arts, Ent. & Rec. 1,200 1,290 1,230 1,210 1,170 1,240 1,190 1,260Retail** 520 530 490 490 530 560 570 560Ground Tran. 40 40 40 40 50 50 50 50Visitor Air Tran. 40 40 30 40 50 60 60 60Other Travel* 60 60 60 40 40 50 50 50Total 4,980 5,180 4,680 4,770 4,810 5,290 5,330 5,440
Industry Employment Generated by Travel Spending (Jobs)
2006 2008 2010 2012 2014 2016 2017 2018
Local Tax Receipts 1.9 1.9 1.7 1.6 1.8 2.0 2.1 2.2State Tax Receipts 8.2 8.7 8.1 9.2 9.8 11.2 11.8 12.2Total 10.1 10.6 9.7 10.8 11.5 13.2 14.0 14.3
Tax Receipts Generated by Travel Spending ($Million)
Details may not add to total due to rounding. * Other Travel includes ground transportation and air travel impacts for travel to other Oregon visitor destinations and travel arrangement services.** Retail includes gasoline.Federal tax receipts not included.
DEAN RUNYAN ASSOCIATESPage 48
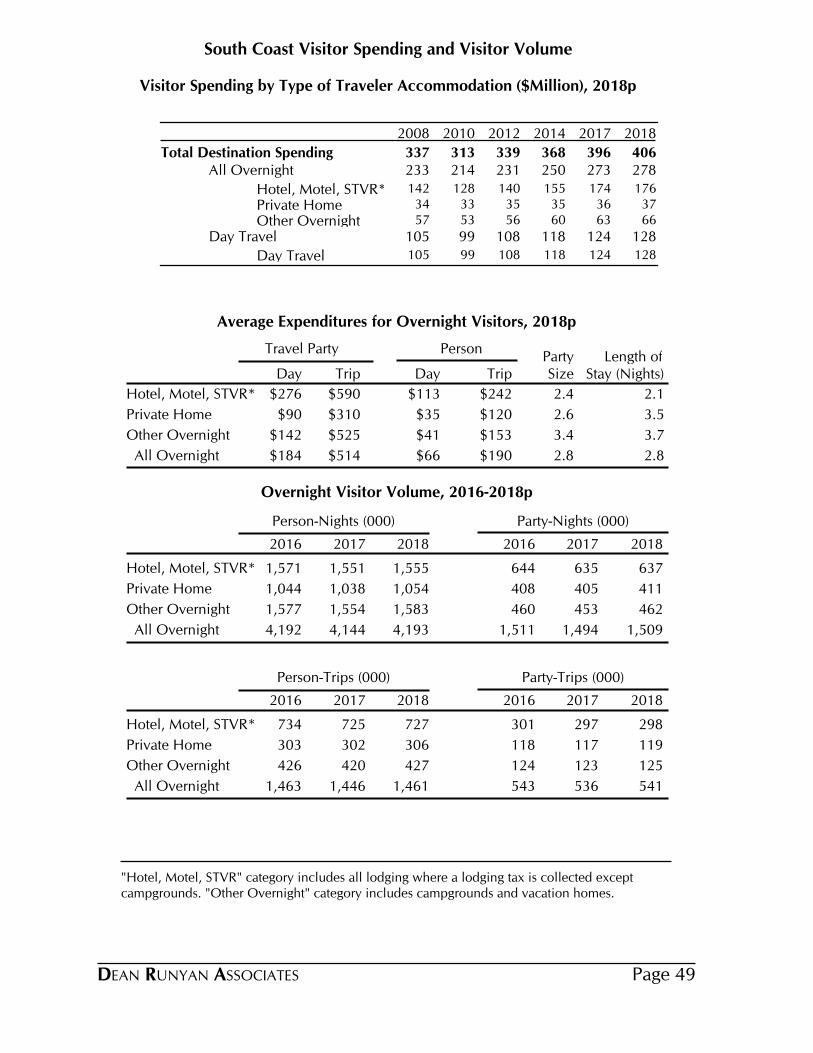
South Coast Visitor Spending and Visitor Volume
Visitor Spending by Type of Traveler Accommodation ($Million), 2018p
2008 2010 2012 2014 2017 2018
Total Destination Spending 337 313 339 368 396 406All Overnight 233 214 231 250 273 278
Hotel, Motel, STVR* 142 128 140 155 174 176
Private Home 34 33 35 35 36 37
Other Overnight 57 53 56 60 63 66
Day Travel 105 99 108 118 124 128
Day Travel 105 99 108 118 124 128
Average Expenditures for Overnight Visitors, 2018p
Travel Party PersonParty Length of
Day Trip Day Trip Size Stay (Nights)
$276 $590 $113 $242Hotel, Motel, STVR* 2.4 2.1
$90 $310 $35 $120Private Home 2.6 3.5
$142 $525 $41 $153Other Overnight 3.4 3.7
$184 $514 $66 $190 All Overnight 2.8 2.8
Overnight Visitor Volume, 2016-2018p
Person-Nights (000) Party-Nights (000)
2016 2017 2018 2016 2017 2018
Hotel, Motel, STVR* 1,571 1,551 1,555 644 635 637
Private Home 1,044 1,038 1,054 408 405 411
Other Overnight 1,577 1,554 1,583 460 453 462
All Overnight 4,192 4,144 4,193 1,511 1,494 1,509
Person-Trips (000) Party-Trips (000)
2016 2017 2018 2016 2017 2018
Hotel, Motel, STVR* 734 725 727 301 297 298
Private Home 303 302 306 118 117 119
Other Overnight 426 420 427 124 123 125
All Overnight 1,463 1,446 1,461 543 536 541
"Hotel, Motel, STVR" category includes all lodging where a lodging tax is collected except campgrounds. "Other Overnight" category includes campgrounds and vacation homes.
DEAN RUNYAN ASSOCIATES Page 49
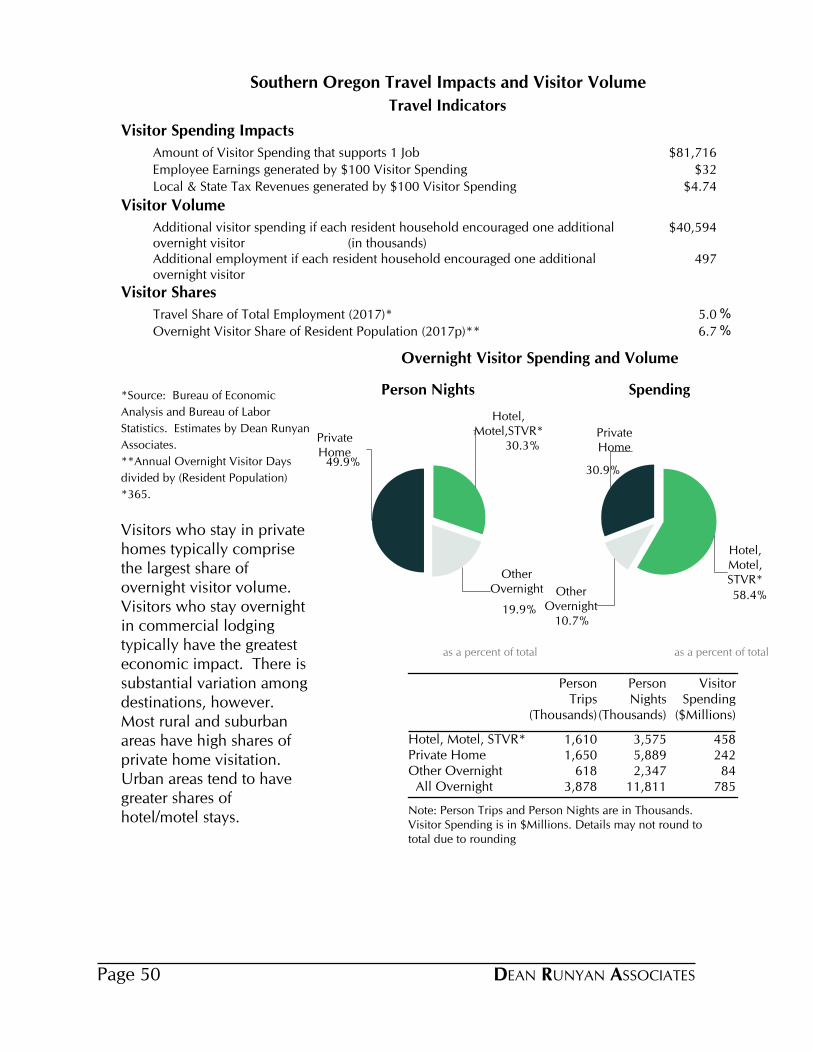
Southern Oregon Travel Impacts and Visitor Volume
Travel Indicators
Visitor Spending Impacts
Amount of Visitor Spending that supports 1 Job $81,716
Employee Earnings generated by $100 Visitor Spending $32
Local & State Tax Revenues generated by $100 Visitor Spending $4.74
Visitor Volume
Additional visitor spending if each resident household encouraged one additional overnight visitor (in thousands)
$40,594
Additional employment if each resident household encouraged one additional overnight visitor
497
Visitor Shares
Travel Share of Total Employment (2017)* 5.0%
Overnight Visitor Share of Resident Population (2017p)** 6.7%
*Source: Bureau of Economic
Analysis and Bureau of Labor
Statistics. Estimates by Dean Runyan
Associates.
**Annual Overnight Visitor Days
divided by (Resident Population)
*365.
Visitors who stay in private homes typically comprise the largest share of overnight visitor volume. Visitors who stay overnight in commercial lodging typically have the greatest economic impact. There is substantial variation among destinations, however. Most rural and suburban areas have high shares of private home visitation. Urban areas tend to have greater shares of hotel/motel stays.
Note: Person Trips and Person Nights are in Thousands. Visitor Spending is in $Millions. Details may not round to total due to rounding
Person Trips
(Thousands)
Person Nights
(Thousands)
Visitor Spending
($Millions)
Hotel, Motel, STVR* 1,610 3,575 458Private Home 1,650 5,889 242Other Overnight 618 2,347 84 All Overnight 3,878 11,811 785
30.3%
Hotel,Motel,STVR*
19.9%
OtherOvernight
49.9%
PrivateHome
Person Nights
as a percent of total
58.4%
Hotel,Motel,STVR*
10.7%
OtherOvernight
30.9%
PrivateHome
Spending
as a percent of total
Overnight Visitor Spending and Volume
DEAN RUNYAN ASSOCIATESPage 50

Direct Travel Impacts, 2010-2018p
Southern Oregon
Avg. Annual Chg.
Spending ($M) 2010 2012 2014 2016 2017 2018 17-18 10-18Total (Current $) 864 924 956 1,002 1,055 1,097 4.0% 3.0% Other 89 91 90 84 94 105 12.1% 2.1% Visitor 775 833 866 917 961 992 3.2% 3.1% Non-transportation 614 653 693 762 790 801 1.4% 3.4% Transportation 160 181 173 155 171 191 11.6% 2.2%
Earnings ($M)Earnings (Current $) 212 227 251 284 306 326 6.5% 5.5%
Employment (Jobs)Employment 10,040 10,430 10,980 11,670 12,080 12,350 2.2% 2.6%
Tax Revenue ($M)Total (Current $) 31 34 37 42 46 47 2.9% 5.4% Local 9 10 11 13 14 15 3.7% 5.9% State 21 25 26 29 31 32 2.5% 5.2%
Other spending includes resident air travel, travel arrangement and reservation services, and convention and trade show organizers. Non-transportation visitor spending includes accommodations, food services, retail, food stores, and arts, entertainment & recreation. Visitor transportation spending includes private auto, auto rental, other local ground transportation and one-way airfares.Earnings include wages & salaries, earned benefits and proprietor income.Employment includes all full- and part-time employment of payroll employees and proprietors.Local tax revenue includes lodging taxes, auto rental taxes and airport passenger facility charges paid by visitors.State tax revenue includes lodging, and motor fuel tax payments of visitors, and the income tax payments attributable to the travel industry income of businesses and employees.Federal tax revenue includes motor fuel excise taxes and airline ticket taxes paid by visitors, and the payroll and income taxes attributable to the travel industry income of employees and businesses.
DEAN RUNYAN ASSOCIATES Page 51
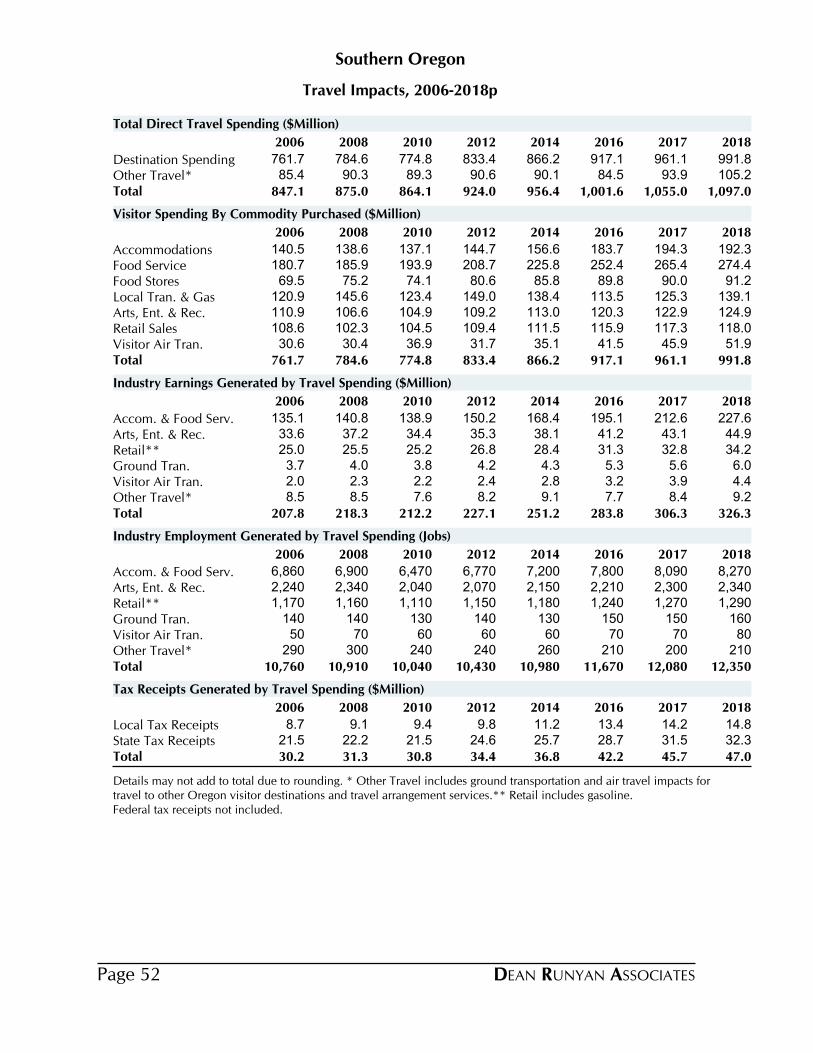
Travel Impacts, 2006-2018p
Southern Oregon
2006 2008 2010 2012 2014 2016 2017 2018
Destination Spending 761.7 784.6 774.8 833.4 866.2 917.1 961.1 991.8Other Travel* 85.4 90.3 89.3 90.6 90.1 84.5 93.9 105.2Total 847.1 875.0 864.1 924.0 956.4 1,001.6 1,055.0 1,097.0
Total Direct Travel Spending ($Million)
2006 2008 2010 2012 2014 2016 2017 2018
Accommodations 140.5 138.6 137.1 144.7 156.6 183.7 194.3 192.3Food Service 180.7 185.9 193.9 208.7 225.8 252.4 265.4 274.4Food Stores 69.5 75.2 74.1 80.6 85.8 89.8 90.0 91.2Local Tran. & Gas 120.9 145.6 123.4 149.0 138.4 113.5 125.3 139.1Arts, Ent. & Rec. 110.9 106.6 104.9 109.2 113.0 120.3 122.9 124.9Retail Sales 108.6 102.3 104.5 109.4 111.5 115.9 117.3 118.0Visitor Air Tran. 30.6 30.4 36.9 31.7 35.1 41.5 45.9 51.9Total 761.7 784.6 774.8 833.4 866.2 917.1 961.1 991.8
Visitor Spending By Commodity Purchased ($Million)
2006 2008 2010 2012 2014 2016 2017 2018
Accom. & Food Serv. 135.1 140.8 138.9 150.2 168.4 195.1 212.6 227.6Arts, Ent. & Rec. 33.6 37.2 34.4 35.3 38.1 41.2 43.1 44.9Retail** 25.0 25.5 25.2 26.8 28.4 31.3 32.8 34.2Ground Tran. 3.7 4.0 3.8 4.2 4.3 5.3 5.6 6.0Visitor Air Tran. 2.0 2.3 2.2 2.4 2.8 3.2 3.9 4.4Other Travel* 8.5 8.5 7.6 8.2 9.1 7.7 8.4 9.2Total 207.8 218.3 212.2 227.1 251.2 283.8 306.3 326.3
Industry Earnings Generated by Travel Spending ($Million)
2006 2008 2010 2012 2014 2016 2017 2018
Accom. & Food Serv. 6,860 6,900 6,470 6,770 7,200 7,800 8,090 8,270Arts, Ent. & Rec. 2,240 2,340 2,040 2,070 2,150 2,210 2,300 2,340Retail** 1,170 1,160 1,110 1,150 1,180 1,240 1,270 1,290Ground Tran. 140 140 130 140 130 150 150 160Visitor Air Tran. 50 70 60 60 60 70 70 80Other Travel* 290 300 240 240 260 210 200 210Total 10,760 10,910 10,040 10,430 10,980 11,670 12,080 12,350
Industry Employment Generated by Travel Spending (Jobs)
2006 2008 2010 2012 2014 2016 2017 2018
Local Tax Receipts 8.7 9.1 9.4 9.8 11.2 13.4 14.2 14.8State Tax Receipts 21.5 22.2 21.5 24.6 25.7 28.7 31.5 32.3Total 30.2 31.3 30.8 34.4 36.8 42.2 45.7 47.0
Tax Receipts Generated by Travel Spending ($Million)
Details may not add to total due to rounding. * Other Travel includes ground transportation and air travel impacts for travel to other Oregon visitor destinations and travel arrangement services.** Retail includes gasoline.Federal tax receipts not included.
DEAN RUNYAN ASSOCIATESPage 52
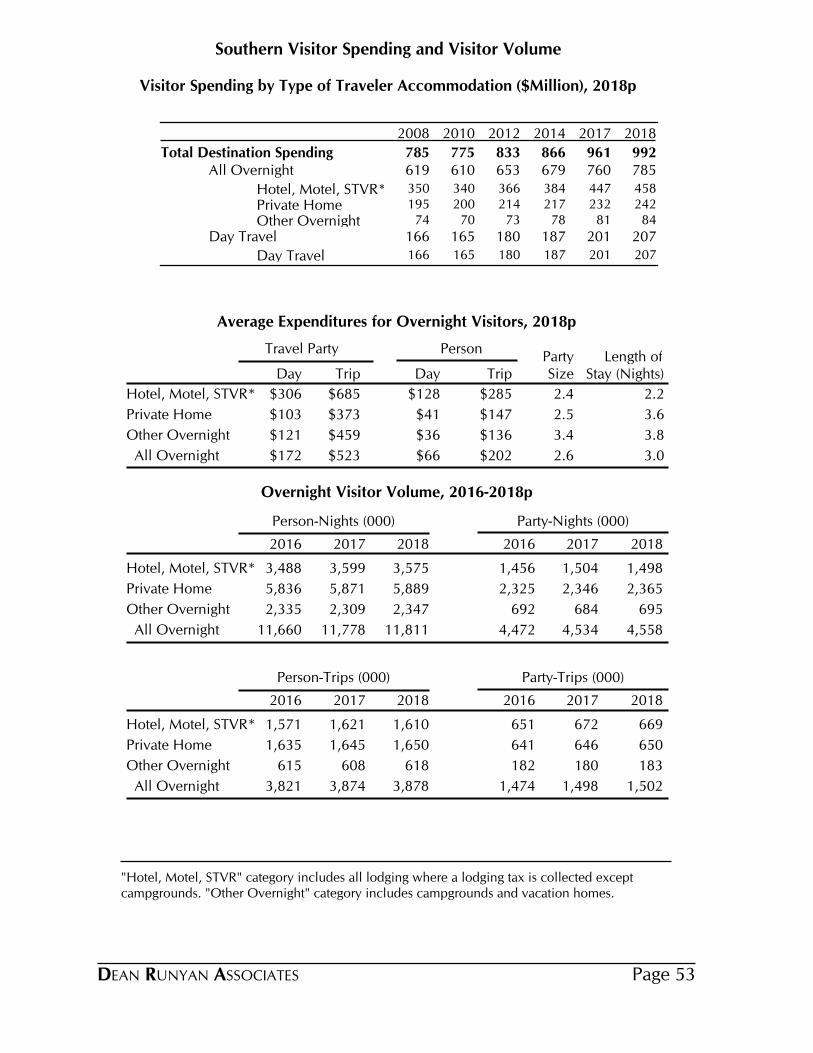
Southern Visitor Spending and Visitor Volume
Visitor Spending by Type of Traveler Accommodation ($Million), 2018p
2008 2010 2012 2014 2017 2018
Total Destination Spending 785 775 833 866 961 992All Overnight 619 610 653 679 760 785
Hotel, Motel, STVR* 350 340 366 384 447 458
Private Home 195 200 214 217 232 242
Other Overnight 74 70 73 78 81 84
Day Travel 166 165 180 187 201 207
Day Travel 166 165 180 187 201 207
Average Expenditures for Overnight Visitors, 2018p
Travel Party PersonParty Length of
Day Trip Day Trip Size Stay (Nights)
$306 $685 $128 $285Hotel, Motel, STVR* 2.4 2.2
$103 $373 $41 $147Private Home 2.5 3.6
$121 $459 $36 $136Other Overnight 3.4 3.8
$172 $523 $66 $202 All Overnight 2.6 3.0
Overnight Visitor Volume, 2016-2018p
Person-Nights (000) Party-Nights (000)
2016 2017 2018 2016 2017 2018
Hotel, Motel, STVR* 3,488 3,599 3,575 1,456 1,504 1,498
Private Home 5,836 5,871 5,889 2,325 2,346 2,365
Other Overnight 2,335 2,309 2,347 692 684 695
All Overnight 11,660 11,778 11,811 4,472 4,534 4,558
Person-Trips (000) Party-Trips (000)
2016 2017 2018 2016 2017 2018
Hotel, Motel, STVR* 1,571 1,621 1,610 651 672 669
Private Home 1,635 1,645 1,650 641 646 650
Other Overnight 615 608 618 182 180 183
All Overnight 3,821 3,874 3,878 1,474 1,498 1,502
"Hotel, Motel, STVR" category includes all lodging where a lodging tax is collected except campgrounds. "Other Overnight" category includes campgrounds and vacation homes.
DEAN RUNYAN ASSOCIATES Page 53
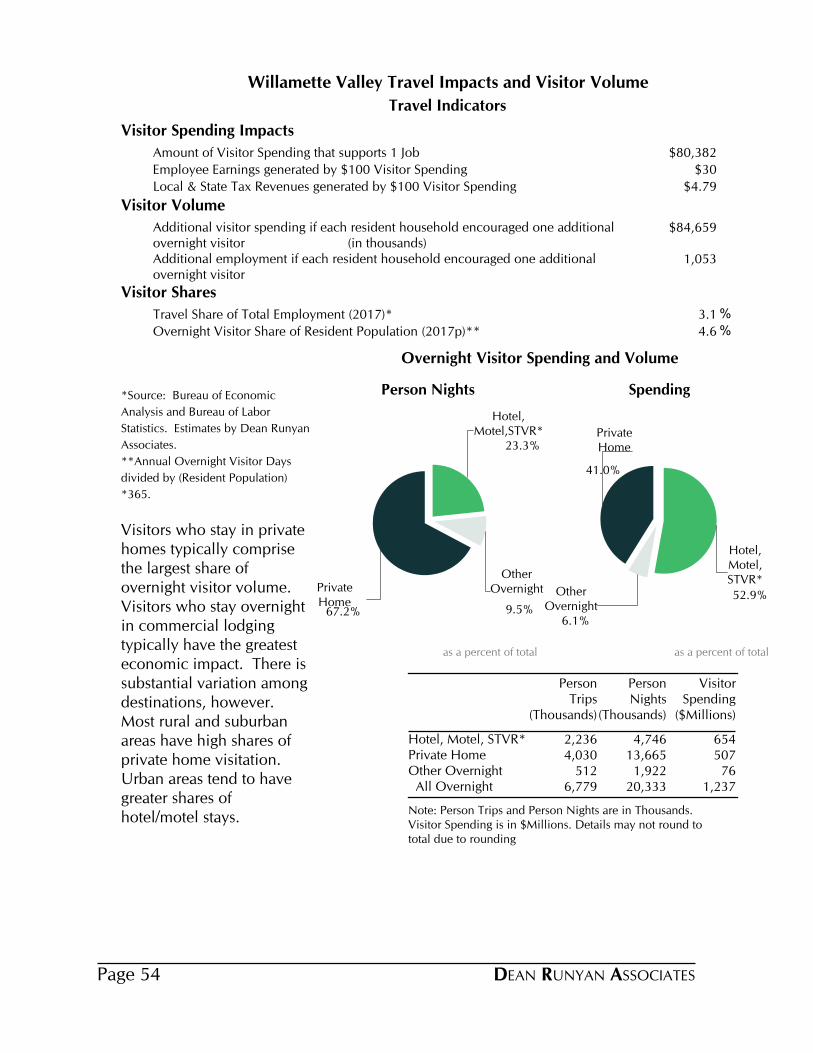
Willamette Valley Travel Impacts and Visitor Volume
Travel Indicators
Visitor Spending Impacts
Amount of Visitor Spending that supports 1 Job $80,382
Employee Earnings generated by $100 Visitor Spending $30
Local & State Tax Revenues generated by $100 Visitor Spending $4.79
Visitor Volume
Additional visitor spending if each resident household encouraged one additional overnight visitor (in thousands)
$84,659
Additional employment if each resident household encouraged one additional overnight visitor
1,053
Visitor Shares
Travel Share of Total Employment (2017)* 3.1%
Overnight Visitor Share of Resident Population (2017p)** 4.6%
*Source: Bureau of Economic
Analysis and Bureau of Labor
Statistics. Estimates by Dean Runyan
Associates.
**Annual Overnight Visitor Days
divided by (Resident Population)
*365.
Visitors who stay in private homes typically comprise the largest share of overnight visitor volume. Visitors who stay overnight in commercial lodging typically have the greatest economic impact. There is substantial variation among destinations, however. Most rural and suburban areas have high shares of private home visitation. Urban areas tend to have greater shares of hotel/motel stays.
Note: Person Trips and Person Nights are in Thousands. Visitor Spending is in $Millions. Details may not round to total due to rounding
Person Trips
(Thousands)
Person Nights
(Thousands)
Visitor Spending
($Millions)
Hotel, Motel, STVR* 2,236 4,746 654Private Home 4,030 13,665 507Other Overnight 512 1,922 76 All Overnight 6,779 20,333 1,237
23.3%
Hotel,Motel,STVR*
9.5%
OtherOvernight
67.2%
PrivateHome
Person Nights
as a percent of total
52.9%
Hotel,Motel,STVR*
6.1%
OtherOvernight
41.0%
PrivateHome
Spending
as a percent of total
Overnight Visitor Spending and Volume
DEAN RUNYAN ASSOCIATESPage 54
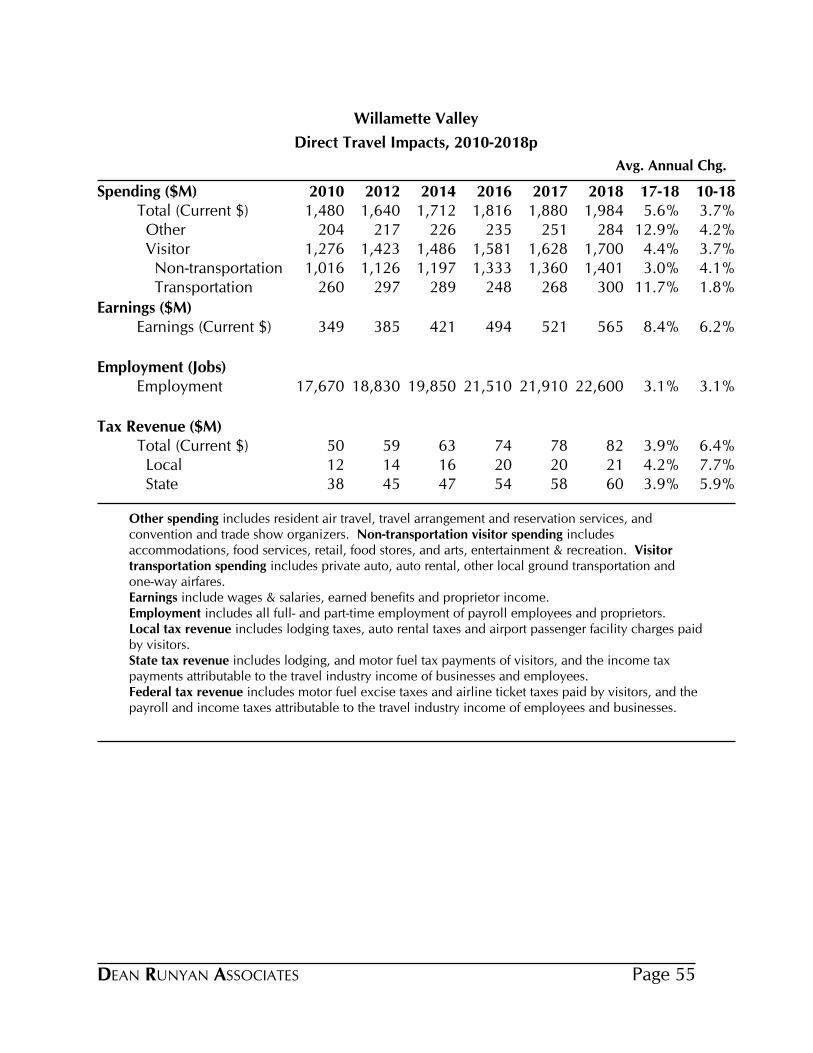
Direct Travel Impacts, 2010-2018p
Willamette Valley
Avg. Annual Chg.
Spending ($M) 2010 2012 2014 2016 2017 2018 17-18 10-18Total (Current $) 1,480 1,640 1,712 1,816 1,880 1,984 5.6% 3.7% Other 204 217 226 235 251 284 12.9% 4.2% Visitor 1,276 1,423 1,486 1,581 1,628 1,700 4.4% 3.7% Non-transportation 1,016 1,126 1,197 1,333 1,360 1,401 3.0% 4.1% Transportation 260 297 289 248 268 300 11.7% 1.8%
Earnings ($M)Earnings (Current $) 349 385 421 494 521 565 8.4% 6.2%
Employment (Jobs)Employment 17,670 18,830 19,850 21,510 21,910 22,600 3.1% 3.1%
Tax Revenue ($M)Total (Current $) 50 59 63 74 78 82 3.9% 6.4% Local 12 14 16 20 20 21 4.2% 7.7% State 38 45 47 54 58 60 3.9% 5.9%
Other spending includes resident air travel, travel arrangement and reservation services, and convention and trade show organizers. Non-transportation visitor spending includes accommodations, food services, retail, food stores, and arts, entertainment & recreation. Visitor transportation spending includes private auto, auto rental, other local ground transportation and one-way airfares.Earnings include wages & salaries, earned benefits and proprietor income.Employment includes all full- and part-time employment of payroll employees and proprietors.Local tax revenue includes lodging taxes, auto rental taxes and airport passenger facility charges paid by visitors.State tax revenue includes lodging, and motor fuel tax payments of visitors, and the income tax payments attributable to the travel industry income of businesses and employees.Federal tax revenue includes motor fuel excise taxes and airline ticket taxes paid by visitors, and the payroll and income taxes attributable to the travel industry income of employees and businesses.
DEAN RUNYAN ASSOCIATES Page 55
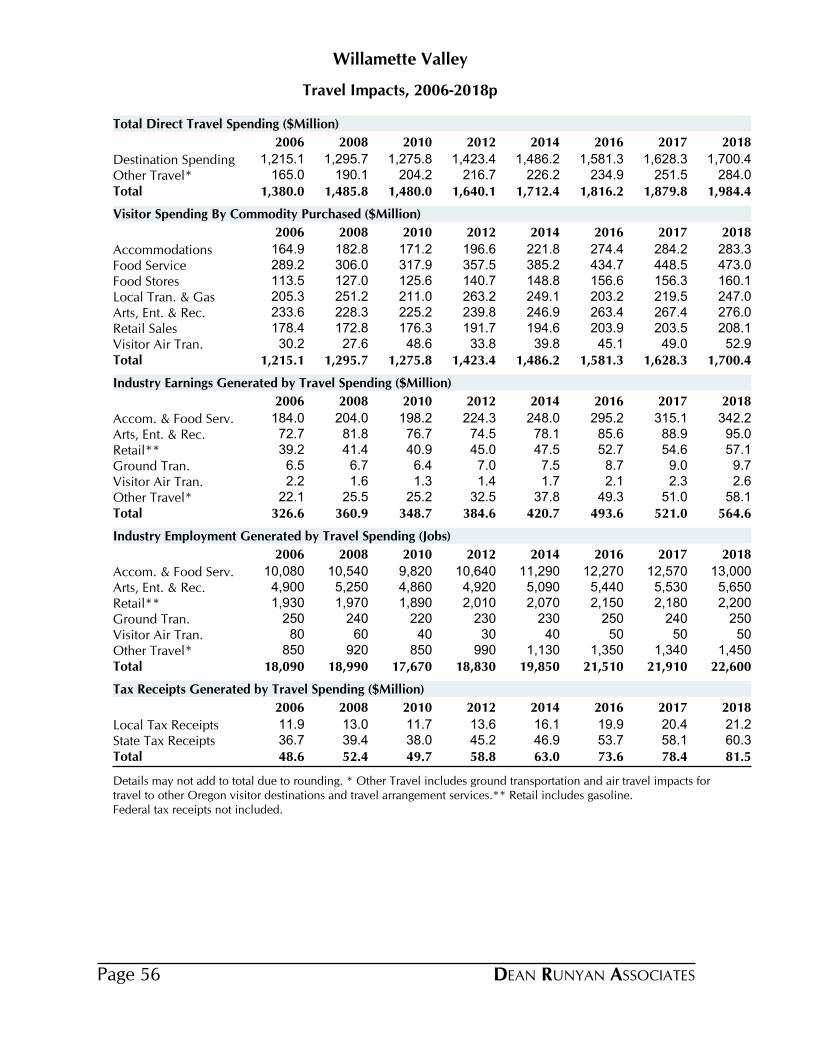
Travel Impacts, 2006-2018p
Willamette Valley
2006 2008 2010 2012 2014 2016 2017 2018
Destination Spending 1,215.1 1,295.7 1,275.8 1,423.4 1,486.2 1,581.3 1,628.3 1,700.4Other Travel* 165.0 190.1 204.2 216.7 226.2 234.9 251.5 284.0Total 1,380.0 1,485.8 1,480.0 1,640.1 1,712.4 1,816.2 1,879.8 1,984.4
Total Direct Travel Spending ($Million)
2006 2008 2010 2012 2014 2016 2017 2018
Accommodations 164.9 182.8 171.2 196.6 221.8 274.4 284.2 283.3Food Service 289.2 306.0 317.9 357.5 385.2 434.7 448.5 473.0Food Stores 113.5 127.0 125.6 140.7 148.8 156.6 156.3 160.1Local Tran. & Gas 205.3 251.2 211.0 263.2 249.1 203.2 219.5 247.0Arts, Ent. & Rec. 233.6 228.3 225.2 239.8 246.9 263.4 267.4 276.0Retail Sales 178.4 172.8 176.3 191.7 194.6 203.9 203.5 208.1Visitor Air Tran. 30.2 27.6 48.6 33.8 39.8 45.1 49.0 52.9Total 1,215.1 1,295.7 1,275.8 1,423.4 1,486.2 1,581.3 1,628.3 1,700.4
Visitor Spending By Commodity Purchased ($Million)
2006 2008 2010 2012 2014 2016 2017 2018
Accom. & Food Serv. 184.0 204.0 198.2 224.3 248.0 295.2 315.1 342.2Arts, Ent. & Rec. 72.7 81.8 76.7 74.5 78.1 85.6 88.9 95.0Retail** 39.2 41.4 40.9 45.0 47.5 52.7 54.6 57.1Ground Tran. 6.5 6.7 6.4 7.0 7.5 8.7 9.0 9.7Visitor Air Tran. 2.2 1.6 1.3 1.4 1.7 2.1 2.3 2.6Other Travel* 22.1 25.5 25.2 32.5 37.8 49.3 51.0 58.1Total 326.6 360.9 348.7 384.6 420.7 493.6 521.0 564.6
Industry Earnings Generated by Travel Spending ($Million)
2006 2008 2010 2012 2014 2016 2017 2018
Accom. & Food Serv. 10,080 10,540 9,820 10,640 11,290 12,270 12,570 13,000Arts, Ent. & Rec. 4,900 5,250 4,860 4,920 5,090 5,440 5,530 5,650Retail** 1,930 1,970 1,890 2,010 2,070 2,150 2,180 2,200Ground Tran. 250 240 220 230 230 250 240 250Visitor Air Tran. 80 60 40 30 40 50 50 50Other Travel* 850 920 850 990 1,130 1,350 1,340 1,450Total 18,090 18,990 17,670 18,830 19,850 21,510 21,910 22,600
Industry Employment Generated by Travel Spending (Jobs)
2006 2008 2010 2012 2014 2016 2017 2018
Local Tax Receipts 11.9 13.0 11.7 13.6 16.1 19.9 20.4 21.2State Tax Receipts 36.7 39.4 38.0 45.2 46.9 53.7 58.1 60.3Total 48.6 52.4 49.7 58.8 63.0 73.6 78.4 81.5
Tax Receipts Generated by Travel Spending ($Million)
Details may not add to total due to rounding. * Other Travel includes ground transportation and air travel impacts for travel to other Oregon visitor destinations and travel arrangement services.** Retail includes gasoline.Federal tax receipts not included.
DEAN RUNYAN ASSOCIATESPage 56
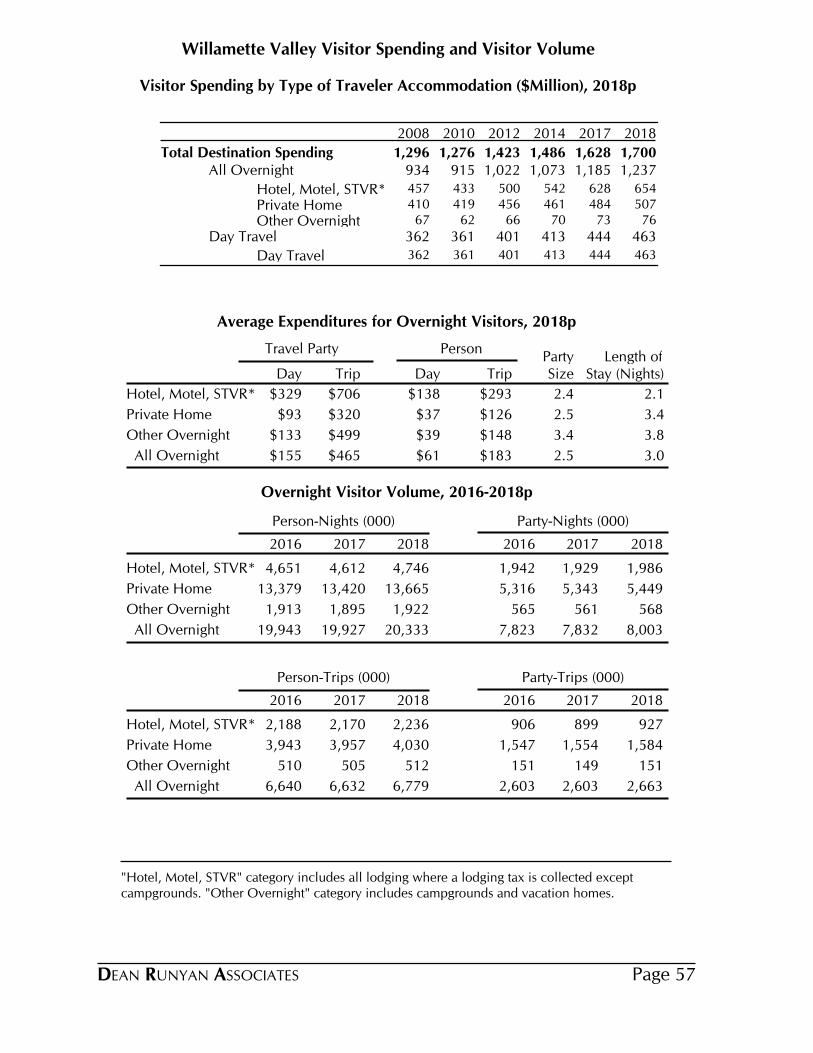
Willamette Valley Visitor Spending and Visitor Volume
Visitor Spending by Type of Traveler Accommodation ($Million), 2018p
2008 2010 2012 2014 2017 2018
Total Destination Spending 1,296 1,276 1,423 1,486 1,628 1,700All Overnight 934 915 1,022 1,073 1,185 1,237
Hotel, Motel, STVR* 457 433 500 542 628 654
Private Home 410 419 456 461 484 507
Other Overnight 67 62 66 70 73 76
Day Travel 362 361 401 413 444 463
Day Travel 362 361 401 413 444 463
Average Expenditures for Overnight Visitors, 2018p
Travel Party PersonParty Length of
Day Trip Day Trip Size Stay (Nights)
$329 $706 $138 $293Hotel, Motel, STVR* 2.4 2.1
$93 $320 $37 $126Private Home 2.5 3.4
$133 $499 $39 $148Other Overnight 3.4 3.8
$155 $465 $61 $183 All Overnight 2.5 3.0
Overnight Visitor Volume, 2016-2018p
Person-Nights (000) Party-Nights (000)
2016 2017 2018 2016 2017 2018
Hotel, Motel, STVR* 4,651 4,612 4,746 1,942 1,929 1,986
Private Home 13,379 13,420 13,665 5,316 5,343 5,449
Other Overnight 1,913 1,895 1,922 565 561 568
All Overnight 19,943 19,927 20,333 7,823 7,832 8,003
Person-Trips (000) Party-Trips (000)
2016 2017 2018 2016 2017 2018
Hotel, Motel, STVR* 2,188 2,170 2,236 906 899 927
Private Home 3,943 3,957 4,030 1,547 1,554 1,584
Other Overnight 510 505 512 151 149 151
All Overnight 6,640 6,632 6,779 2,603 2,603 2,663
"Hotel, Motel, STVR" category includes all lodging where a lodging tax is collected except campgrounds. "Other Overnight" category includes campgrounds and vacation homes.
DEAN RUNYAN ASSOCIATES Page 57
IV. OREGON COUNTY TRAVEL IMPACTS
DEAN RUNYAN ASSOCIATESPAGE 58
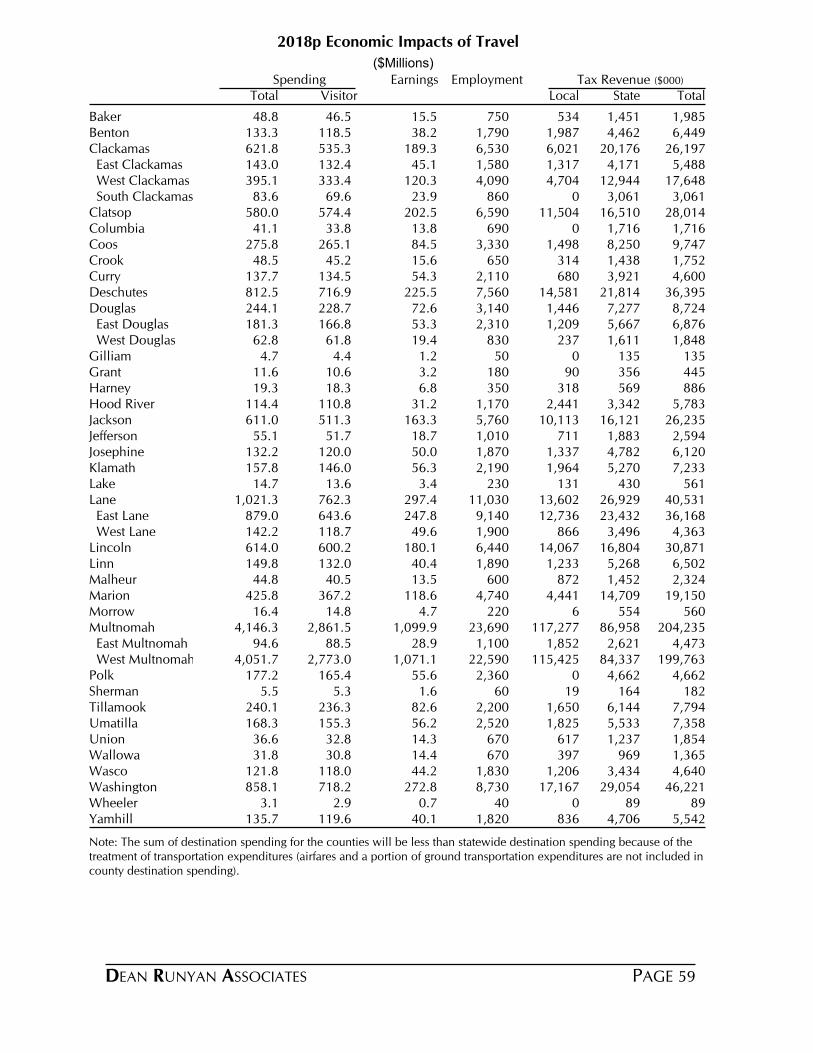
Tax Revenue ($000)SpendingTotal Visitor
Earnings EmploymentLocal State Total
($Millions)
2018p Economic Impacts of Travel
Baker 48.8 46.5 15.5 750 534 1,451 1,985Benton 133.3 118.5 38.2 1,790 1,987 4,462 6,449Clackamas 621.8 535.3 189.3 6,530 6,021 20,176 26,197 East Clackamas 143.0 132.4 45.1 1,580 1,317 4,171 5,488 West Clackamas 395.1 333.4 120.3 4,090 4,704 12,944 17,648 South Clackamas 83.6 69.6 23.9 860 0 3,061 3,061Clatsop 580.0 574.4 202.5 6,590 11,504 16,510 28,014Columbia 41.1 33.8 13.8 690 0 1,716 1,716Coos 275.8 265.1 84.5 3,330 1,498 8,250 9,747Crook 48.5 45.2 15.6 650 314 1,438 1,752Curry 137.7 134.5 54.3 2,110 680 3,921 4,600Deschutes 812.5 716.9 225.5 7,560 14,581 21,814 36,395Douglas 244.1 228.7 72.6 3,140 1,446 7,277 8,724 East Douglas 181.3 166.8 53.3 2,310 1,209 5,667 6,876 West Douglas 62.8 61.8 19.4 830 237 1,611 1,848Gilliam 4.7 4.4 1.2 50 0 135 135Grant 11.6 10.6 3.2 180 90 356 445Harney 19.3 18.3 6.8 350 318 569 886Hood River 114.4 110.8 31.2 1,170 2,441 3,342 5,783Jackson 611.0 511.3 163.3 5,760 10,113 16,121 26,235Jefferson 55.1 51.7 18.7 1,010 711 1,883 2,594Josephine 132.2 120.0 50.0 1,870 1,337 4,782 6,120Klamath 157.8 146.0 56.3 2,190 1,964 5,270 7,233Lake 14.7 13.6 3.4 230 131 430 561Lane 1,021.3 762.3 297.4 11,030 13,602 26,929 40,531 East Lane 879.0 643.6 247.8 9,140 12,736 23,432 36,168 West Lane 142.2 118.7 49.6 1,900 866 3,496 4,363Lincoln 614.0 600.2 180.1 6,440 14,067 16,804 30,871Linn 149.8 132.0 40.4 1,890 1,233 5,268 6,502Malheur 44.8 40.5 13.5 600 872 1,452 2,324Marion 425.8 367.2 118.6 4,740 4,441 14,709 19,150Morrow 16.4 14.8 4.7 220 6 554 560Multnomah 4,146.3 2,861.5 1,099.9 23,690 117,277 86,958 204,235 East Multnomah 94.6 88.5 28.9 1,100 1,852 2,621 4,473 West Multnomah 4,051.7 2,773.0 1,071.1 22,590 115,425 84,337 199,763Polk 177.2 165.4 55.6 2,360 0 4,662 4,662Sherman 5.5 5.3 1.6 60 19 164 182Tillamook 240.1 236.3 82.6 2,200 1,650 6,144 7,794Umatilla 168.3 155.3 56.2 2,520 1,825 5,533 7,358Union 36.6 32.8 14.3 670 617 1,237 1,854Wallowa 31.8 30.8 14.4 670 397 969 1,365Wasco 121.8 118.0 44.2 1,830 1,206 3,434 4,640Washington 858.1 718.2 272.8 8,730 17,167 29,054 46,221Wheeler 3.1 2.9 0.7 40 0 89 89Yamhill 135.7 119.6 40.1 1,820 836 4,706 5,542
Note: The sum of destination spending for the counties will be less than statewide destination spending because of the treatment of transportation expenditures (airfares and a portion of ground transportation expenditures are not included in county destination spending).
DEAN RUNYAN ASSOCIATES PAGE 59
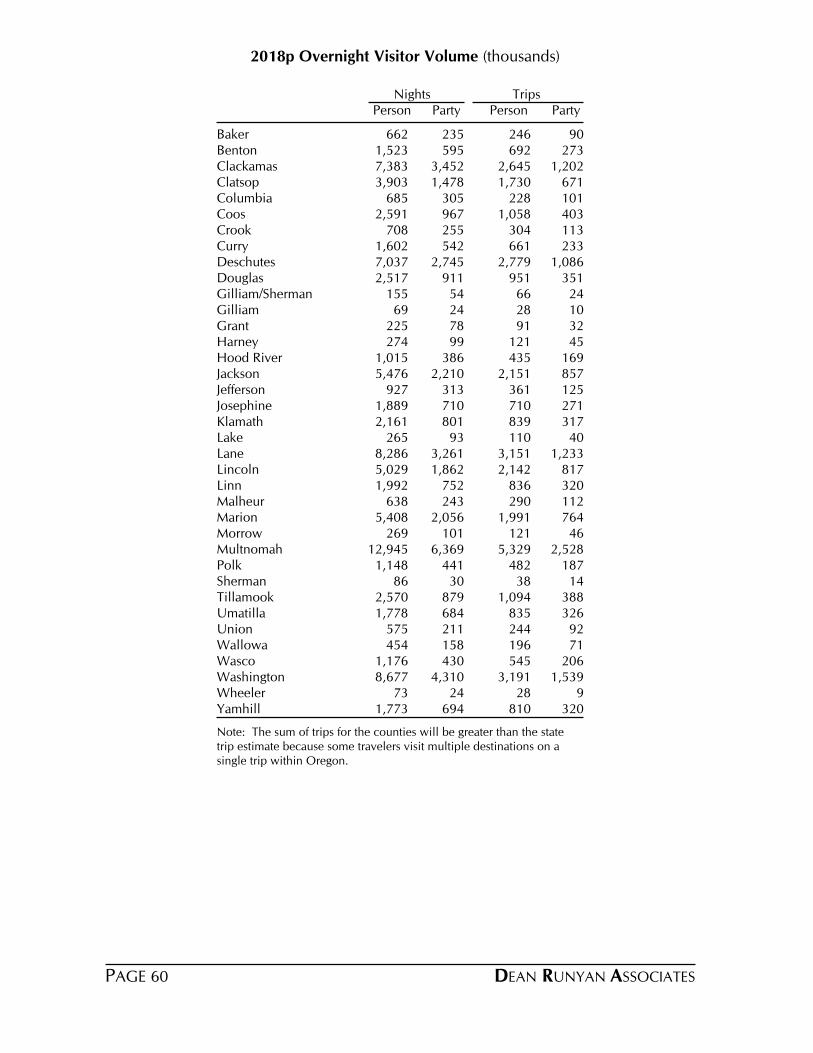
2018p Overnight Visitor Volume (thousands)
PersonPerson Party PartyNights Trips
Baker 662 235 246 90Benton 1,523 595 692 273Clackamas 7,383 3,452 2,645 1,202Clatsop 3,903 1,478 1,730 671Columbia 685 305 228 101Coos 2,591 967 1,058 403Crook 708 255 304 113Curry 1,602 542 661 233Deschutes 7,037 2,745 2,779 1,086Douglas 2,517 911 951 351Gilliam/Sherman 155 54 66 24Gilliam 69 24 28 10Grant 225 78 91 32Harney 274 99 121 45Hood River 1,015 386 435 169Jackson 5,476 2,210 2,151 857Jefferson 927 313 361 125Josephine 1,889 710 710 271Klamath 2,161 801 839 317Lake 265 93 110 40Lane 8,286 3,261 3,151 1,233Lincoln 5,029 1,862 2,142 817Linn 1,992 752 836 320Malheur 638 243 290 112Marion 5,408 2,056 1,991 764Morrow 269 101 121 46Multnomah 12,945 6,369 5,329 2,528Polk 1,148 441 482 187Sherman 86 30 38 14Tillamook 2,570 879 1,094 388Umatilla 1,778 684 835 326Union 575 211 244 92Wallowa 454 158 196 71Wasco 1,176 430 545 206Washington 8,677 4,310 3,191 1,539Wheeler 73 24 28 9Yamhill 1,773 694 810 320
Note: The sum of trips for the counties will be greater than the state trip estimate because some travelers visit multiple destinations on a single trip within Oregon.
DEAN RUNYAN ASSOCIATESPAGE 60
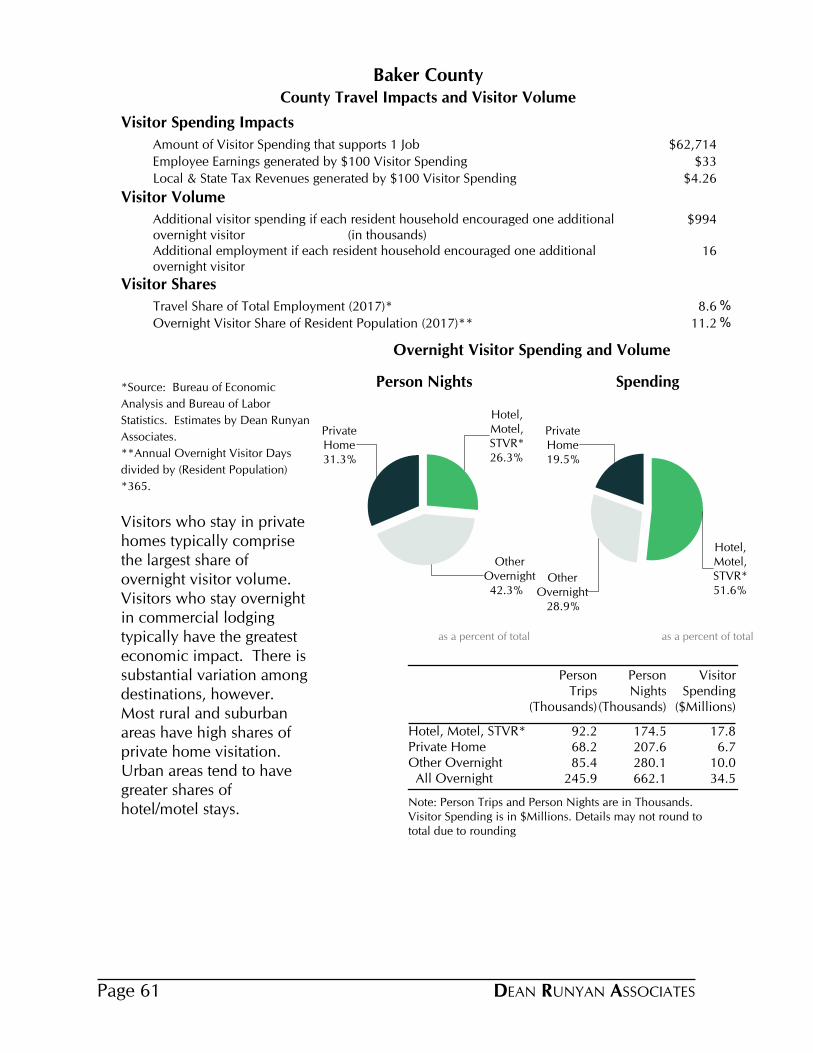
County Travel Impacts and Visitor Volume
Baker County
Visitor Spending Impacts
Amount of Visitor Spending that supports 1 Job $62,714
Employee Earnings generated by $100 Visitor Spending $33
Local & State Tax Revenues generated by $100 Visitor Spending $4.26
Visitor Volume
Additional visitor spending if each resident household encouraged one additional overnight visitor (in thousands)
$994
Additional employment if each resident household encouraged one additional overnight visitor
16
Visitor Shares
Travel Share of Total Employment (2017)* 8.6 %
Overnight Visitor Share of Resident Population (2017)** 11.2 %
*Source: Bureau of Economic
Analysis and Bureau of Labor
Statistics. Estimates by Dean Runyan
Associates.
**Annual Overnight Visitor Days
divided by (Resident Population)
*365.
Visitors who stay in private homes typically comprise the largest share of overnight visitor volume. Visitors who stay overnight in commercial lodging typically have the greatest economic impact. There is substantial variation among destinations, however. Most rural and suburban areas have high shares of private home visitation. Urban areas tend to have greater shares of hotel/motel stays.
Note: Person Trips and Person Nights are in Thousands. Visitor Spending is in $Millions. Details may not round to total due to rounding
Person Trips
(Thousands)
Person Nights
(Thousands)
Visitor Spending
($Millions)
Hotel, Motel, STVR* 92.2 174.5 17.8Private Home 68.2 207.6 6.7Other Overnight 85.4 280.1 10.0 All Overnight 245.9 662.1 34.5
26.3%
Hotel,Motel,STVR*
42.3%
OtherOvernight
31.3%
PrivateHome
Person Nights
as a percent of total
51.6%
Hotel,Motel,STVR*
28.9%
OtherOvernight
19.5%
PrivateHome
Spending
as a percent of total
Overnight Visitor Spending and Volume
DEAN RUNYAN ASSOCIATESPage 61

Direct Travel Impacts, 2010-2018p
Avg. Annual Chg.
Baker
Spending ($M) 2010 2012 2014 2016 2017 2018 17-18 10-18Total (Current $) 41.7 43.3 43.6 45.0 47.2 48.8 3.4% 2.0% Other 2.2 2.7 2.5 1.9 2.0 2.3 11.5% 0.4% Visitor 39.5 40.6 41.1 43.1 45.2 46.5 3.0% 2.1% Non-transportation 34.5 34.9 36.1 39.1 40.7 41.7 2.3% 2.4% Transportation 5.0 5.7 5.1 4.0 4.4 4.9 9.9% -0.3%
Earnings ($M)Earnings (Current $) 10.9 11.6 12.3 13.7 15.1 15.5 3.3% 4.5%
Employment (Jobs)Employment 670 700 720 700 740 750 1.0% 1.3%
Tax Revenue ($M)Total (Current $) 1.5 1.6 1.6 1.8 2.0 2.0 1.3% 3.8% Local 0.4 0.4 0.4 0.5 0.5 0.5 1.4% 3.6% State 1.1 1.2 1.2 1.3 1.4 1.5 1.2% 3.8%
Other spending includes resident air travel, travel arrangement and reservation services, and convention and trade show organizers. Non-transportation visitor spending includes accommodations, food services, retail, food stores, and arts, entertainment & recreation. Visitor transportation spending includes private auto, auto rental, other local ground transportation and one-way airfares.Earnings include wages & salaries, earned benefits and proprietor income.Employment includes all full- and part-time employment of payroll employees and proprietors.Local tax revenue includes lodging taxes, auto rental taxes and airport passenger facility charges paid by visitors.State tax revenue includes lodging, and motor fuel tax payments of visitors, and the income tax payments attributable to the travel industry income of businesses and employees.Federal tax revenue includes motor fuel excise taxes and airline ticket taxes paid by visitors, and the payroll and income taxes attributable to the travel industry income of employees and businesses.
DEAN RUNYAN ASSOCIATES Page 62
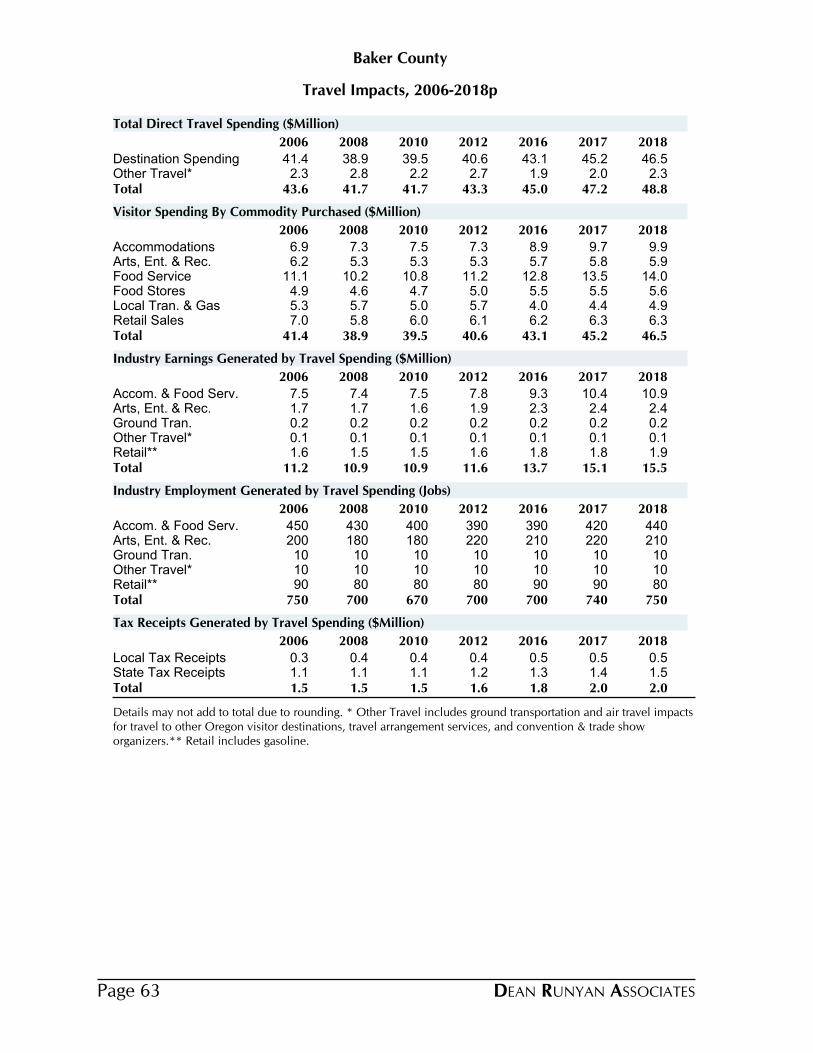
Travel Impacts, 2006-2018p
Baker County
2006 2008 2010 2012 2016 2017 2018
Destination Spending 41.4 38.9 39.5 40.6 43.1 45.2 46.5Other Travel* 2.3 2.8 2.2 2.7 1.9 2.0 2.3Total 43.6 41.7 41.7 43.3 45.0 47.2 48.8
Total Direct Travel Spending ($Million)
2006 2008 2010 2012 2016 2017 2018
Accommodations 6.9 7.3 7.5 7.3 8.9 9.7 9.9Arts, Ent. & Rec. 6.2 5.3 5.3 5.3 5.7 5.8 5.9Food Service 11.1 10.2 10.8 11.2 12.8 13.5 14.0Food Stores 4.9 4.6 4.7 5.0 5.5 5.5 5.6Local Tran. & Gas 5.3 5.7 5.0 5.7 4.0 4.4 4.9Retail Sales 7.0 5.8 6.0 6.1 6.2 6.3 6.3Total 41.4 38.9 39.5 40.6 43.1 45.2 46.5
Visitor Spending By Commodity Purchased ($Million)
2006 2008 2010 2012 2016 2017 2018
Accom. & Food Serv. 7.5 7.4 7.5 7.8 9.3 10.4 10.9Arts, Ent. & Rec. 1.7 1.7 1.6 1.9 2.3 2.4 2.4Ground Tran. 0.2 0.2 0.2 0.2 0.2 0.2 0.2Other Travel* 0.1 0.1 0.1 0.1 0.1 0.1 0.1Retail** 1.6 1.5 1.5 1.6 1.8 1.8 1.9Total 11.2 10.9 10.9 11.6 13.7 15.1 15.5
Industry Earnings Generated by Travel Spending ($Million)
2006 2008 2010 2012 2016 2017 2018
Accom. & Food Serv. 450 430 400 390 390 420 440Arts, Ent. & Rec. 200 180 180 220 210 220 210Ground Tran. 10 10 10 10 10 10 10Other Travel* 10 10 10 10 10 10 10Retail** 90 80 80 80 90 90 80Total 750 700 670 700 700 740 750
Industry Employment Generated by Travel Spending (Jobs)
2006 2008 2010 2012 2016 2017 2018
Local Tax Receipts 0.3 0.4 0.4 0.4 0.5 0.5 0.5State Tax Receipts 1.1 1.1 1.1 1.2 1.3 1.4 1.5Total 1.5 1.5 1.5 1.6 1.8 2.0 2.0
Tax Receipts Generated by Travel Spending ($Million)
Details may not add to total due to rounding. * Other Travel includes ground transportation and air travel impacts for travel to other Oregon visitor destinations, travel arrangement services, and convention & trade show organizers.** Retail includes gasoline.
DEAN RUNYAN ASSOCIATESPage 63

County Visitor Spending and Visitor VolumeBaker
Visitor Spending by Type of Traveler Accommodation ($Million), 2006-2018p
2006 2008 2010 2012 2016 2017 2018
Total Destination Spending 41.4 38.9 39.5 40.6 43.1 45.2 46.5All Overnight 28.6 29.0 29.3 29.9 31.8 33.5 34.5
Hotel, Motel, STVR* 14.5 15.2 15.0 14.8 15.9 17.3 17.8
Private Home 5.6 5.8 6.0 6.4 6.4 6.6 6.7
Other Overnight 8.5 8.0 8.3 8.7 9.5 9.6 10.0
Day Travel 12.8 9.9 10.2 10.7 11.4 11.7 12.0
Day Travel 12.8 9.9 10.2 10.7 11.4 11.7 12.0
Average Expenditures for Overnight Visitors, 2018p
Travel Party PersonParty Length of
Day Trip Day Trip Size Stay (Nights)
$250 $472 $102 $193Hotel, Motel, STVR* 2.4 1.9
$85 $257 $32 $99Private Home 2.6 3.0
$118 $388 $36 $117Other Overnight 3.3 3.3
$147 $385 $52 $140 All Overnight 2.8 2.6
Overnight Visitor Volume, 2016-2018p
Person-Nights (000) Party-Nights (000)
2016 2017 2018 2016 2017 2018
Hotel, Motel, STVR* 166 173 174 68 71 71
Private Home 206 207 208 79 79 80
Other Overnight 278 275 280 84 83 84
All Overnight 651 656 662 231 233 235
Person-Trips (000) Party-Trips (000)
2016 2017 2018 2016 2017 2018
Hotel, Motel, STVR* 88 92 92 36 38 38
Private Home 68 68 68 26 26 26
Other Overnight 85 84 85 26 25 26
All Overnight 241 244 246 87 89 90
"Hotel, Motel" category includes all lodging where a lodging tax is collected except campgrounds. "Other Overnight" category includes campgrounds and vacation homes.
DEAN RUNYAN ASSOCIATES Page 64
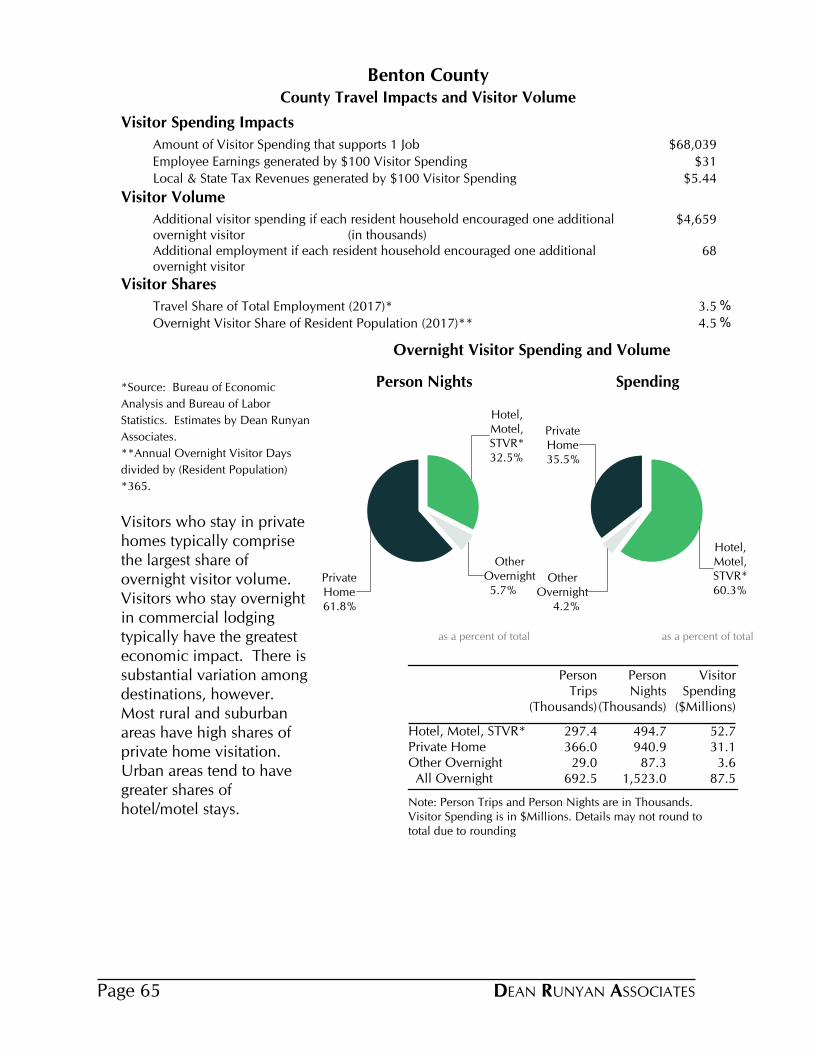
County Travel Impacts and Visitor Volume
Benton County
Visitor Spending Impacts
Amount of Visitor Spending that supports 1 Job $68,039
Employee Earnings generated by $100 Visitor Spending $31
Local & State Tax Revenues generated by $100 Visitor Spending $5.44
Visitor Volume
Additional visitor spending if each resident household encouraged one additional overnight visitor (in thousands)
$4,659
Additional employment if each resident household encouraged one additional overnight visitor
68
Visitor Shares
Travel Share of Total Employment (2017)* 3.5 %
Overnight Visitor Share of Resident Population (2017)** 4.5 %
*Source: Bureau of Economic
Analysis and Bureau of Labor
Statistics. Estimates by Dean Runyan
Associates.
**Annual Overnight Visitor Days
divided by (Resident Population)
*365.
Visitors who stay in private homes typically comprise the largest share of overnight visitor volume. Visitors who stay overnight in commercial lodging typically have the greatest economic impact. There is substantial variation among destinations, however. Most rural and suburban areas have high shares of private home visitation. Urban areas tend to have greater shares of hotel/motel stays.
Note: Person Trips and Person Nights are in Thousands. Visitor Spending is in $Millions. Details may not round to total due to rounding
Person Trips
(Thousands)
Person Nights
(Thousands)
Visitor Spending
($Millions)
Hotel, Motel, STVR* 297.4 494.7 52.7Private Home 366.0 940.9 31.1Other Overnight 29.0 87.3 3.6 All Overnight 692.5 1,523.0 87.5
32.5%
Hotel,Motel,STVR*
5.7%
OtherOvernight
61.8%
PrivateHome
Person Nights
as a percent of total
60.3%
Hotel,Motel,STVR*
4.2%
OtherOvernight
35.5%
PrivateHome
Spending
as a percent of total
Overnight Visitor Spending and Volume
DEAN RUNYAN ASSOCIATESPage 65

Direct Travel Impacts, 2010-2018p
Avg. Annual Chg.
Benton
Spending ($M) 2010 2012 2014 2016 2017 2018 17-18 10-18Total (Current $) 99.1 114.3 115.3 118.0 122.0 133.3 9.3% 3.8% Other 13.7 17.1 15.4 13.2 14.5 14.7 1.6% 0.9% Visitor 85.4 97.2 99.9 104.8 107.5 118.5 10.3% 4.2% Non-transportation 74.3 83.1 87.1 94.7 96.5 105.6 9.4% 4.5% Transportation 11.1 14.0 12.8 10.1 10.9 12.9 18.1% 2.0%
Earnings ($M)Earnings (Current $) 25.1 28.4 30.5 34.1 35.8 38.2 6.6% 5.4%
Employment (Jobs)Employment 1,460 1,590 1,600 1,750 1,790 1,790 0.4% 2.6%
Tax Revenue ($M)Total (Current $) 4.0 4.8 5.0 5.7 6.0 6.4 7.0% 6.0% Local 1.2 1.3 1.5 1.7 1.8 2.0 12.5% 7.0% State 2.9 3.5 3.6 3.9 4.3 4.5 4.7% 5.6%
Other spending includes resident air travel, travel arrangement and reservation services, and convention and trade show organizers. Non-transportation visitor spending includes accommodations, food services, retail, food stores, and arts, entertainment & recreation. Visitor transportation spending includes private auto, auto rental, other local ground transportation and one-way airfares.Earnings include wages & salaries, earned benefits and proprietor income.Employment includes all full- and part-time employment of payroll employees and proprietors.Local tax revenue includes lodging taxes, auto rental taxes and airport passenger facility charges paid by visitors.State tax revenue includes lodging, and motor fuel tax payments of visitors, and the income tax payments attributable to the travel industry income of businesses and employees.Federal tax revenue includes motor fuel excise taxes and airline ticket taxes paid by visitors, and the payroll and income taxes attributable to the travel industry income of employees and businesses.
DEAN RUNYAN ASSOCIATES Page 66
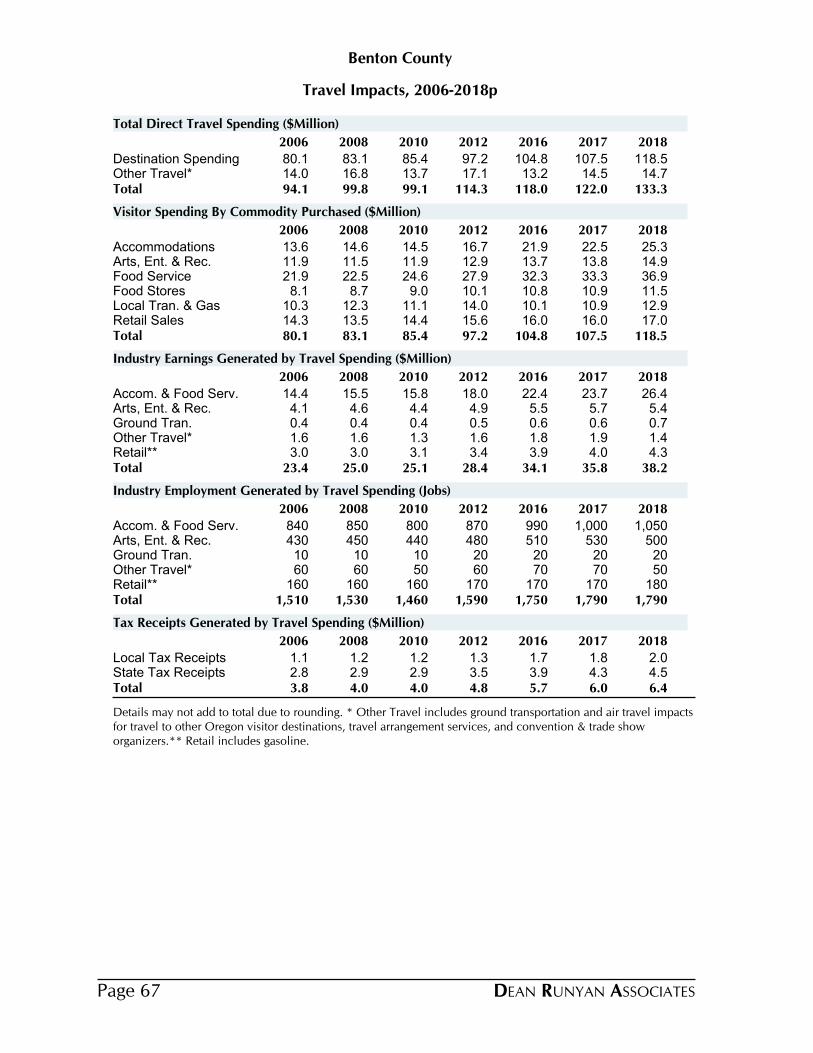
Travel Impacts, 2006-2018p
Benton County
2006 2008 2010 2012 2016 2017 2018
Destination Spending 80.1 83.1 85.4 97.2 104.8 107.5 118.5Other Travel* 14.0 16.8 13.7 17.1 13.2 14.5 14.7Total 94.1 99.8 99.1 114.3 118.0 122.0 133.3
Total Direct Travel Spending ($Million)
2006 2008 2010 2012 2016 2017 2018
Accommodations 13.6 14.6 14.5 16.7 21.9 22.5 25.3Arts, Ent. & Rec. 11.9 11.5 11.9 12.9 13.7 13.8 14.9Food Service 21.9 22.5 24.6 27.9 32.3 33.3 36.9Food Stores 8.1 8.7 9.0 10.1 10.8 10.9 11.5Local Tran. & Gas 10.3 12.3 11.1 14.0 10.1 10.9 12.9Retail Sales 14.3 13.5 14.4 15.6 16.0 16.0 17.0Total 80.1 83.1 85.4 97.2 104.8 107.5 118.5
Visitor Spending By Commodity Purchased ($Million)
2006 2008 2010 2012 2016 2017 2018
Accom. & Food Serv. 14.4 15.5 15.8 18.0 22.4 23.7 26.4Arts, Ent. & Rec. 4.1 4.6 4.4 4.9 5.5 5.7 5.4Ground Tran. 0.4 0.4 0.4 0.5 0.6 0.6 0.7Other Travel* 1.6 1.6 1.3 1.6 1.8 1.9 1.4Retail** 3.0 3.0 3.1 3.4 3.9 4.0 4.3Total 23.4 25.0 25.1 28.4 34.1 35.8 38.2
Industry Earnings Generated by Travel Spending ($Million)
2006 2008 2010 2012 2016 2017 2018
Accom. & Food Serv. 840 850 800 870 990 1,000 1,050Arts, Ent. & Rec. 430 450 440 480 510 530 500Ground Tran. 10 10 10 20 20 20 20Other Travel* 60 60 50 60 70 70 50Retail** 160 160 160 170 170 170 180Total 1,510 1,530 1,460 1,590 1,750 1,790 1,790
Industry Employment Generated by Travel Spending (Jobs)
2006 2008 2010 2012 2016 2017 2018
Local Tax Receipts 1.1 1.2 1.2 1.3 1.7 1.8 2.0State Tax Receipts 2.8 2.9 2.9 3.5 3.9 4.3 4.5Total 3.8 4.0 4.0 4.8 5.7 6.0 6.4
Tax Receipts Generated by Travel Spending ($Million)
Details may not add to total due to rounding. * Other Travel includes ground transportation and air travel impacts for travel to other Oregon visitor destinations, travel arrangement services, and convention & trade show organizers.** Retail includes gasoline.
DEAN RUNYAN ASSOCIATESPage 67

County Visitor Spending and Visitor VolumeBenton
Visitor Spending by Type of Traveler Accommodation ($Million), 2006-2018p
2006 2008 2010 2012 2016 2017 2018
Total Destination Spending 80.1 83.1 85.4 97.2 104.8 107.5 118.5All Overnight 56.1 60.9 62.0 70.7 76.8 78.9 87.5
Hotel, Motel, STVR* 30.9 33.5 33.4 39.6 45.2 46.1 52.7
Private Home 22.2 24.3 25.7 28.0 28.2 29.2 31.1
Other Overnight 3.0 3.0 2.9 3.1 3.5 3.5 3.6
Day Travel 24.0 22.2 23.3 26.5 28.0 28.6 31.1
Day Travel 24.0 22.2 23.3 26.5 28.0 28.6 31.1
Average Expenditures for Overnight Visitors, 2018p
Travel Party PersonParty Length of
Day Trip Day Trip Size Stay (Nights)
$262 $435 $107 $177Hotel, Motel, STVR* 2.5 1.7
$85 $217 $33 $85Private Home 2.6 2.6
$141 $422 $42 $125Other Overnight 3.4 3.0
$147 $320 $57 $126 All Overnight 2.6 2.2
Overnight Visitor Volume, 2016-2018p
Person-Nights (000) Party-Nights (000)
2016 2017 2018 2016 2017 2018
Hotel, Motel, STVR* 451 442 495 184 180 202
Private Home 889 903 941 347 353 368
Other Overnight 87 86 87 26 25 26
All Overnight 1,427 1,432 1,523 557 559 595
Person-Trips (000) Party-Trips (000)
2016 2017 2018 2016 2017 2018
Hotel, Motel, STVR* 271 266 297 111 108 121
Private Home 346 351 366 135 137 143
Other Overnight 29 29 29 9 8 9
All Overnight 646 646 692 254 254 273
"Hotel, Motel" category includes all lodging where a lodging tax is collected except campgrounds. "Other Overnight" category includes campgrounds and vacation homes.
DEAN RUNYAN ASSOCIATES Page 68
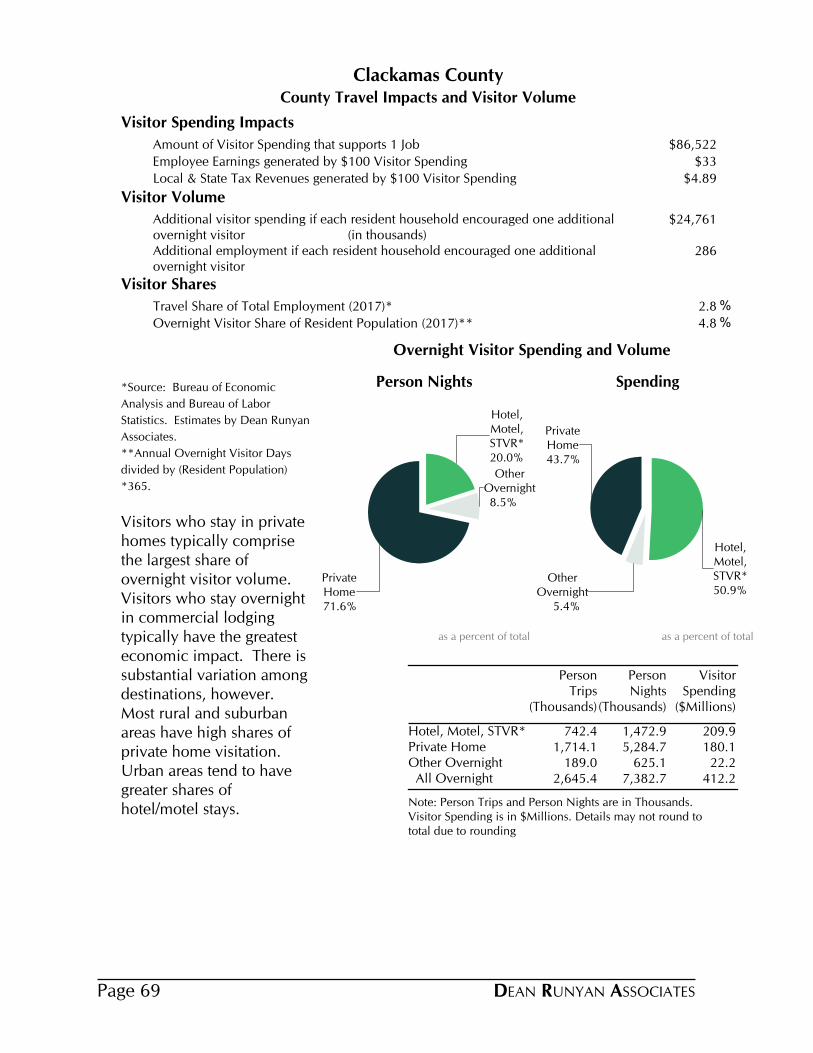
County Travel Impacts and Visitor Volume
Clackamas County
Visitor Spending Impacts
Amount of Visitor Spending that supports 1 Job $86,522
Employee Earnings generated by $100 Visitor Spending $33
Local & State Tax Revenues generated by $100 Visitor Spending $4.89
Visitor Volume
Additional visitor spending if each resident household encouraged one additional overnight visitor (in thousands)
$24,761
Additional employment if each resident household encouraged one additional overnight visitor
286
Visitor Shares
Travel Share of Total Employment (2017)* 2.8 %
Overnight Visitor Share of Resident Population (2017)** 4.8 %
*Source: Bureau of Economic
Analysis and Bureau of Labor
Statistics. Estimates by Dean Runyan
Associates.
**Annual Overnight Visitor Days
divided by (Resident Population)
*365.
Visitors who stay in private homes typically comprise the largest share of overnight visitor volume. Visitors who stay overnight in commercial lodging typically have the greatest economic impact. There is substantial variation among destinations, however. Most rural and suburban areas have high shares of private home visitation. Urban areas tend to have greater shares of hotel/motel stays.
Note: Person Trips and Person Nights are in Thousands. Visitor Spending is in $Millions. Details may not round to total due to rounding
Person Trips
(Thousands)
Person Nights
(Thousands)
Visitor Spending
($Millions)
Hotel, Motel, STVR* 742.4 1,472.9 209.9Private Home 1,714.1 5,284.7 180.1Other Overnight 189.0 625.1 22.2 All Overnight 2,645.4 7,382.7 412.2
20.0%
Hotel,Motel,STVR*
8.5%
OtherOvernight
71.6%
PrivateHome
Person Nights
as a percent of total
50.9%
Hotel,Motel,STVR*
5.4%
OtherOvernight
43.7%
PrivateHome
Spending
as a percent of total
Overnight Visitor Spending and Volume
DEAN RUNYAN ASSOCIATESPage 69

Direct Travel Impacts, 2010-2018p
Avg. Annual Chg.
Clackamas
Spending ($M) 2010 2012 2014 2016 2017 2018 17-18 10-18Total (Current $) 460.1 529.1 551.6 596.0 611.3 621.8 1.7% 3.8% Other 74.0 89.3 89.2 83.1 80.6 86.4 7.2% 2.0% Visitor 386.1 439.8 462.4 512.9 530.7 535.3 0.9% 4.2% Non-transportation 337.3 380.4 405.5 462.0 475.4 476.3 0.2% 4.4% Transportation 48.9 59.4 57.0 50.9 55.3 59.0 6.8% 2.4%
Earnings ($M)Earnings (Current $) 116.0 130.6 143.0 166.5 175.1 189.3 8.1% 6.3%
Employment (Jobs)Employment 5,180 5,530 5,820 6,270 6,430 6,530 1.6% 2.9%
Tax Revenue ($M)Total (Current $) 15.8 19.0 20.4 24.1 25.8 26.2 1.4% 6.5% Local 3.2 3.9 4.6 5.9 6.2 6.0 -2.3% 8.2% State 12.6 15.1 15.8 18.2 19.7 20.2 2.6% 6.1%
Other spending includes resident air travel, travel arrangement and reservation services, and convention and trade show organizers. Non-transportation visitor spending includes accommodations, food services, retail, food stores, and arts, entertainment & recreation. Visitor transportation spending includes private auto, auto rental, other local ground transportation and one-way airfares.Earnings include wages & salaries, earned benefits and proprietor income.Employment includes all full- and part-time employment of payroll employees and proprietors.Local tax revenue includes lodging taxes, auto rental taxes and airport passenger facility charges paid by visitors.State tax revenue includes lodging, and motor fuel tax payments of visitors, and the income tax payments attributable to the travel industry income of businesses and employees.Federal tax revenue includes motor fuel excise taxes and airline ticket taxes paid by visitors, and the payroll and income taxes attributable to the travel industry income of employees and businesses.
DEAN RUNYAN ASSOCIATES Page 70
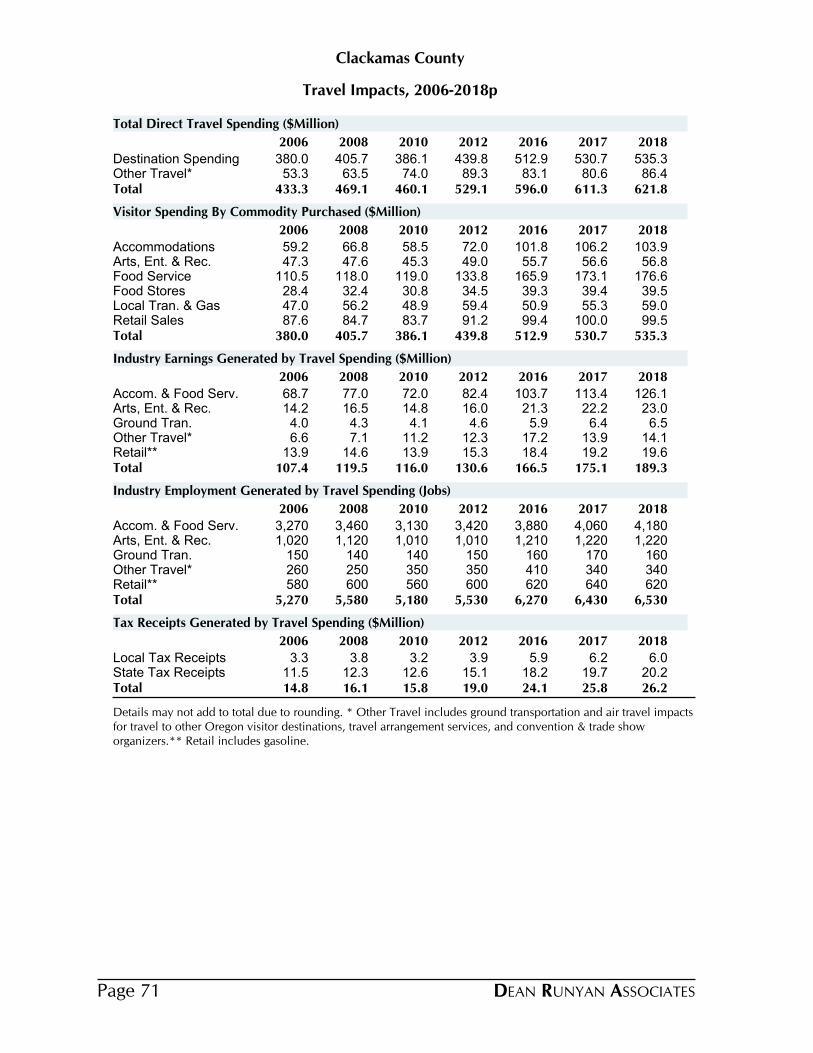
Travel Impacts, 2006-2018p
Clackamas County
2006 2008 2010 2012 2016 2017 2018
Destination Spending 380.0 405.7 386.1 439.8 512.9 530.7 535.3Other Travel* 53.3 63.5 74.0 89.3 83.1 80.6 86.4Total 433.3 469.1 460.1 529.1 596.0 611.3 621.8
Total Direct Travel Spending ($Million)
2006 2008 2010 2012 2016 2017 2018
Accommodations 59.2 66.8 58.5 72.0 101.8 106.2 103.9Arts, Ent. & Rec. 47.3 47.6 45.3 49.0 55.7 56.6 56.8Food Service 110.5 118.0 119.0 133.8 165.9 173.1 176.6Food Stores 28.4 32.4 30.8 34.5 39.3 39.4 39.5Local Tran. & Gas 47.0 56.2 48.9 59.4 50.9 55.3 59.0Retail Sales 87.6 84.7 83.7 91.2 99.4 100.0 99.5Total 380.0 405.7 386.1 439.8 512.9 530.7 535.3
Visitor Spending By Commodity Purchased ($Million)
2006 2008 2010 2012 2016 2017 2018
Accom. & Food Serv. 68.7 77.0 72.0 82.4 103.7 113.4 126.1Arts, Ent. & Rec. 14.2 16.5 14.8 16.0 21.3 22.2 23.0Ground Tran. 4.0 4.3 4.1 4.6 5.9 6.4 6.5Other Travel* 6.6 7.1 11.2 12.3 17.2 13.9 14.1Retail** 13.9 14.6 13.9 15.3 18.4 19.2 19.6Total 107.4 119.5 116.0 130.6 166.5 175.1 189.3
Industry Earnings Generated by Travel Spending ($Million)
2006 2008 2010 2012 2016 2017 2018
Accom. & Food Serv. 3,270 3,460 3,130 3,420 3,880 4,060 4,180Arts, Ent. & Rec. 1,020 1,120 1,010 1,010 1,210 1,220 1,220Ground Tran. 150 140 140 150 160 170 160Other Travel* 260 250 350 350 410 340 340Retail** 580 600 560 600 620 640 620Total 5,270 5,580 5,180 5,530 6,270 6,430 6,530
Industry Employment Generated by Travel Spending (Jobs)
2006 2008 2010 2012 2016 2017 2018
Local Tax Receipts 3.3 3.8 3.2 3.9 5.9 6.2 6.0State Tax Receipts 11.5 12.3 12.6 15.1 18.2 19.7 20.2Total 14.8 16.1 15.8 19.0 24.1 25.8 26.2
Tax Receipts Generated by Travel Spending ($Million)
Details may not add to total due to rounding. * Other Travel includes ground transportation and air travel impacts for travel to other Oregon visitor destinations, travel arrangement services, and convention & trade show organizers.** Retail includes gasoline.
DEAN RUNYAN ASSOCIATESPage 71
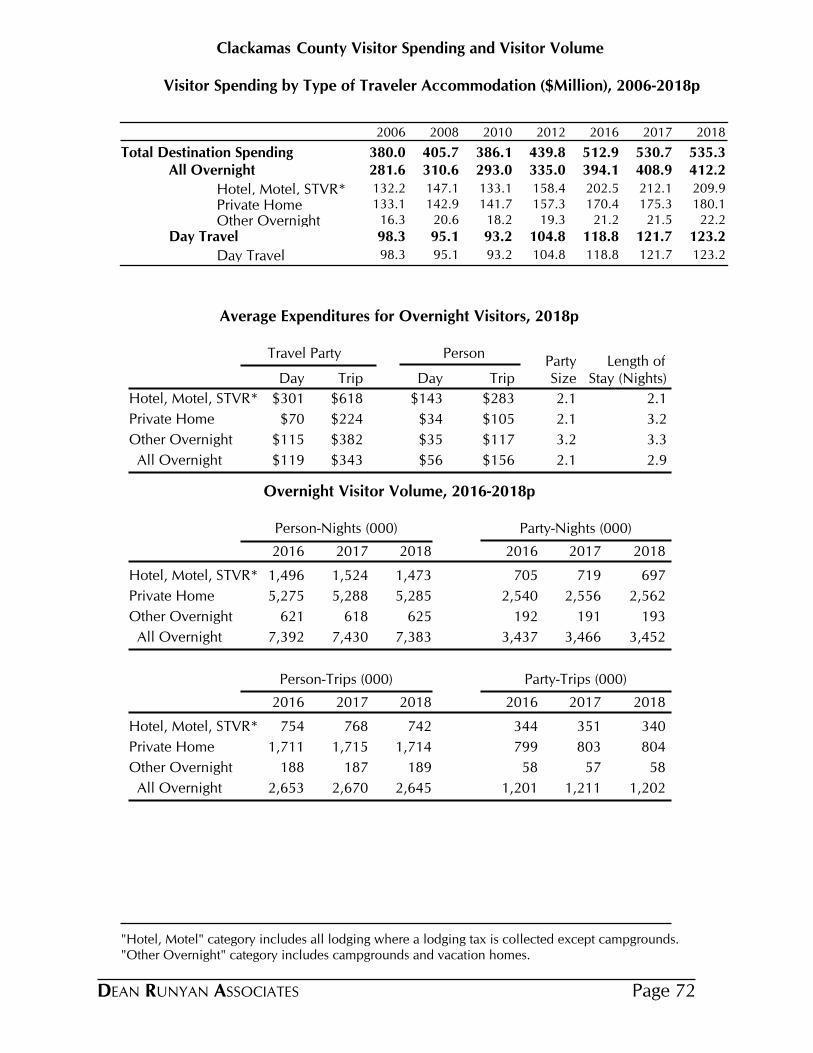
County Visitor Spending and Visitor VolumeClackamas
Visitor Spending by Type of Traveler Accommodation ($Million), 2006-2018p
2006 2008 2010 2012 2016 2017 2018
Total Destination Spending 380.0 405.7 386.1 439.8 512.9 530.7 535.3All Overnight 281.6 310.6 293.0 335.0 394.1 408.9 412.2
Hotel, Motel, STVR* 132.2 147.1 133.1 158.4 202.5 212.1 209.9
Private Home 133.1 142.9 141.7 157.3 170.4 175.3 180.1
Other Overnight 16.3 20.6 18.2 19.3 21.2 21.5 22.2
Day Travel 98.3 95.1 93.2 104.8 118.8 121.7 123.2
Day Travel 98.3 95.1 93.2 104.8 118.8 121.7 123.2
Average Expenditures for Overnight Visitors, 2018p
Travel Party PersonParty Length of
Day Trip Day Trip Size Stay (Nights)
$301 $618 $143 $283Hotel, Motel, STVR* 2.1 2.1
$70 $224 $34 $105Private Home 2.1 3.2
$115 $382 $35 $117Other Overnight 3.2 3.3
$119 $343 $56 $156 All Overnight 2.1 2.9
Overnight Visitor Volume, 2016-2018p
Person-Nights (000) Party-Nights (000)
2016 2017 2018 2016 2017 2018
Hotel, Motel, STVR* 1,496 1,524 1,473 705 719 697
Private Home 5,275 5,288 5,285 2,540 2,556 2,562
Other Overnight 621 618 625 192 191 193
All Overnight 7,392 7,430 7,383 3,437 3,466 3,452
Person-Trips (000) Party-Trips (000)
2016 2017 2018 2016 2017 2018
Hotel, Motel, STVR* 754 768 742 344 351 340
Private Home 1,711 1,715 1,714 799 803 804
Other Overnight 188 187 189 58 57 58
All Overnight 2,653 2,670 2,645 1,201 1,211 1,202
"Hotel, Motel" category includes all lodging where a lodging tax is collected except campgrounds. "Other Overnight" category includes campgrounds and vacation homes.
DEAN RUNYAN ASSOCIATES Page 72
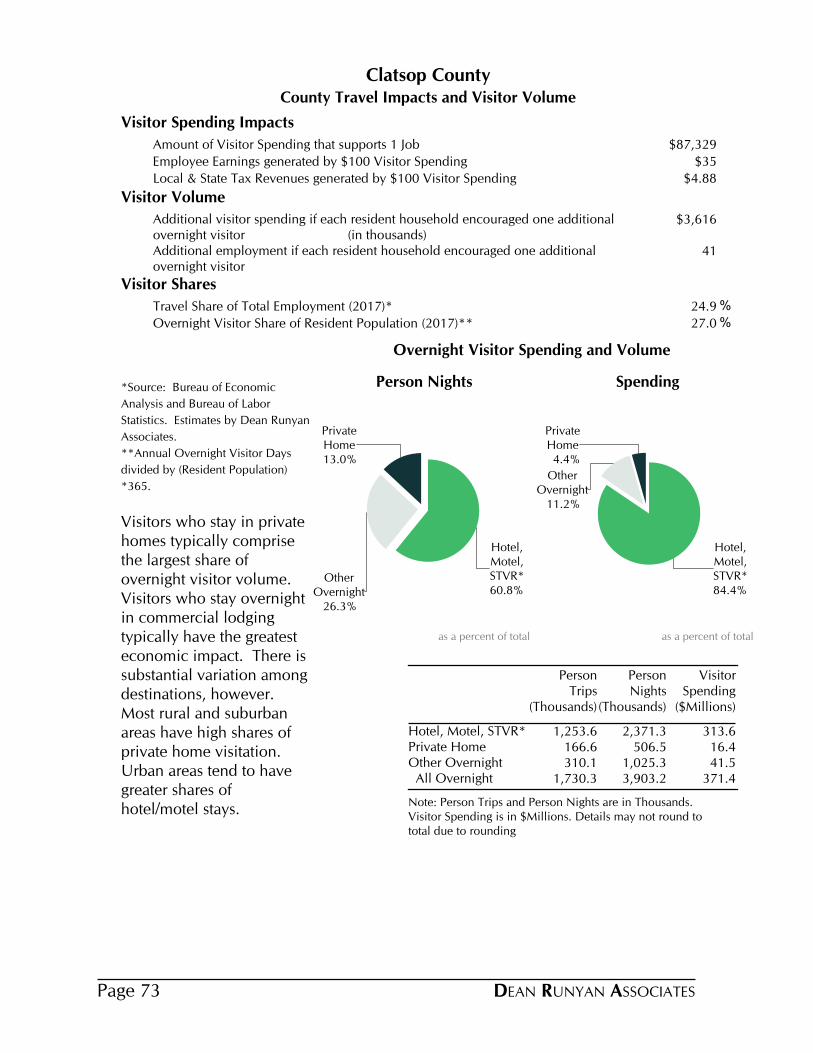
County Travel Impacts and Visitor Volume
Clatsop County
Visitor Spending Impacts
Amount of Visitor Spending that supports 1 Job $87,329
Employee Earnings generated by $100 Visitor Spending $35
Local & State Tax Revenues generated by $100 Visitor Spending $4.88
Visitor Volume
Additional visitor spending if each resident household encouraged one additional overnight visitor (in thousands)
$3,616
Additional employment if each resident household encouraged one additional overnight visitor
41
Visitor Shares
Travel Share of Total Employment (2017)* 24.9 %
Overnight Visitor Share of Resident Population (2017)** 27.0 %
*Source: Bureau of Economic
Analysis and Bureau of Labor
Statistics. Estimates by Dean Runyan
Associates.
**Annual Overnight Visitor Days
divided by (Resident Population)
*365.
Visitors who stay in private homes typically comprise the largest share of overnight visitor volume. Visitors who stay overnight in commercial lodging typically have the greatest economic impact. There is substantial variation among destinations, however. Most rural and suburban areas have high shares of private home visitation. Urban areas tend to have greater shares of hotel/motel stays.
Note: Person Trips and Person Nights are in Thousands. Visitor Spending is in $Millions. Details may not round to total due to rounding
Person Trips
(Thousands)
Person Nights
(Thousands)
Visitor Spending
($Millions)
Hotel, Motel, STVR* 1,253.6 2,371.3 313.6Private Home 166.6 506.5 16.4Other Overnight 310.1 1,025.3 41.5 All Overnight 1,730.3 3,903.2 371.4
60.8%
Hotel,Motel,STVR*
26.3%
OtherOvernight
13.0%
PrivateHome
Person Nights
as a percent of total
84.4%
Hotel,Motel,STVR*
11.2%
OtherOvernight
4.4%
PrivateHome
Spending
as a percent of total
Overnight Visitor Spending and Volume
DEAN RUNYAN ASSOCIATESPage 73

Direct Travel Impacts, 2010-2018p
Avg. Annual Chg.
Clatsop
Spending ($M) 2010 2012 2014 2016 2017 2018 17-18 10-18Total (Current $) 405.2 439.3 516.4 550.6 561.1 580.0 3.4% 4.6% Other 18.2 20.1 7.0 4.5 5.0 5.5 11.5% -13.8% Visitor 387.0 419.2 509.4 546.1 556.1 574.4 3.3% 5.1% Non-transportation 345.6 369.7 454.4 502.0 508.7 522.4 2.7% 5.3% Transportation 41.4 49.6 55.0 44.2 47.4 52.0 9.8% 2.9%
Earnings ($M)Earnings (Current $) 118.6 127.8 142.4 164.2 177.9 202.5 13.8% 6.9%
Employment (Jobs)Employment 5,010 5,090 5,470 5,980 6,220 6,590 6.0% 3.5%
Tax Revenue ($M)Total (Current $) 16.5 18.3 21.6 25.0 26.5 28.0 5.7% 6.9% Local 6.8 7.5 9.3 10.7 11.1 11.5 3.2% 6.8% State 9.7 10.9 12.3 14.2 15.4 16.5 7.6% 6.9%
Other spending includes resident air travel, travel arrangement and reservation services, and convention and trade show organizers. Non-transportation visitor spending includes accommodations, food services, retail, food stores, and arts, entertainment & recreation. Visitor transportation spending includes private auto, auto rental, other local ground transportation and one-way airfares.Earnings include wages & salaries, earned benefits and proprietor income.Employment includes all full- and part-time employment of payroll employees and proprietors.Local tax revenue includes lodging taxes, auto rental taxes and airport passenger facility charges paid by visitors.State tax revenue includes lodging, and motor fuel tax payments of visitors, and the income tax payments attributable to the travel industry income of businesses and employees.Federal tax revenue includes motor fuel excise taxes and airline ticket taxes paid by visitors, and the payroll and income taxes attributable to the travel industry income of employees and businesses.
DEAN RUNYAN ASSOCIATES Page 74

Travel Impacts, 2006-2018p
Clatsop County
2006 2008 2010 2012 2016 2017 2018
Destination Spending 370.3 397.1 387.0 419.2 546.1 556.1 574.4Other Travel* 17.9 15.5 18.2 20.1 4.5 5.0 5.5Total 388.2 412.7 405.2 439.3 550.6 561.1 580.0
Total Direct Travel Spending ($Million)
2006 2008 2010 2012 2016 2017 2018
Accommodations 86.5 94.6 93.2 100.9 141.3 146.8 151.5Arts, Ent. & Rec. 51.6 51.6 49.8 51.8 67.1 66.8 68.0Food Service 101.9 110.4 112.7 121.2 173.9 177.1 183.8Food Stores 30.6 32.8 31.8 34.7 43.8 43.2 43.7Local Tran. & Gas 38.7 49.2 41.4 49.6 44.2 47.4 52.0Retail Sales 61.1 58.5 58.1 61.0 75.8 74.7 75.4Total 370.3 397.1 387.0 419.2 546.1 556.1 574.4
Visitor Spending By Commodity Purchased ($Million)
2006 2008 2010 2012 2016 2017 2018
Accom. & Food Serv. 76.4 85.3 83.0 90.4 123.8 136.5 157.9Arts, Ent. & Rec. 16.0 18.4 16.7 17.3 21.0 21.5 23.4Ground Tran. 1.4 1.5 1.5 1.6 2.4 2.5 2.6Other Travel* 5.7 4.1 5.8 6.2 0.2 0.2 0.3Retail** 11.7 12.0 11.6 12.4 16.8 17.1 18.4Total 111.1 121.5 118.6 127.8 164.2 177.9 202.5
Industry Earnings Generated by Travel Spending ($Million)
2006 2008 2010 2012 2016 2017 2018
Accom. & Food Serv. 3,620 3,740 3,520 3,600 4,380 4,640 4,960Arts, Ent. & Rec. 850 960 830 800 850 850 870Ground Tran. 50 50 50 50 70 70 70Other Travel* 80 70 70 90 10 10 10Retail** 550 560 540 550 680 660 680Total 5,140 5,390 5,010 5,090 5,980 6,220 6,590
Industry Employment Generated by Travel Spending (Jobs)
2006 2008 2010 2012 2016 2017 2018
Local Tax Receipts 6.3 6.8 6.8 7.5 10.7 11.1 11.5State Tax Receipts 9.2 10.0 9.7 10.9 14.2 15.4 16.5Total 15.5 16.7 16.5 18.3 25.0 26.5 28.0
Tax Receipts Generated by Travel Spending ($Million)
Details may not add to total due to rounding. * Other Travel includes ground transportation and air travel impacts for travel to other Oregon visitor destinations, travel arrangement services, and convention & trade show organizers.** Retail includes gasoline.
DEAN RUNYAN ASSOCIATESPage 75
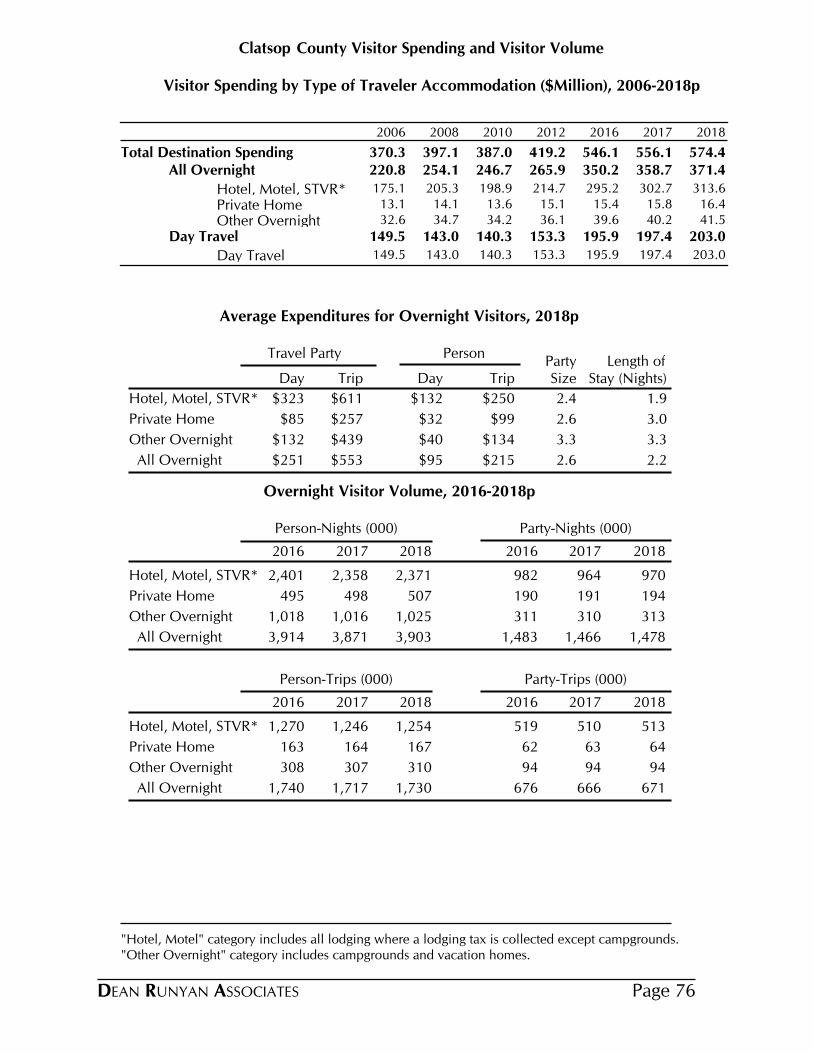
County Visitor Spending and Visitor VolumeClatsop
Visitor Spending by Type of Traveler Accommodation ($Million), 2006-2018p
2006 2008 2010 2012 2016 2017 2018
Total Destination Spending 370.3 397.1 387.0 419.2 546.1 556.1 574.4All Overnight 220.8 254.1 246.7 265.9 350.2 358.7 371.4
Hotel, Motel, STVR* 175.1 205.3 198.9 214.7 295.2 302.7 313.6
Private Home 13.1 14.1 13.6 15.1 15.4 15.8 16.4
Other Overnight 32.6 34.7 34.2 36.1 39.6 40.2 41.5
Day Travel 149.5 143.0 140.3 153.3 195.9 197.4 203.0
Day Travel 149.5 143.0 140.3 153.3 195.9 197.4 203.0
Average Expenditures for Overnight Visitors, 2018p
Travel Party PersonParty Length of
Day Trip Day Trip Size Stay (Nights)
$323 $611 $132 $250Hotel, Motel, STVR* 2.4 1.9
$85 $257 $32 $99Private Home 2.6 3.0
$132 $439 $40 $134Other Overnight 3.3 3.3
$251 $553 $95 $215 All Overnight 2.6 2.2
Overnight Visitor Volume, 2016-2018p
Person-Nights (000) Party-Nights (000)
2016 2017 2018 2016 2017 2018
Hotel, Motel, STVR* 2,401 2,358 2,371 982 964 970
Private Home 495 498 507 190 191 194
Other Overnight 1,018 1,016 1,025 311 310 313
All Overnight 3,914 3,871 3,903 1,483 1,466 1,478
Person-Trips (000) Party-Trips (000)
2016 2017 2018 2016 2017 2018
Hotel, Motel, STVR* 1,270 1,246 1,254 519 510 513
Private Home 163 164 167 62 63 64
Other Overnight 308 307 310 94 94 94
All Overnight 1,740 1,717 1,730 676 666 671
"Hotel, Motel" category includes all lodging where a lodging tax is collected except campgrounds. "Other Overnight" category includes campgrounds and vacation homes.
DEAN RUNYAN ASSOCIATES Page 76
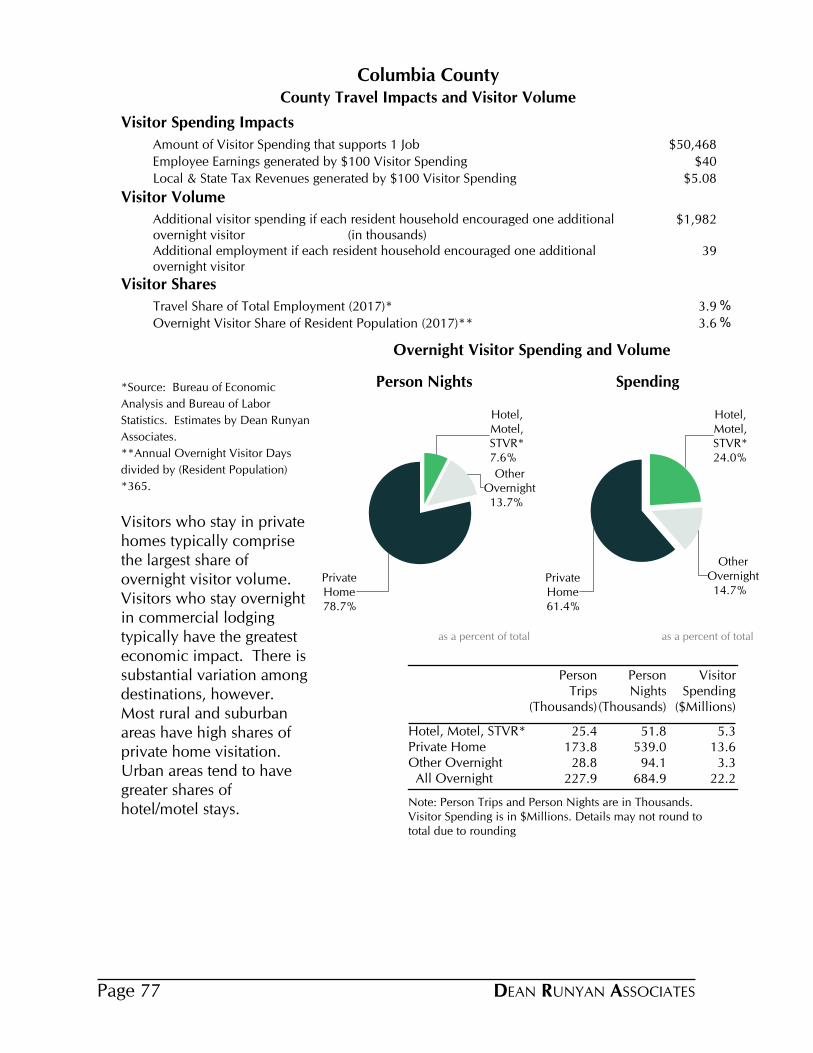
County Travel Impacts and Visitor Volume
Columbia County
Visitor Spending Impacts
Amount of Visitor Spending that supports 1 Job $50,468
Employee Earnings generated by $100 Visitor Spending $40
Local & State Tax Revenues generated by $100 Visitor Spending $5.08
Visitor Volume
Additional visitor spending if each resident household encouraged one additional overnight visitor (in thousands)
$1,982
Additional employment if each resident household encouraged one additional overnight visitor
39
Visitor Shares
Travel Share of Total Employment (2017)* 3.9 %
Overnight Visitor Share of Resident Population (2017)** 3.6 %
*Source: Bureau of Economic
Analysis and Bureau of Labor
Statistics. Estimates by Dean Runyan
Associates.
**Annual Overnight Visitor Days
divided by (Resident Population)
*365.
Visitors who stay in private homes typically comprise the largest share of overnight visitor volume. Visitors who stay overnight in commercial lodging typically have the greatest economic impact. There is substantial variation among destinations, however. Most rural and suburban areas have high shares of private home visitation. Urban areas tend to have greater shares of hotel/motel stays.
Note: Person Trips and Person Nights are in Thousands. Visitor Spending is in $Millions. Details may not round to total due to rounding
Person Trips
(Thousands)
Person Nights
(Thousands)
Visitor Spending
($Millions)
Hotel, Motel, STVR* 25.4 51.8 5.3Private Home 173.8 539.0 13.6Other Overnight 28.8 94.1 3.3 All Overnight 227.9 684.9 22.2
7.6%
Hotel,Motel,STVR*
13.7%
OtherOvernight
78.7%
PrivateHome
Person Nights
as a percent of total
24.0%
Hotel,Motel,STVR*
14.7%
OtherOvernight
61.4%
PrivateHome
Spending
as a percent of total
Overnight Visitor Spending and Volume
DEAN RUNYAN ASSOCIATESPage 77

Direct Travel Impacts, 2010-2018p
Avg. Annual Chg.
Columbia
Spending ($M) 2010 2012 2014 2016 2017 2018 17-18 10-18Total (Current $) 33.7 37.6 38.4 37.3 39.3 41.1 4.7% 2.5% Other 6.7 8.3 7.7 5.9 6.6 7.3 11.5% 1.1% Visitor 27.0 29.3 30.7 31.5 32.7 33.8 3.4% 2.9% Non-transportation 23.8 25.4 27.1 28.6 29.5 30.3 2.7% 3.1% Transportation 3.2 3.8 3.6 2.9 3.2 3.5 10.0% 1.0%
Earnings ($M)Earnings (Current $) 8.2 9.3 10.0 11.3 12.9 13.8 6.9% 6.7%
Employment (Jobs)Employment 530 570 580 630 680 690 1.1% 3.4%
Tax Revenue ($M)Total (Current $) 1.1 1.3 1.4 1.5 1.7 1.7 2.4% 5.6% State 1.1 1.3 1.4 1.5 1.7 1.7 2.4% 5.6%
Other spending includes resident air travel, travel arrangement and reservation services, and convention and trade show organizers. Non-transportation visitor spending includes accommodations, food services, retail, food stores, and arts, entertainment & recreation. Visitor transportation spending includes private auto, auto rental, other local ground transportation and one-way airfares.Earnings include wages & salaries, earned benefits and proprietor income.Employment includes all full- and part-time employment of payroll employees and proprietors.Local tax revenue includes lodging taxes, auto rental taxes and airport passenger facility charges paid by visitors.State tax revenue includes lodging, and motor fuel tax payments of visitors, and the income tax payments attributable to the travel industry income of businesses and employees.Federal tax revenue includes motor fuel excise taxes and airline ticket taxes paid by visitors, and the payroll and income taxes attributable to the travel industry income of employees and businesses.
DEAN RUNYAN ASSOCIATES Page 78
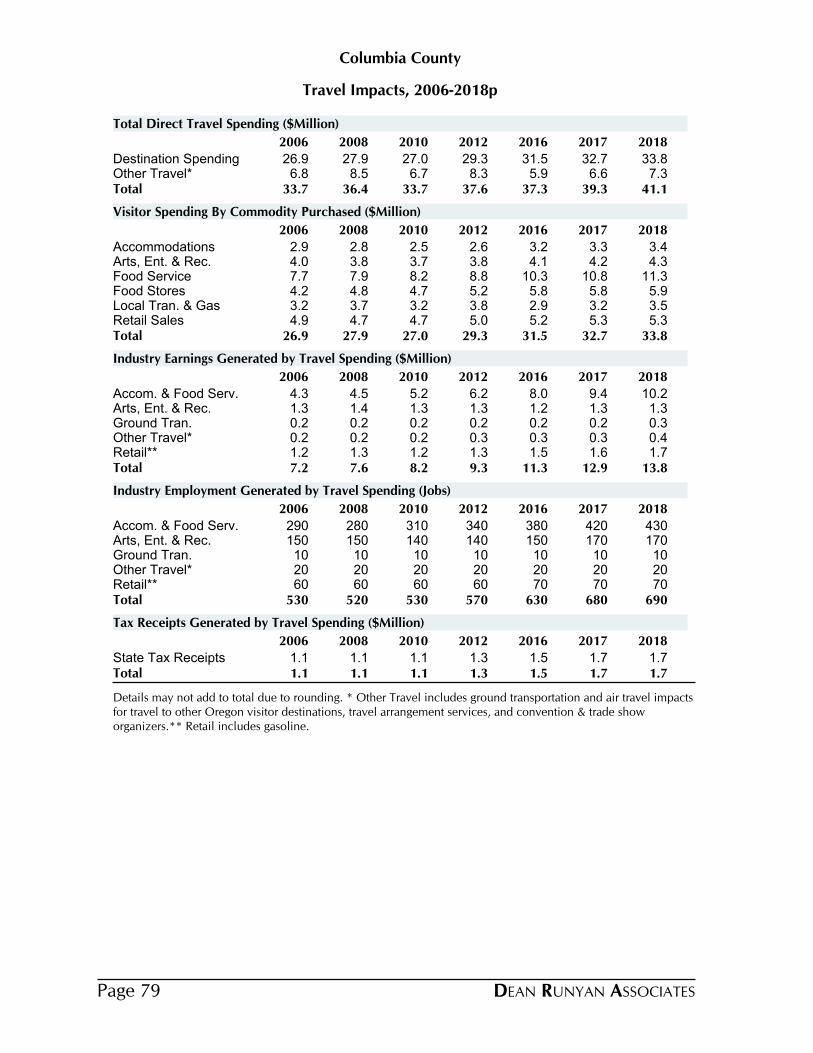
Travel Impacts, 2006-2018p
Columbia County
2006 2008 2010 2012 2016 2017 2018
Destination Spending 26.9 27.9 27.0 29.3 31.5 32.7 33.8Other Travel* 6.8 8.5 6.7 8.3 5.9 6.6 7.3Total 33.7 36.4 33.7 37.6 37.3 39.3 41.1
Total Direct Travel Spending ($Million)
2006 2008 2010 2012 2016 2017 2018
Accommodations 2.9 2.8 2.5 2.6 3.2 3.3 3.4Arts, Ent. & Rec. 4.0 3.8 3.7 3.8 4.1 4.2 4.3Food Service 7.7 7.9 8.2 8.8 10.3 10.8 11.3Food Stores 4.2 4.8 4.7 5.2 5.8 5.8 5.9Local Tran. & Gas 3.2 3.7 3.2 3.8 2.9 3.2 3.5Retail Sales 4.9 4.7 4.7 5.0 5.2 5.3 5.3Total 26.9 27.9 27.0 29.3 31.5 32.7 33.8
Visitor Spending By Commodity Purchased ($Million)
2006 2008 2010 2012 2016 2017 2018
Accom. & Food Serv. 4.3 4.5 5.2 6.2 8.0 9.4 10.2Arts, Ent. & Rec. 1.3 1.4 1.3 1.3 1.2 1.3 1.3Ground Tran. 0.2 0.2 0.2 0.2 0.2 0.2 0.3Other Travel* 0.2 0.2 0.2 0.3 0.3 0.3 0.4Retail** 1.2 1.3 1.2 1.3 1.5 1.6 1.7Total 7.2 7.6 8.2 9.3 11.3 12.9 13.8
Industry Earnings Generated by Travel Spending ($Million)
2006 2008 2010 2012 2016 2017 2018
Accom. & Food Serv. 290 280 310 340 380 420 430Arts, Ent. & Rec. 150 150 140 140 150 170 170Ground Tran. 10 10 10 10 10 10 10Other Travel* 20 20 20 20 20 20 20Retail** 60 60 60 60 70 70 70Total 530 520 530 570 630 680 690
Industry Employment Generated by Travel Spending (Jobs)
2006 2008 2010 2012 2016 2017 2018
State Tax Receipts 1.1 1.1 1.1 1.3 1.5 1.7 1.7Total 1.1 1.1 1.1 1.3 1.5 1.7 1.7
Tax Receipts Generated by Travel Spending ($Million)
Details may not add to total due to rounding. * Other Travel includes ground transportation and air travel impacts for travel to other Oregon visitor destinations, travel arrangement services, and convention & trade show organizers.** Retail includes gasoline.
DEAN RUNYAN ASSOCIATESPage 79
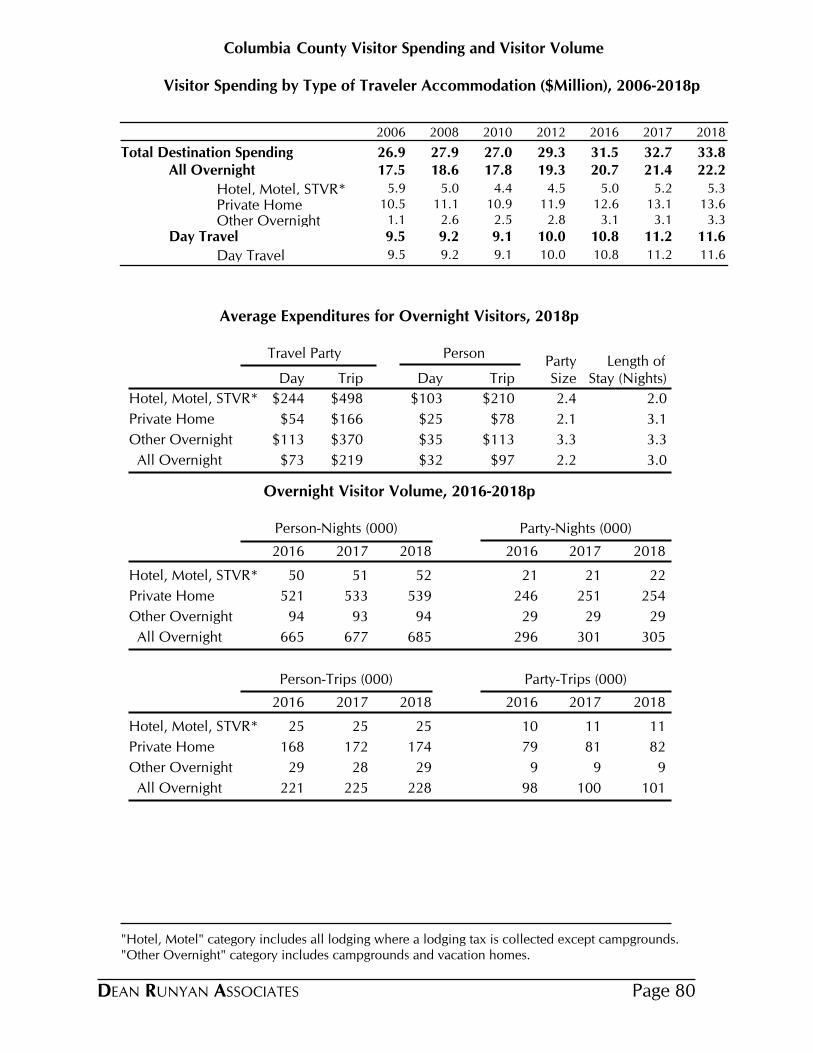
County Visitor Spending and Visitor VolumeColumbia
Visitor Spending by Type of Traveler Accommodation ($Million), 2006-2018p
2006 2008 2010 2012 2016 2017 2018
Total Destination Spending 26.9 27.9 27.0 29.3 31.5 32.7 33.8All Overnight 17.5 18.6 17.8 19.3 20.7 21.4 22.2
Hotel, Motel, STVR* 5.9 5.0 4.4 4.5 5.0 5.2 5.3
Private Home 10.5 11.1 10.9 11.9 12.6 13.1 13.6
Other Overnight 1.1 2.6 2.5 2.8 3.1 3.1 3.3
Day Travel 9.5 9.2 9.1 10.0 10.8 11.2 11.6
Day Travel 9.5 9.2 9.1 10.0 10.8 11.2 11.6
Average Expenditures for Overnight Visitors, 2018p
Travel Party PersonParty Length of
Day Trip Day Trip Size Stay (Nights)
$244 $498 $103 $210Hotel, Motel, STVR* 2.4 2.0
$54 $166 $25 $78Private Home 2.1 3.1
$113 $370 $35 $113Other Overnight 3.3 3.3
$73 $219 $32 $97 All Overnight 2.2 3.0
Overnight Visitor Volume, 2016-2018p
Person-Nights (000) Party-Nights (000)
2016 2017 2018 2016 2017 2018
Hotel, Motel, STVR* 50 51 52 21 21 22
Private Home 521 533 539 246 251 254
Other Overnight 94 93 94 29 29 29
All Overnight 665 677 685 296 301 305
Person-Trips (000) Party-Trips (000)
2016 2017 2018 2016 2017 2018
Hotel, Motel, STVR* 25 25 25 10 11 11
Private Home 168 172 174 79 81 82
Other Overnight 29 28 29 9 9 9
All Overnight 221 225 228 98 100 101
"Hotel, Motel" category includes all lodging where a lodging tax is collected except campgrounds. "Other Overnight" category includes campgrounds and vacation homes.
DEAN RUNYAN ASSOCIATES Page 80
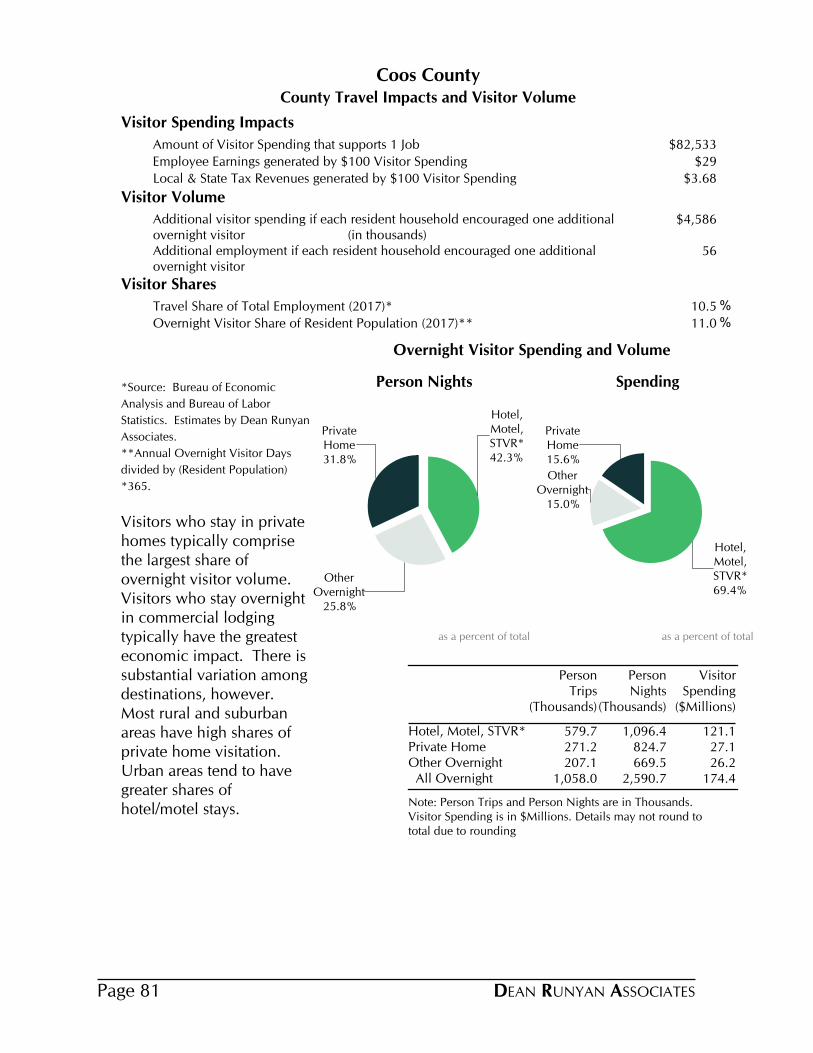
County Travel Impacts and Visitor Volume
Coos County
Visitor Spending Impacts
Amount of Visitor Spending that supports 1 Job $82,533
Employee Earnings generated by $100 Visitor Spending $29
Local & State Tax Revenues generated by $100 Visitor Spending $3.68
Visitor Volume
Additional visitor spending if each resident household encouraged one additional overnight visitor (in thousands)
$4,586
Additional employment if each resident household encouraged one additional overnight visitor
56
Visitor Shares
Travel Share of Total Employment (2017)* 10.5 %
Overnight Visitor Share of Resident Population (2017)** 11.0 %
*Source: Bureau of Economic
Analysis and Bureau of Labor
Statistics. Estimates by Dean Runyan
Associates.
**Annual Overnight Visitor Days
divided by (Resident Population)
*365.
Visitors who stay in private homes typically comprise the largest share of overnight visitor volume. Visitors who stay overnight in commercial lodging typically have the greatest economic impact. There is substantial variation among destinations, however. Most rural and suburban areas have high shares of private home visitation. Urban areas tend to have greater shares of hotel/motel stays.
Note: Person Trips and Person Nights are in Thousands. Visitor Spending is in $Millions. Details may not round to total due to rounding
Person Trips
(Thousands)
Person Nights
(Thousands)
Visitor Spending
($Millions)
Hotel, Motel, STVR* 579.7 1,096.4 121.1Private Home 271.2 824.7 27.1Other Overnight 207.1 669.5 26.2 All Overnight 1,058.0 2,590.7 174.4
42.3%
Hotel,Motel,STVR*
25.8%
OtherOvernight
31.8%
PrivateHome
Person Nights
as a percent of total
69.4%
Hotel,Motel,STVR*
15.0%
OtherOvernight
15.6%
PrivateHome
Spending
as a percent of total
Overnight Visitor Spending and Volume
DEAN RUNYAN ASSOCIATESPage 81

Direct Travel Impacts, 2010-2018p
Avg. Annual Chg.
Coos
Spending ($M) 2010 2012 2014 2016 2017 2018 17-18 10-18Total (Current $) 210.8 230.7 252.6 265.5 271.0 275.8 1.8% 3.4% Other 11.9 12.6 11.2 9.1 9.8 10.7 8.7% -1.4% Visitor 198.9 218.0 241.3 256.4 261.2 265.1 1.5% 3.7% Non-transportation 172.4 186.5 209.4 229.8 233.4 235.1 0.8% 4.0% Transportation 26.4 31.5 31.9 26.6 27.9 30.0 7.7% 1.6%
Earnings ($M)Earnings (Current $) 56.3 60.4 66.6 76.5 79.3 84.5 6.6% 5.2%
Employment (Jobs)Employment 2,940 3,030 3,030 3,280 3,300 3,330 1.1% 1.6%
Tax Revenue ($M)Total (Current $) 6.5 7.3 7.9 9.0 9.5 9.7 2.6% 5.1% Local 1.1 1.1 1.2 1.4 1.5 1.5 1.5% 3.6% State 5.4 6.2 6.7 7.6 8.0 8.2 2.9% 5.4%
Other spending includes resident air travel, travel arrangement and reservation services, and convention and trade show organizers. Non-transportation visitor spending includes accommodations, food services, retail, food stores, and arts, entertainment & recreation. Visitor transportation spending includes private auto, auto rental, other local ground transportation and one-way airfares.Earnings include wages & salaries, earned benefits and proprietor income.Employment includes all full- and part-time employment of payroll employees and proprietors.Local tax revenue includes lodging taxes, auto rental taxes and airport passenger facility charges paid by visitors.State tax revenue includes lodging, and motor fuel tax payments of visitors, and the income tax payments attributable to the travel industry income of businesses and employees.Federal tax revenue includes motor fuel excise taxes and airline ticket taxes paid by visitors, and the payroll and income taxes attributable to the travel industry income of employees and businesses.
Historical revisions have been made to correct for the assignment of visitor air travel to the other travel category total. This correction does not effect economic impact totals.
DEAN RUNYAN ASSOCIATES Page 82

Travel Impacts, 2006-2018p
Coos County
2006 2008 2010 2012 2016 2017 2018
Destination Spending 204.8 217.4 198.9 218.0 256.4 261.2 265.1Other Travel* 13.2 14.9 11.9 12.6 9.1 9.8 10.7Total 218.0 232.3 210.8 230.7 265.5 271.0 275.8
Total Direct Travel Spending ($Million)
2006 2008 2010 2012 2016 2017 2018
Accommodations 42.7 44.7 40.7 45.3 58.8 61.5 59.2Arts, Ent. & Rec. 36.1 35.9 33.1 34.8 40.7 40.6 41.3Food Service 51.5 55.6 53.9 58.7 76.0 77.7 80.5Food Stores 19.6 21.3 19.9 21.7 25.1 24.7 25.1Local Tran. & Gas 23.7 29.6 23.5 28.6 23.0 24.8 27.2Retail Sales 26.6 26.0 24.8 26.1 29.2 28.9 29.1Visitor Air Tran. 4.6 4.4 2.9 2.9 3.6 3.1 2.8Total 204.8 217.4 198.9 218.0 256.4 261.2 265.1
Visitor Spending By Commodity Purchased ($Million)
2006 2008 2010 2012 2016 2017 2018
Accom. & Food Serv. 35.9 39.5 36.1 38.8 49.6 51.3 55.7Arts, Ent. & Rec. 9.6 11.0 9.5 10.5 12.5 12.8 12.8Ground Tran. 0.8 0.9 0.8 0.9 1.2 1.3 1.3Other Travel* 3.5 3.5 3.8 3.8 5.2 5.8 6.5Retail** 6.1 6.5 6.0 6.4 7.9 8.0 8.2Total 56.0 61.3 56.3 60.4 76.5 79.3 84.5
Industry Earnings Generated by Travel Spending ($Million)
2006 2008 2010 2012 2016 2017 2018
Accom. & Food Serv. 1,930 2,010 1,700 1,750 1,950 2,000 2,010Arts, Ent. & Rec. 770 840 830 870 860 820 840Ground Tran. 30 30 30 30 30 30 30Other Travel* 100 110 100 90 110 110 120Retail** 300 310 280 290 330 330 320Total 3,140 3,300 2,940 3,030 3,280 3,300 3,330
Industry Employment Generated by Travel Spending (Jobs)
2006 2008 2010 2012 2016 2017 2018
Local Tax Receipts 1.3 1.3 1.1 1.1 1.4 1.5 1.5State Tax Receipts 5.5 5.9 5.4 6.2 7.6 8.0 8.2Total 6.9 7.3 6.5 7.3 9.0 9.5 9.7
Tax Receipts Generated by Travel Spending ($Million)
Details may not add to total due to rounding. * Other Travel includes ground transportation and air travel impacts for travel to other Oregon visitor destinations, travel arrangement services, and convention & trade show organizers.** Retail includes gasoline.
Historical revisions have been made to correct for the assignment of visitor air travel to the other travel category total. This correction does not effect economic impact totals.
DEAN RUNYAN ASSOCIATESPage 83

County Visitor Spending and Visitor VolumeCoos
Visitor Spending by Type of Traveler Accommodation ($Million), 2006-2018p
2006 2008 2010 2012 2016 2017 2018
Total Destination Spending 200.2 213.0 195.9 215.1 252.8 258.2 262.3All Overnight 129.0 141.9 129.3 141.9 168.3 172.7 174.4
Hotel, Motel, STVR* 84.1 94.5 83.9 93.7 117.3 121.3 121.1
Private Home 23.3 24.6 24.2 25.7 25.8 26.2 27.1
Other Overnight 21.6 22.8 21.2 22.5 25.1 25.3 26.2
Day Travel 71.1 71.1 66.6 73.2 84.6 85.4 87.9
Day Travel 71.1 71.1 66.6 73.2 84.6 85.4 87.9
Average Expenditures for Overnight Visitors, 2018p
Travel Party PersonParty Length of
Day Trip Day Trip Size Stay (Nights)
$269 $509 $110 $209Hotel, Motel, STVR* 2.4 1.9
$85 $259 $33 $100Private Home 2.6 3.1
$134 $432 $39 $127Other Overnight 3.4 3.2
$180 $433 $67 $165 All Overnight 2.7 2.4
Overnight Visitor Volume, 2016-2018p
Person-Nights (000) Party-Nights (000)
2016 2017 2018 2016 2017 2018
Hotel, Motel, STVR* 1,109 1,096 1,096 456 450 450
Private Home 816 813 825 319 317 321
Other Overnight 667 658 670 196 193 196
All Overnight 2,592 2,567 2,591 970 960 967
Person-Trips (000) Party-Trips (000)
2016 2017 2018 2016 2017 2018
Hotel, Motel, STVR* 586 580 580 241 238 238
Private Home 268 267 271 104 103 105
Other Overnight 206 203 207 60 60 61
All Overnight 1,061 1,050 1,058 405 401 403
"Hotel, Motel" category includes all lodging where a lodging tax is collected except campgrounds. "Other Overnight" category includes campgrounds and vacation homes.
DEAN RUNYAN ASSOCIATES Page 84

County Travel Impacts and Visitor Volume
Crook County
Visitor Spending Impacts
Amount of Visitor Spending that supports 1 Job $70,887
Employee Earnings generated by $100 Visitor Spending $34
Local & State Tax Revenues generated by $100 Visitor Spending $3.87
Visitor Volume
Additional visitor spending if each resident household encouraged one additional overnight visitor (in thousands)
$1,117
Additional employment if each resident household encouraged one additional overnight visitor
16
Visitor Shares
Travel Share of Total Employment (2017)* 5.9 %
Overnight Visitor Share of Resident Population (2017)** 8.3 %
*Source: Bureau of Economic
Analysis and Bureau of Labor
Statistics. Estimates by Dean Runyan
Associates.
**Annual Overnight Visitor Days
divided by (Resident Population)
*365.
Visitors who stay in private homes typically comprise the largest share of overnight visitor volume. Visitors who stay overnight in commercial lodging typically have the greatest economic impact. There is substantial variation among destinations, however. Most rural and suburban areas have high shares of private home visitation. Urban areas tend to have greater shares of hotel/motel stays.
Note: Person Trips and Person Nights are in Thousands. Visitor Spending is in $Millions. Details may not round to total due to rounding
Person Trips
(Thousands)
Person Nights
(Thousands)
Visitor Spending
($Millions)
Hotel, Motel, STVR* 123.0 204.6 21.7Private Home 91.9 236.3 5.0Other Overnight 89.5 266.8 9.0 All Overnight 304.5 707.7 35.6
28.9%
Hotel,Motel,STVR*
37.7%
OtherOvernight
33.4%
PrivateHome
Person Nights
as a percent of total
60.9%
Hotel,Motel,STVR*
25.2%
OtherOvernight
13.9%
PrivateHome
Spending
as a percent of total
Overnight Visitor Spending and Volume
DEAN RUNYAN ASSOCIATESPage 85

Direct Travel Impacts, 2010-2018p
Avg. Annual Chg.
Crook
Spending ($M) 2010 2012 2014 2016 2017 2018 17-18 10-18Total (Current $) 29.5 36.1 40.3 44.2 45.9 48.5 5.7% 6.4% Other 2.9 3.5 3.3 2.6 2.9 3.3 11.5% 1.7% Visitor 26.7 32.7 37.1 41.6 43.0 45.2 5.3% 6.8% Non-transportation 24.1 29.3 33.8 38.8 39.9 41.8 4.8% 7.1% Transportation 2.5 3.3 3.3 2.8 3.0 3.4 12.0% 3.7%
Earnings ($M)Earnings (Current $) 8.1 9.2 10.6 13.0 13.8 15.6 12.7% 8.5%
Employment (Jobs)Employment 460 490 510 580 580 650 11.6% 4.4%
Tax Revenue ($M)Total (Current $) 0.9 1.2 1.3 1.5 1.6 1.8 6.6% 8.0% Local 0.2 0.2 0.2 0.3 0.3 0.3 5.4% 7.5% State 0.8 0.9 1.0 1.2 1.3 1.4 6.9% 8.1%
Other spending includes resident air travel, travel arrangement and reservation services, and convention and trade show organizers. Non-transportation visitor spending includes accommodations, food services, retail, food stores, and arts, entertainment & recreation. Visitor transportation spending includes private auto, auto rental, other local ground transportation and one-way airfares.Earnings include wages & salaries, earned benefits and proprietor income.Employment includes all full- and part-time employment of payroll employees and proprietors.Local tax revenue includes lodging taxes, auto rental taxes and airport passenger facility charges paid by visitors.State tax revenue includes lodging, and motor fuel tax payments of visitors, and the income tax payments attributable to the travel industry income of businesses and employees.Federal tax revenue includes motor fuel excise taxes and airline ticket taxes paid by visitors, and the payroll and income taxes attributable to the travel industry income of employees and businesses.
DEAN RUNYAN ASSOCIATES Page 86
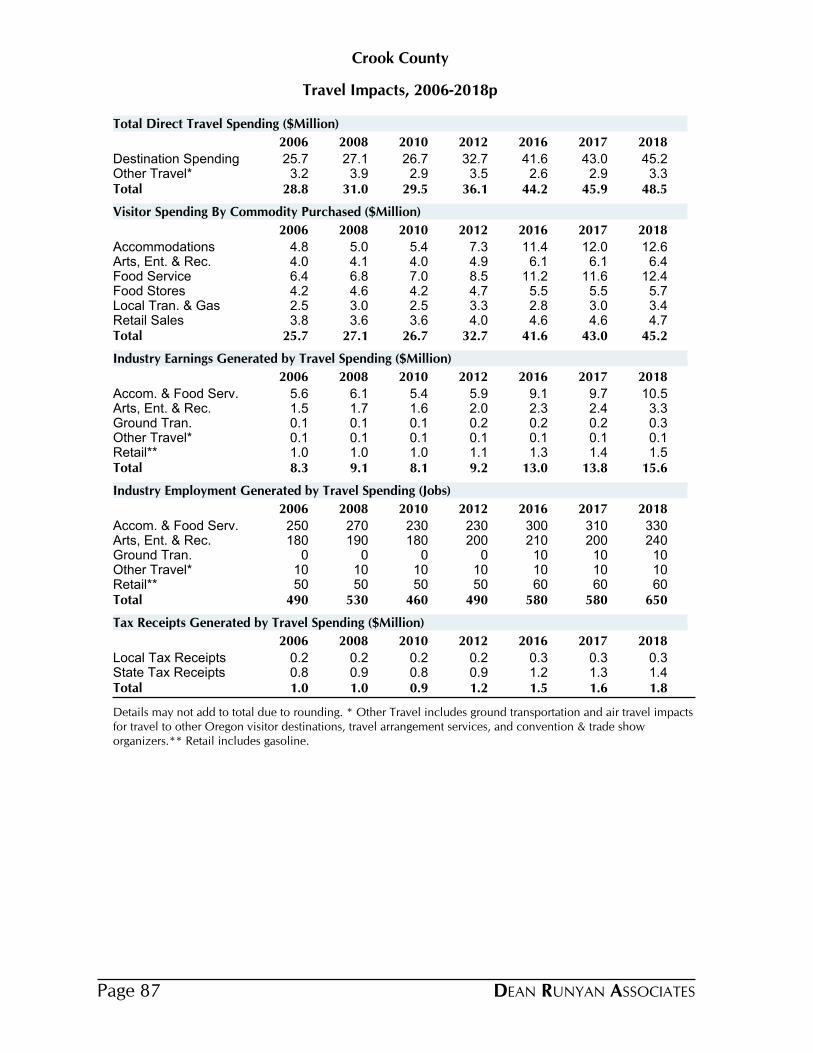
Travel Impacts, 2006-2018p
Crook County
2006 2008 2010 2012 2016 2017 2018
Destination Spending 25.7 27.1 26.7 32.7 41.6 43.0 45.2Other Travel* 3.2 3.9 2.9 3.5 2.6 2.9 3.3Total 28.8 31.0 29.5 36.1 44.2 45.9 48.5
Total Direct Travel Spending ($Million)
2006 2008 2010 2012 2016 2017 2018
Accommodations 4.8 5.0 5.4 7.3 11.4 12.0 12.6Arts, Ent. & Rec. 4.0 4.1 4.0 4.9 6.1 6.1 6.4Food Service 6.4 6.8 7.0 8.5 11.2 11.6 12.4Food Stores 4.2 4.6 4.2 4.7 5.5 5.5 5.7Local Tran. & Gas 2.5 3.0 2.5 3.3 2.8 3.0 3.4Retail Sales 3.8 3.6 3.6 4.0 4.6 4.6 4.7Total 25.7 27.1 26.7 32.7 41.6 43.0 45.2
Visitor Spending By Commodity Purchased ($Million)
2006 2008 2010 2012 2016 2017 2018
Accom. & Food Serv. 5.6 6.1 5.4 5.9 9.1 9.7 10.5Arts, Ent. & Rec. 1.5 1.7 1.6 2.0 2.3 2.4 3.3Ground Tran. 0.1 0.1 0.1 0.2 0.2 0.2 0.3Other Travel* 0.1 0.1 0.1 0.1 0.1 0.1 0.1Retail** 1.0 1.0 1.0 1.1 1.3 1.4 1.5Total 8.3 9.1 8.1 9.2 13.0 13.8 15.6
Industry Earnings Generated by Travel Spending ($Million)
2006 2008 2010 2012 2016 2017 2018
Accom. & Food Serv. 250 270 230 230 300 310 330Arts, Ent. & Rec. 180 190 180 200 210 200 240Ground Tran. 0 0 0 0 10 10 10Other Travel* 10 10 10 10 10 10 10Retail** 50 50 50 50 60 60 60Total 490 530 460 490 580 580 650
Industry Employment Generated by Travel Spending (Jobs)
2006 2008 2010 2012 2016 2017 2018
Local Tax Receipts 0.2 0.2 0.2 0.2 0.3 0.3 0.3State Tax Receipts 0.8 0.9 0.8 0.9 1.2 1.3 1.4Total 1.0 1.0 0.9 1.2 1.5 1.6 1.8
Tax Receipts Generated by Travel Spending ($Million)
Details may not add to total due to rounding. * Other Travel includes ground transportation and air travel impacts for travel to other Oregon visitor destinations, travel arrangement services, and convention & trade show organizers.** Retail includes gasoline.
DEAN RUNYAN ASSOCIATESPage 87
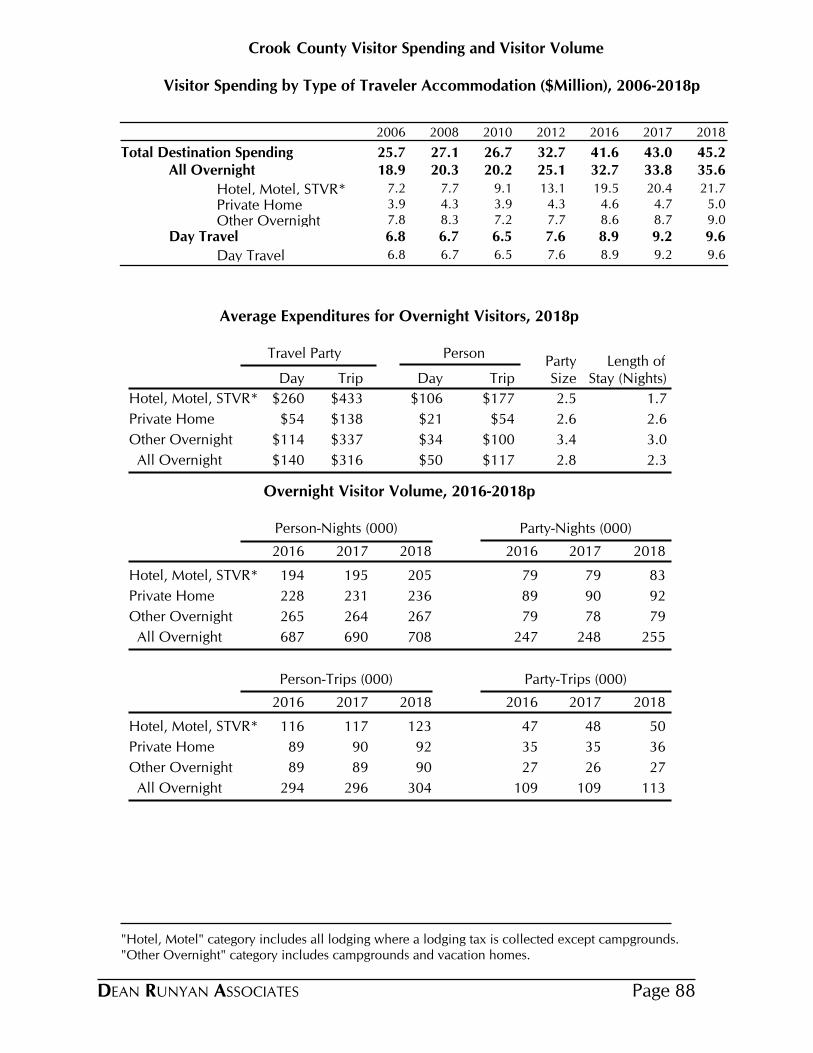
County Visitor Spending and Visitor VolumeCrook
Visitor Spending by Type of Traveler Accommodation ($Million), 2006-2018p
2006 2008 2010 2012 2016 2017 2018
Total Destination Spending 25.7 27.1 26.7 32.7 41.6 43.0 45.2All Overnight 18.9 20.3 20.2 25.1 32.7 33.8 35.6
Hotel, Motel, STVR* 7.2 7.7 9.1 13.1 19.5 20.4 21.7
Private Home 3.9 4.3 3.9 4.3 4.6 4.7 5.0
Other Overnight 7.8 8.3 7.2 7.7 8.6 8.7 9.0
Day Travel 6.8 6.7 6.5 7.6 8.9 9.2 9.6
Day Travel 6.8 6.7 6.5 7.6 8.9 9.2 9.6
Average Expenditures for Overnight Visitors, 2018p
Travel Party PersonParty Length of
Day Trip Day Trip Size Stay (Nights)
$260 $433 $106 $177Hotel, Motel, STVR* 2.5 1.7
$54 $138 $21 $54Private Home 2.6 2.6
$114 $337 $34 $100Other Overnight 3.4 3.0
$140 $316 $50 $117 All Overnight 2.8 2.3
Overnight Visitor Volume, 2016-2018p
Person-Nights (000) Party-Nights (000)
2016 2017 2018 2016 2017 2018
Hotel, Motel, STVR* 194 195 205 79 79 83
Private Home 228 231 236 89 90 92
Other Overnight 265 264 267 79 78 79
All Overnight 687 690 708 247 248 255
Person-Trips (000) Party-Trips (000)
2016 2017 2018 2016 2017 2018
Hotel, Motel, STVR* 116 117 123 47 48 50
Private Home 89 90 92 35 35 36
Other Overnight 89 89 90 27 26 27
All Overnight 294 296 304 109 109 113
"Hotel, Motel" category includes all lodging where a lodging tax is collected except campgrounds. "Other Overnight" category includes campgrounds and vacation homes.
DEAN RUNYAN ASSOCIATES Page 88
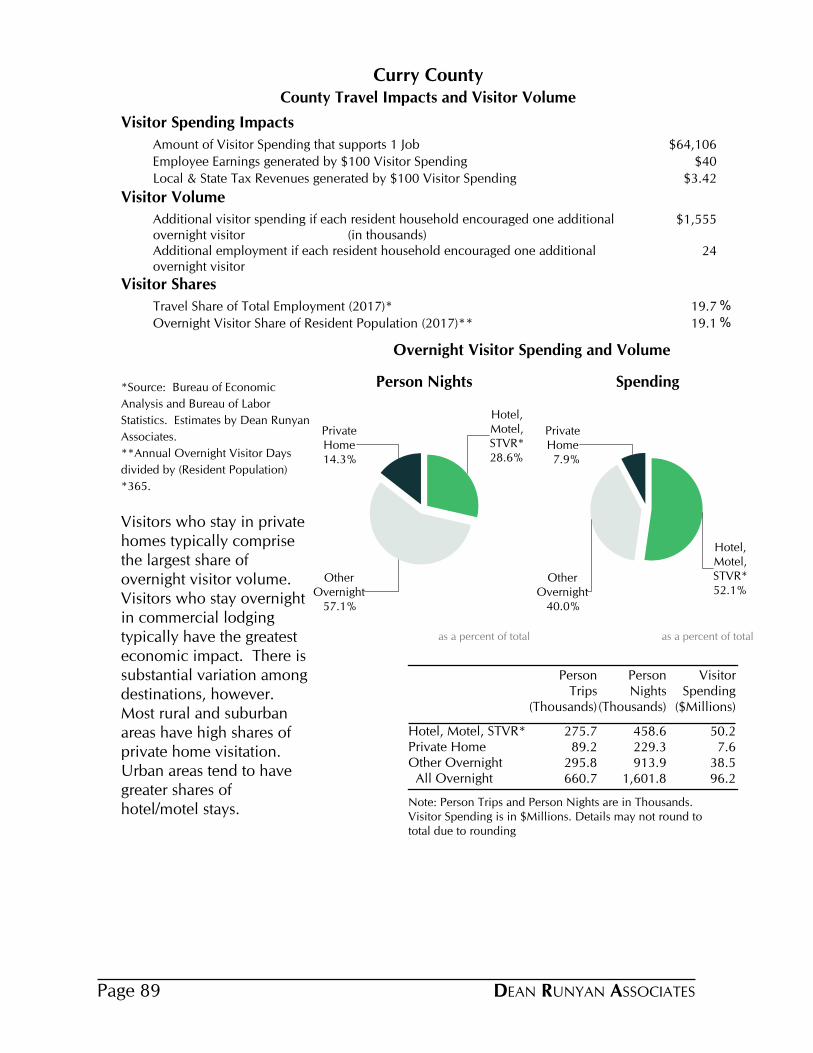
County Travel Impacts and Visitor Volume
Curry County
Visitor Spending Impacts
Amount of Visitor Spending that supports 1 Job $64,106
Employee Earnings generated by $100 Visitor Spending $40
Local & State Tax Revenues generated by $100 Visitor Spending $3.42
Visitor Volume
Additional visitor spending if each resident household encouraged one additional overnight visitor (in thousands)
$1,555
Additional employment if each resident household encouraged one additional overnight visitor
24
Visitor Shares
Travel Share of Total Employment (2017)* 19.7 %
Overnight Visitor Share of Resident Population (2017)** 19.1 %
*Source: Bureau of Economic
Analysis and Bureau of Labor
Statistics. Estimates by Dean Runyan
Associates.
**Annual Overnight Visitor Days
divided by (Resident Population)
*365.
Visitors who stay in private homes typically comprise the largest share of overnight visitor volume. Visitors who stay overnight in commercial lodging typically have the greatest economic impact. There is substantial variation among destinations, however. Most rural and suburban areas have high shares of private home visitation. Urban areas tend to have greater shares of hotel/motel stays.
Note: Person Trips and Person Nights are in Thousands. Visitor Spending is in $Millions. Details may not round to total due to rounding
Person Trips
(Thousands)
Person Nights
(Thousands)
Visitor Spending
($Millions)
Hotel, Motel, STVR* 275.7 458.6 50.2Private Home 89.2 229.3 7.6Other Overnight 295.8 913.9 38.5 All Overnight 660.7 1,601.8 96.2
28.6%
Hotel,Motel,STVR*
57.1%
OtherOvernight
14.3%
PrivateHome
Person Nights
as a percent of total
52.1%
Hotel,Motel,STVR*
40.0%
OtherOvernight
7.9%
PrivateHome
Spending
as a percent of total
Overnight Visitor Spending and Volume
DEAN RUNYAN ASSOCIATESPage 89

Direct Travel Impacts, 2010-2018p
Avg. Annual Chg.
Curry
Spending ($M) 2010 2012 2014 2016 2017 2018 17-18 10-18Total (Current $) 111.1 117.7 123.6 130.4 132.6 137.7 3.9% 2.7% Other 3.1 3.8 3.5 2.6 2.9 3.2 11.5% 0.6% Visitor 108.0 113.9 120.2 127.8 129.7 134.5 3.7% 2.8% Non-transportation 96.1 99.9 106.9 117.2 118.4 122.0 3.0% 3.0% Transportation 12.0 14.0 13.2 10.5 11.3 12.5 10.6% 0.5%
Earnings ($M)Earnings (Current $) 35.7 37.9 41.9 49.1 51.3 54.3 5.9% 5.4%
Employment (Jobs)Employment 1,740 1,740 1,790 2,010 2,040 2,110 3.2% 2.4%
Tax Revenue ($M)Total (Current $) 3.2 3.5 3.7 4.2 4.5 4.6 3.0% 4.6% Local 0.5 0.5 0.5 0.6 0.7 0.7 2.9% 3.2% State 2.7 3.0 3.1 3.6 3.8 3.9 3.1% 4.9%
Other spending includes resident air travel, travel arrangement and reservation services, and convention and trade show organizers. Non-transportation visitor spending includes accommodations, food services, retail, food stores, and arts, entertainment & recreation. Visitor transportation spending includes private auto, auto rental, other local ground transportation and one-way airfares.Earnings include wages & salaries, earned benefits and proprietor income.Employment includes all full- and part-time employment of payroll employees and proprietors.Local tax revenue includes lodging taxes, auto rental taxes and airport passenger facility charges paid by visitors.State tax revenue includes lodging, and motor fuel tax payments of visitors, and the income tax payments attributable to the travel industry income of businesses and employees.Federal tax revenue includes motor fuel excise taxes and airline ticket taxes paid by visitors, and the payroll and income taxes attributable to the travel industry income of employees and businesses.
DEAN RUNYAN ASSOCIATES Page 90

Travel Impacts, 2006-2018p
Curry County
2006 2008 2010 2012 2016 2017 2018
Destination Spending 106.7 112.5 108.0 113.9 127.8 129.7 134.5Other Travel* 3.1 3.7 3.1 3.8 2.6 2.9 3.2Total 109.8 116.1 111.1 117.7 130.4 132.6 137.7
Total Direct Travel Spending ($Million)
2006 2008 2010 2012 2016 2017 2018
Accommodations 22.6 22.9 22.3 23.1 27.8 29.0 29.9Arts, Ent. & Rec. 15.3 15.3 14.6 14.8 16.7 16.6 17.0Food Service 27.2 28.8 29.1 30.5 37.6 38.3 40.0Food Stores 13.7 15.5 14.7 15.8 18.0 17.6 18.0Local Tran. & Gas 11.8 14.5 12.0 14.0 10.5 11.3 12.5Retail Sales 16.2 15.5 15.3 15.7 17.1 16.8 17.1Total 106.7 112.5 108.0 113.9 127.8 129.7 134.5
Visitor Spending By Commodity Purchased ($Million)
2006 2008 2010 2012 2016 2017 2018
Accom. & Food Serv. 25.2 27.0 26.0 28.8 39.2 41.3 44.1Arts, Ent. & Rec. 4.9 5.7 5.1 4.3 4.1 4.1 4.1Ground Tran. 0.4 0.4 0.4 0.4 0.5 0.5 0.5Other Travel* 0.1 0.1 0.1 0.1 0.1 0.1 0.1Retail** 4.1 4.3 4.1 4.3 5.1 5.2 5.4Total 34.7 37.6 35.7 37.9 49.1 51.3 54.3
Industry Earnings Generated by Travel Spending ($Million)
2006 2008 2010 2012 2016 2017 2018
Accom. & Food Serv. 1,200 1,200 1,130 1,190 1,400 1,420 1,450Arts, Ent. & Rec. 430 450 400 340 380 380 420Ground Tran. 10 10 10 10 10 10 10Other Travel* 10 10 10 10 10 10 10Retail** 200 210 190 190 220 220 220Total 1,850 1,880 1,740 1,740 2,010 2,040 2,110
Industry Employment Generated by Travel Spending (Jobs)
2006 2008 2010 2012 2016 2017 2018
Local Tax Receipts 0.6 0.6 0.5 0.5 0.6 0.7 0.7State Tax Receipts 2.7 2.8 2.7 3.0 3.6 3.8 3.9Total 3.2 3.4 3.2 3.5 4.2 4.5 4.6
Tax Receipts Generated by Travel Spending ($Million)
Details may not add to total due to rounding. * Other Travel includes ground transportation and air travel impacts for travel to other Oregon visitor destinations, travel arrangement services, and convention & trade show organizers.** Retail includes gasoline.
DEAN RUNYAN ASSOCIATESPage 91
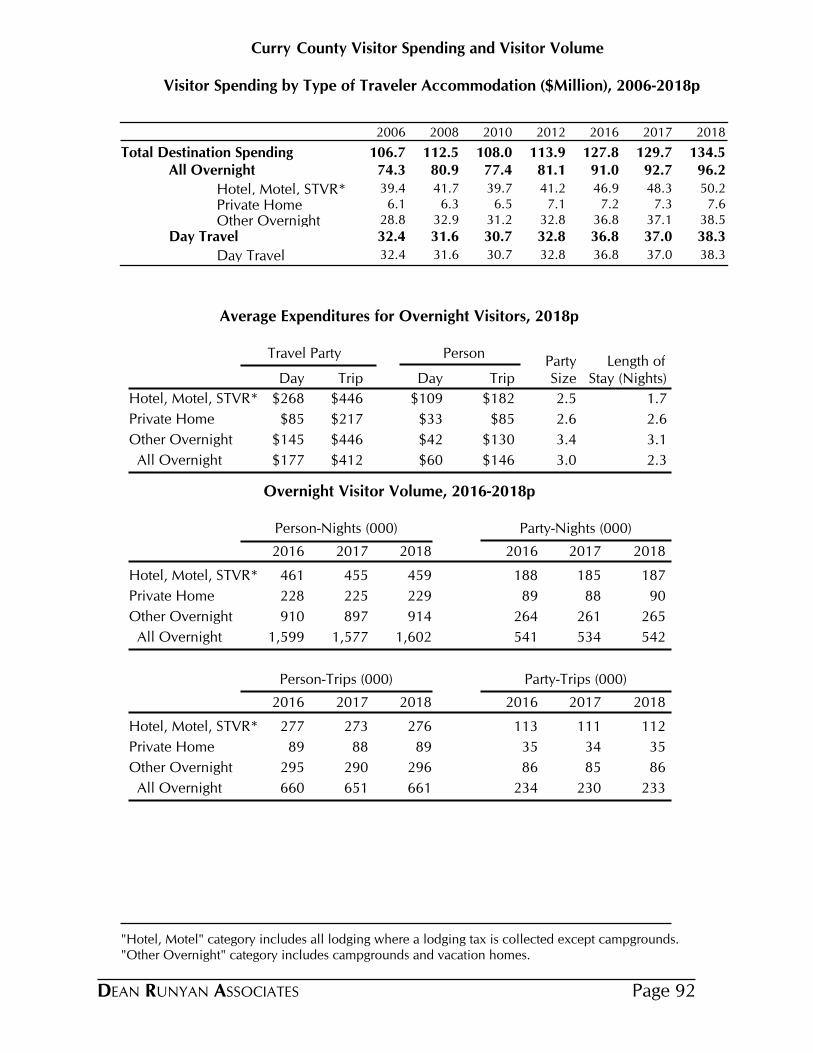
County Visitor Spending and Visitor VolumeCurry
Visitor Spending by Type of Traveler Accommodation ($Million), 2006-2018p
2006 2008 2010 2012 2016 2017 2018
Total Destination Spending 106.7 112.5 108.0 113.9 127.8 129.7 134.5All Overnight 74.3 80.9 77.4 81.1 91.0 92.7 96.2
Hotel, Motel, STVR* 39.4 41.7 39.7 41.2 46.9 48.3 50.2
Private Home 6.1 6.3 6.5 7.1 7.2 7.3 7.6
Other Overnight 28.8 32.9 31.2 32.8 36.8 37.1 38.5
Day Travel 32.4 31.6 30.7 32.8 36.8 37.0 38.3
Day Travel 32.4 31.6 30.7 32.8 36.8 37.0 38.3
Average Expenditures for Overnight Visitors, 2018p
Travel Party PersonParty Length of
Day Trip Day Trip Size Stay (Nights)
$268 $446 $109 $182Hotel, Motel, STVR* 2.5 1.7
$85 $217 $33 $85Private Home 2.6 2.6
$145 $446 $42 $130Other Overnight 3.4 3.1
$177 $412 $60 $146 All Overnight 3.0 2.3
Overnight Visitor Volume, 2016-2018p
Person-Nights (000) Party-Nights (000)
2016 2017 2018 2016 2017 2018
Hotel, Motel, STVR* 461 455 459 188 185 187
Private Home 228 225 229 89 88 90
Other Overnight 910 897 914 264 261 265
All Overnight 1,599 1,577 1,602 541 534 542
Person-Trips (000) Party-Trips (000)
2016 2017 2018 2016 2017 2018
Hotel, Motel, STVR* 277 273 276 113 111 112
Private Home 89 88 89 35 34 35
Other Overnight 295 290 296 86 85 86
All Overnight 660 651 661 234 230 233
"Hotel, Motel" category includes all lodging where a lodging tax is collected except campgrounds. "Other Overnight" category includes campgrounds and vacation homes.
DEAN RUNYAN ASSOCIATES Page 92
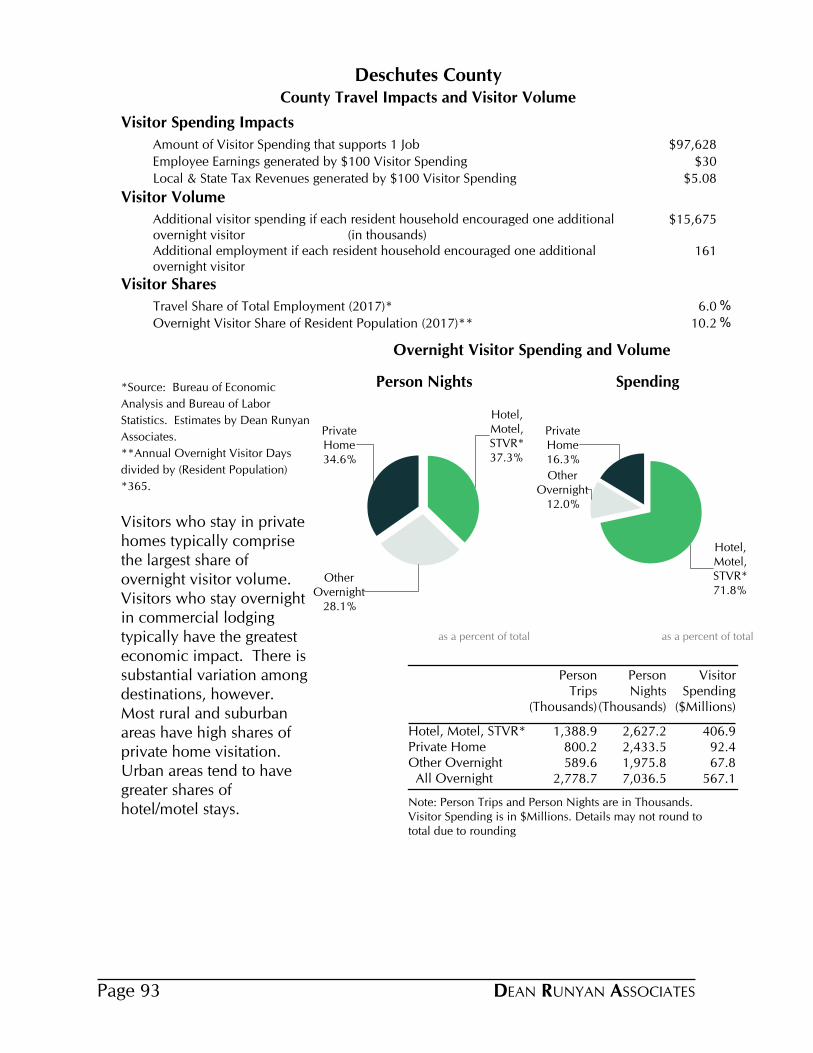
County Travel Impacts and Visitor Volume
Deschutes County
Visitor Spending Impacts
Amount of Visitor Spending that supports 1 Job $97,628
Employee Earnings generated by $100 Visitor Spending $30
Local & State Tax Revenues generated by $100 Visitor Spending $5.08
Visitor Volume
Additional visitor spending if each resident household encouraged one additional overnight visitor (in thousands)
$15,675
Additional employment if each resident household encouraged one additional overnight visitor
161
Visitor Shares
Travel Share of Total Employment (2017)* 6.0 %
Overnight Visitor Share of Resident Population (2017)** 10.2 %
*Source: Bureau of Economic
Analysis and Bureau of Labor
Statistics. Estimates by Dean Runyan
Associates.
**Annual Overnight Visitor Days
divided by (Resident Population)
*365.
Visitors who stay in private homes typically comprise the largest share of overnight visitor volume. Visitors who stay overnight in commercial lodging typically have the greatest economic impact. There is substantial variation among destinations, however. Most rural and suburban areas have high shares of private home visitation. Urban areas tend to have greater shares of hotel/motel stays.
Note: Person Trips and Person Nights are in Thousands. Visitor Spending is in $Millions. Details may not round to total due to rounding
Person Trips
(Thousands)
Person Nights
(Thousands)
Visitor Spending
($Millions)
Hotel, Motel, STVR* 1,388.9 2,627.2 406.9Private Home 800.2 2,433.5 92.4Other Overnight 589.6 1,975.8 67.8 All Overnight 2,778.7 7,036.5 567.1
37.3%
Hotel,Motel,STVR*
28.1%
OtherOvernight
34.6%
PrivateHome
Person Nights
as a percent of total
71.8%
Hotel,Motel,STVR*
12.0%
OtherOvernight
16.3%
PrivateHome
Spending
as a percent of total
Overnight Visitor Spending and Volume
DEAN RUNYAN ASSOCIATESPage 93

Direct Travel Impacts, 2010-2018p
Avg. Annual Chg.
Deschutes
Spending ($M) 2010 2012 2014 2016 2017 2018 17-18 10-18Total (Current $) 510.8 557.0 622.8 715.8 759.6 812.5 7.0% 6.0% Other 67.1 62.0 66.3 71.0 80.4 95.6 18.9% 4.5% Visitor 443.7 495.0 556.5 644.9 679.2 716.9 5.5% 6.2% Non-transportation 370.9 417.8 475.1 564.2 586.3 610.6 4.1% 6.4% Transportation 72.8 77.2 81.3 80.7 92.9 106.3 14.4% 4.8%
Earnings ($M)Earnings (Current $) 117.5 131.5 154.7 187.5 202.7 225.5 11.3% 8.5%
Employment (Jobs)Employment 5,310 5,630 6,270 6,970 7,110 7,560 6.3% 4.5%
Tax Revenue ($M)Total (Current $) 18.9 22.0 25.5 31.9 34.5 36.4 5.4% 8.5% Local 7.4 8.3 10.2 13.2 14.0 14.6 4.1% 8.9% State 11.5 13.7 15.3 18.8 20.5 21.8 6.4% 8.3%
Other spending includes resident air travel, travel arrangement and reservation services, and convention and trade show organizers. Non-transportation visitor spending includes accommodations, food services, retail, food stores, and arts, entertainment & recreation. Visitor transportation spending includes private auto, auto rental, other local ground transportation and one-way airfares.Earnings include wages & salaries, earned benefits and proprietor income.Employment includes all full- and part-time employment of payroll employees and proprietors.Local tax revenue includes lodging taxes, auto rental taxes and airport passenger facility charges paid by visitors.State tax revenue includes lodging, and motor fuel tax payments of visitors, and the income tax payments attributable to the travel industry income of businesses and employees.Federal tax revenue includes motor fuel excise taxes and airline ticket taxes paid by visitors, and the payroll and income taxes attributable to the travel industry income of employees and businesses.
Historical revisions have been made to correct for the assignment of visitor air travel to the other travel category total. This correction does not effect economic impact totals.
DEAN RUNYAN ASSOCIATES Page 94
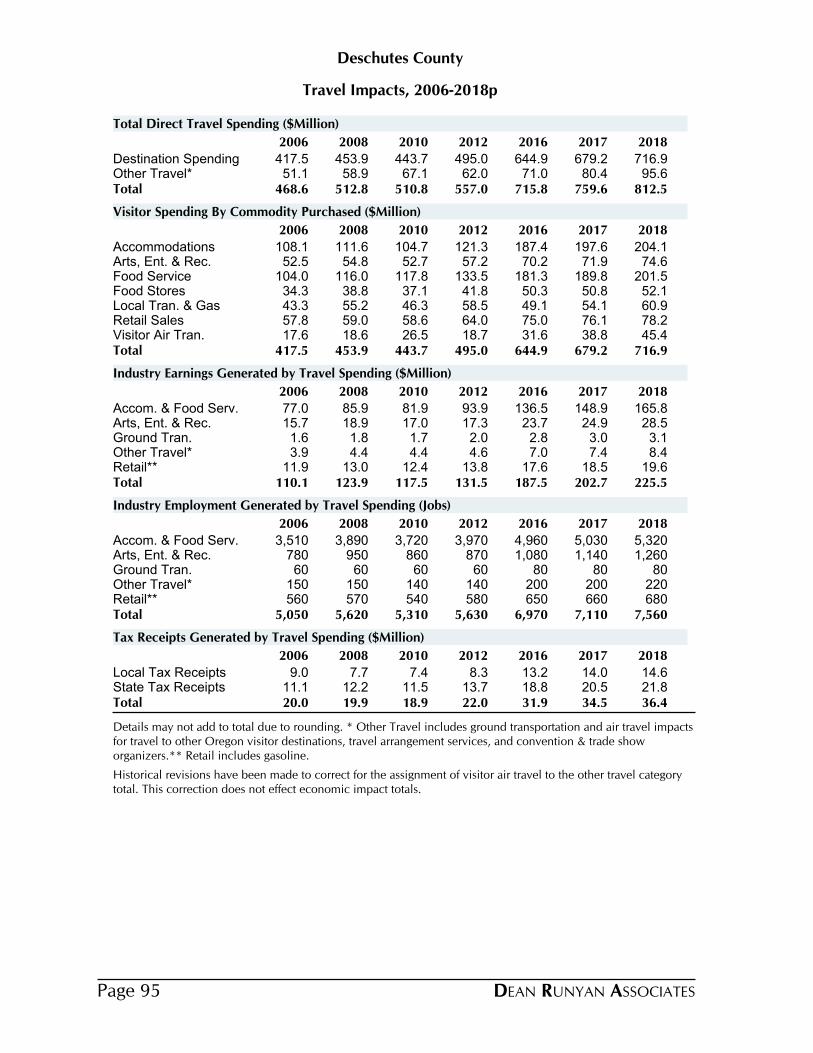
Travel Impacts, 2006-2018p
Deschutes County
2006 2008 2010 2012 2016 2017 2018
Destination Spending 417.5 453.9 443.7 495.0 644.9 679.2 716.9Other Travel* 51.1 58.9 67.1 62.0 71.0 80.4 95.6Total 468.6 512.8 510.8 557.0 715.8 759.6 812.5
Total Direct Travel Spending ($Million)
2006 2008 2010 2012 2016 2017 2018
Accommodations 108.1 111.6 104.7 121.3 187.4 197.6 204.1Arts, Ent. & Rec. 52.5 54.8 52.7 57.2 70.2 71.9 74.6Food Service 104.0 116.0 117.8 133.5 181.3 189.8 201.5Food Stores 34.3 38.8 37.1 41.8 50.3 50.8 52.1Local Tran. & Gas 43.3 55.2 46.3 58.5 49.1 54.1 60.9Retail Sales 57.8 59.0 58.6 64.0 75.0 76.1 78.2Visitor Air Tran. 17.6 18.6 26.5 18.7 31.6 38.8 45.4Total 417.5 453.9 443.7 495.0 644.9 679.2 716.9
Visitor Spending By Commodity Purchased ($Million)
2006 2008 2010 2012 2016 2017 2018
Accom. & Food Serv. 77.0 85.9 81.9 93.9 136.5 148.9 165.8Arts, Ent. & Rec. 15.7 18.9 17.0 17.3 23.7 24.9 28.5Ground Tran. 1.6 1.8 1.7 2.0 2.8 3.0 3.1Other Travel* 3.9 4.4 4.4 4.6 7.0 7.4 8.4Retail** 11.9 13.0 12.4 13.8 17.6 18.5 19.6Total 110.1 123.9 117.5 131.5 187.5 202.7 225.5
Industry Earnings Generated by Travel Spending ($Million)
2006 2008 2010 2012 2016 2017 2018
Accom. & Food Serv. 3,510 3,890 3,720 3,970 4,960 5,030 5,320Arts, Ent. & Rec. 780 950 860 870 1,080 1,140 1,260Ground Tran. 60 60 60 60 80 80 80Other Travel* 150 150 140 140 200 200 220Retail** 560 570 540 580 650 660 680Total 5,050 5,620 5,310 5,630 6,970 7,110 7,560
Industry Employment Generated by Travel Spending (Jobs)
2006 2008 2010 2012 2016 2017 2018
Local Tax Receipts 9.0 7.7 7.4 8.3 13.2 14.0 14.6State Tax Receipts 11.1 12.2 11.5 13.7 18.8 20.5 21.8Total 20.0 19.9 18.9 22.0 31.9 34.5 36.4
Tax Receipts Generated by Travel Spending ($Million)
Details may not add to total due to rounding. * Other Travel includes ground transportation and air travel impacts for travel to other Oregon visitor destinations, travel arrangement services, and convention & trade show organizers.** Retail includes gasoline.
Historical revisions have been made to correct for the assignment of visitor air travel to the other travel category total. This correction does not effect economic impact totals.
DEAN RUNYAN ASSOCIATESPage 95
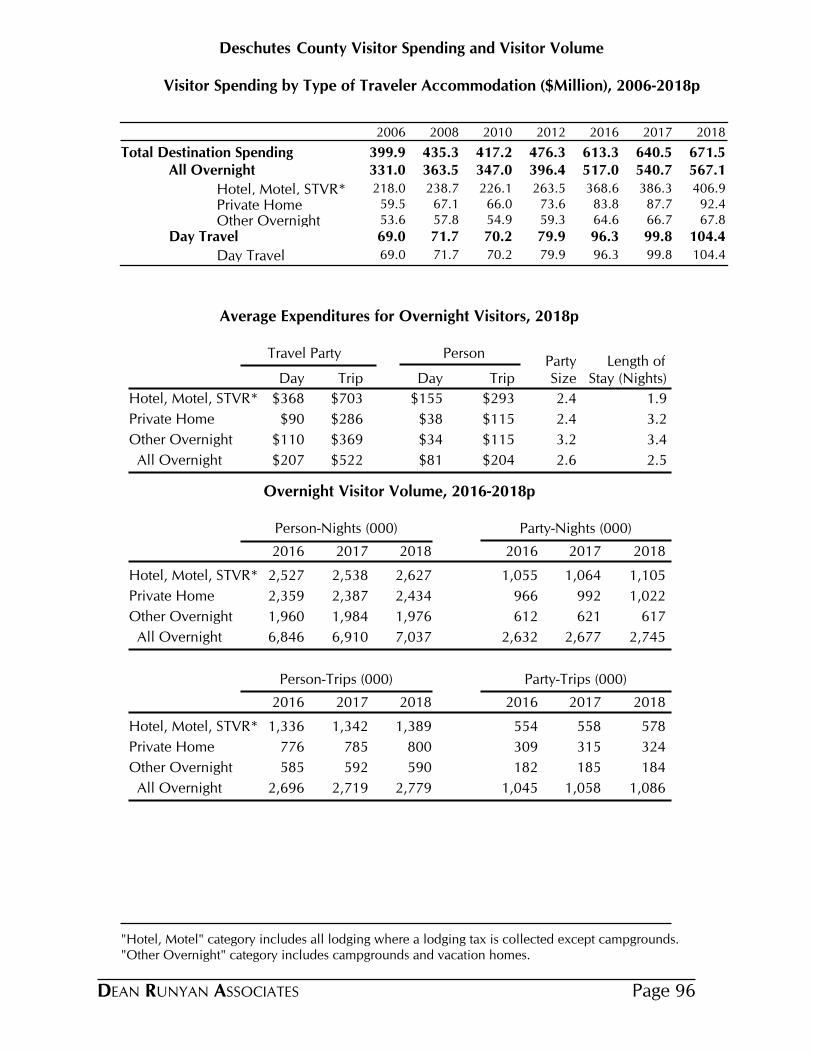
County Visitor Spending and Visitor VolumeDeschutes
Visitor Spending by Type of Traveler Accommodation ($Million), 2006-2018p
2006 2008 2010 2012 2016 2017 2018
Total Destination Spending 399.9 435.3 417.2 476.3 613.3 640.5 671.5All Overnight 331.0 363.5 347.0 396.4 517.0 540.7 567.1
Hotel, Motel, STVR* 218.0 238.7 226.1 263.5 368.6 386.3 406.9
Private Home 59.5 67.1 66.0 73.6 83.8 87.7 92.4
Other Overnight 53.6 57.8 54.9 59.3 64.6 66.7 67.8
Day Travel 69.0 71.7 70.2 79.9 96.3 99.8 104.4
Day Travel 69.0 71.7 70.2 79.9 96.3 99.8 104.4
Average Expenditures for Overnight Visitors, 2018p
Travel Party PersonParty Length of
Day Trip Day Trip Size Stay (Nights)
$368 $703 $155 $293Hotel, Motel, STVR* 2.4 1.9
$90 $286 $38 $115Private Home 2.4 3.2
$110 $369 $34 $115Other Overnight 3.2 3.4
$207 $522 $81 $204 All Overnight 2.6 2.5
Overnight Visitor Volume, 2016-2018p
Person-Nights (000) Party-Nights (000)
2016 2017 2018 2016 2017 2018
Hotel, Motel, STVR* 2,527 2,538 2,627 1,055 1,064 1,105
Private Home 2,359 2,387 2,434 966 992 1,022
Other Overnight 1,960 1,984 1,976 612 621 617
All Overnight 6,846 6,910 7,037 2,632 2,677 2,745
Person-Trips (000) Party-Trips (000)
2016 2017 2018 2016 2017 2018
Hotel, Motel, STVR* 1,336 1,342 1,389 554 558 578
Private Home 776 785 800 309 315 324
Other Overnight 585 592 590 182 185 184
All Overnight 2,696 2,719 2,779 1,045 1,058 1,086
"Hotel, Motel" category includes all lodging where a lodging tax is collected except campgrounds. "Other Overnight" category includes campgrounds and vacation homes.
DEAN RUNYAN ASSOCIATES Page 96

County Travel Impacts and Visitor Volume
Douglas County
Visitor Spending Impacts
Amount of Visitor Spending that supports 1 Job $73,619
Employee Earnings generated by $100 Visitor Spending $31
Local & State Tax Revenues generated by $100 Visitor Spending $3.82
Visitor Volume
Additional visitor spending if each resident household encouraged one additional overnight visitor (in thousands)
$6,214
Additional employment if each resident household encouraged one additional overnight visitor
84
Visitor Shares
Travel Share of Total Employment (2017)* 6.1 %
Overnight Visitor Share of Resident Population (2017)** 6.2 %
*Source: Bureau of Economic
Analysis and Bureau of Labor
Statistics. Estimates by Dean Runyan
Associates.
**Annual Overnight Visitor Days
divided by (Resident Population)
*365.
Visitors who stay in private homes typically comprise the largest share of overnight visitor volume. Visitors who stay overnight in commercial lodging typically have the greatest economic impact. There is substantial variation among destinations, however. Most rural and suburban areas have high shares of private home visitation. Urban areas tend to have greater shares of hotel/motel stays.
Note: Person Trips and Person Nights are in Thousands. Visitor Spending is in $Millions. Details may not round to total due to rounding
Person Trips
(Thousands)
Person Nights
(Thousands)
Visitor Spending
($Millions)
Hotel, Motel, STVR* 328.1 605.2 82.2Private Home 377.6 1,131.5 39.8Other Overnight 245.0 780.7 36.7 All Overnight 950.7 2,517.3 158.7
24.0%
Hotel,Motel,STVR*
31.0%
OtherOvernight
44.9%
PrivateHome
Person Nights
as a percent of total
51.8%
Hotel,Motel,STVR*
23.1%
OtherOvernight
25.1%
PrivateHome
Spending
as a percent of total
Overnight Visitor Spending and Volume
DEAN RUNYAN ASSOCIATESPage 97

Direct Travel Impacts, 2010-2018p
Avg. Annual Chg.
Douglas
Spending ($M) 2010 2012 2014 2016 2017 2018 17-18 10-18Total (Current $) 204.4 219.8 229.5 233.2 237.5 244.1 2.8% 2.2% Other 15.6 19.0 17.7 12.5 13.9 15.5 11.5% -0.1% Visitor 188.8 200.8 211.8 220.7 223.6 228.7 2.3% 2.4% Non-transportation 168.2 176.3 188.8 202.6 204.1 207.0 1.4% 2.6% Transportation 20.6 24.5 23.1 18.0 19.4 21.7 11.5% 0.6%
Earnings ($M)Earnings (Current $) 53.7 55.9 61.5 68.1 70.5 72.6 3.1% 3.8%
Employment (Jobs)Employment 2,810 2,830 2,980 3,130 3,170 3,140 -0.7% 1.4%
Tax Revenue ($M)Total (Current $) 6.3 7.0 7.3 8.1 8.6 8.7 1.8% 4.2% Local 1.0 1.1 1.2 1.4 1.4 1.4 3.2% 4.5% State 5.3 5.9 6.2 6.7 7.2 7.3 1.5% 4.2%
Other spending includes resident air travel, travel arrangement and reservation services, and convention and trade show organizers. Non-transportation visitor spending includes accommodations, food services, retail, food stores, and arts, entertainment & recreation. Visitor transportation spending includes private auto, auto rental, other local ground transportation and one-way airfares.Earnings include wages & salaries, earned benefits and proprietor income.Employment includes all full- and part-time employment of payroll employees and proprietors.Local tax revenue includes lodging taxes, auto rental taxes and airport passenger facility charges paid by visitors.State tax revenue includes lodging, and motor fuel tax payments of visitors, and the income tax payments attributable to the travel industry income of businesses and employees.Federal tax revenue includes motor fuel excise taxes and airline ticket taxes paid by visitors, and the payroll and income taxes attributable to the travel industry income of employees and businesses.
DEAN RUNYAN ASSOCIATES Page 98
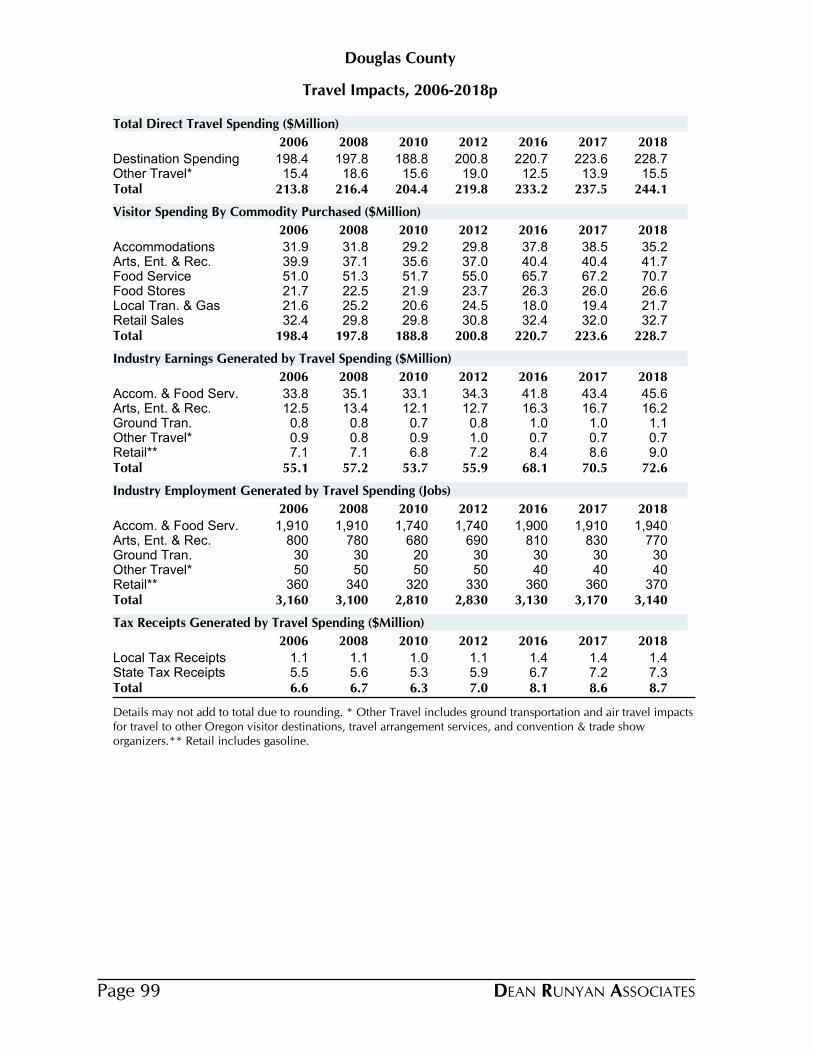
Travel Impacts, 2006-2018p
Douglas County
2006 2008 2010 2012 2016 2017 2018
Destination Spending 198.4 197.8 188.8 200.8 220.7 223.6 228.7Other Travel* 15.4 18.6 15.6 19.0 12.5 13.9 15.5Total 213.8 216.4 204.4 219.8 233.2 237.5 244.1
Total Direct Travel Spending ($Million)
2006 2008 2010 2012 2016 2017 2018
Accommodations 31.9 31.8 29.2 29.8 37.8 38.5 35.2Arts, Ent. & Rec. 39.9 37.1 35.6 37.0 40.4 40.4 41.7Food Service 51.0 51.3 51.7 55.0 65.7 67.2 70.7Food Stores 21.7 22.5 21.9 23.7 26.3 26.0 26.6Local Tran. & Gas 21.6 25.2 20.6 24.5 18.0 19.4 21.7Retail Sales 32.4 29.8 29.8 30.8 32.4 32.0 32.7Total 198.4 197.8 188.8 200.8 220.7 223.6 228.7
Visitor Spending By Commodity Purchased ($Million)
2006 2008 2010 2012 2016 2017 2018
Accom. & Food Serv. 33.8 35.1 33.1 34.3 41.8 43.4 45.6Arts, Ent. & Rec. 12.5 13.4 12.1 12.7 16.3 16.7 16.2Ground Tran. 0.8 0.8 0.7 0.8 1.0 1.0 1.1Other Travel* 0.9 0.8 0.9 1.0 0.7 0.7 0.7Retail** 7.1 7.1 6.8 7.2 8.4 8.6 9.0Total 55.1 57.2 53.7 55.9 68.1 70.5 72.6
Industry Earnings Generated by Travel Spending ($Million)
2006 2008 2010 2012 2016 2017 2018
Accom. & Food Serv. 1,910 1,910 1,740 1,740 1,900 1,910 1,940Arts, Ent. & Rec. 800 780 680 690 810 830 770Ground Tran. 30 30 20 30 30 30 30Other Travel* 50 50 50 50 40 40 40Retail** 360 340 320 330 360 360 370Total 3,160 3,100 2,810 2,830 3,130 3,170 3,140
Industry Employment Generated by Travel Spending (Jobs)
2006 2008 2010 2012 2016 2017 2018
Local Tax Receipts 1.1 1.1 1.0 1.1 1.4 1.4 1.4State Tax Receipts 5.5 5.6 5.3 5.9 6.7 7.2 7.3Total 6.6 6.7 6.3 7.0 8.1 8.6 8.7
Tax Receipts Generated by Travel Spending ($Million)
Details may not add to total due to rounding. * Other Travel includes ground transportation and air travel impacts for travel to other Oregon visitor destinations, travel arrangement services, and convention & trade show organizers.** Retail includes gasoline.
DEAN RUNYAN ASSOCIATESPage 99

County Visitor Spending and Visitor VolumeDouglas
Visitor Spending by Type of Traveler Accommodation ($Million), 2006-2018p
2006 2008 2010 2012 2016 2017 2018
Total Destination Spending 198.4 197.8 188.8 200.8 220.7 223.6 228.7All Overnight 110.0 116.1 108.7 114.6 126.9 129.0 130.1
Hotel, Motel, STVR* 60.1 63.0 55.8 58.0 67.6 68.6 67.3
Private Home 28.5 31.1 31.5 34.1 34.5 35.2 36.8
Other Overnight 21.3 22.0 21.5 22.5 24.9 25.1 26.0
Day Travel 88.4 81.7 80.0 86.2 93.7 94.6 98.5
Day Travel 88.4 81.7 80.0 86.2 93.7 94.6 98.5
Average Expenditures for Overnight Visitors, 2018p
Travel Party PersonParty Length of
Day Trip Day Trip Size Stay (Nights)
$332 $613 $136 $250Hotel, Motel, STVR* 2.4 1.8
$92 $274 $35 $105Private Home 2.6 3.0
$160 $511 $47 $150Other Overnight 3.4 3.2
$174 $452 $63 $167 All Overnight 2.8 2.6
Overnight Visitor Volume, 2016-2018p
Person-Nights (000) Party-Nights (000)
2016 2017 2018 2016 2017 2018
Hotel, Motel, STVR* 600 590 605 245 241 247
Private Home 1,107 1,107 1,131 426 426 435
Other Overnight 777 768 781 228 225 229
All Overnight 2,485 2,465 2,517 899 892 911
Person-Trips (000) Party-Trips (000)
2016 2017 2018 2016 2017 2018
Hotel, Motel, STVR* 326 320 328 133 131 134
Private Home 369 369 378 142 142 145
Other Overnight 244 241 245 71 71 72
All Overnight 939 930 951 347 343 351
"Hotel, Motel" category includes all lodging where a lodging tax is collected except campgrounds. "Other Overnight" category includes campgrounds and vacation homes.
DEAN RUNYAN ASSOCIATES Page 100
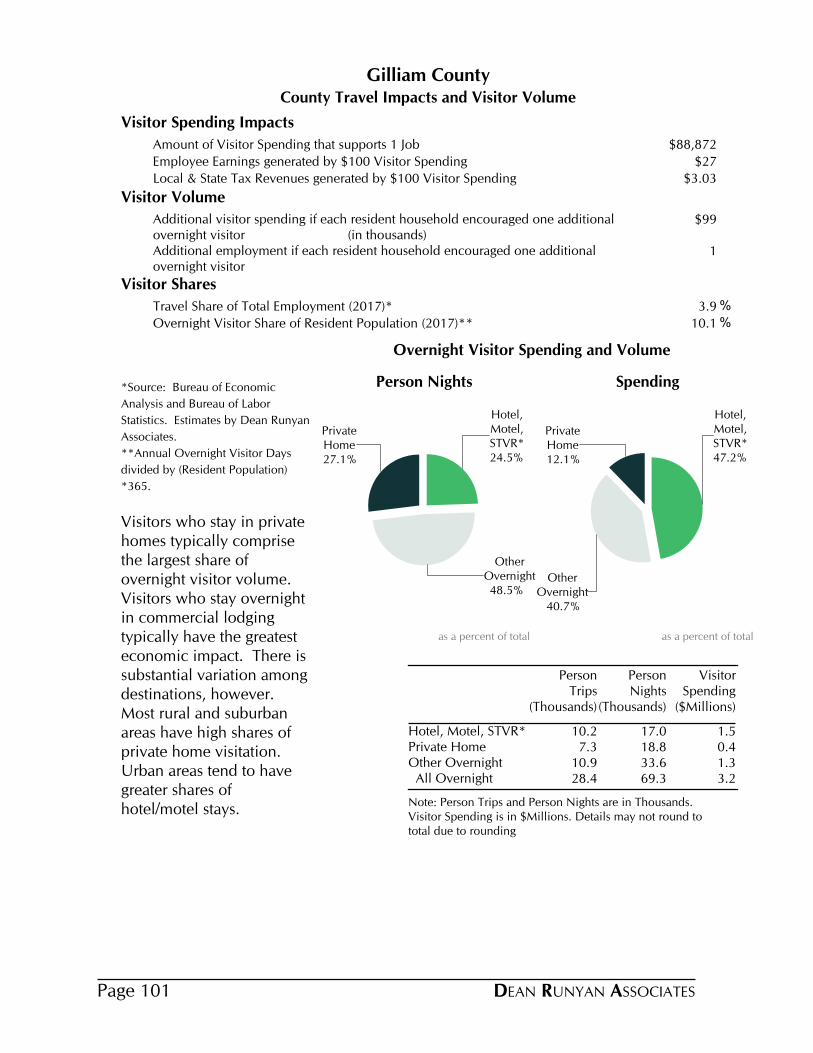
County Travel Impacts and Visitor Volume
Gilliam County
Visitor Spending Impacts
Amount of Visitor Spending that supports 1 Job $88,872
Employee Earnings generated by $100 Visitor Spending $27
Local & State Tax Revenues generated by $100 Visitor Spending $3.03
Visitor Volume
Additional visitor spending if each resident household encouraged one additional overnight visitor (in thousands)
$99
Additional employment if each resident household encouraged one additional overnight visitor
1
Visitor Shares
Travel Share of Total Employment (2017)* 3.9 %
Overnight Visitor Share of Resident Population (2017)** 10.1 %
*Source: Bureau of Economic
Analysis and Bureau of Labor
Statistics. Estimates by Dean Runyan
Associates.
**Annual Overnight Visitor Days
divided by (Resident Population)
*365.
Visitors who stay in private homes typically comprise the largest share of overnight visitor volume. Visitors who stay overnight in commercial lodging typically have the greatest economic impact. There is substantial variation among destinations, however. Most rural and suburban areas have high shares of private home visitation. Urban areas tend to have greater shares of hotel/motel stays.
Note: Person Trips and Person Nights are in Thousands. Visitor Spending is in $Millions. Details may not round to total due to rounding
Person Trips
(Thousands)
Person Nights
(Thousands)
Visitor Spending
($Millions)
Hotel, Motel, STVR* 10.2 17.0 1.5Private Home 7.3 18.8 0.4Other Overnight 10.9 33.6 1.3 All Overnight 28.4 69.3 3.2
24.5%
Hotel,Motel,STVR*
48.5%
OtherOvernight
27.1%
PrivateHome
Person Nights
as a percent of total
47.2%
Hotel,Motel,STVR*
40.7%
OtherOvernight
12.1%
PrivateHome
Spending
as a percent of total
Overnight Visitor Spending and Volume
DEAN RUNYAN ASSOCIATESPage 101
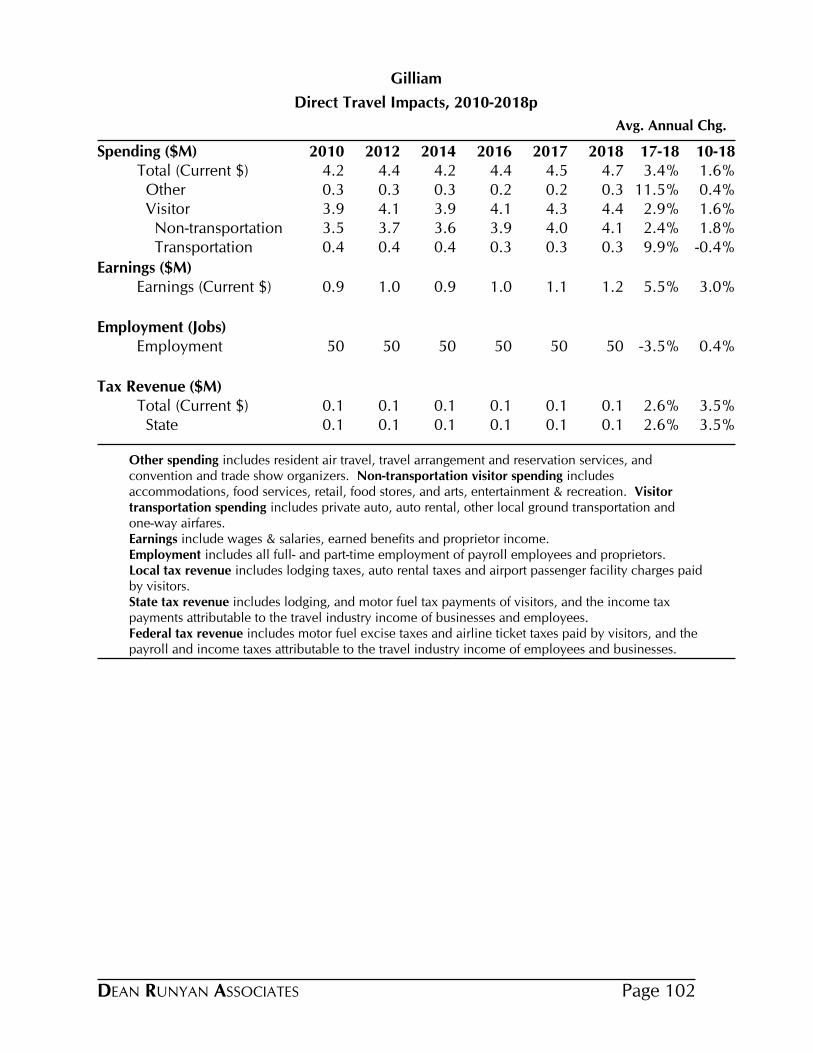
Direct Travel Impacts, 2010-2018p
Avg. Annual Chg.
Gilliam
Spending ($M) 2010 2012 2014 2016 2017 2018 17-18 10-18Total (Current $) 4.2 4.4 4.2 4.4 4.5 4.7 3.4% 1.6% Other 0.3 0.3 0.3 0.2 0.2 0.3 11.5% 0.4% Visitor 3.9 4.1 3.9 4.1 4.3 4.4 2.9% 1.6% Non-transportation 3.5 3.7 3.6 3.9 4.0 4.1 2.4% 1.8% Transportation 0.4 0.4 0.4 0.3 0.3 0.3 9.9% -0.4%
Earnings ($M)Earnings (Current $) 0.9 1.0 0.9 1.0 1.1 1.2 5.5% 3.0%
Employment (Jobs)Employment 50 50 50 50 50 50 -3.5% 0.4%
Tax Revenue ($M)Total (Current $) 0.1 0.1 0.1 0.1 0.1 0.1 2.6% 3.5% State 0.1 0.1 0.1 0.1 0.1 0.1 2.6% 3.5%
Other spending includes resident air travel, travel arrangement and reservation services, and convention and trade show organizers. Non-transportation visitor spending includes accommodations, food services, retail, food stores, and arts, entertainment & recreation. Visitor transportation spending includes private auto, auto rental, other local ground transportation and one-way airfares.Earnings include wages & salaries, earned benefits and proprietor income.Employment includes all full- and part-time employment of payroll employees and proprietors.Local tax revenue includes lodging taxes, auto rental taxes and airport passenger facility charges paid by visitors.State tax revenue includes lodging, and motor fuel tax payments of visitors, and the income tax payments attributable to the travel industry income of businesses and employees.Federal tax revenue includes motor fuel excise taxes and airline ticket taxes paid by visitors, and the payroll and income taxes attributable to the travel industry income of employees and businesses.
DEAN RUNYAN ASSOCIATES Page 102
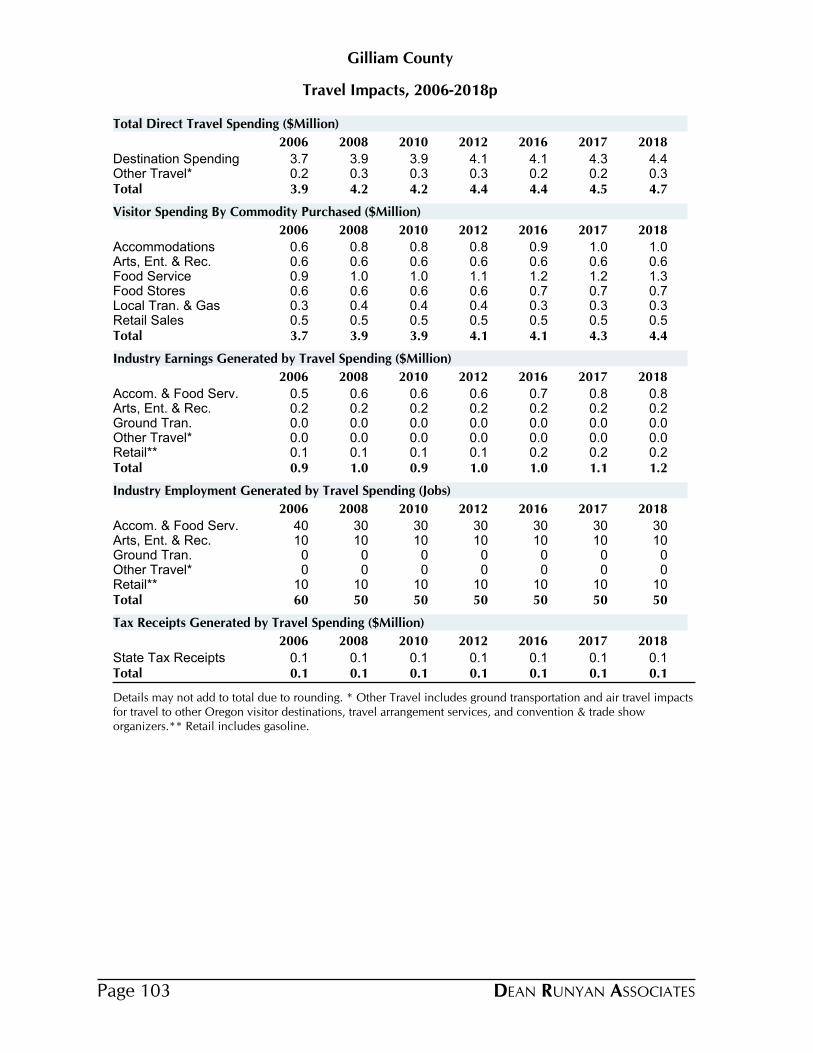
Travel Impacts, 2006-2018p
Gilliam County
2006 2008 2010 2012 2016 2017 2018
Destination Spending 3.7 3.9 3.9 4.1 4.1 4.3 4.4Other Travel* 0.2 0.3 0.3 0.3 0.2 0.2 0.3Total 3.9 4.2 4.2 4.4 4.4 4.5 4.7
Total Direct Travel Spending ($Million)
2006 2008 2010 2012 2016 2017 2018
Accommodations 0.6 0.8 0.8 0.8 0.9 1.0 1.0Arts, Ent. & Rec. 0.6 0.6 0.6 0.6 0.6 0.6 0.6Food Service 0.9 1.0 1.0 1.1 1.2 1.2 1.3Food Stores 0.6 0.6 0.6 0.6 0.7 0.7 0.7Local Tran. & Gas 0.3 0.4 0.4 0.4 0.3 0.3 0.3Retail Sales 0.5 0.5 0.5 0.5 0.5 0.5 0.5Total 3.7 3.9 3.9 4.1 4.1 4.3 4.4
Visitor Spending By Commodity Purchased ($Million)
2006 2008 2010 2012 2016 2017 2018
Accom. & Food Serv. 0.5 0.6 0.6 0.6 0.7 0.8 0.8Arts, Ent. & Rec. 0.2 0.2 0.2 0.2 0.2 0.2 0.2Ground Tran. 0.0 0.0 0.0 0.0 0.0 0.0 0.0Other Travel* 0.0 0.0 0.0 0.0 0.0 0.0 0.0Retail** 0.1 0.1 0.1 0.1 0.2 0.2 0.2Total 0.9 1.0 0.9 1.0 1.0 1.1 1.2
Industry Earnings Generated by Travel Spending ($Million)
2006 2008 2010 2012 2016 2017 2018
Accom. & Food Serv. 40 30 30 30 30 30 30Arts, Ent. & Rec. 10 10 10 10 10 10 10Ground Tran. 0 0 0 0 0 0 0Other Travel* 0 0 0 0 0 0 0Retail** 10 10 10 10 10 10 10Total 60 50 50 50 50 50 50
Industry Employment Generated by Travel Spending (Jobs)
2006 2008 2010 2012 2016 2017 2018
State Tax Receipts 0.1 0.1 0.1 0.1 0.1 0.1 0.1Total 0.1 0.1 0.1 0.1 0.1 0.1 0.1
Tax Receipts Generated by Travel Spending ($Million)
Details may not add to total due to rounding. * Other Travel includes ground transportation and air travel impacts for travel to other Oregon visitor destinations, travel arrangement services, and convention & trade show organizers.** Retail includes gasoline.
DEAN RUNYAN ASSOCIATESPage 103
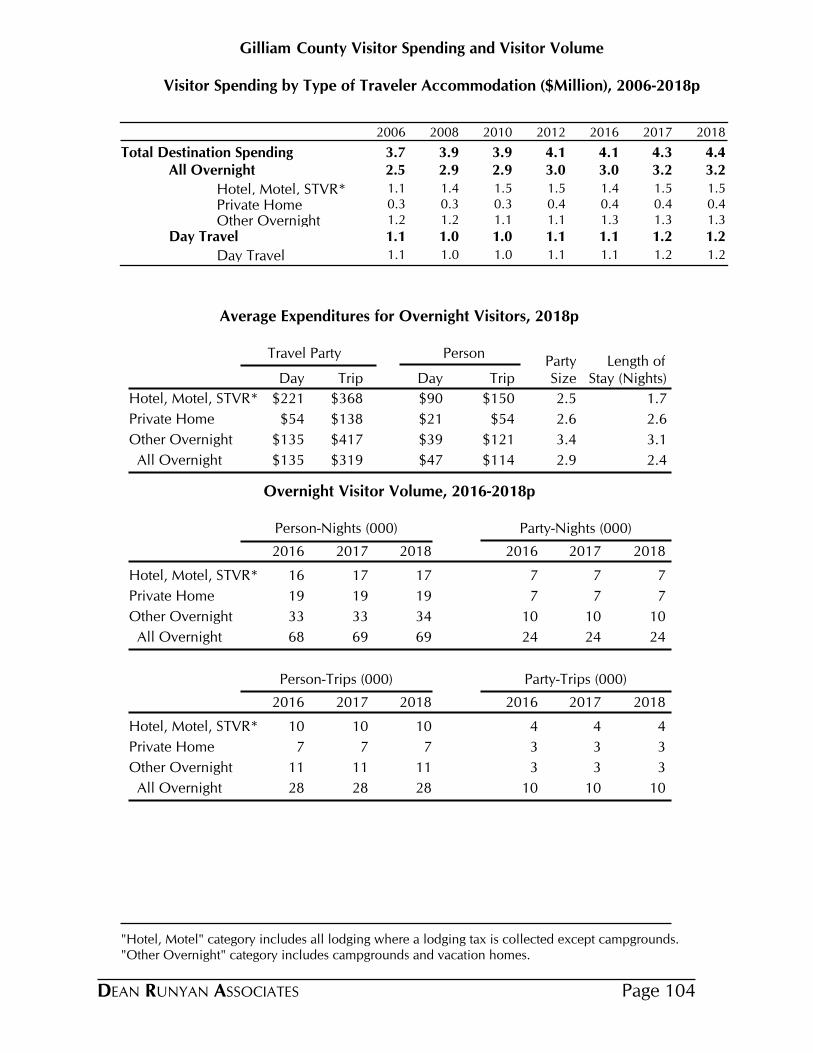
County Visitor Spending and Visitor VolumeGilliam
Visitor Spending by Type of Traveler Accommodation ($Million), 2006-2018p
2006 2008 2010 2012 2016 2017 2018
Total Destination Spending 3.7 3.9 3.9 4.1 4.1 4.3 4.4All Overnight 2.5 2.9 2.9 3.0 3.0 3.2 3.2
Hotel, Motel, STVR* 1.1 1.4 1.5 1.5 1.4 1.5 1.5
Private Home 0.3 0.3 0.3 0.4 0.4 0.4 0.4
Other Overnight 1.2 1.2 1.1 1.1 1.3 1.3 1.3
Day Travel 1.1 1.0 1.0 1.1 1.1 1.2 1.2
Day Travel 1.1 1.0 1.0 1.1 1.1 1.2 1.2
Average Expenditures for Overnight Visitors, 2018p
Travel Party PersonParty Length of
Day Trip Day Trip Size Stay (Nights)
$221 $368 $90 $150Hotel, Motel, STVR* 2.5 1.7
$54 $138 $21 $54Private Home 2.6 2.6
$135 $417 $39 $121Other Overnight 3.4 3.1
$135 $319 $47 $114 All Overnight 2.9 2.4
Overnight Visitor Volume, 2016-2018p
Person-Nights (000) Party-Nights (000)
2016 2017 2018 2016 2017 2018
Hotel, Motel, STVR* 16 17 17 7 7 7
Private Home 19 19 19 7 7 7
Other Overnight 33 33 34 10 10 10
All Overnight 68 69 69 24 24 24
Person-Trips (000) Party-Trips (000)
2016 2017 2018 2016 2017 2018
Hotel, Motel, STVR* 10 10 10 4 4 4
Private Home 7 7 7 3 3 3
Other Overnight 11 11 11 3 3 3
All Overnight 28 28 28 10 10 10
"Hotel, Motel" category includes all lodging where a lodging tax is collected except campgrounds. "Other Overnight" category includes campgrounds and vacation homes.
DEAN RUNYAN ASSOCIATES Page 104

County Travel Impacts and Visitor Volume
Grant County
Visitor Spending Impacts
Amount of Visitor Spending that supports 1 Job $61,676
Employee Earnings generated by $100 Visitor Spending $30
Local & State Tax Revenues generated by $100 Visitor Spending $4.19
Visitor Volume
Additional visitor spending if each resident household encouraged one additional overnight visitor (in thousands)
$301
Additional employment if each resident household encouraged one additional overnight visitor
5
Visitor Shares
Travel Share of Total Employment (2017)* 4.7 %
Overnight Visitor Share of Resident Population (2017)** 8.5 %
*Source: Bureau of Economic
Analysis and Bureau of Labor
Statistics. Estimates by Dean Runyan
Associates.
**Annual Overnight Visitor Days
divided by (Resident Population)
*365.
Visitors who stay in private homes typically comprise the largest share of overnight visitor volume. Visitors who stay overnight in commercial lodging typically have the greatest economic impact. There is substantial variation among destinations, however. Most rural and suburban areas have high shares of private home visitation. Urban areas tend to have greater shares of hotel/motel stays.
Note: Person Trips and Person Nights are in Thousands. Visitor Spending is in $Millions. Details may not round to total due to rounding
Person Trips
(Thousands)
Person Nights
(Thousands)
Visitor Spending
($Millions)
Hotel, Motel, STVR* 24.1 40.2 3.8Private Home 28.3 72.7 1.5Other Overnight 38.4 112.3 3.0 All Overnight 90.8 225.1 8.3
17.8%
Hotel,Motel,STVR*
49.9%
OtherOvernight
32.3%
PrivateHome
Person Nights
as a percent of total
45.6%
Hotel,Motel,STVR*
36.2%
OtherOvernight
18.3%
PrivateHome
Spending
as a percent of total
Overnight Visitor Spending and Volume
DEAN RUNYAN ASSOCIATESPage 105

Direct Travel Impacts, 2010-2018p
Avg. Annual Chg.
Grant
Spending ($M) 2010 2012 2014 2016 2017 2018 17-18 10-18Total (Current $) 9.8 9.7 10.5 10.7 11.2 11.6 3.6% 2.1% Other 1.0 1.2 1.1 0.8 0.9 1.0 11.5% 0.0% Visitor 8.8 8.5 9.4 9.9 10.3 10.6 2.9% 2.4% Non-transportation 7.9 7.5 8.4 9.1 9.5 9.7 2.2% 2.6% Transportation 0.9 1.0 1.0 0.8 0.9 0.9 9.7% 0.2%
Earnings ($M)Earnings (Current $) 2.4 2.3 2.5 2.8 3.0 3.2 7.1% 3.8%
Employment (Jobs)Employment 180 160 170 180 180 180 -0.9% -0.4%
Tax Revenue ($M)Total (Current $) 0.4 0.4 0.4 0.4 0.4 0.4 2.2% 2.6% Local 0.1 0.1 0.1 0.1 0.1 0.1 1.4% -1.4% State 0.3 0.3 0.3 0.3 0.3 0.4 2.4% 3.9%
Other spending includes resident air travel, travel arrangement and reservation services, and convention and trade show organizers. Non-transportation visitor spending includes accommodations, food services, retail, food stores, and arts, entertainment & recreation. Visitor transportation spending includes private auto, auto rental, other local ground transportation and one-way airfares.Earnings include wages & salaries, earned benefits and proprietor income.Employment includes all full- and part-time employment of payroll employees and proprietors.Local tax revenue includes lodging taxes, auto rental taxes and airport passenger facility charges paid by visitors.State tax revenue includes lodging, and motor fuel tax payments of visitors, and the income tax payments attributable to the travel industry income of businesses and employees.Federal tax revenue includes motor fuel excise taxes and airline ticket taxes paid by visitors, and the payroll and income taxes attributable to the travel industry income of employees and businesses.
DEAN RUNYAN ASSOCIATES Page 106

Travel Impacts, 2006-2018p
Grant County
2006 2008 2010 2012 2016 2017 2018
Destination Spending 8.3 8.0 8.8 8.5 9.9 10.3 10.6Other Travel* 1.0 1.2 1.0 1.2 0.8 0.9 1.0Total 9.3 9.1 9.8 9.7 10.7 11.2 11.6
Total Direct Travel Spending ($Million)
2006 2008 2010 2012 2016 2017 2018
Accommodations 1.5 1.5 1.7 1.5 2.1 2.3 2.4Arts, Ent. & Rec. 1.3 1.2 1.3 1.2 1.4 1.4 1.5Food Service 2.1 2.0 2.3 2.3 2.8 2.9 3.0Food Stores 1.3 1.3 1.4 1.4 1.6 1.6 1.6Local Tran. & Gas 0.9 1.0 0.9 1.0 0.8 0.9 0.9Retail Sales 1.2 1.0 1.2 1.1 1.2 1.2 1.2Total 8.3 8.0 8.8 8.5 9.9 10.3 10.6
Visitor Spending By Commodity Purchased ($Million)
2006 2008 2010 2012 2016 2017 2018
Accom. & Food Serv. 1.5 1.5 1.6 1.5 1.9 2.1 2.3Arts, Ent. & Rec. 0.4 0.4 0.4 0.4 0.4 0.4 0.4Ground Tran. 0.0 0.0 0.0 0.0 0.1 0.1 0.1Other Travel* 0.0 0.0 0.0 0.0 0.0 0.0 0.0Retail** 0.3 0.3 0.3 0.3 0.4 0.4 0.4Total 2.3 2.2 2.4 2.3 2.8 3.0 3.2
Industry Earnings Generated by Travel Spending ($Million)
2006 2008 2010 2012 2016 2017 2018
Accom. & Food Serv. 120 100 110 100 110 110 120Arts, Ent. & Rec. 60 50 50 40 40 40 30Ground Tran. 0 0 0 0 0 0 0Other Travel* 0 0 0 0 0 0 0Retail** 20 20 20 20 20 20 20Total 200 170 180 160 180 180 180
Industry Employment Generated by Travel Spending (Jobs)
2006 2008 2010 2012 2016 2017 2018
Local Tax Receipts 0.1 0.1 0.1 0.1 0.1 0.1 0.1State Tax Receipts 0.3 0.2 0.3 0.3 0.3 0.3 0.4Total 0.3 0.3 0.4 0.4 0.4 0.4 0.4
Tax Receipts Generated by Travel Spending ($Million)
Details may not add to total due to rounding. * Other Travel includes ground transportation and air travel impacts for travel to other Oregon visitor destinations, travel arrangement services, and convention & trade show organizers.** Retail includes gasoline.
DEAN RUNYAN ASSOCIATESPage 107
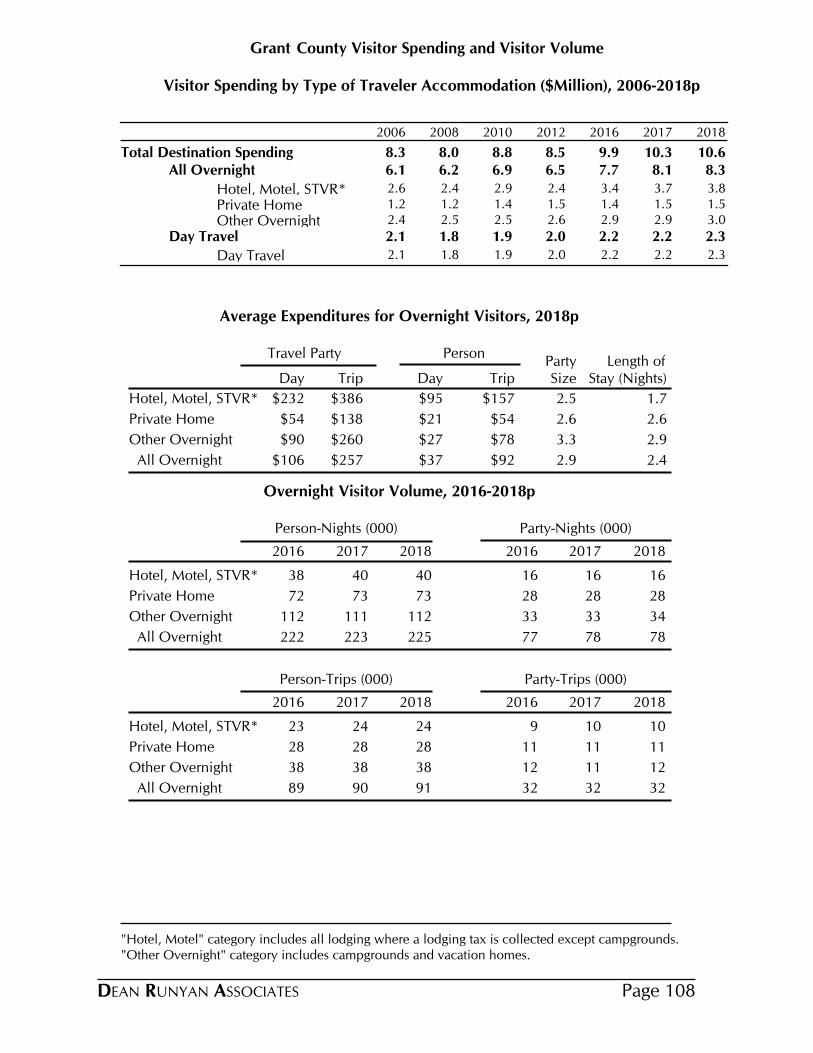
County Visitor Spending and Visitor VolumeGrant
Visitor Spending by Type of Traveler Accommodation ($Million), 2006-2018p
2006 2008 2010 2012 2016 2017 2018
Total Destination Spending 8.3 8.0 8.8 8.5 9.9 10.3 10.6All Overnight 6.1 6.2 6.9 6.5 7.7 8.1 8.3
Hotel, Motel, STVR* 2.6 2.4 2.9 2.4 3.4 3.7 3.8
Private Home 1.2 1.2 1.4 1.5 1.4 1.5 1.5
Other Overnight 2.4 2.5 2.5 2.6 2.9 2.9 3.0
Day Travel 2.1 1.8 1.9 2.0 2.2 2.2 2.3
Day Travel 2.1 1.8 1.9 2.0 2.2 2.2 2.3
Average Expenditures for Overnight Visitors, 2018p
Travel Party PersonParty Length of
Day Trip Day Trip Size Stay (Nights)
$232 $386 $95 $157Hotel, Motel, STVR* 2.5 1.7
$54 $138 $21 $54Private Home 2.6 2.6
$90 $260 $27 $78Other Overnight 3.3 2.9
$106 $257 $37 $92 All Overnight 2.9 2.4
Overnight Visitor Volume, 2016-2018p
Person-Nights (000) Party-Nights (000)
2016 2017 2018 2016 2017 2018
Hotel, Motel, STVR* 38 40 40 16 16 16
Private Home 72 73 73 28 28 28
Other Overnight 112 111 112 33 33 34
All Overnight 222 223 225 77 78 78
Person-Trips (000) Party-Trips (000)
2016 2017 2018 2016 2017 2018
Hotel, Motel, STVR* 23 24 24 9 10 10
Private Home 28 28 28 11 11 11
Other Overnight 38 38 38 12 11 12
All Overnight 89 90 91 32 32 32
"Hotel, Motel" category includes all lodging where a lodging tax is collected except campgrounds. "Other Overnight" category includes campgrounds and vacation homes.
DEAN RUNYAN ASSOCIATES Page 108
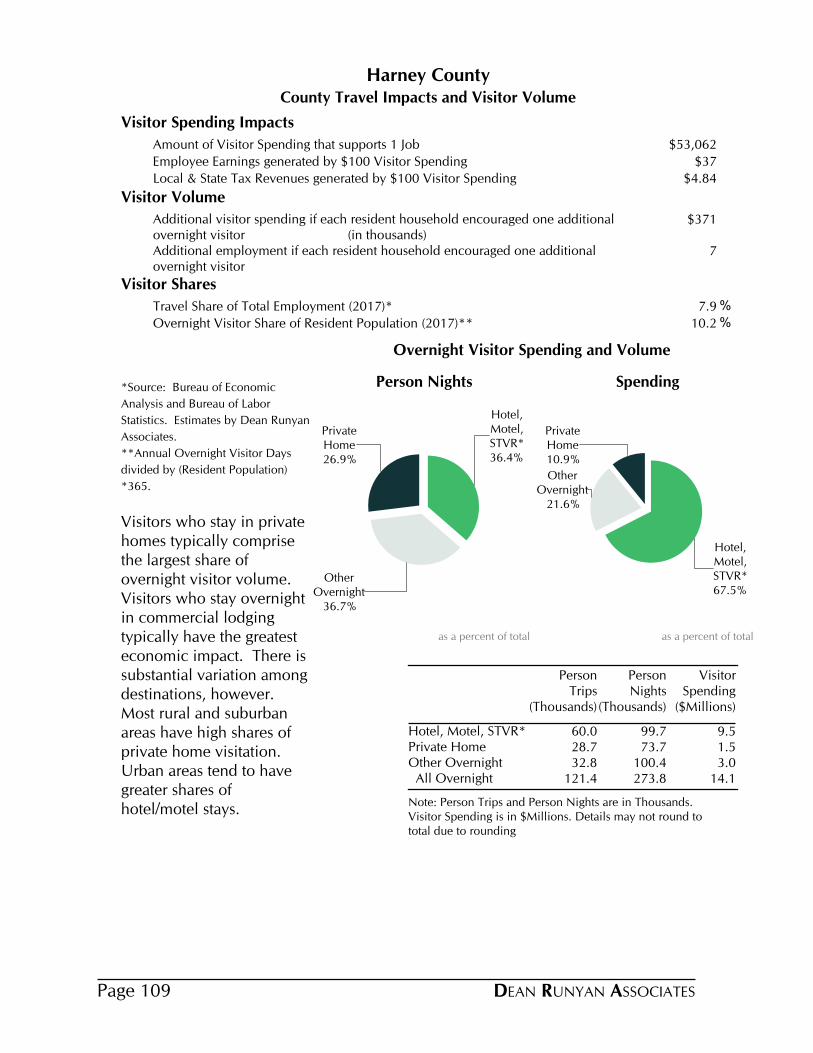
County Travel Impacts and Visitor Volume
Harney County
Visitor Spending Impacts
Amount of Visitor Spending that supports 1 Job $53,062
Employee Earnings generated by $100 Visitor Spending $37
Local & State Tax Revenues generated by $100 Visitor Spending $4.84
Visitor Volume
Additional visitor spending if each resident household encouraged one additional overnight visitor (in thousands)
$371
Additional employment if each resident household encouraged one additional overnight visitor
7
Visitor Shares
Travel Share of Total Employment (2017)* 7.9 %
Overnight Visitor Share of Resident Population (2017)** 10.2 %
*Source: Bureau of Economic
Analysis and Bureau of Labor
Statistics. Estimates by Dean Runyan
Associates.
**Annual Overnight Visitor Days
divided by (Resident Population)
*365.
Visitors who stay in private homes typically comprise the largest share of overnight visitor volume. Visitors who stay overnight in commercial lodging typically have the greatest economic impact. There is substantial variation among destinations, however. Most rural and suburban areas have high shares of private home visitation. Urban areas tend to have greater shares of hotel/motel stays.
Note: Person Trips and Person Nights are in Thousands. Visitor Spending is in $Millions. Details may not round to total due to rounding
Person Trips
(Thousands)
Person Nights
(Thousands)
Visitor Spending
($Millions)
Hotel, Motel, STVR* 60.0 99.7 9.5Private Home 28.7 73.7 1.5Other Overnight 32.8 100.4 3.0 All Overnight 121.4 273.8 14.1
36.4%
Hotel,Motel,STVR*
36.7%
OtherOvernight
26.9%
PrivateHome
Person Nights
as a percent of total
67.5%
Hotel,Motel,STVR*
21.6%
OtherOvernight
10.9%
PrivateHome
Spending
as a percent of total
Overnight Visitor Spending and Volume
DEAN RUNYAN ASSOCIATESPage 109
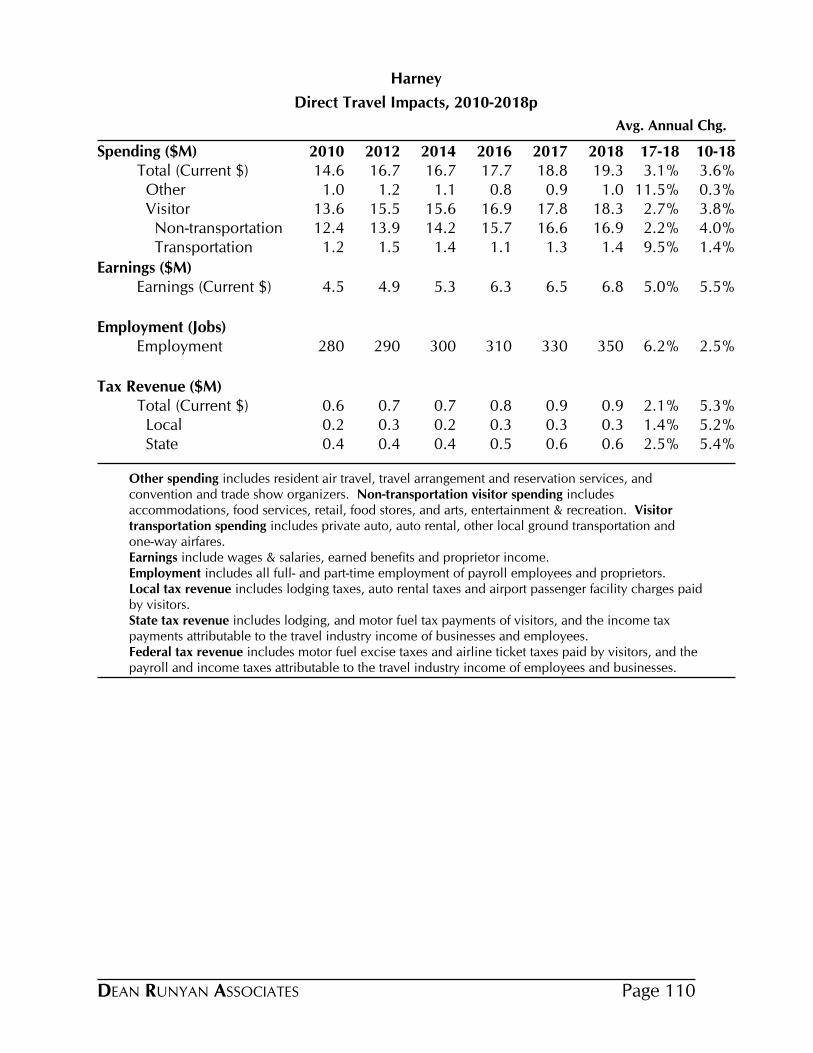
Direct Travel Impacts, 2010-2018p
Avg. Annual Chg.
Harney
Spending ($M) 2010 2012 2014 2016 2017 2018 17-18 10-18Total (Current $) 14.6 16.7 16.7 17.7 18.8 19.3 3.1% 3.6% Other 1.0 1.2 1.1 0.8 0.9 1.0 11.5% 0.3% Visitor 13.6 15.5 15.6 16.9 17.8 18.3 2.7% 3.8% Non-transportation 12.4 13.9 14.2 15.7 16.6 16.9 2.2% 4.0% Transportation 1.2 1.5 1.4 1.1 1.3 1.4 9.5% 1.4%
Earnings ($M)Earnings (Current $) 4.5 4.9 5.3 6.3 6.5 6.8 5.0% 5.5%
Employment (Jobs)Employment 280 290 300 310 330 350 6.2% 2.5%
Tax Revenue ($M)Total (Current $) 0.6 0.7 0.7 0.8 0.9 0.9 2.1% 5.3% Local 0.2 0.3 0.2 0.3 0.3 0.3 1.4% 5.2% State 0.4 0.4 0.4 0.5 0.6 0.6 2.5% 5.4%
Other spending includes resident air travel, travel arrangement and reservation services, and convention and trade show organizers. Non-transportation visitor spending includes accommodations, food services, retail, food stores, and arts, entertainment & recreation. Visitor transportation spending includes private auto, auto rental, other local ground transportation and one-way airfares.Earnings include wages & salaries, earned benefits and proprietor income.Employment includes all full- and part-time employment of payroll employees and proprietors.Local tax revenue includes lodging taxes, auto rental taxes and airport passenger facility charges paid by visitors.State tax revenue includes lodging, and motor fuel tax payments of visitors, and the income tax payments attributable to the travel industry income of businesses and employees.Federal tax revenue includes motor fuel excise taxes and airline ticket taxes paid by visitors, and the payroll and income taxes attributable to the travel industry income of employees and businesses.
DEAN RUNYAN ASSOCIATES Page 110

Travel Impacts, 2006-2018p
Harney County
2006 2008 2010 2012 2016 2017 2018
Destination Spending 17.4 14.5 13.6 15.5 16.9 17.8 18.3Other Travel* 1.0 1.2 1.0 1.2 0.8 0.9 1.0Total 18.4 15.7 14.6 16.7 17.7 18.8 19.3
Total Direct Travel Spending ($Million)
2006 2008 2010 2012 2016 2017 2018
Accommodations 4.0 3.8 3.4 3.9 4.7 5.2 5.3Arts, Ent. & Rec. 3.7 2.7 2.5 2.8 2.9 3.0 3.1Food Service 4.3 3.5 3.4 3.9 4.5 4.7 4.9Food Stores 1.9 1.6 1.7 1.9 2.0 2.0 2.1Local Tran. & Gas 1.6 1.5 1.2 1.5 1.1 1.3 1.4Retail Sales 2.0 1.4 1.4 1.5 1.6 1.6 1.6Total 17.4 14.5 13.6 15.5 16.9 17.8 18.3
Visitor Spending By Commodity Purchased ($Million)
2006 2008 2010 2012 2016 2017 2018
Accom. & Food Serv. 4.0 3.5 3.2 3.5 4.7 4.8 5.1Arts, Ent. & Rec. 1.0 0.9 0.7 0.8 0.9 1.0 1.1Ground Tran. 0.1 0.1 0.1 0.1 0.1 0.1 0.1Other Travel* 0.0 0.0 0.0 0.0 0.0 0.0 0.0Retail** 0.5 0.4 0.4 0.4 0.5 0.5 0.6Total 5.7 4.9 4.5 4.9 6.3 6.5 6.8
Industry Earnings Generated by Travel Spending ($Million)
2006 2008 2010 2012 2016 2017 2018
Accom. & Food Serv. 220 200 180 170 200 210 220Arts, Ent. & Rec. 120 100 90 90 90 90 100Ground Tran. 0 0 0 0 0 0 0Other Travel* 0 0 0 0 0 0 0Retail** 30 20 20 20 20 20 20Total 380 330 280 290 310 330 350
Industry Employment Generated by Travel Spending (Jobs)
2006 2008 2010 2012 2016 2017 2018
Local Tax Receipts 0.2 0.2 0.2 0.3 0.3 0.3 0.3State Tax Receipts 0.5 0.4 0.4 0.4 0.5 0.6 0.6Total 0.7 0.6 0.6 0.7 0.8 0.9 0.9
Tax Receipts Generated by Travel Spending ($Million)
Details may not add to total due to rounding. * Other Travel includes ground transportation and air travel impacts for travel to other Oregon visitor destinations, travel arrangement services, and convention & trade show organizers.** Retail includes gasoline.
DEAN RUNYAN ASSOCIATESPage 111

County Visitor Spending and Visitor VolumeHarney
Visitor Spending by Type of Traveler Accommodation ($Million), 2006-2018p
2006 2008 2010 2012 2016 2017 2018
Total Destination Spending 17.4 14.5 13.6 15.5 16.9 17.8 18.3All Overnight 12.3 11.2 10.3 11.8 13.0 13.8 14.1
Hotel, Motel, STVR* 8.4 7.8 6.5 7.7 8.6 9.3 9.5
Private Home 1.2 1.2 1.4 1.5 1.5 1.5 1.5
Other Overnight 2.7 2.2 2.5 2.6 2.9 2.9 3.0
Day Travel 5.2 3.3 3.3 3.7 3.9 4.1 4.2
Day Travel 5.2 3.3 3.3 3.7 3.9 4.1 4.2
Average Expenditures for Overnight Visitors, 2018p
Travel Party PersonParty Length of
Day Trip Day Trip Size Stay (Nights)
$235 $390 $96 $159Hotel, Motel, STVR* 2.5 1.7
$54 $138 $21 $54Private Home 2.6 2.6
$104 $317 $30 $93Other Overnight 3.4 3.0
$143 $312 $52 $116 All Overnight 2.8 2.2
Overnight Visitor Volume, 2016-2018p
Person-Nights (000) Party-Nights (000)
2016 2017 2018 2016 2017 2018
Hotel, Motel, STVR* 95 99 100 39 40 41
Private Home 73 74 74 29 29 29
Other Overnight 100 99 100 29 29 29
All Overnight 268 271 274 97 98 99
Person-Trips (000) Party-Trips (000)
2016 2017 2018 2016 2017 2018
Hotel, Motel, STVR* 57 60 60 23 24 24
Private Home 28 29 29 11 11 11
Other Overnight 33 32 33 10 9 10
All Overnight 118 120 121 44 45 45
"Hotel, Motel" category includes all lodging where a lodging tax is collected except campgrounds. "Other Overnight" category includes campgrounds and vacation homes.
DEAN RUNYAN ASSOCIATES Page 112
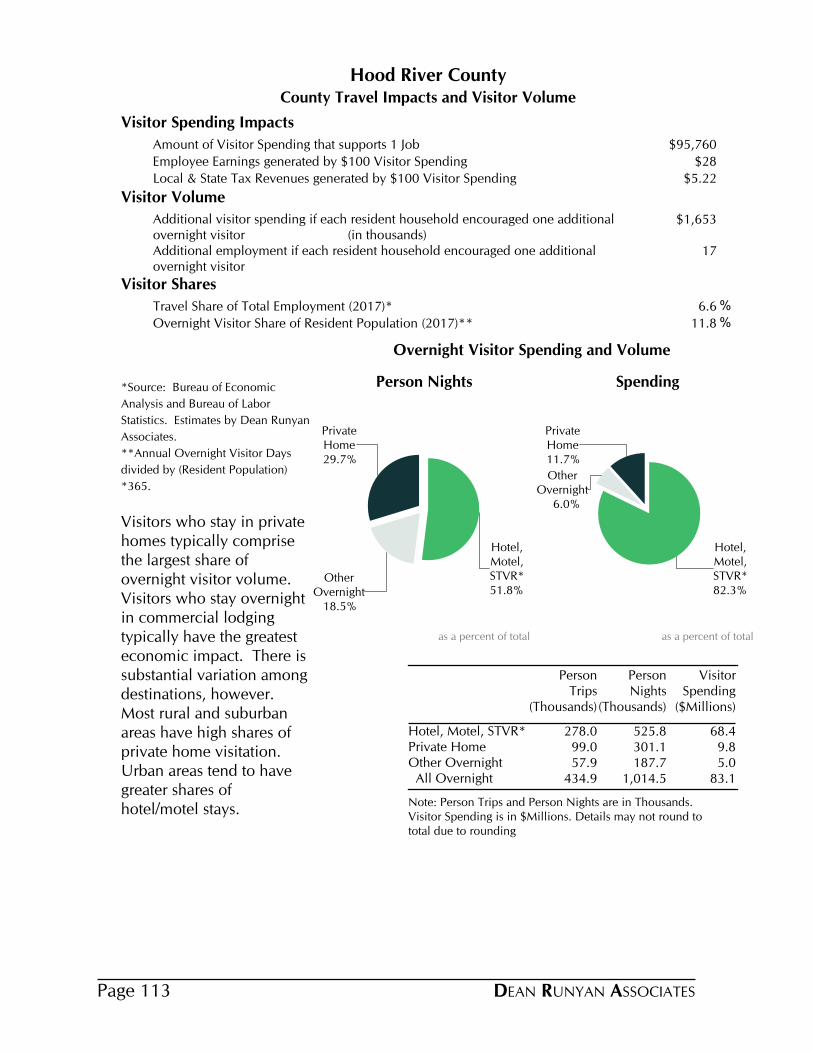
County Travel Impacts and Visitor Volume
Hood River County
Visitor Spending Impacts
Amount of Visitor Spending that supports 1 Job $95,760
Employee Earnings generated by $100 Visitor Spending $28
Local & State Tax Revenues generated by $100 Visitor Spending $5.22
Visitor Volume
Additional visitor spending if each resident household encouraged one additional overnight visitor (in thousands)
$1,653
Additional employment if each resident household encouraged one additional overnight visitor
17
Visitor Shares
Travel Share of Total Employment (2017)* 6.6 %
Overnight Visitor Share of Resident Population (2017)** 11.8 %
*Source: Bureau of Economic
Analysis and Bureau of Labor
Statistics. Estimates by Dean Runyan
Associates.
**Annual Overnight Visitor Days
divided by (Resident Population)
*365.
Visitors who stay in private homes typically comprise the largest share of overnight visitor volume. Visitors who stay overnight in commercial lodging typically have the greatest economic impact. There is substantial variation among destinations, however. Most rural and suburban areas have high shares of private home visitation. Urban areas tend to have greater shares of hotel/motel stays.
Note: Person Trips and Person Nights are in Thousands. Visitor Spending is in $Millions. Details may not round to total due to rounding
Person Trips
(Thousands)
Person Nights
(Thousands)
Visitor Spending
($Millions)
Hotel, Motel, STVR* 278.0 525.8 68.4Private Home 99.0 301.1 9.8Other Overnight 57.9 187.7 5.0 All Overnight 434.9 1,014.5 83.1
51.8%
Hotel,Motel,STVR*
18.5%
OtherOvernight
29.7%
PrivateHome
Person Nights
as a percent of total
82.3%
Hotel,Motel,STVR*
6.0%
OtherOvernight
11.7%
PrivateHome
Spending
as a percent of total
Overnight Visitor Spending and Volume
DEAN RUNYAN ASSOCIATESPage 113

Direct Travel Impacts, 2010-2018p
Avg. Annual Chg.
Hood River
Spending ($M) 2010 2012 2014 2016 2017 2018 17-18 10-18Total (Current $) 73.1 81.4 87.3 100.8 111.4 114.4 2.7% 5.8% Other 3.3 4.0 3.7 3.0 3.3 3.6 11.8% 1.2% Visitor 69.8 77.4 83.6 97.8 108.2 110.8 2.4% 5.9% Non-transportation 61.1 66.8 73.7 89.2 98.1 99.9 1.8% 6.3% Transportation 8.6 10.6 9.9 8.6 10.1 10.9 8.1% 2.9%
Earnings ($M)Earnings (Current $) 18.4 20.0 22.9 27.7 29.6 31.2 5.7% 6.9%
Employment (Jobs)Employment 920 950 1,030 1,120 1,160 1,170 1.1% 3.0%
Tax Revenue ($M)Total (Current $) 3.1 3.5 3.9 5.0 5.6 5.8 2.9% 8.2% Local 1.2 1.3 1.5 2.1 2.4 2.4 3.6% 9.7% State 1.9 2.2 2.4 2.9 3.3 3.3 2.4% 7.3%
Other spending includes resident air travel, travel arrangement and reservation services, and convention and trade show organizers. Non-transportation visitor spending includes accommodations, food services, retail, food stores, and arts, entertainment & recreation. Visitor transportation spending includes private auto, auto rental, other local ground transportation and one-way airfares.Earnings include wages & salaries, earned benefits and proprietor income.Employment includes all full- and part-time employment of payroll employees and proprietors.Local tax revenue includes lodging taxes, auto rental taxes and airport passenger facility charges paid by visitors.State tax revenue includes lodging, and motor fuel tax payments of visitors, and the income tax payments attributable to the travel industry income of businesses and employees.Federal tax revenue includes motor fuel excise taxes and airline ticket taxes paid by visitors, and the payroll and income taxes attributable to the travel industry income of employees and businesses.
DEAN RUNYAN ASSOCIATES Page 114
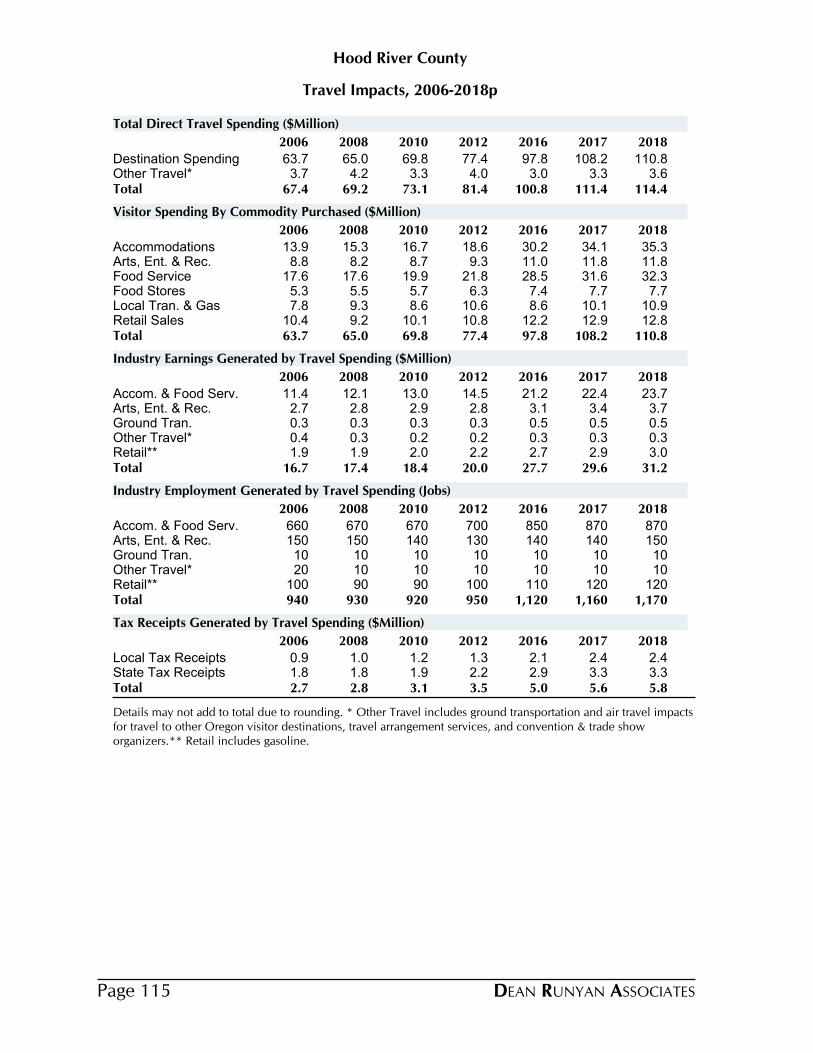
Travel Impacts, 2006-2018p
Hood River County
2006 2008 2010 2012 2016 2017 2018
Destination Spending 63.7 65.0 69.8 77.4 97.8 108.2 110.8Other Travel* 3.7 4.2 3.3 4.0 3.0 3.3 3.6Total 67.4 69.2 73.1 81.4 100.8 111.4 114.4
Total Direct Travel Spending ($Million)
2006 2008 2010 2012 2016 2017 2018
Accommodations 13.9 15.3 16.7 18.6 30.2 34.1 35.3Arts, Ent. & Rec. 8.8 8.2 8.7 9.3 11.0 11.8 11.8Food Service 17.6 17.6 19.9 21.8 28.5 31.6 32.3Food Stores 5.3 5.5 5.7 6.3 7.4 7.7 7.7Local Tran. & Gas 7.8 9.3 8.6 10.6 8.6 10.1 10.9Retail Sales 10.4 9.2 10.1 10.8 12.2 12.9 12.8Total 63.7 65.0 69.8 77.4 97.8 108.2 110.8
Visitor Spending By Commodity Purchased ($Million)
2006 2008 2010 2012 2016 2017 2018
Accom. & Food Serv. 11.4 12.1 13.0 14.5 21.2 22.4 23.7Arts, Ent. & Rec. 2.7 2.8 2.9 2.8 3.1 3.4 3.7Ground Tran. 0.3 0.3 0.3 0.3 0.5 0.5 0.5Other Travel* 0.4 0.3 0.2 0.2 0.3 0.3 0.3Retail** 1.9 1.9 2.0 2.2 2.7 2.9 3.0Total 16.7 17.4 18.4 20.0 27.7 29.6 31.2
Industry Earnings Generated by Travel Spending ($Million)
2006 2008 2010 2012 2016 2017 2018
Accom. & Food Serv. 660 670 670 700 850 870 870Arts, Ent. & Rec. 150 150 140 130 140 140 150Ground Tran. 10 10 10 10 10 10 10Other Travel* 20 10 10 10 10 10 10Retail** 100 90 90 100 110 120 120Total 940 930 920 950 1,120 1,160 1,170
Industry Employment Generated by Travel Spending (Jobs)
2006 2008 2010 2012 2016 2017 2018
Local Tax Receipts 0.9 1.0 1.2 1.3 2.1 2.4 2.4State Tax Receipts 1.8 1.8 1.9 2.2 2.9 3.3 3.3Total 2.7 2.8 3.1 3.5 5.0 5.6 5.8
Tax Receipts Generated by Travel Spending ($Million)
Details may not add to total due to rounding. * Other Travel includes ground transportation and air travel impacts for travel to other Oregon visitor destinations, travel arrangement services, and convention & trade show organizers.** Retail includes gasoline.
DEAN RUNYAN ASSOCIATESPage 115
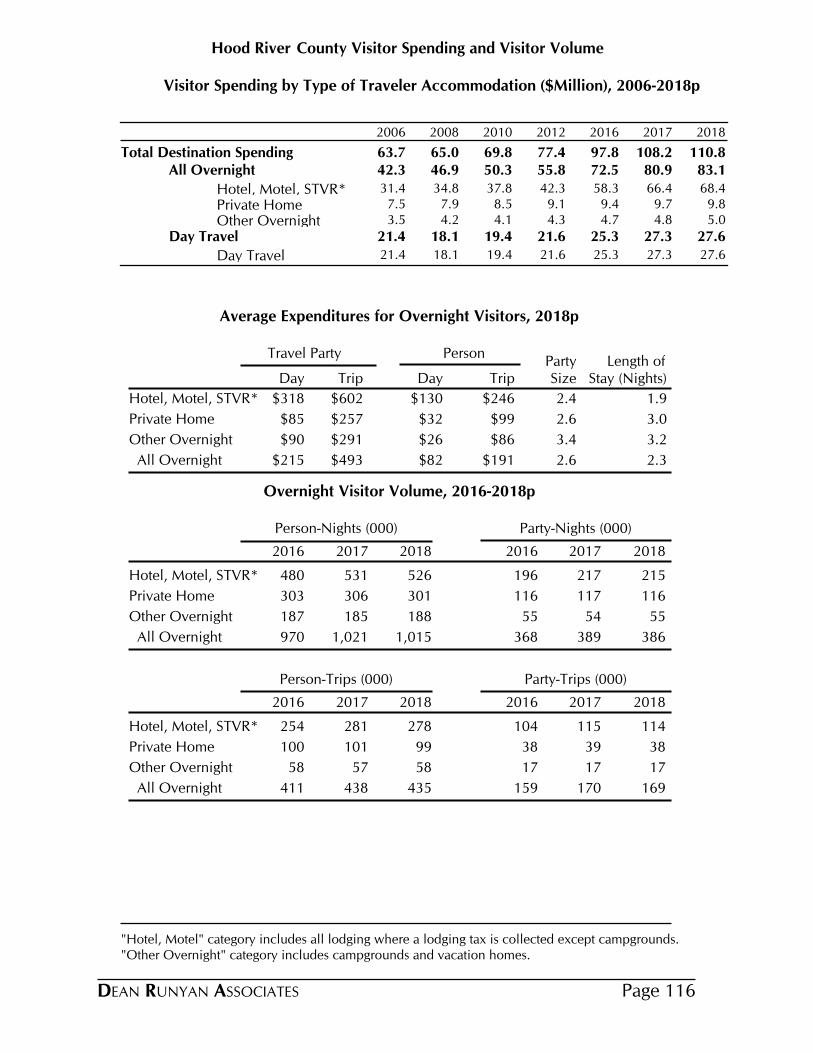
County Visitor Spending and Visitor VolumeHood River
Visitor Spending by Type of Traveler Accommodation ($Million), 2006-2018p
2006 2008 2010 2012 2016 2017 2018
Total Destination Spending 63.7 65.0 69.8 77.4 97.8 108.2 110.8All Overnight 42.3 46.9 50.3 55.8 72.5 80.9 83.1
Hotel, Motel, STVR* 31.4 34.8 37.8 42.3 58.3 66.4 68.4
Private Home 7.5 7.9 8.5 9.1 9.4 9.7 9.8
Other Overnight 3.5 4.2 4.1 4.3 4.7 4.8 5.0
Day Travel 21.4 18.1 19.4 21.6 25.3 27.3 27.6
Day Travel 21.4 18.1 19.4 21.6 25.3 27.3 27.6
Average Expenditures for Overnight Visitors, 2018p
Travel Party PersonParty Length of
Day Trip Day Trip Size Stay (Nights)
$318 $602 $130 $246Hotel, Motel, STVR* 2.4 1.9
$85 $257 $32 $99Private Home 2.6 3.0
$90 $291 $26 $86Other Overnight 3.4 3.2
$215 $493 $82 $191 All Overnight 2.6 2.3
Overnight Visitor Volume, 2016-2018p
Person-Nights (000) Party-Nights (000)
2016 2017 2018 2016 2017 2018
Hotel, Motel, STVR* 480 531 526 196 217 215
Private Home 303 306 301 116 117 116
Other Overnight 187 185 188 55 54 55
All Overnight 970 1,021 1,015 368 389 386
Person-Trips (000) Party-Trips (000)
2016 2017 2018 2016 2017 2018
Hotel, Motel, STVR* 254 281 278 104 115 114
Private Home 100 101 99 38 39 38
Other Overnight 58 57 58 17 17 17
All Overnight 411 438 435 159 170 169
"Hotel, Motel" category includes all lodging where a lodging tax is collected except campgrounds. "Other Overnight" category includes campgrounds and vacation homes.
DEAN RUNYAN ASSOCIATES Page 116
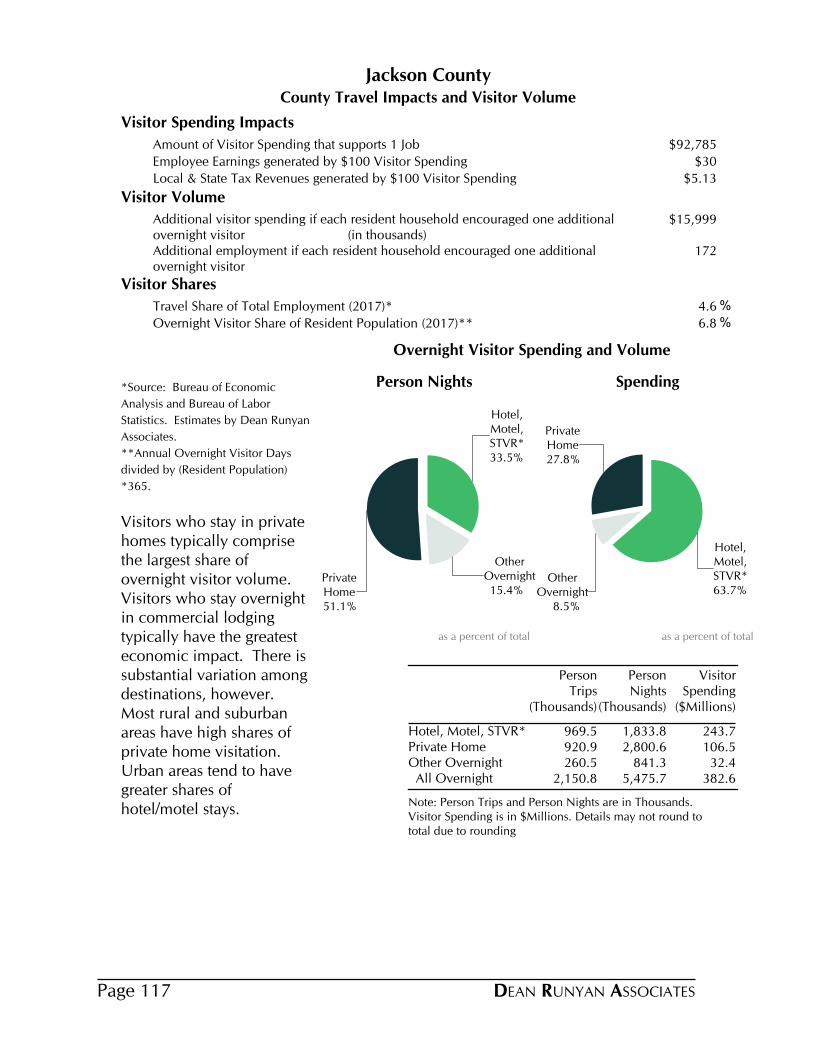
County Travel Impacts and Visitor Volume
Jackson County
Visitor Spending Impacts
Amount of Visitor Spending that supports 1 Job $92,785
Employee Earnings generated by $100 Visitor Spending $30
Local & State Tax Revenues generated by $100 Visitor Spending $5.13
Visitor Volume
Additional visitor spending if each resident household encouraged one additional overnight visitor (in thousands)
$15,999
Additional employment if each resident household encouraged one additional overnight visitor
172
Visitor Shares
Travel Share of Total Employment (2017)* 4.6 %
Overnight Visitor Share of Resident Population (2017)** 6.8 %
*Source: Bureau of Economic
Analysis and Bureau of Labor
Statistics. Estimates by Dean Runyan
Associates.
**Annual Overnight Visitor Days
divided by (Resident Population)
*365.
Visitors who stay in private homes typically comprise the largest share of overnight visitor volume. Visitors who stay overnight in commercial lodging typically have the greatest economic impact. There is substantial variation among destinations, however. Most rural and suburban areas have high shares of private home visitation. Urban areas tend to have greater shares of hotel/motel stays.
Note: Person Trips and Person Nights are in Thousands. Visitor Spending is in $Millions. Details may not round to total due to rounding
Person Trips
(Thousands)
Person Nights
(Thousands)
Visitor Spending
($Millions)
Hotel, Motel, STVR* 969.5 1,833.8 243.7Private Home 920.9 2,800.6 106.5Other Overnight 260.5 841.3 32.4 All Overnight 2,150.8 5,475.7 382.6
33.5%
Hotel,Motel,STVR*
15.4%
OtherOvernight
51.1%
PrivateHome
Person Nights
as a percent of total
63.7%
Hotel,Motel,STVR*
8.5%
OtherOvernight
27.8%
PrivateHome
Spending
as a percent of total
Overnight Visitor Spending and Volume
DEAN RUNYAN ASSOCIATESPage 117
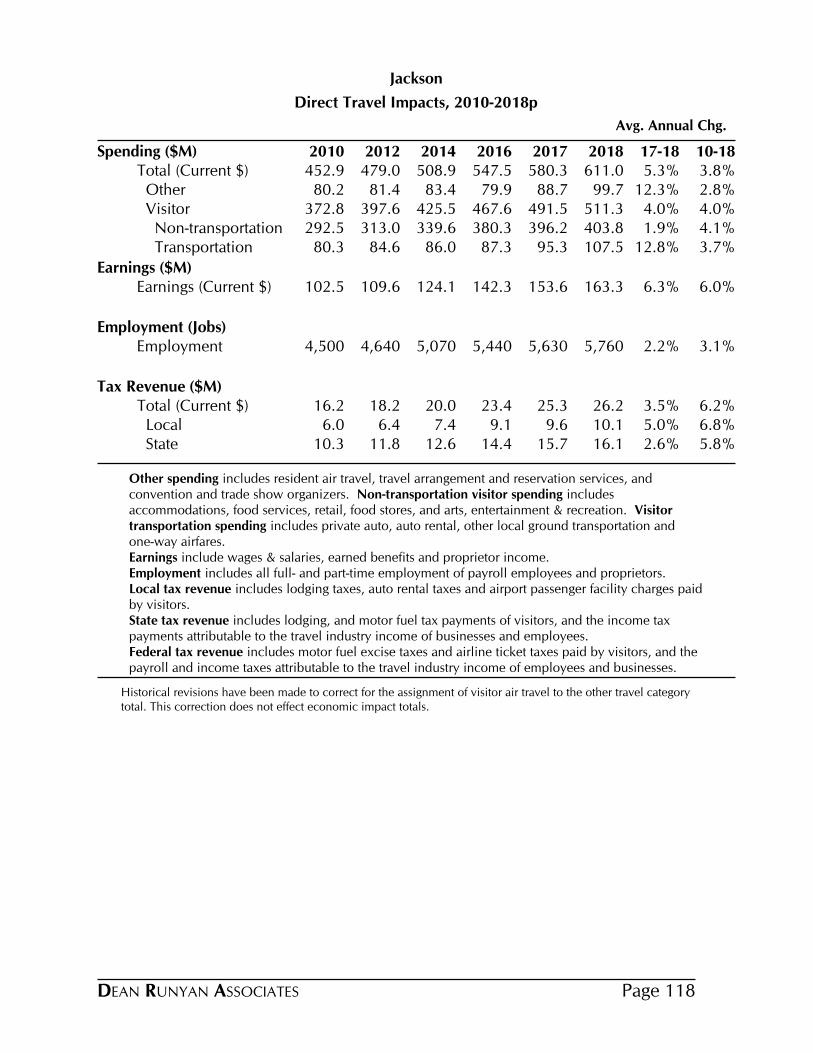
Direct Travel Impacts, 2010-2018p
Avg. Annual Chg.
Jackson
Spending ($M) 2010 2012 2014 2016 2017 2018 17-18 10-18Total (Current $) 452.9 479.0 508.9 547.5 580.3 611.0 5.3% 3.8% Other 80.2 81.4 83.4 79.9 88.7 99.7 12.3% 2.8% Visitor 372.8 397.6 425.5 467.6 491.5 511.3 4.0% 4.0% Non-transportation 292.5 313.0 339.6 380.3 396.2 403.8 1.9% 4.1% Transportation 80.3 84.6 86.0 87.3 95.3 107.5 12.8% 3.7%
Earnings ($M)Earnings (Current $) 102.5 109.6 124.1 142.3 153.6 163.3 6.3% 6.0%
Employment (Jobs)Employment 4,500 4,640 5,070 5,440 5,630 5,760 2.2% 3.1%
Tax Revenue ($M)Total (Current $) 16.2 18.2 20.0 23.4 25.3 26.2 3.5% 6.2% Local 6.0 6.4 7.4 9.1 9.6 10.1 5.0% 6.8% State 10.3 11.8 12.6 14.4 15.7 16.1 2.6% 5.8%
Other spending includes resident air travel, travel arrangement and reservation services, and convention and trade show organizers. Non-transportation visitor spending includes accommodations, food services, retail, food stores, and arts, entertainment & recreation. Visitor transportation spending includes private auto, auto rental, other local ground transportation and one-way airfares.Earnings include wages & salaries, earned benefits and proprietor income.Employment includes all full- and part-time employment of payroll employees and proprietors.Local tax revenue includes lodging taxes, auto rental taxes and airport passenger facility charges paid by visitors.State tax revenue includes lodging, and motor fuel tax payments of visitors, and the income tax payments attributable to the travel industry income of businesses and employees.Federal tax revenue includes motor fuel excise taxes and airline ticket taxes paid by visitors, and the payroll and income taxes attributable to the travel industry income of employees and businesses.
Historical revisions have been made to correct for the assignment of visitor air travel to the other travel category total. This correction does not effect economic impact totals.
DEAN RUNYAN ASSOCIATES Page 118

Travel Impacts, 2006-2018p
Jackson County
2006 2008 2010 2012 2016 2017 2018
Destination Spending 344.7 361.6 372.8 397.6 467.6 491.5 511.3Other Travel* 74.4 79.0 80.2 81.4 79.9 88.7 99.7Total 419.1 440.6 452.9 479.0 547.5 580.3 611.0
Total Direct Travel Spending ($Million)
2006 2008 2010 2012 2016 2017 2018
Accommodations 66.4 67.3 69.2 74.2 98.1 104.2 105.5Arts, Ent. & Rec. 44.6 44.3 44.4 46.4 53.0 54.5 55.2Food Service 85.2 89.9 95.8 103.6 130.3 137.6 142.2Food Stores 30.3 33.5 33.0 36.1 41.2 41.4 41.9Local Tran. & Gas 40.8 50.7 45.0 53.9 45.8 50.3 56.5Retail Sales 50.0 48.2 50.0 52.7 57.7 58.5 58.9Visitor Air Tran. 27.4 27.6 35.3 30.7 41.5 45.0 51.0Total 344.7 361.6 372.8 397.6 467.6 491.5 511.3
Visitor Spending By Commodity Purchased ($Million)
2006 2008 2010 2012 2016 2017 2018
Accom. & Food Serv. 62.1 66.5 67.4 72.6 98.5 106.9 113.8Arts, Ent. & Rec. 12.9 14.8 13.9 14.2 16.9 17.8 18.6Ground Tran. 1.9 2.2 2.1 2.3 3.0 3.2 3.5Other Travel* 8.4 8.7 8.1 8.9 9.9 11.0 12.2Retail** 10.5 11.0 10.9 11.7 14.0 14.7 15.2Total 95.7 103.1 102.5 109.6 142.3 153.6 163.3
Industry Earnings Generated by Travel Spending ($Million)
2006 2008 2010 2012 2016 2017 2018
Accom. & Food Serv. 3,100 3,200 3,060 3,210 3,910 4,040 4,110Arts, Ent. & Rec. 730 830 700 660 710 760 790Ground Tran. 70 80 70 80 90 90 90Other Travel* 270 300 230 240 230 230 240Retail** 440 450 440 460 500 520 520Total 4,610 4,860 4,500 4,640 5,440 5,630 5,760
Industry Employment Generated by Travel Spending (Jobs)
2006 2008 2010 2012 2016 2017 2018
Local Tax Receipts 5.3 5.6 6.0 6.4 9.1 9.6 10.1State Tax Receipts 9.9 10.4 10.3 11.8 14.4 15.7 16.1Total 15.1 16.1 16.2 18.2 23.4 25.3 26.2
Tax Receipts Generated by Travel Spending ($Million)
Details may not add to total due to rounding. * Other Travel includes ground transportation and air travel impacts for travel to other Oregon visitor destinations, travel arrangement services, and convention & trade show organizers.** Retail includes gasoline.
Historical revisions have been made to correct for the assignment of visitor air travel to the other travel category total. This correction does not effect economic impact totals.
DEAN RUNYAN ASSOCIATESPage 119
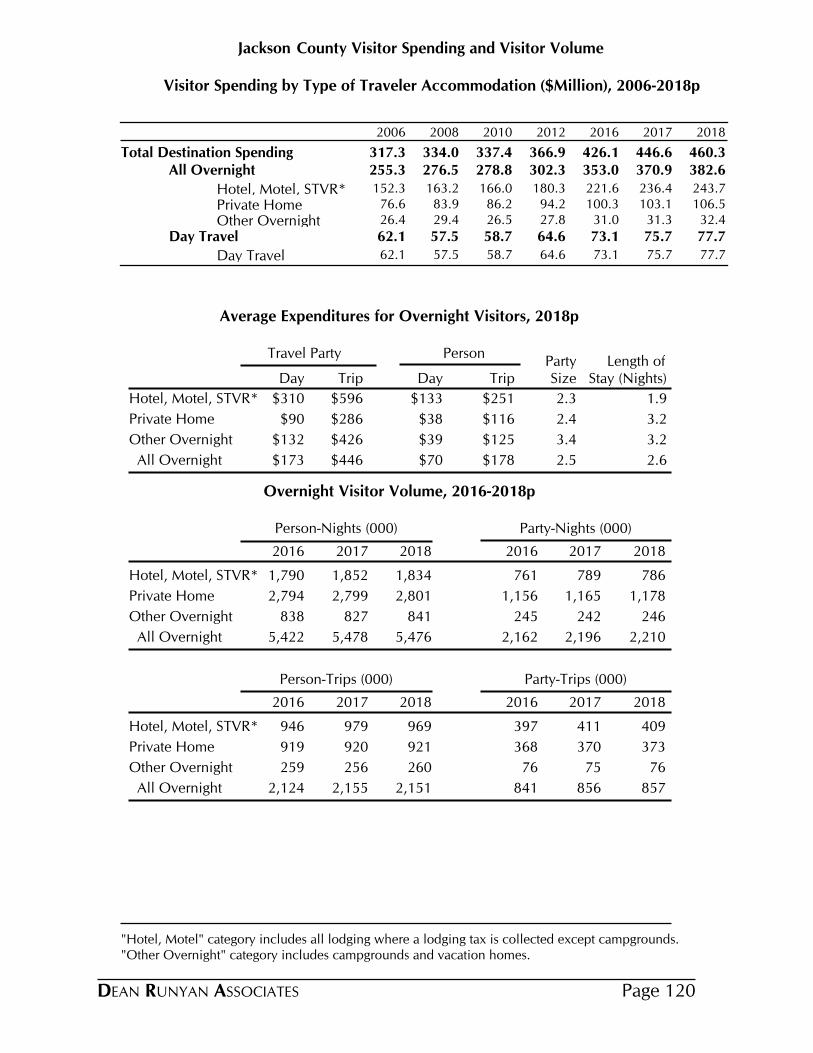
County Visitor Spending and Visitor VolumeJackson
Visitor Spending by Type of Traveler Accommodation ($Million), 2006-2018p
2006 2008 2010 2012 2016 2017 2018
Total Destination Spending 317.3 334.0 337.4 366.9 426.1 446.6 460.3All Overnight 255.3 276.5 278.8 302.3 353.0 370.9 382.6
Hotel, Motel, STVR* 152.3 163.2 166.0 180.3 221.6 236.4 243.7
Private Home 76.6 83.9 86.2 94.2 100.3 103.1 106.5
Other Overnight 26.4 29.4 26.5 27.8 31.0 31.3 32.4
Day Travel 62.1 57.5 58.7 64.6 73.1 75.7 77.7
Day Travel 62.1 57.5 58.7 64.6 73.1 75.7 77.7
Average Expenditures for Overnight Visitors, 2018p
Travel Party PersonParty Length of
Day Trip Day Trip Size Stay (Nights)
$310 $596 $133 $251Hotel, Motel, STVR* 2.3 1.9
$90 $286 $38 $116Private Home 2.4 3.2
$132 $426 $39 $125Other Overnight 3.4 3.2
$173 $446 $70 $178 All Overnight 2.5 2.6
Overnight Visitor Volume, 2016-2018p
Person-Nights (000) Party-Nights (000)
2016 2017 2018 2016 2017 2018
Hotel, Motel, STVR* 1,790 1,852 1,834 761 789 786
Private Home 2,794 2,799 2,801 1,156 1,165 1,178
Other Overnight 838 827 841 245 242 246
All Overnight 5,422 5,478 5,476 2,162 2,196 2,210
Person-Trips (000) Party-Trips (000)
2016 2017 2018 2016 2017 2018
Hotel, Motel, STVR* 946 979 969 397 411 409
Private Home 919 920 921 368 370 373
Other Overnight 259 256 260 76 75 76
All Overnight 2,124 2,155 2,151 841 856 857
"Hotel, Motel" category includes all lodging where a lodging tax is collected except campgrounds. "Other Overnight" category includes campgrounds and vacation homes.
DEAN RUNYAN ASSOCIATES Page 120
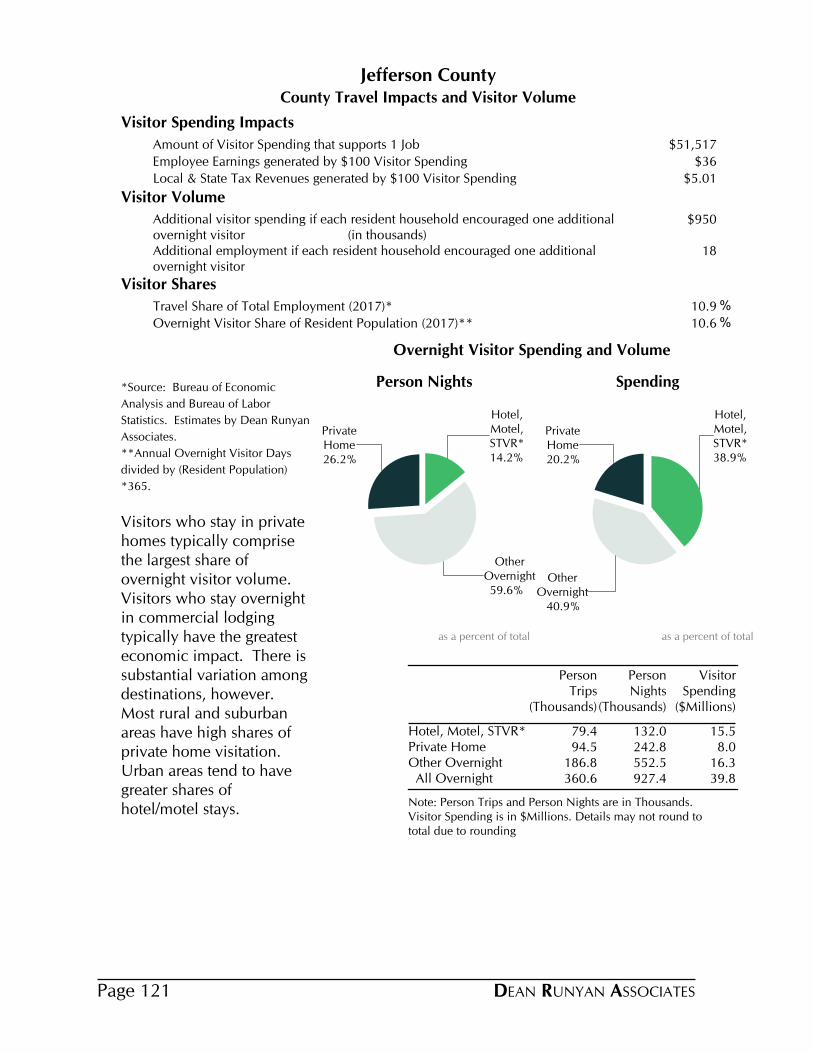
County Travel Impacts and Visitor Volume
Jefferson County
Visitor Spending Impacts
Amount of Visitor Spending that supports 1 Job $51,517
Employee Earnings generated by $100 Visitor Spending $36
Local & State Tax Revenues generated by $100 Visitor Spending $5.01
Visitor Volume
Additional visitor spending if each resident household encouraged one additional overnight visitor (in thousands)
$950
Additional employment if each resident household encouraged one additional overnight visitor
18
Visitor Shares
Travel Share of Total Employment (2017)* 10.9 %
Overnight Visitor Share of Resident Population (2017)** 10.6 %
*Source: Bureau of Economic
Analysis and Bureau of Labor
Statistics. Estimates by Dean Runyan
Associates.
**Annual Overnight Visitor Days
divided by (Resident Population)
*365.
Visitors who stay in private homes typically comprise the largest share of overnight visitor volume. Visitors who stay overnight in commercial lodging typically have the greatest economic impact. There is substantial variation among destinations, however. Most rural and suburban areas have high shares of private home visitation. Urban areas tend to have greater shares of hotel/motel stays.
Note: Person Trips and Person Nights are in Thousands. Visitor Spending is in $Millions. Details may not round to total due to rounding
Person Trips
(Thousands)
Person Nights
(Thousands)
Visitor Spending
($Millions)
Hotel, Motel, STVR* 79.4 132.0 15.5Private Home 94.5 242.8 8.0Other Overnight 186.8 552.5 16.3 All Overnight 360.6 927.4 39.8
14.2%
Hotel,Motel,STVR*
59.6%
OtherOvernight
26.2%
PrivateHome
Person Nights
as a percent of total
38.9%
Hotel,Motel,STVR*
40.9%
OtherOvernight
20.2%
PrivateHome
Spending
as a percent of total
Overnight Visitor Spending and Volume
DEAN RUNYAN ASSOCIATESPage 121

Direct Travel Impacts, 2010-2018p
Avg. Annual Chg.
Jefferson
Spending ($M) 2010 2012 2014 2016 2017 2018 17-18 10-18Total (Current $) 42.5 47.1 48.1 50.5 52.5 55.1 5.0% 3.3% Other 3.0 3.7 3.5 2.7 3.0 3.4 11.5% 1.6% Visitor 39.5 43.4 44.6 47.8 49.4 51.7 4.6% 3.4% Non-transportation 34.6 37.3 39.1 43.4 44.6 46.3 3.8% 3.7% Transportation 4.9 6.1 5.5 4.4 4.8 5.4 12.0% 1.2%
Earnings ($M)Earnings (Current $) 10.0 11.8 14.6 16.6 17.5 18.7 6.6% 8.2%
Employment (Jobs)Employment 690 820 960 1,020 1,010 1,010 0.4% 4.9%
Tax Revenue ($M)Total (Current $) 1.5 1.8 2.0 2.3 2.5 2.6 4.0% 7.1% Local 0.4 0.5 0.5 0.6 0.7 0.7 5.4% 7.7% State 1.1 1.3 1.5 1.7 1.8 1.9 3.5% 6.9%
Other spending includes resident air travel, travel arrangement and reservation services, and convention and trade show organizers. Non-transportation visitor spending includes accommodations, food services, retail, food stores, and arts, entertainment & recreation. Visitor transportation spending includes private auto, auto rental, other local ground transportation and one-way airfares.Earnings include wages & salaries, earned benefits and proprietor income.Employment includes all full- and part-time employment of payroll employees and proprietors.Local tax revenue includes lodging taxes, auto rental taxes and airport passenger facility charges paid by visitors.State tax revenue includes lodging, and motor fuel tax payments of visitors, and the income tax payments attributable to the travel industry income of businesses and employees.Federal tax revenue includes motor fuel excise taxes and airline ticket taxes paid by visitors, and the payroll and income taxes attributable to the travel industry income of employees and businesses.
DEAN RUNYAN ASSOCIATES Page 122

Travel Impacts, 2006-2018p
Jefferson County
2006 2008 2010 2012 2016 2017 2018
Destination Spending 38.8 40.5 39.5 43.4 47.8 49.4 51.7Other Travel* 2.8 3.5 3.0 3.7 2.7 3.0 3.4Total 41.6 44.0 42.5 47.1 50.5 52.5 55.1
Total Direct Travel Spending ($Million)
2006 2008 2010 2012 2016 2017 2018
Accommodations 6.5 6.6 6.3 7.1 9.3 9.8 10.2Arts, Ent. & Rec. 6.6 6.5 6.3 6.6 7.3 7.4 7.6Food Service 9.6 10.1 10.5 11.5 13.7 14.2 15.0Food Stores 5.6 6.0 5.8 6.3 7.1 7.1 7.2Local Tran. & Gas 4.8 5.8 4.9 6.1 4.4 4.8 5.4Retail Sales 5.6 5.5 5.6 5.8 6.1 6.2 6.3Total 38.8 40.5 39.5 43.4 47.8 49.4 51.7
Visitor Spending By Commodity Purchased ($Million)
2006 2008 2010 2012 2016 2017 2018
Accom. & Food Serv. 6.1 6.5 6.4 7.0 10.2 10.8 12.0Arts, Ent. & Rec. 1.7 2.0 1.8 2.8 4.2 4.3 4.2Ground Tran. 0.2 0.2 0.2 0.2 0.2 0.2 0.2Other Travel* 0.1 0.1 0.1 0.1 0.1 0.1 0.1Retail** 1.5 1.6 1.5 1.6 1.9 2.0 2.1Total 9.5 10.3 10.0 11.8 16.6 17.5 18.7
Industry Earnings Generated by Travel Spending ($Million)
2006 2008 2010 2012 2016 2017 2018
Accom. & Food Serv. 360 350 360 370 470 480 510Arts, Ent. & Rec. 180 250 250 360 450 420 400Ground Tran. 10 10 10 10 10 10 10Other Travel* 10 10 10 10 10 10 10Retail** 80 80 80 80 90 90 90Total 630 700 690 820 1,020 1,010 1,010
Industry Employment Generated by Travel Spending (Jobs)
2006 2008 2010 2012 2016 2017 2018
Local Tax Receipts 0.3 0.4 0.4 0.5 0.6 0.7 0.7State Tax Receipts 1.1 1.1 1.1 1.3 1.7 1.8 1.9Total 1.4 1.6 1.5 1.8 2.3 2.5 2.6
Tax Receipts Generated by Travel Spending ($Million)
Details may not add to total due to rounding. * Other Travel includes ground transportation and air travel impacts for travel to other Oregon visitor destinations, travel arrangement services, and convention & trade show organizers.** Retail includes gasoline.
DEAN RUNYAN ASSOCIATESPage 123
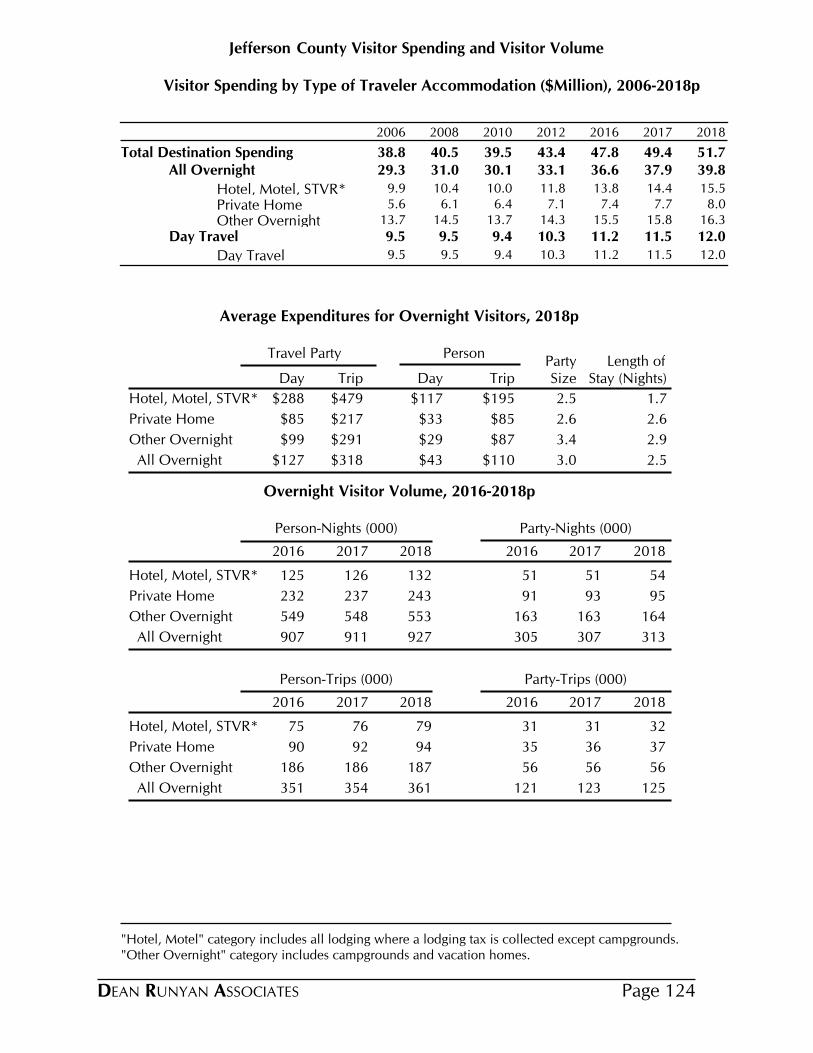
County Visitor Spending and Visitor VolumeJefferson
Visitor Spending by Type of Traveler Accommodation ($Million), 2006-2018p
2006 2008 2010 2012 2016 2017 2018
Total Destination Spending 38.8 40.5 39.5 43.4 47.8 49.4 51.7All Overnight 29.3 31.0 30.1 33.1 36.6 37.9 39.8
Hotel, Motel, STVR* 9.9 10.4 10.0 11.8 13.8 14.4 15.5
Private Home 5.6 6.1 6.4 7.1 7.4 7.7 8.0
Other Overnight 13.7 14.5 13.7 14.3 15.5 15.8 16.3
Day Travel 9.5 9.5 9.4 10.3 11.2 11.5 12.0
Day Travel 9.5 9.5 9.4 10.3 11.2 11.5 12.0
Average Expenditures for Overnight Visitors, 2018p
Travel Party PersonParty Length of
Day Trip Day Trip Size Stay (Nights)
$288 $479 $117 $195Hotel, Motel, STVR* 2.5 1.7
$85 $217 $33 $85Private Home 2.6 2.6
$99 $291 $29 $87Other Overnight 3.4 2.9
$127 $318 $43 $110 All Overnight 3.0 2.5
Overnight Visitor Volume, 2016-2018p
Person-Nights (000) Party-Nights (000)
2016 2017 2018 2016 2017 2018
Hotel, Motel, STVR* 125 126 132 51 51 54
Private Home 232 237 243 91 93 95
Other Overnight 549 548 553 163 163 164
All Overnight 907 911 927 305 307 313
Person-Trips (000) Party-Trips (000)
2016 2017 2018 2016 2017 2018
Hotel, Motel, STVR* 75 76 79 31 31 32
Private Home 90 92 94 35 36 37
Other Overnight 186 186 187 56 56 56
All Overnight 351 354 361 121 123 125
"Hotel, Motel" category includes all lodging where a lodging tax is collected except campgrounds. "Other Overnight" category includes campgrounds and vacation homes.
DEAN RUNYAN ASSOCIATES Page 124
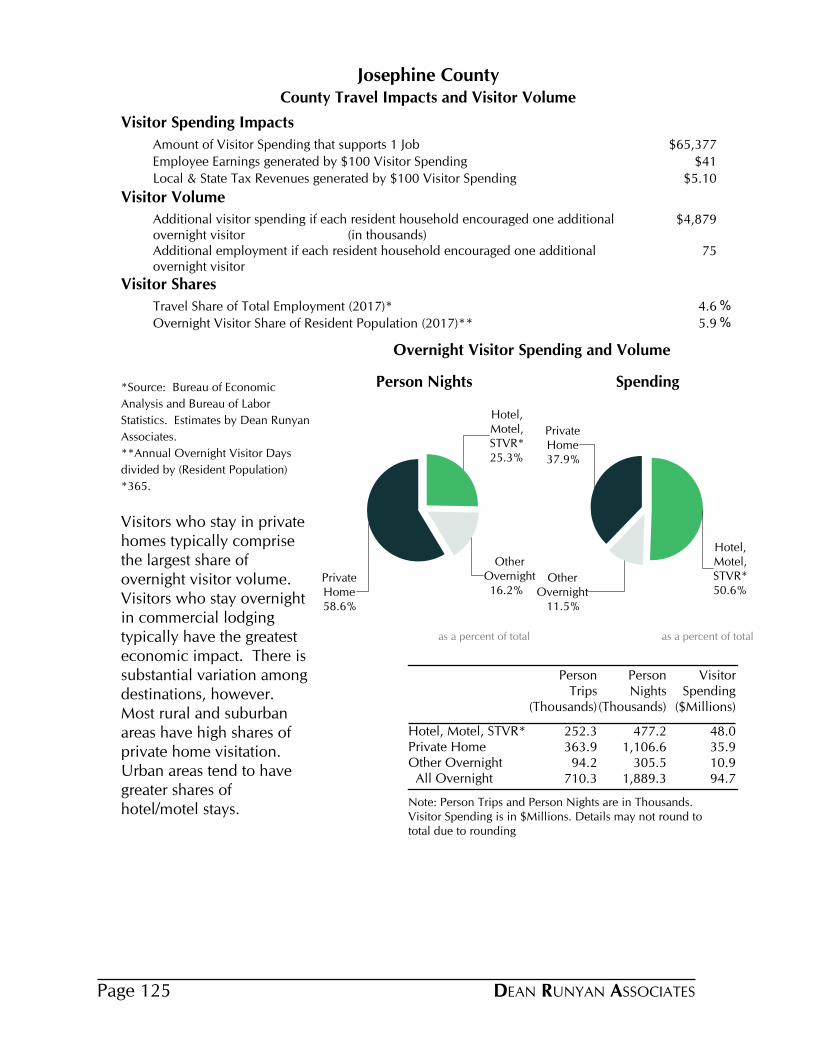
County Travel Impacts and Visitor Volume
Josephine County
Visitor Spending Impacts
Amount of Visitor Spending that supports 1 Job $65,377
Employee Earnings generated by $100 Visitor Spending $41
Local & State Tax Revenues generated by $100 Visitor Spending $5.10
Visitor Volume
Additional visitor spending if each resident household encouraged one additional overnight visitor (in thousands)
$4,879
Additional employment if each resident household encouraged one additional overnight visitor
75
Visitor Shares
Travel Share of Total Employment (2017)* 4.6 %
Overnight Visitor Share of Resident Population (2017)** 5.9 %
*Source: Bureau of Economic
Analysis and Bureau of Labor
Statistics. Estimates by Dean Runyan
Associates.
**Annual Overnight Visitor Days
divided by (Resident Population)
*365.
Visitors who stay in private homes typically comprise the largest share of overnight visitor volume. Visitors who stay overnight in commercial lodging typically have the greatest economic impact. There is substantial variation among destinations, however. Most rural and suburban areas have high shares of private home visitation. Urban areas tend to have greater shares of hotel/motel stays.
Note: Person Trips and Person Nights are in Thousands. Visitor Spending is in $Millions. Details may not round to total due to rounding
Person Trips
(Thousands)
Person Nights
(Thousands)
Visitor Spending
($Millions)
Hotel, Motel, STVR* 252.3 477.2 48.0Private Home 363.9 1,106.6 35.9Other Overnight 94.2 305.5 10.9 All Overnight 710.3 1,889.3 94.7
25.3%
Hotel,Motel,STVR*
16.2%
OtherOvernight
58.6%
PrivateHome
Person Nights
as a percent of total
50.6%
Hotel,Motel,STVR*
11.5%
OtherOvernight
37.9%
PrivateHome
Spending
as a percent of total
Overnight Visitor Spending and Volume
DEAN RUNYAN ASSOCIATESPage 125
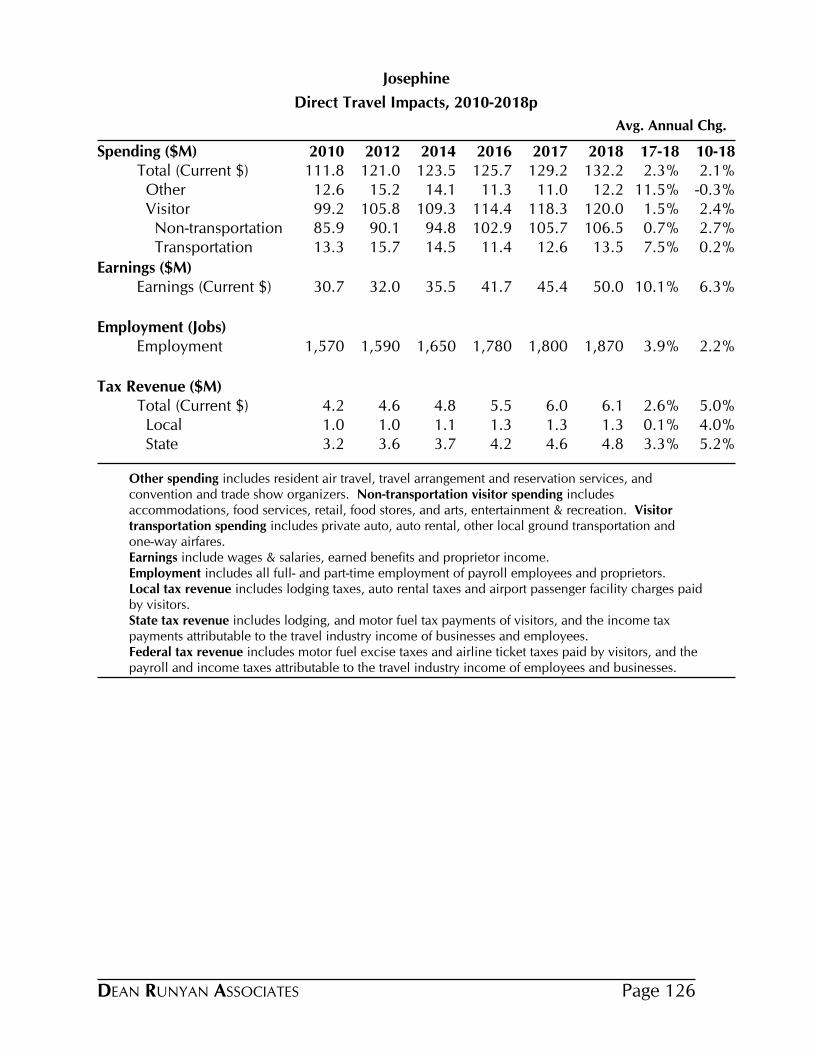
Direct Travel Impacts, 2010-2018p
Avg. Annual Chg.
Josephine
Spending ($M) 2010 2012 2014 2016 2017 2018 17-18 10-18Total (Current $) 111.8 121.0 123.5 125.7 129.2 132.2 2.3% 2.1% Other 12.6 15.2 14.1 11.3 11.0 12.2 11.5% -0.3% Visitor 99.2 105.8 109.3 114.4 118.3 120.0 1.5% 2.4% Non-transportation 85.9 90.1 94.8 102.9 105.7 106.5 0.7% 2.7% Transportation 13.3 15.7 14.5 11.4 12.6 13.5 7.5% 0.2%
Earnings ($M)Earnings (Current $) 30.7 32.0 35.5 41.7 45.4 50.0 10.1% 6.3%
Employment (Jobs)Employment 1,570 1,590 1,650 1,780 1,800 1,870 3.9% 2.2%
Tax Revenue ($M)Total (Current $) 4.2 4.6 4.8 5.5 6.0 6.1 2.6% 5.0% Local 1.0 1.0 1.1 1.3 1.3 1.3 0.1% 4.0% State 3.2 3.6 3.7 4.2 4.6 4.8 3.3% 5.2%
Other spending includes resident air travel, travel arrangement and reservation services, and convention and trade show organizers. Non-transportation visitor spending includes accommodations, food services, retail, food stores, and arts, entertainment & recreation. Visitor transportation spending includes private auto, auto rental, other local ground transportation and one-way airfares.Earnings include wages & salaries, earned benefits and proprietor income.Employment includes all full- and part-time employment of payroll employees and proprietors.Local tax revenue includes lodging taxes, auto rental taxes and airport passenger facility charges paid by visitors.State tax revenue includes lodging, and motor fuel tax payments of visitors, and the income tax payments attributable to the travel industry income of businesses and employees.Federal tax revenue includes motor fuel excise taxes and airline ticket taxes paid by visitors, and the payroll and income taxes attributable to the travel industry income of employees and businesses.
DEAN RUNYAN ASSOCIATES Page 126

Travel Impacts, 2006-2018p
Josephine County
2006 2008 2010 2012 2016 2017 2018
Destination Spending 106.0 101.2 99.2 105.8 114.4 118.3 120.0Other Travel* 13.2 15.9 12.6 15.2 11.3 11.0 12.2Total 119.2 117.1 111.8 121.0 125.7 129.2 132.2
Total Direct Travel Spending ($Million)
2006 2008 2010 2012 2016 2017 2018
Accommodations 20.4 17.9 17.4 17.8 22.5 23.5 23.5Arts, Ent. & Rec. 15.1 13.8 13.6 14.0 15.1 15.4 15.4Food Service 27.7 26.7 27.7 29.5 34.6 36.1 36.8Food Stores 11.2 11.7 11.4 12.4 13.6 13.6 13.6Local Tran. & Gas 14.2 15.6 13.3 15.7 11.4 12.6 13.5Retail Sales 17.4 15.6 15.9 16.5 17.1 17.2 17.1Total 106.0 101.2 99.2 105.8 114.4 118.3 120.0
Visitor Spending By Commodity Purchased ($Million)
2006 2008 2010 2012 2016 2017 2018
Accom. & Food Serv. 21.8 21.0 20.6 21.7 29.8 33.7 37.5Arts, Ent. & Rec. 4.8 5.1 4.7 4.6 5.3 5.5 5.9Ground Tran. 0.5 0.5 0.5 0.5 0.7 0.7 0.7Other Travel* 1.2 1.3 1.0 1.0 1.2 0.6 0.7Retail** 4.1 4.0 4.0 4.2 4.8 5.0 5.3Total 32.5 31.9 30.7 32.0 41.7 45.4 50.0
Industry Earnings Generated by Travel Spending ($Million)
2006 2008 2010 2012 2016 2017 2018
Accom. & Food Serv. 1,090 1,040 980 990 1,170 1,220 1,270Arts, Ent. & Rec. 420 420 360 360 360 350 350Ground Tran. 20 20 20 20 20 20 20Other Travel* 60 50 40 40 50 30 30Retail** 190 180 180 180 180 190 200Total 1,770 1,720 1,570 1,590 1,780 1,800 1,870
Industry Employment Generated by Travel Spending (Jobs)
2006 2008 2010 2012 2016 2017 2018
Local Tax Receipts 1.1 1.0 1.0 1.0 1.3 1.3 1.3State Tax Receipts 3.4 3.3 3.2 3.6 4.2 4.6 4.8Total 4.6 4.3 4.2 4.6 5.5 6.0 6.1
Tax Receipts Generated by Travel Spending ($Million)
Details may not add to total due to rounding. * Other Travel includes ground transportation and air travel impacts for travel to other Oregon visitor destinations, travel arrangement services, and convention & trade show organizers.** Retail includes gasoline.
DEAN RUNYAN ASSOCIATESPage 127

County Visitor Spending and Visitor VolumeJosephine
Visitor Spending by Type of Traveler Accommodation ($Million), 2006-2018p
2006 2008 2010 2012 2016 2017 2018
Total Destination Spending 106.0 101.2 99.2 105.8 114.4 118.3 120.0All Overnight 82.1 80.4 78.4 83.3 90.1 93.4 94.7
Hotel, Motel, STVR* 44.4 40.4 38.8 40.6 45.6 47.8 48.0
Private Home 28.7 30.0 30.7 33.3 34.1 35.1 35.9
Other Overnight 9.0 10.0 8.9 9.4 10.4 10.5 10.9
Day Travel 23.9 20.8 20.8 22.6 24.3 24.9 25.3
Day Travel 23.9 20.8 20.8 22.6 24.3 24.9 25.3
Average Expenditures for Overnight Visitors, 2018p
Travel Party PersonParty Length of
Day Trip Day Trip Size Stay (Nights)
$246 $465 $101 $190Hotel, Motel, STVR* 2.4 1.9
$85 $257 $32 $99Private Home 2.6 3.0
$120 $392 $36 $115Other Overnight 3.4 3.3
$133 $350 $50 $133 All Overnight 2.7 2.6
Overnight Visitor Volume, 2016-2018p
Person-Nights (000) Party-Nights (000)
2016 2017 2018 2016 2017 2018
Hotel, Motel, STVR* 485 491 477 198 201 195
Private Home 1,096 1,106 1,107 421 424 425
Other Overnight 304 300 305 90 89 90
All Overnight 1,885 1,898 1,889 709 714 710
Person-Trips (000) Party-Trips (000)
2016 2017 2018 2016 2017 2018
Hotel, Motel, STVR* 256 260 252 105 106 103
Private Home 360 364 364 138 140 140
Other Overnight 94 93 94 28 27 28
All Overnight 710 716 710 271 273 271
"Hotel, Motel" category includes all lodging where a lodging tax is collected except campgrounds. "Other Overnight" category includes campgrounds and vacation homes.
DEAN RUNYAN ASSOCIATES Page 128
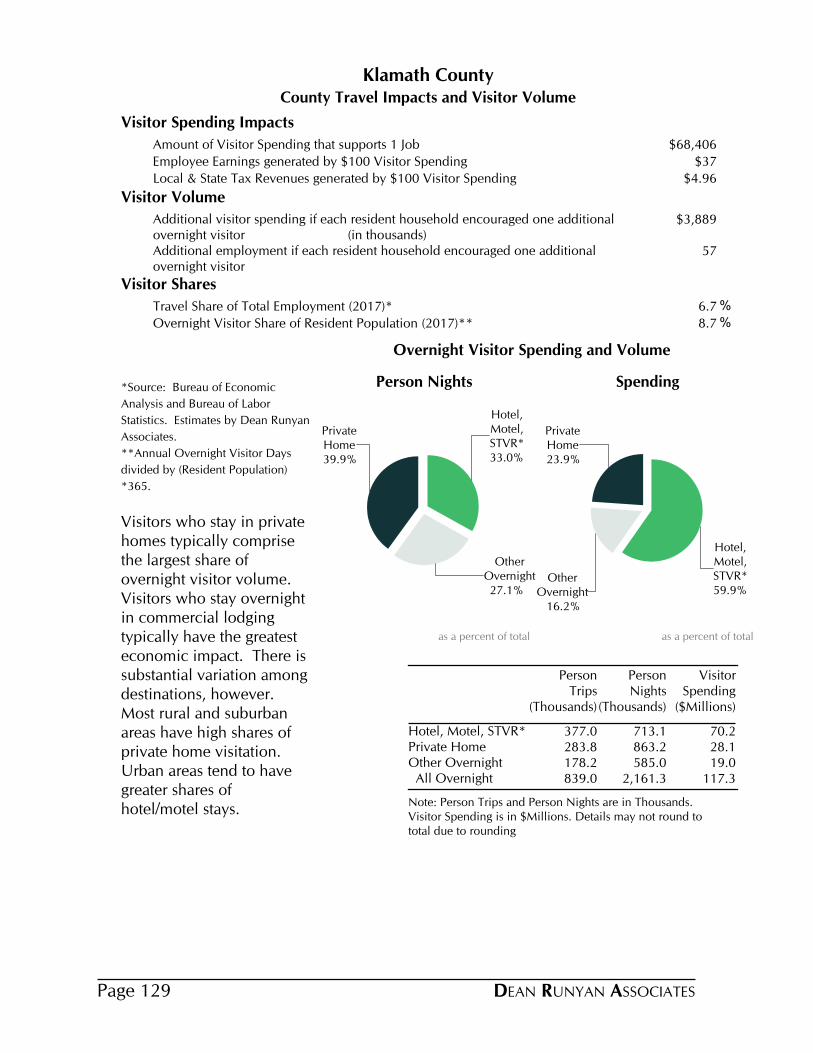
County Travel Impacts and Visitor Volume
Klamath County
Visitor Spending Impacts
Amount of Visitor Spending that supports 1 Job $68,406
Employee Earnings generated by $100 Visitor Spending $37
Local & State Tax Revenues generated by $100 Visitor Spending $4.96
Visitor Volume
Additional visitor spending if each resident household encouraged one additional overnight visitor (in thousands)
$3,889
Additional employment if each resident household encouraged one additional overnight visitor
57
Visitor Shares
Travel Share of Total Employment (2017)* 6.7 %
Overnight Visitor Share of Resident Population (2017)** 8.7 %
*Source: Bureau of Economic
Analysis and Bureau of Labor
Statistics. Estimates by Dean Runyan
Associates.
**Annual Overnight Visitor Days
divided by (Resident Population)
*365.
Visitors who stay in private homes typically comprise the largest share of overnight visitor volume. Visitors who stay overnight in commercial lodging typically have the greatest economic impact. There is substantial variation among destinations, however. Most rural and suburban areas have high shares of private home visitation. Urban areas tend to have greater shares of hotel/motel stays.
Note: Person Trips and Person Nights are in Thousands. Visitor Spending is in $Millions. Details may not round to total due to rounding
Person Trips
(Thousands)
Person Nights
(Thousands)
Visitor Spending
($Millions)
Hotel, Motel, STVR* 377.0 713.1 70.2Private Home 283.8 863.2 28.1Other Overnight 178.2 585.0 19.0 All Overnight 839.0 2,161.3 117.3
33.0%
Hotel,Motel,STVR*
27.1%
OtherOvernight
39.9%
PrivateHome
Person Nights
as a percent of total
59.9%
Hotel,Motel,STVR*
16.2%
OtherOvernight
23.9%
PrivateHome
Spending
as a percent of total
Overnight Visitor Spending and Volume
DEAN RUNYAN ASSOCIATESPage 129

Direct Travel Impacts, 2010-2018p
Avg. Annual Chg.
Klamath
Spending ($M) 2010 2012 2014 2016 2017 2018 17-18 10-18Total (Current $) 135.3 145.6 139.8 141.2 153.9 157.8 2.5% 1.9% Other 12.5 14.1 11.4 8.3 10.7 11.8 9.9% -0.7% Visitor 122.8 131.5 128.4 132.9 143.1 146.0 2.0% 2.2% Non-transportation 104.2 110.0 110.4 118.9 126.3 127.7 1.1% 2.6% Transportation 18.6 21.5 18.1 13.9 16.8 18.2 8.3% -0.3%
Earnings ($M)Earnings (Current $) 37.1 41.6 43.5 46.4 51.9 56.3 8.5% 5.4%
Employment (Jobs)Employment 1,680 1,880 1,850 1,910 2,080 2,190 4.9% 3.3%
Tax Revenue ($M)Total (Current $) 5.1 5.7 5.7 6.3 7.1 7.2 2.3% 4.4% Local 1.5 1.4 1.6 1.8 2.0 2.0 0.1% 3.6% State 3.6 4.3 4.2 4.5 5.1 5.3 3.1% 4.7%
Other spending includes resident air travel, travel arrangement and reservation services, and convention and trade show organizers. Non-transportation visitor spending includes accommodations, food services, retail, food stores, and arts, entertainment & recreation. Visitor transportation spending includes private auto, auto rental, other local ground transportation and one-way airfares.Earnings include wages & salaries, earned benefits and proprietor income.Employment includes all full- and part-time employment of payroll employees and proprietors.Local tax revenue includes lodging taxes, auto rental taxes and airport passenger facility charges paid by visitors.State tax revenue includes lodging, and motor fuel tax payments of visitors, and the income tax payments attributable to the travel industry income of businesses and employees.Federal tax revenue includes motor fuel excise taxes and airline ticket taxes paid by visitors, and the payroll and income taxes attributable to the travel industry income of employees and businesses.
Historical revisions have been made to correct for the assignment of visitor air travel to the other travel category total. This correction does not effect economic impact totals.
DEAN RUNYAN ASSOCIATES Page 130

Travel Impacts, 2006-2018p
Klamath County
2006 2008 2010 2012 2016 2017 2018
Destination Spending 122.9 126.1 122.8 131.5 132.9 143.1 146.0Other Travel* 14.0 15.8 12.5 14.1 8.3 10.7 11.8Total 137.0 142.0 135.3 145.6 141.2 153.9 157.8
Total Direct Travel Spending ($Million)
2006 2008 2010 2012 2016 2017 2018
Accommodations 26.4 26.3 25.9 27.4 31.0 33.9 34.0Arts, Ent. & Rec. 18.3 17.6 17.4 18.0 18.6 19.4 19.5Food Service 29.3 30.3 31.4 33.7 37.5 40.4 41.5Food Stores 11.2 12.4 12.5 13.5 14.4 14.7 14.8Local Tran. & Gas 16.9 20.0 17.1 20.4 13.9 15.9 17.3Retail Sales 17.7 16.7 16.9 17.5 17.4 18.0 18.0Visitor Air Tran. 3.2 2.8 1.6 1.1 0.0 0.9 0.9Total 122.9 126.1 122.8 131.5 132.9 143.1 146.0
Visitor Spending By Commodity Purchased ($Million)
2006 2008 2010 2012 2016 2017 2018
Accom. & Food Serv. 25.1 26.2 25.7 29.6 34.8 38.6 41.7Arts, Ent. & Rec. 5.6 6.2 5.8 6.0 5.6 6.0 6.9Ground Tran. 0.6 0.6 0.6 0.7 0.8 0.9 0.9Other Travel* 1.2 1.1 1.0 1.1 0.7 1.5 1.7Retail** 3.9 4.0 4.0 4.2 4.6 4.9 5.2Total 36.3 38.2 37.1 41.6 46.4 51.9 56.3
Industry Earnings Generated by Travel Spending ($Million)
2006 2008 2010 2012 2016 2017 2018
Accom. & Food Serv. 1,140 1,120 1,040 1,180 1,210 1,310 1,360Arts, Ent. & Rec. 420 440 410 450 450 500 540Ground Tran. 20 20 20 20 20 20 20Other Travel* 50 40 40 40 30 50 50Retail** 180 180 180 190 200 210 210Total 1,820 1,810 1,680 1,880 1,910 2,080 2,190
Industry Employment Generated by Travel Spending (Jobs)
2006 2008 2010 2012 2016 2017 2018
Local Tax Receipts 1.2 1.5 1.5 1.4 1.8 2.0 2.0State Tax Receipts 3.7 3.8 3.6 4.3 4.5 5.1 5.3Total 4.9 5.3 5.1 5.7 6.3 7.1 7.2
Tax Receipts Generated by Travel Spending ($Million)
Details may not add to total due to rounding. * Other Travel includes ground transportation and air travel impacts for travel to other Oregon visitor destinations, travel arrangement services, and convention & trade show organizers.** Retail includes gasoline.
Historical revisions have been made to correct for the assignment of visitor air travel to the other travel category total. This correction does not effect economic impact totals.
DEAN RUNYAN ASSOCIATESPage 131

County Visitor Spending and Visitor VolumeKlamath
Visitor Spending by Type of Traveler Accommodation ($Million), 2006-2018p
2006 2008 2010 2012 2016 2017 2018
Total Destination Spending 119.7 123.4 121.2 130.4 132.9 142.2 145.0All Overnight 94.3 99.9 97.8 105.0 107.0 114.9 117.3
Hotel, Motel, STVR* 57.8 59.7 57.1 61.9 62.4 68.9 70.2
Private Home 23.8 25.1 24.9 26.5 26.5 27.7 28.1
Other Overnight 12.7 15.1 15.9 16.7 18.1 18.4 19.0
Day Travel 25.5 23.5 23.4 25.4 25.9 27.3 27.8
Day Travel 25.5 23.5 23.4 25.4 25.9 27.3 27.8
Average Expenditures for Overnight Visitors, 2018p
Travel Party PersonParty Length of
Day Trip Day Trip Size Stay (Nights)
$240 $455 $98 $186Hotel, Motel, STVR* 2.4 1.9
$85 $257 $33 $99Private Home 2.6 3.0
$108 $354 $32 $107Other Overnight 3.3 3.3
$146 $370 $54 $140 All Overnight 2.7 2.5
Overnight Visitor Volume, 2016-2018p
Person-Nights (000) Party-Nights (000)
2016 2017 2018 2016 2017 2018
Hotel, Motel, STVR* 670 716 713 274 293 292
Private Home 849 869 863 326 334 332
Other Overnight 581 577 585 175 174 177
All Overnight 2,100 2,162 2,161 776 802 801
Person-Trips (000) Party-Trips (000)
2016 2017 2018 2016 2017 2018
Hotel, Motel, STVR* 354 379 377 145 155 154
Private Home 279 286 284 107 110 109
Other Overnight 177 176 178 53 53 54
All Overnight 810 840 839 305 318 317
"Hotel, Motel" category includes all lodging where a lodging tax is collected except campgrounds. "Other Overnight" category includes campgrounds and vacation homes.
DEAN RUNYAN ASSOCIATES Page 132
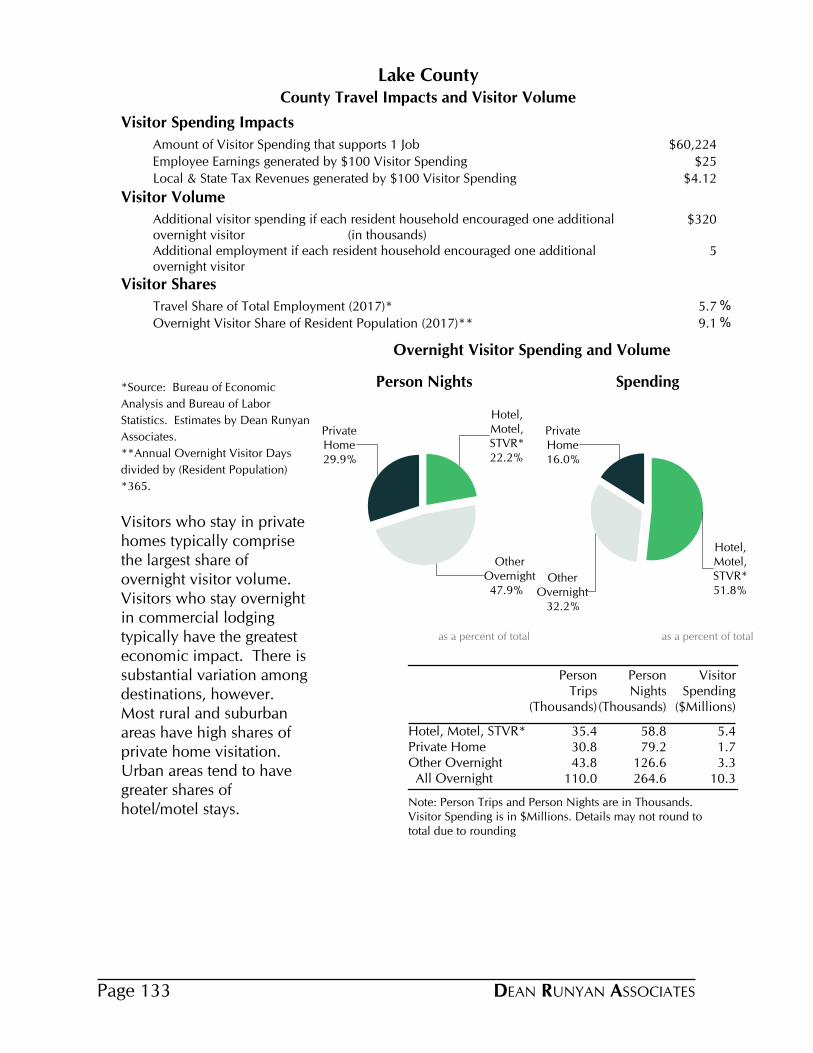
County Travel Impacts and Visitor Volume
Lake County
Visitor Spending Impacts
Amount of Visitor Spending that supports 1 Job $60,224
Employee Earnings generated by $100 Visitor Spending $25
Local & State Tax Revenues generated by $100 Visitor Spending $4.12
Visitor Volume
Additional visitor spending if each resident household encouraged one additional overnight visitor (in thousands)
$320
Additional employment if each resident household encouraged one additional overnight visitor
5
Visitor Shares
Travel Share of Total Employment (2017)* 5.7 %
Overnight Visitor Share of Resident Population (2017)** 9.1 %
*Source: Bureau of Economic
Analysis and Bureau of Labor
Statistics. Estimates by Dean Runyan
Associates.
**Annual Overnight Visitor Days
divided by (Resident Population)
*365.
Visitors who stay in private homes typically comprise the largest share of overnight visitor volume. Visitors who stay overnight in commercial lodging typically have the greatest economic impact. There is substantial variation among destinations, however. Most rural and suburban areas have high shares of private home visitation. Urban areas tend to have greater shares of hotel/motel stays.
Note: Person Trips and Person Nights are in Thousands. Visitor Spending is in $Millions. Details may not round to total due to rounding
Person Trips
(Thousands)
Person Nights
(Thousands)
Visitor Spending
($Millions)
Hotel, Motel, STVR* 35.4 58.8 5.4Private Home 30.8 79.2 1.7Other Overnight 43.8 126.6 3.3 All Overnight 110.0 264.6 10.3
22.2%
Hotel,Motel,STVR*
47.9%
OtherOvernight
29.9%
PrivateHome
Person Nights
as a percent of total
51.8%
Hotel,Motel,STVR*
32.2%
OtherOvernight
16.0%
PrivateHome
Spending
as a percent of total
Overnight Visitor Spending and Volume
DEAN RUNYAN ASSOCIATESPage 133

Direct Travel Impacts, 2010-2018p
Avg. Annual Chg.
Lake
Spending ($M) 2010 2012 2014 2016 2017 2018 17-18 10-18Total (Current $) 13.3 13.4 13.5 13.8 14.3 14.7 2.9% 1.3% Other 1.1 1.3 1.2 0.9 1.0 1.1 11.5% 0.4% Visitor 12.3 12.1 12.3 12.9 13.3 13.6 2.3% 1.3% Non-transportation 11.0 10.7 11.1 11.9 12.2 12.4 1.7% 1.5% Transportation 1.2 1.4 1.2 1.0 1.1 1.2 9.0% -0.5%
Earnings ($M)Earnings (Current $) 2.9 2.7 3.0 3.2 3.3 3.4 3.7% 1.9%
Employment (Jobs)Employment 250 220 220 220 220 230 4.0% -0.8%
Tax Revenue ($M)Total (Current $) 0.4 0.4 0.5 0.5 0.6 0.6 1.2% 2.8% Local 0.1 0.1 0.1 0.1 0.1 0.1 0.9% 2.4% State 0.3 0.4 0.4 0.4 0.4 0.4 1.2% 2.9%
Other spending includes resident air travel, travel arrangement and reservation services, and convention and trade show organizers. Non-transportation visitor spending includes accommodations, food services, retail, food stores, and arts, entertainment & recreation. Visitor transportation spending includes private auto, auto rental, other local ground transportation and one-way airfares.Earnings include wages & salaries, earned benefits and proprietor income.Employment includes all full- and part-time employment of payroll employees and proprietors.Local tax revenue includes lodging taxes, auto rental taxes and airport passenger facility charges paid by visitors.State tax revenue includes lodging, and motor fuel tax payments of visitors, and the income tax payments attributable to the travel industry income of businesses and employees.Federal tax revenue includes motor fuel excise taxes and airline ticket taxes paid by visitors, and the payroll and income taxes attributable to the travel industry income of employees and businesses.
DEAN RUNYAN ASSOCIATES Page 134
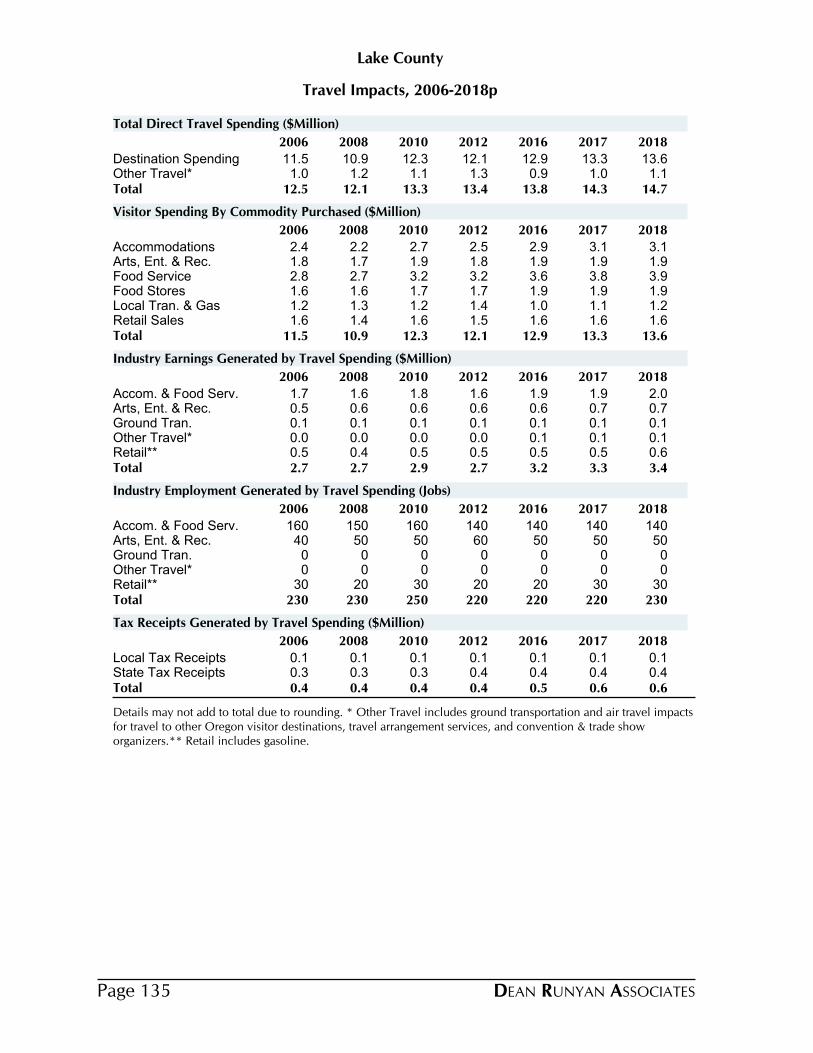
Travel Impacts, 2006-2018p
Lake County
2006 2008 2010 2012 2016 2017 2018
Destination Spending 11.5 10.9 12.3 12.1 12.9 13.3 13.6Other Travel* 1.0 1.2 1.1 1.3 0.9 1.0 1.1Total 12.5 12.1 13.3 13.4 13.8 14.3 14.7
Total Direct Travel Spending ($Million)
2006 2008 2010 2012 2016 2017 2018
Accommodations 2.4 2.2 2.7 2.5 2.9 3.1 3.1Arts, Ent. & Rec. 1.8 1.7 1.9 1.8 1.9 1.9 1.9Food Service 2.8 2.7 3.2 3.2 3.6 3.8 3.9Food Stores 1.6 1.6 1.7 1.7 1.9 1.9 1.9Local Tran. & Gas 1.2 1.3 1.2 1.4 1.0 1.1 1.2Retail Sales 1.6 1.4 1.6 1.5 1.6 1.6 1.6Total 11.5 10.9 12.3 12.1 12.9 13.3 13.6
Visitor Spending By Commodity Purchased ($Million)
2006 2008 2010 2012 2016 2017 2018
Accom. & Food Serv. 1.7 1.6 1.8 1.6 1.9 1.9 2.0Arts, Ent. & Rec. 0.5 0.6 0.6 0.6 0.6 0.7 0.7Ground Tran. 0.1 0.1 0.1 0.1 0.1 0.1 0.1Other Travel* 0.0 0.0 0.0 0.0 0.1 0.1 0.1Retail** 0.5 0.4 0.5 0.5 0.5 0.5 0.6Total 2.7 2.7 2.9 2.7 3.2 3.3 3.4
Industry Earnings Generated by Travel Spending ($Million)
2006 2008 2010 2012 2016 2017 2018
Accom. & Food Serv. 160 150 160 140 140 140 140Arts, Ent. & Rec. 40 50 50 60 50 50 50Ground Tran. 0 0 0 0 0 0 0Other Travel* 0 0 0 0 0 0 0Retail** 30 20 30 20 20 30 30Total 230 230 250 220 220 220 230
Industry Employment Generated by Travel Spending (Jobs)
2006 2008 2010 2012 2016 2017 2018
Local Tax Receipts 0.1 0.1 0.1 0.1 0.1 0.1 0.1State Tax Receipts 0.3 0.3 0.3 0.4 0.4 0.4 0.4Total 0.4 0.4 0.4 0.4 0.5 0.6 0.6
Tax Receipts Generated by Travel Spending ($Million)
Details may not add to total due to rounding. * Other Travel includes ground transportation and air travel impacts for travel to other Oregon visitor destinations, travel arrangement services, and convention & trade show organizers.** Retail includes gasoline.
DEAN RUNYAN ASSOCIATESPage 135
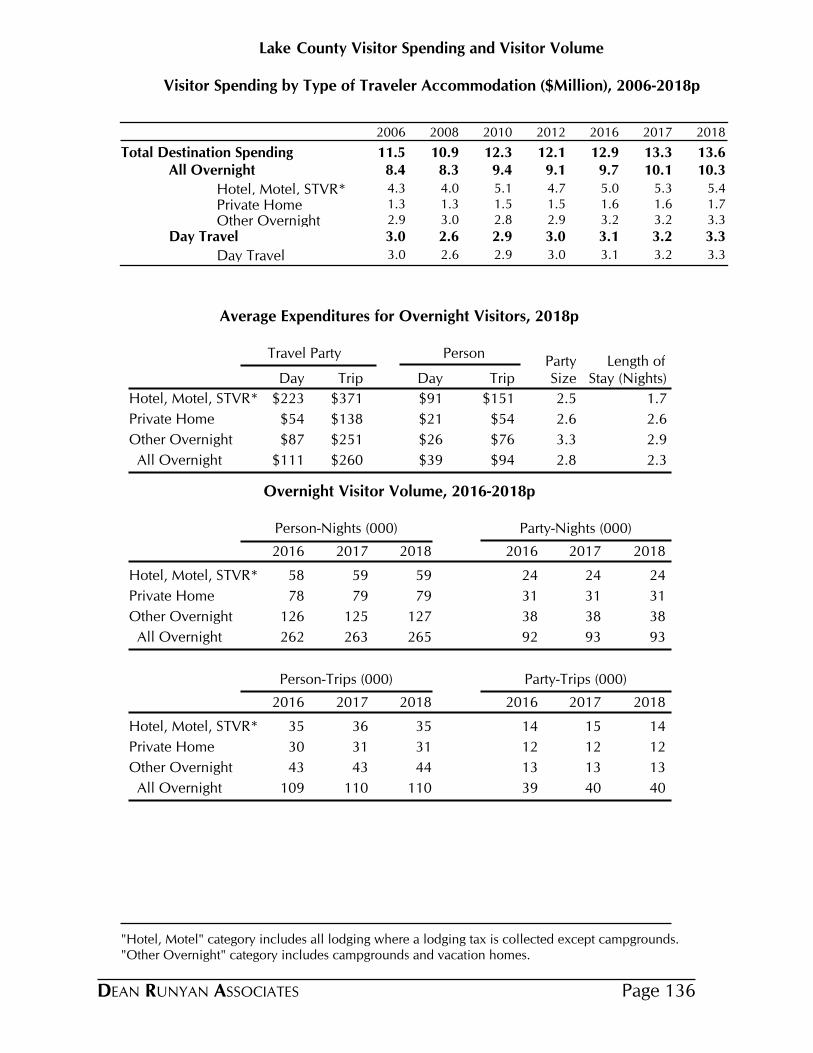
County Visitor Spending and Visitor VolumeLake
Visitor Spending by Type of Traveler Accommodation ($Million), 2006-2018p
2006 2008 2010 2012 2016 2017 2018
Total Destination Spending 11.5 10.9 12.3 12.1 12.9 13.3 13.6All Overnight 8.4 8.3 9.4 9.1 9.7 10.1 10.3
Hotel, Motel, STVR* 4.3 4.0 5.1 4.7 5.0 5.3 5.4
Private Home 1.3 1.3 1.5 1.5 1.6 1.6 1.7
Other Overnight 2.9 3.0 2.8 2.9 3.2 3.2 3.3
Day Travel 3.0 2.6 2.9 3.0 3.1 3.2 3.3
Day Travel 3.0 2.6 2.9 3.0 3.1 3.2 3.3
Average Expenditures for Overnight Visitors, 2018p
Travel Party PersonParty Length of
Day Trip Day Trip Size Stay (Nights)
$223 $371 $91 $151Hotel, Motel, STVR* 2.5 1.7
$54 $138 $21 $54Private Home 2.6 2.6
$87 $251 $26 $76Other Overnight 3.3 2.9
$111 $260 $39 $94 All Overnight 2.8 2.3
Overnight Visitor Volume, 2016-2018p
Person-Nights (000) Party-Nights (000)
2016 2017 2018 2016 2017 2018
Hotel, Motel, STVR* 58 59 59 24 24 24
Private Home 78 79 79 31 31 31
Other Overnight 126 125 127 38 38 38
All Overnight 262 263 265 92 93 93
Person-Trips (000) Party-Trips (000)
2016 2017 2018 2016 2017 2018
Hotel, Motel, STVR* 35 36 35 14 15 14
Private Home 30 31 31 12 12 12
Other Overnight 43 43 44 13 13 13
All Overnight 109 110 110 39 40 40
"Hotel, Motel" category includes all lodging where a lodging tax is collected except campgrounds. "Other Overnight" category includes campgrounds and vacation homes.
DEAN RUNYAN ASSOCIATES Page 136
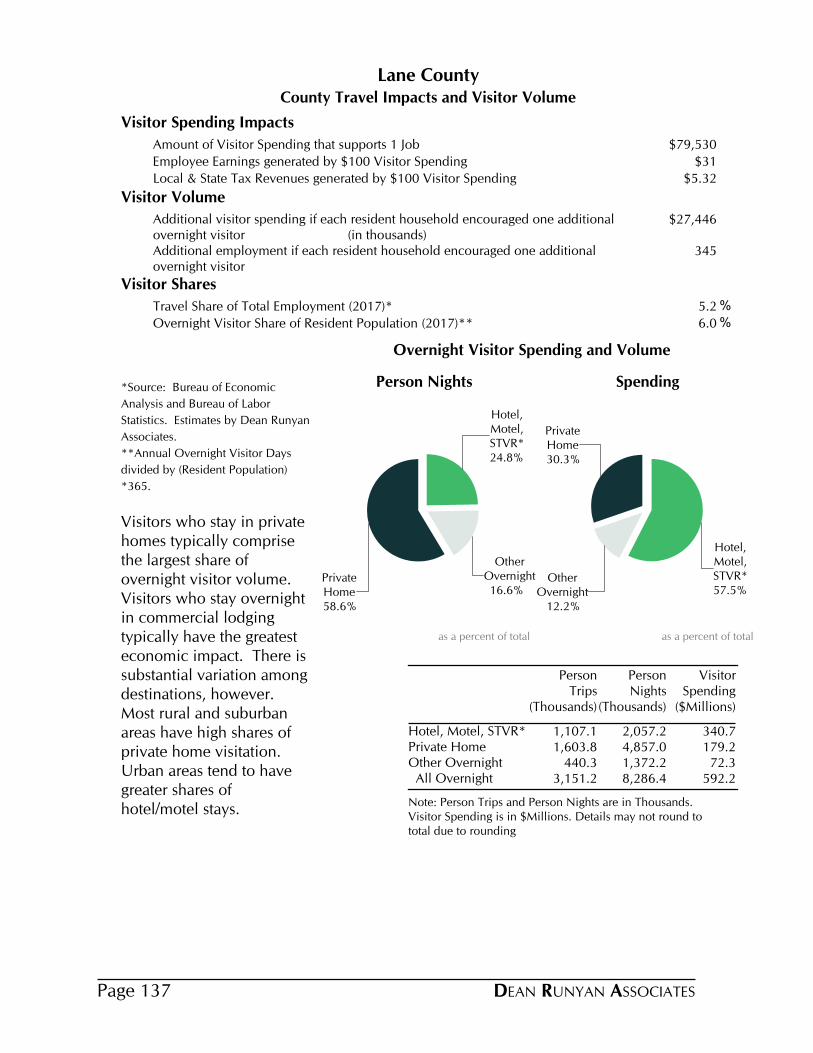
County Travel Impacts and Visitor Volume
Lane County
Visitor Spending Impacts
Amount of Visitor Spending that supports 1 Job $79,530
Employee Earnings generated by $100 Visitor Spending $31
Local & State Tax Revenues generated by $100 Visitor Spending $5.32
Visitor Volume
Additional visitor spending if each resident household encouraged one additional overnight visitor (in thousands)
$27,446
Additional employment if each resident household encouraged one additional overnight visitor
345
Visitor Shares
Travel Share of Total Employment (2017)* 5.2 %
Overnight Visitor Share of Resident Population (2017)** 6.0 %
*Source: Bureau of Economic
Analysis and Bureau of Labor
Statistics. Estimates by Dean Runyan
Associates.
**Annual Overnight Visitor Days
divided by (Resident Population)
*365.
Visitors who stay in private homes typically comprise the largest share of overnight visitor volume. Visitors who stay overnight in commercial lodging typically have the greatest economic impact. There is substantial variation among destinations, however. Most rural and suburban areas have high shares of private home visitation. Urban areas tend to have greater shares of hotel/motel stays.
Note: Person Trips and Person Nights are in Thousands. Visitor Spending is in $Millions. Details may not round to total due to rounding
Person Trips
(Thousands)
Person Nights
(Thousands)
Visitor Spending
($Millions)
Hotel, Motel, STVR* 1,107.1 2,057.2 340.7Private Home 1,603.8 4,857.0 179.2Other Overnight 440.3 1,372.2 72.3 All Overnight 3,151.2 8,286.4 592.2
24.8%
Hotel,Motel,STVR*
16.6%
OtherOvernight
58.6%
PrivateHome
Person Nights
as a percent of total
57.5%
Hotel,Motel,STVR*
12.2%
OtherOvernight
30.3%
PrivateHome
Spending
as a percent of total
Overnight Visitor Spending and Volume
DEAN RUNYAN ASSOCIATESPage 137
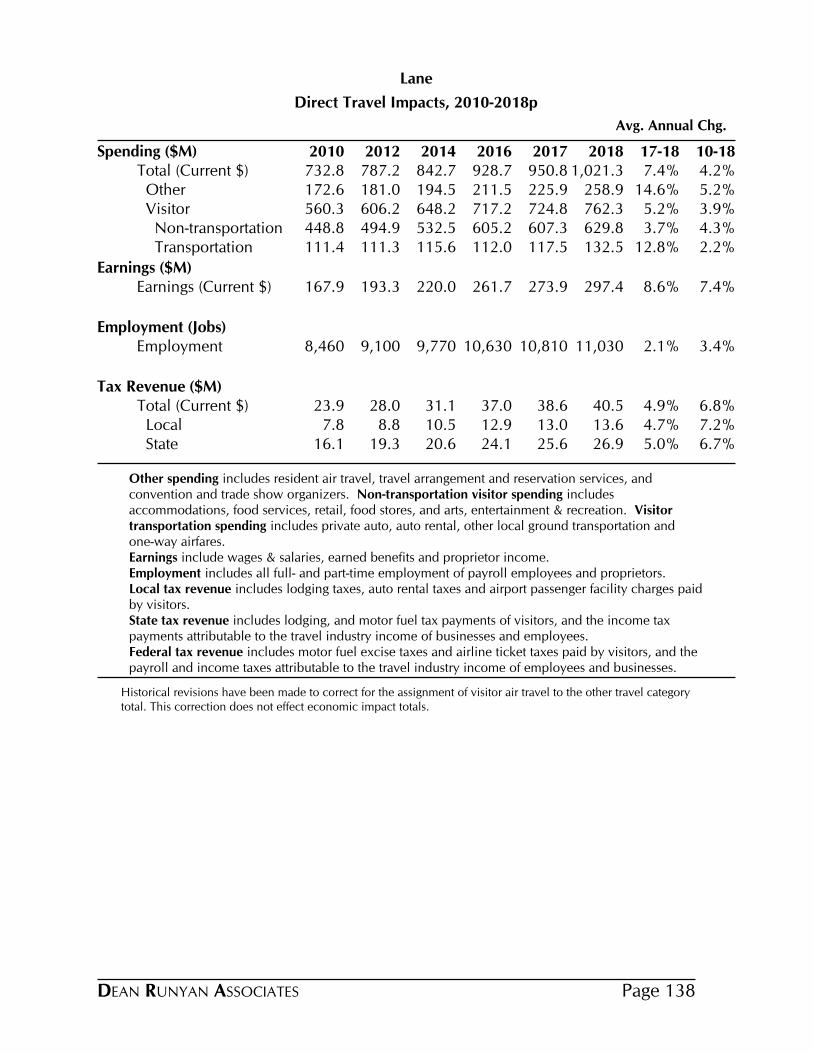
Direct Travel Impacts, 2010-2018p
Avg. Annual Chg.
Lane
Spending ($M) 2010 2012 2014 2016 2017 2018 17-18 10-18Total (Current $) 732.8 787.2 842.7 928.7 950.8 1,021.3 7.4% 4.2% Other 172.6 181.0 194.5 211.5 225.9 258.9 14.6% 5.2% Visitor 560.3 606.2 648.2 717.2 724.8 762.3 5.2% 3.9% Non-transportation 448.8 494.9 532.5 605.2 607.3 629.8 3.7% 4.3% Transportation 111.4 111.3 115.6 112.0 117.5 132.5 12.8% 2.2%
Earnings ($M)Earnings (Current $) 167.9 193.3 220.0 261.7 273.9 297.4 8.6% 7.4%
Employment (Jobs)Employment 8,460 9,100 9,770 10,630 10,810 11,030 2.1% 3.4%
Tax Revenue ($M)Total (Current $) 23.9 28.0 31.1 37.0 38.6 40.5 4.9% 6.8% Local 7.8 8.8 10.5 12.9 13.0 13.6 4.7% 7.2% State 16.1 19.3 20.6 24.1 25.6 26.9 5.0% 6.7%
Other spending includes resident air travel, travel arrangement and reservation services, and convention and trade show organizers. Non-transportation visitor spending includes accommodations, food services, retail, food stores, and arts, entertainment & recreation. Visitor transportation spending includes private auto, auto rental, other local ground transportation and one-way airfares.Earnings include wages & salaries, earned benefits and proprietor income.Employment includes all full- and part-time employment of payroll employees and proprietors.Local tax revenue includes lodging taxes, auto rental taxes and airport passenger facility charges paid by visitors.State tax revenue includes lodging, and motor fuel tax payments of visitors, and the income tax payments attributable to the travel industry income of businesses and employees.Federal tax revenue includes motor fuel excise taxes and airline ticket taxes paid by visitors, and the payroll and income taxes attributable to the travel industry income of employees and businesses.
Historical revisions have been made to correct for the assignment of visitor air travel to the other travel category total. This correction does not effect economic impact totals.
DEAN RUNYAN ASSOCIATES Page 138
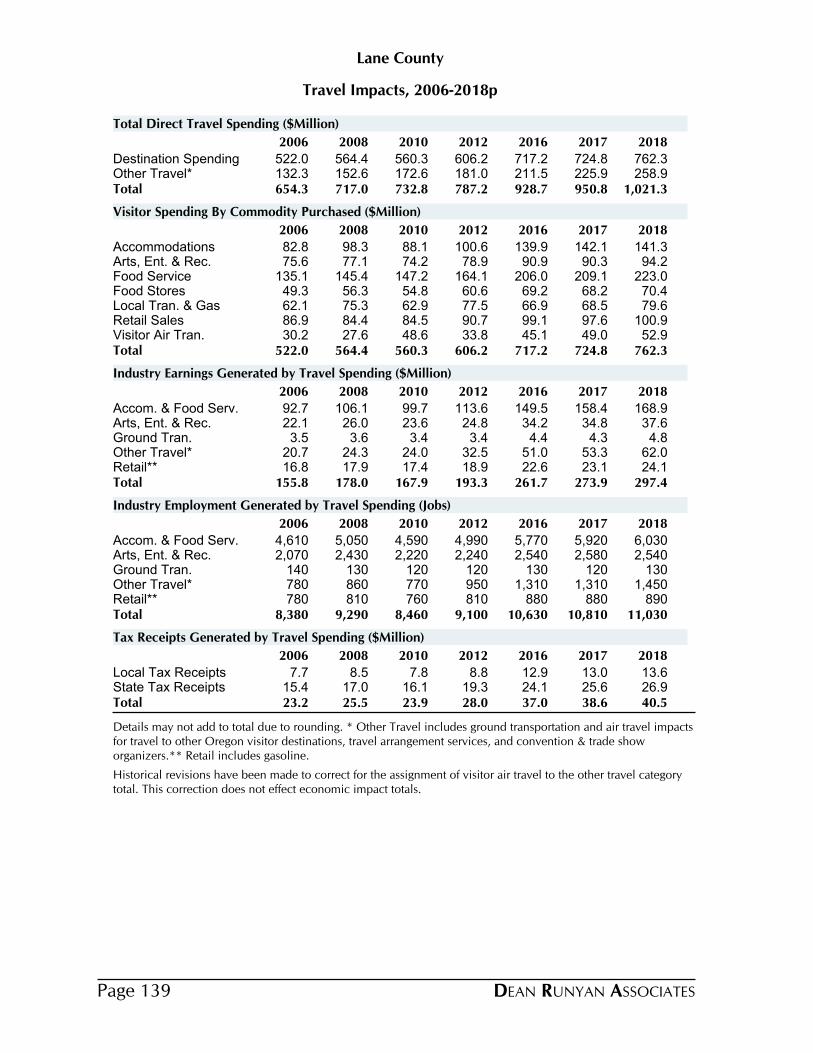
Travel Impacts, 2006-2018p
Lane County
2006 2008 2010 2012 2016 2017 2018
Destination Spending 522.0 564.4 560.3 606.2 717.2 724.8 762.3Other Travel* 132.3 152.6 172.6 181.0 211.5 225.9 258.9Total 654.3 717.0 732.8 787.2 928.7 950.8 1,021.3
Total Direct Travel Spending ($Million)
2006 2008 2010 2012 2016 2017 2018
Accommodations 82.8 98.3 88.1 100.6 139.9 142.1 141.3Arts, Ent. & Rec. 75.6 77.1 74.2 78.9 90.9 90.3 94.2Food Service 135.1 145.4 147.2 164.1 206.0 209.1 223.0Food Stores 49.3 56.3 54.8 60.6 69.2 68.2 70.4Local Tran. & Gas 62.1 75.3 62.9 77.5 66.9 68.5 79.6Retail Sales 86.9 84.4 84.5 90.7 99.1 97.6 100.9Visitor Air Tran. 30.2 27.6 48.6 33.8 45.1 49.0 52.9Total 522.0 564.4 560.3 606.2 717.2 724.8 762.3
Visitor Spending By Commodity Purchased ($Million)
2006 2008 2010 2012 2016 2017 2018
Accom. & Food Serv. 92.7 106.1 99.7 113.6 149.5 158.4 168.9Arts, Ent. & Rec. 22.1 26.0 23.6 24.8 34.2 34.8 37.6Ground Tran. 3.5 3.6 3.4 3.4 4.4 4.3 4.8Other Travel* 20.7 24.3 24.0 32.5 51.0 53.3 62.0Retail** 16.8 17.9 17.4 18.9 22.6 23.1 24.1Total 155.8 178.0 167.9 193.3 261.7 273.9 297.4
Industry Earnings Generated by Travel Spending ($Million)
2006 2008 2010 2012 2016 2017 2018
Accom. & Food Serv. 4,610 5,050 4,590 4,990 5,770 5,920 6,030Arts, Ent. & Rec. 2,070 2,430 2,220 2,240 2,540 2,580 2,540Ground Tran. 140 130 120 120 130 120 130Other Travel* 780 860 770 950 1,310 1,310 1,450Retail** 780 810 760 810 880 880 890Total 8,380 9,290 8,460 9,100 10,630 10,810 11,030
Industry Employment Generated by Travel Spending (Jobs)
2006 2008 2010 2012 2016 2017 2018
Local Tax Receipts 7.7 8.5 7.8 8.8 12.9 13.0 13.6State Tax Receipts 15.4 17.0 16.1 19.3 24.1 25.6 26.9Total 23.2 25.5 23.9 28.0 37.0 38.6 40.5
Tax Receipts Generated by Travel Spending ($Million)
Details may not add to total due to rounding. * Other Travel includes ground transportation and air travel impacts for travel to other Oregon visitor destinations, travel arrangement services, and convention & trade show organizers.** Retail includes gasoline.
Historical revisions have been made to correct for the assignment of visitor air travel to the other travel category total. This correction does not effect economic impact totals.
DEAN RUNYAN ASSOCIATESPage 139
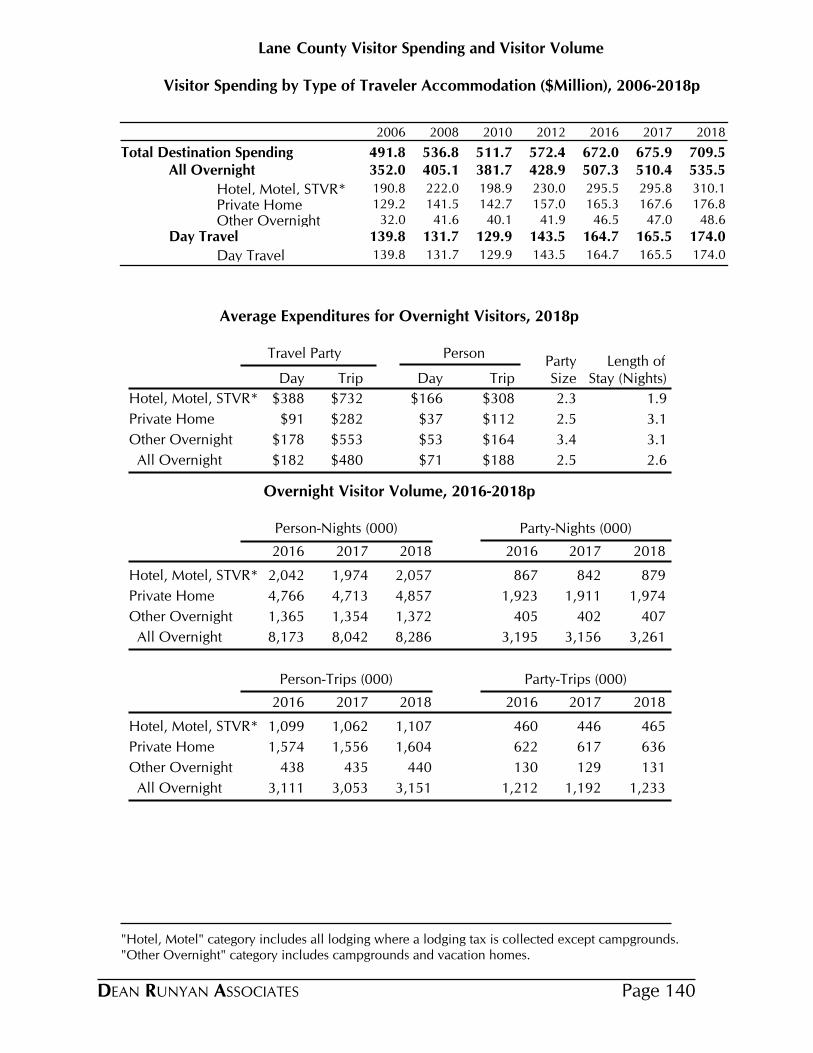
County Visitor Spending and Visitor VolumeLane
Visitor Spending by Type of Traveler Accommodation ($Million), 2006-2018p
2006 2008 2010 2012 2016 2017 2018
Total Destination Spending 491.8 536.8 511.7 572.4 672.0 675.9 709.5All Overnight 352.0 405.1 381.7 428.9 507.3 510.4 535.5
Hotel, Motel, STVR* 190.8 222.0 198.9 230.0 295.5 295.8 310.1
Private Home 129.2 141.5 142.7 157.0 165.3 167.6 176.8
Other Overnight 32.0 41.6 40.1 41.9 46.5 47.0 48.6
Day Travel 139.8 131.7 129.9 143.5 164.7 165.5 174.0
Day Travel 139.8 131.7 129.9 143.5 164.7 165.5 174.0
Average Expenditures for Overnight Visitors, 2018p
Travel Party PersonParty Length of
Day Trip Day Trip Size Stay (Nights)
$388 $732 $166 $308Hotel, Motel, STVR* 2.3 1.9
$91 $282 $37 $112Private Home 2.5 3.1
$178 $553 $53 $164Other Overnight 3.4 3.1
$182 $480 $71 $188 All Overnight 2.5 2.6
Overnight Visitor Volume, 2016-2018p
Person-Nights (000) Party-Nights (000)
2016 2017 2018 2016 2017 2018
Hotel, Motel, STVR* 2,042 1,974 2,057 867 842 879
Private Home 4,766 4,713 4,857 1,923 1,911 1,974
Other Overnight 1,365 1,354 1,372 405 402 407
All Overnight 8,173 8,042 8,286 3,195 3,156 3,261
Person-Trips (000) Party-Trips (000)
2016 2017 2018 2016 2017 2018
Hotel, Motel, STVR* 1,099 1,062 1,107 460 446 465
Private Home 1,574 1,556 1,604 622 617 636
Other Overnight 438 435 440 130 129 131
All Overnight 3,111 3,053 3,151 1,212 1,192 1,233
"Hotel, Motel" category includes all lodging where a lodging tax is collected except campgrounds. "Other Overnight" category includes campgrounds and vacation homes.
DEAN RUNYAN ASSOCIATES Page 140
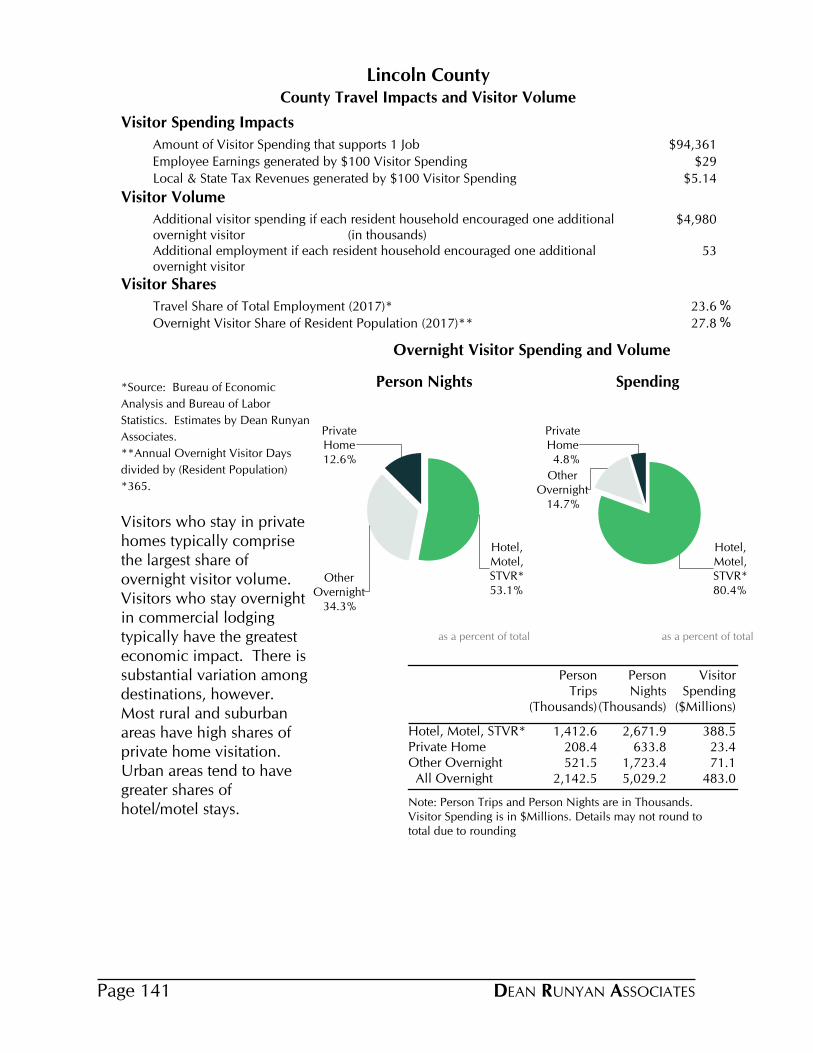
County Travel Impacts and Visitor Volume
Lincoln County
Visitor Spending Impacts
Amount of Visitor Spending that supports 1 Job $94,361
Employee Earnings generated by $100 Visitor Spending $29
Local & State Tax Revenues generated by $100 Visitor Spending $5.14
Visitor Volume
Additional visitor spending if each resident household encouraged one additional overnight visitor (in thousands)
$4,980
Additional employment if each resident household encouraged one additional overnight visitor
53
Visitor Shares
Travel Share of Total Employment (2017)* 23.6 %
Overnight Visitor Share of Resident Population (2017)** 27.8 %
*Source: Bureau of Economic
Analysis and Bureau of Labor
Statistics. Estimates by Dean Runyan
Associates.
**Annual Overnight Visitor Days
divided by (Resident Population)
*365.
Visitors who stay in private homes typically comprise the largest share of overnight visitor volume. Visitors who stay overnight in commercial lodging typically have the greatest economic impact. There is substantial variation among destinations, however. Most rural and suburban areas have high shares of private home visitation. Urban areas tend to have greater shares of hotel/motel stays.
Note: Person Trips and Person Nights are in Thousands. Visitor Spending is in $Millions. Details may not round to total due to rounding
Person Trips
(Thousands)
Person Nights
(Thousands)
Visitor Spending
($Millions)
Hotel, Motel, STVR* 1,412.6 2,671.9 388.5Private Home 208.4 633.8 23.4Other Overnight 521.5 1,723.4 71.1 All Overnight 2,142.5 5,029.2 483.0
53.1%
Hotel,Motel,STVR*
34.3%
OtherOvernight
12.6%
PrivateHome
Person Nights
as a percent of total
80.4%
Hotel,Motel,STVR*
14.7%
OtherOvernight
4.8%
PrivateHome
Spending
as a percent of total
Overnight Visitor Spending and Volume
DEAN RUNYAN ASSOCIATESPage 141

Direct Travel Impacts, 2010-2018p
Avg. Annual Chg.
Lincoln
Spending ($M) 2010 2012 2014 2016 2017 2018 17-18 10-18Total (Current $) 433.0 443.8 506.7 573.1 590.9 614.0 3.9% 4.5% Other 9.8 11.3 10.9 11.4 12.2 13.8 13.0% 4.4% Visitor 423.2 432.6 495.8 561.8 578.7 600.2 3.7% 4.5% Non-transportation 377.9 381.3 442.2 515.3 528.3 544.5 3.1% 4.7% Transportation 45.4 51.3 53.5 46.4 50.4 55.7 10.5% 2.6%
Earnings ($M)Earnings (Current $) 116.5 121.9 133.1 153.3 162.0 180.1 11.2% 5.6%
Employment (Jobs)Employment 5,540 5,520 5,790 6,060 6,130 6,440 5.0% 1.9%
Tax Revenue ($M)Total (Current $) 19.8 20.6 23.3 27.7 29.5 30.9 4.8% 5.7% Local 9.3 9.2 11.0 12.9 13.6 14.1 3.4% 5.3% State 10.5 11.4 12.4 14.8 15.8 16.8 6.0% 6.1%
Other spending includes resident air travel, travel arrangement and reservation services, and convention and trade show organizers. Non-transportation visitor spending includes accommodations, food services, retail, food stores, and arts, entertainment & recreation. Visitor transportation spending includes private auto, auto rental, other local ground transportation and one-way airfares.Earnings include wages & salaries, earned benefits and proprietor income.Employment includes all full- and part-time employment of payroll employees and proprietors.Local tax revenue includes lodging taxes, auto rental taxes and airport passenger facility charges paid by visitors.State tax revenue includes lodging, and motor fuel tax payments of visitors, and the income tax payments attributable to the travel industry income of businesses and employees.Federal tax revenue includes motor fuel excise taxes and airline ticket taxes paid by visitors, and the payroll and income taxes attributable to the travel industry income of employees and businesses.
DEAN RUNYAN ASSOCIATES Page 142
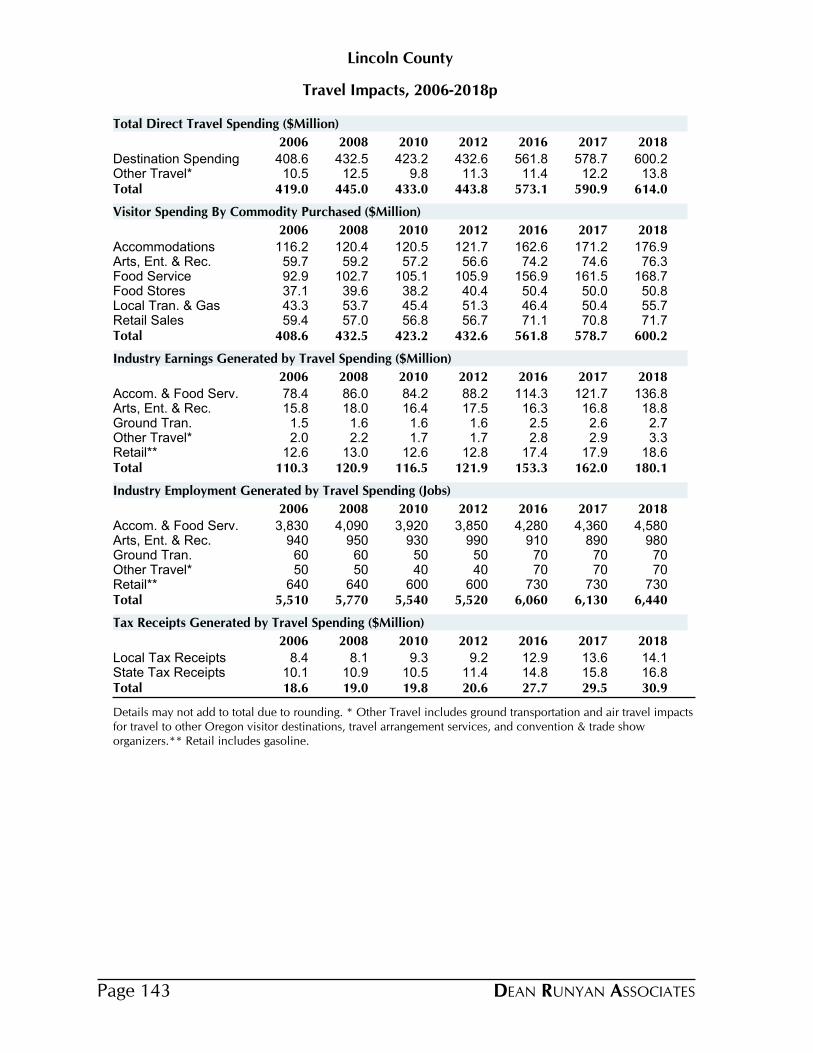
Travel Impacts, 2006-2018p
Lincoln County
2006 2008 2010 2012 2016 2017 2018
Destination Spending 408.6 432.5 423.2 432.6 561.8 578.7 600.2Other Travel* 10.5 12.5 9.8 11.3 11.4 12.2 13.8Total 419.0 445.0 433.0 443.8 573.1 590.9 614.0
Total Direct Travel Spending ($Million)
2006 2008 2010 2012 2016 2017 2018
Accommodations 116.2 120.4 120.5 121.7 162.6 171.2 176.9Arts, Ent. & Rec. 59.7 59.2 57.2 56.6 74.2 74.6 76.3Food Service 92.9 102.7 105.1 105.9 156.9 161.5 168.7Food Stores 37.1 39.6 38.2 40.4 50.4 50.0 50.8Local Tran. & Gas 43.3 53.7 45.4 51.3 46.4 50.4 55.7Retail Sales 59.4 57.0 56.8 56.7 71.1 70.8 71.7Total 408.6 432.5 423.2 432.6 561.8 578.7 600.2
Visitor Spending By Commodity Purchased ($Million)
2006 2008 2010 2012 2016 2017 2018
Accom. & Food Serv. 78.4 86.0 84.2 88.2 114.3 121.7 136.8Arts, Ent. & Rec. 15.8 18.0 16.4 17.5 16.3 16.8 18.8Ground Tran. 1.5 1.6 1.6 1.6 2.5 2.6 2.7Other Travel* 2.0 2.2 1.7 1.7 2.8 2.9 3.3Retail** 12.6 13.0 12.6 12.8 17.4 17.9 18.6Total 110.3 120.9 116.5 121.9 153.3 162.0 180.1
Industry Earnings Generated by Travel Spending ($Million)
2006 2008 2010 2012 2016 2017 2018
Accom. & Food Serv. 3,830 4,090 3,920 3,850 4,280 4,360 4,580Arts, Ent. & Rec. 940 950 930 990 910 890 980Ground Tran. 60 60 50 50 70 70 70Other Travel* 50 50 40 40 70 70 70Retail** 640 640 600 600 730 730 730Total 5,510 5,770 5,540 5,520 6,060 6,130 6,440
Industry Employment Generated by Travel Spending (Jobs)
2006 2008 2010 2012 2016 2017 2018
Local Tax Receipts 8.4 8.1 9.3 9.2 12.9 13.6 14.1State Tax Receipts 10.1 10.9 10.5 11.4 14.8 15.8 16.8Total 18.6 19.0 19.8 20.6 27.7 29.5 30.9
Tax Receipts Generated by Travel Spending ($Million)
Details may not add to total due to rounding. * Other Travel includes ground transportation and air travel impacts for travel to other Oregon visitor destinations, travel arrangement services, and convention & trade show organizers.** Retail includes gasoline.
DEAN RUNYAN ASSOCIATESPage 143
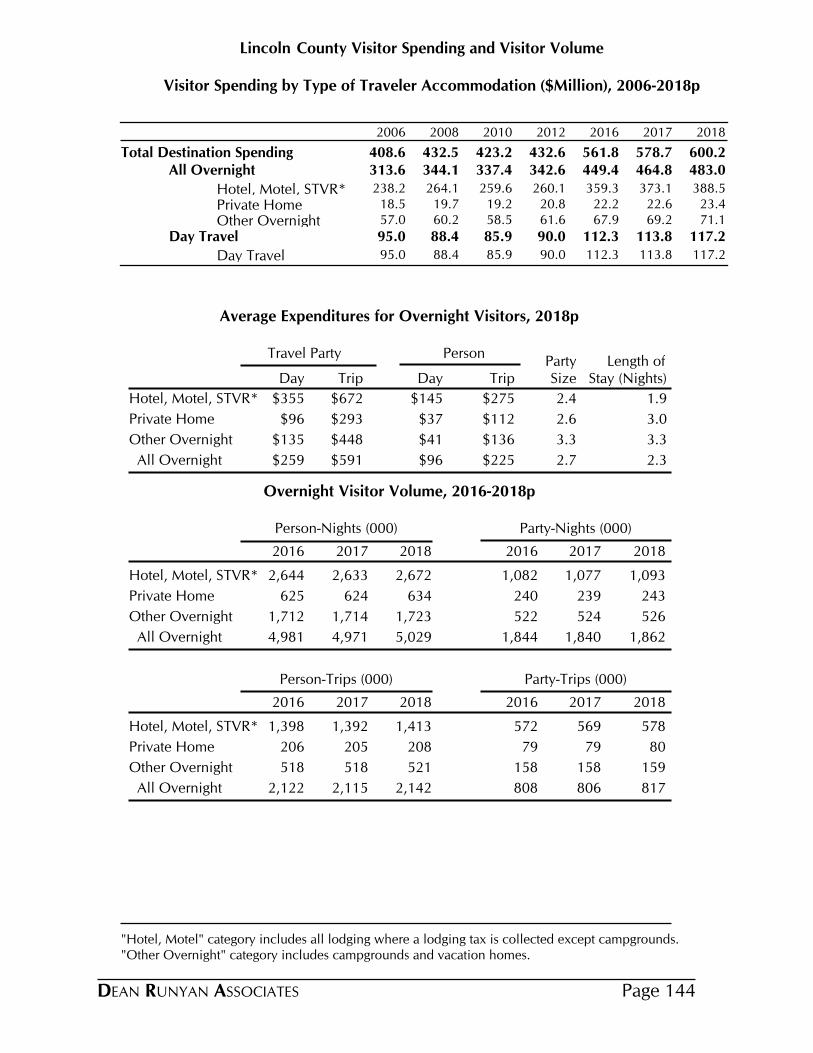
County Visitor Spending and Visitor VolumeLincoln
Visitor Spending by Type of Traveler Accommodation ($Million), 2006-2018p
2006 2008 2010 2012 2016 2017 2018
Total Destination Spending 408.6 432.5 423.2 432.6 561.8 578.7 600.2All Overnight 313.6 344.1 337.4 342.6 449.4 464.8 483.0
Hotel, Motel, STVR* 238.2 264.1 259.6 260.1 359.3 373.1 388.5
Private Home 18.5 19.7 19.2 20.8 22.2 22.6 23.4
Other Overnight 57.0 60.2 58.5 61.6 67.9 69.2 71.1
Day Travel 95.0 88.4 85.9 90.0 112.3 113.8 117.2
Day Travel 95.0 88.4 85.9 90.0 112.3 113.8 117.2
Average Expenditures for Overnight Visitors, 2018p
Travel Party PersonParty Length of
Day Trip Day Trip Size Stay (Nights)
$355 $672 $145 $275Hotel, Motel, STVR* 2.4 1.9
$96 $293 $37 $112Private Home 2.6 3.0
$135 $448 $41 $136Other Overnight 3.3 3.3
$259 $591 $96 $225 All Overnight 2.7 2.3
Overnight Visitor Volume, 2016-2018p
Person-Nights (000) Party-Nights (000)
2016 2017 2018 2016 2017 2018
Hotel, Motel, STVR* 2,644 2,633 2,672 1,082 1,077 1,093
Private Home 625 624 634 240 239 243
Other Overnight 1,712 1,714 1,723 522 524 526
All Overnight 4,981 4,971 5,029 1,844 1,840 1,862
Person-Trips (000) Party-Trips (000)
2016 2017 2018 2016 2017 2018
Hotel, Motel, STVR* 1,398 1,392 1,413 572 569 578
Private Home 206 205 208 79 79 80
Other Overnight 518 518 521 158 158 159
All Overnight 2,122 2,115 2,142 808 806 817
"Hotel, Motel" category includes all lodging where a lodging tax is collected except campgrounds. "Other Overnight" category includes campgrounds and vacation homes.
DEAN RUNYAN ASSOCIATES Page 144
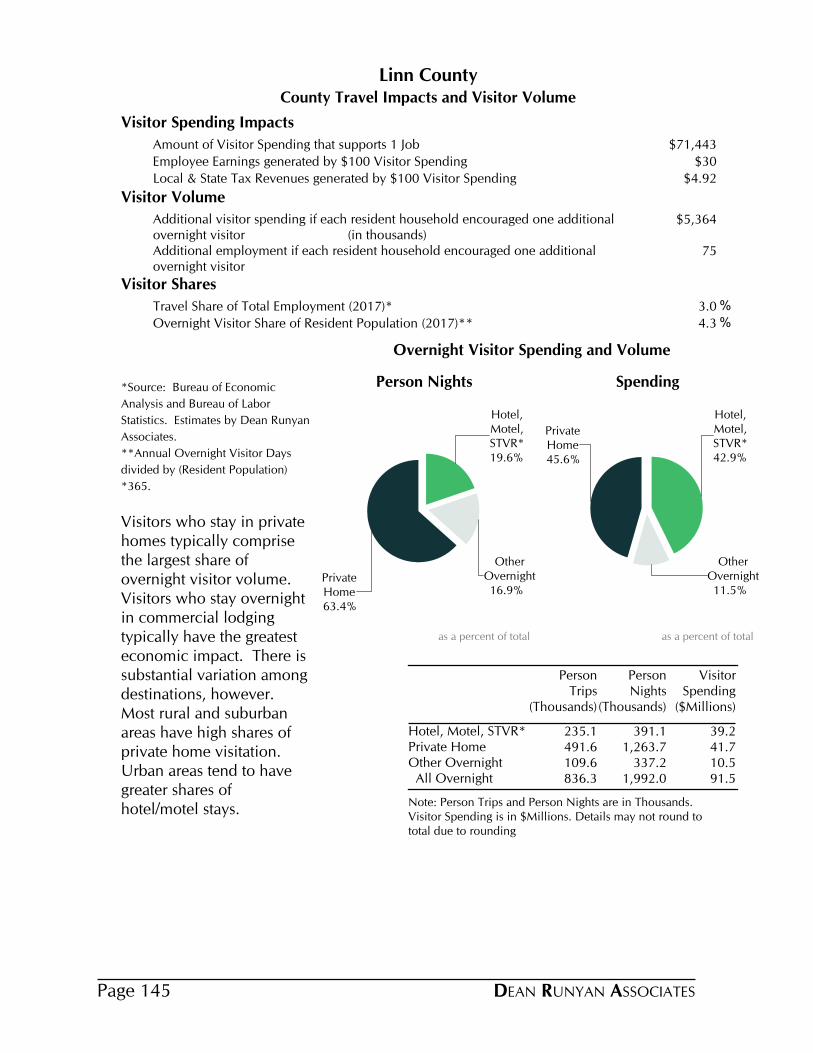
County Travel Impacts and Visitor Volume
Linn County
Visitor Spending Impacts
Amount of Visitor Spending that supports 1 Job $71,443
Employee Earnings generated by $100 Visitor Spending $30
Local & State Tax Revenues generated by $100 Visitor Spending $4.92
Visitor Volume
Additional visitor spending if each resident household encouraged one additional overnight visitor (in thousands)
$5,364
Additional employment if each resident household encouraged one additional overnight visitor
75
Visitor Shares
Travel Share of Total Employment (2017)* 3.0 %
Overnight Visitor Share of Resident Population (2017)** 4.3 %
*Source: Bureau of Economic
Analysis and Bureau of Labor
Statistics. Estimates by Dean Runyan
Associates.
**Annual Overnight Visitor Days
divided by (Resident Population)
*365.
Visitors who stay in private homes typically comprise the largest share of overnight visitor volume. Visitors who stay overnight in commercial lodging typically have the greatest economic impact. There is substantial variation among destinations, however. Most rural and suburban areas have high shares of private home visitation. Urban areas tend to have greater shares of hotel/motel stays.
Note: Person Trips and Person Nights are in Thousands. Visitor Spending is in $Millions. Details may not round to total due to rounding
Person Trips
(Thousands)
Person Nights
(Thousands)
Visitor Spending
($Millions)
Hotel, Motel, STVR* 235.1 391.1 39.2Private Home 491.6 1,263.7 41.7Other Overnight 109.6 337.2 10.5 All Overnight 836.3 1,992.0 91.5
19.6%
Hotel,Motel,STVR*
16.9%
OtherOvernight
63.4%
PrivateHome
Person Nights
as a percent of total
42.9%
Hotel,Motel,STVR*
11.5%
OtherOvernight
45.6%
PrivateHome
Spending
as a percent of total
Overnight Visitor Spending and Volume
DEAN RUNYAN ASSOCIATESPage 145

Direct Travel Impacts, 2010-2018p
Avg. Annual Chg.
Linn
Spending ($M) 2010 2012 2014 2016 2017 2018 17-18 10-18Total (Current $) 112.9 131.4 136.0 139.2 143.6 149.8 4.3% 3.6% Other 16.8 20.7 19.3 14.2 15.9 17.7 11.5% 0.6% Visitor 96.1 110.7 116.7 125.0 127.7 132.0 3.4% 4.1% Non-transportation 84.0 95.2 102.1 113.1 114.9 117.8 2.6% 4.3% Transportation 12.1 15.5 14.6 11.9 12.9 14.2 10.2% 2.1%
Earnings ($M)Earnings (Current $) 24.8 27.5 29.8 34.8 37.0 40.4 9.4% 6.3%
Employment (Jobs)Employment 1,490 1,570 1,630 1,780 1,800 1,890 5.2% 3.1%
Tax Revenue ($M)Total (Current $) 4.0 4.9 5.1 5.9 6.3 6.5 2.9% 6.4% Local 0.6 0.8 0.9 1.2 1.2 1.2 1.4% 8.4% State 3.3 4.0 4.1 4.7 5.1 5.3 3.2% 5.9%
Other spending includes resident air travel, travel arrangement and reservation services, and convention and trade show organizers. Non-transportation visitor spending includes accommodations, food services, retail, food stores, and arts, entertainment & recreation. Visitor transportation spending includes private auto, auto rental, other local ground transportation and one-way airfares.Earnings include wages & salaries, earned benefits and proprietor income.Employment includes all full- and part-time employment of payroll employees and proprietors.Local tax revenue includes lodging taxes, auto rental taxes and airport passenger facility charges paid by visitors.State tax revenue includes lodging, and motor fuel tax payments of visitors, and the income tax payments attributable to the travel industry income of businesses and employees.Federal tax revenue includes motor fuel excise taxes and airline ticket taxes paid by visitors, and the payroll and income taxes attributable to the travel industry income of employees and businesses.
DEAN RUNYAN ASSOCIATES Page 146
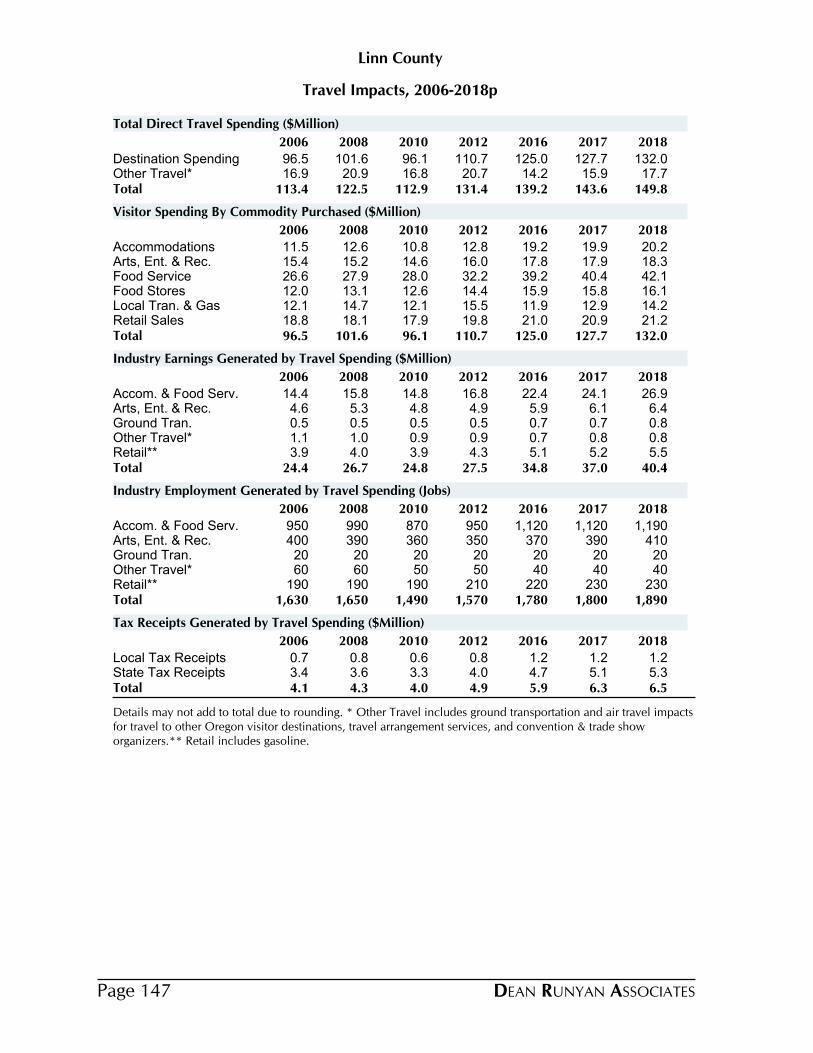
Travel Impacts, 2006-2018p
Linn County
2006 2008 2010 2012 2016 2017 2018
Destination Spending 96.5 101.6 96.1 110.7 125.0 127.7 132.0Other Travel* 16.9 20.9 16.8 20.7 14.2 15.9 17.7Total 113.4 122.5 112.9 131.4 139.2 143.6 149.8
Total Direct Travel Spending ($Million)
2006 2008 2010 2012 2016 2017 2018
Accommodations 11.5 12.6 10.8 12.8 19.2 19.9 20.2Arts, Ent. & Rec. 15.4 15.2 14.6 16.0 17.8 17.9 18.3Food Service 26.6 27.9 28.0 32.2 39.2 40.4 42.1Food Stores 12.0 13.1 12.6 14.4 15.9 15.8 16.1Local Tran. & Gas 12.1 14.7 12.1 15.5 11.9 12.9 14.2Retail Sales 18.8 18.1 17.9 19.8 21.0 20.9 21.2Total 96.5 101.6 96.1 110.7 125.0 127.7 132.0
Visitor Spending By Commodity Purchased ($Million)
2006 2008 2010 2012 2016 2017 2018
Accom. & Food Serv. 14.4 15.8 14.8 16.8 22.4 24.1 26.9Arts, Ent. & Rec. 4.6 5.3 4.8 4.9 5.9 6.1 6.4Ground Tran. 0.5 0.5 0.5 0.5 0.7 0.7 0.8Other Travel* 1.1 1.0 0.9 0.9 0.7 0.8 0.8Retail** 3.9 4.0 3.9 4.3 5.1 5.2 5.5Total 24.4 26.7 24.8 27.5 34.8 37.0 40.4
Industry Earnings Generated by Travel Spending ($Million)
2006 2008 2010 2012 2016 2017 2018
Accom. & Food Serv. 950 990 870 950 1,120 1,120 1,190Arts, Ent. & Rec. 400 390 360 350 370 390 410Ground Tran. 20 20 20 20 20 20 20Other Travel* 60 60 50 50 40 40 40Retail** 190 190 190 210 220 230 230Total 1,630 1,650 1,490 1,570 1,780 1,800 1,890
Industry Employment Generated by Travel Spending (Jobs)
2006 2008 2010 2012 2016 2017 2018
Local Tax Receipts 0.7 0.8 0.6 0.8 1.2 1.2 1.2State Tax Receipts 3.4 3.6 3.3 4.0 4.7 5.1 5.3Total 4.1 4.3 4.0 4.9 5.9 6.3 6.5
Tax Receipts Generated by Travel Spending ($Million)
Details may not add to total due to rounding. * Other Travel includes ground transportation and air travel impacts for travel to other Oregon visitor destinations, travel arrangement services, and convention & trade show organizers.** Retail includes gasoline.
DEAN RUNYAN ASSOCIATESPage 147

County Visitor Spending and Visitor VolumeLinn
Visitor Spending by Type of Traveler Accommodation ($Million), 2006-2018p
2006 2008 2010 2012 2016 2017 2018
Total Destination Spending 96.5 101.6 96.1 110.7 125.0 127.7 132.0All Overnight 64.0 70.4 65.7 75.6 86.5 88.5 91.5
Hotel, Motel, STVR* 24.3 27.0 22.9 28.0 37.0 38.1 39.2
Private Home 31.2 34.2 34.1 38.5 39.4 40.2 41.7
Other Overnight 8.6 9.2 8.6 9.1 10.1 10.2 10.5
Day Travel 32.5 31.2 30.4 35.1 38.6 39.2 40.5
Day Travel 32.5 31.2 30.4 35.1 38.6 39.2 40.5
Average Expenditures for Overnight Visitors, 2018p
Travel Party PersonParty Length of
Day Trip Day Trip Size Stay (Nights)
$246 $409 $100 $167Hotel, Motel, STVR* 2.5 1.7
$85 $217 $33 $85Private Home 2.6 2.6
$107 $329 $31 $96Other Overnight 3.4 3.1
$122 $286 $46 $109 All Overnight 2.7 2.3
Overnight Visitor Volume, 2016-2018p
Person-Nights (000) Party-Nights (000)
2016 2017 2018 2016 2017 2018
Hotel, Motel, STVR* 393 389 391 160 159 159
Private Home 1,243 1,244 1,264 486 486 494
Other Overnight 336 332 337 98 97 98
All Overnight 1,972 1,965 1,992 744 742 752
Person-Trips (000) Party-Trips (000)
2016 2017 2018 2016 2017 2018
Hotel, Motel, STVR* 237 234 235 96 95 96
Private Home 483 484 492 189 189 192
Other Overnight 109 108 110 32 32 32
All Overnight 829 826 836 317 316 320
"Hotel, Motel" category includes all lodging where a lodging tax is collected except campgrounds. "Other Overnight" category includes campgrounds and vacation homes.
DEAN RUNYAN ASSOCIATES Page 148

County Travel Impacts and Visitor Volume
Malheur County
Visitor Spending Impacts
Amount of Visitor Spending that supports 1 Job $68,413
Employee Earnings generated by $100 Visitor Spending $33
Local & State Tax Revenues generated by $100 Visitor Spending $5.74
Visitor Volume
Additional visitor spending if each resident household encouraged one additional overnight visitor (in thousands)
$1,162
Additional employment if each resident household encouraged one additional overnight visitor
17
Visitor Shares
Travel Share of Total Employment (2017)* 3.6 %
Overnight Visitor Share of Resident Population (2017)** 5.7 %
*Source: Bureau of Economic
Analysis and Bureau of Labor
Statistics. Estimates by Dean Runyan
Associates.
**Annual Overnight Visitor Days
divided by (Resident Population)
*365.
Visitors who stay in private homes typically comprise the largest share of overnight visitor volume. Visitors who stay overnight in commercial lodging typically have the greatest economic impact. There is substantial variation among destinations, however. Most rural and suburban areas have high shares of private home visitation. Urban areas tend to have greater shares of hotel/motel stays.
Note: Person Trips and Person Nights are in Thousands. Visitor Spending is in $Millions. Details may not round to total due to rounding
Person Trips
(Thousands)
Person Nights
(Thousands)
Visitor Spending
($Millions)
Hotel, Motel, STVR* 137.7 229.0 22.4Private Home 117.9 303.1 6.3Other Overnight 34.6 106.2 4.2 All Overnight 290.2 638.3 32.9
35.9%
Hotel,Motel,STVR*
16.6%
OtherOvernight
47.5%
PrivateHome
Person Nights
as a percent of total
68.0%
Hotel,Motel,STVR*
12.7%
OtherOvernight
19.3%
PrivateHome
Spending
as a percent of total
Overnight Visitor Spending and Volume
DEAN RUNYAN ASSOCIATESPage 149

Direct Travel Impacts, 2010-2018p
Avg. Annual Chg.
Malheur
Spending ($M) 2010 2012 2014 2016 2017 2018 17-18 10-18Total (Current $) 37.6 41.0 40.1 42.1 45.6 44.8 -1.7% 2.2% Other 4.3 5.2 4.7 3.5 3.9 4.3 11.5% 0.1% Visitor 33.3 35.9 35.3 38.6 41.7 40.5 -2.9% 2.5% Non-transportation 30.2 32.2 32.1 35.9 38.7 37.3 -3.5% 2.7% Transportation 3.1 3.7 3.3 2.7 3.0 3.2 4.5% 0.2%
Earnings ($M)Earnings (Current $) 9.8 10.9 11.1 12.4 13.1 13.5 3.5% 4.1%
Employment (Jobs)Employment 550 590 560 590 620 600 -2.8% 1.2%
Tax Revenue ($M)Total (Current $) 1.7 1.9 1.9 2.2 2.4 2.3 -3.2% 4.3% Local 0.6 0.7 0.7 0.8 0.9 0.9 -7.3% 4.2% State 1.0 1.2 1.2 1.3 1.5 1.5 -0.6% 4.3%
Other spending includes resident air travel, travel arrangement and reservation services, and convention and trade show organizers. Non-transportation visitor spending includes accommodations, food services, retail, food stores, and arts, entertainment & recreation. Visitor transportation spending includes private auto, auto rental, other local ground transportation and one-way airfares.Earnings include wages & salaries, earned benefits and proprietor income.Employment includes all full- and part-time employment of payroll employees and proprietors.Local tax revenue includes lodging taxes, auto rental taxes and airport passenger facility charges paid by visitors.State tax revenue includes lodging, and motor fuel tax payments of visitors, and the income tax payments attributable to the travel industry income of businesses and employees.Federal tax revenue includes motor fuel excise taxes and airline ticket taxes paid by visitors, and the payroll and income taxes attributable to the travel industry income of employees and businesses.
DEAN RUNYAN ASSOCIATES Page 150
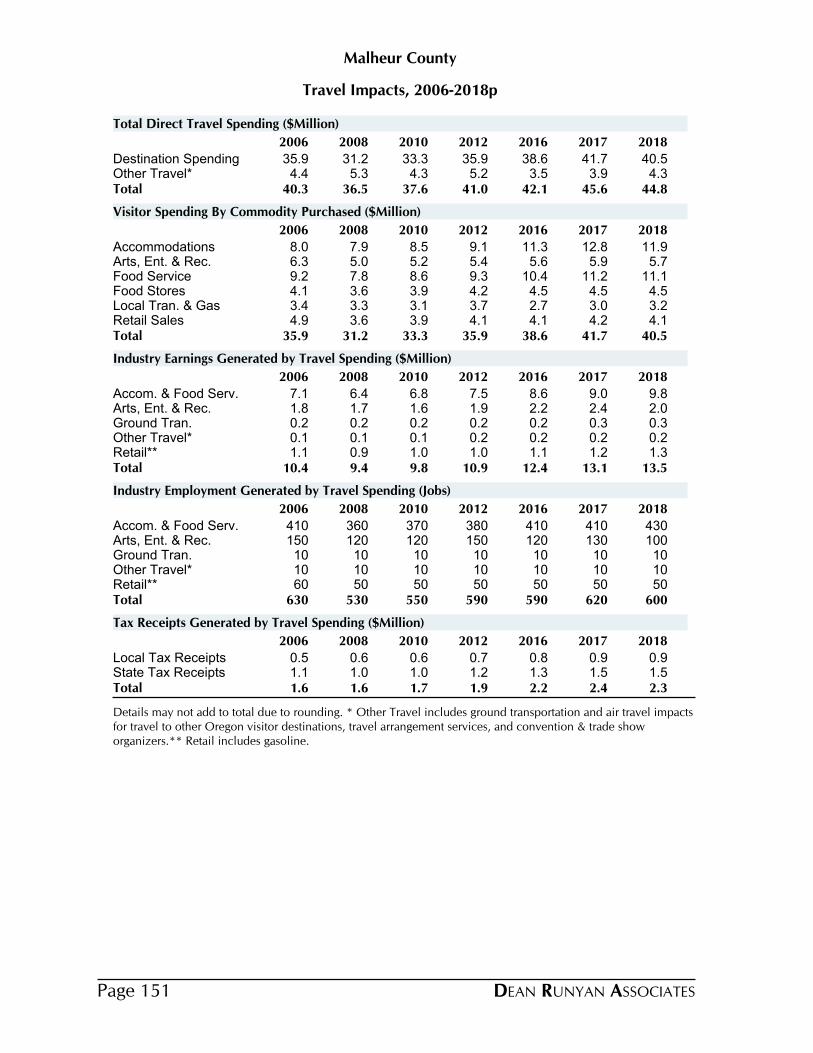
Travel Impacts, 2006-2018p
Malheur County
2006 2008 2010 2012 2016 2017 2018
Destination Spending 35.9 31.2 33.3 35.9 38.6 41.7 40.5Other Travel* 4.4 5.3 4.3 5.2 3.5 3.9 4.3Total 40.3 36.5 37.6 41.0 42.1 45.6 44.8
Total Direct Travel Spending ($Million)
2006 2008 2010 2012 2016 2017 2018
Accommodations 8.0 7.9 8.5 9.1 11.3 12.8 11.9Arts, Ent. & Rec. 6.3 5.0 5.2 5.4 5.6 5.9 5.7Food Service 9.2 7.8 8.6 9.3 10.4 11.2 11.1Food Stores 4.1 3.6 3.9 4.2 4.5 4.5 4.5Local Tran. & Gas 3.4 3.3 3.1 3.7 2.7 3.0 3.2Retail Sales 4.9 3.6 3.9 4.1 4.1 4.2 4.1Total 35.9 31.2 33.3 35.9 38.6 41.7 40.5
Visitor Spending By Commodity Purchased ($Million)
2006 2008 2010 2012 2016 2017 2018
Accom. & Food Serv. 7.1 6.4 6.8 7.5 8.6 9.0 9.8Arts, Ent. & Rec. 1.8 1.7 1.6 1.9 2.2 2.4 2.0Ground Tran. 0.2 0.2 0.2 0.2 0.2 0.3 0.3Other Travel* 0.1 0.1 0.1 0.2 0.2 0.2 0.2Retail** 1.1 0.9 1.0 1.0 1.1 1.2 1.3Total 10.4 9.4 9.8 10.9 12.4 13.1 13.5
Industry Earnings Generated by Travel Spending ($Million)
2006 2008 2010 2012 2016 2017 2018
Accom. & Food Serv. 410 360 370 380 410 410 430Arts, Ent. & Rec. 150 120 120 150 120 130 100Ground Tran. 10 10 10 10 10 10 10Other Travel* 10 10 10 10 10 10 10Retail** 60 50 50 50 50 50 50Total 630 530 550 590 590 620 600
Industry Employment Generated by Travel Spending (Jobs)
2006 2008 2010 2012 2016 2017 2018
Local Tax Receipts 0.5 0.6 0.6 0.7 0.8 0.9 0.9State Tax Receipts 1.1 1.0 1.0 1.2 1.3 1.5 1.5Total 1.6 1.6 1.7 1.9 2.2 2.4 2.3
Tax Receipts Generated by Travel Spending ($Million)
Details may not add to total due to rounding. * Other Travel includes ground transportation and air travel impacts for travel to other Oregon visitor destinations, travel arrangement services, and convention & trade show organizers.** Retail includes gasoline.
DEAN RUNYAN ASSOCIATESPage 151
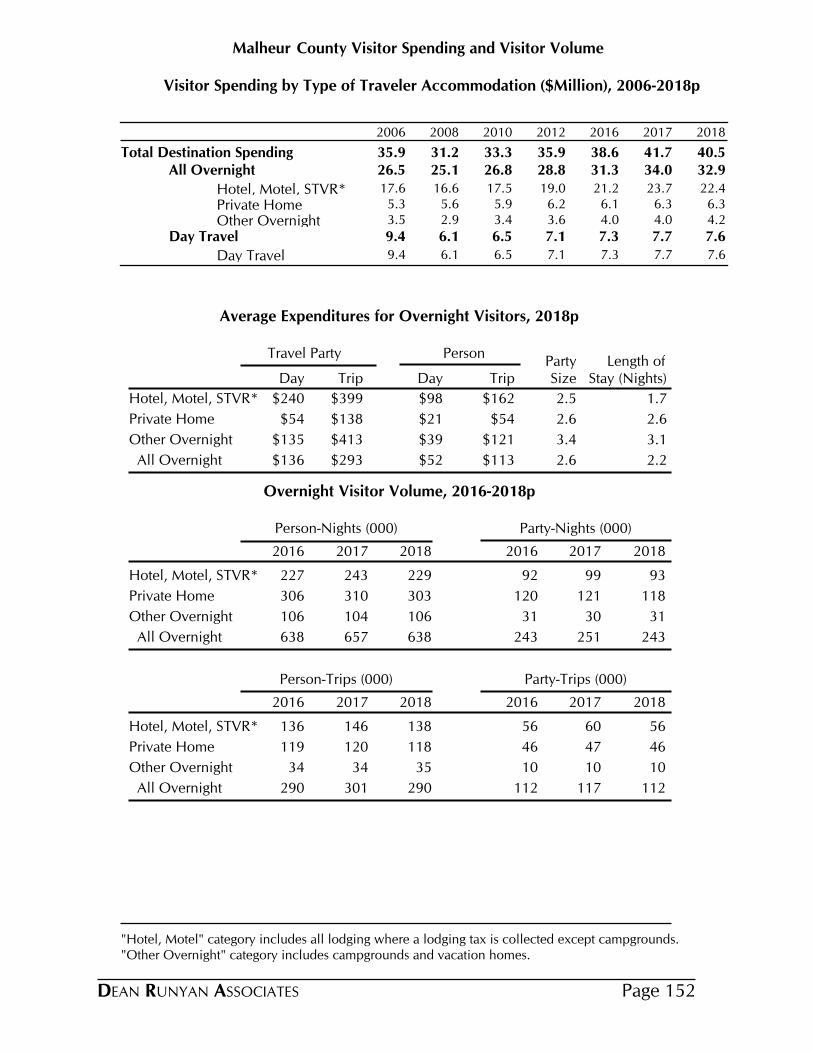
County Visitor Spending and Visitor VolumeMalheur
Visitor Spending by Type of Traveler Accommodation ($Million), 2006-2018p
2006 2008 2010 2012 2016 2017 2018
Total Destination Spending 35.9 31.2 33.3 35.9 38.6 41.7 40.5All Overnight 26.5 25.1 26.8 28.8 31.3 34.0 32.9
Hotel, Motel, STVR* 17.6 16.6 17.5 19.0 21.2 23.7 22.4
Private Home 5.3 5.6 5.9 6.2 6.1 6.3 6.3
Other Overnight 3.5 2.9 3.4 3.6 4.0 4.0 4.2
Day Travel 9.4 6.1 6.5 7.1 7.3 7.7 7.6
Day Travel 9.4 6.1 6.5 7.1 7.3 7.7 7.6
Average Expenditures for Overnight Visitors, 2018p
Travel Party PersonParty Length of
Day Trip Day Trip Size Stay (Nights)
$240 $399 $98 $162Hotel, Motel, STVR* 2.5 1.7
$54 $138 $21 $54Private Home 2.6 2.6
$135 $413 $39 $121Other Overnight 3.4 3.1
$136 $293 $52 $113 All Overnight 2.6 2.2
Overnight Visitor Volume, 2016-2018p
Person-Nights (000) Party-Nights (000)
2016 2017 2018 2016 2017 2018
Hotel, Motel, STVR* 227 243 229 92 99 93
Private Home 306 310 303 120 121 118
Other Overnight 106 104 106 31 30 31
All Overnight 638 657 638 243 251 243
Person-Trips (000) Party-Trips (000)
2016 2017 2018 2016 2017 2018
Hotel, Motel, STVR* 136 146 138 56 60 56
Private Home 119 120 118 46 47 46
Other Overnight 34 34 35 10 10 10
All Overnight 290 301 290 112 117 112
"Hotel, Motel" category includes all lodging where a lodging tax is collected except campgrounds. "Other Overnight" category includes campgrounds and vacation homes.
DEAN RUNYAN ASSOCIATES Page 152
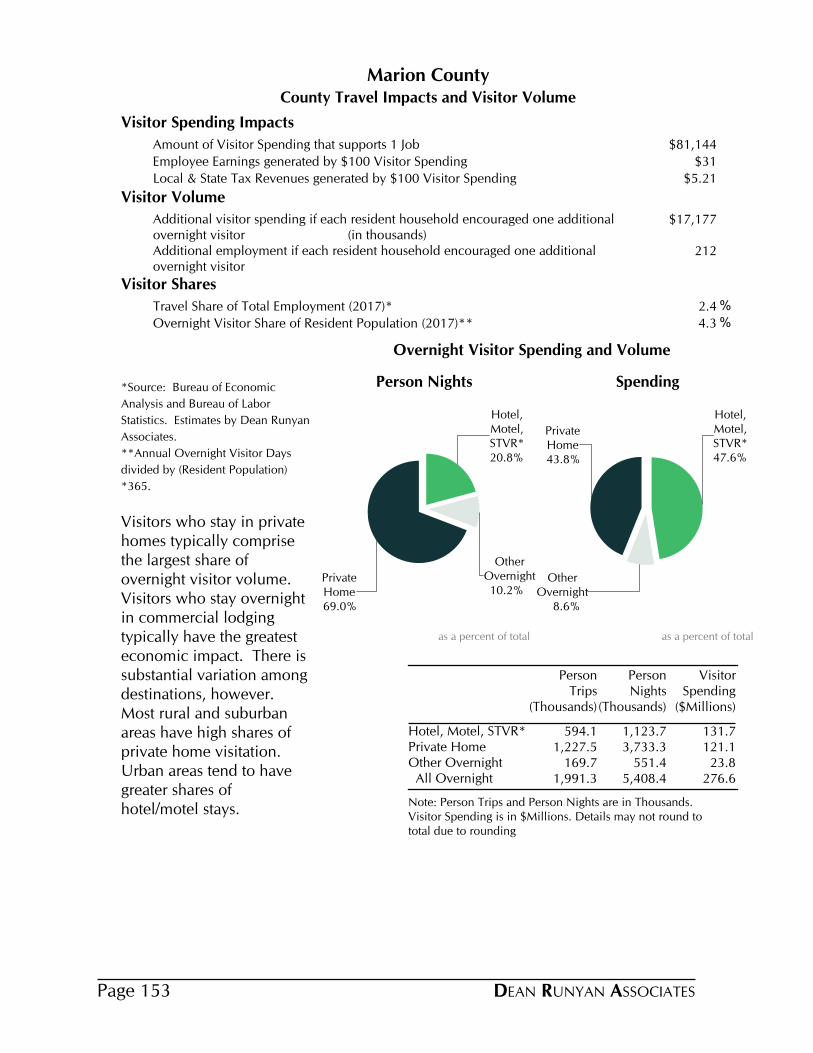
County Travel Impacts and Visitor Volume
Marion County
Visitor Spending Impacts
Amount of Visitor Spending that supports 1 Job $81,144
Employee Earnings generated by $100 Visitor Spending $31
Local & State Tax Revenues generated by $100 Visitor Spending $5.21
Visitor Volume
Additional visitor spending if each resident household encouraged one additional overnight visitor (in thousands)
$17,177
Additional employment if each resident household encouraged one additional overnight visitor
212
Visitor Shares
Travel Share of Total Employment (2017)* 2.4 %
Overnight Visitor Share of Resident Population (2017)** 4.3 %
*Source: Bureau of Economic
Analysis and Bureau of Labor
Statistics. Estimates by Dean Runyan
Associates.
**Annual Overnight Visitor Days
divided by (Resident Population)
*365.
Visitors who stay in private homes typically comprise the largest share of overnight visitor volume. Visitors who stay overnight in commercial lodging typically have the greatest economic impact. There is substantial variation among destinations, however. Most rural and suburban areas have high shares of private home visitation. Urban areas tend to have greater shares of hotel/motel stays.
Note: Person Trips and Person Nights are in Thousands. Visitor Spending is in $Millions. Details may not round to total due to rounding
Person Trips
(Thousands)
Person Nights
(Thousands)
Visitor Spending
($Millions)
Hotel, Motel, STVR* 594.1 1,123.7 131.7Private Home 1,227.5 3,733.3 121.1Other Overnight 169.7 551.4 23.8 All Overnight 1,991.3 5,408.4 276.6
20.8%
Hotel,Motel,STVR*
10.2%
OtherOvernight
69.0%
PrivateHome
Person Nights
as a percent of total
47.6%
Hotel,Motel,STVR*
8.6%
OtherOvernight
43.8%
PrivateHome
Spending
as a percent of total
Overnight Visitor Spending and Volume
DEAN RUNYAN ASSOCIATESPage 153

Direct Travel Impacts, 2010-2018p
Avg. Annual Chg.
Marion
Spending ($M) 2010 2012 2014 2016 2017 2018 17-18 10-18Total (Current $) 324.2 364.3 381.9 396.7 415.5 425.8 2.5% 3.5% Other 48.6 59.3 56.5 47.3 52.6 58.6 11.4% 2.4% Visitor 275.7 305.0 325.5 349.4 363.0 367.2 1.2% 3.6% Non-transportation 241.8 263.4 286.0 317.4 327.7 329.3 0.5% 3.9% Transportation 33.8 41.6 39.5 32.1 35.3 38.0 7.6% 1.4%
Earnings ($M)Earnings (Current $) 75.6 81.4 89.6 104.9 112.0 118.6 5.9% 5.8%
Employment (Jobs)Employment 3,890 4,020 4,340 4,660 4,720 4,740 0.4% 2.5%
Tax Revenue ($M)Total (Current $) 12.0 14.1 15.1 17.4 19.0 19.1 0.8% 6.0% Local 2.5 2.9 3.4 4.2 4.5 4.4 -1.0% 7.3% State 9.5 11.2 11.7 13.2 14.5 14.7 1.4% 5.6%
Other spending includes resident air travel, travel arrangement and reservation services, and convention and trade show organizers. Non-transportation visitor spending includes accommodations, food services, retail, food stores, and arts, entertainment & recreation. Visitor transportation spending includes private auto, auto rental, other local ground transportation and one-way airfares.Earnings include wages & salaries, earned benefits and proprietor income.Employment includes all full- and part-time employment of payroll employees and proprietors.Local tax revenue includes lodging taxes, auto rental taxes and airport passenger facility charges paid by visitors.State tax revenue includes lodging, and motor fuel tax payments of visitors, and the income tax payments attributable to the travel industry income of businesses and employees.Federal tax revenue includes motor fuel excise taxes and airline ticket taxes paid by visitors, and the payroll and income taxes attributable to the travel industry income of employees and businesses.
DEAN RUNYAN ASSOCIATES Page 154

Travel Impacts, 2006-2018p
Marion County
2006 2008 2010 2012 2016 2017 2018
Destination Spending 268.9 279.1 275.7 305.0 349.4 363.0 367.2Other Travel* 48.9 59.8 48.6 59.3 47.3 52.6 58.6Total 317.8 338.9 324.2 364.3 396.7 415.5 425.8
Total Direct Travel Spending ($Million)
2006 2008 2010 2012 2016 2017 2018
Accommodations 39.8 42.3 40.1 43.1 63.5 67.6 67.1Arts, Ent. & Rec. 41.5 40.5 40.1 42.8 47.8 48.7 48.8Food Service 73.5 75.8 79.4 87.8 108.1 112.8 115.1Food Stores 31.2 34.1 33.8 37.7 42.2 42.4 42.5Local Tran. & Gas 33.0 39.1 33.8 41.6 32.1 35.3 38.0Retail Sales 49.9 47.2 48.4 52.1 55.7 56.1 55.8Total 268.9 279.1 275.7 305.0 349.4 363.0 367.2
Visitor Spending By Commodity Purchased ($Million)
2006 2008 2010 2012 2016 2017 2018
Accom. & Food Serv. 44.7 48.2 47.2 51.8 69.5 74.9 79.0Arts, Ent. & Rec. 12.4 13.9 13.0 13.1 14.7 15.3 16.8Ground Tran. 1.3 1.3 1.3 1.5 1.9 2.0 2.1Other Travel* 3.8 4.0 3.7 3.8 5.5 5.9 6.5Retail** 10.1 10.4 10.3 11.2 13.2 13.8 14.3Total 72.3 77.8 75.6 81.4 104.9 112.0 118.6
Industry Earnings Generated by Travel Spending ($Million)
2006 2008 2010 2012 2016 2017 2018
Accom. & Food Serv. 2,440 2,480 2,320 2,500 2,910 2,980 3,000Arts, Ent. & Rec. 890 990 910 850 970 950 940Ground Tran. 50 50 40 50 50 50 50Other Travel* 170 170 150 150 210 210 220Retail** 480 470 460 480 520 530 530Total 4,020 4,150 3,890 4,020 4,660 4,720 4,740
Industry Employment Generated by Travel Spending (Jobs)
2006 2008 2010 2012 2016 2017 2018
Local Tax Receipts 2.6 2.8 2.5 2.9 4.2 4.5 4.4State Tax Receipts 9.4 9.9 9.5 11.2 13.2 14.5 14.7Total 12.0 12.7 12.0 14.1 17.4 19.0 19.1
Tax Receipts Generated by Travel Spending ($Million)
Details may not add to total due to rounding. * Other Travel includes ground transportation and air travel impacts for travel to other Oregon visitor destinations, travel arrangement services, and convention & trade show organizers.** Retail includes gasoline.
DEAN RUNYAN ASSOCIATESPage 155
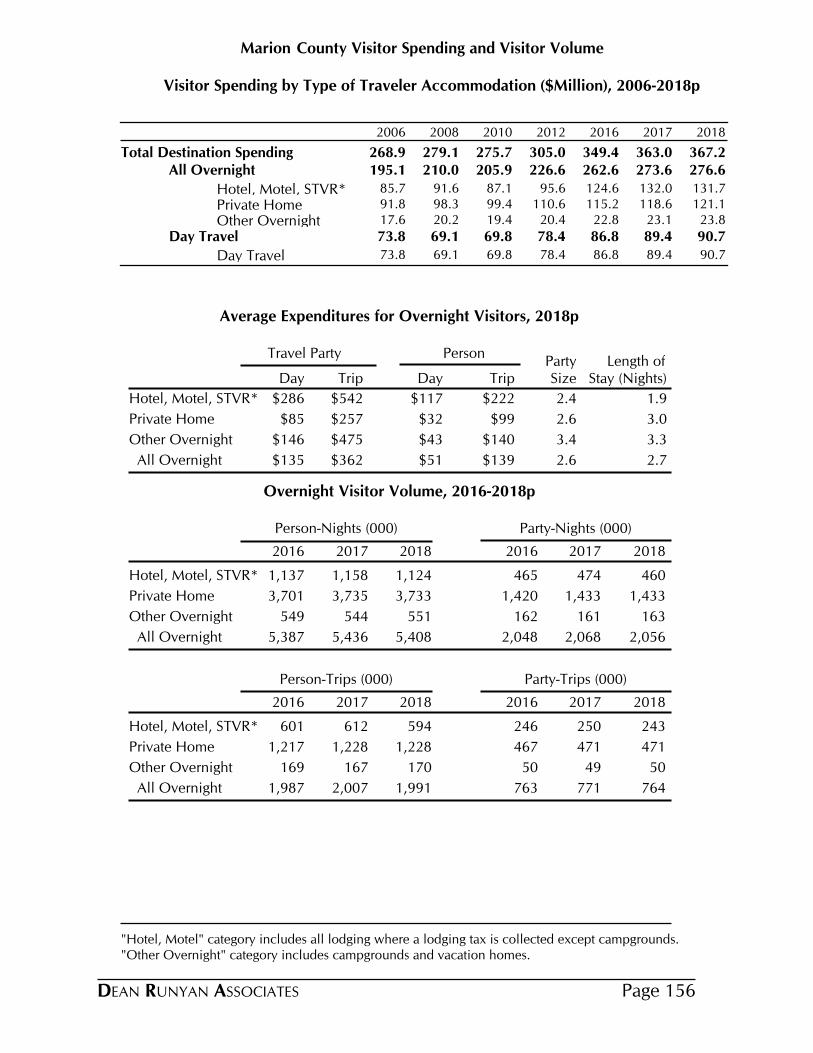
County Visitor Spending and Visitor VolumeMarion
Visitor Spending by Type of Traveler Accommodation ($Million), 2006-2018p
2006 2008 2010 2012 2016 2017 2018
Total Destination Spending 268.9 279.1 275.7 305.0 349.4 363.0 367.2All Overnight 195.1 210.0 205.9 226.6 262.6 273.6 276.6
Hotel, Motel, STVR* 85.7 91.6 87.1 95.6 124.6 132.0 131.7
Private Home 91.8 98.3 99.4 110.6 115.2 118.6 121.1
Other Overnight 17.6 20.2 19.4 20.4 22.8 23.1 23.8
Day Travel 73.8 69.1 69.8 78.4 86.8 89.4 90.7
Day Travel 73.8 69.1 69.8 78.4 86.8 89.4 90.7
Average Expenditures for Overnight Visitors, 2018p
Travel Party PersonParty Length of
Day Trip Day Trip Size Stay (Nights)
$286 $542 $117 $222Hotel, Motel, STVR* 2.4 1.9
$85 $257 $32 $99Private Home 2.6 3.0
$146 $475 $43 $140Other Overnight 3.4 3.3
$135 $362 $51 $139 All Overnight 2.6 2.7
Overnight Visitor Volume, 2016-2018p
Person-Nights (000) Party-Nights (000)
2016 2017 2018 2016 2017 2018
Hotel, Motel, STVR* 1,137 1,158 1,124 465 474 460
Private Home 3,701 3,735 3,733 1,420 1,433 1,433
Other Overnight 549 544 551 162 161 163
All Overnight 5,387 5,436 5,408 2,048 2,068 2,056
Person-Trips (000) Party-Trips (000)
2016 2017 2018 2016 2017 2018
Hotel, Motel, STVR* 601 612 594 246 250 243
Private Home 1,217 1,228 1,228 467 471 471
Other Overnight 169 167 170 50 49 50
All Overnight 1,987 2,007 1,991 763 771 764
"Hotel, Motel" category includes all lodging where a lodging tax is collected except campgrounds. "Other Overnight" category includes campgrounds and vacation homes.
DEAN RUNYAN ASSOCIATES Page 156

County Travel Impacts and Visitor Volume
Morrow County
Visitor Spending Impacts
Amount of Visitor Spending that supports 1 Job $66,576
Employee Earnings generated by $100 Visitor Spending $31
Local & State Tax Revenues generated by $100 Visitor Spending $3.79
Visitor Volume
Additional visitor spending if each resident household encouraged one additional overnight visitor (in thousands)
$386
Additional employment if each resident household encouraged one additional overnight visitor
6
Visitor Shares
Travel Share of Total Employment (2017)* 2.5 %
Overnight Visitor Share of Resident Population (2017)** 6.5 %
*Source: Bureau of Economic
Analysis and Bureau of Labor
Statistics. Estimates by Dean Runyan
Associates.
**Annual Overnight Visitor Days
divided by (Resident Population)
*365.
Visitors who stay in private homes typically comprise the largest share of overnight visitor volume. Visitors who stay overnight in commercial lodging typically have the greatest economic impact. There is substantial variation among destinations, however. Most rural and suburban areas have high shares of private home visitation. Urban areas tend to have greater shares of hotel/motel stays.
Note: Person Trips and Person Nights are in Thousands. Visitor Spending is in $Millions. Details may not round to total due to rounding
Person Trips
(Thousands)
Person Nights
(Thousands)
Visitor Spending
($Millions)
Hotel, Motel, STVR* 53.9 89.6 8.1Private Home 43.9 112.9 2.4Other Overnight 23.3 66.9 1.3 All Overnight 121.1 269.4 11.8
33.3%
Hotel,Motel,STVR*
24.8%
OtherOvernight
41.9%
PrivateHome
Person Nights
as a percent of total
68.6%
Hotel,Motel,STVR*
11.4%
OtherOvernight
20.0%
PrivateHome
Spending
as a percent of total
Overnight Visitor Spending and Volume
DEAN RUNYAN ASSOCIATESPage 157

Direct Travel Impacts, 2010-2018p
Avg. Annual Chg.
Morrow
Spending ($M) 2010 2012 2014 2016 2017 2018 17-18 10-18Total (Current $) 12.0 13.4 14.4 14.9 15.8 16.4 3.4% 4.0% Other 1.5 1.9 1.7 1.3 1.4 1.6 11.5% 0.4% Visitor 10.4 11.5 12.6 13.6 14.4 14.8 2.6% 4.4% Non-transportation 9.3 10.2 11.3 12.6 13.2 13.5 2.0% 4.7% Transportation 1.1 1.3 1.3 1.1 1.2 1.3 9.2% 1.9%
Earnings ($M)Earnings (Current $) 2.8 3.1 3.4 3.8 4.1 4.7 15.4% 6.9%
Employment (Jobs)Employment 150 160 180 180 190 220 16.0% 5.0%
Tax Revenue ($M)Total (Current $) 0.3 0.4 0.4 0.5 0.5 0.6 6.4% 6.2% Local 0.0 0.0 0.0 0.0 0.0 0.0 1.4% 3.9% State 0.3 0.4 0.4 0.5 0.5 0.6 6.5% 6.2%
Other spending includes resident air travel, travel arrangement and reservation services, and convention and trade show organizers. Non-transportation visitor spending includes accommodations, food services, retail, food stores, and arts, entertainment & recreation. Visitor transportation spending includes private auto, auto rental, other local ground transportation and one-way airfares.Earnings include wages & salaries, earned benefits and proprietor income.Employment includes all full- and part-time employment of payroll employees and proprietors.Local tax revenue includes lodging taxes, auto rental taxes and airport passenger facility charges paid by visitors.State tax revenue includes lodging, and motor fuel tax payments of visitors, and the income tax payments attributable to the travel industry income of businesses and employees.Federal tax revenue includes motor fuel excise taxes and airline ticket taxes paid by visitors, and the payroll and income taxes attributable to the travel industry income of employees and businesses.
DEAN RUNYAN ASSOCIATES Page 158
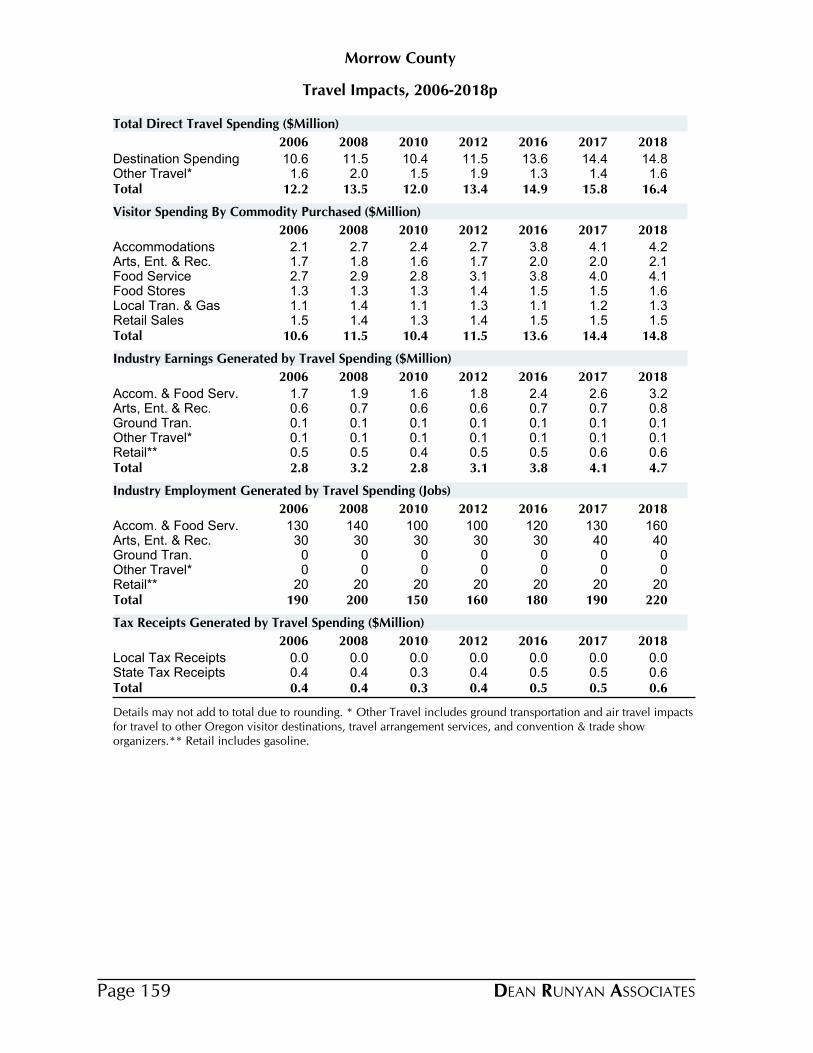
Travel Impacts, 2006-2018p
Morrow County
2006 2008 2010 2012 2016 2017 2018
Destination Spending 10.6 11.5 10.4 11.5 13.6 14.4 14.8Other Travel* 1.6 2.0 1.5 1.9 1.3 1.4 1.6Total 12.2 13.5 12.0 13.4 14.9 15.8 16.4
Total Direct Travel Spending ($Million)
2006 2008 2010 2012 2016 2017 2018
Accommodations 2.1 2.7 2.4 2.7 3.8 4.1 4.2Arts, Ent. & Rec. 1.7 1.8 1.6 1.7 2.0 2.0 2.1Food Service 2.7 2.9 2.8 3.1 3.8 4.0 4.1Food Stores 1.3 1.3 1.3 1.4 1.5 1.5 1.6Local Tran. & Gas 1.1 1.4 1.1 1.3 1.1 1.2 1.3Retail Sales 1.5 1.4 1.3 1.4 1.5 1.5 1.5Total 10.6 11.5 10.4 11.5 13.6 14.4 14.8
Visitor Spending By Commodity Purchased ($Million)
2006 2008 2010 2012 2016 2017 2018
Accom. & Food Serv. 1.7 1.9 1.6 1.8 2.4 2.6 3.2Arts, Ent. & Rec. 0.6 0.7 0.6 0.6 0.7 0.7 0.8Ground Tran. 0.1 0.1 0.1 0.1 0.1 0.1 0.1Other Travel* 0.1 0.1 0.1 0.1 0.1 0.1 0.1Retail** 0.5 0.5 0.4 0.5 0.5 0.6 0.6Total 2.8 3.2 2.8 3.1 3.8 4.1 4.7
Industry Earnings Generated by Travel Spending ($Million)
2006 2008 2010 2012 2016 2017 2018
Accom. & Food Serv. 130 140 100 100 120 130 160Arts, Ent. & Rec. 30 30 30 30 30 40 40Ground Tran. 0 0 0 0 0 0 0Other Travel* 0 0 0 0 0 0 0Retail** 20 20 20 20 20 20 20Total 190 200 150 160 180 190 220
Industry Employment Generated by Travel Spending (Jobs)
2006 2008 2010 2012 2016 2017 2018
Local Tax Receipts 0.0 0.0 0.0 0.0 0.0 0.0 0.0State Tax Receipts 0.4 0.4 0.3 0.4 0.5 0.5 0.6Total 0.4 0.4 0.3 0.4 0.5 0.5 0.6
Tax Receipts Generated by Travel Spending ($Million)
Details may not add to total due to rounding. * Other Travel includes ground transportation and air travel impacts for travel to other Oregon visitor destinations, travel arrangement services, and convention & trade show organizers.** Retail includes gasoline.
DEAN RUNYAN ASSOCIATESPage 159
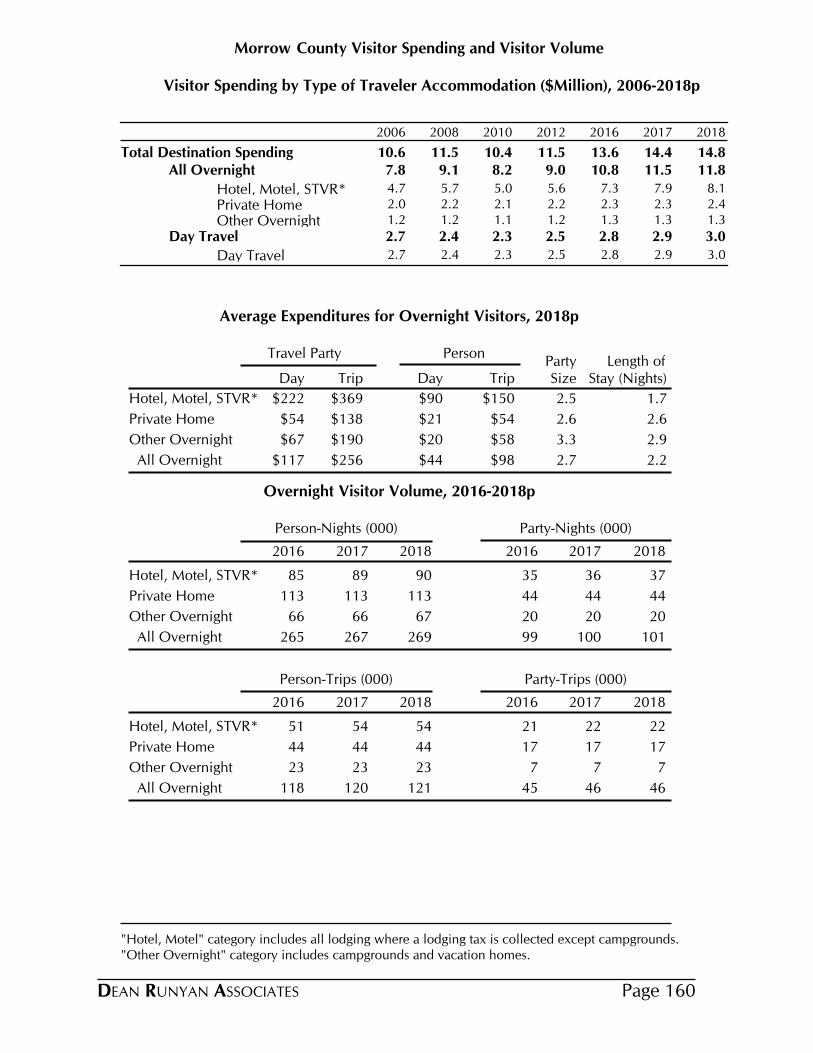
County Visitor Spending and Visitor VolumeMorrow
Visitor Spending by Type of Traveler Accommodation ($Million), 2006-2018p
2006 2008 2010 2012 2016 2017 2018
Total Destination Spending 10.6 11.5 10.4 11.5 13.6 14.4 14.8All Overnight 7.8 9.1 8.2 9.0 10.8 11.5 11.8
Hotel, Motel, STVR* 4.7 5.7 5.0 5.6 7.3 7.9 8.1
Private Home 2.0 2.2 2.1 2.2 2.3 2.3 2.4
Other Overnight 1.2 1.2 1.1 1.2 1.3 1.3 1.3
Day Travel 2.7 2.4 2.3 2.5 2.8 2.9 3.0
Day Travel 2.7 2.4 2.3 2.5 2.8 2.9 3.0
Average Expenditures for Overnight Visitors, 2018p
Travel Party PersonParty Length of
Day Trip Day Trip Size Stay (Nights)
$222 $369 $90 $150Hotel, Motel, STVR* 2.5 1.7
$54 $138 $21 $54Private Home 2.6 2.6
$67 $190 $20 $58Other Overnight 3.3 2.9
$117 $256 $44 $98 All Overnight 2.7 2.2
Overnight Visitor Volume, 2016-2018p
Person-Nights (000) Party-Nights (000)
2016 2017 2018 2016 2017 2018
Hotel, Motel, STVR* 85 89 90 35 36 37
Private Home 113 113 113 44 44 44
Other Overnight 66 66 67 20 20 20
All Overnight 265 267 269 99 100 101
Person-Trips (000) Party-Trips (000)
2016 2017 2018 2016 2017 2018
Hotel, Motel, STVR* 51 54 54 21 22 22
Private Home 44 44 44 17 17 17
Other Overnight 23 23 23 7 7 7
All Overnight 118 120 121 45 46 46
"Hotel, Motel" category includes all lodging where a lodging tax is collected except campgrounds. "Other Overnight" category includes campgrounds and vacation homes.
DEAN RUNYAN ASSOCIATES Page 160
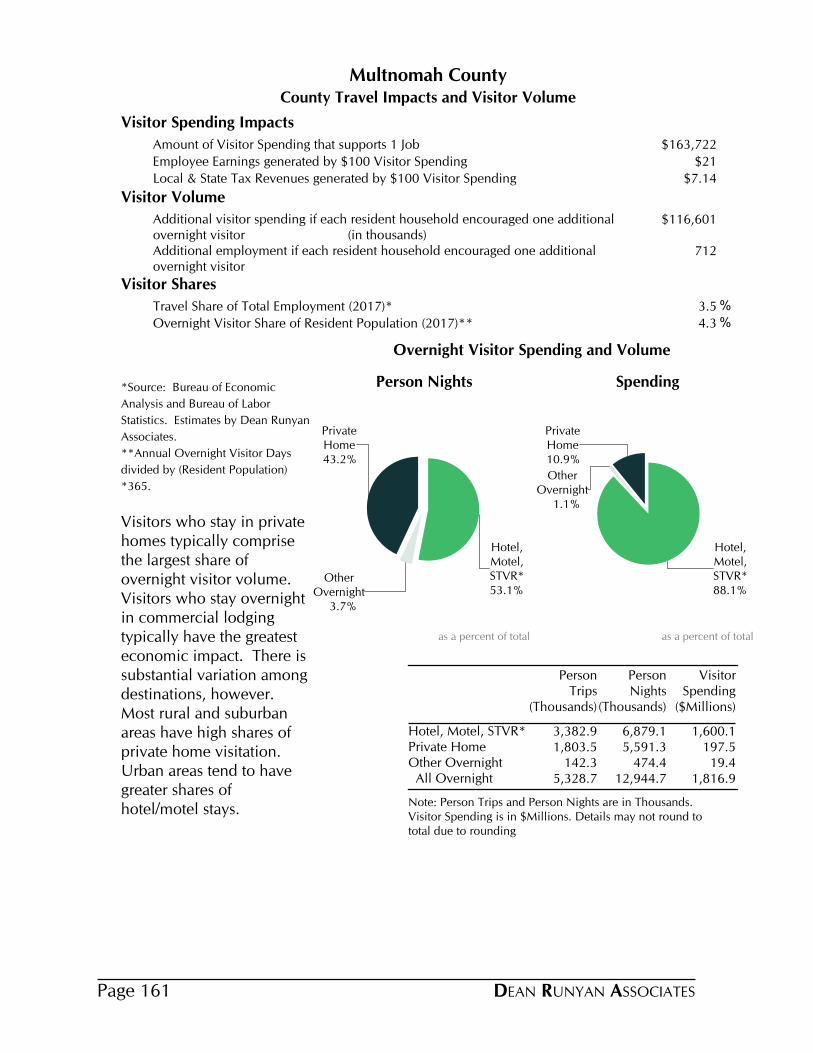
County Travel Impacts and Visitor Volume
Multnomah County
Visitor Spending Impacts
Amount of Visitor Spending that supports 1 Job $163,722
Employee Earnings generated by $100 Visitor Spending $21
Local & State Tax Revenues generated by $100 Visitor Spending $7.14
Visitor Volume
Additional visitor spending if each resident household encouraged one additional overnight visitor (in thousands)
$116,601
Additional employment if each resident household encouraged one additional overnight visitor
712
Visitor Shares
Travel Share of Total Employment (2017)* 3.5 %
Overnight Visitor Share of Resident Population (2017)** 4.3 %
*Source: Bureau of Economic
Analysis and Bureau of Labor
Statistics. Estimates by Dean Runyan
Associates.
**Annual Overnight Visitor Days
divided by (Resident Population)
*365.
Visitors who stay in private homes typically comprise the largest share of overnight visitor volume. Visitors who stay overnight in commercial lodging typically have the greatest economic impact. There is substantial variation among destinations, however. Most rural and suburban areas have high shares of private home visitation. Urban areas tend to have greater shares of hotel/motel stays.
Note: Person Trips and Person Nights are in Thousands. Visitor Spending is in $Millions. Details may not round to total due to rounding
Person Trips
(Thousands)
Person Nights
(Thousands)
Visitor Spending
($Millions)
Hotel, Motel, STVR* 3,382.9 6,879.1 1,600.1Private Home 1,803.5 5,591.3 197.5Other Overnight 142.3 474.4 19.4 All Overnight 5,328.7 12,944.7 1,816.9
53.1%
Hotel,Motel,STVR*
3.7%
OtherOvernight
43.2%
PrivateHome
Person Nights
as a percent of total
88.1%
Hotel,Motel,STVR*
1.1%
OtherOvernight
10.9%
PrivateHome
Spending
as a percent of total
Overnight Visitor Spending and Volume
DEAN RUNYAN ASSOCIATESPage 161
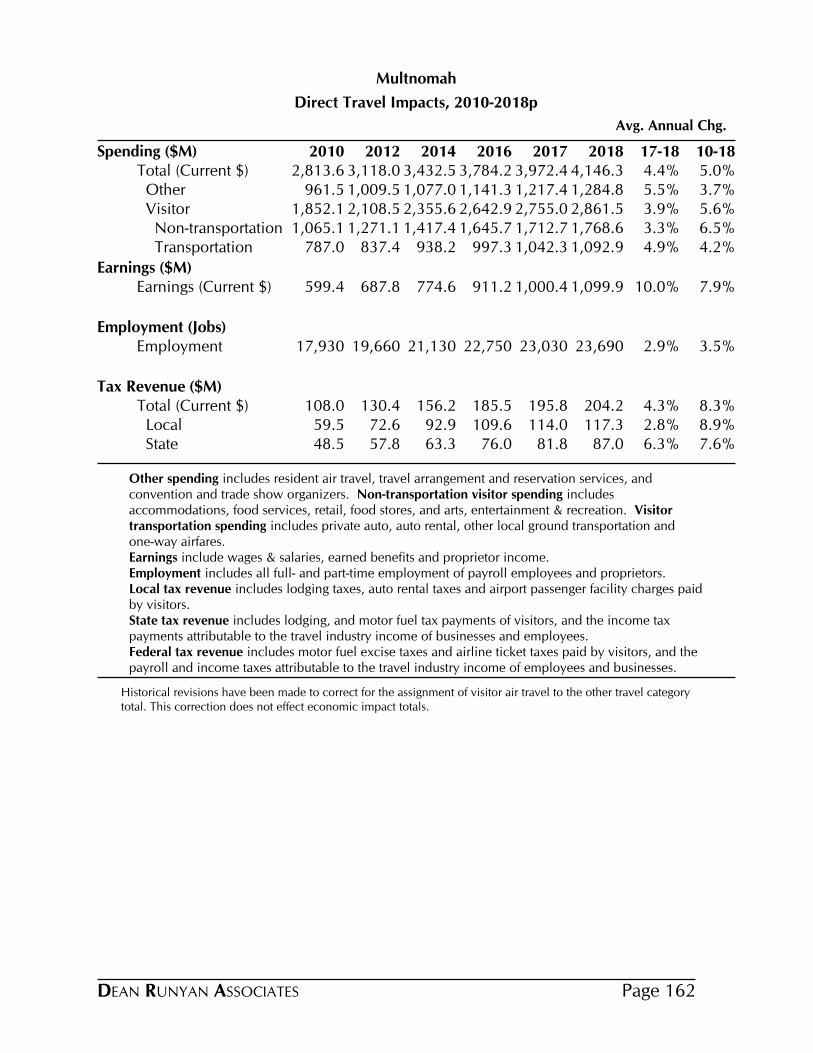
Direct Travel Impacts, 2010-2018p
Avg. Annual Chg.
Multnomah
Spending ($M) 2010 2012 2014 2016 2017 2018 17-18 10-18Total (Current $) 2,813.6 3,118.0 3,432.5 3,784.2 3,972.4 4,146.3 4.4% 5.0% Other 961.5 1,009.5 1,077.0 1,141.3 1,217.4 1,284.8 5.5% 3.7% Visitor 1,852.1 2,108.5 2,355.6 2,642.9 2,755.0 2,861.5 3.9% 5.6% Non-transportation 1,065.1 1,271.1 1,417.4 1,645.7 1,712.7 1,768.6 3.3% 6.5% Transportation 787.0 837.4 938.2 997.3 1,042.3 1,092.9 4.9% 4.2%
Earnings ($M)Earnings (Current $) 599.4 687.8 774.6 911.2 1,000.4 1,099.9 10.0% 7.9%
Employment (Jobs)Employment 17,930 19,660 21,130 22,750 23,030 23,690 2.9% 3.5%
Tax Revenue ($M)Total (Current $) 108.0 130.4 156.2 185.5 195.8 204.2 4.3% 8.3% Local 59.5 72.6 92.9 109.6 114.0 117.3 2.8% 8.9% State 48.5 57.8 63.3 76.0 81.8 87.0 6.3% 7.6%
Other spending includes resident air travel, travel arrangement and reservation services, and convention and trade show organizers. Non-transportation visitor spending includes accommodations, food services, retail, food stores, and arts, entertainment & recreation. Visitor transportation spending includes private auto, auto rental, other local ground transportation and one-way airfares.Earnings include wages & salaries, earned benefits and proprietor income.Employment includes all full- and part-time employment of payroll employees and proprietors.Local tax revenue includes lodging taxes, auto rental taxes and airport passenger facility charges paid by visitors.State tax revenue includes lodging, and motor fuel tax payments of visitors, and the income tax payments attributable to the travel industry income of businesses and employees.Federal tax revenue includes motor fuel excise taxes and airline ticket taxes paid by visitors, and the payroll and income taxes attributable to the travel industry income of employees and businesses.
Historical revisions have been made to correct for the assignment of visitor air travel to the other travel category total. This correction does not effect economic impact totals.
DEAN RUNYAN ASSOCIATES Page 162
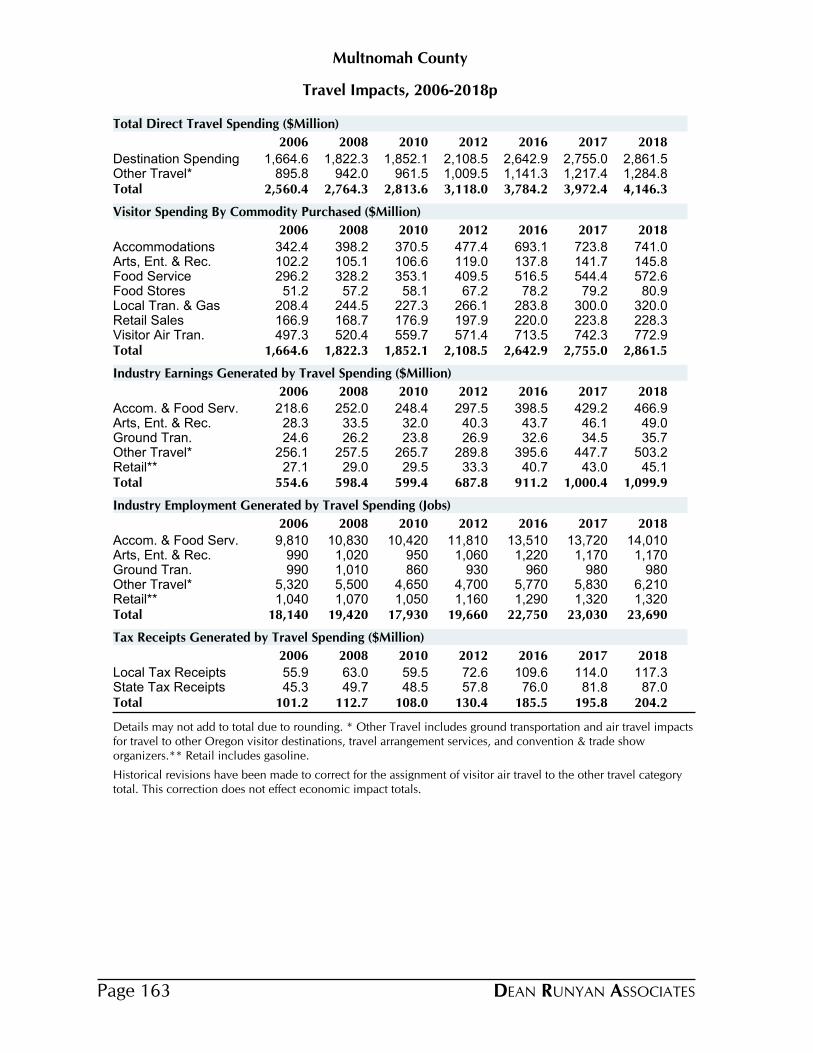
Travel Impacts, 2006-2018p
Multnomah County
2006 2008 2010 2012 2016 2017 2018
Destination Spending 1,664.6 1,822.3 1,852.1 2,108.5 2,642.9 2,755.0 2,861.5Other Travel* 895.8 942.0 961.5 1,009.5 1,141.3 1,217.4 1,284.8Total 2,560.4 2,764.3 2,813.6 3,118.0 3,784.2 3,972.4 4,146.3
Total Direct Travel Spending ($Million)
2006 2008 2010 2012 2016 2017 2018
Accommodations 342.4 398.2 370.5 477.4 693.1 723.8 741.0Arts, Ent. & Rec. 102.2 105.1 106.6 119.0 137.8 141.7 145.8Food Service 296.2 328.2 353.1 409.5 516.5 544.4 572.6Food Stores 51.2 57.2 58.1 67.2 78.2 79.2 80.9Local Tran. & Gas 208.4 244.5 227.3 266.1 283.8 300.0 320.0Retail Sales 166.9 168.7 176.9 197.9 220.0 223.8 228.3Visitor Air Tran. 497.3 520.4 559.7 571.4 713.5 742.3 772.9Total 1,664.6 1,822.3 1,852.1 2,108.5 2,642.9 2,755.0 2,861.5
Visitor Spending By Commodity Purchased ($Million)
2006 2008 2010 2012 2016 2017 2018
Accom. & Food Serv. 218.6 252.0 248.4 297.5 398.5 429.2 466.9Arts, Ent. & Rec. 28.3 33.5 32.0 40.3 43.7 46.1 49.0Ground Tran. 24.6 26.2 23.8 26.9 32.6 34.5 35.7Other Travel* 256.1 257.5 265.7 289.8 395.6 447.7 503.2Retail** 27.1 29.0 29.5 33.3 40.7 43.0 45.1Total 554.6 598.4 599.4 687.8 911.2 1,000.4 1,099.9
Industry Earnings Generated by Travel Spending ($Million)
2006 2008 2010 2012 2016 2017 2018
Accom. & Food Serv. 9,810 10,830 10,420 11,810 13,510 13,720 14,010Arts, Ent. & Rec. 990 1,020 950 1,060 1,220 1,170 1,170Ground Tran. 990 1,010 860 930 960 980 980Other Travel* 5,320 5,500 4,650 4,700 5,770 5,830 6,210Retail** 1,040 1,070 1,050 1,160 1,290 1,320 1,320Total 18,140 19,420 17,930 19,660 22,750 23,030 23,690
Industry Employment Generated by Travel Spending (Jobs)
2006 2008 2010 2012 2016 2017 2018
Local Tax Receipts 55.9 63.0 59.5 72.6 109.6 114.0 117.3State Tax Receipts 45.3 49.7 48.5 57.8 76.0 81.8 87.0Total 101.2 112.7 108.0 130.4 185.5 195.8 204.2
Tax Receipts Generated by Travel Spending ($Million)
Details may not add to total due to rounding. * Other Travel includes ground transportation and air travel impacts for travel to other Oregon visitor destinations, travel arrangement services, and convention & trade show organizers.** Retail includes gasoline.
Historical revisions have been made to correct for the assignment of visitor air travel to the other travel category total. This correction does not effect economic impact totals.
DEAN RUNYAN ASSOCIATESPage 163

County Visitor Spending and Visitor VolumeMultnomah
Visitor Spending by Type of Traveler Accommodation ($Million), 2006-2018p
2006 2008 2010 2012 2016 2017 2018
Total Destination Spending 1,167 1,302 1,292 1,537 1,929 2,013 2,089All Overnight 985 1,119 1,104 1,318 1,677 1,751 1,817
Hotel, Motel, STVR* 837 956 935 1,131 1,475 1,543 1,600
Private Home 133 148 154 171 184 190 197
Other Overnight 15 16 16 17 18 19 19
Day Travel 182 183 188 219 252 261 272
Day Travel 182 183 188 219 252 261 272
Average Expenditures for Overnight Visitors, 2018p
Travel Party PersonParty Length of
Day Trip Day Trip Size Stay (Nights)
$489 $1,020 $233 $473Hotel, Motel, STVR* 2.1 2.1
$67 $216 $35 $109Private Home 1.9 3.2
$126 $425 $41 $136Other Overnight 3.1 3.4
$285 $719 $140 $341 All Overnight 2.0 2.5
Overnight Visitor Volume, 2016-2018p
Person-Nights (000) Party-Nights (000)
2016 2017 2018 2016 2017 2018
Hotel, Motel, STVR* 6,592 6,745 6,879 3,127 3,201 3,275
Private Home 5,489 5,532 5,591 2,867 2,901 2,941
Other Overnight 472 468 474 152 151 153
All Overnight 12,553 12,745 12,945 6,146 6,253 6,369
Person-Trips (000) Party-Trips (000)
2016 2017 2018 2016 2017 2018
Hotel, Motel, STVR* 3,242 3,317 3,383 1,499 1,534 1,569
Private Home 1,771 1,784 1,804 893 902 914
Other Overnight 141 140 142 45 45 46
All Overnight 5,154 5,242 5,329 2,437 2,481 2,528
"Hotel, Motel" category includes all lodging where a lodging tax is collected except campgrounds. "Other Overnight" category includes campgrounds and vacation homes.
DEAN RUNYAN ASSOCIATES Page 164
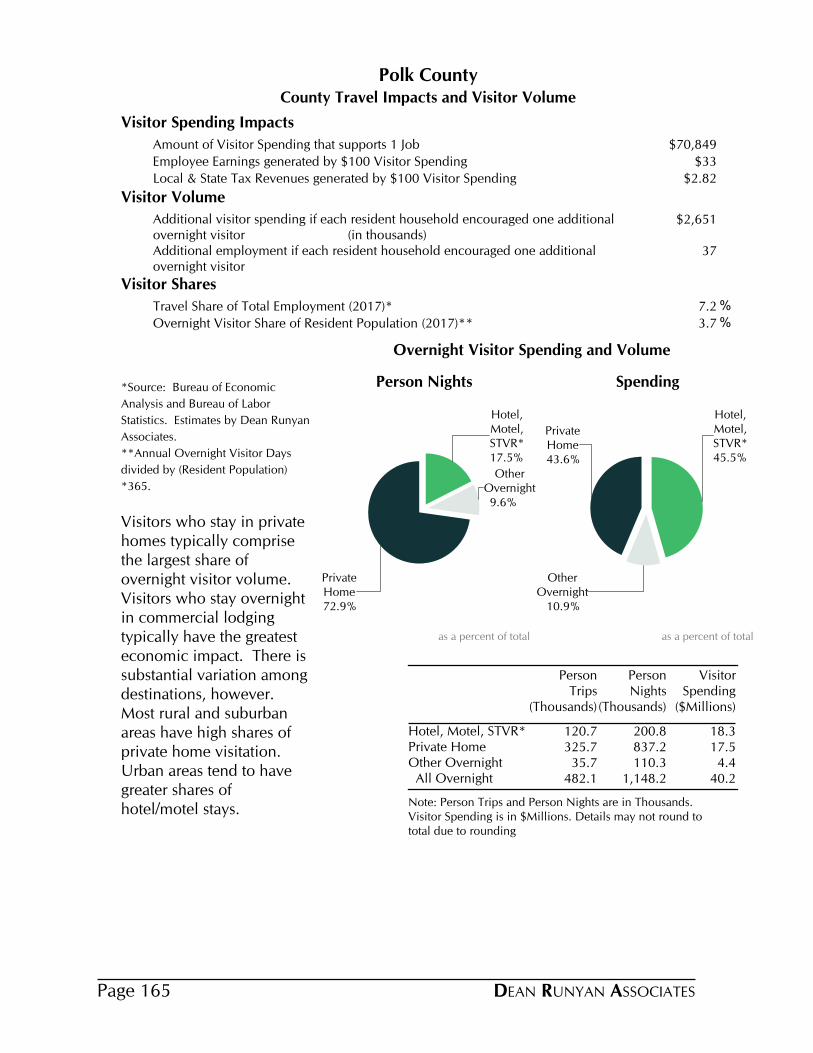
County Travel Impacts and Visitor Volume
Polk County
Visitor Spending Impacts
Amount of Visitor Spending that supports 1 Job $70,849
Employee Earnings generated by $100 Visitor Spending $33
Local & State Tax Revenues generated by $100 Visitor Spending $2.82
Visitor Volume
Additional visitor spending if each resident household encouraged one additional overnight visitor (in thousands)
$2,651
Additional employment if each resident household encouraged one additional overnight visitor
37
Visitor Shares
Travel Share of Total Employment (2017)* 7.2 %
Overnight Visitor Share of Resident Population (2017)** 3.7 %
*Source: Bureau of Economic
Analysis and Bureau of Labor
Statistics. Estimates by Dean Runyan
Associates.
**Annual Overnight Visitor Days
divided by (Resident Population)
*365.
Visitors who stay in private homes typically comprise the largest share of overnight visitor volume. Visitors who stay overnight in commercial lodging typically have the greatest economic impact. There is substantial variation among destinations, however. Most rural and suburban areas have high shares of private home visitation. Urban areas tend to have greater shares of hotel/motel stays.
Note: Person Trips and Person Nights are in Thousands. Visitor Spending is in $Millions. Details may not round to total due to rounding
Person Trips
(Thousands)
Person Nights
(Thousands)
Visitor Spending
($Millions)
Hotel, Motel, STVR* 120.7 200.8 18.3Private Home 325.7 837.2 17.5Other Overnight 35.7 110.3 4.4 All Overnight 482.1 1,148.2 40.2
17.5%
Hotel,Motel,STVR*
9.6%
OtherOvernight
72.9%
PrivateHome
Person Nights
as a percent of total
45.5%
Hotel,Motel,STVR*
10.9%
OtherOvernight
43.6%
PrivateHome
Spending
as a percent of total
Overnight Visitor Spending and Volume
DEAN RUNYAN ASSOCIATESPage 165

Direct Travel Impacts, 2010-2018p
Avg. Annual Chg.
Polk
Spending ($M) 2010 2012 2014 2016 2017 2018 17-18 10-18Total (Current $) 152.6 161.7 165.4 170.6 177.8 177.2 -0.4% 1.9% Other 10.3 12.9 12.2 9.4 10.6 11.9 11.5% 1.7% Visitor 142.3 148.9 153.2 161.2 167.2 165.4 -1.1% 1.9% Non-transportation 134.4 139.5 144.6 154.3 159.6 156.9 -1.7% 2.0% Transportation 7.9 9.3 8.6 6.9 7.6 8.4 11.0% 0.8%
Earnings ($M)Earnings (Current $) 48.3 43.2 41.8 48.5 51.3 55.6 8.5% 1.8%
Employment (Jobs)Employment 1,970 1,890 1,900 2,120 2,190 2,360 7.9% 2.3%
Tax Revenue ($M)Total (Current $) 3.7 3.7 3.7 4.1 4.5 4.7 4.6% 3.0% State 3.7 3.7 3.7 4.1 4.5 4.7 4.6% 3.0%
Other spending includes resident air travel, travel arrangement and reservation services, and convention and trade show organizers. Non-transportation visitor spending includes accommodations, food services, retail, food stores, and arts, entertainment & recreation. Visitor transportation spending includes private auto, auto rental, other local ground transportation and one-way airfares.Earnings include wages & salaries, earned benefits and proprietor income.Employment includes all full- and part-time employment of payroll employees and proprietors.Local tax revenue includes lodging taxes, auto rental taxes and airport passenger facility charges paid by visitors.State tax revenue includes lodging, and motor fuel tax payments of visitors, and the income tax payments attributable to the travel industry income of businesses and employees.Federal tax revenue includes motor fuel excise taxes and airline ticket taxes paid by visitors, and the payroll and income taxes attributable to the travel industry income of employees and businesses.
DEAN RUNYAN ASSOCIATES Page 166
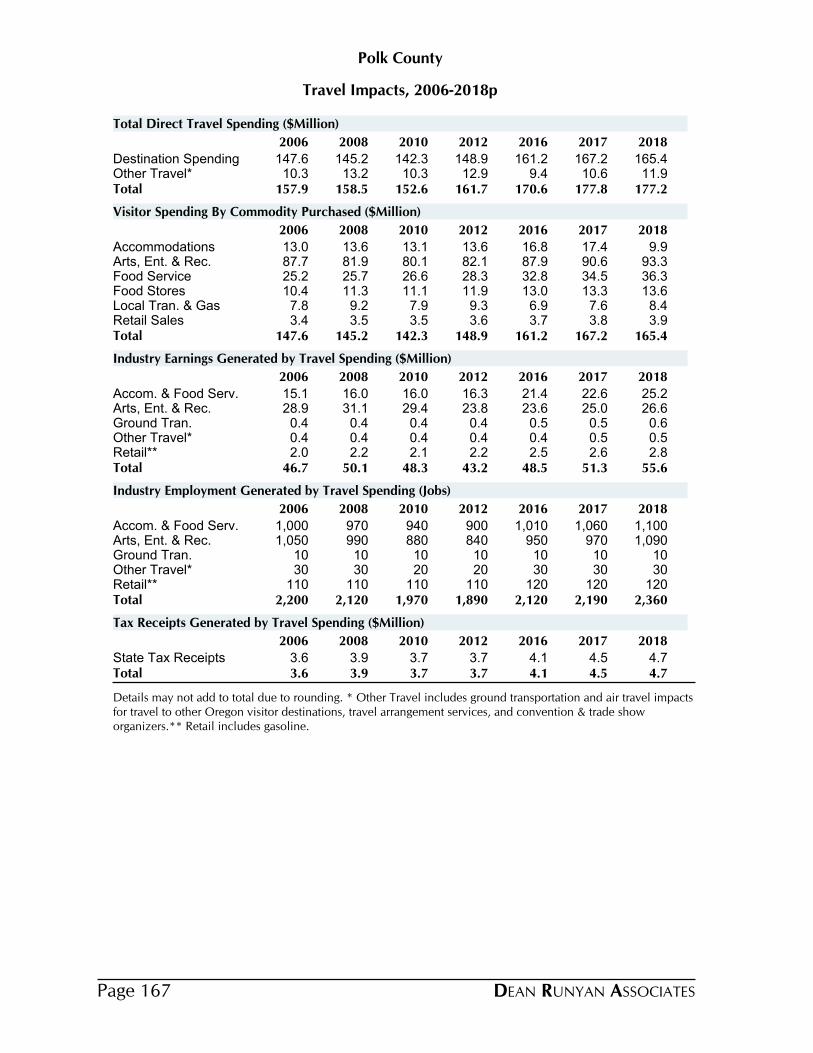
Travel Impacts, 2006-2018p
Polk County
2006 2008 2010 2012 2016 2017 2018
Destination Spending 147.6 145.2 142.3 148.9 161.2 167.2 165.4Other Travel* 10.3 13.2 10.3 12.9 9.4 10.6 11.9Total 157.9 158.5 152.6 161.7 170.6 177.8 177.2
Total Direct Travel Spending ($Million)
2006 2008 2010 2012 2016 2017 2018
Accommodations 13.0 13.6 13.1 13.6 16.8 17.4 9.9Arts, Ent. & Rec. 87.7 81.9 80.1 82.1 87.9 90.6 93.3Food Service 25.2 25.7 26.6 28.3 32.8 34.5 36.3Food Stores 10.4 11.3 11.1 11.9 13.0 13.3 13.6Local Tran. & Gas 7.8 9.2 7.9 9.3 6.9 7.6 8.4Retail Sales 3.4 3.5 3.5 3.6 3.7 3.8 3.9Total 147.6 145.2 142.3 148.9 161.2 167.2 165.4
Visitor Spending By Commodity Purchased ($Million)
2006 2008 2010 2012 2016 2017 2018
Accom. & Food Serv. 15.1 16.0 16.0 16.3 21.4 22.6 25.2Arts, Ent. & Rec. 28.9 31.1 29.4 23.8 23.6 25.0 26.6Ground Tran. 0.4 0.4 0.4 0.4 0.5 0.5 0.6Other Travel* 0.4 0.4 0.4 0.4 0.4 0.5 0.5Retail** 2.0 2.2 2.1 2.2 2.5 2.6 2.8Total 46.7 50.1 48.3 43.2 48.5 51.3 55.6
Industry Earnings Generated by Travel Spending ($Million)
2006 2008 2010 2012 2016 2017 2018
Accom. & Food Serv. 1,000 970 940 900 1,010 1,060 1,100Arts, Ent. & Rec. 1,050 990 880 840 950 970 1,090Ground Tran. 10 10 10 10 10 10 10Other Travel* 30 30 20 20 30 30 30Retail** 110 110 110 110 120 120 120Total 2,200 2,120 1,970 1,890 2,120 2,190 2,360
Industry Employment Generated by Travel Spending (Jobs)
2006 2008 2010 2012 2016 2017 2018
State Tax Receipts 3.6 3.9 3.7 3.7 4.1 4.5 4.7Total 3.6 3.9 3.7 3.7 4.1 4.5 4.7
Tax Receipts Generated by Travel Spending ($Million)
Details may not add to total due to rounding. * Other Travel includes ground transportation and air travel impacts for travel to other Oregon visitor destinations, travel arrangement services, and convention & trade show organizers.** Retail includes gasoline.
DEAN RUNYAN ASSOCIATESPage 167

County Visitor Spending and Visitor VolumePolk
Visitor Spending by Type of Traveler Accommodation ($Million), 2006-2018p
2006 2008 2010 2012 2016 2017 2018
Total Destination Spending 147.6 145.2 142.3 148.9 161.2 167.2 165.4All Overnight 36.3 39.5 38.4 40.7 44.9 46.5 40.2
Hotel, Motel, STVR* 20.7 21.4 20.7 21.7 24.8 25.4 18.3
Private Home 12.3 14.3 14.1 15.2 15.9 16.8 17.5
Other Overnight 3.3 3.8 3.6 3.7 4.2 4.2 4.4
Day Travel 111.4 105.8 103.9 108.2 116.3 120.7 125.1
Day Travel 111.4 105.8 103.9 108.2 116.3 120.7 125.1
Average Expenditures for Overnight Visitors, 2018p
Travel Party PersonParty Length of
Day Trip Day Trip Size Stay (Nights)
$224 $372 $91 $152Hotel, Motel, STVR* 2.5 1.7
$54 $138 $21 $54Private Home 2.6 2.6
$137 $422 $40 $123Other Overnight 3.4 3.1
$91 $215 $35 $83 All Overnight 2.6 2.4
Overnight Visitor Volume, 2016-2018p
Person-Nights (000) Party-Nights (000)
2016 2017 2018 2016 2017 2018
Hotel, Motel, STVR* 199 196 201 81 80 82
Private Home 793 820 837 310 321 327
Other Overnight 110 109 110 32 32 32
All Overnight 1,101 1,125 1,148 423 432 441
Person-Trips (000) Party-Trips (000)
2016 2017 2018 2016 2017 2018
Hotel, Motel, STVR* 119 118 121 49 48 49
Private Home 308 319 326 121 125 127
Other Overnight 36 35 36 10 10 10
All Overnight 463 472 482 180 183 187
"Hotel, Motel" category includes all lodging where a lodging tax is collected except campgrounds. "Other Overnight" category includes campgrounds and vacation homes.
DEAN RUNYAN ASSOCIATES Page 168

County Travel Impacts and Visitor Volume
Sherman County
Visitor Spending Impacts
Amount of Visitor Spending that supports 1 Job $90,714
Employee Earnings generated by $100 Visitor Spending $29
Local & State Tax Revenues generated by $100 Visitor Spending $3.46
Visitor Volume
Additional visitor spending if each resident household encouraged one additional overnight visitor (in thousands)
$86
Additional employment if each resident household encouraged one additional overnight visitor
1
Visitor Shares
Travel Share of Total Employment (2017)* 4.1 %
Overnight Visitor Share of Resident Population (2017)** 13.3 %
*Source: Bureau of Economic
Analysis and Bureau of Labor
Statistics. Estimates by Dean Runyan
Associates.
**Annual Overnight Visitor Days
divided by (Resident Population)
*365.
Visitors who stay in private homes typically comprise the largest share of overnight visitor volume. Visitors who stay overnight in commercial lodging typically have the greatest economic impact. There is substantial variation among destinations, however. Most rural and suburban areas have high shares of private home visitation. Urban areas tend to have greater shares of hotel/motel stays.
Note: Person Trips and Person Nights are in Thousands. Visitor Spending is in $Millions. Details may not round to total due to rounding
Person Trips
(Thousands)
Person Nights
(Thousands)
Visitor Spending
($Millions)
Hotel, Motel, STVR* 18.8 31.3 2.9Private Home 6.9 17.8 0.4Other Overnight 11.9 37.0 0.9 All Overnight 37.6 86.0 4.1
36.3%
Hotel,Motel,STVR*
43.0%
OtherOvernight
20.7%
PrivateHome
Person Nights
as a percent of total
69.4%
Hotel,Motel,STVR*
21.5%
OtherOvernight
9.1%
PrivateHome
Spending
as a percent of total
Overnight Visitor Spending and Volume
DEAN RUNYAN ASSOCIATESPage 169
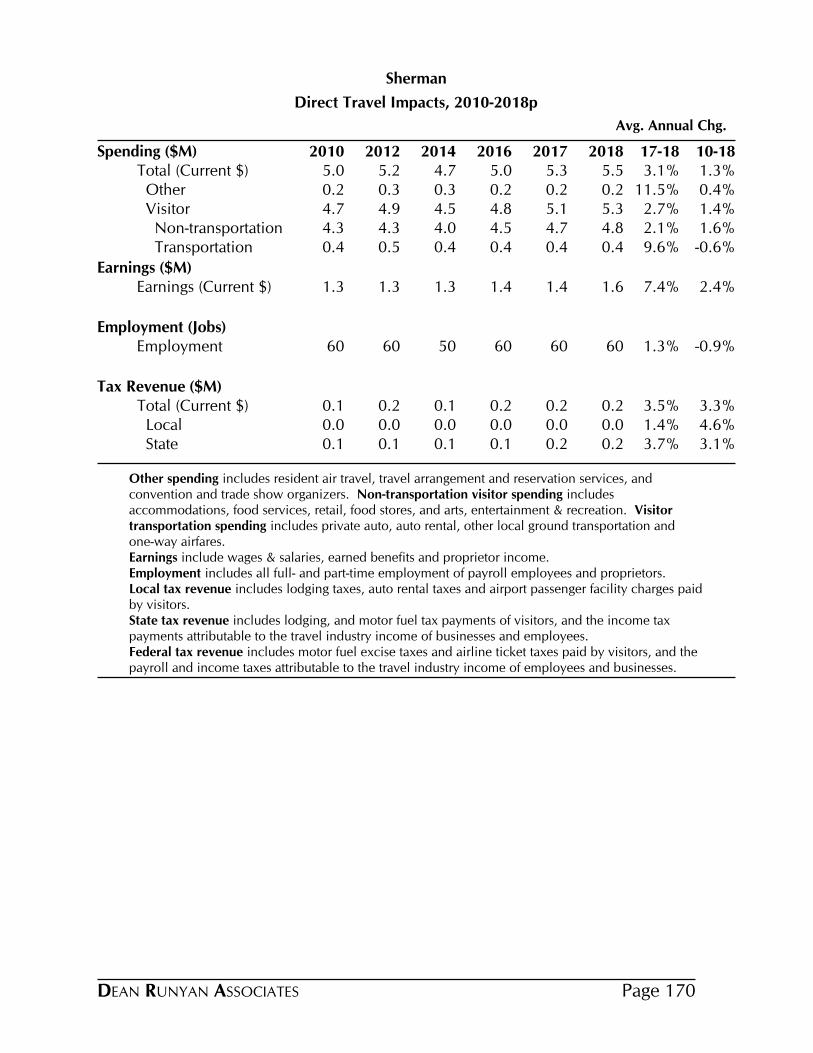
Direct Travel Impacts, 2010-2018p
Avg. Annual Chg.
Sherman
Spending ($M) 2010 2012 2014 2016 2017 2018 17-18 10-18Total (Current $) 5.0 5.2 4.7 5.0 5.3 5.5 3.1% 1.3% Other 0.2 0.3 0.3 0.2 0.2 0.2 11.5% 0.4% Visitor 4.7 4.9 4.5 4.8 5.1 5.3 2.7% 1.4% Non-transportation 4.3 4.3 4.0 4.5 4.7 4.8 2.1% 1.6% Transportation 0.4 0.5 0.4 0.4 0.4 0.4 9.6% -0.6%
Earnings ($M)Earnings (Current $) 1.3 1.3 1.3 1.4 1.4 1.6 7.4% 2.4%
Employment (Jobs)Employment 60 60 50 60 60 60 1.3% -0.9%
Tax Revenue ($M)Total (Current $) 0.1 0.2 0.1 0.2 0.2 0.2 3.5% 3.3% Local 0.0 0.0 0.0 0.0 0.0 0.0 1.4% 4.6% State 0.1 0.1 0.1 0.1 0.2 0.2 3.7% 3.1%
Other spending includes resident air travel, travel arrangement and reservation services, and convention and trade show organizers. Non-transportation visitor spending includes accommodations, food services, retail, food stores, and arts, entertainment & recreation. Visitor transportation spending includes private auto, auto rental, other local ground transportation and one-way airfares.Earnings include wages & salaries, earned benefits and proprietor income.Employment includes all full- and part-time employment of payroll employees and proprietors.Local tax revenue includes lodging taxes, auto rental taxes and airport passenger facility charges paid by visitors.State tax revenue includes lodging, and motor fuel tax payments of visitors, and the income tax payments attributable to the travel industry income of businesses and employees.Federal tax revenue includes motor fuel excise taxes and airline ticket taxes paid by visitors, and the payroll and income taxes attributable to the travel industry income of employees and businesses.
DEAN RUNYAN ASSOCIATES Page 170

Travel Impacts, 2006-2018p
Sherman County
2006 2008 2010 2012 2016 2017 2018
Destination Spending 4.3 4.7 4.7 4.9 4.8 5.1 5.3Other Travel* 0.2 0.3 0.2 0.3 0.2 0.2 0.2Total 4.6 5.0 5.0 5.2 5.0 5.3 5.5
Total Direct Travel Spending ($Million)
2006 2008 2010 2012 2016 2017 2018
Accommodations 1.0 1.3 1.3 1.3 1.4 1.5 1.6Arts, Ent. & Rec. 0.8 0.8 0.8 0.8 0.7 0.8 0.8Food Service 1.1 1.1 1.2 1.2 1.3 1.4 1.4Food Stores 0.5 0.5 0.5 0.5 0.6 0.6 0.6Local Tran. & Gas 0.4 0.5 0.4 0.5 0.4 0.4 0.4Retail Sales 0.6 0.5 0.5 0.5 0.5 0.5 0.5Total 4.3 4.7 4.7 4.9 4.8 5.1 5.3
Visitor Spending By Commodity Purchased ($Million)
2006 2008 2010 2012 2016 2017 2018
Accom. & Food Serv. 0.7 0.8 0.8 0.8 0.9 0.9 1.0Arts, Ent. & Rec. 0.2 0.2 0.2 0.2 0.2 0.2 0.2Ground Tran. 0.0 0.0 0.0 0.0 0.0 0.0 0.0Other Travel* 0.0 0.0 0.0 0.0 0.0 0.0 0.0Retail** 0.2 0.2 0.2 0.2 0.2 0.2 0.2Total 1.1 1.3 1.3 1.3 1.4 1.4 1.6
Industry Earnings Generated by Travel Spending ($Million)
2006 2008 2010 2012 2016 2017 2018
Accom. & Food Serv. 40 40 40 40 40 40 40Arts, Ent. & Rec. 10 10 10 10 10 10 10Ground Tran. 0 0 0 0 0 0 0Other Travel* 0 0 0 0 0 0 0Retail** 10 10 10 10 10 10 10Total 60 70 60 60 60 60 60
Industry Employment Generated by Travel Spending (Jobs)
2006 2008 2010 2012 2016 2017 2018
Local Tax Receipts 0.0 0.0 0.0 0.0 0.0 0.0 0.0State Tax Receipts 0.1 0.1 0.1 0.1 0.1 0.2 0.2Total 0.1 0.1 0.1 0.2 0.2 0.2 0.2
Tax Receipts Generated by Travel Spending ($Million)
Details may not add to total due to rounding. * Other Travel includes ground transportation and air travel impacts for travel to other Oregon visitor destinations, travel arrangement services, and convention & trade show organizers.** Retail includes gasoline.
DEAN RUNYAN ASSOCIATESPage 171
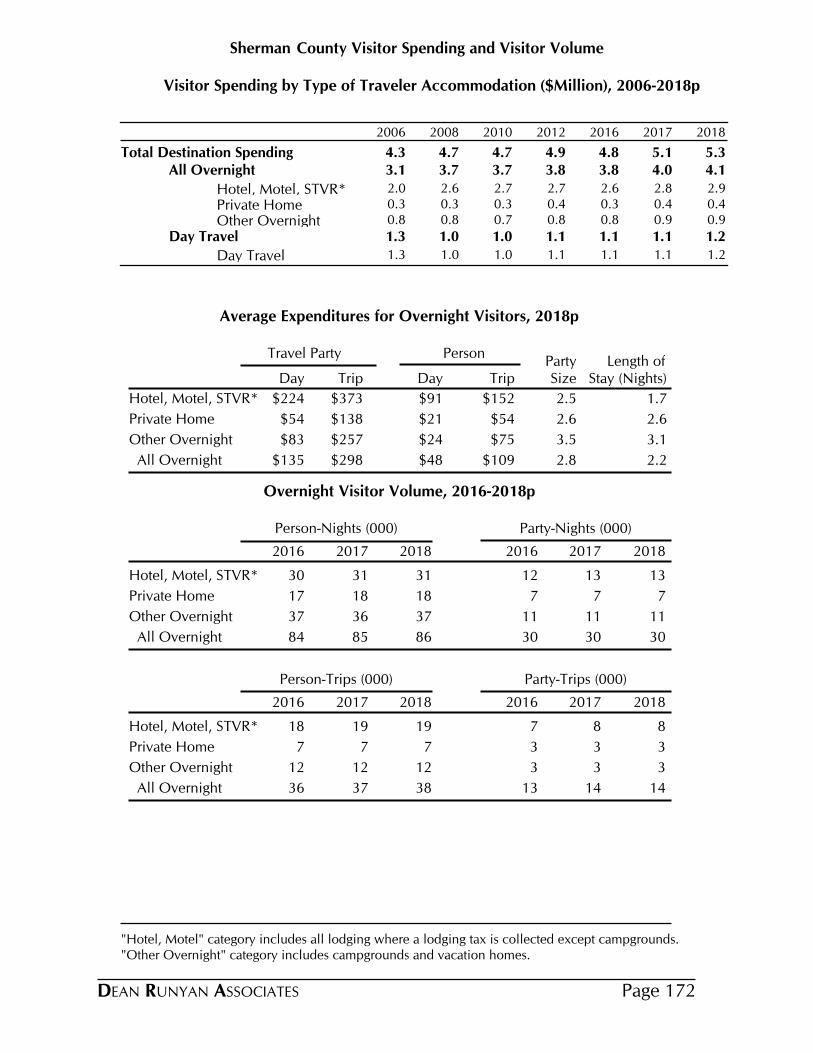
County Visitor Spending and Visitor VolumeSherman
Visitor Spending by Type of Traveler Accommodation ($Million), 2006-2018p
2006 2008 2010 2012 2016 2017 2018
Total Destination Spending 4.3 4.7 4.7 4.9 4.8 5.1 5.3All Overnight 3.1 3.7 3.7 3.8 3.8 4.0 4.1
Hotel, Motel, STVR* 2.0 2.6 2.7 2.7 2.6 2.8 2.9
Private Home 0.3 0.3 0.3 0.4 0.3 0.4 0.4
Other Overnight 0.8 0.8 0.7 0.8 0.8 0.9 0.9
Day Travel 1.3 1.0 1.0 1.1 1.1 1.1 1.2
Day Travel 1.3 1.0 1.0 1.1 1.1 1.1 1.2
Average Expenditures for Overnight Visitors, 2018p
Travel Party PersonParty Length of
Day Trip Day Trip Size Stay (Nights)
$224 $373 $91 $152Hotel, Motel, STVR* 2.5 1.7
$54 $138 $21 $54Private Home 2.6 2.6
$83 $257 $24 $75Other Overnight 3.5 3.1
$135 $298 $48 $109 All Overnight 2.8 2.2
Overnight Visitor Volume, 2016-2018p
Person-Nights (000) Party-Nights (000)
2016 2017 2018 2016 2017 2018
Hotel, Motel, STVR* 30 31 31 12 13 13
Private Home 17 18 18 7 7 7
Other Overnight 37 36 37 11 11 11
All Overnight 84 85 86 30 30 30
Person-Trips (000) Party-Trips (000)
2016 2017 2018 2016 2017 2018
Hotel, Motel, STVR* 18 19 19 7 8 8
Private Home 7 7 7 3 3 3
Other Overnight 12 12 12 3 3 3
All Overnight 36 37 38 13 14 14
"Hotel, Motel" category includes all lodging where a lodging tax is collected except campgrounds. "Other Overnight" category includes campgrounds and vacation homes.
DEAN RUNYAN ASSOCIATES Page 172
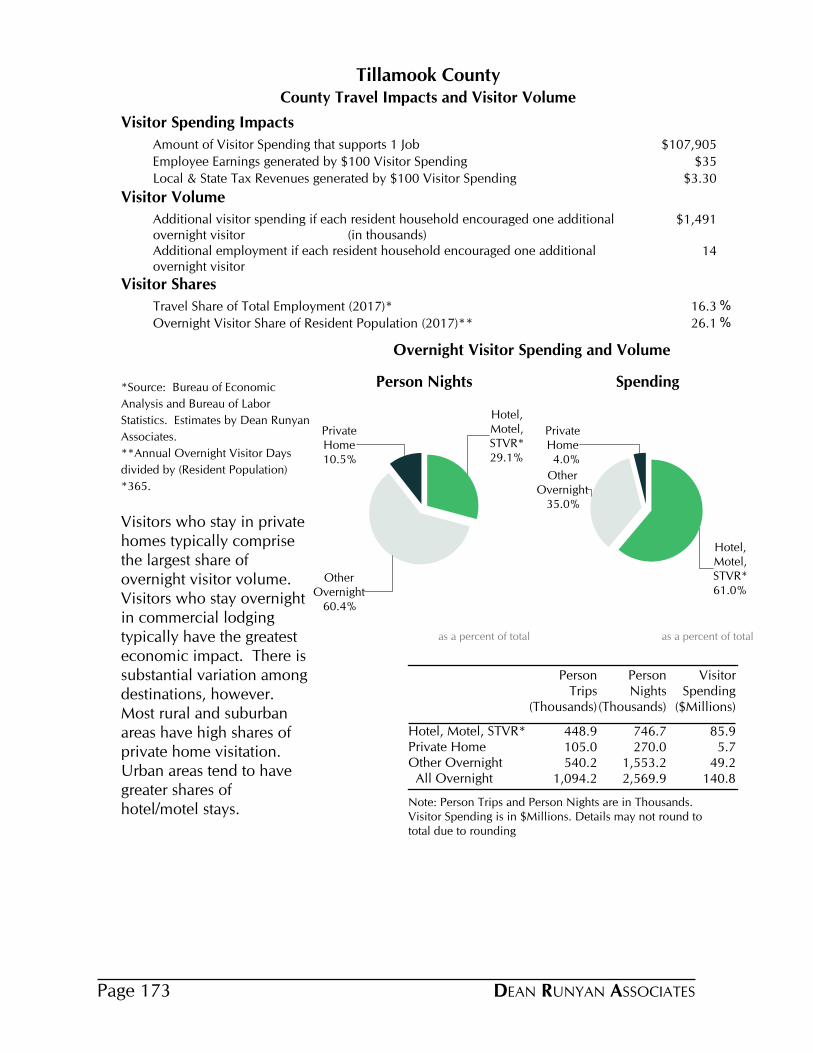
County Travel Impacts and Visitor Volume
Tillamook County
Visitor Spending Impacts
Amount of Visitor Spending that supports 1 Job $107,905
Employee Earnings generated by $100 Visitor Spending $35
Local & State Tax Revenues generated by $100 Visitor Spending $3.30
Visitor Volume
Additional visitor spending if each resident household encouraged one additional overnight visitor (in thousands)
$1,491
Additional employment if each resident household encouraged one additional overnight visitor
14
Visitor Shares
Travel Share of Total Employment (2017)* 16.3 %
Overnight Visitor Share of Resident Population (2017)** 26.1 %
*Source: Bureau of Economic
Analysis and Bureau of Labor
Statistics. Estimates by Dean Runyan
Associates.
**Annual Overnight Visitor Days
divided by (Resident Population)
*365.
Visitors who stay in private homes typically comprise the largest share of overnight visitor volume. Visitors who stay overnight in commercial lodging typically have the greatest economic impact. There is substantial variation among destinations, however. Most rural and suburban areas have high shares of private home visitation. Urban areas tend to have greater shares of hotel/motel stays.
Note: Person Trips and Person Nights are in Thousands. Visitor Spending is in $Millions. Details may not round to total due to rounding
Person Trips
(Thousands)
Person Nights
(Thousands)
Visitor Spending
($Millions)
Hotel, Motel, STVR* 448.9 746.7 85.9Private Home 105.0 270.0 5.7Other Overnight 540.2 1,553.2 49.2 All Overnight 1,094.2 2,569.9 140.8
29.1%
Hotel,Motel,STVR*
60.4%
OtherOvernight
10.5%
PrivateHome
Person Nights
as a percent of total
61.0%
Hotel,Motel,STVR*
35.0%
OtherOvernight
4.0%
PrivateHome
Spending
as a percent of total
Overnight Visitor Spending and Volume
DEAN RUNYAN ASSOCIATESPage 173

Direct Travel Impacts, 2010-2018p
Avg. Annual Chg.
Tillamook
Spending ($M) 2010 2012 2014 2016 2017 2018 17-18 10-18Total (Current $) 186.2 199.4 220.9 227.4 232.7 240.1 3.1% 3.2% Other 3.4 4.3 3.9 3.0 3.4 3.8 11.5% 1.2% Visitor 182.8 195.1 216.9 224.4 229.3 236.3 3.0% 3.3% Non-transportation 167.6 177.1 199.1 210.6 214.4 219.8 2.6% 3.5% Transportation 15.2 18.0 17.8 13.8 15.0 16.4 9.7% 1.0%
Earnings ($M)Earnings (Current $) 55.0 57.0 66.1 72.3 77.3 82.6 7.0% 5.2%
Employment (Jobs)Employment 2,100 1,960 2,150 2,190 2,210 2,200 -0.6% 0.6%
Tax Revenue ($M)Total (Current $) 5.1 5.6 6.3 7.0 7.5 7.8 3.8% 5.4% Local 1.0 1.1 1.3 1.5 1.6 1.7 2.9% 6.2% State 4.1 4.5 4.9 5.5 5.9 6.1 4.0% 5.2%
Other spending includes resident air travel, travel arrangement and reservation services, and convention and trade show organizers. Non-transportation visitor spending includes accommodations, food services, retail, food stores, and arts, entertainment & recreation. Visitor transportation spending includes private auto, auto rental, other local ground transportation and one-way airfares.Earnings include wages & salaries, earned benefits and proprietor income.Employment includes all full- and part-time employment of payroll employees and proprietors.Local tax revenue includes lodging taxes, auto rental taxes and airport passenger facility charges paid by visitors.State tax revenue includes lodging, and motor fuel tax payments of visitors, and the income tax payments attributable to the travel industry income of businesses and employees.Federal tax revenue includes motor fuel excise taxes and airline ticket taxes paid by visitors, and the payroll and income taxes attributable to the travel industry income of employees and businesses.
DEAN RUNYAN ASSOCIATES Page 174
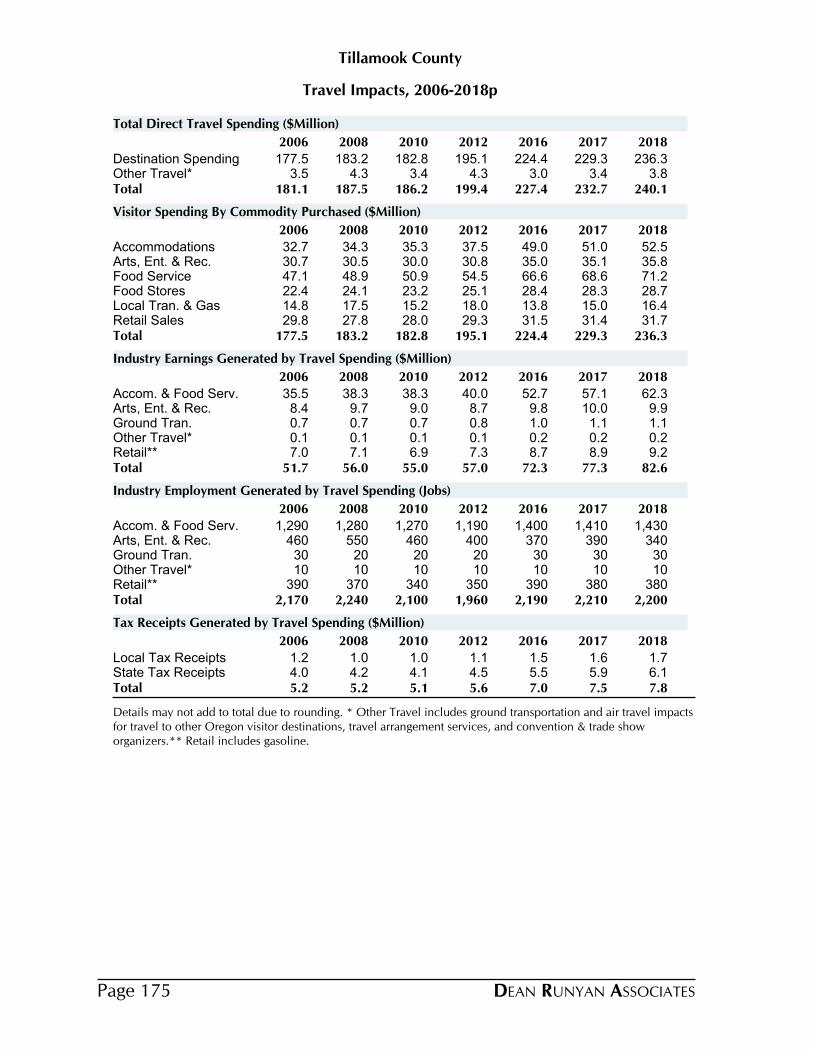
Travel Impacts, 2006-2018p
Tillamook County
2006 2008 2010 2012 2016 2017 2018
Destination Spending 177.5 183.2 182.8 195.1 224.4 229.3 236.3Other Travel* 3.5 4.3 3.4 4.3 3.0 3.4 3.8Total 181.1 187.5 186.2 199.4 227.4 232.7 240.1
Total Direct Travel Spending ($Million)
2006 2008 2010 2012 2016 2017 2018
Accommodations 32.7 34.3 35.3 37.5 49.0 51.0 52.5Arts, Ent. & Rec. 30.7 30.5 30.0 30.8 35.0 35.1 35.8Food Service 47.1 48.9 50.9 54.5 66.6 68.6 71.2Food Stores 22.4 24.1 23.2 25.1 28.4 28.3 28.7Local Tran. & Gas 14.8 17.5 15.2 18.0 13.8 15.0 16.4Retail Sales 29.8 27.8 28.0 29.3 31.5 31.4 31.7Total 177.5 183.2 182.8 195.1 224.4 229.3 236.3
Visitor Spending By Commodity Purchased ($Million)
2006 2008 2010 2012 2016 2017 2018
Accom. & Food Serv. 35.5 38.3 38.3 40.0 52.7 57.1 62.3Arts, Ent. & Rec. 8.4 9.7 9.0 8.7 9.8 10.0 9.9Ground Tran. 0.7 0.7 0.7 0.8 1.0 1.1 1.1Other Travel* 0.1 0.1 0.1 0.1 0.2 0.2 0.2Retail** 7.0 7.1 6.9 7.3 8.7 8.9 9.2Total 51.7 56.0 55.0 57.0 72.3 77.3 82.6
Industry Earnings Generated by Travel Spending ($Million)
2006 2008 2010 2012 2016 2017 2018
Accom. & Food Serv. 1,290 1,280 1,270 1,190 1,400 1,410 1,430Arts, Ent. & Rec. 460 550 460 400 370 390 340Ground Tran. 30 20 20 20 30 30 30Other Travel* 10 10 10 10 10 10 10Retail** 390 370 340 350 390 380 380Total 2,170 2,240 2,100 1,960 2,190 2,210 2,200
Industry Employment Generated by Travel Spending (Jobs)
2006 2008 2010 2012 2016 2017 2018
Local Tax Receipts 1.2 1.0 1.0 1.1 1.5 1.6 1.7State Tax Receipts 4.0 4.2 4.1 4.5 5.5 5.9 6.1Total 5.2 5.2 5.1 5.6 7.0 7.5 7.8
Tax Receipts Generated by Travel Spending ($Million)
Details may not add to total due to rounding. * Other Travel includes ground transportation and air travel impacts for travel to other Oregon visitor destinations, travel arrangement services, and convention & trade show organizers.** Retail includes gasoline.
DEAN RUNYAN ASSOCIATESPage 175

County Visitor Spending and Visitor VolumeTillamook
Visitor Spending by Type of Traveler Accommodation ($Million), 2006-2018p
2006 2008 2010 2012 2016 2017 2018
Total Destination Spending 177.5 183.2 182.8 195.1 224.4 229.3 236.3All Overnight 98.1 107.1 107.0 113.0 133.3 136.5 140.8
Hotel, Motel, STVR* 53.9 59.9 62.2 65.2 81.2 83.3 85.9
Private Home 4.4 4.7 4.7 5.2 5.1 5.4 5.7
Other Overnight 39.8 42.5 40.1 42.6 47.0 47.7 49.2
Day Travel 79.5 76.1 75.7 82.1 91.1 92.8 95.5
Day Travel 79.5 76.1 75.7 82.1 91.1 92.8 95.5
Average Expenditures for Overnight Visitors, 2018p
Travel Party PersonParty Length of
Day Trip Day Trip Size Stay (Nights)
$282 $470 $115 $191Hotel, Motel, STVR* 2.5 1.7
$54 $138 $21 $54Private Home 2.6 2.6
$105 $300 $32 $91Other Overnight 3.3 2.9
$160 $363 $55 $129 All Overnight 2.9 2.3
Overnight Visitor Volume, 2016-2018p
Person-Nights (000) Party-Nights (000)
2016 2017 2018 2016 2017 2018
Hotel, Motel, STVR* 751 740 747 306 302 304
Private Home 255 265 270 100 104 106
Other Overnight 1,543 1,543 1,553 466 467 469
All Overnight 2,549 2,549 2,570 872 872 879
Person-Trips (000) Party-Trips (000)
2016 2017 2018 2016 2017 2018
Hotel, Motel, STVR* 452 445 449 184 181 183
Private Home 99 103 105 39 40 41
Other Overnight 536 538 540 163 164 164
All Overnight 1,087 1,086 1,094 386 385 388
"Hotel, Motel" category includes all lodging where a lodging tax is collected except campgrounds. "Other Overnight" category includes campgrounds and vacation homes.
DEAN RUNYAN ASSOCIATES Page 176
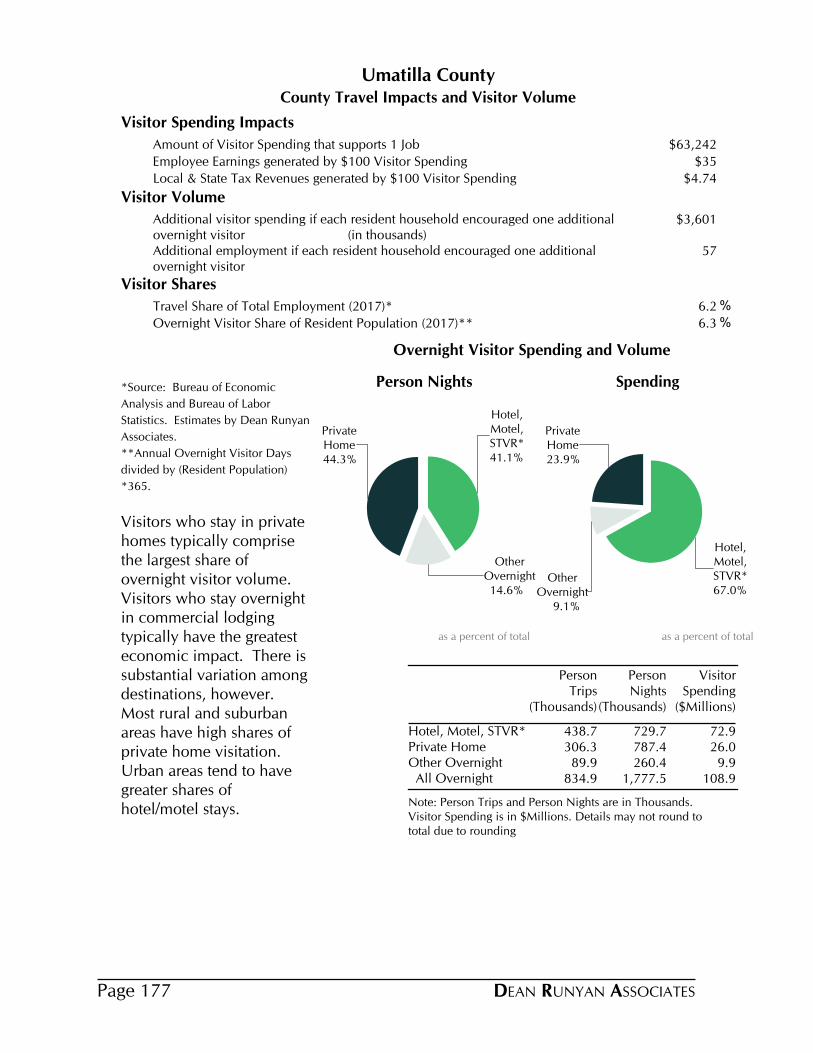
County Travel Impacts and Visitor Volume
Umatilla County
Visitor Spending Impacts
Amount of Visitor Spending that supports 1 Job $63,242
Employee Earnings generated by $100 Visitor Spending $35
Local & State Tax Revenues generated by $100 Visitor Spending $4.74
Visitor Volume
Additional visitor spending if each resident household encouraged one additional overnight visitor (in thousands)
$3,601
Additional employment if each resident household encouraged one additional overnight visitor
57
Visitor Shares
Travel Share of Total Employment (2017)* 6.2 %
Overnight Visitor Share of Resident Population (2017)** 6.3 %
*Source: Bureau of Economic
Analysis and Bureau of Labor
Statistics. Estimates by Dean Runyan
Associates.
**Annual Overnight Visitor Days
divided by (Resident Population)
*365.
Visitors who stay in private homes typically comprise the largest share of overnight visitor volume. Visitors who stay overnight in commercial lodging typically have the greatest economic impact. There is substantial variation among destinations, however. Most rural and suburban areas have high shares of private home visitation. Urban areas tend to have greater shares of hotel/motel stays.
Note: Person Trips and Person Nights are in Thousands. Visitor Spending is in $Millions. Details may not round to total due to rounding
Person Trips
(Thousands)
Person Nights
(Thousands)
Visitor Spending
($Millions)
Hotel, Motel, STVR* 438.7 729.7 72.9Private Home 306.3 787.4 26.0Other Overnight 89.9 260.4 9.9 All Overnight 834.9 1,777.5 108.9
41.1%
Hotel,Motel,STVR*
14.6%
OtherOvernight
44.3%
PrivateHome
Person Nights
as a percent of total
67.0%
Hotel,Motel,STVR*
9.1%
OtherOvernight
23.9%
PrivateHome
Spending
as a percent of total
Overnight Visitor Spending and Volume
DEAN RUNYAN ASSOCIATESPage 177

Direct Travel Impacts, 2010-2018p
Avg. Annual Chg.
Umatilla
Spending ($M) 2010 2012 2014 2016 2017 2018 17-18 10-18Total (Current $) 133.6 140.3 148.0 146.6 162.0 168.3 3.9% 2.9% Other 11.7 13.4 12.7 9.6 11.8 13.0 10.5% 1.3% Visitor 121.9 126.9 135.4 137.0 150.2 155.3 3.4% 3.1% Non-transportation 106.5 109.1 118.0 124.0 134.7 137.8 2.3% 3.3% Transportation 15.4 17.8 17.4 13.0 15.5 17.5 12.5% 1.6%
Earnings ($M)Earnings (Current $) 36.0 41.9 45.1 49.6 52.5 56.2 7.1% 5.7%
Employment (Jobs)Employment 2,030 2,190 2,290 2,430 2,480 2,520 1.6% 2.7%
Tax Revenue ($M)Total (Current $) 4.9 5.5 5.8 6.3 7.1 7.4 3.8% 5.3% Local 1.2 1.2 1.4 1.5 1.8 1.8 4.0% 5.2% State 3.7 4.3 4.4 4.8 5.3 5.5 3.7% 5.3%
Other spending includes resident air travel, travel arrangement and reservation services, and convention and trade show organizers. Non-transportation visitor spending includes accommodations, food services, retail, food stores, and arts, entertainment & recreation. Visitor transportation spending includes private auto, auto rental, other local ground transportation and one-way airfares.Earnings include wages & salaries, earned benefits and proprietor income.Employment includes all full- and part-time employment of payroll employees and proprietors.Local tax revenue includes lodging taxes, auto rental taxes and airport passenger facility charges paid by visitors.State tax revenue includes lodging, and motor fuel tax payments of visitors, and the income tax payments attributable to the travel industry income of businesses and employees.Federal tax revenue includes motor fuel excise taxes and airline ticket taxes paid by visitors, and the payroll and income taxes attributable to the travel industry income of employees and businesses.
Historical revisions have been made to correct for the assignment of visitor air travel to the other travel category total. This correction does not effect economic impact totals.
DEAN RUNYAN ASSOCIATES Page 178
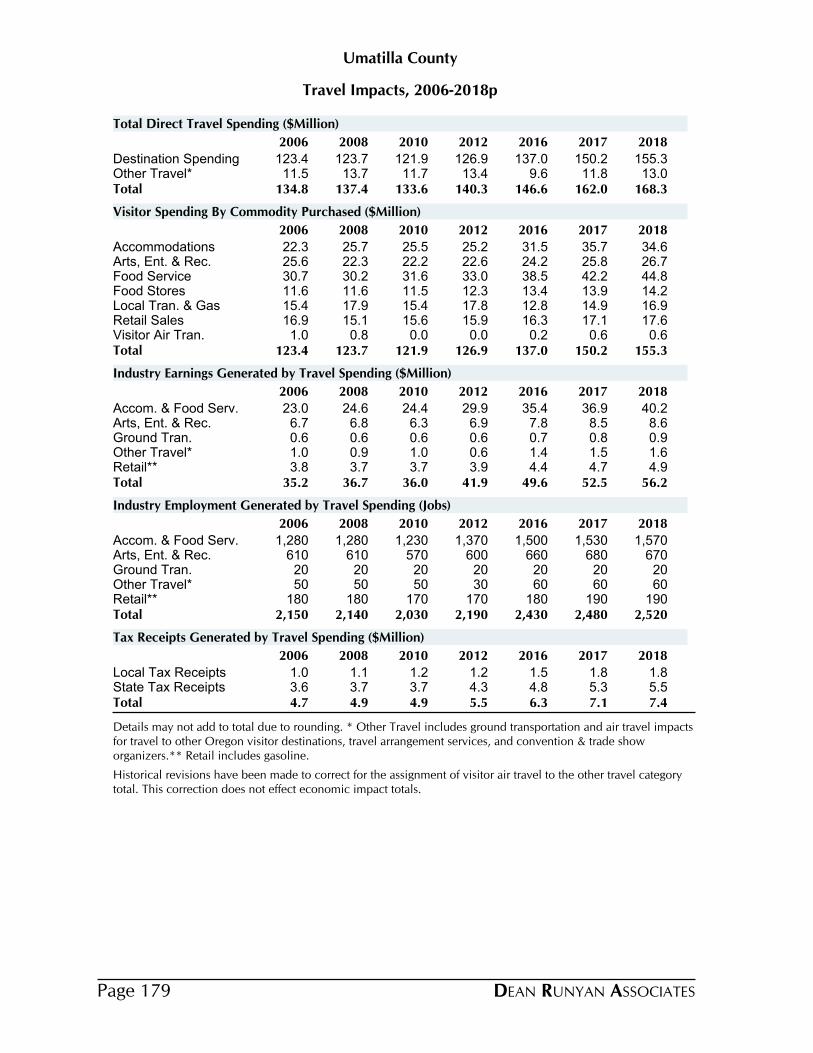
Travel Impacts, 2006-2018p
Umatilla County
2006 2008 2010 2012 2016 2017 2018
Destination Spending 123.4 123.7 121.9 126.9 137.0 150.2 155.3Other Travel* 11.5 13.7 11.7 13.4 9.6 11.8 13.0Total 134.8 137.4 133.6 140.3 146.6 162.0 168.3
Total Direct Travel Spending ($Million)
2006 2008 2010 2012 2016 2017 2018
Accommodations 22.3 25.7 25.5 25.2 31.5 35.7 34.6Arts, Ent. & Rec. 25.6 22.3 22.2 22.6 24.2 25.8 26.7Food Service 30.7 30.2 31.6 33.0 38.5 42.2 44.8Food Stores 11.6 11.6 11.5 12.3 13.4 13.9 14.2Local Tran. & Gas 15.4 17.9 15.4 17.8 12.8 14.9 16.9Retail Sales 16.9 15.1 15.6 15.9 16.3 17.1 17.6Visitor Air Tran. 1.0 0.8 0.0 0.0 0.2 0.6 0.6Total 123.4 123.7 121.9 126.9 137.0 150.2 155.3
Visitor Spending By Commodity Purchased ($Million)
2006 2008 2010 2012 2016 2017 2018
Accom. & Food Serv. 23.0 24.6 24.4 29.9 35.4 36.9 40.2Arts, Ent. & Rec. 6.7 6.8 6.3 6.9 7.8 8.5 8.6Ground Tran. 0.6 0.6 0.6 0.6 0.7 0.8 0.9Other Travel* 1.0 0.9 1.0 0.6 1.4 1.5 1.6Retail** 3.8 3.7 3.7 3.9 4.4 4.7 4.9Total 35.2 36.7 36.0 41.9 49.6 52.5 56.2
Industry Earnings Generated by Travel Spending ($Million)
2006 2008 2010 2012 2016 2017 2018
Accom. & Food Serv. 1,280 1,280 1,230 1,370 1,500 1,530 1,570Arts, Ent. & Rec. 610 610 570 600 660 680 670Ground Tran. 20 20 20 20 20 20 20Other Travel* 50 50 50 30 60 60 60Retail** 180 180 170 170 180 190 190Total 2,150 2,140 2,030 2,190 2,430 2,480 2,520
Industry Employment Generated by Travel Spending (Jobs)
2006 2008 2010 2012 2016 2017 2018
Local Tax Receipts 1.0 1.1 1.2 1.2 1.5 1.8 1.8State Tax Receipts 3.6 3.7 3.7 4.3 4.8 5.3 5.5Total 4.7 4.9 4.9 5.5 6.3 7.1 7.4
Tax Receipts Generated by Travel Spending ($Million)
Details may not add to total due to rounding. * Other Travel includes ground transportation and air travel impacts for travel to other Oregon visitor destinations, travel arrangement services, and convention & trade show organizers.** Retail includes gasoline.
Historical revisions have been made to correct for the assignment of visitor air travel to the other travel category total. This correction does not effect economic impact totals.
DEAN RUNYAN ASSOCIATESPage 179

County Visitor Spending and Visitor VolumeUmatilla
Visitor Spending by Type of Traveler Accommodation ($Million), 2006-2018p
2006 2008 2010 2012 2016 2017 2018
Total Destination Spending 122.4 122.9 121.9 126.9 136.8 149.6 154.7All Overnight 79.0 87.0 85.8 88.5 95.9 105.7 108.9
Hotel, Motel, STVR* 50.2 56.9 55.3 56.0 62.4 70.7 72.9
Private Home 20.3 21.5 22.4 23.8 24.0 25.4 26.0
Other Overnight 8.6 8.6 8.1 8.7 9.5 9.6 9.9
Day Travel 43.4 35.9 36.1 38.4 40.9 43.9 45.8
Day Travel 43.4 35.9 36.1 38.4 40.9 43.9 45.8
Average Expenditures for Overnight Visitors, 2018p
Travel Party PersonParty Length of
Day Trip Day Trip Size Stay (Nights)
$245 $408 $100 $166Hotel, Motel, STVR* 2.5 1.7
$85 $217 $33 $85Private Home 2.6 2.6
$127 $365 $38 $111Other Overnight 3.3 2.9
$159 $334 $61 $130 All Overnight 2.6 2.1
Overnight Visitor Volume, 2016-2018p
Person-Nights (000) Party-Nights (000)
2016 2017 2018 2016 2017 2018
Hotel, Motel, STVR* 636 693 730 259 282 297
Private Home 757 785 787 296 307 308
Other Overnight 259 257 260 78 77 78
All Overnight 1,651 1,735 1,778 633 667 684
Person-Trips (000) Party-Trips (000)
2016 2017 2018 2016 2017 2018
Hotel, Motel, STVR* 382 416 439 156 170 179
Private Home 294 305 306 115 119 120
Other Overnight 89 89 90 27 27 27
All Overnight 766 811 835 298 316 326
"Hotel, Motel" category includes all lodging where a lodging tax is collected except campgrounds. "Other Overnight" category includes campgrounds and vacation homes.
DEAN RUNYAN ASSOCIATES Page 180

County Travel Impacts and Visitor Volume
Union County
Visitor Spending Impacts
Amount of Visitor Spending that supports 1 Job $50,182
Employee Earnings generated by $100 Visitor Spending $43
Local & State Tax Revenues generated by $100 Visitor Spending $5.65
Visitor Volume
Additional visitor spending if each resident household encouraged one additional overnight visitor (in thousands)
$1,158
Additional employment if each resident household encouraged one additional overnight visitor
23
Visitor Shares
Travel Share of Total Employment (2017)* 4.3 %
Overnight Visitor Share of Resident Population (2017)** 5.9 %
*Source: Bureau of Economic
Analysis and Bureau of Labor
Statistics. Estimates by Dean Runyan
Associates.
**Annual Overnight Visitor Days
divided by (Resident Population)
*365.
Visitors who stay in private homes typically comprise the largest share of overnight visitor volume. Visitors who stay overnight in commercial lodging typically have the greatest economic impact. There is substantial variation among destinations, however. Most rural and suburban areas have high shares of private home visitation. Urban areas tend to have greater shares of hotel/motel stays.
Note: Person Trips and Person Nights are in Thousands. Visitor Spending is in $Millions. Details may not round to total due to rounding
Person Trips
(Thousands)
Person Nights
(Thousands)
Visitor Spending
($Millions)
Hotel, Motel, STVR* 88.2 146.7 14.1Private Home 103.4 265.7 5.6Other Overnight 52.6 162.2 6.5 All Overnight 244.1 574.6 26.1
25.5%
Hotel,Motel,STVR*
28.2%
OtherOvernight
46.2%
PrivateHome
Person Nights
as a percent of total
53.8%
Hotel,Motel,STVR*
24.9%
OtherOvernight
21.3%
PrivateHome
Spending
as a percent of total
Overnight Visitor Spending and Volume
DEAN RUNYAN ASSOCIATESPage 181

Direct Travel Impacts, 2010-2018p
Avg. Annual Chg.
Union
Spending ($M) 2010 2012 2014 2016 2017 2018 17-18 10-18Total (Current $) 29.3 31.8 33.0 33.3 35.2 36.6 3.9% 2.8% Other 3.5 4.4 4.0 3.0 3.3 3.7 11.5% 0.7% Visitor 25.8 27.5 29.0 30.3 31.9 32.8 3.1% 3.1% Non-transportation 23.3 24.5 26.3 28.1 29.4 30.2 2.5% 3.3% Transportation 2.5 2.9 2.7 2.2 2.4 2.7 9.9% 0.9%
Earnings ($M)Earnings (Current $) 9.3 9.5 10.5 11.8 12.3 14.3 16.1% 5.5%
Employment (Jobs)Employment 540 550 570 600 620 670 8.2% 2.8%
Tax Revenue ($M)Total (Current $) 1.2 1.4 1.5 1.6 1.8 1.9 4.8% 5.9% Local 0.3 0.4 0.5 0.6 0.6 0.6 1.6% 7.4% State 0.8 0.9 1.0 1.1 1.2 1.2 6.4% 5.2%
Other spending includes resident air travel, travel arrangement and reservation services, and convention and trade show organizers. Non-transportation visitor spending includes accommodations, food services, retail, food stores, and arts, entertainment & recreation. Visitor transportation spending includes private auto, auto rental, other local ground transportation and one-way airfares.Earnings include wages & salaries, earned benefits and proprietor income.Employment includes all full- and part-time employment of payroll employees and proprietors.Local tax revenue includes lodging taxes, auto rental taxes and airport passenger facility charges paid by visitors.State tax revenue includes lodging, and motor fuel tax payments of visitors, and the income tax payments attributable to the travel industry income of businesses and employees.Federal tax revenue includes motor fuel excise taxes and airline ticket taxes paid by visitors, and the payroll and income taxes attributable to the travel industry income of employees and businesses.
DEAN RUNYAN ASSOCIATES Page 182

Travel Impacts, 2006-2018p
Union County
2006 2008 2010 2012 2016 2017 2018
Destination Spending 28.9 27.8 25.8 27.5 30.3 31.9 32.8Other Travel* 3.5 4.3 3.5 4.4 3.0 3.3 3.7Total 32.4 32.1 29.3 31.8 33.3 35.2 36.6
Total Direct Travel Spending ($Million)
2006 2008 2010 2012 2016 2017 2018
Accommodations 6.1 6.3 5.7 5.8 7.4 8.0 8.2Arts, Ent. & Rec. 4.9 4.3 3.9 4.0 4.4 4.5 4.6Food Service 7.3 6.8 6.7 7.2 8.4 8.8 9.2Food Stores 3.9 4.0 3.8 4.1 4.5 4.5 4.6Local Tran. & Gas 2.7 3.0 2.5 2.9 2.2 2.4 2.7Retail Sales 4.0 3.3 3.2 3.4 3.5 3.6 3.6Total 28.9 27.8 25.8 27.5 30.3 31.9 32.8
Visitor Spending By Commodity Purchased ($Million)
2006 2008 2010 2012 2016 2017 2018
Accom. & Food Serv. 6.9 6.9 6.8 6.9 8.4 8.7 10.3Arts, Ent. & Rec. 1.5 1.6 1.3 1.3 1.9 2.0 2.3Ground Tran. 0.2 0.1 0.1 0.1 0.2 0.2 0.2Other Travel* 0.1 0.1 0.1 0.1 0.2 0.2 0.2Retail** 1.0 1.0 0.9 1.0 1.1 1.2 1.2Total 9.8 9.7 9.3 9.5 11.8 12.3 14.3
Industry Earnings Generated by Travel Spending ($Million)
2006 2008 2010 2012 2016 2017 2018
Accom. & Food Serv. 350 350 340 330 360 360 390Arts, Ent. & Rec. 190 160 140 160 180 190 210Ground Tran. 10 0 0 0 0 10 0Other Travel* 10 10 10 10 10 10 10Retail** 50 50 50 50 50 50 50Total 600 570 540 550 600 620 670
Industry Employment Generated by Travel Spending (Jobs)
2006 2008 2010 2012 2016 2017 2018
Local Tax Receipts 0.4 0.4 0.3 0.4 0.6 0.6 0.6State Tax Receipts 0.9 0.9 0.8 0.9 1.1 1.2 1.2Total 1.3 1.3 1.2 1.4 1.6 1.8 1.9
Tax Receipts Generated by Travel Spending ($Million)
Details may not add to total due to rounding. * Other Travel includes ground transportation and air travel impacts for travel to other Oregon visitor destinations, travel arrangement services, and convention & trade show organizers.** Retail includes gasoline.
DEAN RUNYAN ASSOCIATESPage 183

County Visitor Spending and Visitor VolumeUnion
Visitor Spending by Type of Traveler Accommodation ($Million), 2006-2018p
2006 2008 2010 2012 2016 2017 2018
Total Destination Spending 28.9 27.8 25.8 27.5 30.3 31.9 32.8All Overnight 21.9 22.2 20.4 21.5 24.0 25.3 26.1
Hotel, Motel, STVR* 12.1 11.9 10.6 10.8 12.6 13.7 14.1
Private Home 4.3 4.6 4.7 5.2 5.2 5.4 5.6
Other Overnight 5.5 5.7 5.2 5.5 6.2 6.3 6.5
Day Travel 7.1 5.6 5.4 5.9 6.3 6.5 6.7
Day Travel 7.1 5.6 5.4 5.9 6.3 6.5 6.7
Average Expenditures for Overnight Visitors, 2018p
Travel Party PersonParty Length of
Day Trip Day Trip Size Stay (Nights)
$235 $391 $96 $159Hotel, Motel, STVR* 2.5 1.7
$54 $138 $21 $54Private Home 2.6 2.6
$138 $424 $40 $124Other Overnight 3.4 3.1
$124 $285 $45 $107 All Overnight 2.7 2.3
Overnight Visitor Volume, 2016-2018p
Person-Nights (000) Party-Nights (000)
2016 2017 2018 2016 2017 2018
Hotel, Motel, STVR* 138 144 147 56 59 60
Private Home 260 264 266 102 103 104
Other Overnight 162 159 162 47 46 47
All Overnight 560 568 575 205 209 211
Person-Trips (000) Party-Trips (000)
2016 2017 2018 2016 2017 2018
Hotel, Motel, STVR* 83 87 88 34 35 36
Private Home 101 103 103 40 40 40
Other Overnight 52 52 53 15 15 15
All Overnight 237 241 244 89 91 92
"Hotel, Motel" category includes all lodging where a lodging tax is collected except campgrounds. "Other Overnight" category includes campgrounds and vacation homes.
DEAN RUNYAN ASSOCIATES Page 184
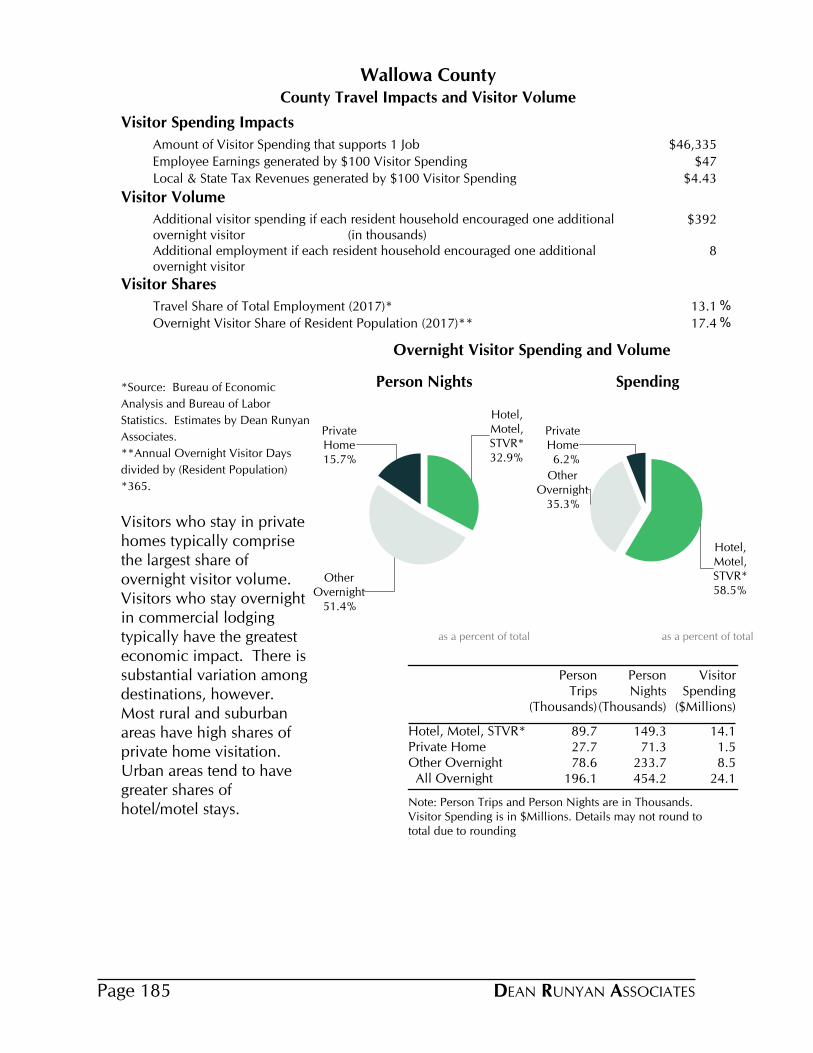
County Travel Impacts and Visitor Volume
Wallowa County
Visitor Spending Impacts
Amount of Visitor Spending that supports 1 Job $46,335
Employee Earnings generated by $100 Visitor Spending $47
Local & State Tax Revenues generated by $100 Visitor Spending $4.43
Visitor Volume
Additional visitor spending if each resident household encouraged one additional overnight visitor (in thousands)
$392
Additional employment if each resident household encouraged one additional overnight visitor
8
Visitor Shares
Travel Share of Total Employment (2017)* 13.1 %
Overnight Visitor Share of Resident Population (2017)** 17.4 %
*Source: Bureau of Economic
Analysis and Bureau of Labor
Statistics. Estimates by Dean Runyan
Associates.
**Annual Overnight Visitor Days
divided by (Resident Population)
*365.
Visitors who stay in private homes typically comprise the largest share of overnight visitor volume. Visitors who stay overnight in commercial lodging typically have the greatest economic impact. There is substantial variation among destinations, however. Most rural and suburban areas have high shares of private home visitation. Urban areas tend to have greater shares of hotel/motel stays.
Note: Person Trips and Person Nights are in Thousands. Visitor Spending is in $Millions. Details may not round to total due to rounding
Person Trips
(Thousands)
Person Nights
(Thousands)
Visitor Spending
($Millions)
Hotel, Motel, STVR* 89.7 149.3 14.1Private Home 27.7 71.3 1.5Other Overnight 78.6 233.7 8.5 All Overnight 196.1 454.2 24.1
32.9%
Hotel,Motel,STVR*
51.4%
OtherOvernight
15.7%
PrivateHome
Person Nights
as a percent of total
58.5%
Hotel,Motel,STVR*
35.3%
OtherOvernight
6.2%
PrivateHome
Spending
as a percent of total
Overnight Visitor Spending and Volume
DEAN RUNYAN ASSOCIATESPage 185

Direct Travel Impacts, 2010-2018p
Avg. Annual Chg.
Wallowa
Spending ($M) 2010 2012 2014 2016 2017 2018 17-18 10-18Total (Current $) 25.7 26.7 27.6 29.3 30.9 31.8 3.0% 2.7% Other 1.0 1.1 1.1 0.8 0.9 1.0 11.5% 0.5% Visitor 24.7 25.5 26.5 28.5 30.0 30.8 2.7% 2.8% Non-transportation 22.6 23.1 24.2 26.7 27.9 28.6 2.2% 3.0% Transportation 2.1 2.5 2.3 1.9 2.0 2.2 9.6% 0.6%
Earnings ($M)Earnings (Current $) 8.4 9.1 10.5 12.7 12.8 14.4 12.7% 7.0%
Employment (Jobs)Employment 490 520 550 590 630 670 5.4% 4.0%
Tax Revenue ($M)Total (Current $) 0.9 0.9 1.0 1.2 1.3 1.4 5.7% 5.5% Local 0.3 0.3 0.3 0.4 0.4 0.4 1.4% 3.9% State 0.6 0.7 0.7 0.9 0.9 1.0 7.6% 6.2%
Other spending includes resident air travel, travel arrangement and reservation services, and convention and trade show organizers. Non-transportation visitor spending includes accommodations, food services, retail, food stores, and arts, entertainment & recreation. Visitor transportation spending includes private auto, auto rental, other local ground transportation and one-way airfares.Earnings include wages & salaries, earned benefits and proprietor income.Employment includes all full- and part-time employment of payroll employees and proprietors.Local tax revenue includes lodging taxes, auto rental taxes and airport passenger facility charges paid by visitors.State tax revenue includes lodging, and motor fuel tax payments of visitors, and the income tax payments attributable to the travel industry income of businesses and employees.Federal tax revenue includes motor fuel excise taxes and airline ticket taxes paid by visitors, and the payroll and income taxes attributable to the travel industry income of employees and businesses.
DEAN RUNYAN ASSOCIATES Page 186
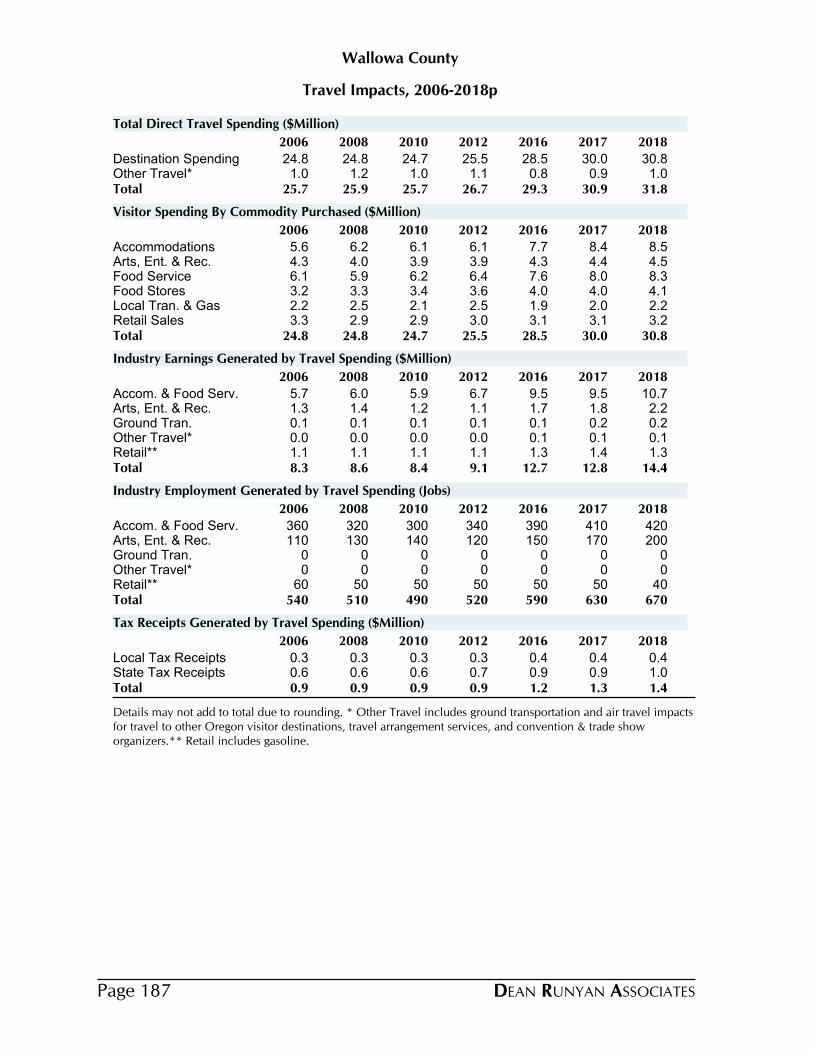
Travel Impacts, 2006-2018p
Wallowa County
2006 2008 2010 2012 2016 2017 2018
Destination Spending 24.8 24.8 24.7 25.5 28.5 30.0 30.8Other Travel* 1.0 1.2 1.0 1.1 0.8 0.9 1.0Total 25.7 25.9 25.7 26.7 29.3 30.9 31.8
Total Direct Travel Spending ($Million)
2006 2008 2010 2012 2016 2017 2018
Accommodations 5.6 6.2 6.1 6.1 7.7 8.4 8.5Arts, Ent. & Rec. 4.3 4.0 3.9 3.9 4.3 4.4 4.5Food Service 6.1 5.9 6.2 6.4 7.6 8.0 8.3Food Stores 3.2 3.3 3.4 3.6 4.0 4.0 4.1Local Tran. & Gas 2.2 2.5 2.1 2.5 1.9 2.0 2.2Retail Sales 3.3 2.9 2.9 3.0 3.1 3.1 3.2Total 24.8 24.8 24.7 25.5 28.5 30.0 30.8
Visitor Spending By Commodity Purchased ($Million)
2006 2008 2010 2012 2016 2017 2018
Accom. & Food Serv. 5.7 6.0 5.9 6.7 9.5 9.5 10.7Arts, Ent. & Rec. 1.3 1.4 1.2 1.1 1.7 1.8 2.2Ground Tran. 0.1 0.1 0.1 0.1 0.1 0.2 0.2Other Travel* 0.0 0.0 0.0 0.0 0.1 0.1 0.1Retail** 1.1 1.1 1.1 1.1 1.3 1.4 1.3Total 8.3 8.6 8.4 9.1 12.7 12.8 14.4
Industry Earnings Generated by Travel Spending ($Million)
2006 2008 2010 2012 2016 2017 2018
Accom. & Food Serv. 360 320 300 340 390 410 420Arts, Ent. & Rec. 110 130 140 120 150 170 200Ground Tran. 0 0 0 0 0 0 0Other Travel* 0 0 0 0 0 0 0Retail** 60 50 50 50 50 50 40Total 540 510 490 520 590 630 670
Industry Employment Generated by Travel Spending (Jobs)
2006 2008 2010 2012 2016 2017 2018
Local Tax Receipts 0.3 0.3 0.3 0.3 0.4 0.4 0.4State Tax Receipts 0.6 0.6 0.6 0.7 0.9 0.9 1.0Total 0.9 0.9 0.9 0.9 1.2 1.3 1.4
Tax Receipts Generated by Travel Spending ($Million)
Details may not add to total due to rounding. * Other Travel includes ground transportation and air travel impacts for travel to other Oregon visitor destinations, travel arrangement services, and convention & trade show organizers.** Retail includes gasoline.
DEAN RUNYAN ASSOCIATESPage 187

County Visitor Spending and Visitor VolumeWallowa
Visitor Spending by Type of Traveler Accommodation ($Million), 2006-2018p
2006 2008 2010 2012 2016 2017 2018
Total Destination Spending 24.8 24.8 24.7 25.5 28.5 30.0 30.8All Overnight 18.2 19.3 19.2 19.7 22.2 23.4 24.1
Hotel, Motel, STVR* 10.7 11.4 11.0 11.0 12.7 13.8 14.1
Private Home 1.2 1.3 1.3 1.4 1.4 1.5 1.5
Other Overnight 6.3 6.6 6.9 7.3 8.1 8.2 8.5
Day Travel 6.6 5.5 5.5 5.8 6.3 6.5 6.7
Day Travel 6.6 5.5 5.5 5.8 6.3 6.5 6.7
Average Expenditures for Overnight Visitors, 2018p
Travel Party PersonParty Length of
Day Trip Day Trip Size Stay (Nights)
$232 $385 $94 $157Hotel, Motel, STVR* 2.5 1.7
$54 $138 $21 $54Private Home 2.6 2.6
$122 $362 $36 $108Other Overnight 3.4 3.0
$152 $340 $53 $123 All Overnight 2.9 2.2
Overnight Visitor Volume, 2016-2018p
Person-Nights (000) Party-Nights (000)
2016 2017 2018 2016 2017 2018
Hotel, Motel, STVR* 142 148 149 58 60 61
Private Home 70 71 71 27 28 28
Other Overnight 232 231 234 69 68 69
All Overnight 444 450 454 154 157 158
Person-Trips (000) Party-Trips (000)
2016 2017 2018 2016 2017 2018
Hotel, Motel, STVR* 85 89 90 35 36 37
Private Home 27 28 28 11 11 11
Other Overnight 78 78 79 23 23 23
All Overnight 191 195 196 69 70 71
"Hotel, Motel" category includes all lodging where a lodging tax is collected except campgrounds. "Other Overnight" category includes campgrounds and vacation homes.
DEAN RUNYAN ASSOCIATES Page 188
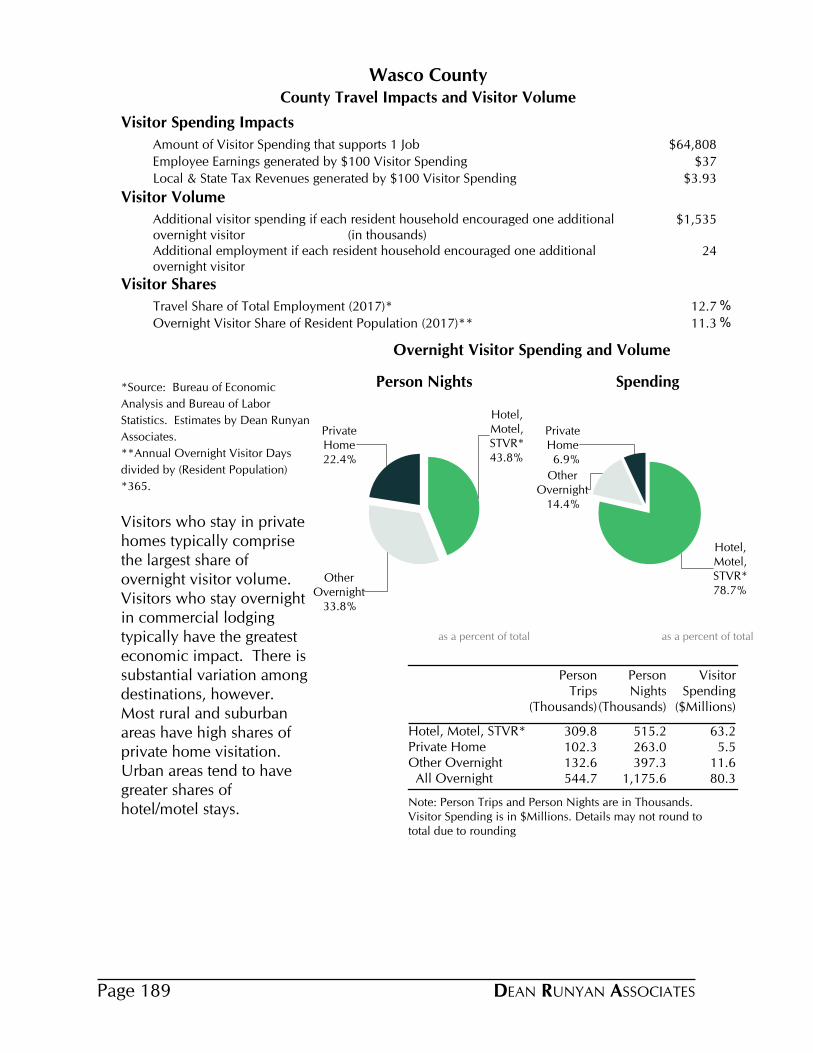
County Travel Impacts and Visitor Volume
Wasco County
Visitor Spending Impacts
Amount of Visitor Spending that supports 1 Job $64,808
Employee Earnings generated by $100 Visitor Spending $37
Local & State Tax Revenues generated by $100 Visitor Spending $3.93
Visitor Volume
Additional visitor spending if each resident household encouraged one additional overnight visitor (in thousands)
$1,535
Additional employment if each resident household encouraged one additional overnight visitor
24
Visitor Shares
Travel Share of Total Employment (2017)* 12.7 %
Overnight Visitor Share of Resident Population (2017)** 11.3 %
*Source: Bureau of Economic
Analysis and Bureau of Labor
Statistics. Estimates by Dean Runyan
Associates.
**Annual Overnight Visitor Days
divided by (Resident Population)
*365.
Visitors who stay in private homes typically comprise the largest share of overnight visitor volume. Visitors who stay overnight in commercial lodging typically have the greatest economic impact. There is substantial variation among destinations, however. Most rural and suburban areas have high shares of private home visitation. Urban areas tend to have greater shares of hotel/motel stays.
Note: Person Trips and Person Nights are in Thousands. Visitor Spending is in $Millions. Details may not round to total due to rounding
Person Trips
(Thousands)
Person Nights
(Thousands)
Visitor Spending
($Millions)
Hotel, Motel, STVR* 309.8 515.2 63.2Private Home 102.3 263.0 5.5Other Overnight 132.6 397.3 11.6 All Overnight 544.7 1,175.6 80.3
43.8%
Hotel,Motel,STVR*
33.8%
OtherOvernight
22.4%
PrivateHome
Person Nights
as a percent of total
78.7%
Hotel,Motel,STVR*
14.4%
OtherOvernight
6.9%
PrivateHome
Spending
as a percent of total
Overnight Visitor Spending and Volume
DEAN RUNYAN ASSOCIATESPage 189

Direct Travel Impacts, 2010-2018p
Avg. Annual Chg.
Wasco
Spending ($M) 2010 2012 2014 2016 2017 2018 17-18 10-18Total (Current $) 90.0 91.1 102.2 115.1 122.3 121.8 -0.4% 3.9% Other 3.4 4.3 4.0 3.0 3.4 3.7 11.5% 1.0% Visitor 86.5 86.8 98.2 112.1 119.0 118.0 -0.8% 4.0% Non-transportation 79.8 79.2 90.7 105.7 111.8 110.3 -1.3% 4.1% Transportation 6.8 7.6 7.5 6.4 7.2 7.7 7.6% 1.7%
Earnings ($M)Earnings (Current $) 26.8 27.1 33.3 39.9 42.7 44.2 3.3% 6.5%
Employment (Jobs)Employment 1,400 1,430 1,590 1,810 1,880 1,830 -2.5% 3.4%
Tax Revenue ($M)Total (Current $) 2.7 2.8 3.4 4.3 4.7 4.6 -0.9% 7.0% Local 0.7 0.7 0.9 1.2 1.3 1.2 -5.1% 7.8% State 2.0 2.2 2.6 3.1 3.4 3.4 0.6% 6.7%
Other spending includes resident air travel, travel arrangement and reservation services, and convention and trade show organizers. Non-transportation visitor spending includes accommodations, food services, retail, food stores, and arts, entertainment & recreation. Visitor transportation spending includes private auto, auto rental, other local ground transportation and one-way airfares.Earnings include wages & salaries, earned benefits and proprietor income.Employment includes all full- and part-time employment of payroll employees and proprietors.Local tax revenue includes lodging taxes, auto rental taxes and airport passenger facility charges paid by visitors.State tax revenue includes lodging, and motor fuel tax payments of visitors, and the income tax payments attributable to the travel industry income of businesses and employees.Federal tax revenue includes motor fuel excise taxes and airline ticket taxes paid by visitors, and the payroll and income taxes attributable to the travel industry income of employees and businesses.
DEAN RUNYAN ASSOCIATES Page 190
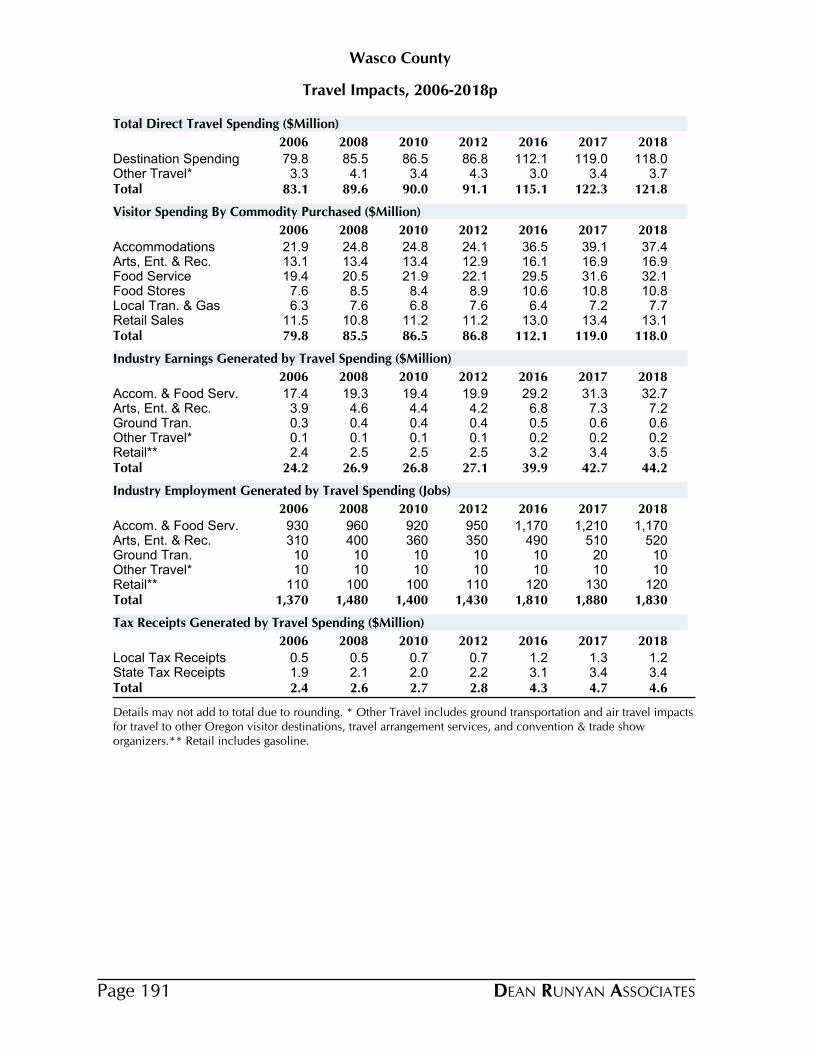
Travel Impacts, 2006-2018p
Wasco County
2006 2008 2010 2012 2016 2017 2018
Destination Spending 79.8 85.5 86.5 86.8 112.1 119.0 118.0Other Travel* 3.3 4.1 3.4 4.3 3.0 3.4 3.7Total 83.1 89.6 90.0 91.1 115.1 122.3 121.8
Total Direct Travel Spending ($Million)
2006 2008 2010 2012 2016 2017 2018
Accommodations 21.9 24.8 24.8 24.1 36.5 39.1 37.4Arts, Ent. & Rec. 13.1 13.4 13.4 12.9 16.1 16.9 16.9Food Service 19.4 20.5 21.9 22.1 29.5 31.6 32.1Food Stores 7.6 8.5 8.4 8.9 10.6 10.8 10.8Local Tran. & Gas 6.3 7.6 6.8 7.6 6.4 7.2 7.7Retail Sales 11.5 10.8 11.2 11.2 13.0 13.4 13.1Total 79.8 85.5 86.5 86.8 112.1 119.0 118.0
Visitor Spending By Commodity Purchased ($Million)
2006 2008 2010 2012 2016 2017 2018
Accom. & Food Serv. 17.4 19.3 19.4 19.9 29.2 31.3 32.7Arts, Ent. & Rec. 3.9 4.6 4.4 4.2 6.8 7.3 7.2Ground Tran. 0.3 0.4 0.4 0.4 0.5 0.6 0.6Other Travel* 0.1 0.1 0.1 0.1 0.2 0.2 0.2Retail** 2.4 2.5 2.5 2.5 3.2 3.4 3.5Total 24.2 26.9 26.8 27.1 39.9 42.7 44.2
Industry Earnings Generated by Travel Spending ($Million)
2006 2008 2010 2012 2016 2017 2018
Accom. & Food Serv. 930 960 920 950 1,170 1,210 1,170Arts, Ent. & Rec. 310 400 360 350 490 510 520Ground Tran. 10 10 10 10 10 20 10Other Travel* 10 10 10 10 10 10 10Retail** 110 100 100 110 120 130 120Total 1,370 1,480 1,400 1,430 1,810 1,880 1,830
Industry Employment Generated by Travel Spending (Jobs)
2006 2008 2010 2012 2016 2017 2018
Local Tax Receipts 0.5 0.5 0.7 0.7 1.2 1.3 1.2State Tax Receipts 1.9 2.1 2.0 2.2 3.1 3.4 3.4Total 2.4 2.6 2.7 2.8 4.3 4.7 4.6
Tax Receipts Generated by Travel Spending ($Million)
Details may not add to total due to rounding. * Other Travel includes ground transportation and air travel impacts for travel to other Oregon visitor destinations, travel arrangement services, and convention & trade show organizers.** Retail includes gasoline.
DEAN RUNYAN ASSOCIATESPage 191
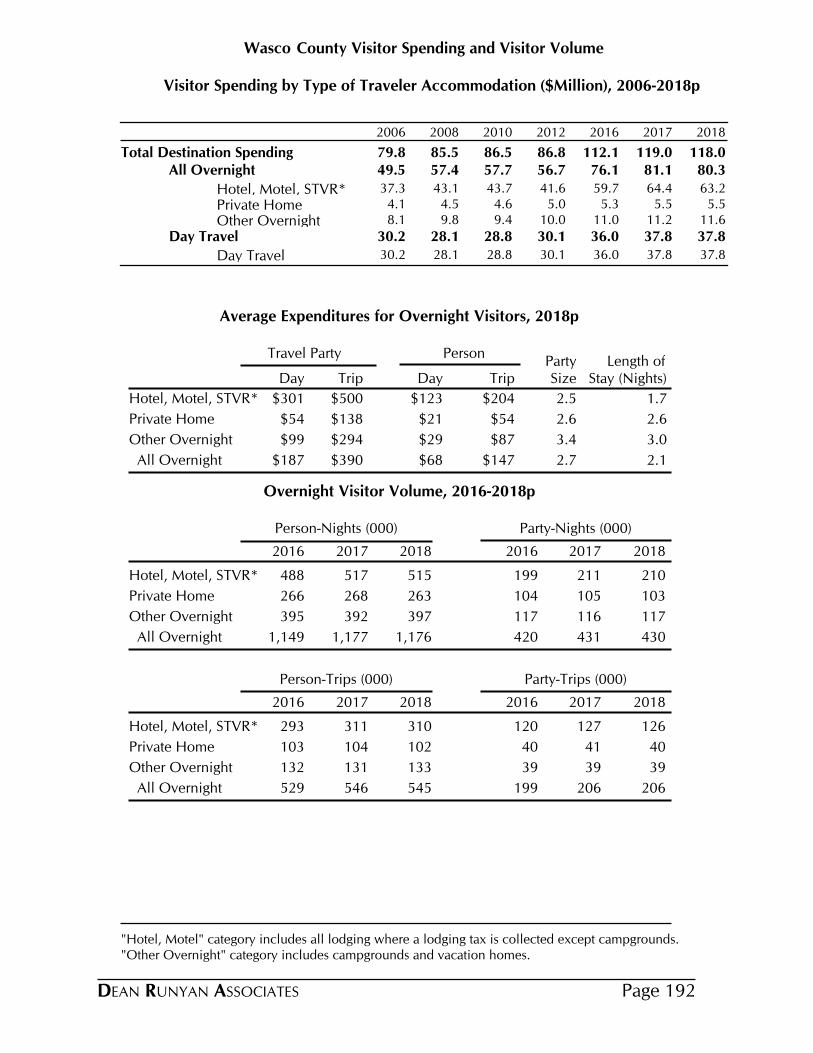
County Visitor Spending and Visitor VolumeWasco
Visitor Spending by Type of Traveler Accommodation ($Million), 2006-2018p
2006 2008 2010 2012 2016 2017 2018
Total Destination Spending 79.8 85.5 86.5 86.8 112.1 119.0 118.0All Overnight 49.5 57.4 57.7 56.7 76.1 81.1 80.3
Hotel, Motel, STVR* 37.3 43.1 43.7 41.6 59.7 64.4 63.2
Private Home 4.1 4.5 4.6 5.0 5.3 5.5 5.5
Other Overnight 8.1 9.8 9.4 10.0 11.0 11.2 11.6
Day Travel 30.2 28.1 28.8 30.1 36.0 37.8 37.8
Day Travel 30.2 28.1 28.8 30.1 36.0 37.8 37.8
Average Expenditures for Overnight Visitors, 2018p
Travel Party PersonParty Length of
Day Trip Day Trip Size Stay (Nights)
$301 $500 $123 $204Hotel, Motel, STVR* 2.5 1.7
$54 $138 $21 $54Private Home 2.6 2.6
$99 $294 $29 $87Other Overnight 3.4 3.0
$187 $390 $68 $147 All Overnight 2.7 2.1
Overnight Visitor Volume, 2016-2018p
Person-Nights (000) Party-Nights (000)
2016 2017 2018 2016 2017 2018
Hotel, Motel, STVR* 488 517 515 199 211 210
Private Home 266 268 263 104 105 103
Other Overnight 395 392 397 117 116 117
All Overnight 1,149 1,177 1,176 420 431 430
Person-Trips (000) Party-Trips (000)
2016 2017 2018 2016 2017 2018
Hotel, Motel, STVR* 293 311 310 120 127 126
Private Home 103 104 102 40 41 40
Other Overnight 132 131 133 39 39 39
All Overnight 529 546 545 199 206 206
"Hotel, Motel" category includes all lodging where a lodging tax is collected except campgrounds. "Other Overnight" category includes campgrounds and vacation homes.
DEAN RUNYAN ASSOCIATES Page 192
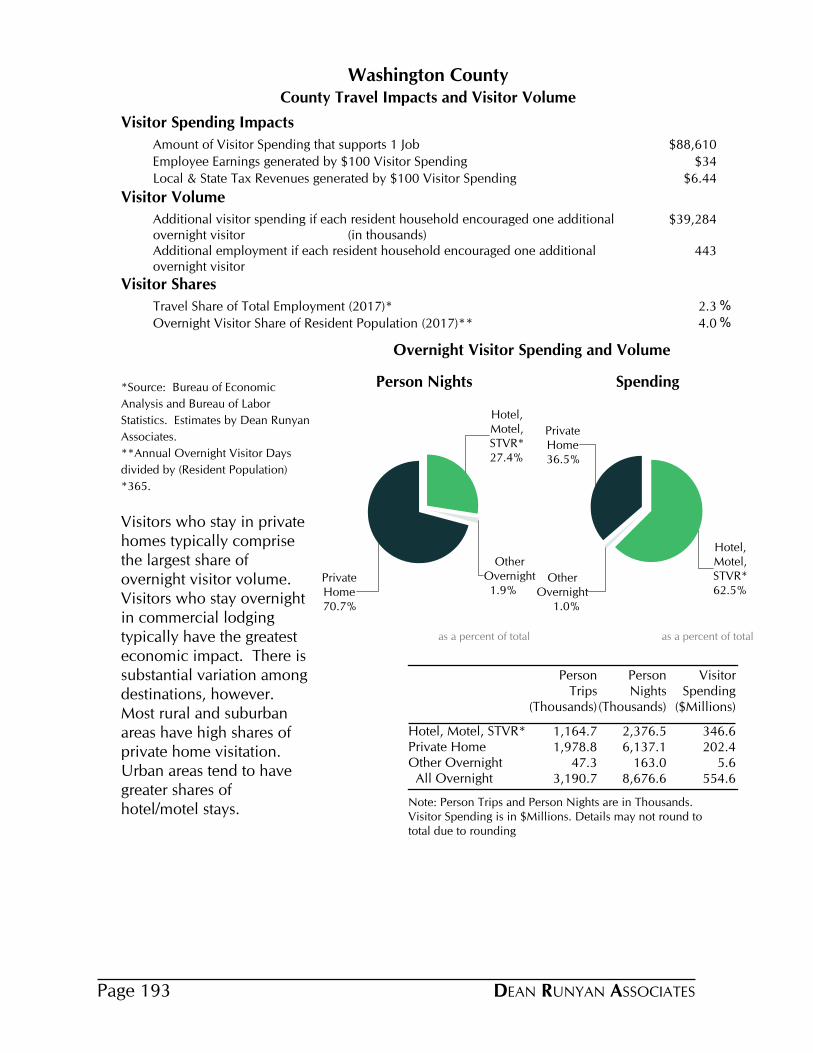
County Travel Impacts and Visitor Volume
Washington County
Visitor Spending Impacts
Amount of Visitor Spending that supports 1 Job $88,610
Employee Earnings generated by $100 Visitor Spending $34
Local & State Tax Revenues generated by $100 Visitor Spending $6.44
Visitor Volume
Additional visitor spending if each resident household encouraged one additional overnight visitor (in thousands)
$39,284
Additional employment if each resident household encouraged one additional overnight visitor
443
Visitor Shares
Travel Share of Total Employment (2017)* 2.3 %
Overnight Visitor Share of Resident Population (2017)** 4.0 %
*Source: Bureau of Economic
Analysis and Bureau of Labor
Statistics. Estimates by Dean Runyan
Associates.
**Annual Overnight Visitor Days
divided by (Resident Population)
*365.
Visitors who stay in private homes typically comprise the largest share of overnight visitor volume. Visitors who stay overnight in commercial lodging typically have the greatest economic impact. There is substantial variation among destinations, however. Most rural and suburban areas have high shares of private home visitation. Urban areas tend to have greater shares of hotel/motel stays.
Note: Person Trips and Person Nights are in Thousands. Visitor Spending is in $Millions. Details may not round to total due to rounding
Person Trips
(Thousands)
Person Nights
(Thousands)
Visitor Spending
($Millions)
Hotel, Motel, STVR* 1,164.7 2,376.5 346.6Private Home 1,978.8 6,137.1 202.4Other Overnight 47.3 163.0 5.6 All Overnight 3,190.7 8,676.6 554.6
27.4%
Hotel,Motel,STVR*
1.9%
OtherOvernight
70.7%
PrivateHome
Person Nights
as a percent of total
62.5%
Hotel,Motel,STVR*
1.0%
OtherOvernight
36.5%
PrivateHome
Spending
as a percent of total
Overnight Visitor Spending and Volume
DEAN RUNYAN ASSOCIATESPage 193

Direct Travel Impacts, 2010-2018p
Avg. Annual Chg.
Washington
Spending ($M) 2010 2012 2014 2016 2017 2018 17-18 10-18Total (Current $) 556.6 653.3 670.8 754.7 828.8 858.1 3.5% 5.6% Other 117.9 141.3 130.0 121.6 131.6 139.9 6.3% 2.2% Visitor 438.7 512.0 540.7 633.1 697.2 718.2 3.0% 6.4% Non-transportation 377.2 436.7 467.6 563.0 617.5 631.7 2.3% 6.7% Transportation 61.5 75.3 73.2 70.1 79.8 86.5 8.5% 4.4%
Earnings ($M)Earnings (Current $) 141.8 169.3 184.0 235.4 256.0 272.8 6.5% 8.5%
Employment (Jobs)Employment 5,740 6,560 7,070 8,300 8,640 8,730 1.0% 5.4%
Tax Revenue ($M)Total (Current $) 22.0 27.3 29.7 37.2 45.0 46.2 2.6% 9.7% Local 6.1 7.5 9.1 12.7 16.8 17.2 2.3% 13.8% State 15.9 19.8 20.6 24.5 28.3 29.1 2.8% 7.8%
Other spending includes resident air travel, travel arrangement and reservation services, and convention and trade show organizers. Non-transportation visitor spending includes accommodations, food services, retail, food stores, and arts, entertainment & recreation. Visitor transportation spending includes private auto, auto rental, other local ground transportation and one-way airfares.Earnings include wages & salaries, earned benefits and proprietor income.Employment includes all full- and part-time employment of payroll employees and proprietors.Local tax revenue includes lodging taxes, auto rental taxes and airport passenger facility charges paid by visitors.State tax revenue includes lodging, and motor fuel tax payments of visitors, and the income tax payments attributable to the travel industry income of businesses and employees.Federal tax revenue includes motor fuel excise taxes and airline ticket taxes paid by visitors, and the payroll and income taxes attributable to the travel industry income of employees and businesses.
DEAN RUNYAN ASSOCIATES Page 194
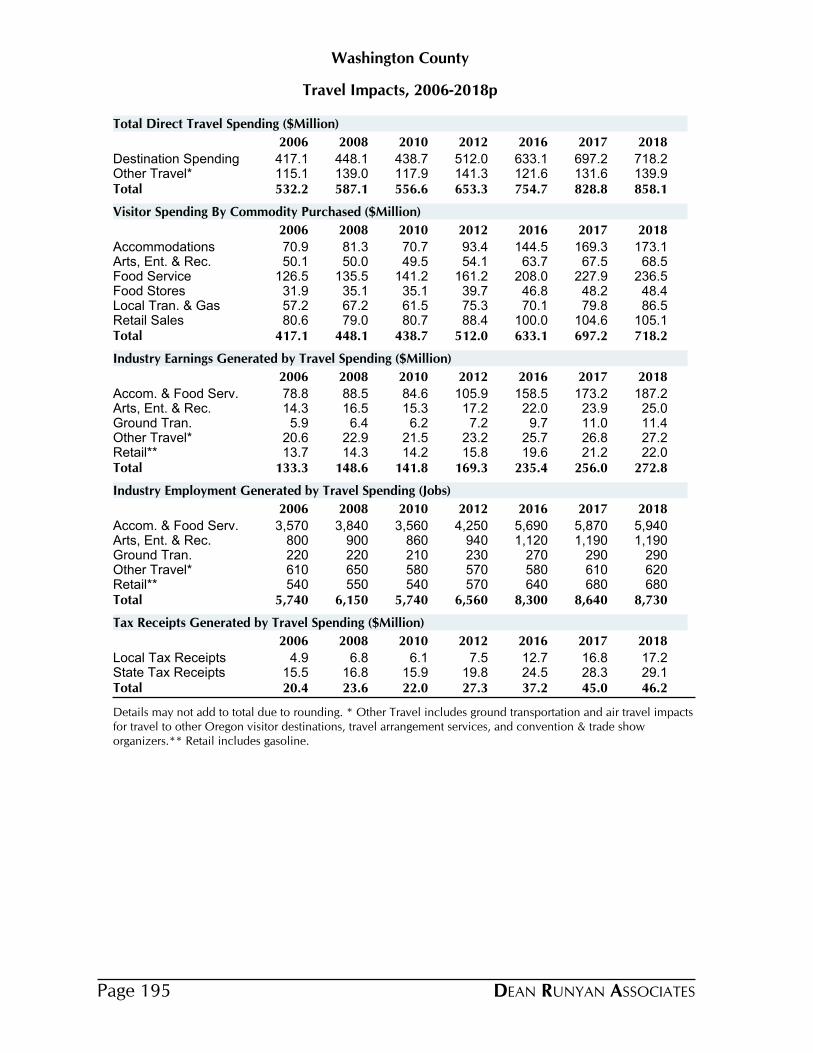
Travel Impacts, 2006-2018p
Washington County
2006 2008 2010 2012 2016 2017 2018
Destination Spending 417.1 448.1 438.7 512.0 633.1 697.2 718.2Other Travel* 115.1 139.0 117.9 141.3 121.6 131.6 139.9Total 532.2 587.1 556.6 653.3 754.7 828.8 858.1
Total Direct Travel Spending ($Million)
2006 2008 2010 2012 2016 2017 2018
Accommodations 70.9 81.3 70.7 93.4 144.5 169.3 173.1Arts, Ent. & Rec. 50.1 50.0 49.5 54.1 63.7 67.5 68.5Food Service 126.5 135.5 141.2 161.2 208.0 227.9 236.5Food Stores 31.9 35.1 35.1 39.7 46.8 48.2 48.4Local Tran. & Gas 57.2 67.2 61.5 75.3 70.1 79.8 86.5Retail Sales 80.6 79.0 80.7 88.4 100.0 104.6 105.1Total 417.1 448.1 438.7 512.0 633.1 697.2 718.2
Visitor Spending By Commodity Purchased ($Million)
2006 2008 2010 2012 2016 2017 2018
Accom. & Food Serv. 78.8 88.5 84.6 105.9 158.5 173.2 187.2Arts, Ent. & Rec. 14.3 16.5 15.3 17.2 22.0 23.9 25.0Ground Tran. 5.9 6.4 6.2 7.2 9.7 11.0 11.4Other Travel* 20.6 22.9 21.5 23.2 25.7 26.8 27.2Retail** 13.7 14.3 14.2 15.8 19.6 21.2 22.0Total 133.3 148.6 141.8 169.3 235.4 256.0 272.8
Industry Earnings Generated by Travel Spending ($Million)
2006 2008 2010 2012 2016 2017 2018
Accom. & Food Serv. 3,570 3,840 3,560 4,250 5,690 5,870 5,940Arts, Ent. & Rec. 800 900 860 940 1,120 1,190 1,190Ground Tran. 220 220 210 230 270 290 290Other Travel* 610 650 580 570 580 610 620Retail** 540 550 540 570 640 680 680Total 5,740 6,150 5,740 6,560 8,300 8,640 8,730
Industry Employment Generated by Travel Spending (Jobs)
2006 2008 2010 2012 2016 2017 2018
Local Tax Receipts 4.9 6.8 6.1 7.5 12.7 16.8 17.2State Tax Receipts 15.5 16.8 15.9 19.8 24.5 28.3 29.1Total 20.4 23.6 22.0 27.3 37.2 45.0 46.2
Tax Receipts Generated by Travel Spending ($Million)
Details may not add to total due to rounding. * Other Travel includes ground transportation and air travel impacts for travel to other Oregon visitor destinations, travel arrangement services, and convention & trade show organizers.** Retail includes gasoline.
DEAN RUNYAN ASSOCIATESPage 195
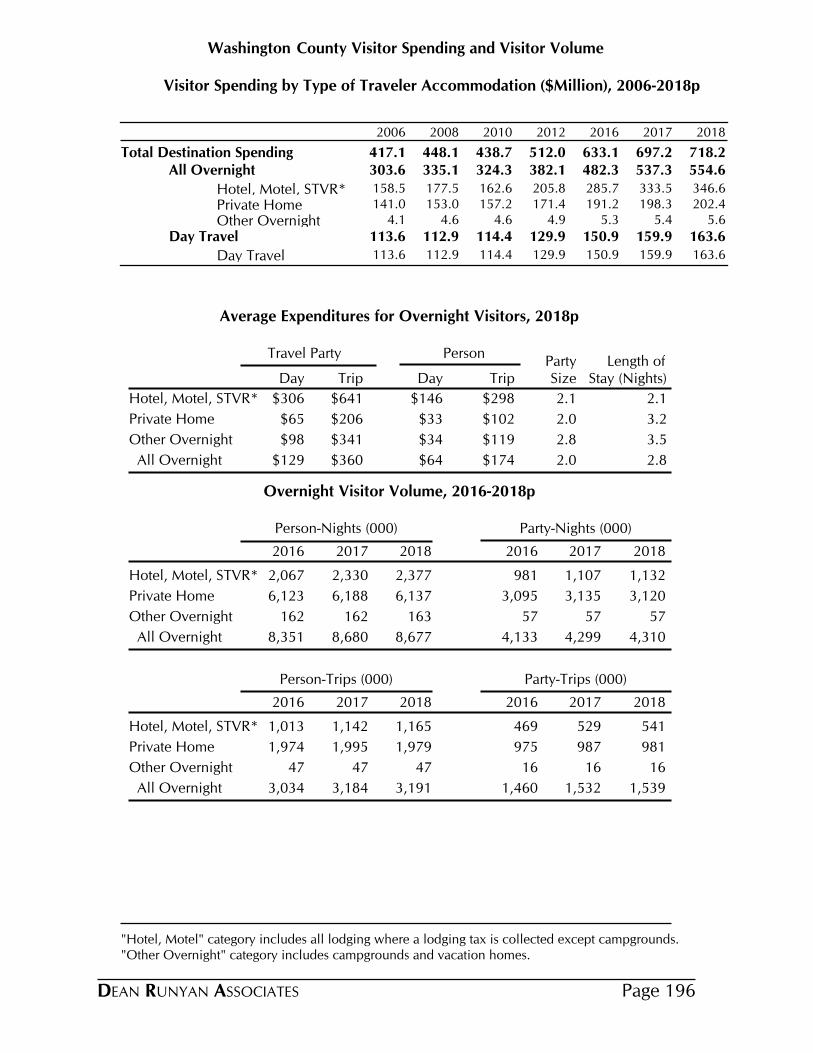
County Visitor Spending and Visitor VolumeWashington
Visitor Spending by Type of Traveler Accommodation ($Million), 2006-2018p
2006 2008 2010 2012 2016 2017 2018
Total Destination Spending 417.1 448.1 438.7 512.0 633.1 697.2 718.2All Overnight 303.6 335.1 324.3 382.1 482.3 537.3 554.6
Hotel, Motel, STVR* 158.5 177.5 162.6 205.8 285.7 333.5 346.6
Private Home 141.0 153.0 157.2 171.4 191.2 198.3 202.4
Other Overnight 4.1 4.6 4.6 4.9 5.3 5.4 5.6
Day Travel 113.6 112.9 114.4 129.9 150.9 159.9 163.6
Day Travel 113.6 112.9 114.4 129.9 150.9 159.9 163.6
Average Expenditures for Overnight Visitors, 2018p
Travel Party PersonParty Length of
Day Trip Day Trip Size Stay (Nights)
$306 $641 $146 $298Hotel, Motel, STVR* 2.1 2.1
$65 $206 $33 $102Private Home 2.0 3.2
$98 $341 $34 $119Other Overnight 2.8 3.5
$129 $360 $64 $174 All Overnight 2.0 2.8
Overnight Visitor Volume, 2016-2018p
Person-Nights (000) Party-Nights (000)
2016 2017 2018 2016 2017 2018
Hotel, Motel, STVR* 2,067 2,330 2,377 981 1,107 1,132
Private Home 6,123 6,188 6,137 3,095 3,135 3,120
Other Overnight 162 162 163 57 57 57
All Overnight 8,351 8,680 8,677 4,133 4,299 4,310
Person-Trips (000) Party-Trips (000)
2016 2017 2018 2016 2017 2018
Hotel, Motel, STVR* 1,013 1,142 1,165 469 529 541
Private Home 1,974 1,995 1,979 975 987 981
Other Overnight 47 47 47 16 16 16
All Overnight 3,034 3,184 3,191 1,460 1,532 1,539
"Hotel, Motel" category includes all lodging where a lodging tax is collected except campgrounds. "Other Overnight" category includes campgrounds and vacation homes.
DEAN RUNYAN ASSOCIATES Page 196
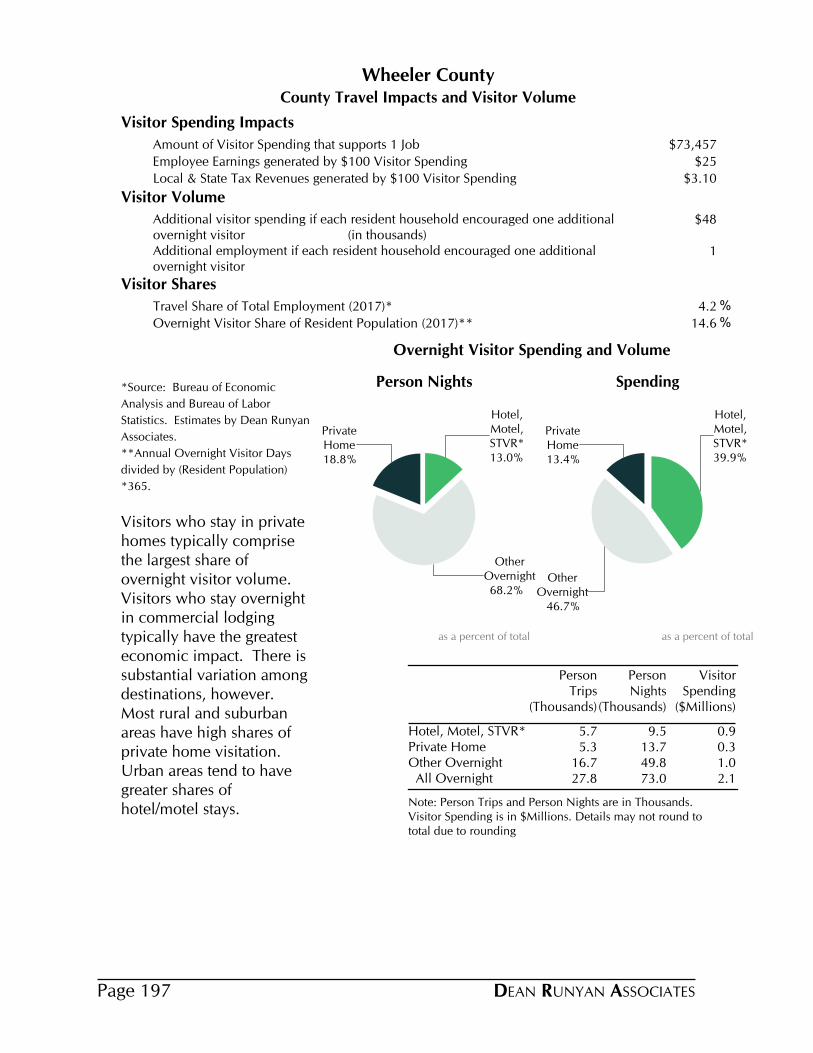
County Travel Impacts and Visitor Volume
Wheeler County
Visitor Spending Impacts
Amount of Visitor Spending that supports 1 Job $73,457
Employee Earnings generated by $100 Visitor Spending $25
Local & State Tax Revenues generated by $100 Visitor Spending $3.10
Visitor Volume
Additional visitor spending if each resident household encouraged one additional overnight visitor (in thousands)
$48
Additional employment if each resident household encouraged one additional overnight visitor
1
Visitor Shares
Travel Share of Total Employment (2017)* 4.2 %
Overnight Visitor Share of Resident Population (2017)** 14.6 %
*Source: Bureau of Economic
Analysis and Bureau of Labor
Statistics. Estimates by Dean Runyan
Associates.
**Annual Overnight Visitor Days
divided by (Resident Population)
*365.
Visitors who stay in private homes typically comprise the largest share of overnight visitor volume. Visitors who stay overnight in commercial lodging typically have the greatest economic impact. There is substantial variation among destinations, however. Most rural and suburban areas have high shares of private home visitation. Urban areas tend to have greater shares of hotel/motel stays.
Note: Person Trips and Person Nights are in Thousands. Visitor Spending is in $Millions. Details may not round to total due to rounding
Person Trips
(Thousands)
Person Nights
(Thousands)
Visitor Spending
($Millions)
Hotel, Motel, STVR* 5.7 9.5 0.9Private Home 5.3 13.7 0.3Other Overnight 16.7 49.8 1.0 All Overnight 27.8 73.0 2.1
13.0%
Hotel,Motel,STVR*
68.2%
OtherOvernight
18.8%
PrivateHome
Person Nights
as a percent of total
39.9%
Hotel,Motel,STVR*
46.7%
OtherOvernight
13.4%
PrivateHome
Spending
as a percent of total
Overnight Visitor Spending and Volume
DEAN RUNYAN ASSOCIATESPage 197
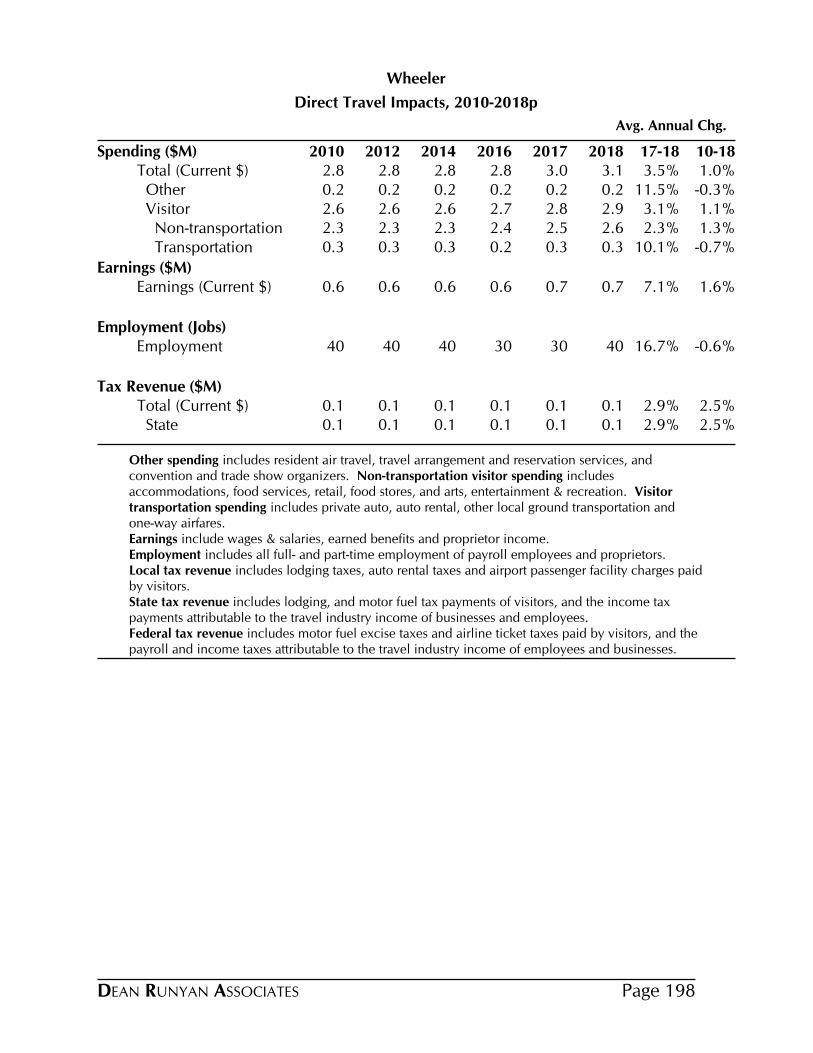
Direct Travel Impacts, 2010-2018p
Avg. Annual Chg.
Wheeler
Spending ($M) 2010 2012 2014 2016 2017 2018 17-18 10-18Total (Current $) 2.8 2.8 2.8 2.8 3.0 3.1 3.5% 1.0% Other 0.2 0.2 0.2 0.2 0.2 0.2 11.5% -0.3% Visitor 2.6 2.6 2.6 2.7 2.8 2.9 3.1% 1.1% Non-transportation 2.3 2.3 2.3 2.4 2.5 2.6 2.3% 1.3% Transportation 0.3 0.3 0.3 0.2 0.3 0.3 10.1% -0.7%
Earnings ($M)Earnings (Current $) 0.6 0.6 0.6 0.6 0.7 0.7 7.1% 1.6%
Employment (Jobs)Employment 40 40 40 30 30 40 16.7% -0.6%
Tax Revenue ($M)Total (Current $) 0.1 0.1 0.1 0.1 0.1 0.1 2.9% 2.5% State 0.1 0.1 0.1 0.1 0.1 0.1 2.9% 2.5%
Other spending includes resident air travel, travel arrangement and reservation services, and convention and trade show organizers. Non-transportation visitor spending includes accommodations, food services, retail, food stores, and arts, entertainment & recreation. Visitor transportation spending includes private auto, auto rental, other local ground transportation and one-way airfares.Earnings include wages & salaries, earned benefits and proprietor income.Employment includes all full- and part-time employment of payroll employees and proprietors.Local tax revenue includes lodging taxes, auto rental taxes and airport passenger facility charges paid by visitors.State tax revenue includes lodging, and motor fuel tax payments of visitors, and the income tax payments attributable to the travel industry income of businesses and employees.Federal tax revenue includes motor fuel excise taxes and airline ticket taxes paid by visitors, and the payroll and income taxes attributable to the travel industry income of employees and businesses.
DEAN RUNYAN ASSOCIATES Page 198
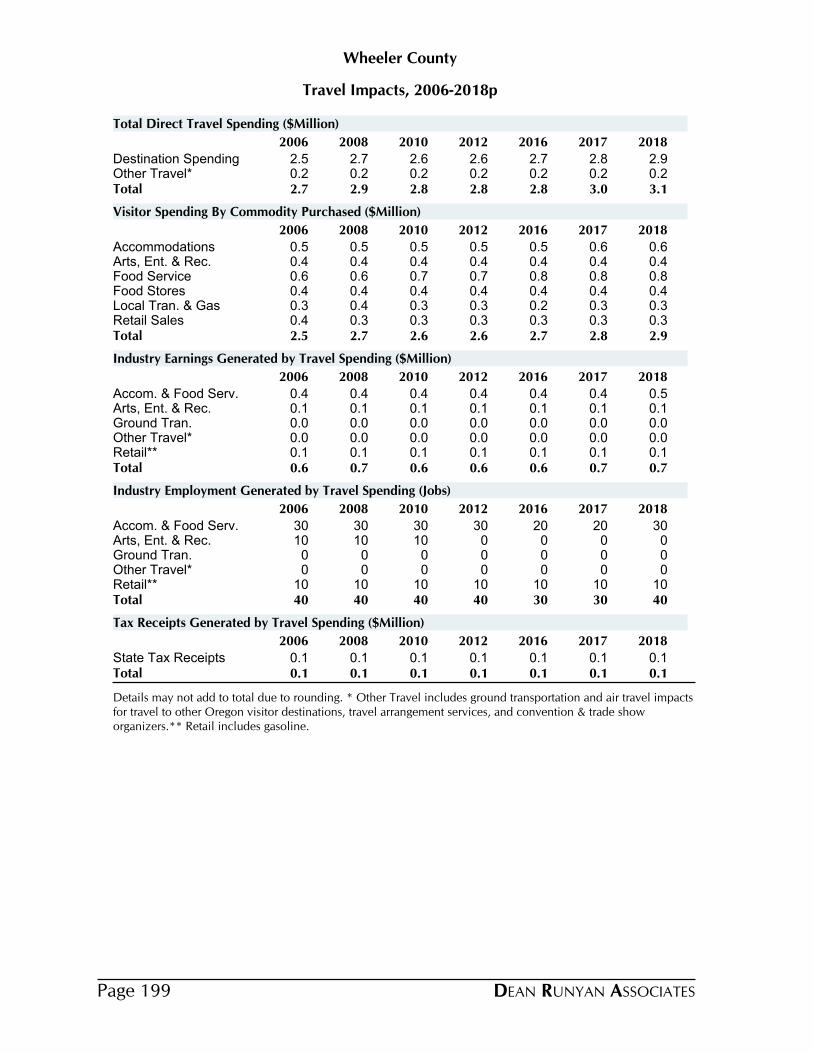
Travel Impacts, 2006-2018p
Wheeler County
2006 2008 2010 2012 2016 2017 2018
Destination Spending 2.5 2.7 2.6 2.6 2.7 2.8 2.9Other Travel* 0.2 0.2 0.2 0.2 0.2 0.2 0.2Total 2.7 2.9 2.8 2.8 2.8 3.0 3.1
Total Direct Travel Spending ($Million)
2006 2008 2010 2012 2016 2017 2018
Accommodations 0.5 0.5 0.5 0.5 0.5 0.6 0.6Arts, Ent. & Rec. 0.4 0.4 0.4 0.4 0.4 0.4 0.4Food Service 0.6 0.6 0.7 0.7 0.8 0.8 0.8Food Stores 0.4 0.4 0.4 0.4 0.4 0.4 0.4Local Tran. & Gas 0.3 0.4 0.3 0.3 0.2 0.3 0.3Retail Sales 0.4 0.3 0.3 0.3 0.3 0.3 0.3Total 2.5 2.7 2.6 2.6 2.7 2.8 2.9
Visitor Spending By Commodity Purchased ($Million)
2006 2008 2010 2012 2016 2017 2018
Accom. & Food Serv. 0.4 0.4 0.4 0.4 0.4 0.4 0.5Arts, Ent. & Rec. 0.1 0.1 0.1 0.1 0.1 0.1 0.1Ground Tran. 0.0 0.0 0.0 0.0 0.0 0.0 0.0Other Travel* 0.0 0.0 0.0 0.0 0.0 0.0 0.0Retail** 0.1 0.1 0.1 0.1 0.1 0.1 0.1Total 0.6 0.7 0.6 0.6 0.6 0.7 0.7
Industry Earnings Generated by Travel Spending ($Million)
2006 2008 2010 2012 2016 2017 2018
Accom. & Food Serv. 30 30 30 30 20 20 30Arts, Ent. & Rec. 10 10 10 0 0 0 0Ground Tran. 0 0 0 0 0 0 0Other Travel* 0 0 0 0 0 0 0Retail** 10 10 10 10 10 10 10Total 40 40 40 40 30 30 40
Industry Employment Generated by Travel Spending (Jobs)
2006 2008 2010 2012 2016 2017 2018
State Tax Receipts 0.1 0.1 0.1 0.1 0.1 0.1 0.1Total 0.1 0.1 0.1 0.1 0.1 0.1 0.1
Tax Receipts Generated by Travel Spending ($Million)
Details may not add to total due to rounding. * Other Travel includes ground transportation and air travel impacts for travel to other Oregon visitor destinations, travel arrangement services, and convention & trade show organizers.** Retail includes gasoline.
DEAN RUNYAN ASSOCIATESPage 199
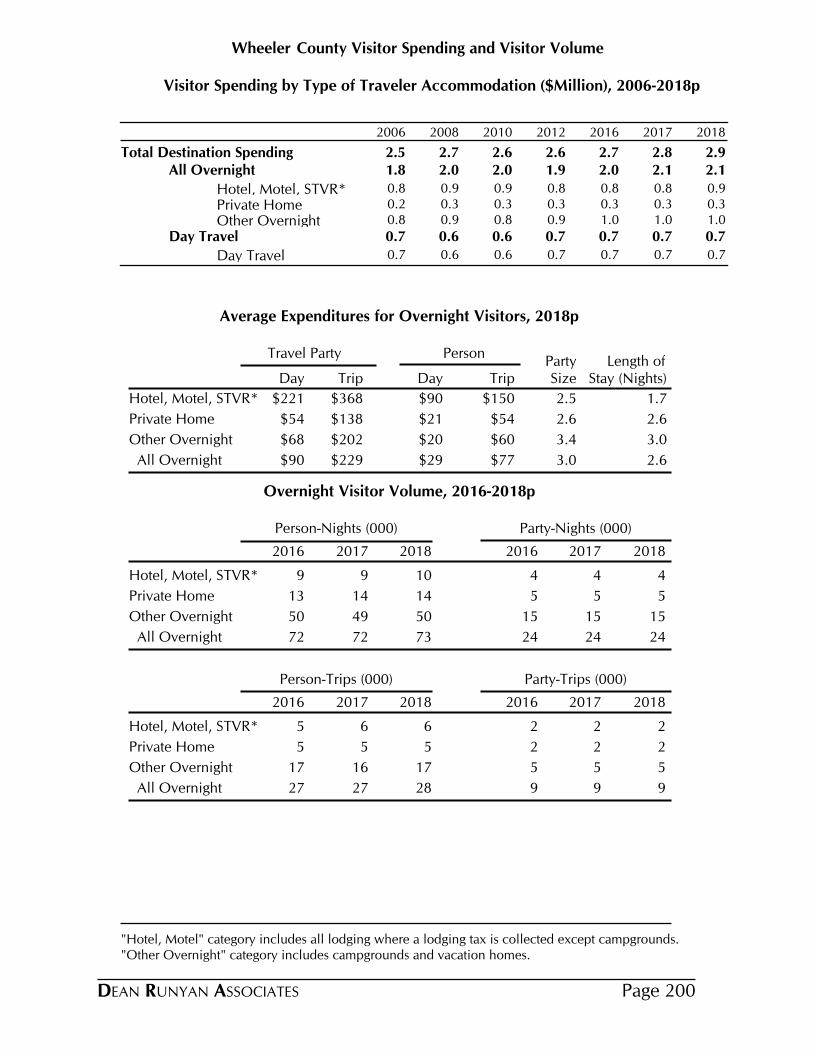
County Visitor Spending and Visitor VolumeWheeler
Visitor Spending by Type of Traveler Accommodation ($Million), 2006-2018p
2006 2008 2010 2012 2016 2017 2018
Total Destination Spending 2.5 2.7 2.6 2.6 2.7 2.8 2.9All Overnight 1.8 2.0 2.0 1.9 2.0 2.1 2.1
Hotel, Motel, STVR* 0.8 0.9 0.9 0.8 0.8 0.8 0.9
Private Home 0.2 0.3 0.3 0.3 0.3 0.3 0.3
Other Overnight 0.8 0.9 0.8 0.9 1.0 1.0 1.0
Day Travel 0.7 0.6 0.6 0.7 0.7 0.7 0.7
Day Travel 0.7 0.6 0.6 0.7 0.7 0.7 0.7
Average Expenditures for Overnight Visitors, 2018p
Travel Party PersonParty Length of
Day Trip Day Trip Size Stay (Nights)
$221 $368 $90 $150Hotel, Motel, STVR* 2.5 1.7
$54 $138 $21 $54Private Home 2.6 2.6
$68 $202 $20 $60Other Overnight 3.4 3.0
$90 $229 $29 $77 All Overnight 3.0 2.6
Overnight Visitor Volume, 2016-2018p
Person-Nights (000) Party-Nights (000)
2016 2017 2018 2016 2017 2018
Hotel, Motel, STVR* 9 9 10 4 4 4
Private Home 13 14 14 5 5 5
Other Overnight 50 49 50 15 15 15
All Overnight 72 72 73 24 24 24
Person-Trips (000) Party-Trips (000)
2016 2017 2018 2016 2017 2018
Hotel, Motel, STVR* 5 6 6 2 2 2
Private Home 5 5 5 2 2 2
Other Overnight 17 16 17 5 5 5
All Overnight 27 27 28 9 9 9
"Hotel, Motel" category includes all lodging where a lodging tax is collected except campgrounds. "Other Overnight" category includes campgrounds and vacation homes.
DEAN RUNYAN ASSOCIATES Page 200
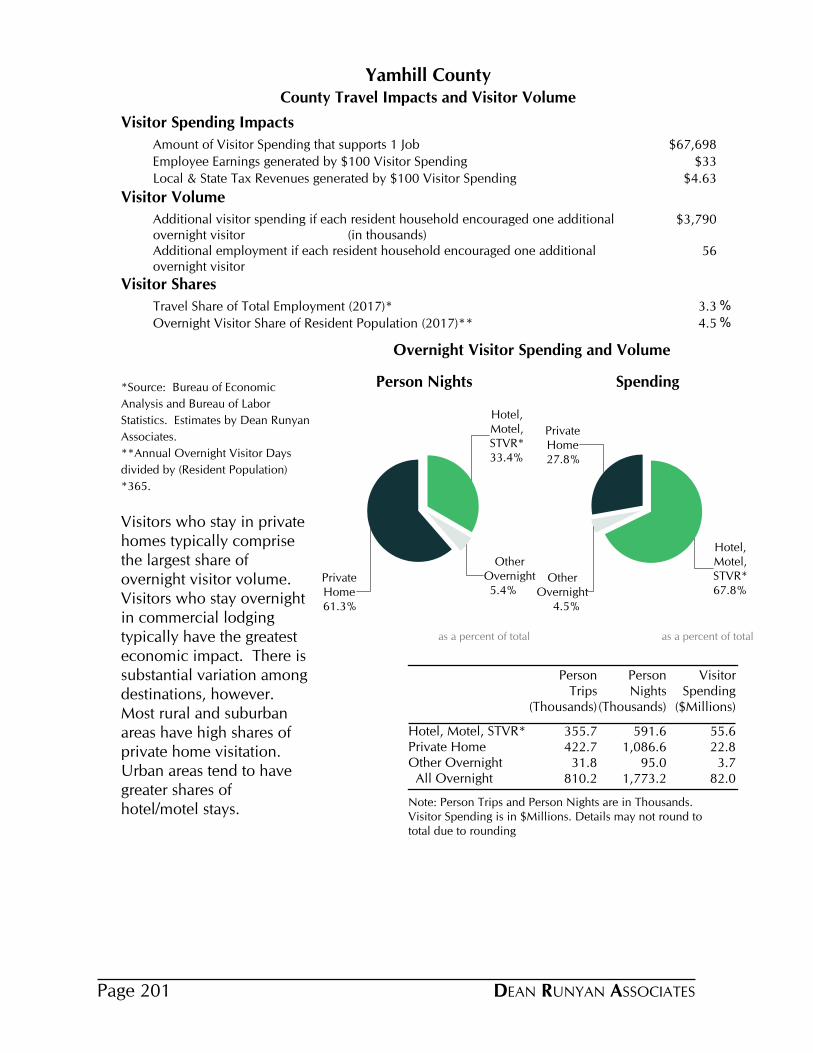
County Travel Impacts and Visitor Volume
Yamhill County
Visitor Spending Impacts
Amount of Visitor Spending that supports 1 Job $67,698
Employee Earnings generated by $100 Visitor Spending $33
Local & State Tax Revenues generated by $100 Visitor Spending $4.63
Visitor Volume
Additional visitor spending if each resident household encouraged one additional overnight visitor (in thousands)
$3,790
Additional employment if each resident household encouraged one additional overnight visitor
56
Visitor Shares
Travel Share of Total Employment (2017)* 3.3 %
Overnight Visitor Share of Resident Population (2017)** 4.5 %
*Source: Bureau of Economic
Analysis and Bureau of Labor
Statistics. Estimates by Dean Runyan
Associates.
**Annual Overnight Visitor Days
divided by (Resident Population)
*365.
Visitors who stay in private homes typically comprise the largest share of overnight visitor volume. Visitors who stay overnight in commercial lodging typically have the greatest economic impact. There is substantial variation among destinations, however. Most rural and suburban areas have high shares of private home visitation. Urban areas tend to have greater shares of hotel/motel stays.
Note: Person Trips and Person Nights are in Thousands. Visitor Spending is in $Millions. Details may not round to total due to rounding
Person Trips
(Thousands)
Person Nights
(Thousands)
Visitor Spending
($Millions)
Hotel, Motel, STVR* 355.7 591.6 55.6Private Home 422.7 1,086.6 22.8Other Overnight 31.8 95.0 3.7 All Overnight 810.2 1,773.2 82.0
33.4%
Hotel,Motel,STVR*
5.4%
OtherOvernight
61.3%
PrivateHome
Person Nights
as a percent of total
67.8%
Hotel,Motel,STVR*
4.5%
OtherOvernight
27.8%
PrivateHome
Spending
as a percent of total
Overnight Visitor Spending and Volume
DEAN RUNYAN ASSOCIATESPage 201

Direct Travel Impacts, 2010-2018p
Avg. Annual Chg.
Yamhill
Spending ($M) 2010 2012 2014 2016 2017 2018 17-18 10-18Total (Current $) 94.2 113.2 115.7 119.8 126.0 135.7 7.7% 4.7% Other 14.2 17.7 17.0 13.1 14.5 16.1 10.8% 1.6% Visitor 80.0 95.4 98.7 106.7 111.5 119.6 7.3% 5.1% Non-transportation 71.9 85.0 89.1 98.7 102.7 109.6 6.7% 5.4% Transportation 8.1 10.5 9.6 8.0 8.8 10.0 13.4% 2.6%
Earnings ($M)Earnings (Current $) 21.6 25.7 28.8 33.8 36.0 40.1 11.3% 8.0%
Employment (Jobs)Employment 1,250 1,450 1,560 1,660 1,680 1,820 8.3% 4.8%
Tax Revenue ($M)Total (Current $) 2.9 3.9 4.1 4.8 5.2 5.5 6.2% 8.3% Local 0.2 0.4 0.6 0.7 0.8 0.8 8.6% 20.3% State 2.7 3.4 3.6 4.1 4.4 4.7 5.8% 7.0%
Other spending includes resident air travel, travel arrangement and reservation services, and convention and trade show organizers. Non-transportation visitor spending includes accommodations, food services, retail, food stores, and arts, entertainment & recreation. Visitor transportation spending includes private auto, auto rental, other local ground transportation and one-way airfares.Earnings include wages & salaries, earned benefits and proprietor income.Employment includes all full- and part-time employment of payroll employees and proprietors.Local tax revenue includes lodging taxes, auto rental taxes and airport passenger facility charges paid by visitors.State tax revenue includes lodging, and motor fuel tax payments of visitors, and the income tax payments attributable to the travel industry income of businesses and employees.Federal tax revenue includes motor fuel excise taxes and airline ticket taxes paid by visitors, and the payroll and income taxes attributable to the travel industry income of employees and businesses.
DEAN RUNYAN ASSOCIATES Page 202
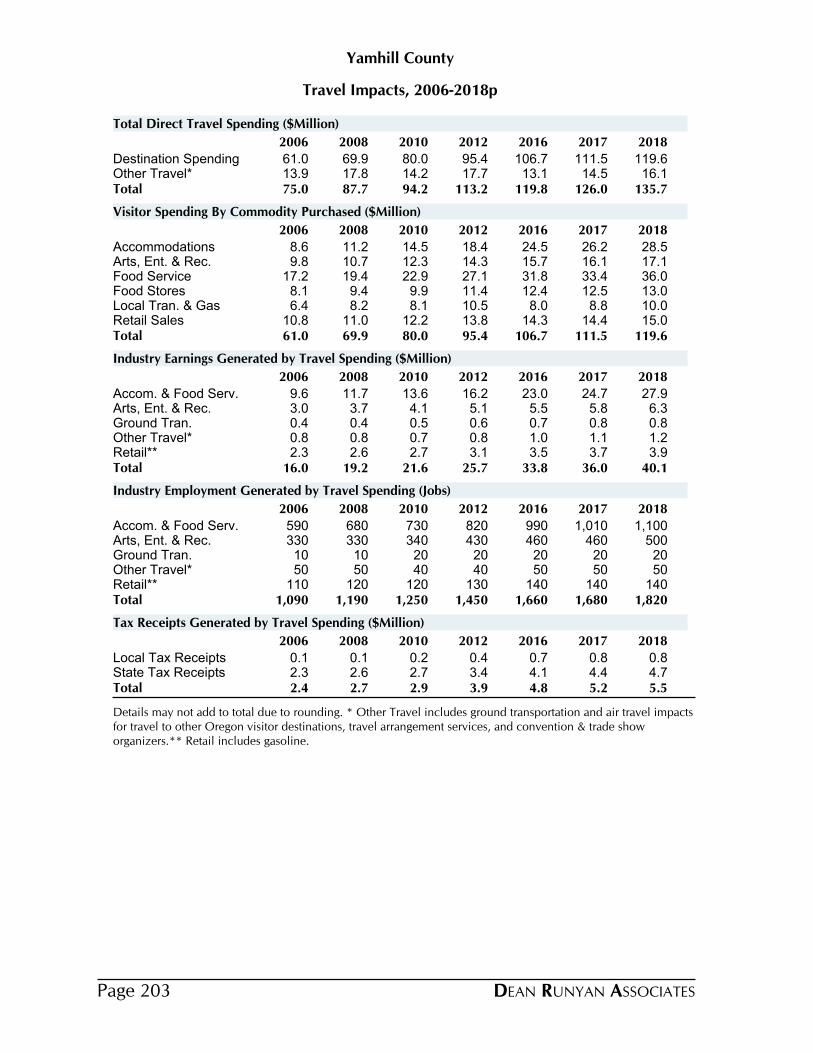
Travel Impacts, 2006-2018p
Yamhill County
2006 2008 2010 2012 2016 2017 2018
Destination Spending 61.0 69.9 80.0 95.4 106.7 111.5 119.6Other Travel* 13.9 17.8 14.2 17.7 13.1 14.5 16.1Total 75.0 87.7 94.2 113.2 119.8 126.0 135.7
Total Direct Travel Spending ($Million)
2006 2008 2010 2012 2016 2017 2018
Accommodations 8.6 11.2 14.5 18.4 24.5 26.2 28.5Arts, Ent. & Rec. 9.8 10.7 12.3 14.3 15.7 16.1 17.1Food Service 17.2 19.4 22.9 27.1 31.8 33.4 36.0Food Stores 8.1 9.4 9.9 11.4 12.4 12.5 13.0Local Tran. & Gas 6.4 8.2 8.1 10.5 8.0 8.8 10.0Retail Sales 10.8 11.0 12.2 13.8 14.3 14.4 15.0Total 61.0 69.9 80.0 95.4 106.7 111.5 119.6
Visitor Spending By Commodity Purchased ($Million)
2006 2008 2010 2012 2016 2017 2018
Accom. & Food Serv. 9.6 11.7 13.6 16.2 23.0 24.7 27.9Arts, Ent. & Rec. 3.0 3.7 4.1 5.1 5.5 5.8 6.3Ground Tran. 0.4 0.4 0.5 0.6 0.7 0.8 0.8Other Travel* 0.8 0.8 0.7 0.8 1.0 1.1 1.2Retail** 2.3 2.6 2.7 3.1 3.5 3.7 3.9Total 16.0 19.2 21.6 25.7 33.8 36.0 40.1
Industry Earnings Generated by Travel Spending ($Million)
2006 2008 2010 2012 2016 2017 2018
Accom. & Food Serv. 590 680 730 820 990 1,010 1,100Arts, Ent. & Rec. 330 330 340 430 460 460 500Ground Tran. 10 10 20 20 20 20 20Other Travel* 50 50 40 40 50 50 50Retail** 110 120 120 130 140 140 140Total 1,090 1,190 1,250 1,450 1,660 1,680 1,820
Industry Employment Generated by Travel Spending (Jobs)
2006 2008 2010 2012 2016 2017 2018
Local Tax Receipts 0.1 0.1 0.2 0.4 0.7 0.8 0.8State Tax Receipts 2.3 2.6 2.7 3.4 4.1 4.4 4.7Total 2.4 2.7 2.9 3.9 4.8 5.2 5.5
Tax Receipts Generated by Travel Spending ($Million)
Details may not add to total due to rounding. * Other Travel includes ground transportation and air travel impacts for travel to other Oregon visitor destinations, travel arrangement services, and convention & trade show organizers.** Retail includes gasoline.
DEAN RUNYAN ASSOCIATESPage 203
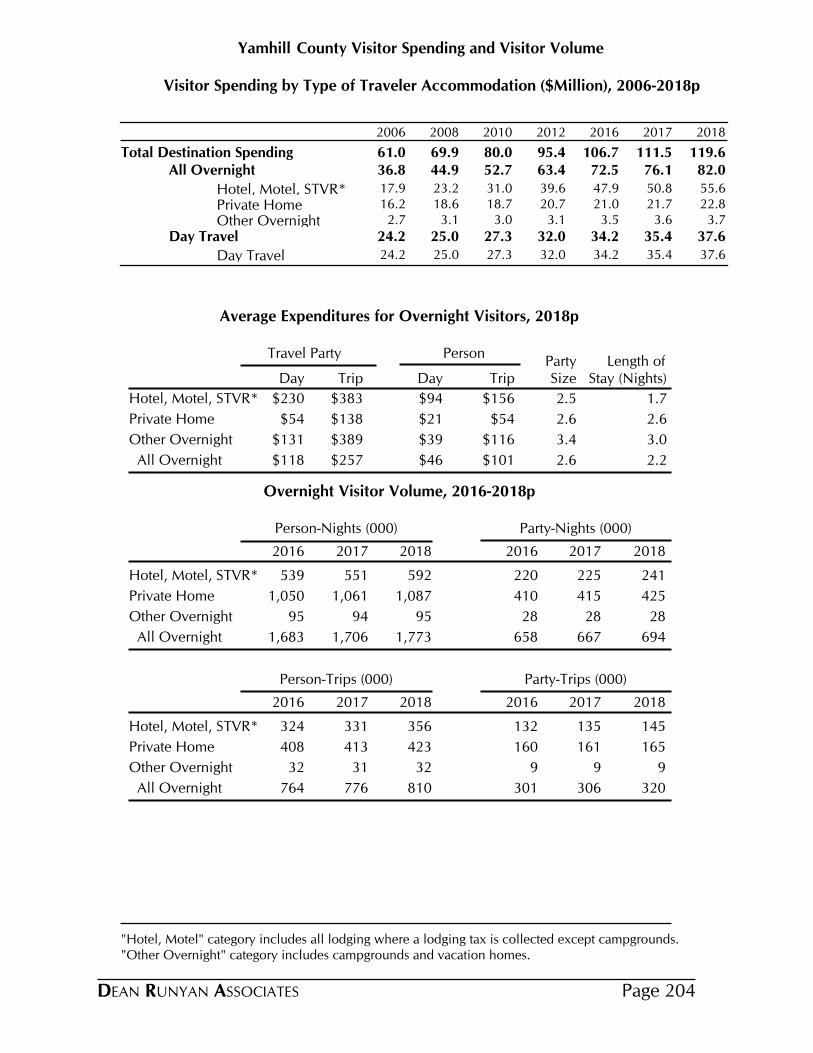
County Visitor Spending and Visitor VolumeYamhill
Visitor Spending by Type of Traveler Accommodation ($Million), 2006-2018p
2006 2008 2010 2012 2016 2017 2018
Total Destination Spending 61.0 69.9 80.0 95.4 106.7 111.5 119.6All Overnight 36.8 44.9 52.7 63.4 72.5 76.1 82.0
Hotel, Motel, STVR* 17.9 23.2 31.0 39.6 47.9 50.8 55.6
Private Home 16.2 18.6 18.7 20.7 21.0 21.7 22.8
Other Overnight 2.7 3.1 3.0 3.1 3.5 3.6 3.7
Day Travel 24.2 25.0 27.3 32.0 34.2 35.4 37.6
Day Travel 24.2 25.0 27.3 32.0 34.2 35.4 37.6
Average Expenditures for Overnight Visitors, 2018p
Travel Party PersonParty Length of
Day Trip Day Trip Size Stay (Nights)
$230 $383 $94 $156Hotel, Motel, STVR* 2.5 1.7
$54 $138 $21 $54Private Home 2.6 2.6
$131 $389 $39 $116Other Overnight 3.4 3.0
$118 $257 $46 $101 All Overnight 2.6 2.2
Overnight Visitor Volume, 2016-2018p
Person-Nights (000) Party-Nights (000)
2016 2017 2018 2016 2017 2018
Hotel, Motel, STVR* 539 551 592 220 225 241
Private Home 1,050 1,061 1,087 410 415 425
Other Overnight 95 94 95 28 28 28
All Overnight 1,683 1,706 1,773 658 667 694
Person-Trips (000) Party-Trips (000)
2016 2017 2018 2016 2017 2018
Hotel, Motel, STVR* 324 331 356 132 135 145
Private Home 408 413 423 160 161 165
Other Overnight 32 31 32 9 9 9
All Overnight 764 776 810 301 306 320
"Hotel, Motel" category includes all lodging where a lodging tax is collected except campgrounds. "Other Overnight" category includes campgrounds and vacation homes.
DEAN RUNYAN ASSOCIATES Page 204

V. Oregon Day Travel, 2018p
Visitor volume and average daily spending estimates for day travel to specific destinations within Oregon are not provided in this report because of data limitations. Day travel often involves expenditures in multiple locations. For example, a day trip from Portland to Eugene may entail expenditures on food and motor fuel in different intermediate locations on the trip. In addition, the magnitude and type of expenditures are very much related to the purpose of day travel and the activities engaged on the trip. Finally, it is difficult to provide meaningful estimates of day travel visitor volume relating to specific destinations because of the fact that day trips involve travel to and through multiple locations (e.g., counties). The following charts and tables provide information on day travel to destinations in Oregon broken out by trip activity and trip purpose. Trip activities are shown below. In general, the greater levels of average daily spending for cultural, dining and shopping activities reflect day trips to urban areas. Many important day trip activities, such as visits to wineries and gaming, are not shown because of insufficient data.
$0 $40 $80 $120 $160 $200 $240 $280
Beach
Cultural
Fine Dining
Outdoor Activity
Rural Sightseeing
Shopping
Transportation Food Other
Transp.Total Food Other Party Size
Beach $22.0$142.4 $59.2 $61.1 2.8Cultural $18.6$219.5 $88.8 $112.1 2.8Fine Dining $21.0$250.9 $117.8 $112.1 2.6Outdoor Activity $27.4$136.5 $44.4 $64.8 2.8Rural Sightseeing $19.4$142.1 $59.9 $62.8 2.7Shopping $22.4$220.3 $92.1 $105.8 2.4
Sources: OmniTrak and Dean Runyan Associates
DEAN RUNYAN ASSOCIATESPage 205
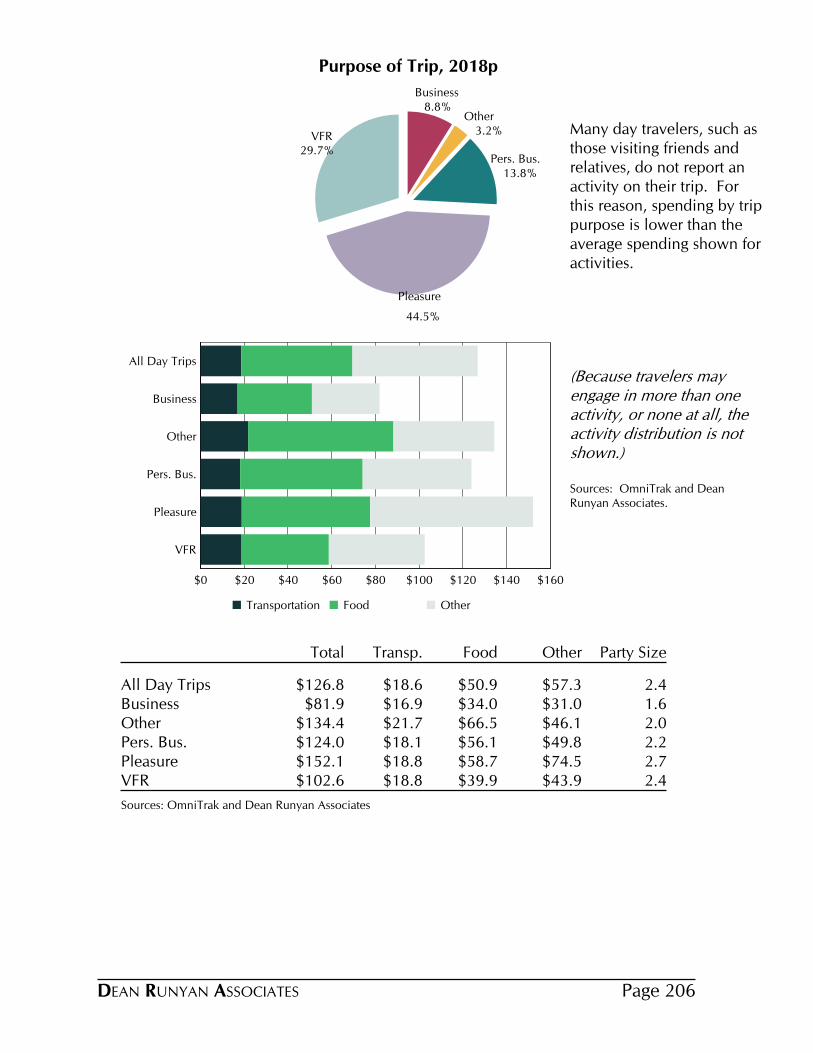
8.8%Business
3.2%Other
13.8%Pers. Bus.
44.5%
Pleasure
29.7%VFR
Purpose of Trip, 2018p
Many day travelers, such as those visiting friends and relatives, do not report an activity on their trip. For this reason, spending by trip purpose is lower than the average spending shown for activities.
$0 $20 $40 $60 $80 $100 $120 $140 $160
All Day Trips
Business
Other
Pers. Bus.
Pleasure
VFR
Transportation Food Other
(Because travelers may engage in more than one activity, or none at all, the activity distribution is not shown.)
Sources: OmniTrak and Dean Runyan Associates.
Transp.Total Food Other Party Size
All Day Trips $18.6$126.8 $50.9 $57.3 2.4Business $16.9$81.9 $34.0 $31.0 1.6Other $21.7$134.4 $66.5 $46.1 2.0Pers. Bus. $18.1$124.0 $56.1 $49.8 2.2Pleasure $18.8$152.1 $58.7 $74.5 2.7VFR $18.8$102.6 $39.9 $43.9 2.4
Sources: OmniTrak and Dean Runyan Associates
DEAN RUNYAN ASSOCIATES Page 206
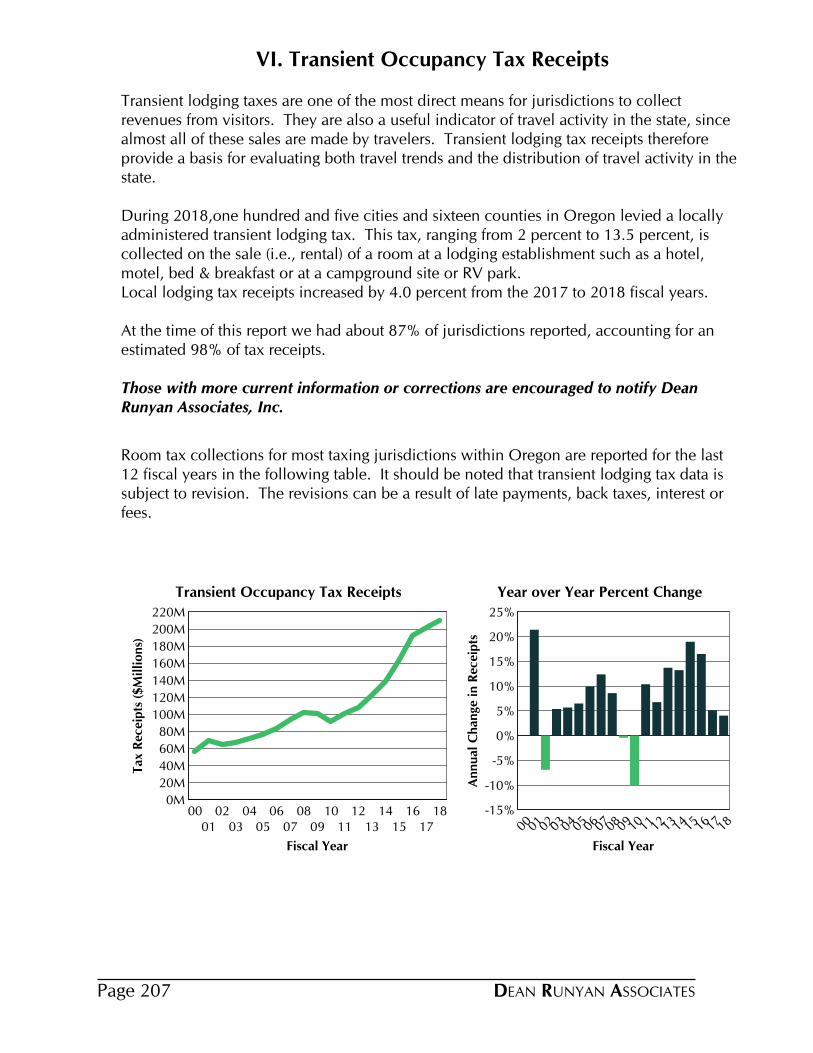
VI. Transient Occupancy Tax Receipts
Transient lodging taxes are one of the most direct means for jurisdictions to collect revenues from visitors. They are also a useful indicator of travel activity in the state, since almost all of these sales are made by travelers. Transient lodging tax receipts therefore provide a basis for evaluating both travel trends and the distribution of travel activity in the state.
During 2018,one hundred and five cities and sixteen counties in Oregon levied a locally administered transient lodging tax. This tax, ranging from 2 percent to 13.5 percent, is collected on the sale (i.e., rental) of a room at a lodging establishment such as a hotel, motel, bed & breakfast or at a campground site or RV park.Local lodging tax receipts increased by 4.0 percent from the 2017 to 2018 fiscal years. At the time of this report we had about 87% of jurisdictions reported, accounting for an estimated 98% of tax receipts.
Those with more current information or corrections are encouraged to notify Dean Runyan Associates, Inc.
Room tax collections for most taxing jurisdictions within Oregon are reported for the last 12 fiscal years in the following table. It should be noted that transient lodging tax data is subject to revision. The revisions can be a result of late payments, back taxes, interest or fees.
0M
20M
40M
60M
80M
100M
120M
140M
160M
180M
200M
220M
0001
0203
0405
0607
0809
1011
1213
1415
1617
18
Fiscal Year
Tax
Rec
eip
ts ($
Millio
ns)
Transient Occupancy Tax Receipts
-15%
-10%
-5%
0%
5%
10%
15%
20%
25%
00010203040506070809101112131415161718
Fiscal Year
An
nu
al C
han
ge in
Rec
eip
ts
Year over Year Percent Change
DEAN RUNYAN ASSOCIATESPage 207
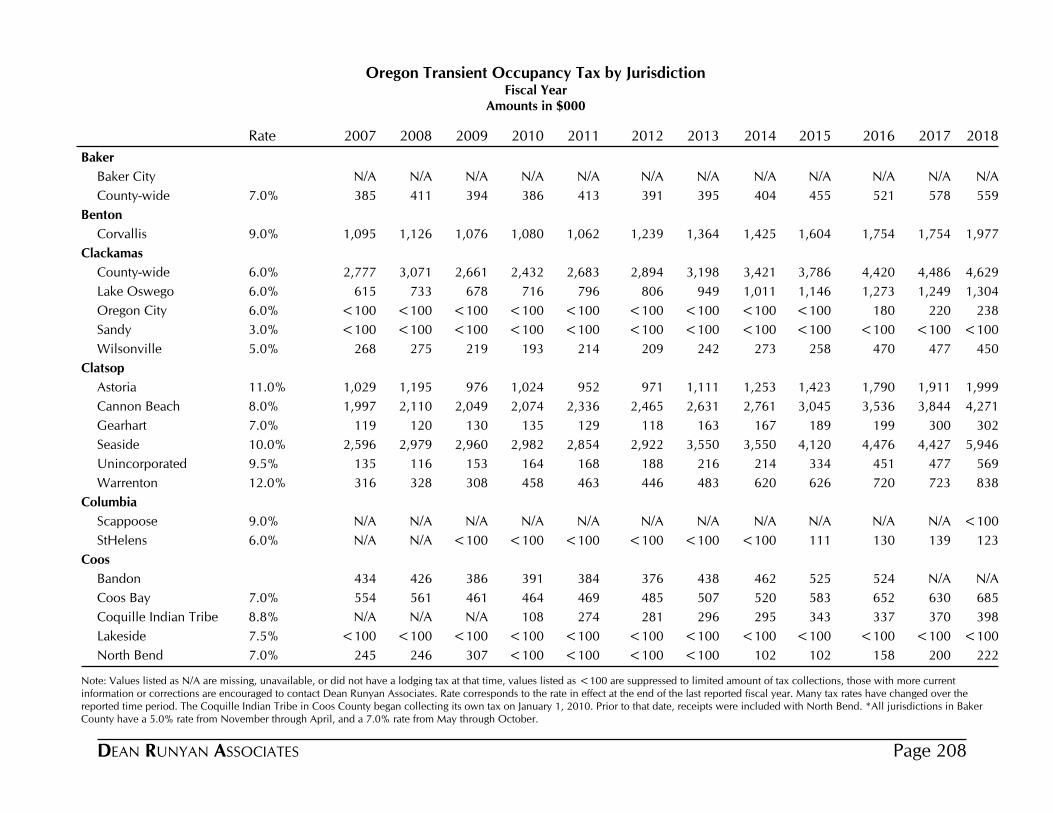
2010 2011 2012 2013 2014 2015 2016 2017
Oregon Transient Occupancy Tax by JurisdictionFiscal Year
Amounts in $000
Rate 200920082007 2018
Baker
Baker City N/A N/A N/A N/A N/A N/A N/AN/AN/AN/A N/A N/A
County-wide 386 413 391 395 404 455 5785217.0% 394385 411 559
Benton
Corvallis 1,080 1,062 1,239 1,364 1,425 1,604 1,7541,7549.0% 1,0761,095 1,126 1,977
Clackamas
County-wide 2,432 2,683 2,894 3,198 3,421 3,786 4,4864,4206.0% 2,6612,777 3,071 4,629
Lake Oswego 716 796 806 949 1,011 1,146 1,2491,2736.0% 678615 733 1,304
Oregon City <100 <100 <100 <100 <100 <100 2201806.0% <100<100 <100 238
Sandy <100 <100 <100 <100 <100 <100 <100<1003.0% <100<100 <100 <100
Wilsonville 193 214 209 242 273 258 4774705.0% 219268 275 450
Clatsop
Astoria 1,024 952 971 1,111 1,253 1,423 1,9111,79011.0% 9761,029 1,195 1,999
Cannon Beach 2,074 2,336 2,465 2,631 2,761 3,045 3,8443,5368.0% 2,0491,997 2,110 4,271
Gearhart 135 129 118 163 167 189 3001997.0% 130119 120 302
Seaside 2,982 2,854 2,922 3,550 3,550 4,120 4,4274,47610.0% 2,9602,596 2,979 5,946
Unincorporated 164 168 188 216 214 334 4774519.5% 153135 116 569
Warrenton 458 463 446 483 620 626 72372012.0% 308316 328 838
Columbia
Scappoose N/A N/A N/A N/A N/A N/A N/AN/A9.0% N/AN/A N/A <100
StHelens <100 <100 <100 <100 <100 111 1391306.0% <100N/A N/A 123
Coos
Bandon 391 384 376 438 462 525 N/A524386434 426 N/A
Coos Bay 464 469 485 507 520 583 6306527.0% 461554 561 685
Coquille Indian Tribe 108 274 281 296 295 343 3703378.8% N/AN/A N/A 398
Lakeside <100 <100 <100 <100 <100 <100 <100<1007.5% <100<100 <100 <100
North Bend <100 <100 <100 <100 102 102 2001587.0% 307245 246 222
Note: Values listed as N/A are missing, unavailable, or did not have a lodging tax at that time, values listed as <100 are suppressed to limited amount of tax collections, those with more current information or corrections are encouraged to contact Dean Runyan Associates. Rate corresponds to the rate in effect at the end of the last reported fiscal year. Many tax rates have changed over the reported time period. The Coquille Indian Tribe in Coos County began collecting its own tax on January 1, 2010. Prior to that date, receipts were included with North Bend. *All jurisdictions in Baker County have a 5.0% rate from November through April, and a 7.0% rate from May through October.
DEAN RUNYAN ASSOCIATES Page 208
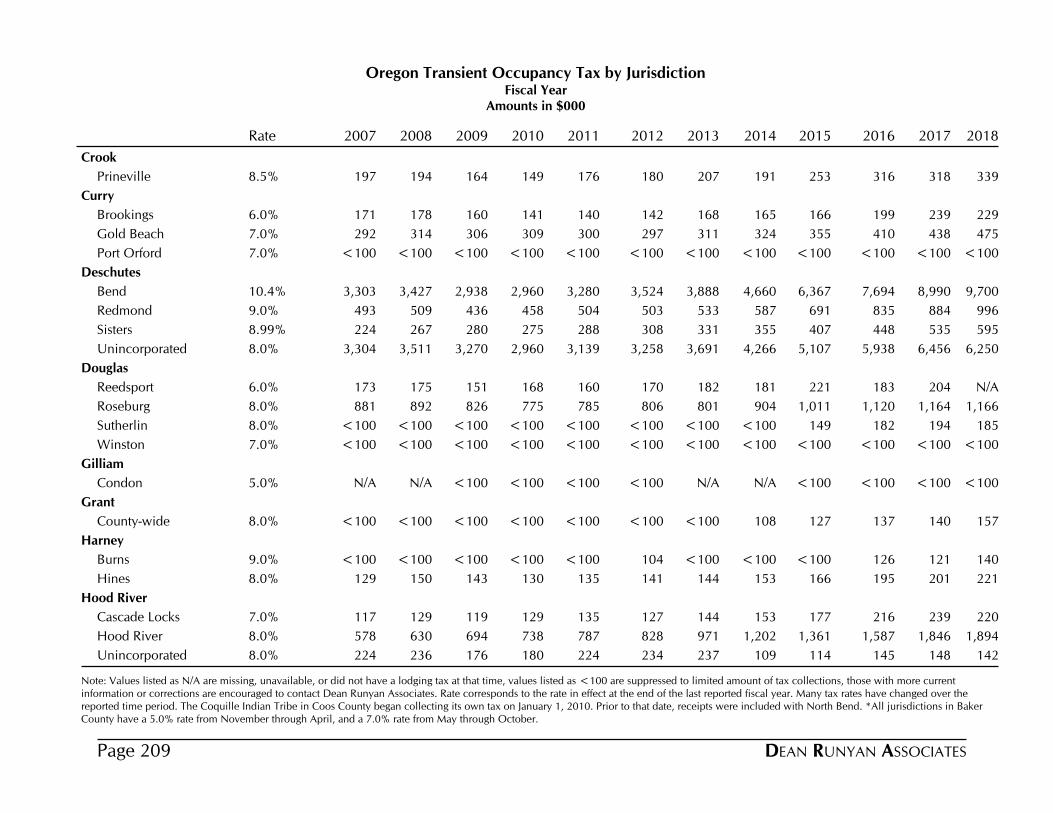
2010 2011 2012 2013 2014 2015 2016 2017
Oregon Transient Occupancy Tax by JurisdictionFiscal Year
Amounts in $000
Rate 200920082007 2018
Crook
Prineville 149 176 180 207 191 253 3183168.5% 164197 194 339
Curry
Brookings 141 140 142 168 165 166 2391996.0% 160171 178 229
Gold Beach 309 300 297 311 324 355 4384107.0% 306292 314 475
Port Orford <100 <100 <100 <100 <100 <100 <100<1007.0% <100<100 <100 <100
Deschutes
Bend 2,960 3,280 3,524 3,888 4,660 6,367 8,9907,69410.4% 2,9383,303 3,427 9,700
Redmond 458 504 503 533 587 691 8848359.0% 436493 509 996
Sisters 275 288 308 331 355 407 5354488.99% 280224 267 595
Unincorporated 2,960 3,139 3,258 3,691 4,266 5,107 6,4565,9388.0% 3,2703,304 3,511 6,250
Douglas
Reedsport 168 160 170 182 181 221 2041836.0% 151173 175 N/A
Roseburg 775 785 806 801 904 1,011 1,1641,1208.0% 826881 892 1,166
Sutherlin <100 <100 <100 <100 <100 149 1941828.0% <100<100 <100 185
Winston <100 <100 <100 <100 <100 <100 <100<1007.0% <100<100 <100 <100
Gilliam
Condon <100 <100 <100 N/A N/A <100 <100<1005.0% <100N/A N/A <100
Grant
County-wide <100 <100 <100 <100 108 127 1401378.0% <100<100 <100 157
Harney
Burns <100 <100 104 <100 <100 <100 1211269.0% <100<100 <100 140
Hines 130 135 141 144 153 166 2011958.0% 143129 150 221
Hood River
Cascade Locks 129 135 127 144 153 177 2392167.0% 119117 129 220
Hood River 738 787 828 971 1,202 1,361 1,8461,5878.0% 694578 630 1,894
Unincorporated 180 224 234 237 109 114 1481458.0% 176224 236 142
Note: Values listed as N/A are missing, unavailable, or did not have a lodging tax at that time, values listed as <100 are suppressed to limited amount of tax collections, those with more current information or corrections are encouraged to contact Dean Runyan Associates. Rate corresponds to the rate in effect at the end of the last reported fiscal year. Many tax rates have changed over the reported time period. The Coquille Indian Tribe in Coos County began collecting its own tax on January 1, 2010. Prior to that date, receipts were included with North Bend. *All jurisdictions in Baker County have a 5.0% rate from November through April, and a 7.0% rate from May through October.
DEAN RUNYAN ASSOCIATESPage 209
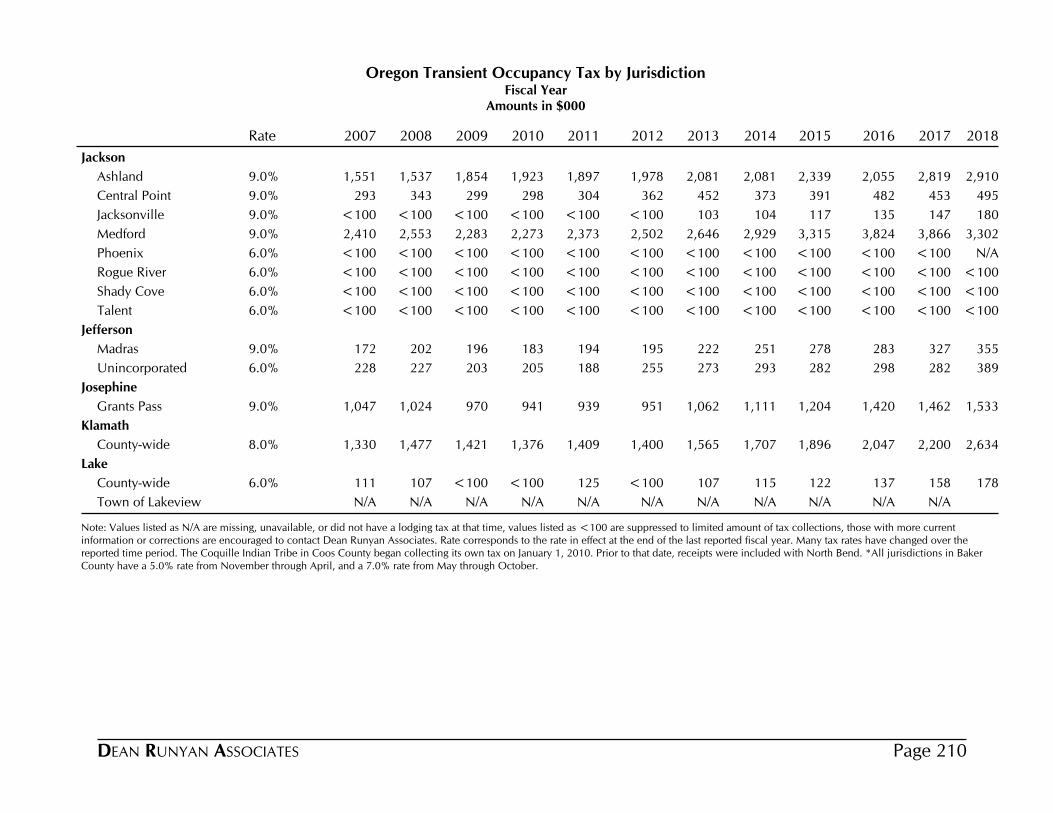
2010 2011 2012 2013 2014 2015 2016 2017
Oregon Transient Occupancy Tax by JurisdictionFiscal Year
Amounts in $000
Rate 200920082007 2018
Jackson
Ashland 1,923 1,897 1,978 2,081 2,081 2,339 2,8192,0559.0% 1,8541,551 1,537 2,910
Central Point 298 304 362 452 373 391 4534829.0% 299293 343 495
Jacksonville <100 <100 <100 103 104 117 1471359.0% <100<100 <100 180
Medford 2,273 2,373 2,502 2,646 2,929 3,315 3,8663,8249.0% 2,2832,410 2,553 3,302
Phoenix <100 <100 <100 <100 <100 <100 <100<1006.0% <100<100 <100 N/A
Rogue River <100 <100 <100 <100 <100 <100 <100<1006.0% <100<100 <100 <100
Shady Cove <100 <100 <100 <100 <100 <100 <100<1006.0% <100<100 <100 <100
Talent <100 <100 <100 <100 <100 <100 <100<1006.0% <100<100 <100 <100
Jefferson
Madras 183 194 195 222 251 278 3272839.0% 196172 202 355
Unincorporated 205 188 255 273 293 282 2822986.0% 203228 227 389
Josephine
Grants Pass 941 939 951 1,062 1,111 1,204 1,4621,4209.0% 9701,047 1,024 1,533
Klamath
County-wide 1,376 1,409 1,400 1,565 1,707 1,896 2,2002,0478.0% 1,4211,330 1,477 2,634
Lake
County-wide <100 125 <100 107 115 122 1581376.0% <100111 107 178
Town of Lakeview N/A N/A N/A N/A N/A N/A N/AN/AN/AN/A N/A
Note: Values listed as N/A are missing, unavailable, or did not have a lodging tax at that time, values listed as <100 are suppressed to limited amount of tax collections, those with more current information or corrections are encouraged to contact Dean Runyan Associates. Rate corresponds to the rate in effect at the end of the last reported fiscal year. Many tax rates have changed over the reported time period. The Coquille Indian Tribe in Coos County began collecting its own tax on January 1, 2010. Prior to that date, receipts were included with North Bend. *All jurisdictions in Baker County have a 5.0% rate from November through April, and a 7.0% rate from May through October.
DEAN RUNYAN ASSOCIATES Page 210
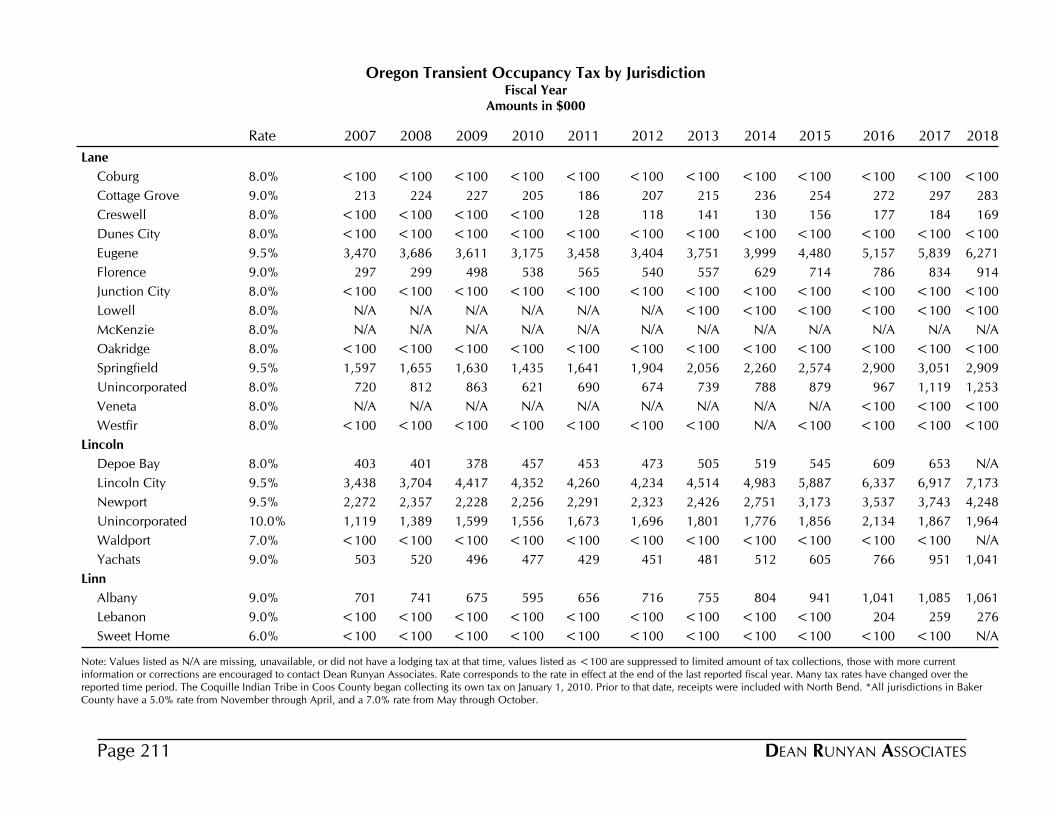
2010 2011 2012 2013 2014 2015 2016 2017
Oregon Transient Occupancy Tax by JurisdictionFiscal Year
Amounts in $000
Rate 200920082007 2018
Lane
Coburg <100 <100 <100 <100 <100 <100 <100<1008.0% <100<100 <100 <100
Cottage Grove 205 186 207 215 236 254 2972729.0% 227213 224 283
Creswell <100 128 118 141 130 156 1841778.0% <100<100 <100 169
Dunes City <100 <100 <100 <100 <100 <100 <100<1008.0% <100<100 <100 <100
Eugene 3,175 3,458 3,404 3,751 3,999 4,480 5,8395,1579.5% 3,6113,470 3,686 6,271
Florence 538 565 540 557 629 714 8347869.0% 498297 299 914
Junction City <100 <100 <100 <100 <100 <100 <100<1008.0% <100<100 <100 <100
Lowell N/A N/A N/A <100 <100 <100 <100<1008.0% N/AN/A N/A <100
McKenzie N/A N/A N/A N/A N/A N/A N/AN/A8.0% N/AN/A N/A N/A
Oakridge <100 <100 <100 <100 <100 <100 <100<1008.0% <100<100 <100 <100
Springfield 1,435 1,641 1,904 2,056 2,260 2,574 3,0512,9009.5% 1,6301,597 1,655 2,909
Unincorporated 621 690 674 739 788 879 1,1199678.0% 863720 812 1,253
Veneta N/A N/A N/A N/A N/A N/A <100<1008.0% N/AN/A N/A <100
Westfir <100 <100 <100 <100 N/A <100 <100<1008.0% <100<100 <100 <100
Lincoln
Depoe Bay 457 453 473 505 519 545 6536098.0% 378403 401 N/A
Lincoln City 4,352 4,260 4,234 4,514 4,983 5,887 6,9176,3379.5% 4,4173,438 3,704 7,173
Newport 2,256 2,291 2,323 2,426 2,751 3,173 3,7433,5379.5% 2,2282,272 2,357 4,248
Unincorporated 1,556 1,673 1,696 1,801 1,776 1,856 1,8672,13410.0% 1,5991,119 1,389 1,964
Waldport <100 <100 <100 <100 <100 <100 <100<1007.0% <100<100 <100 N/A
Yachats 477 429 451 481 512 605 9517669.0% 496503 520 1,041
Linn
Albany 595 656 716 755 804 941 1,0851,0419.0% 675701 741 1,061
Lebanon <100 <100 <100 <100 <100 <100 2592049.0% <100<100 <100 276
Sweet Home <100 <100 <100 <100 <100 <100 <100<1006.0% <100<100 <100 N/A
Note: Values listed as N/A are missing, unavailable, or did not have a lodging tax at that time, values listed as <100 are suppressed to limited amount of tax collections, those with more current information or corrections are encouraged to contact Dean Runyan Associates. Rate corresponds to the rate in effect at the end of the last reported fiscal year. Many tax rates have changed over the reported time period. The Coquille Indian Tribe in Coos County began collecting its own tax on January 1, 2010. Prior to that date, receipts were included with North Bend. *All jurisdictions in Baker County have a 5.0% rate from November through April, and a 7.0% rate from May through October.
DEAN RUNYAN ASSOCIATESPage 211
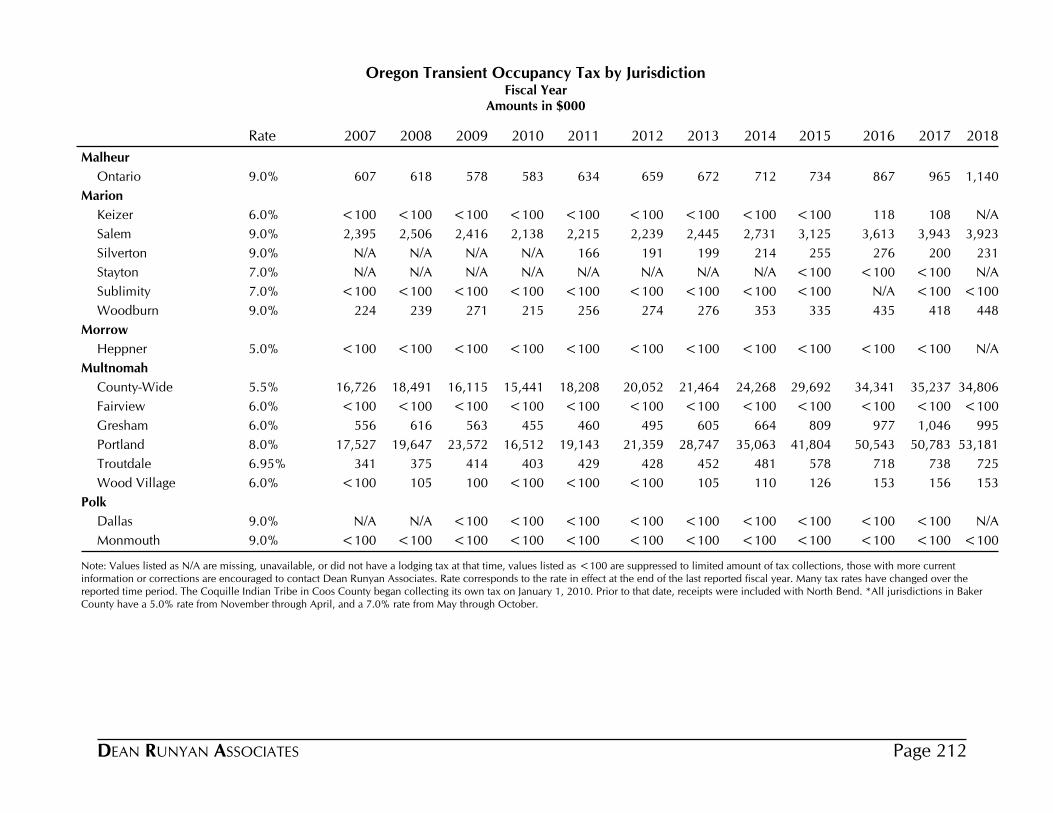
2010 2011 2012 2013 2014 2015 2016 2017
Oregon Transient Occupancy Tax by JurisdictionFiscal Year
Amounts in $000
Rate 200920082007 2018
Malheur
Ontario 583 634 659 672 712 734 9658679.0% 578607 618 1,140
Marion
Keizer <100 <100 <100 <100 <100 <100 1081186.0% <100<100 <100 N/A
Salem 2,138 2,215 2,239 2,445 2,731 3,125 3,9433,6139.0% 2,4162,395 2,506 3,923
Silverton N/A 166 191 199 214 255 2002769.0% N/AN/A N/A 231
Stayton N/A N/A N/A N/A N/A <100 <100<1007.0% N/AN/A N/A N/A
Sublimity <100 <100 <100 <100 <100 <100 <100N/A7.0% <100<100 <100 <100
Woodburn 215 256 274 276 353 335 4184359.0% 271224 239 448
Morrow
Heppner <100 <100 <100 <100 <100 <100 <100<1005.0% <100<100 <100 N/A
Multnomah
County-Wide 15,441 18,208 20,052 21,464 24,268 29,692 35,23734,3415.5% 16,11516,726 18,491 34,806
Fairview <100 <100 <100 <100 <100 <100 <100<1006.0% <100<100 <100 <100
Gresham 455 460 495 605 664 809 1,0469776.0% 563556 616 995
Portland 16,512 19,143 21,359 28,747 35,063 41,804 50,78350,5438.0% 23,57217,527 19,647 53,181
Troutdale 403 429 428 452 481 578 7387186.95% 414341 375 725
Wood Village <100 <100 <100 105 110 126 1561536.0% 100<100 105 153
Polk
Dallas <100 <100 <100 <100 <100 <100 <100<1009.0% <100N/A N/A N/A
Monmouth <100 <100 <100 <100 <100 <100 <100<1009.0% <100<100 <100 <100
Note: Values listed as N/A are missing, unavailable, or did not have a lodging tax at that time, values listed as <100 are suppressed to limited amount of tax collections, those with more current information or corrections are encouraged to contact Dean Runyan Associates. Rate corresponds to the rate in effect at the end of the last reported fiscal year. Many tax rates have changed over the reported time period. The Coquille Indian Tribe in Coos County began collecting its own tax on January 1, 2010. Prior to that date, receipts were included with North Bend. *All jurisdictions in Baker County have a 5.0% rate from November through April, and a 7.0% rate from May through October.
DEAN RUNYAN ASSOCIATES Page 212
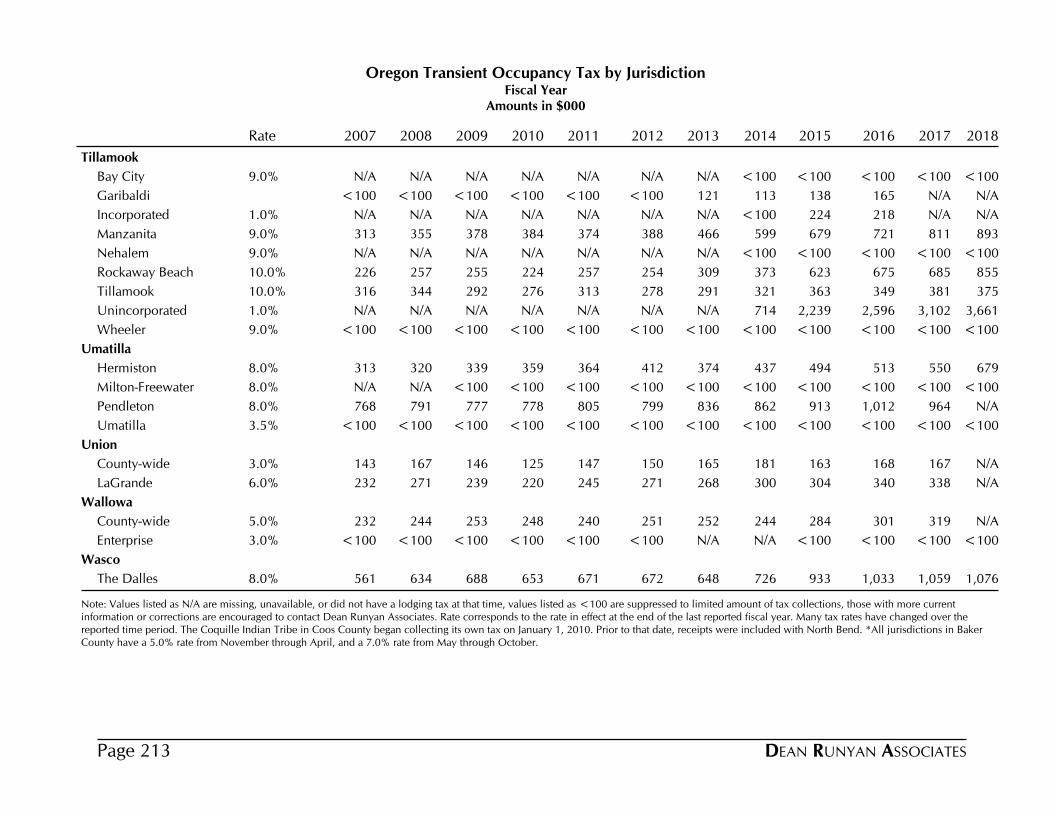
2010 2011 2012 2013 2014 2015 2016 2017
Oregon Transient Occupancy Tax by JurisdictionFiscal Year
Amounts in $000
Rate 200920082007 2018
Tillamook
Bay City N/A N/A N/A N/A <100 <100 <100<1009.0% N/AN/A N/A <100
Garibaldi <100 <100 <100 121 113 138 N/A165<100<100 <100 N/A
Incorporated N/A N/A N/A N/A <100 224 N/A2181.0% N/AN/A N/A N/A
Manzanita 384 374 388 466 599 679 8117219.0% 378313 355 893
Nehalem N/A N/A N/A N/A <100 <100 <100<1009.0% N/AN/A N/A <100
Rockaway Beach 224 257 254 309 373 623 68567510.0% 255226 257 855
Tillamook 276 313 278 291 321 363 38134910.0% 292316 344 375
Unincorporated N/A N/A N/A N/A 714 2,239 3,1022,5961.0% N/AN/A N/A 3,661
Wheeler <100 <100 <100 <100 <100 <100 <100<1009.0% <100<100 <100 <100
Umatilla
Hermiston 359 364 412 374 437 494 5505138.0% 339313 320 679
Milton-Freewater <100 <100 <100 <100 <100 <100 <100<1008.0% <100N/A N/A <100
Pendleton 778 805 799 836 862 913 9641,0128.0% 777768 791 N/A
Umatilla <100 <100 <100 <100 <100 <100 <100<1003.5% <100<100 <100 <100
Union
County-wide 125 147 150 165 181 163 1671683.0% 146143 167 N/A
LaGrande 220 245 271 268 300 304 3383406.0% 239232 271 N/A
Wallowa
County-wide 248 240 251 252 244 284 3193015.0% 253232 244 N/A
Enterprise <100 <100 <100 N/A N/A <100 <100<1003.0% <100<100 <100 <100
Wasco
The Dalles 653 671 672 648 726 933 1,0591,0338.0% 688561 634 1,076
Note: Values listed as N/A are missing, unavailable, or did not have a lodging tax at that time, values listed as <100 are suppressed to limited amount of tax collections, those with more current information or corrections are encouraged to contact Dean Runyan Associates. Rate corresponds to the rate in effect at the end of the last reported fiscal year. Many tax rates have changed over the reported time period. The Coquille Indian Tribe in Coos County began collecting its own tax on January 1, 2010. Prior to that date, receipts were included with North Bend. *All jurisdictions in Baker County have a 5.0% rate from November through April, and a 7.0% rate from May through October.
DEAN RUNYAN ASSOCIATESPage 213
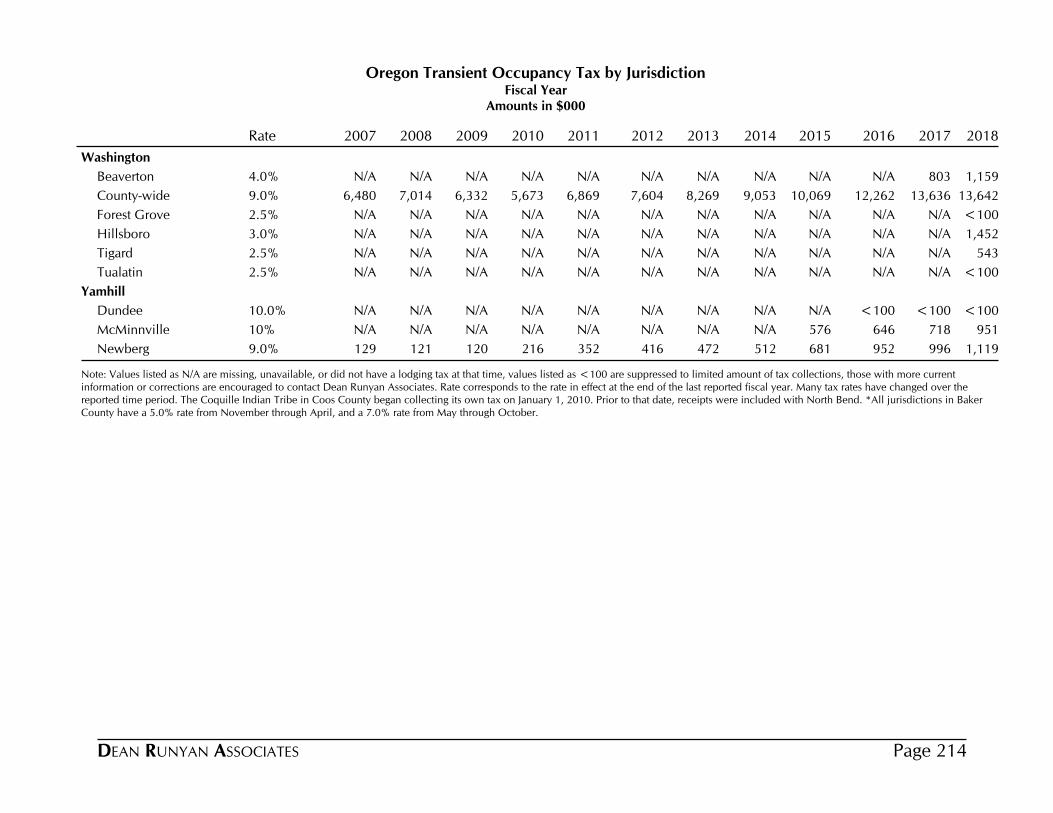
2010 2011 2012 2013 2014 2015 2016 2017
Oregon Transient Occupancy Tax by JurisdictionFiscal Year
Amounts in $000
Rate 200920082007 2018
Washington
Beaverton N/A N/A N/A N/A N/A N/A 803N/A4.0% N/AN/A N/A 1,159
County-wide 5,673 6,869 7,604 8,269 9,053 10,069 13,63612,2629.0% 6,3326,480 7,014 13,642
Forest Grove N/A N/A N/A N/A N/A N/A N/AN/A2.5% N/AN/A N/A <100
Hillsboro N/A N/A N/A N/A N/A N/A N/AN/A3.0% N/AN/A N/A 1,452
Tigard N/A N/A N/A N/A N/A N/A N/AN/A2.5% N/AN/A N/A 543
Tualatin N/A N/A N/A N/A N/A N/A N/AN/A2.5% N/AN/A N/A <100
Yamhill
Dundee N/A N/A N/A N/A N/A N/A <100<10010.0% N/AN/A N/A <100
McMinnville N/A N/A N/A N/A N/A 576 71864610% N/AN/A N/A 951
Newberg 216 352 416 472 512 681 9969529.0% 120129 121 1,119
Note: Values listed as N/A are missing, unavailable, or did not have a lodging tax at that time, values listed as <100 are suppressed to limited amount of tax collections, those with more current information or corrections are encouraged to contact Dean Runyan Associates. Rate corresponds to the rate in effect at the end of the last reported fiscal year. Many tax rates have changed over the reported time period. The Coquille Indian Tribe in Coos County began collecting its own tax on January 1, 2010. Prior to that date, receipts were included with North Bend. *All jurisdictions in Baker County have a 5.0% rate from November through April, and a 7.0% rate from May through October.
DEAN RUNYAN ASSOCIATES Page 214
This page intentionally blank
DEAN RUNYAN ASSOCIATESPage 215
APPENDICES
Appendix A 2017 Travel Impact Estimates
Appendix B Key Terms and Definitions
Appendix C Regional Travel Impact Model
Appendix D Travel Industry Accounts
Appendix E Oregon Earnings and Employment by Industry Sector
Appendix F Industry Groups
Appendix G Split-County Trends
DEAN RUNYAN ASSOCIATES Page 216
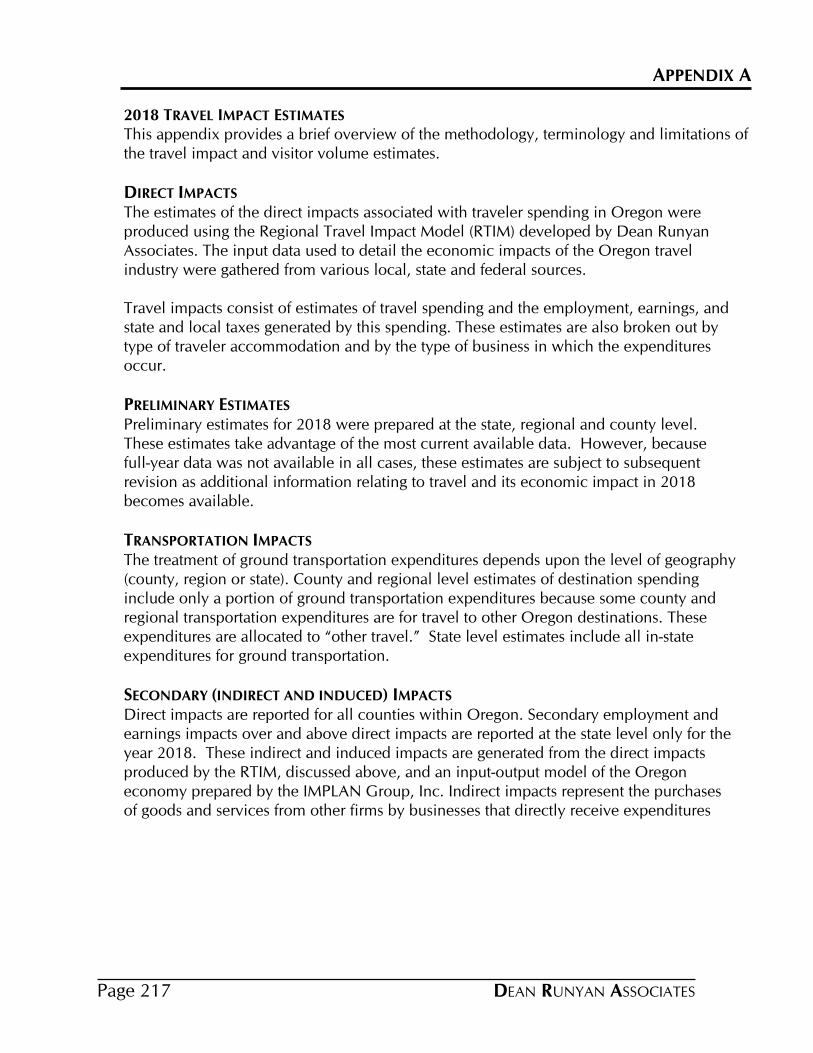
APPENDIX A
2018 TRAVEL IMPACT ESTIMATES
This appendix provides a brief overview of the methodology, terminology and limitations of the travel impact and visitor volume estimates.
DIRECT IMPACTS
The estimates of the direct impacts associated with traveler spending in Oregon were produced using the Regional Travel Impact Model (RTIM) developed by Dean Runyan Associates. The input data used to detail the economic impacts of the Oregon travel industry were gathered from various local, state and federal sources.
Travel impacts consist of estimates of travel spending and the employment, earnings, and state and local taxes generated by this spending. These estimates are also broken out by type of traveler accommodation and by the type of business in which the expenditures occur.
PRELIMINARY ESTIMATES
Preliminary estimates for 2018 were prepared at the state, regional and county level. These estimates take advantage of the most current available data. However, because full-year data was not available in all cases, these estimates are subject to subsequent revision as additional information relating to travel and its economic impact in 2018 becomes available.
TRANSPORTATION IMPACTS
The treatment of ground transportation expenditures depends upon the level of geography (county, region or state). County and regional level estimates of destination spending include only a portion of ground transportation expenditures because some county and regional transportation expenditures are for travel to other Oregon destinations. These expenditures are allocated to “other travel.” State level estimates include all in-state expenditures for ground transportation.
SECONDARY (INDIRECT AND INDUCED) IMPACTS
Direct impacts are reported for all counties within Oregon. Secondary employment and earnings impacts over and above direct impacts are reported at the state level only for the year 2018. These indirect and induced impacts are generated from the direct impacts produced by the RTIM, discussed above, and an input-output model of the Oregon economy prepared by the IMPLAN Group, Inc. Indirect impacts represent the purchases of goods and services from other firms by businesses that directly receive expenditures
DEAN RUNYAN ASSOCIATESPage 217
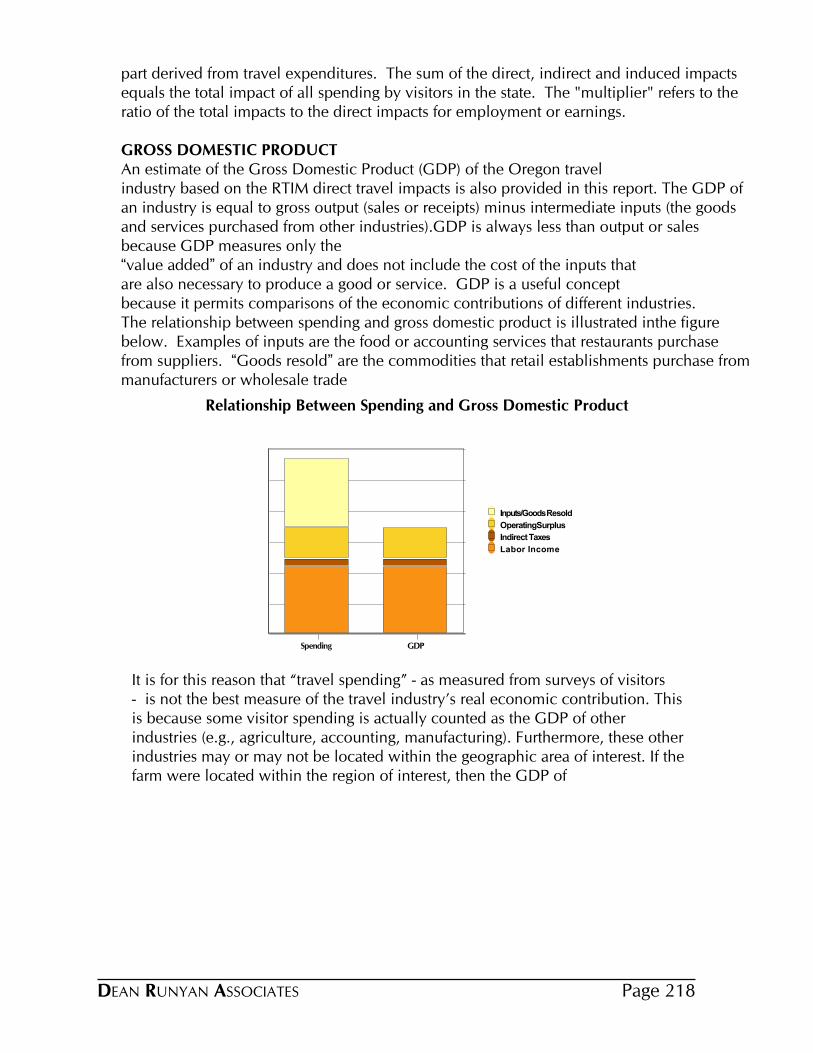
part derived from travel expenditures. The sum of the direct, indirect and induced impacts equals the total impact of all spending by visitors in the state. The "multiplier" refers to the ratio of the total impacts to the direct impacts for employment or earnings.
GROSS DOMESTIC PRODUCTAn estimate of the Gross Domestic Product (GDP) of the Oregon travelindustry based on the RTIM direct travel impacts is also provided in this report. The GDP of an industry is equal to gross output (sales or receipts) minus intermediate inputs (the goods and services purchased from other industries).GDP is always less than output or sales because GDP measures only the“value added” of an industry and does not include the cost of the inputs thatare also necessary to produce a good or service. GDP is a useful conceptbecause it permits comparisons of the economic contributions of different industries.The relationship between spending and gross domestic product is illustrated inthe figure below. Examples of inputs are the food or accounting services that restaurants purchase from suppliers. “Goods resold” are the commodities that retail establishments purchase from manufacturers or wholesale trade
Relationship Between Spending and Gross Domestic Product
Inputs/Goods Resold
OperatingSurplus
Indirect Taxes
Labor Income
Spending GDP
It is for this reason that “travel spending” - as measured from surveys of visitors- is not the best measure of the travel industry’s real economic contribution. This is because some visitor spending is actually counted as the GDP of other industries (e.g., agriculture, accounting, manufacturing). Furthermore, these other industries may or may not be located within the geographic area of interest. If the farm were located within the region of interest, then the GDP of
DEAN RUNYAN ASSOCIATES Page 218
the local farm would be included as an indirect or secondary effect. If not (e.g., a manufacturing firm in another state or country), then that portion of GDP is not counted.The preceding graph also shows the three main components of GDP. For most industries, labor income (essentially equivalent to earnings in this report) is the primary component of GDP. This is true of the travel industry. A second component is the tax payments that businesses make to government, such as sales, excise and property taxes. In the case of excise taxes, businesses are essentially a collection agency for the government. The final component, operating surplus, represents the income and payments (e.g., dividends, interest) to other stakeholders of the firm.The concept of GDP also illustrates that with small geographic units of analysis (e.g., counties), earnings, employment, and tax revenues are the best measures of the economic value of the travel industry to the local economy. Small area measures of GDP are less reliable and much of the operating surplus may leak out of the local economy anyway. Indirect effects are also generally less in smaller economies.
INTERPRETATION OF IMPACT ESTIMATESUsers of this report should be aware of several issues regarding the interpretation of the impact estimates contained herein:
· The estimates contained in this report are based on the most current data available and supersede all previous estimates of travel impacts.
· The estimates in this report are expressed in current dollars unless otherwise noted.
· The employment estimates in this report are estimates of the total number of full and part-time jobs directly generated by travel spending, rather than the number of individuals employed. Both payroll and self-employment are included in these estimates. Caution should therefore be used in comparing these estimates with other employment data series.
· In general, estimates of small geographic areas (e.g., rural counties) are less reliable than estimates for regions or metropolitan counties. Trend analysis and comparisons of counties with relatively low levels of travel related economic activity should therefore be interpreted cautiously.
· The estimates of travel impacts published in this report will necessarily differ somewhat from estimates generated from different models, methodologies and data sources. Nonetheless, it should be emphasized that all credible estimates of direct travel impacts at the state level, including those of Dean Runyan Associates, are of similar magnitude.
DEAN RUNYAN ASSOCIATESPage 219
APPENDIX B
DEFINITION OF TERMS
Commodity: A classification of a product or service, such as lodging or food service. An establishment or industry may produce more than one commodity.
Direct Impacts: Employment, earnings and tax receipts directly generated by travel spending, as distinguished from secondary and total impacts.
Earnings: Earnings include wage and salary disbursements, other earned income or benefits, and proprietor income. Only the earnings attributable to travel expenditures are included.
Employment: Industry employment (jobs) associated with travel-generated earnings. Includes both full-time and part-time positions, and salaried or self-employed individuals. Employment is reported as an average for a time period, typically annual. (Unless otherwise noted, the employment estimates refer to establishment or industry employment at place of work, not the employment status or residence of the individual.)
Federal Taxes: Federal taxes include the motor fuel excise tax, airline ticket taxes, and personal income and payroll taxes.
Industry: A classification of business or government establishments based on their primary technological process. (See NAICS Appendix table.)
Local Taxes: Lodging taxes imposed by cities, counties and other regional tax jurisdictions in Oregon. These taxes are levied on sales to visitors and the spending of employees attributable to travel industry earnings. Passenger Facility Charges attributable to visitors (a fee imposed on airline tickets) are included in counties with airports. Property tax payments attributable to travel industry businesses and employees are also included.
Other spending: Other spending includes spending by residents on ground and air transportation for travel to other destinations, spending on travel arrangement services, and convention/ trade shows.
Private Home: Unpaid overnight accommodations of friends and relatives.
Receipts: Travel expenditures less the sales and excise taxes paid by the consumer.
State Taxes: Lodging taxes, motor fuel, and business and personal income taxes imposed by the state of Oregon. These taxes are levied on sales to visitors and the spending of employees attributable to travel industry earnings.
Total Impacts: The sum of Direct and Secondary impacts.
Travel spending: The sum of visitor and other spending related to travel.
Visitor spending: All spending on goods & services by visitors at the destination. Also referred to as destination spending.
DEAN RUNYAN ASSOCIATES Page 220
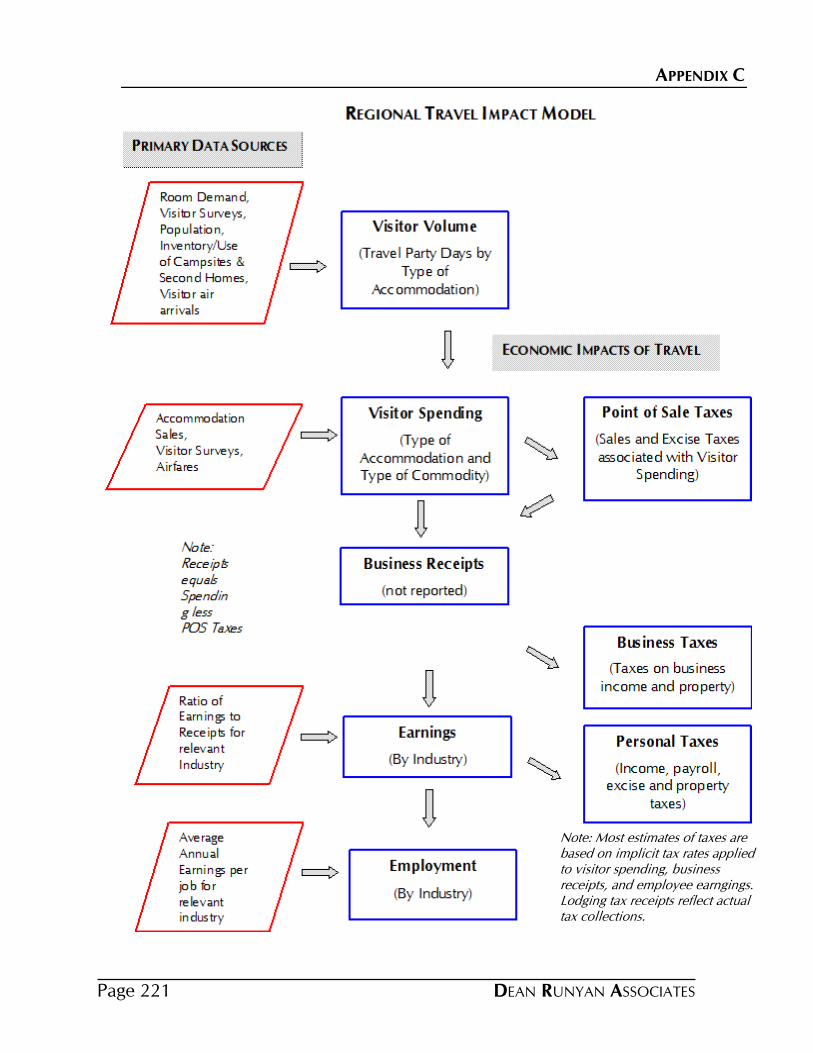
APPENDIX C
Note: Most estimates of taxes are based on implicit tax rates applied to visitor spending, business receipts, and employee earngings. Lodging tax receipts reflect actual tax collections.
DEAN RUNYAN ASSOCIATESPage 221
APPENDIX D
TRAVEL INDUSTRY ACCOUNTS: A COMPARISON OF THE
REGIONAL TRAVEL IMPACT MODEL AND
TRAVEL & TOURISM SATELLITE ACCOUNTS
An economic account is a method for displaying inter-related information about a set of economic activities. A travel industry account is a method to report different types of related information about the purchase of goods and services by visitors. The Bureau of Economic Analysis (BEA), which now provides annual and quarterly estimates of travel and tourism at the national level, describes a Travel and Tourism Satellite Account (TTSA) as “present(ing) a rearrangement of information from the National Income and Product Accounts, from the industry accounts, and from other sources so that travel and tourism activities can be analyzed more completely than is possible in the structure of the traditional national economic accounts.”[1] Similarly, the RTIM has been developed by Dean Runyan Associates to estimate travel spending, earnings, employment, and tax receipts at the state, county, and regional levels. These initial findings can, in turn, be used as input data for deriving estimates of other economic measures, such as value-added and indirect effects.
This appendix provides an overview of the Regional Travel Impact Model (RTIM) and travel and tourism satellite accounts (TTSAs). Although there is no single or absolute form of a TTSA, the one developed by the Bureau of Economic Analysis (BEA) will be the basis of the analysis here. The definitions, framework, and estimating methods used for the U.S. BEA TTSA follow, as closely as is practicable, the guidelines for similar travel satellite accounts that were developed by the World Tourism Organization (WTO) and the Organization for Economic Co-operation and Development (OECD).
The primary focus is on the direct impacts of visitor spending. Visitors are defined as persons that stay overnight away from home, or travel more than fifty miles one- way on a non-routine trip. Only the expenditures related to specific trips are counted as visitor spending. Other travel related expenditures such as the consumption of durable goods (e.g., recreational vehicles or sporting equipment) or the purchase of vacation homes are not considered.
While such a definition of the travel industry (i.e., the trip related expenditures of visitors) is conservative, it is also in keeping with the notion of the travel industry as being an export-oriented industry for specific local communities. That is, visitors are important to regions because they inject money into the local economy. This focus on the export-oriented nature of the travel industry for local communities becomes blurred if the industry is defined so as to include non-trip related expenditures.
[1] Peter D. Kuhbach, Mark A. Planting, and Erich H. Strassner, “U.S. Travel and Tourism Satellite Accounts for 1998-2003,” Survey of Current Business 84 (September 2004): 43-59.
DEAN RUNYAN ASSOCIATES Page 222
PRIMARY CONCEPTS, CATEGORIES & DATA REQUIREMENTS
There are three primary types of information that are measured and/or estimated in a travel industry account. The first is a measure of the travel industry in terms of both the characteristics of the business firms that sell travel goods and services and the characteristics of consumers that purchase travel industry goods and services. The second is a measure of the demand segments that consume travel industry goods and services. For example, the distinction between business and leisure travel is a measure of demand segments. The third is a measure of the components of economic output associated with the travel industry. The employee earnings generated by visitor spending is one such component. Travel-generated tax receipts are another. These three categories of information represent different aspects of the accounting ledger - they represent different ways of viewing or analyzing the travel industry.
The bulk of this paper will discuss these three types of information in terms of their conceptual foundations, the data requirements, and some of the more salient issues that users of this information should be aware of. There will also be some discussion of indirect and induced effects in that these effects can be reasonably estimated from the direct travel industry accounts. These secondary (versus direct) effects describe the relationship of the travel industry to other sectors of the larger economy.
The intent of this discussion will be to provide a general overview of the process of constructing travel industry accounts and the underlying similarity between the RTIM and a TTSA. More technical issues are generally placed in footnotes.
TRAVEL INDUSTRY
Defining the travel industry is probably the most critical and data intensive effort involved in developing a travel industry account. It is an exercise in matching supply (sellers of goods and services) with demand (the travelers that purchase those particular goods and services). It is complicated by the fact that no single industrial classification scheme provides a valid measure of the travel industry.2 There are only three significant industrial classifications (Accommodations [NAICS 721], Scheduled Passenger Air Transportation [NAICS 481111] and Travel Arrangement and Reservation Services [NAICS 5615]) that primarily sell travel industry goods and services.3 Firms in other industries (retail, recreation, transportation) provide goods and services to both travelers and other types of consumers.
Because of this, most satellite accounts, as well as the RTIM, incorporate at least some information about the expenditures of visitors in order to define the supply of
2 The North American Industrial Classification System (NAICS) is the current standard in the United States.3 Even these industries are not purely travel. For example, the accommodations industry provides services to local residents (food service and meeting rooms). Passenger airlines also ship cargo on the same planes that carry passengers. Fortunately, it is usually possible to make adjustments for these non-travel components through the use of additional data.
DEAN RUNYAN ASSOCIATESPage 223
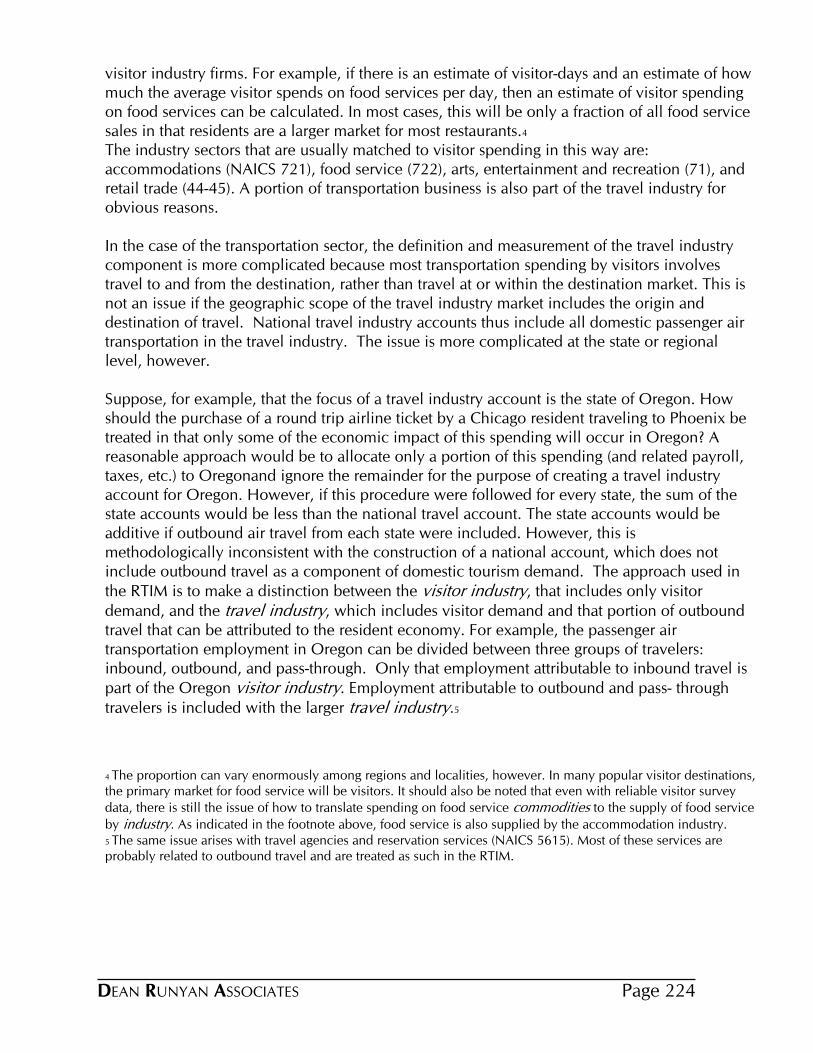
visitor industry firms. For example, if there is an estimate of visitor-days and an estimate of how much the average visitor spends on food services per day, then an estimate of visitor spending on food services can be calculated. In most cases, this will be only a fraction of all food service sales in that residents are a larger market for most restaurants.4
The industry sectors that are usually matched to visitor spending in this way are: accommodations (NAICS 721), food service (722), arts, entertainment and recreation (71), and retail trade (44-45). A portion of transportation business is also part of the travel industry for obvious reasons.
In the case of the transportation sector, the definition and measurement of the travel industry component is more complicated because most transportation spending by visitors involves travel to and from the destination, rather than travel at or within the destination market. This is not an issue if the geographic scope of the travel industry market includes the origin and destination of travel. National travel industry accounts thus include all domestic passenger air transportation in the travel industry. The issue is more complicated at the state or regional level, however.
Suppose, for example, that the focus of a travel industry account is the state of Oregon. How should the purchase of a round trip airline ticket by a Chicago resident traveling to Phoenix be treated in that only some of the economic impact of this spending will occur in Oregon? A reasonable approach would be to allocate only a portion of this spending (and related payroll, taxes, etc.) to Oregonand ignore the remainder for the purpose of creating a travel industry account for Oregon. However, if this procedure were followed for every state, the sum of the state accounts would be less than the national travel account. The state accounts would be additive if outbound air travel from each state were included. However, this is methodologically inconsistent with the construction of a national account, which does not include outbound travel as a component of domestic tourism demand. The approach used in the RTIM is to make a distinction between the visitor industry, that includes only visitor demand, and the travel industry, which includes visitor demand and that portion of outbound travel that can be attributed to the resident economy. For example, the passenger air transportation employment in Oregon can be divided between three groups of travelers: inbound, outbound, and pass-through. Only that employment attributable to inbound travel is part of the Oregon visitor industry. Employment attributable to outbound and pass- through travelers is included with the larger travel industry.5
4 The proportion can vary enormously among regions and localities, however. In many popular visitor destinations, the primary market for food service will be visitors. It should also be noted that even with reliable visitor survey data, there is still the issue of how to translate spending on food service commodities to the supply of food service
by industry. As indicated in the footnote above, food service is also supplied by the accommodation industry.5 The same issue arises with travel agencies and reservation services (NAICS 5615). Most of these services are probably related to outbound travel and are treated as such in the RTIM.
DEAN RUNYAN ASSOCIATES Page 224
Bureau of Economic Analysis Tourism Industries Distribution of Travel-Generated Compensation
in United States, 2007
Accommodation & Food Services 38.1%
Traveler accommodations 21.5%
Food services and drinking places 16.6%
Transportation 23.3%
Air transportation 15.4%
Rail transportation 0.4%
Water transportation 1.2%
Interurban bus transportation 0.3%
Interurban charter bus transportation 0.2%
Urban transit systems & other tran. 1.7%
Taxi service 1.0%
Automotive equipment rental & leasing 2.0%
Automotive repair services 0.8%
Parking lots and garages 0.2%
Toll highways 0.1%
Recreation 11.2%
Scenic and sightseeing transportation 0.4%
Motion pictures and performing arts 1.1%
Spectator sports 2.3%
Participant sports 2.4%
Gambling 3.0%
All other recreation and entertainment 2.0%
Retail & Nondurable Goods Production 16.2%
Petroleum refineries 0.6%
Industries producing nondurable PCE
commodities, excluding petroleum refineries
4.4%
Wholesale trade & tran. services 4.2%
Gasoline service stations 1.3%
Retail trade services, excluding
gasoline service stations
5.8%
Travel Arrangement 7.3%
All other industries 2.2%
Total Tourism Compensation 100.0% Source: Adapted from Eric S. Griffith and Steven L. Zemanek, “U.S. Travel and Tourism Satellite Accounts for 2005-2008,” Survey of Current Business (June 2009): 37, table 6.
The following two tables display the specific industries that are included in the travel industry for the BEA’s national TTSA and the RTIM. Although not identical, the industries are equivalent with only a few exceptions.6
6 The major exception is that the BEA includes the production of consumer non-durables that are sold through retail outlets. This is not a major component and would be even less so at the level of the state.
DEAN RUNYAN ASSOCIATESPage 225
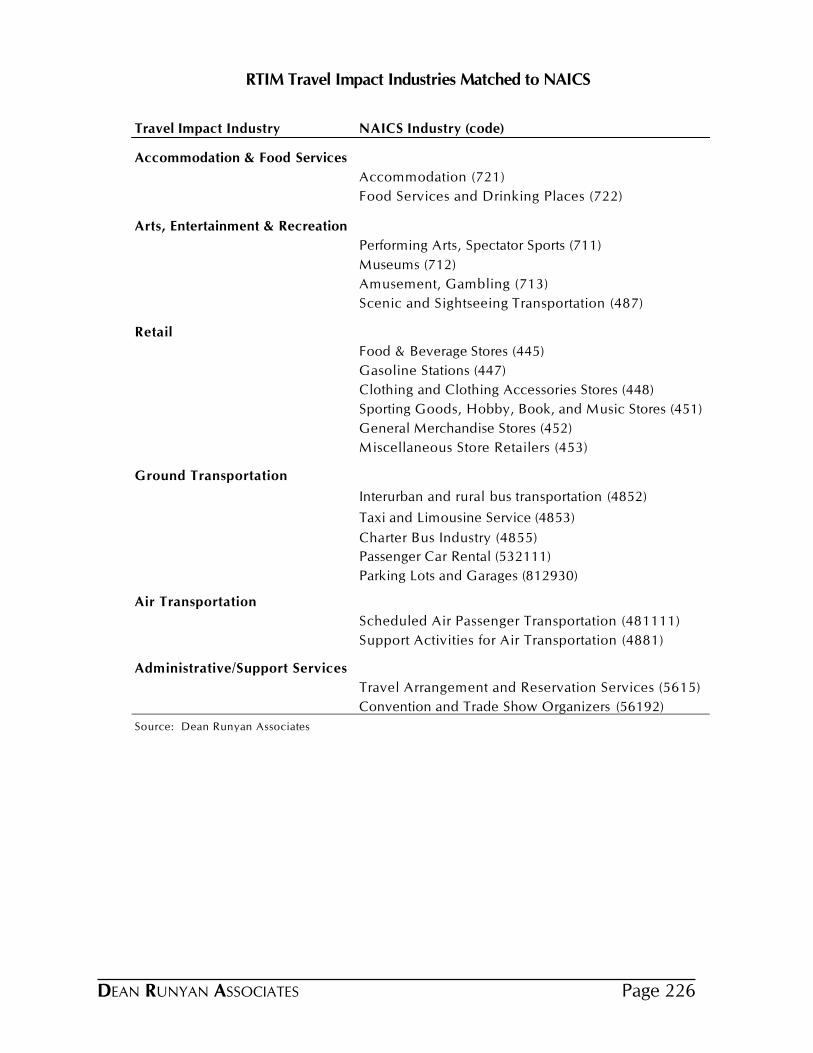
RTIM Travel Impact Industries Matched to NAICS
Travel Impact Industry NAICS Industry (code)
Accommodation & Food Services
Arts, Entertainment & Recreation
Retail
Ground Transportation
Air Transportation
Administrative/Support Services
Accommodation (721)
Food Services and Drinking Places (722)
Performing Arts, Spectator Sports (711)
Museums (712)
Amusement, Gambling (713)
Scenic and Sightseeing Transportation (487)
Food & Beverage Stores (445)
Gasoline Stations (447)
Clothing and Clothing Accessories Stores (448)
Sporting Goods, Hobby, Book, and Music Stores (451)
General Merchandise Stores (452)
Miscellaneous Store Retailers (453)
Interurban and rural bus transportation (4852)
Taxi and Limousine Service (4853)
Charter Bus Industry (4855)
Passenger Car Rental (532111)
Parking Lots and Garages (812930)
Scheduled Air Passenger Transportation (481111)
Support Activities for Air Transportation (4881)
Travel Arrangement and Reservation Services (5615)
Convention and Trade Show Organizers (56192)
Source: Dean Runyan Associates
DEAN RUNYAN ASSOCIATES Page 226
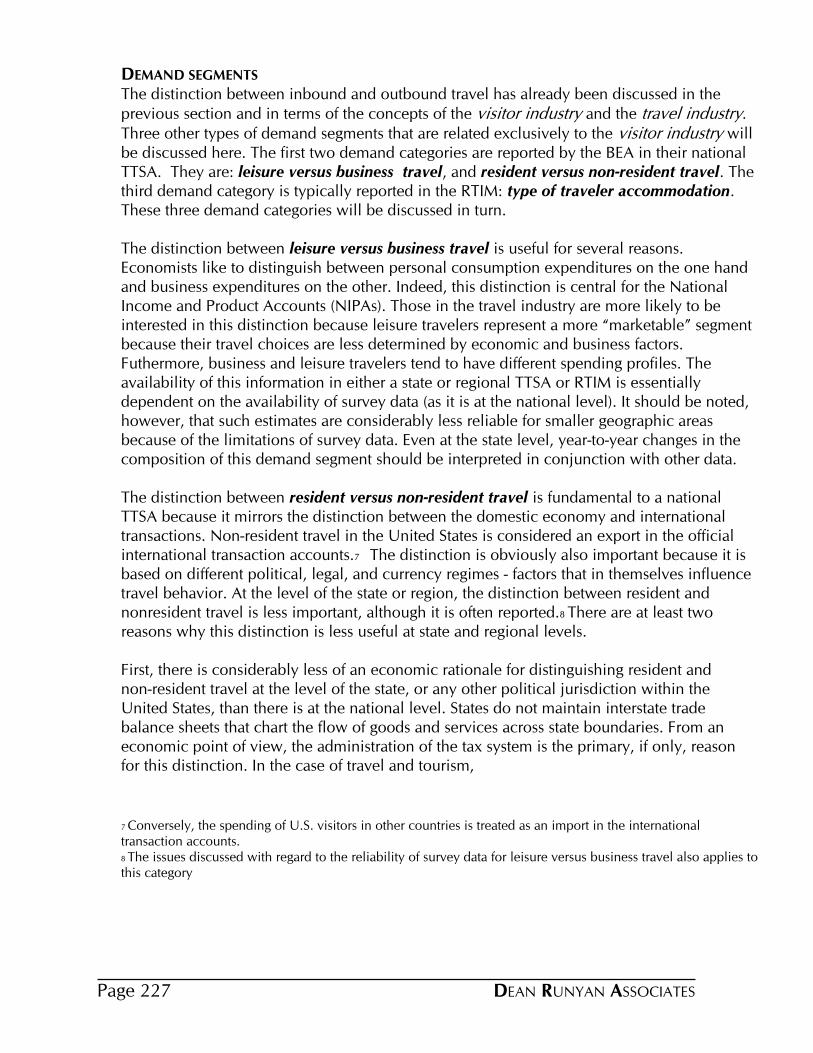
DEMAND SEGMENTS
The distinction between inbound and outbound travel has already been discussed in the previous section and in terms of the concepts of the visitor industry and the travel industry. Three other types of demand segments that are related exclusively to the visitor industry will be discussed here. The first two demand categories are reported by the BEA in their national TTSA. They are: leisure versus business travel, and resident versus non-resident travel. The third demand category is typically reported in the RTIM: type of traveler accommodation. These three demand categories will be discussed in turn.
The distinction between leisure versus business travel is useful for several reasons. Economists like to distinguish between personal consumption expenditures on the one hand and business expenditures on the other. Indeed, this distinction is central for the National Income and Product Accounts (NIPAs). Those in the travel industry are more likely to be interested in this distinction because leisure travelers represent a more “marketable” segment because their travel choices are less determined by economic and business factors. Futhermore, business and leisure travelers tend to have different spending profiles. The availability of this information in either a state or regional TTSA or RTIM is essentially dependent on the availability of survey data (as it is at the national level). It should be noted, however, that such estimates are considerably less reliable for smaller geographic areas because of the limitations of survey data. Even at the state level, year-to-year changes in the composition of this demand segment should be interpreted in conjunction with other data.
The distinction between resident versus non-resident travel is fundamental to a national TTSA because it mirrors the distinction between the domestic economy and international transactions. Non-resident travel in the United States is considered an export in the official international transaction accounts.7 The distinction is obviously also important because it is based on different political, legal, and currency regimes - factors that in themselves influence travel behavior. At the level of the state or region, the distinction between resident and nonresident travel is less important, although it is often reported.8 There are at least two reasons why this distinction is less useful at state and regional levels.
First, there is considerably less of an economic rationale for distinguishing resident and non-resident travel at the level of the state, or any other political jurisdiction within the United States, than there is at the national level. States do not maintain interstate trade balance sheets that chart the flow of goods and services across state boundaries. From an economic point of view, the administration of the tax system is the primary, if only, reason for this distinction. In the case of travel and tourism,
7 Conversely, the spending of U.S. visitors in other countries is treated as an import in the international transaction accounts.8 The issues discussed with regard to the reliability of survey data for leisure versus business travel also applies to this category
DEAN RUNYAN ASSOCIATESPage 227
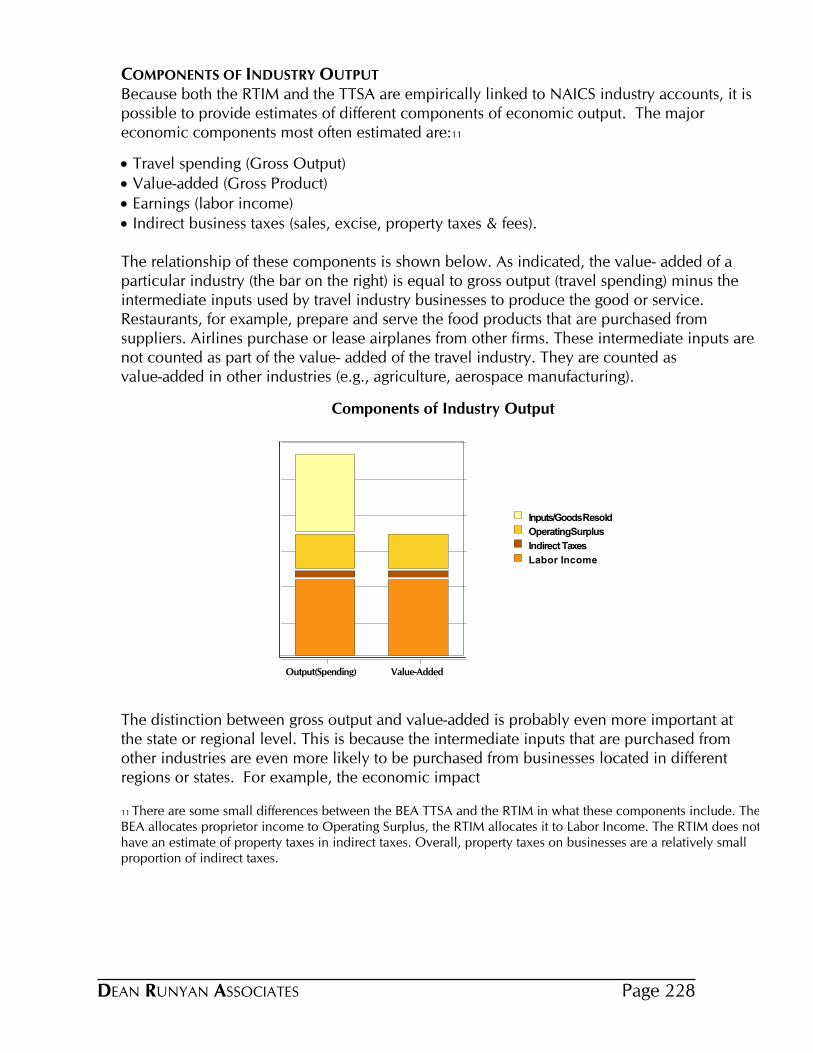
COMPONENTS OF INDUSTRY OUTPUT
Because both the RTIM and the TTSA are empirically linked to NAICS industry accounts, it is possible to provide estimates of different components of economic output. The major economic components most often estimated are:11
· Travel spending (Gross Output)· Value-added (Gross Product)· Earnings (labor income)· Indirect business taxes (sales, excise, property taxes & fees).
The relationship of these components is shown below. As indicated, the value- added of a particular industry (the bar on the right) is equal to gross output (travel spending) minus the intermediate inputs used by travel industry businesses to produce the good or service. Restaurants, for example, prepare and serve the food products that are purchased from suppliers. Airlines purchase or lease airplanes from other firms. These intermediate inputs are not counted as part of the value- added of the travel industry. They are counted as value-added in other industries (e.g., agriculture, aerospace manufacturing).
Components of Industry Output
Inputs/Goods Resold
OperatingSurplus
Indirect Taxes
Labor Income
Output(Spending) Value-Added
The distinction between gross output and value-added is probably even more important at the state or regional level. This is because the intermediate inputs that are purchased from other industries are even more likely to be purchased from businesses located in different regions or states. For example, the economic impact
11 There are some small differences between the BEA TTSA and the RTIM in what these components include. The BEA allocates proprietor income to Operating Surplus, the RTIM allocates it to Labor Income. The RTIM does not have an estimate of property taxes in indirect taxes. Overall, property taxes on businesses are a relatively small proportion of indirect taxes.
DEAN RUNYAN ASSOCIATES Page 228
of air passenger travel in the state of Hawaii should not include the purchase of airplanes manufactured in other parts of the world. Travel industry value-added is a more meaningful measure of the true economic impact of visitor spending in Hawaii because a portion of the economic impact of visitor spending in the state will actually occur elsewhere.12
Value-added can also be viewed in terms of the distribution or payout of industry receipts, exclusive of those paid to other firms for intermediate inputs. Some of the receipts are distributed to labor as wages, benefits, and proprietor income. Some receipts are paid to government as indirect taxes. These taxes are called “indirect” because most of them are actually paid by consumers in the form of sales or excise taxes.13 The remainder leaves gross operating surplus. Out of gross operating surplus various payments are made in the form of dividends, interest, and other payments, or retained by the firm. The sum of these three broad categories of payments is equal to travel industry value-added. To summarize:
Value-added = Spending less intermediate goods & services, or Value-added = Labor Income plus indirect business taxes plus gross operating surplus.
The RTIM is similar to the TTSA in that it also provides estimates of these components of economic output. Travel spending, earnings, and tax impacts are generally provided at the state or regional level. Value-added is generally reported at the state-level only (sometimes referred to as Travel Industry Gross State Product). At the level of the state, travel industry value-added or GSP is an important measure -- more economically meaningful than travel spending.14 For smaller geographic areas, however, the rationale for reporting value-added is less clear. First, there are real data limitations and data costs in deriving these estimates. Second, the most important components of value added for the travel industry are earnings and tax receipts. Because the travel industry is relatively labor intensive and because a large proportion of travel industry goods and services are subject to excise and sales taxes, these two components of value-added (labor income and indirect taxes) are relatively high for the travel industry. The local effects of gross operating surplus are generally less important and certainly much more difficult to assess than are earnings and tax impacts. The relevance of earnings and tax receipts is also in keeping the export-oriented emphasis of the travel industry: earnings and tax receipts are more likely to stay in the local economy than is operating surplus.
12 It should also be noted the value of the intermediate inputs used by travel industry firms will not necessarily disappear if the travel industry stops buying them. Aerospace firms will shift their production to other users (e.g., military). Agriculture will seek new markets for their products.13 Other taxes included here are property taxes, business franchise taxes, and other fees. Income taxes are not included, because they are paid out of operating surplus.14 It is also possible to compare different industries with respect to their value-added. It is more difficult and less useful to compare industries on the basis of sales.
DEAN RUNYAN ASSOCIATESPage 229
INDIRECT, INDUCED AND SECONDARY EFFECTS
To this point, the discussion of travel industry accounts has referred only to the direct output components. That is, the ripple effects of the re-spending of travel industry receipts throughout the larger economy have not been analyzed. The structure of both the TTSA and the RTIM permit such analysis.
· Indirect effects refer to the intermediate inputs used to produce the final product or service, providing that those inputs are themselves produced within the designated geographic area.
· Induced effects refer to the purchase of goods and services by employees that are attributable to direct and indirect impacts. These induced impacts are derived from economic data that describe the purchasing patterns of households. For example, employees of all the designated export-oriented industries will spend their income on food, household durables, health care, and so on.
· The sum of indirect and induced impacts is sometimes referred to as the secondary effect. These secondary impacts may be as great or greater than the direct impact alone.
· The ratio of the total effects (direct plus either indirect, induced, or secondary) to the direct effects is the multiplier.
The BEA reports the indirect components of economic output. This is equivalent to domestic travel spending less the goods and services imported from abroad to meet domestic demand. For travel, these imports would include souvenirs manufactured in China and petroleum extracted in Saudi Arabia. The indirect output multiplier for 2002 was 1.76. The ratio of domestic travel spending to travel industry value-added was 1.88. The difference reflects the intermediate inputs for travel imported from abroad.
At the state level, these indirect output multipliers are typically lower because relatively more of the intermediate inputs are purchased from outside of the state. At the county or metropolitan level, the multipliers are generally even lower for the same reason. Furthermore, the estimates are usually less reliable because of the data limitations of the regional input-output model used to estimate the indirect effects.
The BEA does not report induced effects - the effect of household spending of the direct and indirect labor income. Typically, these induced effects will be larger than the indirect effects at the state or regional level, in part because they are based on both the direct and indirect components.15 As with indirect effects, the induced effects will also tend to be lower for smaller economic areas and the reliability of the estimates will be less.
15 The induced effects can be estimated with the Implan model maintained by the Minnesota Implan Group.
DEAN RUNYAN ASSOCIATES Page 230
Secondary effects should be interpreted cautiously. These effects describe the relationship of economic transactions at a point in time. These relationships will not necessarily remain constant with a change in direct economic output. This is because all economic resources have alternative uses. Because of this, it is often difficult to determine the effect of an increase or decrease in visitor spending on the larger economic system over time.
THE REGIONAL TRAVEL IMPACT MODEL AND TRAVEL & TOURISM SATELLITE ACCOUNTS
COMPARED
This appendix has provided an overview of Dean Runyan Associates RTIM and the Bureau of Economic Analysis’ domestic TTSA. These travel industry accounts are similar in terms of how they define the travel industry and the measures of the industry that are reported. The differences stem largely from their different levels of analysis - the BEA provides estimates at the national level only, while the RTIM’s are typically constructed on a state or regional level. Because of this geographic focus, the RTIM provides a distinction between the visitor industry and the travel industry. The RTIM also provides measures of all of the components of economic output and secondary effects at the state or large region level. At smaller units of analysis, however, the emphasis is on earnings and tax receipts generated by travel spending as these are the most reliable and meaningful measures of the economic impact of travel at the local level.
DEAN RUNYAN ASSOCIATESPage 231
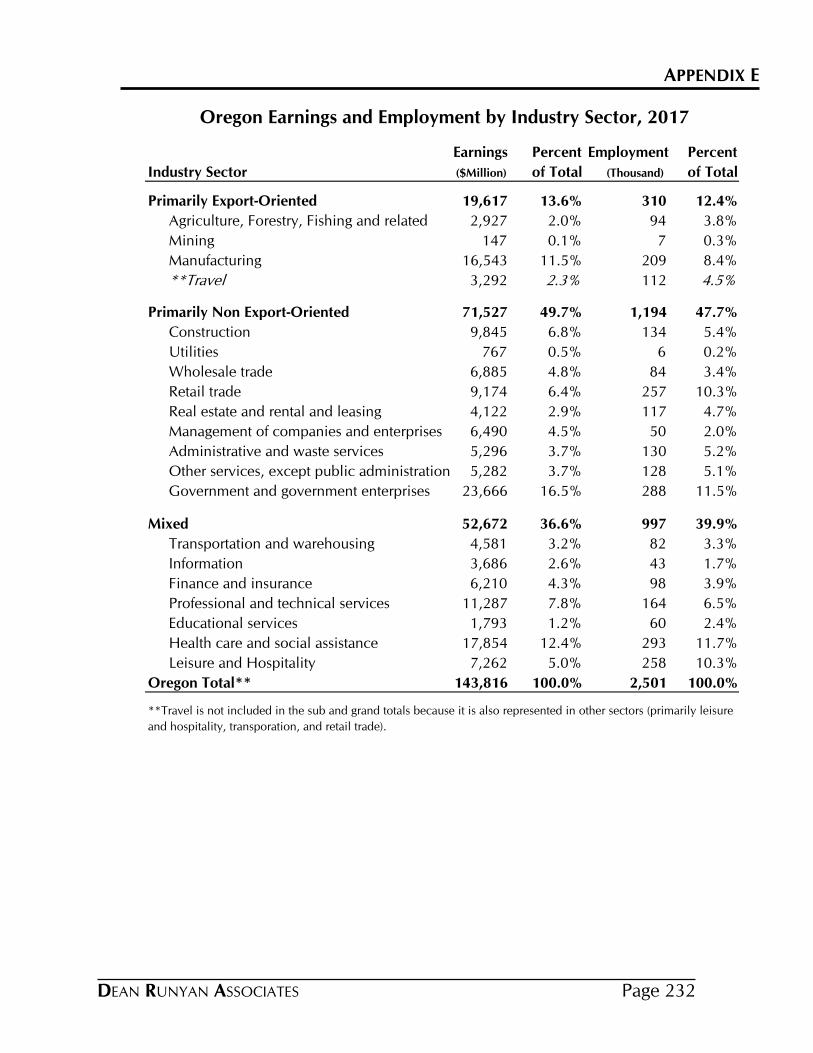
APPENDIX E
Earnings Percent Employment Percent
Industry Sector ($Million) of Total (Thousand) of Total
Primarily Export-Oriented 19,617 13.6% 310 12.4%
Agriculture, Forestry, Fishing and related 2,927 2.0% 94 3.8%
Mining 147 0.1% 7 0.3%
Manufacturing 16,543 11.5% 209 8.4%
**Travel 3,292 2.3% 112 4.5%
Primarily Non Export-Oriented 71,527 49.7% 1,194 47.7%
Construction 9,845 6.8% 134 5.4%
Utilities 767 0.5% 6 0.2%
Wholesale trade 6,885 4.8% 84 3.4%
Retail trade 9,174 6.4% 257 10.3%
Real estate and rental and leasing 4,122 2.9% 117 4.7%
Management of companies and enterprises 6,490 4.5% 50 2.0%
Administrative and waste services 5,296 3.7% 130 5.2%
Other services, except public administration 5,282 3.7% 128 5.1%
Government and government enterprises 23,666 16.5% 288 11.5%
Mixed 52,672 36.6% 997 39.9%
Transportation and warehousing 4,581 3.2% 82 3.3%
Information 3,686 2.6% 43 1.7%
Finance and insurance 6,210 4.3% 98 3.9%
Professional and technical services 11,287 7.8% 164 6.5%
Educational services 1,793 1.2% 60 2.4%
Health care and social assistance 17,854 12.4% 293 11.7%
Leisure and Hospitality 7,262 5.0% 258 10.3%
Oregon Total** 143,816 100.0% 2,501 100.0%
Oregon Earnings and Employment by Industry Sector, 2017
**Travel is not included in the sub and grand totals because it is also represented in other sectors (primarily leisure
and hospitality, transporation, and retail trade).
DEAN RUNYAN ASSOCIATES Page 232
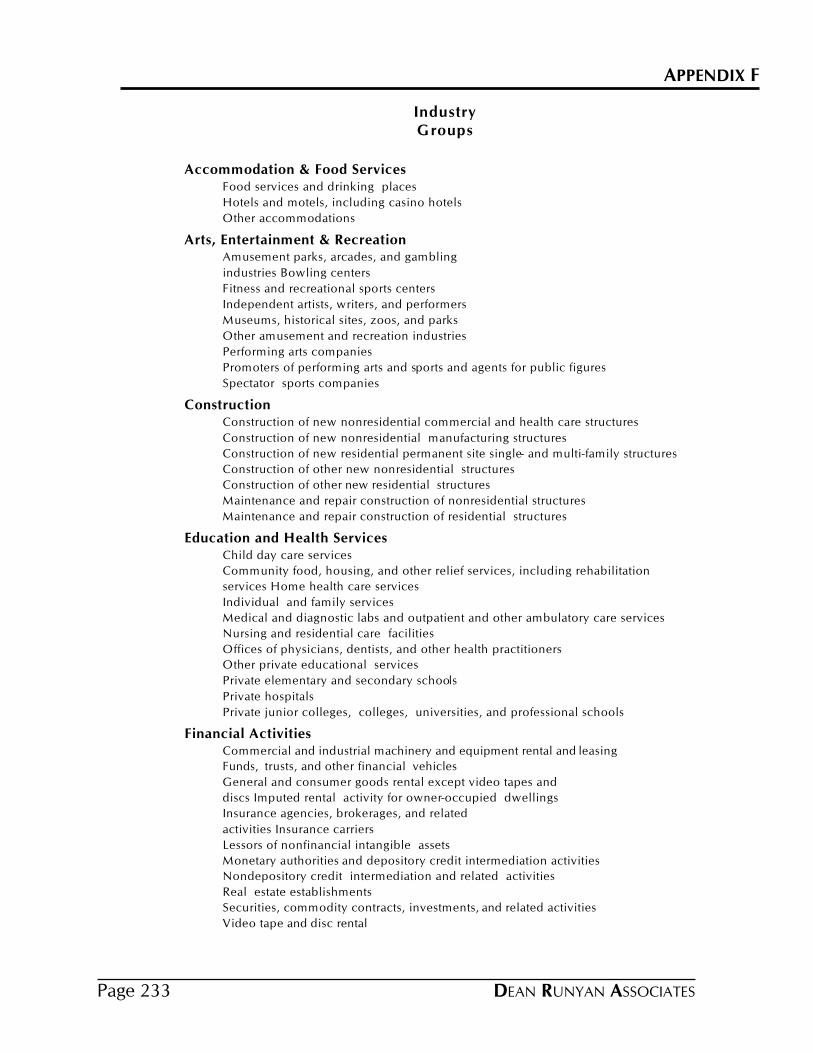
APPENDIX F
Industry Groups
Accommodation & Food Services Food services and drinking places
Hotels and motels, including casino hotels
Other accommodations
Arts, Entertainment & Recreation Amusement parks, arcades, and gambling
industries Bowling centers
Fitness and recreational sports centers
Independent artists, writers, and performers
Museums, historical sites, zoos, and parks
Other amusement and recreation industries
Performing arts companies
Promoters of performing arts and sports and agents for public figures
Spectator sports companies
Construction Construction of new nonresidential commercial and health care structures
Construction of new nonresidential manufacturing structures
Construction of new residential permanent site single- and multi-family structures
Construction of other new nonresidential structures
Construction of other new residential structures
Maintenance and repair construction of nonresidential structures
Maintenance and repair construction of residential structures
Education and Health Services Child day care services
Community food, housing, and other relief services, including rehabilitation
services Home health care services
Individual and family services
Medical and diagnostic labs and outpatient and other ambulatory care services
Nursing and residential care facilities
Offices of physicians, dentists, and other health practitioners
Other private educational services
Private elementary and secondary schools
Private hospitals
Private junior colleges, colleges, universities, and professional schools
Financial Activities Commercial and industrial machinery and equipment rental and leasing
Funds, trusts, and other financial vehicles
General and consumer goods rental except video tapes and
discs Imputed rental activity for owner-occupied dwellings
Insurance agencies, brokerages, and related
activities Insurance carriers
Lessors of nonfinancial intangible assets
Monetary authorities and depository credit intermediation activities
Nondepository credit intermediation and related activities
Real estate establishments
Securities, commodity contracts, investments, and related activities
Video tape and disc rental
DEAN RUNYAN ASSOCIATESPage 233
Information Book publishers
Cable and other subscription programming
Data processing, hosting, ISP, web search portals and related services
Directory, mailing list, and other publishers
Internet publishing and broadcasting
Motion picture and video industries
Newspaper publishers
Other information services
Periodical publishers
Radio and television broadcasting
Software publishers
Sound recording industries
Telecommunications
Manufacturing & Utilities
(280 industries)
Natural Resources and Mining All other crop farming
Animal production, except cattle and poultry and eggs
Cattle ranching and farming
Commercial Fishing
Commercial hunting and trapping
Commercial logging
Cotton farming
Dairy cattle and milk production
Drilling oil and gas wells
Extraction of oil and natural gas
Forestry, forest products, and timber tract production
Fruit farming
Grain farming
Greenhouse, nursery, and floriculture production
Mining and quarrying other nonmetallic minerals
Mining and quarrying sand, gravel, clay, and ceramic and refractory minerals
Mining and quarrying stone
Mining coal
Mining copper, nickel, lead, and zinc
Mining gold, silver, and other metal ore
Mining iron ore
Oilseed farming
Poultry and egg production
Sugarcane and sugar beet farming
Support activities for agriculture and forestry
Support activities for oil and gas operations
Support activities for other mining
Tobacco farming
Tree nut farming
Vegetable and melon farming
DEAN RUNYAN ASSOCIATES Page 234
Other Services Automotive repair and maintenance, except car washes
Car washes
Civic, social, professional, and similar organizations
Commercial and industrial machinery and equipment repair and maintenance
Death care services
Dry-cleaning and laundry services
Electronic and precision equipment repair and maintenance
Grantmaking, giving, and social advocacy organizations
Other personal services
Personal and household goods repair and maintenance
Personal care services
Private household operations
Religious organizations
Professional and Business Services Accounting, tax preparation, bookkeeping, and payroll services
Advertising and related services
All other miscellaneous professional, scientific, and technical services
Architectural, engineering, and related services
Business support services
Computer systems design services
Custom computer programming services
Employment services
Environmental and other technical consulting services
Facilities support services
Investigation and security services
Legal services
Management of companies and enterprises
Management, scientific, and technical consulting services
Office administrative services
Other computer related services, including facilities management
Other support services
Photographic services
Scientific research and development services
Services to buildings and dwellings
Specialized design services
Travel arrangement and reservation services
Veterinary services
Waste management and remediation services
Public Administration Federal electric utilities
Other Federal Government enterprises
Other state and local government enterprises
State and local government electric utilities
State and local government passenger transit
US Postal Service
DEAN RUNYAN ASSOCIATESPage 235
Trade Retail Nonstores - Direct and electronic sales
Retail Stores - Building material and garden supply
Retail Stores - Clothing and clothing accessories
Retail Stores - Electronics and appliances
Retail Stores - Food and beverage
Retail Stores - Furniture and home furnishings
Retail Stores - Gasoline stations
Retail Stores - General merchandise
Retail Stores - Health and personal care
Retail Stores - Miscellaneous
Retail Stores - Motor vehicle and parts
Retail Stores - Sporting goods, hobby, book and music
Wholesale trade businesses
Transport Automotive equipment rental and leasing
Couriers and messengers
Scenic and sightseeing transportation and support activities for transportation
Transit and ground passenger transportation
Transport by air
Transport by pipeline
Transport by rail
Transport by truck
Transport by water
Warehousing and storage
DEAN RUNYAN ASSOCIATES Page 236
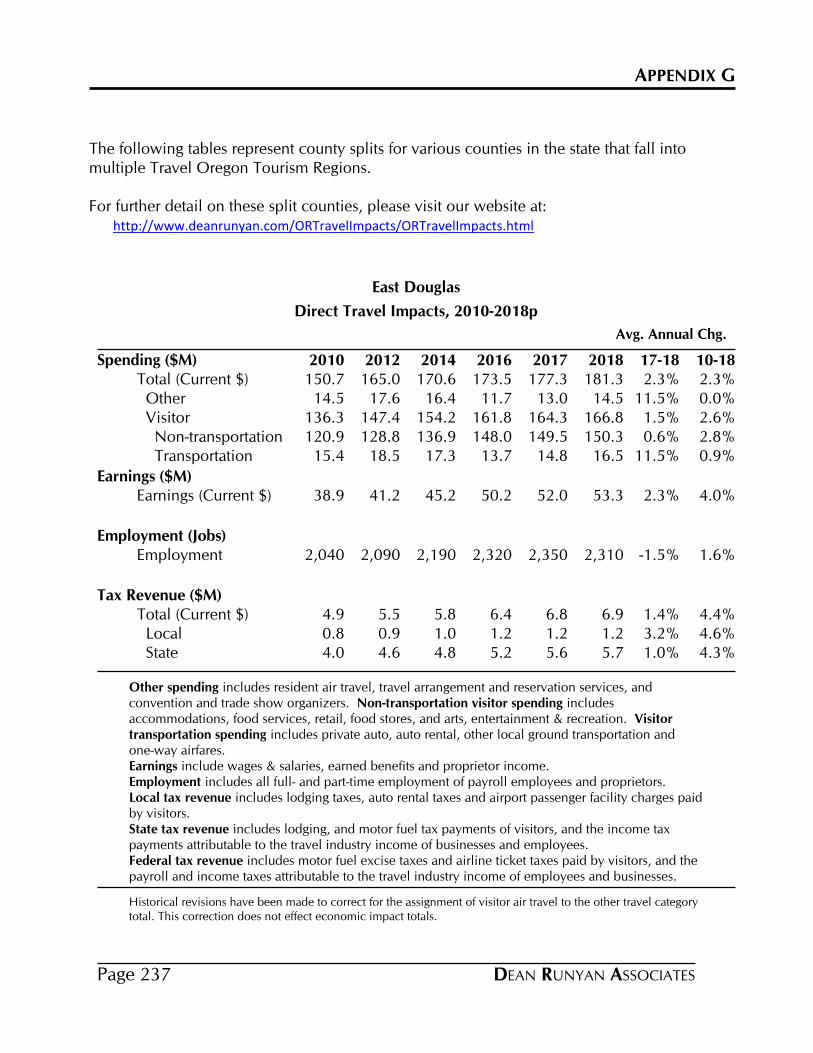
APPENDIX G
The following tables represent county splits for various counties in the state that fall into multiple Travel Oregon Tourism Regions.
For further detail on these split counties, please visit our website at:http://www.deanrunyan.com/ORTravelImpacts/ORTravelImpacts.html
Direct Travel Impacts, 2010-2018p
Avg. Annual Chg.
East Douglas
Spending ($M) 2010 2012 2014 2016 2017 2018 17-18 10-18Total (Current $) 150.7 165.0 170.6 173.5 177.3 181.3 2.3% 2.3% Other 14.5 17.6 16.4 11.7 13.0 14.5 11.5% 0.0% Visitor 136.3 147.4 154.2 161.8 164.3 166.8 1.5% 2.6% Non-transportation 120.9 128.8 136.9 148.0 149.5 150.3 0.6% 2.8% Transportation 15.4 18.5 17.3 13.7 14.8 16.5 11.5% 0.9%
Earnings ($M)Earnings (Current $) 38.9 41.2 45.2 50.2 52.0 53.3 2.3% 4.0%
Employment (Jobs)Employment 2,040 2,090 2,190 2,320 2,350 2,310 -1.5% 1.6%
Tax Revenue ($M)Total (Current $) 4.9 5.5 5.8 6.4 6.8 6.9 1.4% 4.4% Local 0.8 0.9 1.0 1.2 1.2 1.2 3.2% 4.6% State 4.0 4.6 4.8 5.2 5.6 5.7 1.0% 4.3%
Other spending includes resident air travel, travel arrangement and reservation services, and convention and trade show organizers. Non-transportation visitor spending includes accommodations, food services, retail, food stores, and arts, entertainment & recreation. Visitor transportation spending includes private auto, auto rental, other local ground transportation and one-way airfares.Earnings include wages & salaries, earned benefits and proprietor income.Employment includes all full- and part-time employment of payroll employees and proprietors.Local tax revenue includes lodging taxes, auto rental taxes and airport passenger facility charges paid by visitors.State tax revenue includes lodging, and motor fuel tax payments of visitors, and the income tax payments attributable to the travel industry income of businesses and employees.Federal tax revenue includes motor fuel excise taxes and airline ticket taxes paid by visitors, and the payroll and income taxes attributable to the travel industry income of employees and businesses.
Historical revisions have been made to correct for the assignment of visitor air travel to the other travel category total. This correction does not effect economic impact totals.
DEAN RUNYAN ASSOCIATESPage 237
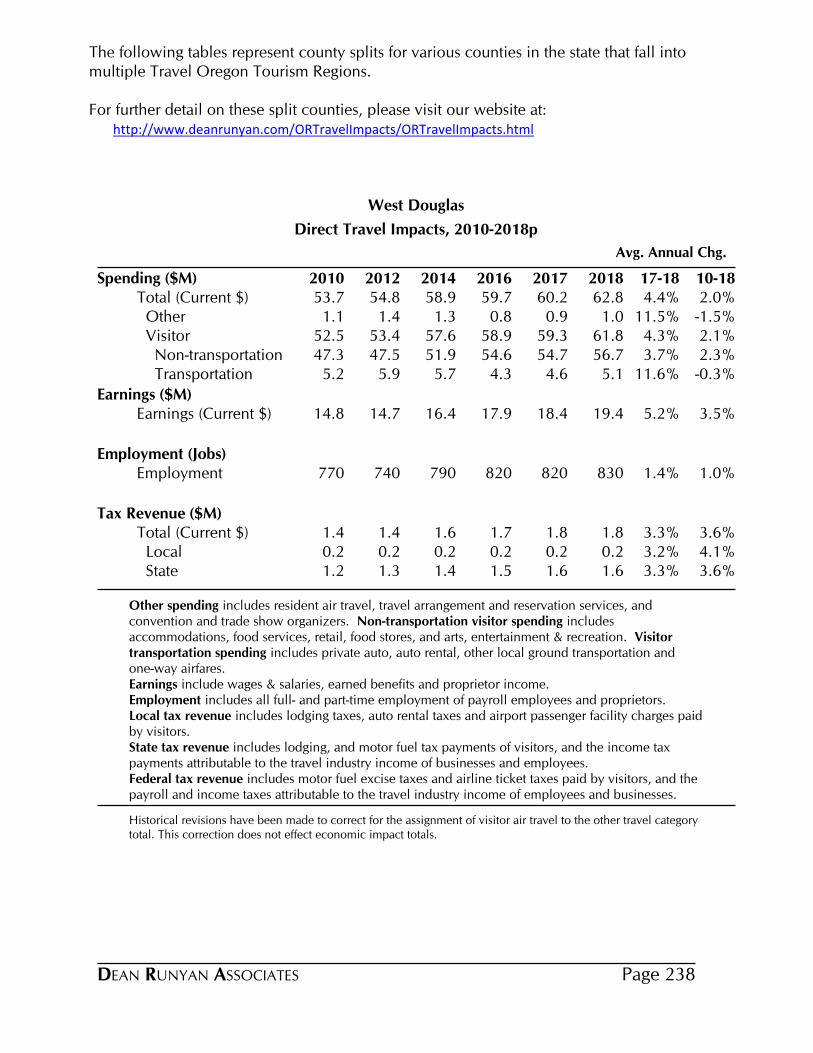
The following tables represent county splits for various counties in the state that fall into multiple Travel Oregon Tourism Regions.
For further detail on these split counties, please visit our website at:http://www.deanrunyan.com/ORTravelImpacts/ORTravelImpacts.html
Direct Travel Impacts, 2010-2018p
Avg. Annual Chg.
West Douglas
Spending ($M) 2010 2012 2014 2016 2017 2018 17-18 10-18Total (Current $) 53.7 54.8 58.9 59.7 60.2 62.8 4.4% 2.0% Other 1.1 1.4 1.3 0.8 0.9 1.0 11.5% -1.5% Visitor 52.5 53.4 57.6 58.9 59.3 61.8 4.3% 2.1% Non-transportation 47.3 47.5 51.9 54.6 54.7 56.7 3.7% 2.3% Transportation 5.2 5.9 5.7 4.3 4.6 5.1 11.6% -0.3%
Earnings ($M)Earnings (Current $) 14.8 14.7 16.4 17.9 18.4 19.4 5.2% 3.5%
Employment (Jobs)Employment 770 740 790 820 820 830 1.4% 1.0%
Tax Revenue ($M)Total (Current $) 1.4 1.4 1.6 1.7 1.8 1.8 3.3% 3.6% Local 0.2 0.2 0.2 0.2 0.2 0.2 3.2% 4.1% State 1.2 1.3 1.4 1.5 1.6 1.6 3.3% 3.6%
Other spending includes resident air travel, travel arrangement and reservation services, and convention and trade show organizers. Non-transportation visitor spending includes accommodations, food services, retail, food stores, and arts, entertainment & recreation. Visitor transportation spending includes private auto, auto rental, other local ground transportation and one-way airfares.Earnings include wages & salaries, earned benefits and proprietor income.Employment includes all full- and part-time employment of payroll employees and proprietors.Local tax revenue includes lodging taxes, auto rental taxes and airport passenger facility charges paid by visitors.State tax revenue includes lodging, and motor fuel tax payments of visitors, and the income tax payments attributable to the travel industry income of businesses and employees.Federal tax revenue includes motor fuel excise taxes and airline ticket taxes paid by visitors, and the payroll and income taxes attributable to the travel industry income of employees and businesses.
Historical revisions have been made to correct for the assignment of visitor air travel to the other travel category total. This correction does not effect economic impact totals.
DEAN RUNYAN ASSOCIATES Page 238
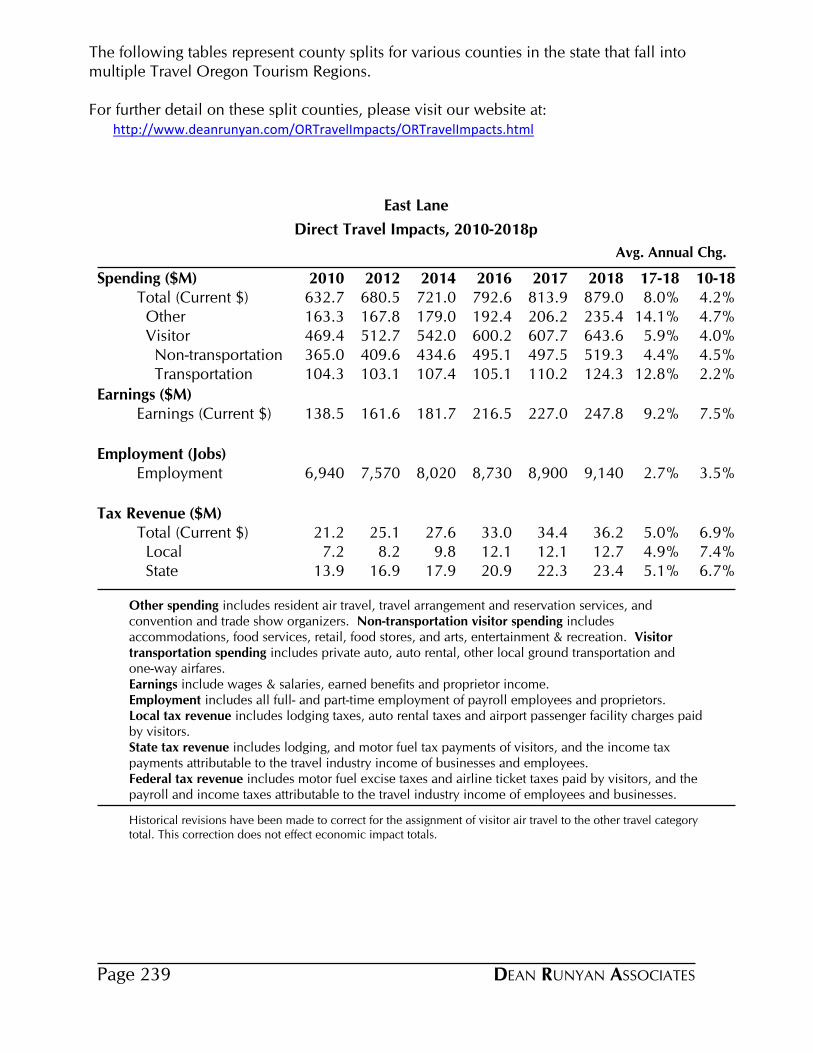
The following tables represent county splits for various counties in the state that fall into multiple Travel Oregon Tourism Regions.
For further detail on these split counties, please visit our website at:http://www.deanrunyan.com/ORTravelImpacts/ORTravelImpacts.html
Direct Travel Impacts, 2010-2018p
Avg. Annual Chg.
East Lane
Spending ($M) 2010 2012 2014 2016 2017 2018 17-18 10-18Total (Current $) 632.7 680.5 721.0 792.6 813.9 879.0 8.0% 4.2% Other 163.3 167.8 179.0 192.4 206.2 235.4 14.1% 4.7% Visitor 469.4 512.7 542.0 600.2 607.7 643.6 5.9% 4.0% Non-transportation 365.0 409.6 434.6 495.1 497.5 519.3 4.4% 4.5% Transportation 104.3 103.1 107.4 105.1 110.2 124.3 12.8% 2.2%
Earnings ($M)Earnings (Current $) 138.5 161.6 181.7 216.5 227.0 247.8 9.2% 7.5%
Employment (Jobs)Employment 6,940 7,570 8,020 8,730 8,900 9,140 2.7% 3.5%
Tax Revenue ($M)Total (Current $) 21.2 25.1 27.6 33.0 34.4 36.2 5.0% 6.9% Local 7.2 8.2 9.8 12.1 12.1 12.7 4.9% 7.4% State 13.9 16.9 17.9 20.9 22.3 23.4 5.1% 6.7%
Other spending includes resident air travel, travel arrangement and reservation services, and convention and trade show organizers. Non-transportation visitor spending includes accommodations, food services, retail, food stores, and arts, entertainment & recreation. Visitor transportation spending includes private auto, auto rental, other local ground transportation and one-way airfares.Earnings include wages & salaries, earned benefits and proprietor income.Employment includes all full- and part-time employment of payroll employees and proprietors.Local tax revenue includes lodging taxes, auto rental taxes and airport passenger facility charges paid by visitors.State tax revenue includes lodging, and motor fuel tax payments of visitors, and the income tax payments attributable to the travel industry income of businesses and employees.Federal tax revenue includes motor fuel excise taxes and airline ticket taxes paid by visitors, and the payroll and income taxes attributable to the travel industry income of employees and businesses.
Historical revisions have been made to correct for the assignment of visitor air travel to the other travel category total. This correction does not effect economic impact totals.
DEAN RUNYAN ASSOCIATESPage 239
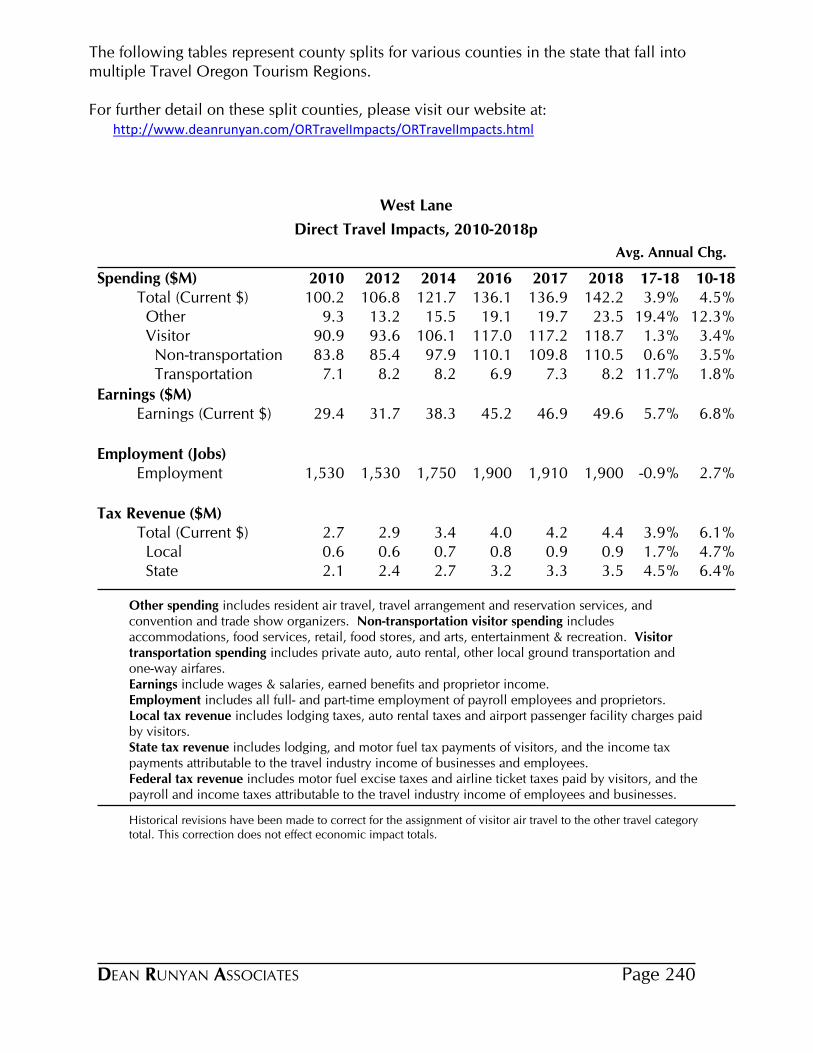
The following tables represent county splits for various counties in the state that fall into multiple Travel Oregon Tourism Regions.
For further detail on these split counties, please visit our website at:http://www.deanrunyan.com/ORTravelImpacts/ORTravelImpacts.html
Direct Travel Impacts, 2010-2018p
Avg. Annual Chg.
West Lane
Spending ($M) 2010 2012 2014 2016 2017 2018 17-18 10-18Total (Current $) 100.2 106.8 121.7 136.1 136.9 142.2 3.9% 4.5% Other 9.3 13.2 15.5 19.1 19.7 23.5 19.4% 12.3% Visitor 90.9 93.6 106.1 117.0 117.2 118.7 1.3% 3.4% Non-transportation 83.8 85.4 97.9 110.1 109.8 110.5 0.6% 3.5% Transportation 7.1 8.2 8.2 6.9 7.3 8.2 11.7% 1.8%
Earnings ($M)Earnings (Current $) 29.4 31.7 38.3 45.2 46.9 49.6 5.7% 6.8%
Employment (Jobs)Employment 1,530 1,530 1,750 1,900 1,910 1,900 -0.9% 2.7%
Tax Revenue ($M)Total (Current $) 2.7 2.9 3.4 4.0 4.2 4.4 3.9% 6.1% Local 0.6 0.6 0.7 0.8 0.9 0.9 1.7% 4.7% State 2.1 2.4 2.7 3.2 3.3 3.5 4.5% 6.4%
Other spending includes resident air travel, travel arrangement and reservation services, and convention and trade show organizers. Non-transportation visitor spending includes accommodations, food services, retail, food stores, and arts, entertainment & recreation. Visitor transportation spending includes private auto, auto rental, other local ground transportation and one-way airfares.Earnings include wages & salaries, earned benefits and proprietor income.Employment includes all full- and part-time employment of payroll employees and proprietors.Local tax revenue includes lodging taxes, auto rental taxes and airport passenger facility charges paid by visitors.State tax revenue includes lodging, and motor fuel tax payments of visitors, and the income tax payments attributable to the travel industry income of businesses and employees.Federal tax revenue includes motor fuel excise taxes and airline ticket taxes paid by visitors, and the payroll and income taxes attributable to the travel industry income of employees and businesses.
Historical revisions have been made to correct for the assignment of visitor air travel to the other travel category total. This correction does not effect economic impact totals.
DEAN RUNYAN ASSOCIATES Page 240
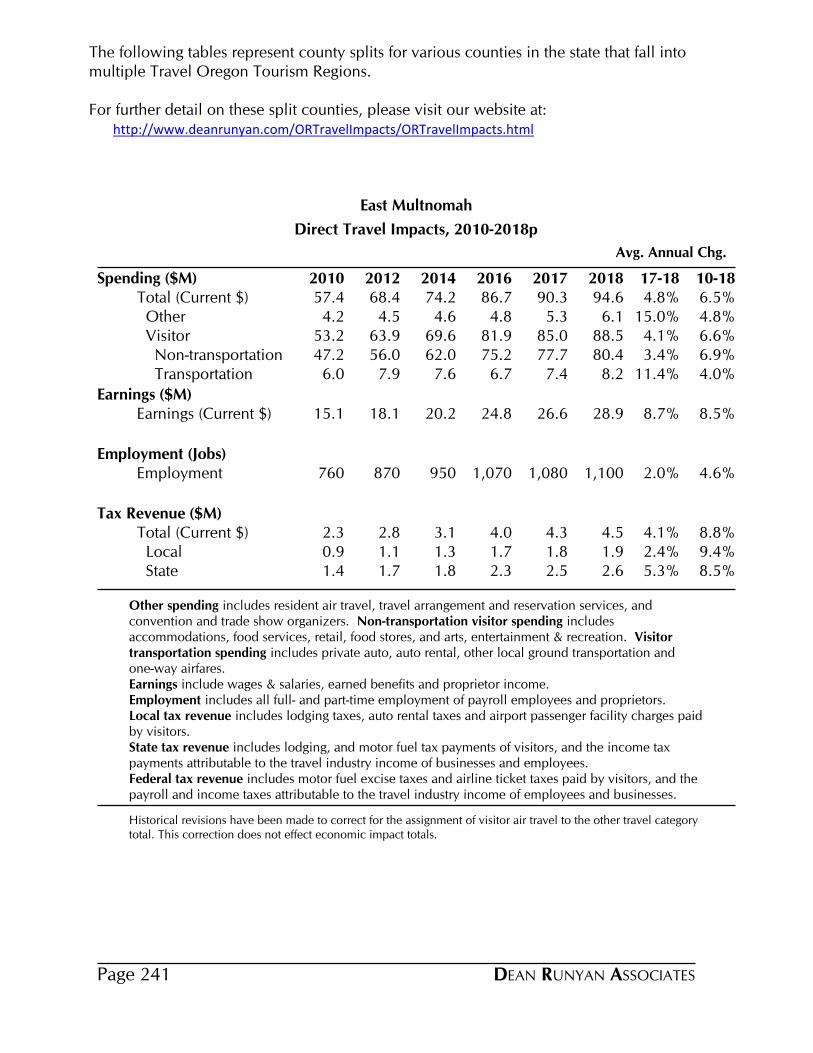
The following tables represent county splits for various counties in the state that fall into multiple Travel Oregon Tourism Regions.
For further detail on these split counties, please visit our website at:http://www.deanrunyan.com/ORTravelImpacts/ORTravelImpacts.html
Direct Travel Impacts, 2010-2018p
Avg. Annual Chg.
East Multnomah
Spending ($M) 2010 2012 2014 2016 2017 2018 17-18 10-18Total (Current $) 57.4 68.4 74.2 86.7 90.3 94.6 4.8% 6.5% Other 4.2 4.5 4.6 4.8 5.3 6.1 15.0% 4.8% Visitor 53.2 63.9 69.6 81.9 85.0 88.5 4.1% 6.6% Non-transportation 47.2 56.0 62.0 75.2 77.7 80.4 3.4% 6.9% Transportation 6.0 7.9 7.6 6.7 7.4 8.2 11.4% 4.0%
Earnings ($M)Earnings (Current $) 15.1 18.1 20.2 24.8 26.6 28.9 8.7% 8.5%
Employment (Jobs)Employment 760 870 950 1,070 1,080 1,100 2.0% 4.6%
Tax Revenue ($M)Total (Current $) 2.3 2.8 3.1 4.0 4.3 4.5 4.1% 8.8% Local 0.9 1.1 1.3 1.7 1.8 1.9 2.4% 9.4% State 1.4 1.7 1.8 2.3 2.5 2.6 5.3% 8.5%
Other spending includes resident air travel, travel arrangement and reservation services, and convention and trade show organizers. Non-transportation visitor spending includes accommodations, food services, retail, food stores, and arts, entertainment & recreation. Visitor transportation spending includes private auto, auto rental, other local ground transportation and one-way airfares.Earnings include wages & salaries, earned benefits and proprietor income.Employment includes all full- and part-time employment of payroll employees and proprietors.Local tax revenue includes lodging taxes, auto rental taxes and airport passenger facility charges paid by visitors.State tax revenue includes lodging, and motor fuel tax payments of visitors, and the income tax payments attributable to the travel industry income of businesses and employees.Federal tax revenue includes motor fuel excise taxes and airline ticket taxes paid by visitors, and the payroll and income taxes attributable to the travel industry income of employees and businesses.
Historical revisions have been made to correct for the assignment of visitor air travel to the other travel category total. This correction does not effect economic impact totals.
DEAN RUNYAN ASSOCIATESPage 241
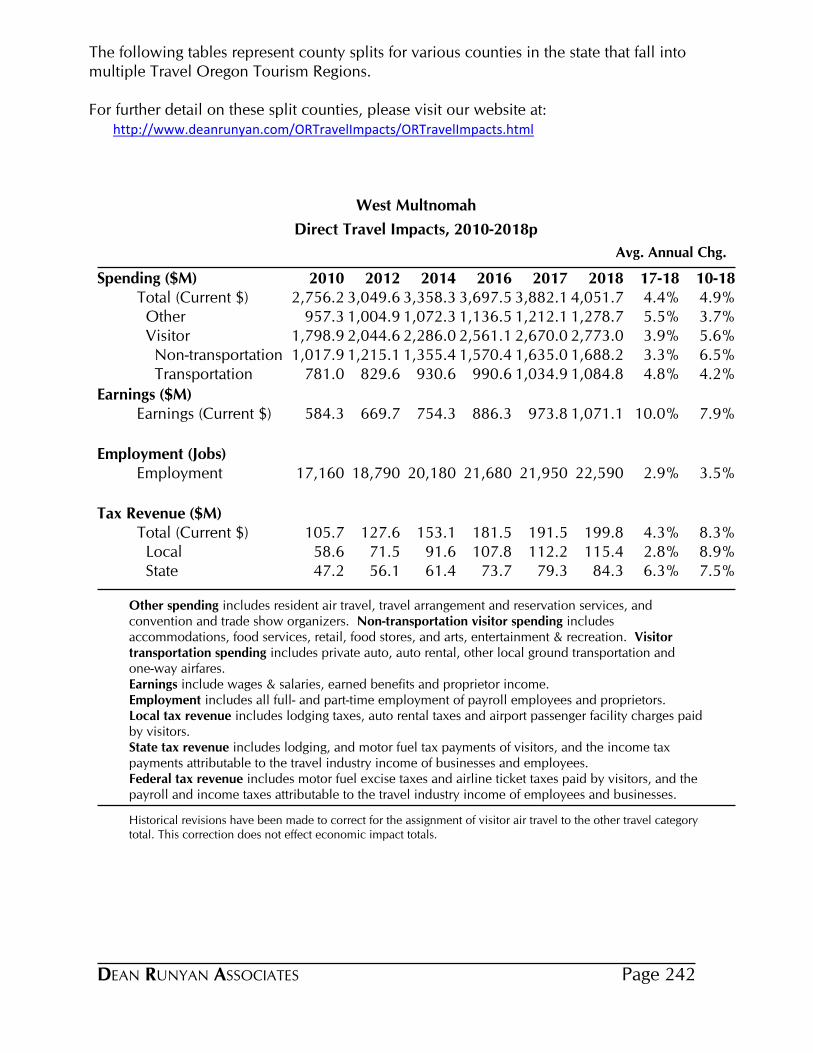
The following tables represent county splits for various counties in the state that fall into multiple Travel Oregon Tourism Regions.
For further detail on these split counties, please visit our website at:http://www.deanrunyan.com/ORTravelImpacts/ORTravelImpacts.html
Direct Travel Impacts, 2010-2018p
Avg. Annual Chg.
West Multnomah
Spending ($M) 2010 2012 2014 2016 2017 2018 17-18 10-18Total (Current $) 2,756.2 3,049.6 3,358.3 3,697.5 3,882.1 4,051.7 4.4% 4.9% Other 957.3 1,004.9 1,072.3 1,136.5 1,212.1 1,278.7 5.5% 3.7% Visitor 1,798.9 2,044.6 2,286.0 2,561.1 2,670.0 2,773.0 3.9% 5.6% Non-transportation 1,017.9 1,215.1 1,355.4 1,570.4 1,635.0 1,688.2 3.3% 6.5% Transportation 781.0 829.6 930.6 990.6 1,034.9 1,084.8 4.8% 4.2%
Earnings ($M)Earnings (Current $) 584.3 669.7 754.3 886.3 973.8 1,071.1 10.0% 7.9%
Employment (Jobs)Employment 17,160 18,790 20,180 21,680 21,950 22,590 2.9% 3.5%
Tax Revenue ($M)Total (Current $) 105.7 127.6 153.1 181.5 191.5 199.8 4.3% 8.3% Local 58.6 71.5 91.6 107.8 112.2 115.4 2.8% 8.9% State 47.2 56.1 61.4 73.7 79.3 84.3 6.3% 7.5%
Other spending includes resident air travel, travel arrangement and reservation services, and convention and trade show organizers. Non-transportation visitor spending includes accommodations, food services, retail, food stores, and arts, entertainment & recreation. Visitor transportation spending includes private auto, auto rental, other local ground transportation and one-way airfares.Earnings include wages & salaries, earned benefits and proprietor income.Employment includes all full- and part-time employment of payroll employees and proprietors.Local tax revenue includes lodging taxes, auto rental taxes and airport passenger facility charges paid by visitors.State tax revenue includes lodging, and motor fuel tax payments of visitors, and the income tax payments attributable to the travel industry income of businesses and employees.Federal tax revenue includes motor fuel excise taxes and airline ticket taxes paid by visitors, and the payroll and income taxes attributable to the travel industry income of employees and businesses.
Historical revisions have been made to correct for the assignment of visitor air travel to the other travel category total. This correction does not effect economic impact totals.
DEAN RUNYAN ASSOCIATES Page 242
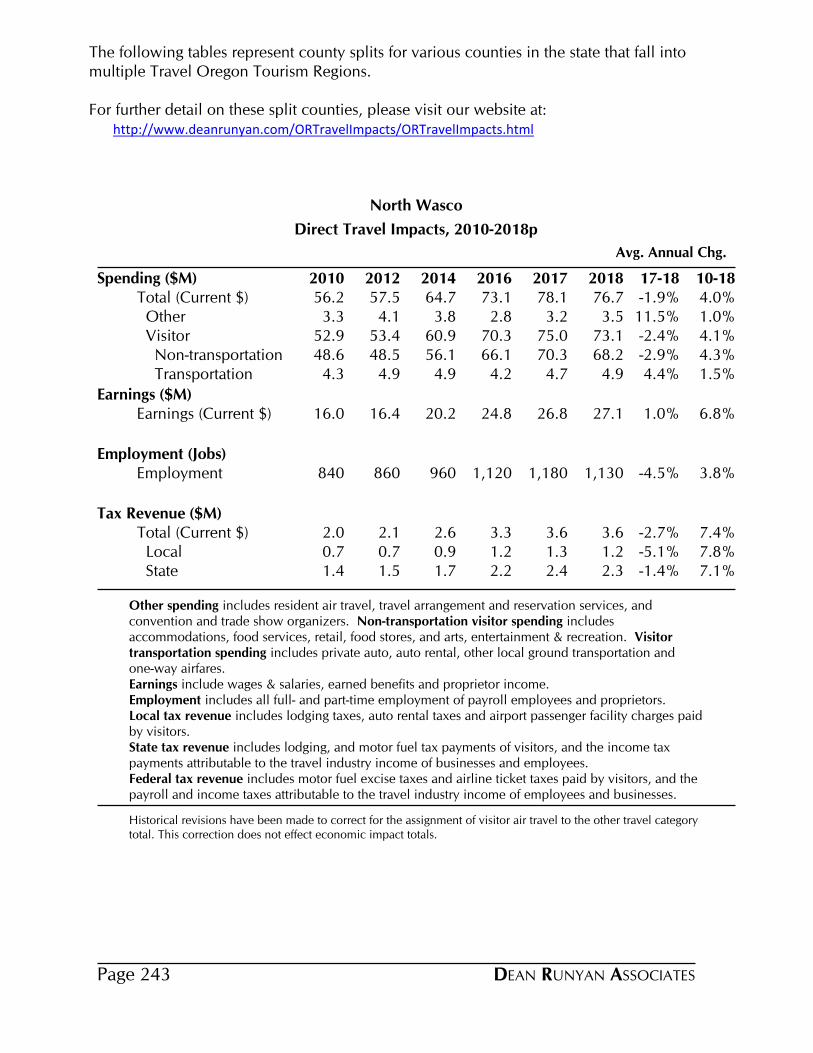
The following tables represent county splits for various counties in the state that fall into multiple Travel Oregon Tourism Regions.
For further detail on these split counties, please visit our website at:http://www.deanrunyan.com/ORTravelImpacts/ORTravelImpacts.html
Direct Travel Impacts, 2010-2018p
Avg. Annual Chg.
North Wasco
Spending ($M) 2010 2012 2014 2016 2017 2018 17-18 10-18Total (Current $) 56.2 57.5 64.7 73.1 78.1 76.7 -1.9% 4.0% Other 3.3 4.1 3.8 2.8 3.2 3.5 11.5% 1.0% Visitor 52.9 53.4 60.9 70.3 75.0 73.1 -2.4% 4.1% Non-transportation 48.6 48.5 56.1 66.1 70.3 68.2 -2.9% 4.3% Transportation 4.3 4.9 4.9 4.2 4.7 4.9 4.4% 1.5%
Earnings ($M)Earnings (Current $) 16.0 16.4 20.2 24.8 26.8 27.1 1.0% 6.8%
Employment (Jobs)Employment 840 860 960 1,120 1,180 1,130 -4.5% 3.8%
Tax Revenue ($M)Total (Current $) 2.0 2.1 2.6 3.3 3.6 3.6 -2.7% 7.4% Local 0.7 0.7 0.9 1.2 1.3 1.2 -5.1% 7.8% State 1.4 1.5 1.7 2.2 2.4 2.3 -1.4% 7.1%
Other spending includes resident air travel, travel arrangement and reservation services, and convention and trade show organizers. Non-transportation visitor spending includes accommodations, food services, retail, food stores, and arts, entertainment & recreation. Visitor transportation spending includes private auto, auto rental, other local ground transportation and one-way airfares.Earnings include wages & salaries, earned benefits and proprietor income.Employment includes all full- and part-time employment of payroll employees and proprietors.Local tax revenue includes lodging taxes, auto rental taxes and airport passenger facility charges paid by visitors.State tax revenue includes lodging, and motor fuel tax payments of visitors, and the income tax payments attributable to the travel industry income of businesses and employees.Federal tax revenue includes motor fuel excise taxes and airline ticket taxes paid by visitors, and the payroll and income taxes attributable to the travel industry income of employees and businesses.
Historical revisions have been made to correct for the assignment of visitor air travel to the other travel category total. This correction does not effect economic impact totals.
DEAN RUNYAN ASSOCIATESPage 243
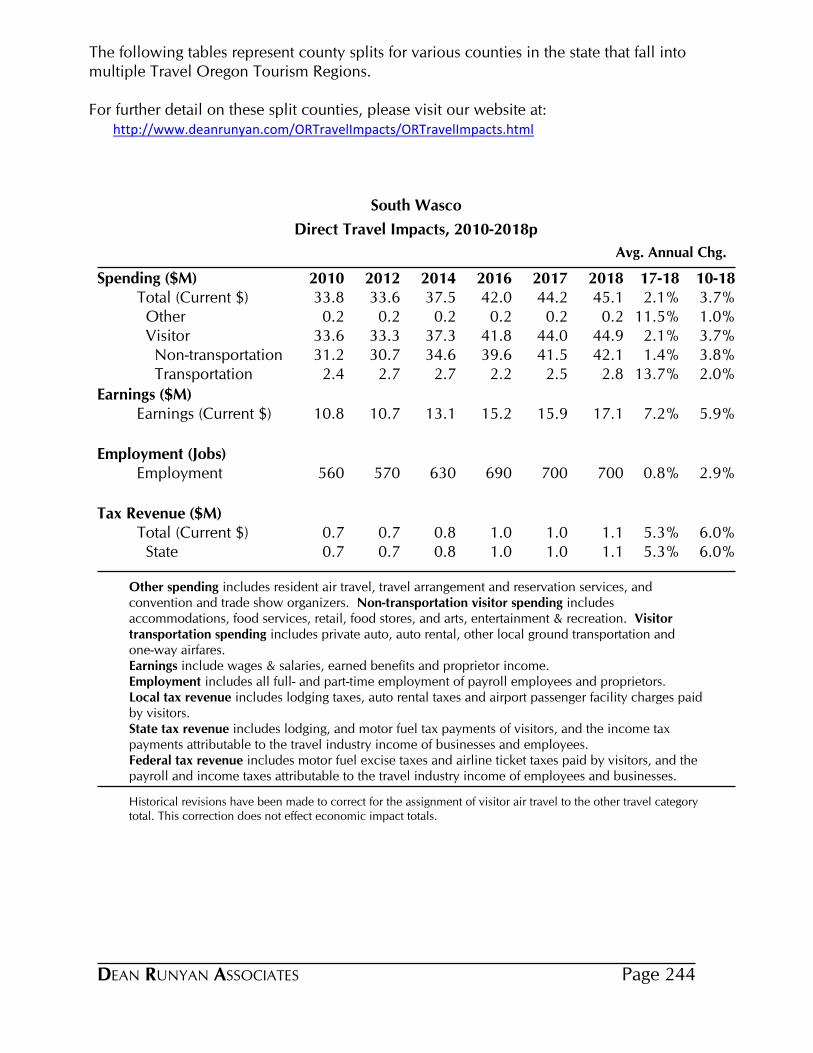
The following tables represent county splits for various counties in the state that fall into multiple Travel Oregon Tourism Regions.
For further detail on these split counties, please visit our website at:http://www.deanrunyan.com/ORTravelImpacts/ORTravelImpacts.html
Direct Travel Impacts, 2010-2018p
Avg. Annual Chg.
South Wasco
Spending ($M) 2010 2012 2014 2016 2017 2018 17-18 10-18Total (Current $) 33.8 33.6 37.5 42.0 44.2 45.1 2.1% 3.7% Other 0.2 0.2 0.2 0.2 0.2 0.2 11.5% 1.0% Visitor 33.6 33.3 37.3 41.8 44.0 44.9 2.1% 3.7% Non-transportation 31.2 30.7 34.6 39.6 41.5 42.1 1.4% 3.8% Transportation 2.4 2.7 2.7 2.2 2.5 2.8 13.7% 2.0%
Earnings ($M)Earnings (Current $) 10.8 10.7 13.1 15.2 15.9 17.1 7.2% 5.9%
Employment (Jobs)Employment 560 570 630 690 700 700 0.8% 2.9%
Tax Revenue ($M)Total (Current $) 0.7 0.7 0.8 1.0 1.0 1.1 5.3% 6.0% State 0.7 0.7 0.8 1.0 1.0 1.1 5.3% 6.0%
Other spending includes resident air travel, travel arrangement and reservation services, and convention and trade show organizers. Non-transportation visitor spending includes accommodations, food services, retail, food stores, and arts, entertainment & recreation. Visitor transportation spending includes private auto, auto rental, other local ground transportation and one-way airfares.Earnings include wages & salaries, earned benefits and proprietor income.Employment includes all full- and part-time employment of payroll employees and proprietors.Local tax revenue includes lodging taxes, auto rental taxes and airport passenger facility charges paid by visitors.State tax revenue includes lodging, and motor fuel tax payments of visitors, and the income tax payments attributable to the travel industry income of businesses and employees.Federal tax revenue includes motor fuel excise taxes and airline ticket taxes paid by visitors, and the payroll and income taxes attributable to the travel industry income of employees and businesses.
Historical revisions have been made to correct for the assignment of visitor air travel to the other travel category total. This correction does not effect economic impact totals.
DEAN RUNYAN ASSOCIATES Page 244