Oregon Smoke Management Annual Report › ... › SMAC › 2016AnnualReport.pdf · 2020-05-01 · 1...
20
Oregon Smoke Management Annual Report 2016 Oregon Department of Forestry FIRE PROTECTION DIVISION Smoke Management and Fuels
Transcript of Oregon Smoke Management Annual Report › ... › SMAC › 2016AnnualReport.pdf · 2020-05-01 · 1...
Oregon
Smoke Management
Annual Report
2016
Oregon Department of Forestry FIRE PROTECTION DIVISION
Smoke Management and Fuels

General File
1-2-5-910
Oregon Smoke Management Annual Report
2016
Prepared by:
Fire Protection Division
Oregon Department of Forestry
2600 State Street
Salem, Oregon 97310
(Annual Report available online at: http://oregon.gov/ODF/FIRE/SMP/SMR2016.pdf)

Table of contents Page
2016 summary .......................................................................................................................................................................... 1
Program overview ..................................................................................................................................................................... 1
Program summary ..................................................................................................................................................................... 1
Audits ............................................................................................................................................................................. 1
Meteorological services ................................................................................................................................................... 2
Polyethylene (PE) on piles study...................................................................................................................................... 2
Program accomplishment data................................................................................................................................................... 2
Alternatives to burning and emission reduction techniques tracking ................................................................................. 2
Prescribed burning statistics ............................................................................................................................................ 3
FIGURES
1 Smoke management regulated areas ................................................................................................................................ 4
2A Intrusion density .............................................................................................................................................................. 5
2B Length of intrusion .......................................................................................................................................................... 5
3A Intrusion summary ........................................................................................................................................................... 6
3B Accumulated intrusion hours ........................................................................................................................................... 6
4A Prescribed burning emissions estimate (PM2.5)............................................................................................................... 8
4B Wildfire emissions estimate (carbon and PM2.5) ............................................................................................................. 8
5 Total forestland burning emissions (PM2.5) .................................................................................................................... 9
6 Historical accomplishment -- Total acres burned (statewide).......................................................................................... 12
7 Historical accomplishment -- Total tons burned (statewide) ........................................................................................... 12
8 Monthly prescribed burn acres burned ........................................................................................................................... 13
9 Piled vs broadcast vs. underburn acres burned ............................................................................................................... 13
TABLES
1 2007 - 2016 accomplishment summary ............................................................................................................................ 4
2 Smoke intrusion summary -- 2016 ................................................................................................................................... 7
3A Broadcast burning PM2.5 emissions by district .............................................................................................................. 10
3B Pile burning PM2.5 emissions by district ....................................................................................................................... 10
3C Underburning PM2.5 emissions by district .................................................................................................................... 11
4 Burn summary by district -- 2016 .................................................................................................................................. 14
5 Tons burned by month by district -- 2016....................................................................................................................... 15
6 Acres burned by month by district -- 2016 ..................................................................................................................... 16
7 2016 burn data by owner type ........................................................................................................................................ 17

1
Oregon Department of Forestry
Smoke Management 2016 Annual Report
2016 summary
Acres burned – Statewide 181,800 acres were ignited. The 10-year average is
165,599 acres.
Intrusions – There were 11 smoke intrusions into Smoke Sensitive Receptor
Areas (SSRAs). The 10-year average is eight intrusions.*
Smoke impacts – Almost all intrusions impacted SSRAs east of the Cascades and
were generally associated with nighttime drainage flow.
Emissions -- Emissions were 11,509 tons of PM 2.5, which was a little less than
the 10-year average of 12,060 tons.
* Number of Smoke Sensitive Receptor Areas increased from 11 to 23 in 2008.
Program overview
The Oregon Smoke Management Plan was
developed as a voluntary program in 1969 and
adopted as a regulatory program by the State
Forester and the Environmental Quality
Commission (EQC) in 1972. The plan has gone
through several major revisions since then. The last
revision to the plan was completed in 2014.
The plan’s overall purpose is to keep smoke from
forestland prescribed burning from being carried to
Smoke Sensitive Receptor Areas (SSRAs) and other
areas sensitive to smoke, and to provide maximum
opportunity for essential forestland burning while
minimizing emissions. The plan is a framework
through which emission reduction goals are
achieved. The State Forester administers the plan in
cooperation with landowners, land management
agencies, and air quality agencies. The plan applies
to all lands classified as forestland and all federally
managed forestland, whether or not classified,
within a forest protection district. In general all
federal forestland and Class I forestland in western
Oregon is regulated at a higher level but all
forestland owners and managers must comply with
most or all aspects of the program.
The Oregon Smoke Management Plan contains six
principle objectives. These are:
1. Protect public health,
2. Minimize smoke intrusions into designated
population areas,
3. Reduce emissions from prescribed burning,
4. Protect visibility in Class I Wilderness Areas,
5. Maximize burning opportunities while
minimizing emissions, and
6. Coordinate with other state smoke management
programs.
Program summary
Audits
The Oregon Smoke Management Plan goal is an
annual audit of approximately one percent of the
prescribed burns conducted in the Regulated Area.
Approximately one-half of the audits are conducted
prior to the burn and the other half on the day of the
burn. These audits help maintain consistent data
reporting and monitor the effectiveness of the Oregon
Smoke Management program.
The Smoke Management program has hired a Field
Coordinator this year, who can devote significant time
to overseeing the audit program and improving the
compliance for conducting audits. This year the

2
program accomplished 33 audits for a total of 10,503
audited tons. The completed audit breakout was 21
pre-burn audits and 12 burn-day audits. Forest Service,
BLM, ODF, and private landowers were sampled and
audited. Trends show that reported tons are generally
lower than audited tons. The Smoke Management
Field Coordinator has been teaching proper techniques
for estimating fuel loading through on-the-job training
with employees during site visits, burn boss refresher
trainings, and fuel loading estimation briefing papers.
It is anticipated that this outreach and education effort
will begin to shift tonnage reporting to a more precise
fuel load estimate.
Meteorological services
Oregon Department of Forestry meteorologists
originate three daily Smoke Management forecasts
and burning instructions for western Oregon,
northeast Oregon, and south central Oregon. ODF
meteorologists provided limited assistance to the
Lakeview and Klamath Falls woodstove smoke
control programs. Through a cooperative agreement
with DEQ they are making the open burning
forecast for the Willamette Valley north of Lane
County throughout the year. In addition, ODF
provides the Department of Agriculture field
burning forecasts for the north Willamette Valley,
Jefferson County, and Union County during the
summer field burning season (July 1- October 15).
Other forecast services included weather support for
significant weather events (heavy rain, wind, etc.)
and for weather events that may increase the
chances for wildfire and its spread. In addition, the
meteorologists provide daily quality control for the
National Fire Danger Rating System.
Polyethylene (PE) on piles study
The Smoke Management program commissioned a
field study based on recommendations from the
2012-13 program review. The goal was to
determine whether covering dry prescribed burn
piles with PE provided significant particulate and
toxic emission reduction than burning uncovered
wet piles. In addition, it was also important to show
that adding a PE cover did not significantly increase
the amount of pollutants emitted vs. an uncovered
pile whether it was dry or wet.
Lab studies have already demonstrated that burning
woody material with PE does not introduce more or
additional toxic pollutants than burning only woody
material. However, to fully demonstrate the
effectiveness of PE to reduce burning emissions, a
field study was necessary to allow for a rule change
to increase thickness and coverage of PE.
ODF conducted the study with a team from the
Environmental Protection Agency. The study period
lasted five days in late October 2015. It included
sampling and analysis of smoke emissions from 11
ignited piles. Three piles were wet, three piles were
dry and uncovered, and five piles were covered with
varying amounts and thicknesses of PE.
Results of the study have been published in
Atmospheric Environment and indicate “…that
uncovered wet piles burned with lower combustion
efficiency and higher emission factors for VOCs,
PM2.5, PCDD/PCDF, and PAHs. Removal of the
PE prior to ignition, variation of PE size, and
changing PE thickness resulted in no statistical
distinction between emissions.”
Program accomplishment data
Alternatives to burning and emission reduction
techniques tracking
As part of the 2013 plan review, the program is
tracking acres of treated forestland where
alternatives to burning were employed. In addition,
emission reduction techniques of prescribed burn
units are also tracked. See results below:
Total acres statewide treated with alternatives to
burning: 231,397.
Total acres statewide acres using emission reduction
techniques: 133,874.
Total acres statewide using covered piles: 3,937.
Alternatives to burning include:
Biomass removal, scattering material, chipping,
crushing, firewood removal, non-treatment, or other
techniques for reducing fire hazard and/or creating
planting spots without using prescribed fire.
Emission reduction techniques include: piling clean
piles instead of broadcast or underburning, use of
rapid ignition techniques, covering piles with
polyethylene to keep the piles dry, and other
techniques used to reduce particulate and gaseous
emissions while burning.
3
The goal is to demonstrate the program is not
exclusively focused on prescribed burning but all
treatment methods that most effectively reduce fire
hazard, maintain productive and resilient forests,
and keep or improve air quality.
Prescribed burning statistics
The following tables and figures provide detailed
information about the Smoke Management
program. The data details accomplishments for
2016 and comparisons with previous years.
4
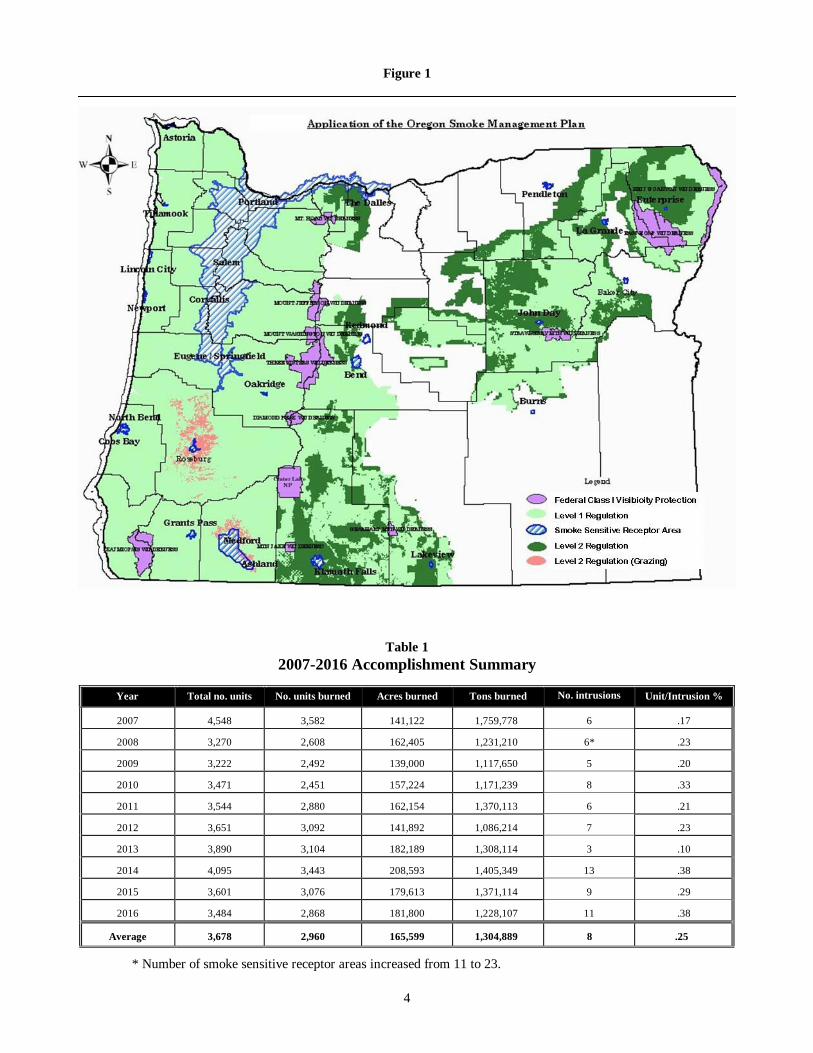
Figure 1
Table 1
2007-2016 Accomplishment Summary
Year Total no. units No. units burned Acres burned Tons burned No. intrusions Unit/Intrusion %
2007 4,548 3,582 141,122 1,759,778 6 .17
2008 3,270 2,608 162,405 1,231,210 6* .23
2009 3,222 2,492 139,000 1,117,650 5 .20
2010 3,471 2,451 157,224 1,171,239 8 .33
2011 3,544 2,880 162,154 1,370,113 6 .21
2012 3,651 3,092 141,892 1,086,214 7 .23
2013 3,890 3,104 182,189 1,308,114 3 .10
2014 4,095 3,443 208,593 1,405,349 13 .38
2015 3,601 3,076 179,613 1,371,114 9 .29
2016 3,484 2,868 181,800 1,228,107 11 .38
Average 3,678 2,960 165,599 1,304,889 8 .25
* Number of smoke sensitive receptor areas increased from 11 to 23.

5
Figure 2A
Figure 2B
* Number of smoke sensitive receptor areas increased from 11 to 23 in 2008.

6
Figure 3A
Figure 3B
* Number of smoke sensitive receptor areas increased from 11 to 23 in 2008.

7
Table 2
Smoke Intrusion Summary - 2016
Date
District/
Forest
Primary area
affected Unit no.
Owner
class Intensity Length
Apr 2-3 Wallowa-
Whitman NF
Baker City 16-406-16300-13 USFS Light 15 hours
Apr 17 Wallowa-
Whitman NF
John Day 15-406-16300-05 USFS Moderate 8 hours
Apr 18-
19
Wallowa-
Whitman NF
Baker City 16-406-16300-11 USFS Light 19 hours
May 2-3 Deschutes NF Bend 15-406-01100-11 USFS Heavy 11 hours
May 12 Fremont-Winema
NF
Lakeview 14-406-02100-02
15-406-02200-01
USFS Light 4 hours
May 27 Western Lane Roseburg 15-781-12703-02
16-781-05806-01
Private Moderate 5 hours
May 31-
Jun 1
Deschutes
NF/Central
Oregon
Bend 16-951-04099-00
14-406-01100-60
Private Moderate 6 hours
Sep 26-27 Malheur NF John Day 16-406-04400-02
16-406-04400-03
USFS Light 15 hours
Sep 28 Wallowa-
Whitman NF
Enterprise 16-406-16200-05
16-406-16200-06
USFS Light 14 hours
Sep 29-30 Wallowa-
Whitman NF
Enterprise 16-406-16200-01 USFS Light 35 hours
Nov 10 Wallowa-
Whitman NF
Baker City 16-406-16300-06
16-406-16300-07
16-406-16300-08
16-406-16300-09
USFS Moderate 18 hours
8
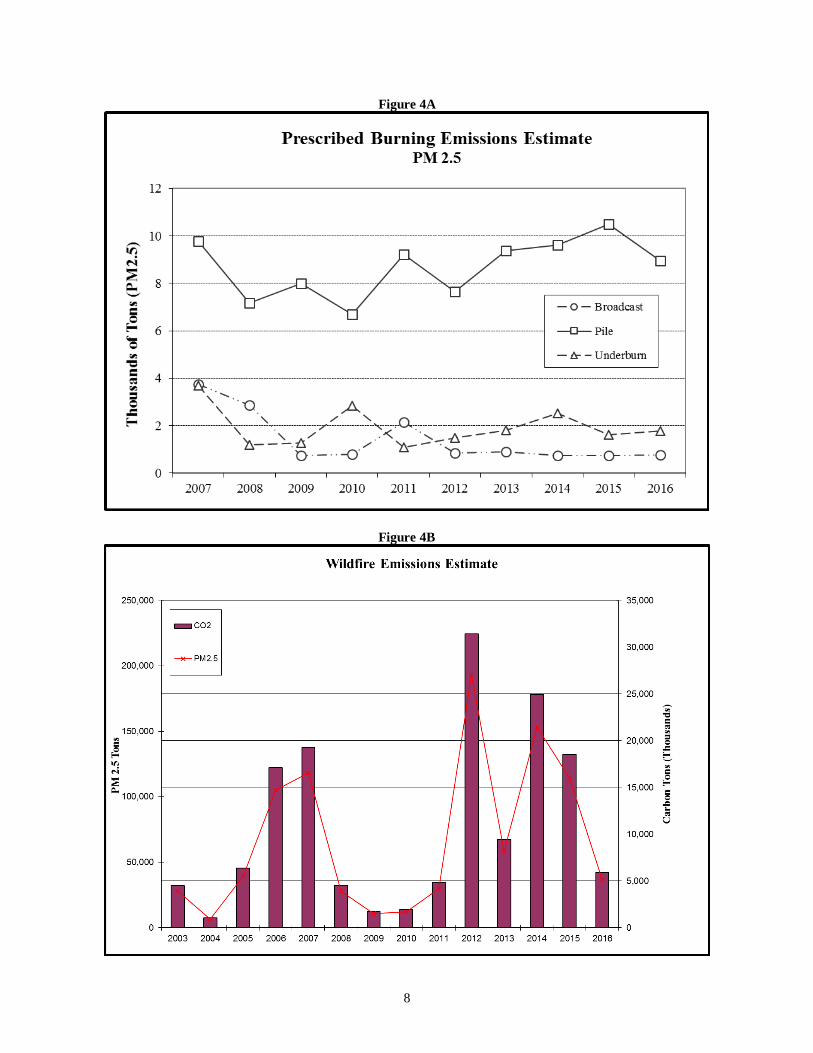
Figure 4A
Figure 4B

9
Figure 5

10
Table 3A
2007 2008 2009 2010 2011 2012 2013 2014 2015 2016
Astoria 9 28 5 0 0 0 0 0 4 0
Central Oregon 339 365 0 0 916 0 3 13 15 8
Coos FPA 1092 879 398 340 773 221 307 170 289 66
Douglas FPA 22 13 65 21 27 56 45 0 105 60
Forest Grove 11 0 28 5 13 0 10 0 0 9
Klamath-Lake 175 20 26 40 1 0 0 0 0 0
North Cascade 52 2 0 0 0 0 0 0 0 0
Northeast Oregon 62 18 29 204 68 106 0 0 0 68
South Cascade 0 0 11 0 1 1 1 0 0 0
Southw est Oregon 34 66 0 18 12 0 2 3 8 3
Tillamook 0 10 0 0 0 0 5 0 0 0
Walker Range 0 2 0 0 0 0 0 0 0 0
West Oregon 179 81 114 81 44 15 38 9 5 0
Western Lane 92 83 57 25 50 1 36 6 69 15
Columbia Gorge SA 1 0 0 0 0 0 0 0
Crater Lake NP 0 0 0 11 0 0 0 0 0 0
Deschutes NF 0 82 4 3 0 0 68 0 12 13
Fremont NF 1342 6 0 0 0 0 0 0 0 133
Klamath NF 0 0 0 0 0 0 0 0 0 0
Malheur NF 188 523 4 0 0 357 0 371 0 1
Mt. Hood NF 0 0 0 0 0 0 0 0 0 0
Ochoco NF 0 12 0 0 0 3 17 8 0 8
Rogue/Siskiyou NF 73 17 1 0 1 4 65 9 22 0
Siskiyou NF 0 0 0 0 0 0 0 0 0 0
Siuslaw NF 3 0 0 0 0 0 0 0 0 0
Umatilla NF 0 373 0 31 143 19 0 44 53 85
Umpqua NF 1 28 1 4 41 12 0 0 17 0
Wallow a-Whitman NF 27 243 0 9 68 20 243 89 52 308
Willamette NF 50 15 1 2 2 12 20 9 98 0
Winema NF 0 0 0 0 0 15 30 0 0 1
Total 3751 2866 745 794 2160 842 890 731 749 778
PM 2.5 Emissions (Tons) Broadcast
Table 3B

11
2007 2008 2009 2010 2011 2012 2013 2014 2015 2016
Astoria 255 113 121 142 305 490 525 326 377 446
Central Oregon 175 25 121 128 151 174 148 295 256 294
Coos District 0 0 0 0 0 0 0 0 4
Coos FPA 1786 1319 801 748 837 915 1125 1266 1259 1130
Douglas FPA 579 821 1173 720 533 515 815 1223 1180 934
Forest Grove 555 244 282 273 250 311 545 351 299 196
Klamath-Lake 467 115 62 107 139 54 80 292 871 338
North Cascade 439 262 144 164 213 283 465 306 405 216
Northeast Oregon 352 603 1075 288 1436 312 1276 829 438 952
South Cascade 1568 1011 896 994 1130 754 886 778 934 708
Southw est Oregon 596 295 703 411 453 632 463 683 576 519
Tillamook 263 180 278 114 235 138 296 236 236 144
Walker Range 17 0 0 1 0 0 0 1 0 0
West Oregon 1203 814 788 873 918 898 1117 1230 1261 917
Western Lane 469 319 159 195 149 119 118 196 156 90
Columbia Gorge SA 0 1 0 0 0 0 0 0 0
Crater Lake NP 0 0 0 0 0 0 1 0 3 2
Deschutes NF 170 40 100 312 253 230 185 208 306 170
Fremont NF 2 4 1 7 8 10 24 73 83 117
Klamath NF 5 3 10 2 4 2 6 10 5 14
Malheur NF 273 394 203 127 722 185 251 309 389 603
Mt. Hood NF 37 23 6 33 51 21 33 74 51 23
Ochoco NF 0 0 0 0 1 105 75 0 21 6
Rogue/Siskiyou NF 362 376 527 599 601 741 261 346 521 241
Siskiyou NF 0 0 0 0 0 0 0 0 0 0
Siuslaw NF 22 21 36 29 34 23 22 33 22 22
Umatilla NF 8 26 0 26 18 25 15 30 150 75
Umpqua NF 44 17 81 153 46 201 115 83 133 75
Wallow a-Whitman NF 45 132 319 200 559 353 327 244 165 388
Willamette NF 59 20 20 38 72 128 143 107 280 252
Winema NF 22 0 82 12 101 37 49 89 118 65
Total 9773 7177 7989 6696 9219 7656 9366 9618 10495 8941
PM 2.5 Emissions (Tons) Pile
Table 3C
2007 2008 2009 2010 2011 2012 2013 2014 2015 2016
Astoria 0 0 0 0 0 0 0 0 0 0
Central Oregon 243 0 6 277 0 20 1 10 0 0
Coos FPA 0 0 0 0 0 0 0 0 0 0
Douglas FPA 0 0 0 0 0 0 0 0 0 0
Forest Grove 0 0 0 0 0 0 0 0 0 0
Klamath-Lake 50 56 35 1 9 0 0 0 0 0
North Cascade 0 0 0 0 0 0 0 0 0 0
Northeast Oregon 66 18 7 0 0 0 0 0 0 0
South Cascade 0 0 0 0 0 0 0 0 0 0
Southw est Oregon 32 95 21 22 11 26 31 5 17 17
Tillamook 0 0 0 0 0 0 0 0 0 0
Walker Range 0 0 0 0 0 0 0 0 0 0
West Oregon 0 0 0 0 0 0 0 0 0 0
Western Lane 0 0 0 0 0 0 0 0 0 0
Columbia Gorge SA 0 0 0 0 0 0 0 0 0
Crater Lake NP 0 0 0 0 0 0 0 0 0 0
Deschutes NF 279 91 159 174 129 58 143 292 200 129
Fremont NF 339 381 430 677 248 190 142 209 680 294
Klamath NF 0 0 0 0 0 0 0 0 0 0
Malheur NF 732 91 214 541 34 524 514 533 11 481
Mt. Hood NF 26 0 2 61 28 14 43 8 1 20
Ochoco NF 0 0 14 46 91 0 89 79 103 65
Rogue/Siskiyou NF 29 36 30 103 157 4 25 49 59 88
Siskiyou NF 0 0 0 0 0 0 0 0 0 0
Siuslaw NF 3 0 0 0 0 0 0 0 0 0
Umatilla NF 527 103 0 247 170 232 355 411 267 1
Umpqua NF 130 40 48 106 0 33 58 139 10 60
Wallow a-Whitman NF 795 186 207 320 83 228 330 495 162 475
Willamette NF 267 100 95 37 59 45 40 164 81 92
Winema NF 182 0 10 227 76 116 45 138 34 68
Total 3700 1197 1278 2839 1095 1490 1816 2532 1625 1790
PM 2.5 Emissions (Tons) Underburn

12
Figure 6
Figure 7

13
Figure 8
Figure 9

14
Table 4
Burn Summary by District -- 2016
District/Forest Units burned Acres burned Tons burned
Astoria 101 2,393 46,476
Central Oregon 83 10,088 62,262
Coos District 1 60 435
Coos FPA 351 14,015 129,135
Douglas FPA 273 13,153 100,068
Forest Grove 103 2,692 20,057
Klamath-Lake 16 8,977 33,280
North Cascade 67 2,340 20,180
Northeast 116 13,803 118,774
South Cascade 230 9,923 63,196
Southwest 163 8,486 59,158
Tillamook 45 2,992 15,414
Walker Range 0 0 0
Western Lane 64 2,588 13,669
West Oregon 291 10,768 92,108
Crater Lake NP 1 27 284
Deschutes NF 137 11,261 30,040
Fremont NF 16 8,221 53,426
Klamath NF 4 324 1,633
Malheur NF 240 23,463 109,469
Mt Hood NF 39 1,034 4,457
Ochoco NF 11 2,488 7,920
Oregon Caves NM 0 0 0
Rogue River\Siskiyou NF 91 3,684 37,436
Siuslaw NF 53 1,937 2,604
Umatilla NF 51 1,971 16,207
Umpqua NF 36 1,040 12,748
Wallowa-Whitman NF 117 17,431 132,155
Willamette NF 109 3,028 30,688
Winema NF 59 3,613 14,828
District Total 1,904 102,278 774,212
Forest Total 964 79,522 453,895
Grand Total 2,868 181,800 1,228,107

15
Table 5
Tons Burned by Month by District 2016
District Jan Feb Mar Apr May Jun Jul Aug Sep Oct Nov Dec Total by
district
Astoria 32,981 13,495 46,476
Central Oregon 766 3,083 5,554 6,544 38,378 6,815 1,122 62,262
Coos District 435 435
Coos FPA 1,429 7,660 1,617 6,683 150 59,114 47,640 4,842 129,135
Douglas FPA 171 747 3,040 1,472 60,562 33,305 771 100,068
Forest Grove 41 317 8 200 892 16,474 1,820 305 20,057
Klamath-Lake 13,409 3,492 372 9,175 6,832 33,280
North Cascade 55 188 33 17,211 2,693 20,180
Northeast 60 70 50 490 28,227 77,590 12,287 118,774
South Cascade 144 20 43,286 18,612 1,134 63,196
Southwest 2,245 30 382 1,619 23,361 28,738 2,783 59,158
Tillamook 12,104 3,175 135 15,414
Walker Range 0
Western Lane 75 110 3 2,318 10,098 793 272 13,669
West Oregon 200 80 500 81,306 9,121 901 92,108
Crater Lake NP 108 176 284
Deschutes NF 52 3,458 6,084 3,331 48 1 8,954 5,880 2,232 30,040
Fremont NF 200 722 2,295 15,892 17,390 1,080 7,568 7,864 415 53,426
Klamath NF 1,633 1,633
Malheur NF 400 32,974 2,140 6,725 15,125 17,435 34,670 109,469
Mt Hood NF 2,048 1,789 620 4,457
Ochoco NF 136 200 3,390 2,016 1,953 225 7,920
Oregon Caves N.M. 0
Rogue/Siskiyou NF 1,978 250 2,598 7,389 15,576 9,200 445 37,436
Siuslaw NF 117 100 50 2,312 25 2,604
Umatilla NF 1,003 1,622 192 200 7,665 3,507 2,018 16,207
Umpqua NF 4,070 1,445 6,192 1,041 12,748
Wallowa-Whitman NF 50 11,341 1,725 30,455 85,464 3,120 132,155
Willamette NF 3 2 3,086 2,391 3,183 22,023 30,688
Winema NF 120 16 1,770 3,510 3,427 5,111 874 14,828
District Total 2,686 27,861 10,806 17,982 6,834 0 150 0 0 432,712 250,629 24,552 774,212
Forest Total 511 2,718 6,370 40,808 75,455 5,851 201 0 54,999 175,631 52,715 38,636 453,895
Grand Total 3,197 30,579 17,176 58,790 82,289 5,851 351 0 54,999 608,343 303,344 63,188 1,228,107
16
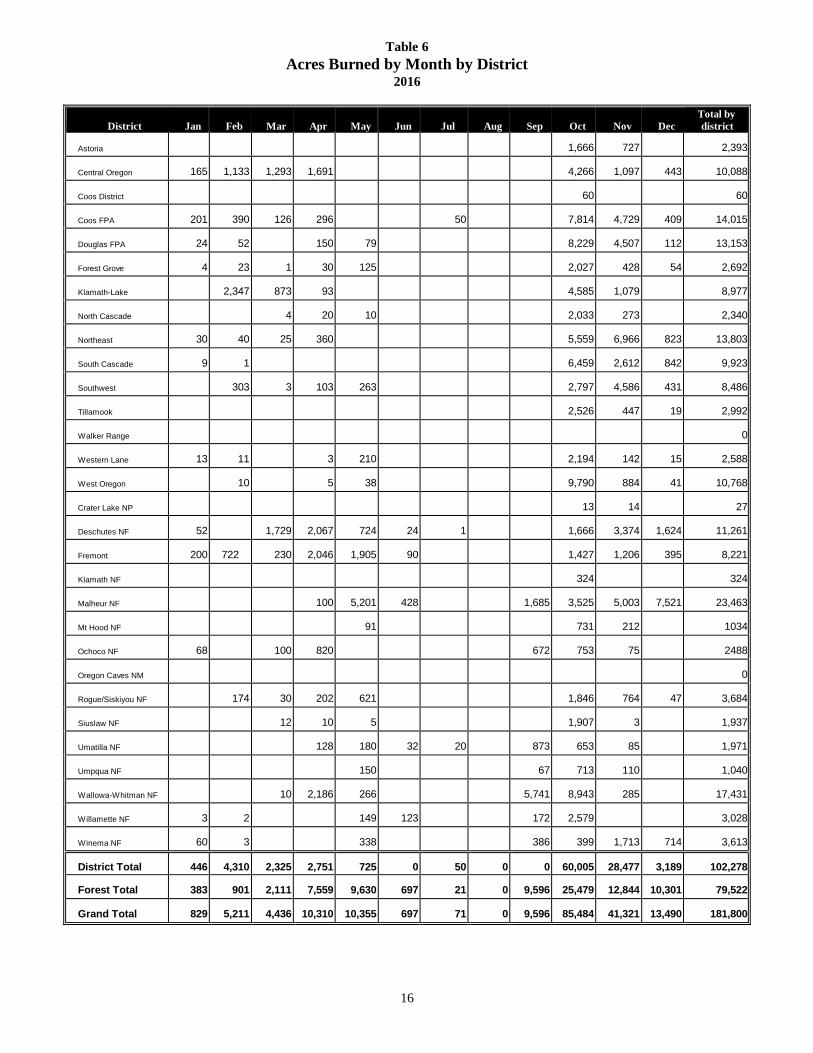
Table 6
Acres Burned by Month by District 2016
District Jan Feb Mar Apr May Jun Jul Aug Sep Oct Nov Dec
Total by
district
Astoria 1,666 727 2,393
Central Oregon 165 1,133 1,293 1,691 4,266 1,097 443 10,088
Coos District 60 60
Coos FPA 201 390 126 296 50 7,814 4,729 409 14,015
Douglas FPA 24 52 150 79 8,229 4,507 112 13,153
Forest Grove 4 23 1 30 125 2,027 428 54 2,692
Klamath-Lake 2,347 873 93 4,585 1,079 8,977
North Cascade 4 20 10 2,033 273 2,340
Northeast 30 40 25 360 5,559 6,966 823 13,803
South Cascade 9 1 6,459 2,612 842 9,923
Southwest 303 3 103 263 2,797 4,586 431 8,486
Tillamook 2,526 447 19 2,992
Walker Range 0
Western Lane 13 11 3 210 2,194 142 15 2,588
West Oregon 10 5 38 9,790 884 41 10,768
Crater Lake NP 13 14 27
Deschutes NF 52 1,729 2,067 724 24 1 1,666 3,374 1,624 11,261
Fremont 200 722 230 2,046 1,905 90 1,427 1,206 395 8,221
Klamath NF 324 324
Malheur NF 100 5,201 428 1,685 3,525 5,003 7,521 23,463
Mt Hood NF 91 731 212 1034
Ochoco NF 68 100 820 672 753 75 2488
Oregon Caves NM 0
Rogue/Siskiyou NF 174 30 202 621 1,846 764 47 3,684
Siuslaw NF 12 10 5 1,907 3 1,937
Umatilla NF 128 180 32 20 873 653 85 1,971
Umpqua NF 150 67 713 110 1,040
Wallowa-Whitman NF 10 2,186 266 5,741 8,943 285 17,431
Willamette NF 3 2 149 123 172 2,579 3,028
Winema NF 60 3 338 386 399 1,713 714 3,613
District Total 446 4,310 2,325 2,751 725 0 50 0 0 60,005 28,477 3,189 102,278
Forest Total 383 901 2,111 7,559 9,630 697 21 0 9,596 25,479 12,844 10,301 79,522
Grand Total 829 5,211 4,436 10,310 10,355 697 71 0 9,596 85,484 41,321 13,490 181,800

17
Table 7
Burn Data by Owner Type 2016
Private State
Federal (except
USFS)
USFS
District/Forest Units Acres Tons Units Acres Tons Units Acres Tons Units Acres Tons
Astoria 75 1,766 33,718 26 627 12,758 0 0 0
Central Oregon 46 3,933 36,776 9 239 3,042 28 5,916 22,444
Coos District 1 60 435 0 0 0 0 0 0
Coos FPA 294 11,818 108,924 5 102 998 52 2,095 19,213
Douglas FPA 242 12,206 94,674 1 91 99 30 856 5,295
Forest Grove 91 2,135 14,901 12 557 5,156 0 0 0
Klamath-Lake 0 0 0 1 4,360 7,600 15 4,617 25,680
North Cascade 58 1,418 14,176 1 60 190 8 862 5,814
Northeast 110 12,785 84,554 0 0 0 6 1,018 34,220
South Cascade 205 6,712 41,516 0 0 0 25 3,211 21,680
Southwest 101 5,873 38,701 0 0 0 62 2,613 20,457
Tillamook 25 1,372 10,070 16 1,400 5,124 4 220 220
Walker Range 0 0 0 0 0 0 0 0 0
West Lane 64 2,588 13,669 0 0 0 0 0 0
West Oregon 275 9,830 89,124 8 245 839 8 693 2,145
Crater Lake NP 0 0 0 0 0 0 1 27 284
Oregon Caves NM 0 0 0 0 0 0 0 0 0
Deschutes NF 137 11,261 30,040
Fremont NF 16 8,221 53,426
Klamath NF 4 324 1,633
Malheur NF 240 23,463 109,469
Mt Hood NF 39 1,034 4,457
Ochoco NF 11 2,488 7,920
Rogue/Siskiyou NF 91 3,684 37,436
Siuslaw NF 53 1,937 2,604
Umatilla NF 51 1,971 16,207
Umpqua NF 36 1,040 12,748
Wallowa-Whitman NF 117 17,431 132,155
Willamette NF 109 3,028 30,688
Winema NF 59 3,613 14,828
Total 1,587 72,496 581,238 79 7,681 35,806 239 22,128 157,452 963 79,495 453,611