Oregon Retirement Savings Plan Retirement Savings...Jan 18, 2017 · Catherine Reilly, CFA Brian...
42
DC‐3546 Fredrik Axsater, CFA Megan M. Hart Vidur Mehra, CFA Megan Yost January 18, 2017 Oregon Retirement Savings Plan This material is solely for the private use of Oregon Retirement Savings Plan and is not intended for public dissemination.
Transcript of Oregon Retirement Savings Plan Retirement Savings...Jan 18, 2017 · Catherine Reilly, CFA Brian...

DC‐3546
Fredrik Axsater, CFA
Megan M. Hart
Vidur Mehra, CFA
Megan Yost
January 18, 2017
Oregon Retirement Savings Plan
This material is solely for the private use of Oregon Retirement Savings Plan and is not intended for public dissemination.
Table of Contents
1. SSGA Target Retirement Strategies
2. DC Client and Participant Engagement Support
AppendicesAppendix A: Additional Investment OptionsAppendix B: Target Retirement Mutual Fund OfferingAppendix C: Target Retirement CIT OfferingAppendix D: Important DisclosuresAppendix E: Biographies
The information contained in this document is current as of the date presented unless otherwise noted.
2DC‐3546
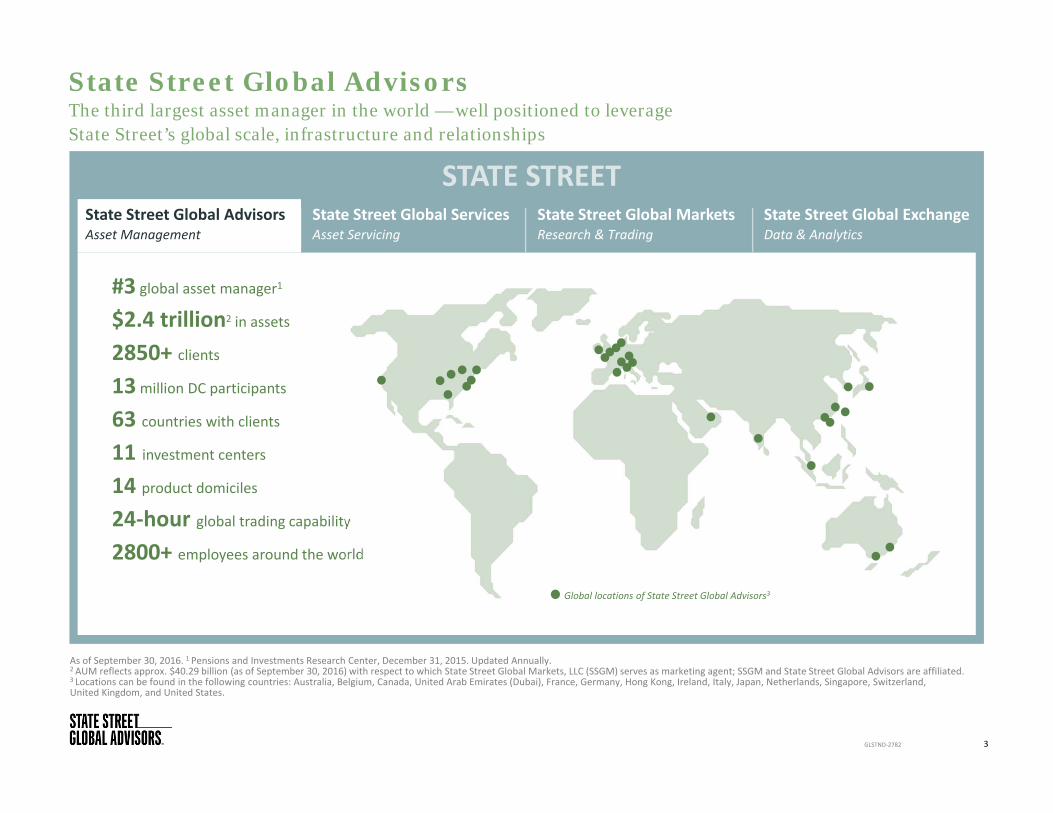
State Street Global Advisors
3GLSTND‐2782
As of September 30, 2016. 1 Pensions and Investments Research Center, December 31, 2015. Updated Annually.2 AUM reflects approx. $40.29 billion (as of September 30, 2016) with respect to which State Street Global Markets, LLC (SSGM) serves as marketing agent; SSGM and State Street Global Advisors are affiliated.3 Locations can be found in the following countries: Australia, Belgium, Canada, United Arab Emirates (Dubai), France, Germany, Hong Kong, Ireland, Italy, Japan, Netherlands, Singapore, Switzerland,United Kingdom, and United States.
The third largest asset manager in the world — well positioned to leverage State Street’s global scale, infrastructure and relationships
STATE STREETState Street Global MarketsResearch & Trading
State Street Global ExchangeData & Analytics
State Street Global ServicesAsset Servicing
State Street Global AdvisorsAsset Management
#3 global asset manager1
$2.4 trillion2 in assets
2850+ clients 13million DC participants
63 countries with clients11 investment centers
14 product domiciles
24‐hour global trading capability
2800+ employees around the world
Global locations of State Street Global Advisors3

Executive Summary & Conclusions
Source: SSGA. As of June 30, 2015.1 See slide 28.
4DC‐3546
• Managing target date strategies since 1995, across multiple market cycles
• Flagship commingled solution launched in 2005 and produced strong long‐term results: since inception average realized risk lower than 71% of peers while performance was in the top 7% (versus Morningstar peers)1
• Employee‐focused approach with DC mission to “make retirement work” for individuals
• More than 35 years of DC market experience and global DC footprint with more than $360 billion in assets under management
• 60+ person DC team structured to serve as an extension of staff and meet the broad needs of Oregon, employers, and employees
• Dedicated client and participant engagement teams focused on the employee experience and delivering tailored services
SSGA Target Date AUM ($billions)as of September 30, 2016
Shared Commitment to Employees Experienced Target Date Provider Holistic Support
SSGA offers the State of Oregon a partnership focused on helping Oregonians achieve a more secure and confident future
SSGA
ORSP Ascensus
$0
$5,000
$10,000
$15,000
$20,000
$25,000
$30,000
$35,000
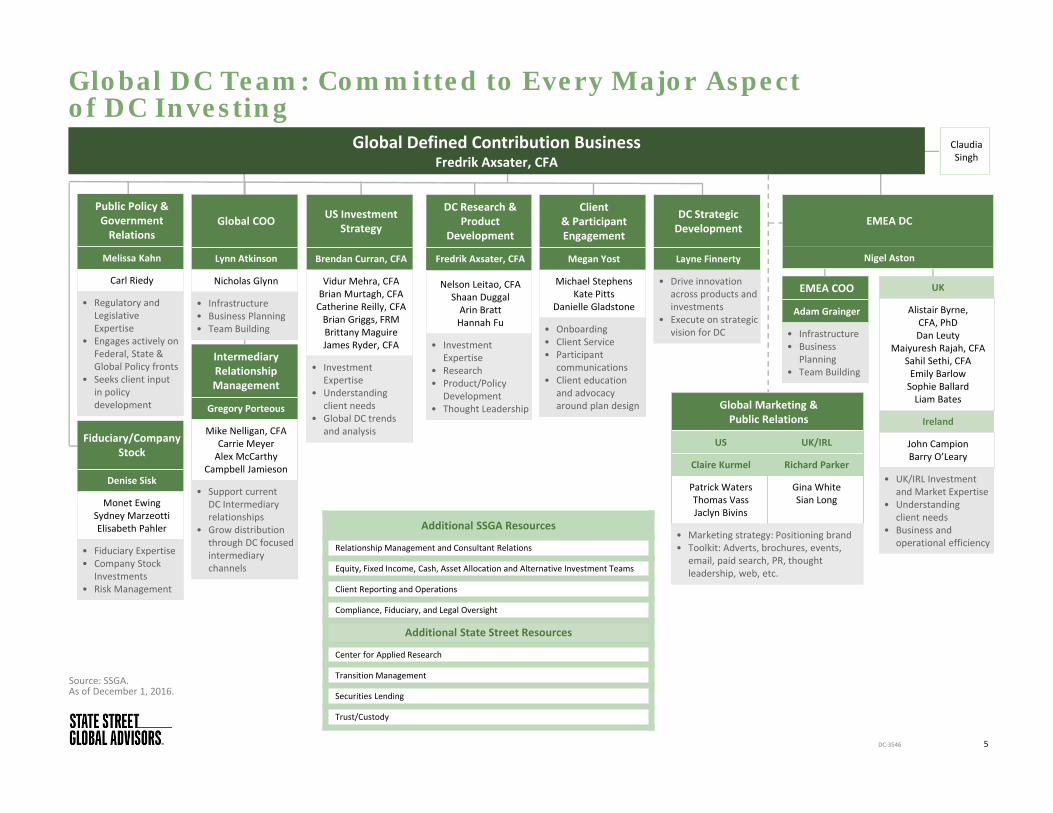
Global DC Team: Committed to Every Major Aspect of DC Investing
5
Source: SSGA.As of December 1, 2016.
Global Defined Contribution BusinessFredrik Axsater, CFA
DC Strategic Development
Layne Finnerty
• Drive innovation across products and investments
• Execute on strategic vision for DC
Global COO
Lynn Atkinson
Nicholas Glynn
• Infrastructure• Business Planning• Team Building
DC Research & Product
Development
Fredrik Axsater, CFA
Nelson Leitao, CFAShaan DuggalArin BrattHannah Fu
• Investment Expertise
• Research• Product/Policy
Development• Thought Leadership
US Investment Strategy
Brendan Curran, CFA
Vidur Mehra, CFABrian Murtagh, CFACatherine Reilly, CFABrian Griggs, FRMBrittany MaguireJames Ryder, CFA
• Investment Expertise
• Understandingclient needs
• Global DC trendsand analysis
Client& Participant Engagement
Megan Yost
Michael StephensKate Pitts
Danielle Gladstone
• Onboarding • Client Service• Participant
communications• Client education
and advocacyaround plan design
Intermediary Relationship Management
Gregory Porteous
Mike Nelligan, CFACarrie MeyerAlex McCarthy
Campbell Jamieson
• Support current DC Intermediary relationships
• Grow distribution through DC focused intermediary channels
Public Policy & Government Relations
Melissa Kahn
Carl Riedy
• Regulatory and Legislative Expertise
• Engages actively on Federal, State & Global Policy fronts
• Seeks client input in policy development
Fiduciary/Company Stock
Denise Sisk
Monet EwingSydney MarzeottiElisabeth Pahler
• Fiduciary Expertise• Company Stock
Investments• Risk Management
Additional SSGA Resources
Relationship Management and Consultant Relations
Equity, Fixed Income, Cash, Asset Allocation and Alternative Investment Teams
Client Reporting and Operations
Compliance, Fiduciary, and Legal Oversight
Additional State Street Resources
Center for Applied Research
Transition Management
Securities Lending
Trust/Custody
Global Marketing & Public Relations
US UK/IRL
Claire Kurmel Richard Parker
Patrick WatersThomas VassJaclyn Bivins
Gina WhiteSian Long
• Marketing strategy: Positioning brand• Toolkit: Adverts, brochures, events,
email, paid search, PR, thought leadership, web, etc.
UK
Alistair Byrne, CFA, PhDDan Leuty
Maiyuresh Rajah, CFA Sahil Sethi, CFAEmily BarlowSophie BallardLiam Bates
Ireland
John CampionBarry O’Leary
• UK/IRL Investment and Market Expertise
• Understanding client needs
• Business and operational efficiency
EMEA DC
Nigel Aston
EMEA COO
Adam Grainger
• Infrastructure• Business
Planning• Team Building
Claudia Singh
DC‐3546
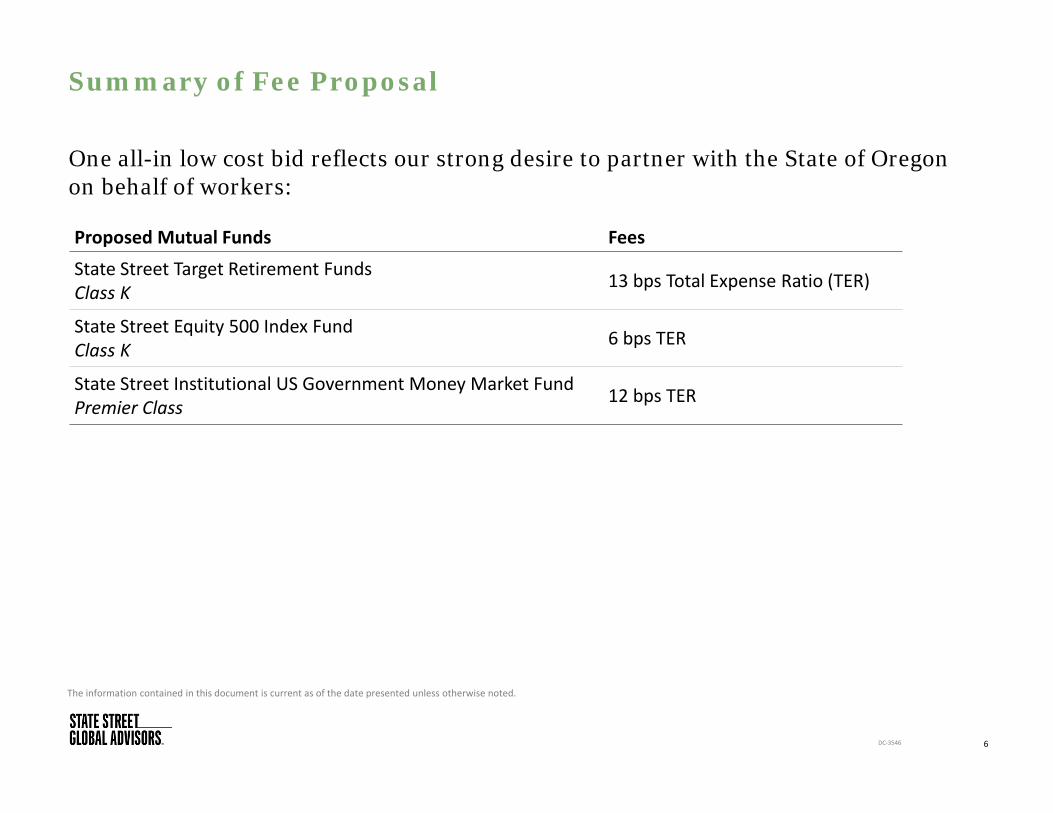
Summary of Fee Proposal
The information contained in this document is current as of the date presented unless otherwise noted.
6DC‐3546
Proposed Mutual Funds Fees
State Street Target Retirement Funds Class K 13 bps Total Expense Ratio (TER)
State Street Equity 500 Index Fund Class K 6 bps TER
State Street Institutional US Government Money Market FundPremier Class 12 bps TER
One all-in low cost bid reflects our strong desire to partner with the State of Oregon on behalf of workers:

SSGA Target Retirement Strategies
7DC‐3546
8
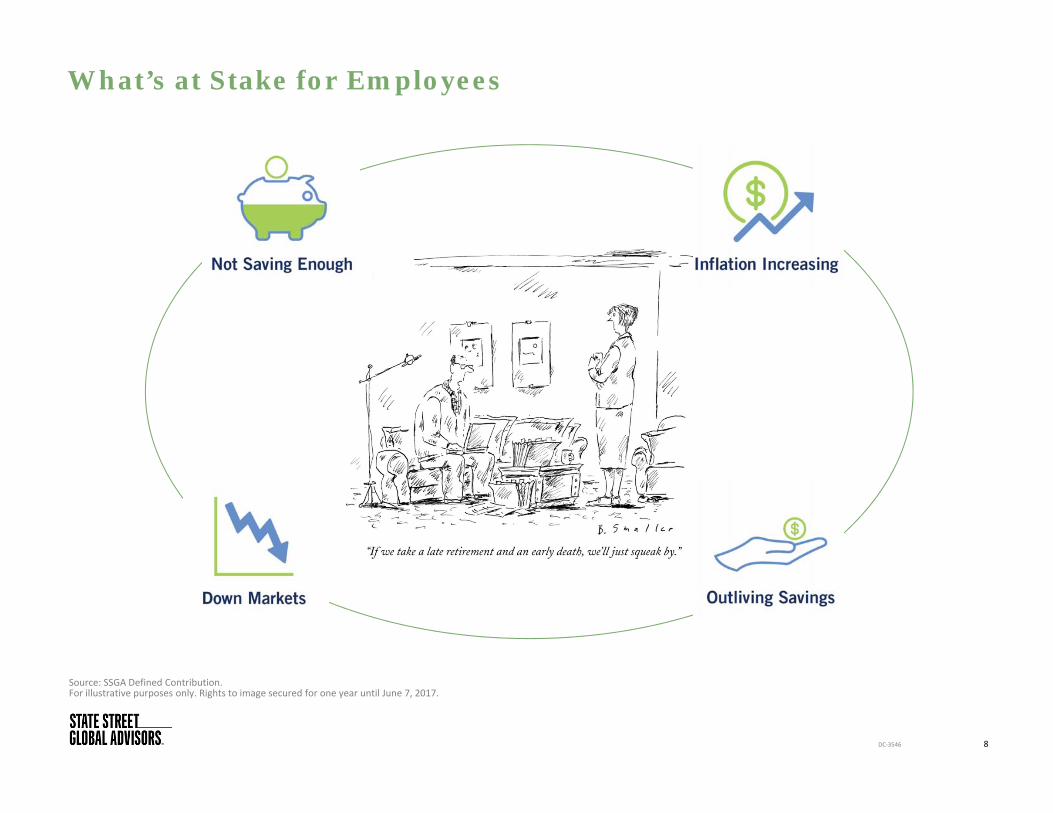
What’s at Stake for Employees
Source: SSGA Defined Contribution. For illustrative purposes only. Rights to image secured for one year until June 7, 2017.
DC‐3546
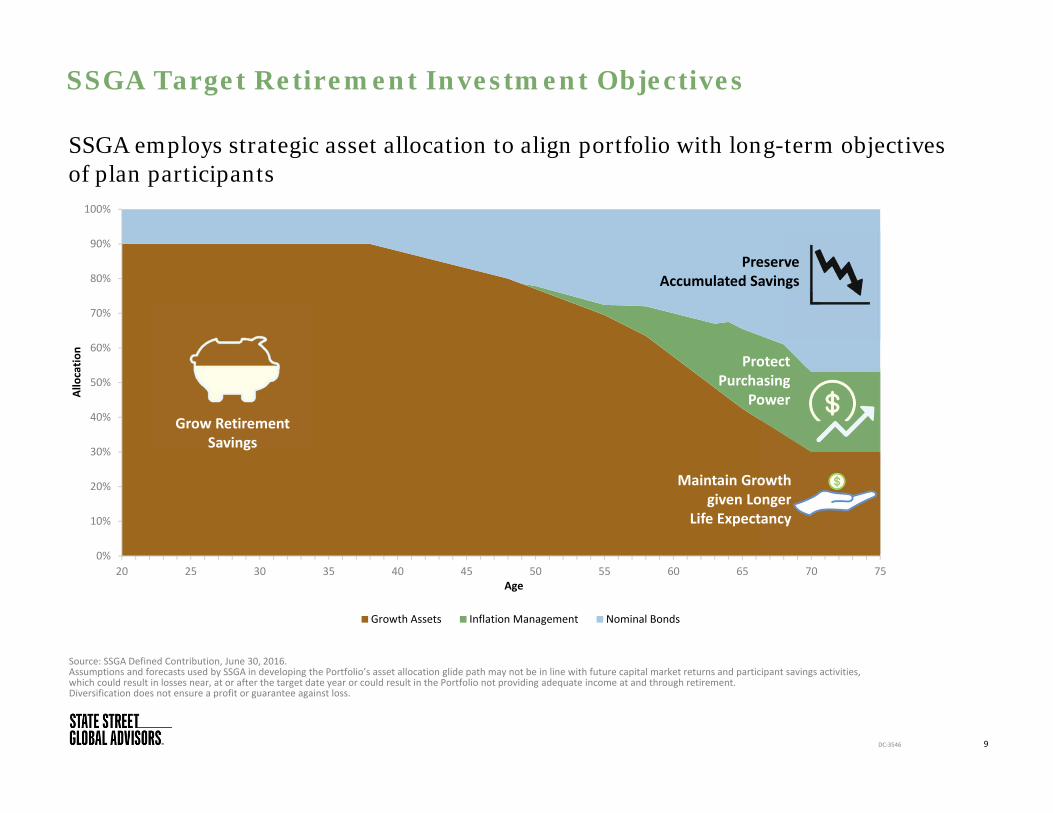
SSGA Target Retirement Investment Objectives
9DC‐3546
Source: SSGA Defined Contribution, June 30, 2016. Assumptions and forecasts used by SSGA in developing the Portfolio’s asset allocation glide path may not be in line with future capital market returns and participant savings activities, which could result in losses near, at or after the target date year or could result in the Portfolio not providing adequate income at and through retirement.Diversification does not ensure a profit or guarantee against loss.
0%
10%
20%
30%
40%
50%
60%
70%
80%
90%
100%
20 25 30 35 40 45 50 55 60 65 70 75
Growth Assets Inflation Management Nominal Bonds
Allocatio
n
Age
SSGA employs strategic asset allocation to align portfolio with long-term objectivesof plan participants
Grow Retirement Savings
Protect Purchasing
Power
Maintain Growth given Longer
Life Expectancy
Preserve Accumulated Savings
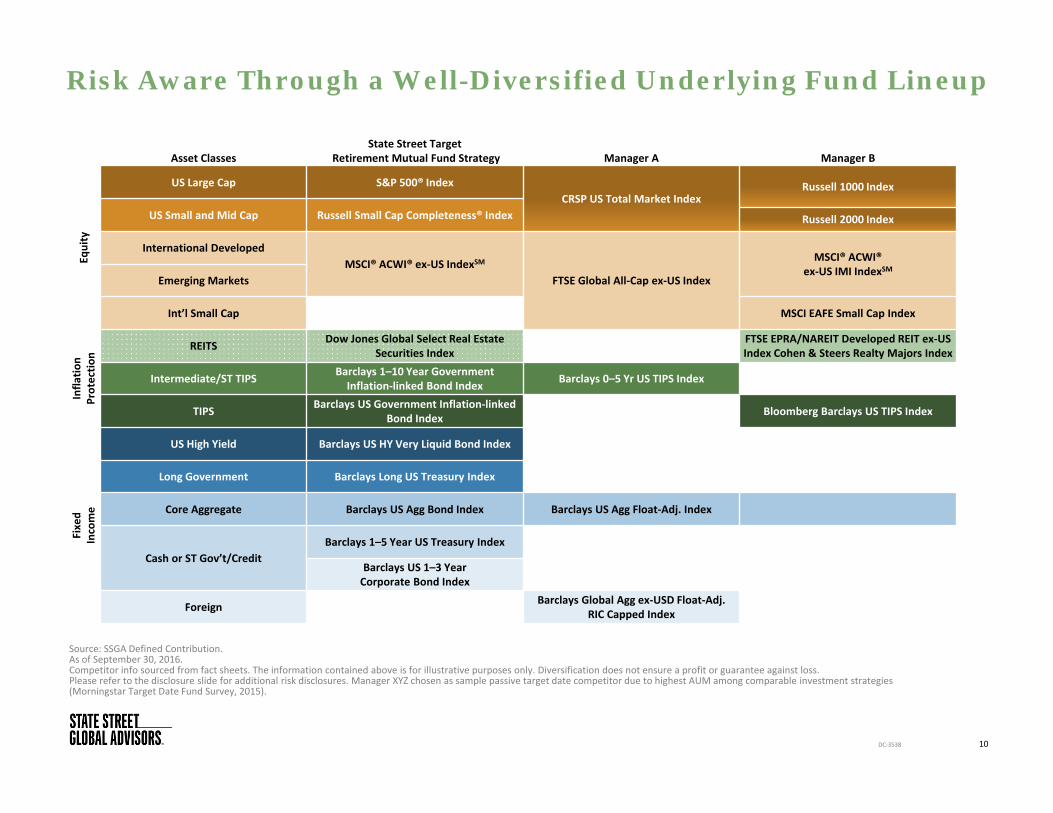
Risk Aware Through a Well-Diversified Underlying Fund Lineup
Source: SSGA Defined Contribution.As of September 30, 2016.Competitor info sourced from fact sheets. The information contained above is for illustrative purposes only. Diversification does not ensure a profit or guarantee against loss.Please refer to the disclosure slide for additional risk disclosures. Manager XYZ chosen as sample passive target date competitor due to highest AUM among comparable investment strategies (Morningstar Target Date Fund Survey, 2015).
Asset ClassesState Street Target
Retirement Mutual Fund Strategy Manager A Manager B
Equity
US Large Cap S&P 500® IndexCRSP US Total Market Index
Russell 1000 Index
US Small and Mid Cap Russell Small Cap Completeness® Index Russell 2000 Index
International DevelopedMSCI® ACWI® ex‐US IndexSM
FTSE Global All‐Cap ex‐US Index
MSCI® ACWI® ex‐US IMI IndexSM
Emerging Markets
Int’l Small Cap MSCI EAFE Small Cap Index
Infla
tion
Protectio
n
REITS Dow Jones Global Select Real Estate Securities Index
FTSE EPRA/NAREIT Developed REIT ex‐US Index Cohen & Steers Realty Majors Index
Intermediate/ST TIPS Barclays 1–10 Year GovernmentInflation‐linked Bond Index Barclays 0–5 Yr US TIPS Index
TIPS Barclays US Government Inflation‐linked Bond Index Bloomberg Barclays US TIPS Index
Fixed
Income
US High Yield Barclays US HY Very Liquid Bond Index
Long Government Barclays Long US Treasury Index
Core Aggregate Barclays US Agg Bond Index Barclays US Agg Float‐Adj. Index
Cash or ST Gov’t/CreditBarclays 1–5 Year US Treasury Index
Barclays US 1–3 Year Corporate Bond Index
Foreign Barclays Global Agg ex‐USD Float‐Adj. RIC Capped Index
DC‐3538 10
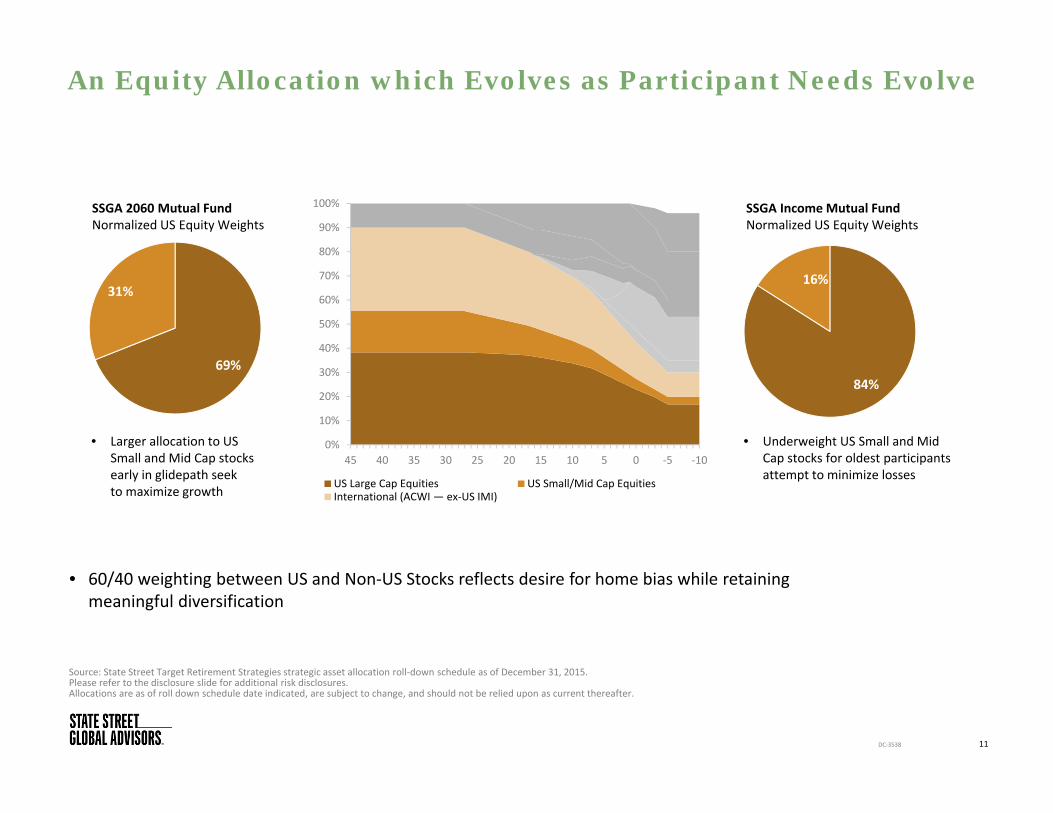
An Equity Allocation which Evolves as Participant Needs Evolve
11DC‐3538
69%
31%
84%
16%
• Larger allocation to US Small and Mid Cap stocks early in glidepath seek to maximize growth
• Underweight US Small and Mid Cap stocks for oldest participants attempt to minimize losses
• 60/40 weighting between US and Non‐US Stocks reflects desire for home bias while retaining meaningful diversification
SSGA 2060 Mutual FundNormalized US Equity Weights
Source: State Street Target Retirement Strategies strategic asset allocation roll‐down schedule as of December 31, 2015. Please refer to the disclosure slide for additional risk disclosures. Allocations are as of roll down schedule date indicated, are subject to change, and should not be relied upon as current thereafter.
SSGA Income Mutual FundNormalized US Equity Weights
0%
10%
20%
30%
40%
50%
60%
70%
80%
90%
100%
45 40 35 30 25 20 15 10 5 0 ‐5 ‐10
US Large Cap Equities US Small/Mid Cap EquitiesInternational (ACWI — ex‐US IMI)
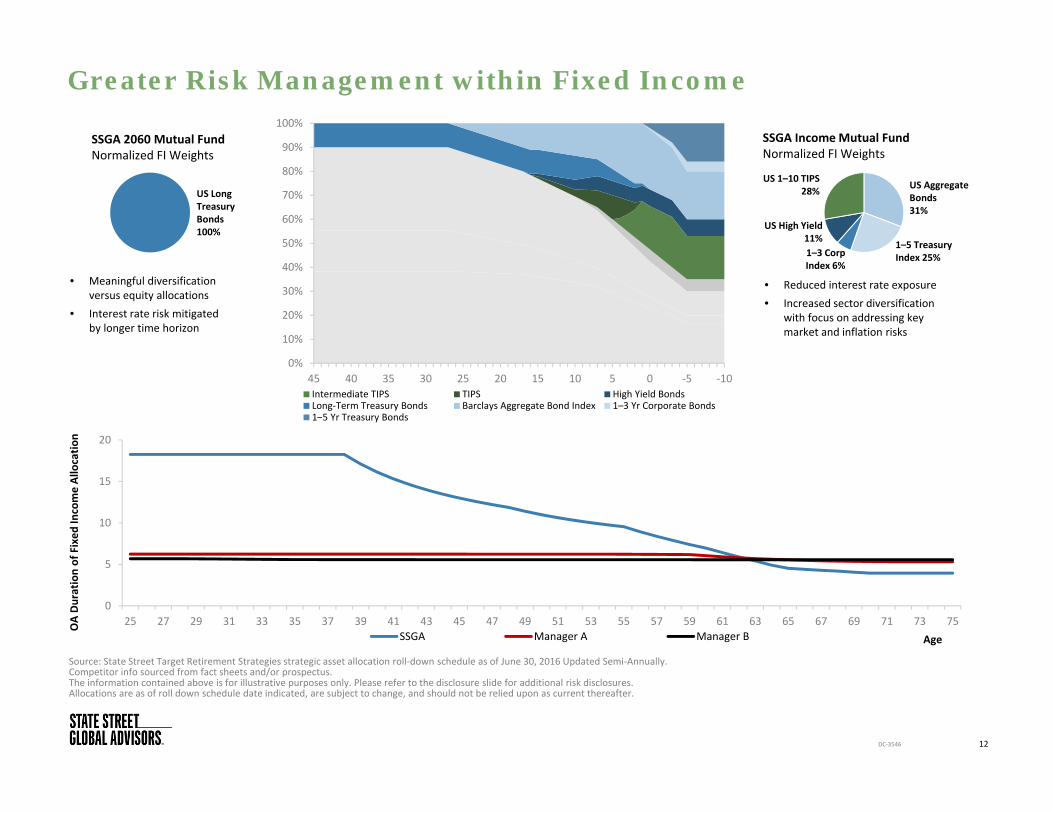
Greater Risk Management within Fixed Income
Source: State Street Target Retirement Strategies strategic asset allocation roll‐down schedule as of June 30, 2016 Updated Semi‐Annually.Competitor info sourced from fact sheets and/or prospectus.The information contained above is for illustrative purposes only. Please refer to the disclosure slide for additional risk disclosures. Allocations are as of roll down schedule date indicated, are subject to change, and should not be relied upon as current thereafter.
0
5
10
15
20
25 27 29 31 33 35 37 39 41 43 45 47 49 51 53 55 57 59 61 63 65 67 69 71 73 75SSGA Manager A Manager B Age
OA Duration of Fixed
Income Allocatio
n
• Reduced interest rate exposure• Increased sector diversification
with focus on addressing key market and inflation risks
1–5 Treasury Index 25%
US Aggregate Bonds31%
US High Yield11%
US 1–10 TIPS28%
• Meaningful diversification versus equity allocations
• Interest rate risk mitigated by longer time horizon
US Long Treasury Bonds100%
SSGA IncomeMutual FundNormalized FI Weights
SSGA 2060 Mutual FundNormalized FI Weights
12
0%
10%
20%
30%
40%
50%
60%
70%
80%
90%
100%
45 40 35 30 25 20 15 10 5 0 ‐5 ‐10Intermediate TIPS TIPS High Yield BondsLong‐Term Treasury Bonds Barclays Aggregate Bond Index 1–3 Yr Corporate Bonds1–5 Yr Treasury Bonds
1–3 Corp Index 6%
DC‐3546
5%GlobalREITs
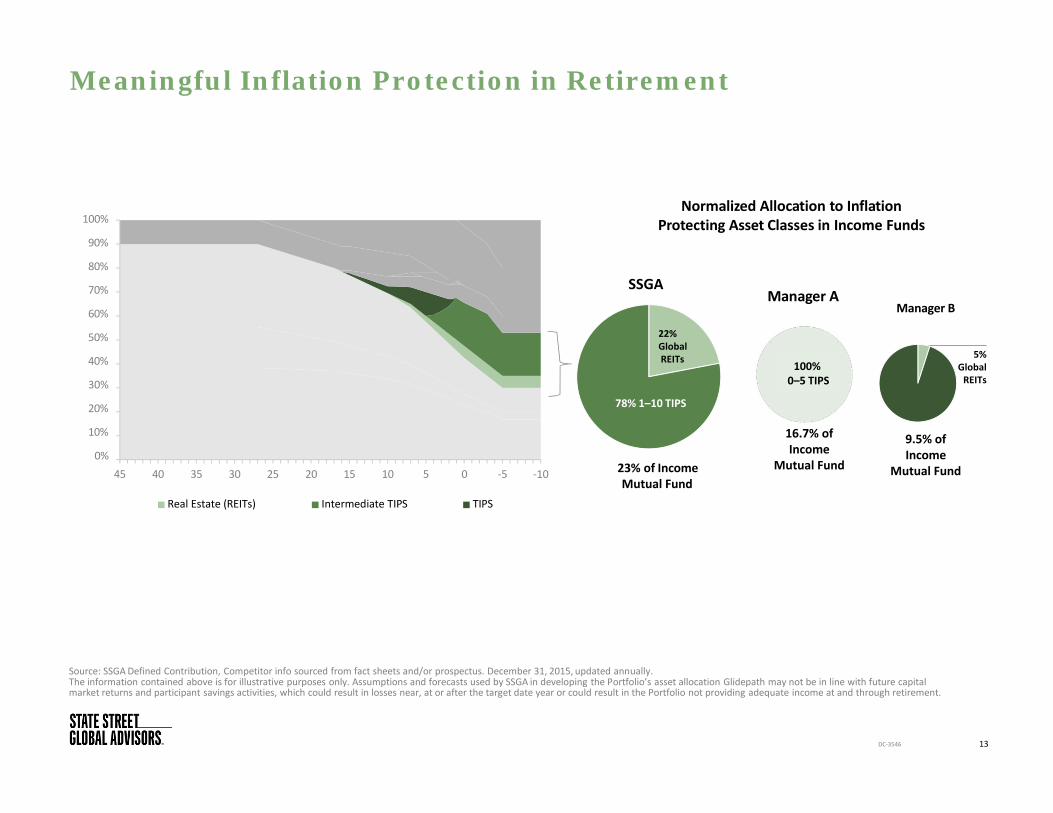
Meaningful Inflation Protection in Retirement
Source: SSGADefined Contribution, Competitor info sourced from fact sheets and/or prospectus. December 31, 2015, updated annually.The information contained above is for illustrative purposes only. Assumptions and forecasts used by SSGA in developing the Portfolio’s asset allocation Glidepath may not be in line with future capital market returns and participant savings activities, which could result in losses near, at or after the target date year or could result in the Portfolio not providing adequate income at and through retirement.
23% of IncomeMutual Fund
45 40 35 30 25 20 15 10 5 0 ‐5 ‐10
Real Estate (REITs) Intermediate TIPS TIPS
16.7% ofIncome
Mutual Fund
9.5% of Income
Mutual Fund
SSGA
Normalized Allocation to InflationProtecting Asset Classes in Income Funds100%
90%
80%
70%
60%
50%
40%
30%
20%
10%
0%
Manager AManager B
13DC‐3546
22% GlobalREITs
78% 1–10 TIPS95% TIPS
100% 0–5 TIPS
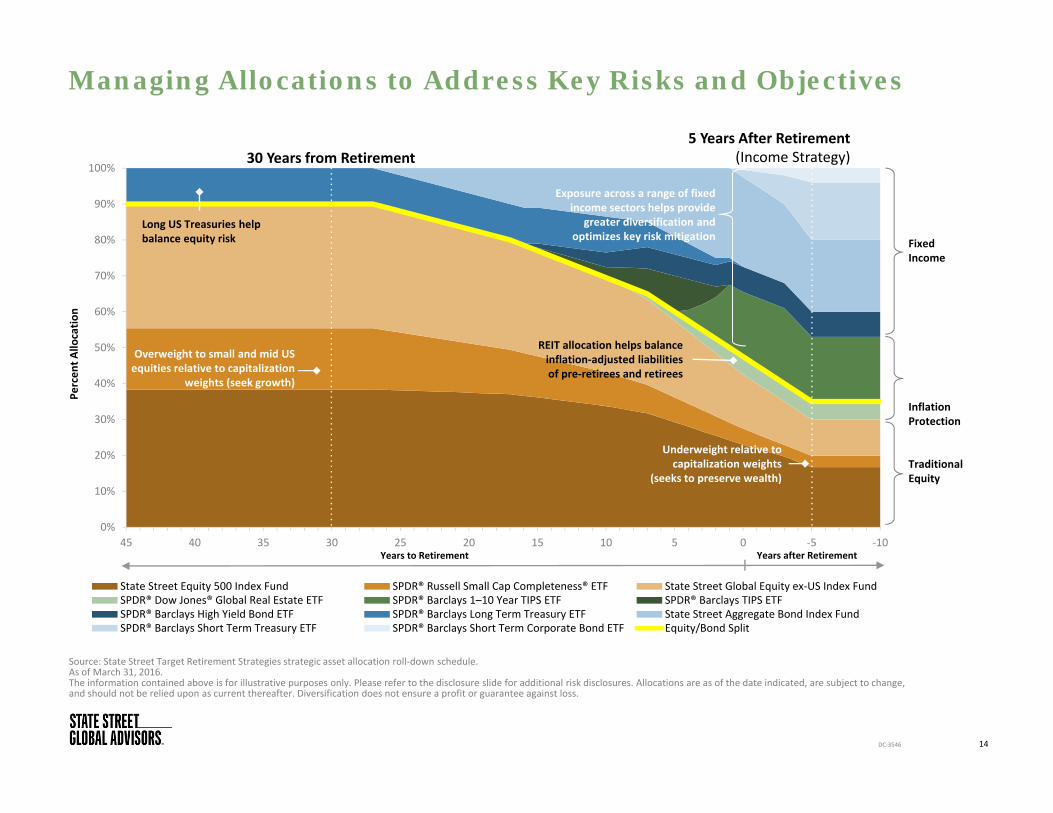
Managing Allocations to Address Key Risks and Objectives
14DC‐3546
Source: State Street Target Retirement Strategies strategic asset allocation roll‐down schedule.As of March 31, 2016.The information contained above is for illustrative purposes only. Please refer to the disclosure slide for additional risk disclosures. Allocations are as of the date indicated, are subject to change, and should not be relied upon as current thereafter. Diversification does not ensure a profit or guarantee against loss.
Years to Retirement Years after Retirement
0%
10%
20%
30%
40%
50%
60%
70%
80%
90%
100%
45 40 35 30 25 20 15 10 5 0 ‐5 ‐10
State Street Equity 500 Index Fund SPDR® Russell Small Cap Completeness® ETF State Street Global Equity ex‐US Index FundSPDR® Dow Jones® Global Real Estate ETF SPDR® Barclays 1–10 Year TIPS ETF SPDR® Barclays TIPS ETFSPDR® Barclays High Yield Bond ETF SPDR® Barclays Long Term Treasury ETF State Street Aggregate Bond Index FundSPDR® Barclays Short Term Treasury ETF SPDR® Barclays Short Term Corporate Bond ETF Equity/Bond Split
Long US Treasuries help balance equity risk
Overweight to small and mid US equities relative to capitalization
weights (seek growth)
REIT allocation helps balance inflation‐adjusted liabilities of pre‐retirees and retirees
Underweight relative to capitalization weights
(seeks to preserve wealth)
Exposure across a range of fixed income sectors helps provide
greater diversification and optimizes key risk mitigation
5 Years After Retirement (Income Strategy)30 Years from Retirement
Inflation Protection
Fixed Income
TraditionalEquity
Percen
t Allo
catio
n

DC Client and Participant Engagement Support
15DC‐3546

YOU ARE OUR FOCUS
Y O U R E X P E R I E N C E + Y O U R WO R K E R S ’ E X P E R I E N C E
As an extension of your team, we bring a consultative and strategic approach
to helping you make retirement work for Oregonians
16DC‐3546

Our shared goal is to improve the financial wellbeing of your workers now — and in retirement
ENGAGING OREGONIANS
of employees feel distracted at work1
of defined contribution participants report missing work to deal with the emotional stress caused by their finances2
of defined contribution participants feel theyare living paycheck to paycheck2
of US workers lack a savings cushion for emergencies3
1 Employee Financial Wellness Survey 2014 Results, PwC.2 State Street Global Advisors Biannual DC Investor Survey, March 2015. See disclosure for survey methodology.3 Report on the Economic Well‐Being of US Households in 2013, US Federal Reserve, 2014.
17DC‐3546
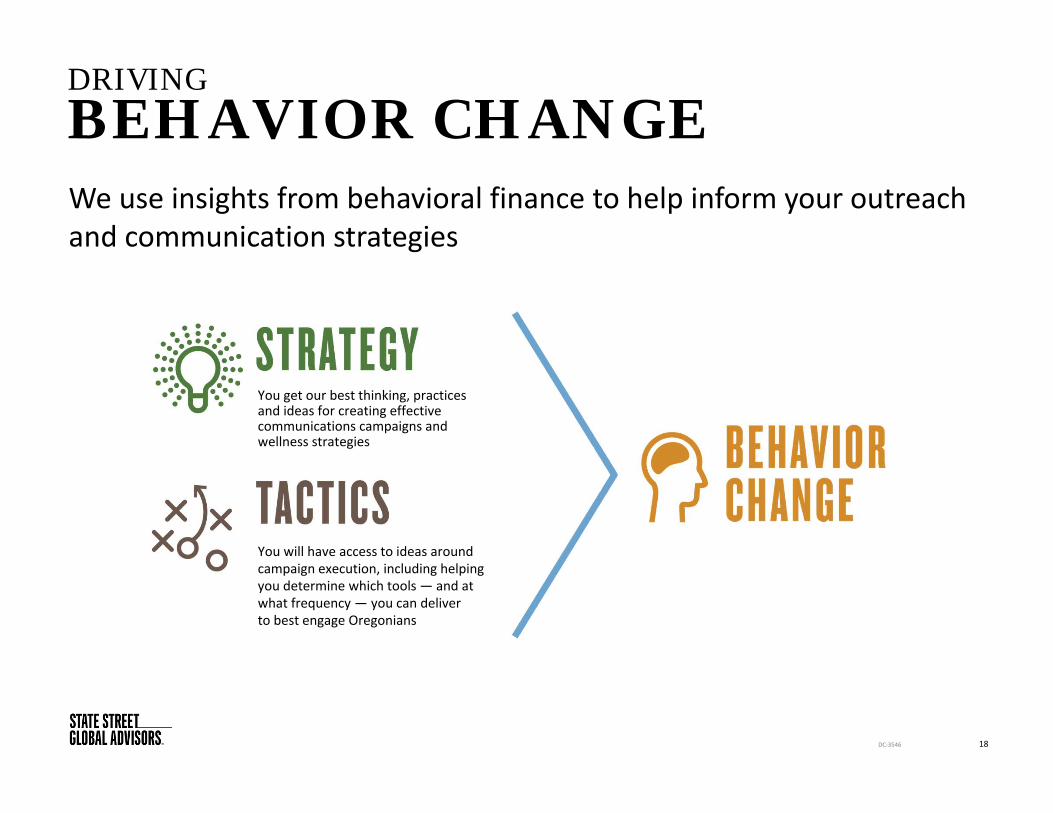
We use insights from behavioral finance to help inform your outreach and communication strategies
DRIVINGBEHAVIOR CHANGE
You get our best thinking, practices and ideas for creating effective communications campaigns and wellness strategies
You will have access to ideas around campaign execution, including helping you determine which tools — and at what frequency — you can deliver to best engage Oregonians
18DC‐3546

We take a consultative approach to helping you and your administratordevelop outreach strategies both during enrollment — and beyond
SUPPORTINGYOUR STRATEGY
Outreach strategy
Access toindustry specialists
Strategic editorial review
Provide sample messaging
Communications campaign planning
Sharing best practices
19DC‐3546

Our well‐defined process is designed to provide a smooth fund implementation
SUPPORTING YOURPLAN SETUP
• Identify Key Contacts• Establish Timeline• Circulate Project Plan• Establish weekly/
monthly meetings
Initial Project ScopeWhat’s happening and when?
Ongoing DevelopmentHow will we work together?
• Confirm roles and responsibilities (including SSGA, recordkeeper, and other providers)
• Validate process flow
• Finalize participant communications
• Confirm delivery instructions
• Review contingency plans
• Review process for opening accounts
• Confirm settlement of assets
• Review communication follow‐up
Communication & TransitionAre we prepared?
De‐brief/Post ImplementationWere we successful?
20DC‐3546
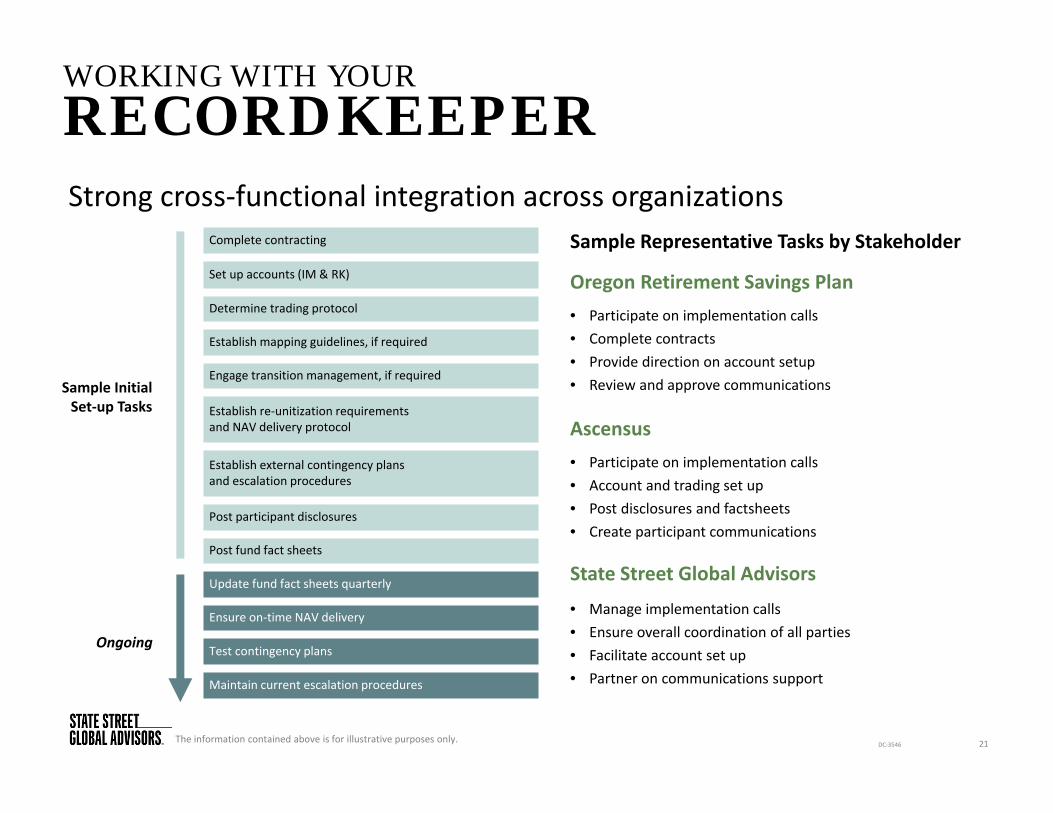
The information contained above is for illustrative purposes only. 21
Sample Representative Tasks by Stakeholder
Oregon Retirement Savings Plan• Participate on implementation calls• Complete contracts• Provide direction on account setup• Review and approve communications
Ascensus• Participate on implementation calls• Account and trading set up• Post disclosures and factsheets• Create participant communications
State Street Global Advisors
• Manage implementation calls• Ensure overall coordination of all parties• Facilitate account set up• Partner on communications support
Complete contracting
Set up accounts (IM & RK)
Determine trading protocol
Establish mapping guidelines, if required
Engage transition management, if required
Establish re‐unitization requirements and NAV delivery protocol
Establish external contingency plans and escalation procedures
Post participant disclosures
Post fund fact sheets
Update fund fact sheets quarterly
Ensure on‐time NAV delivery
Test contingency plans
Maintain current escalation procedures
Ongoing
Sample Initial Set‐up Tasks
WORKING WITH YOUR RECORDKEEPERStrong cross‐functional integration across organizations
DC‐3546

22
“Financial security — the perception that you have more than enough money to do what you want to do — has three times the impact of your income alone on overall wellbeing”1
– Tom Rath and Jim Harter, Wellbeing
1 Wellbeing, Tom Rath and Jim Harter, Gallup Press, 2010.
DC‐3546
Appendix A: Additional Investment OptionsUS Government Money Market Fund S&P 500 Index
23DC‐3546
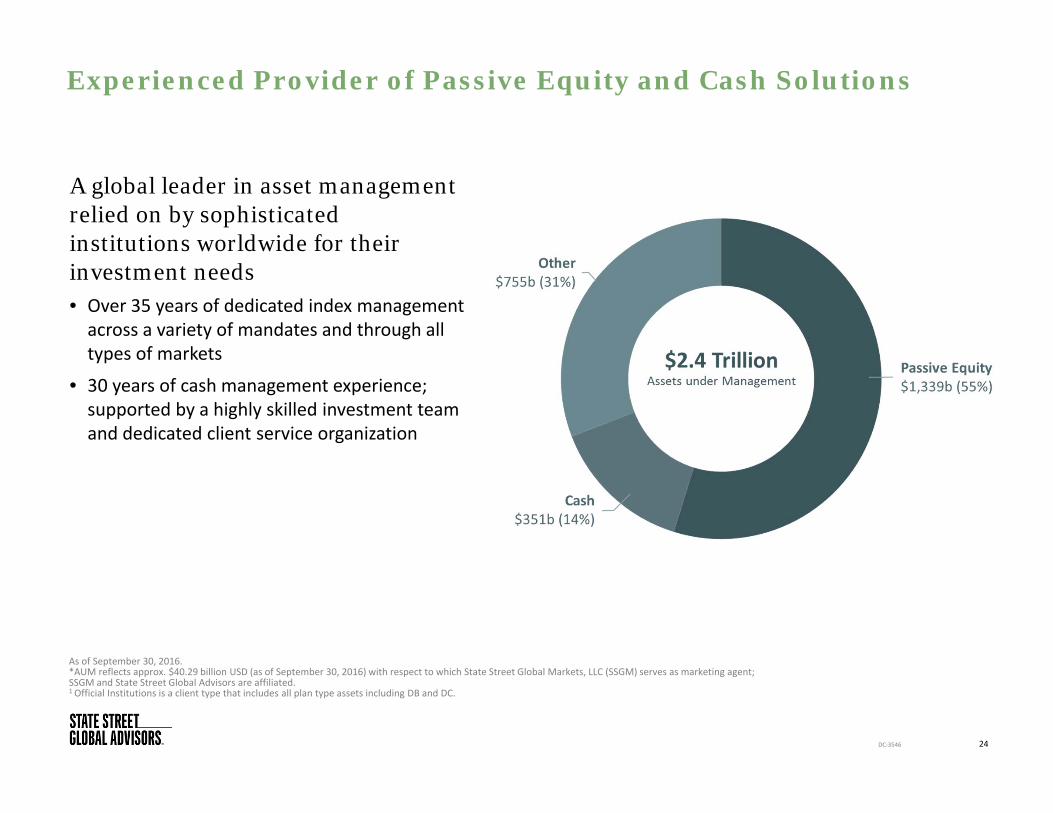
Experienced Provider of Passive Equity and Cash Solutions
As of September 30, 2016.*AUM reflects approx. $40.29 billion USD (as of September 30, 2016) with respect to which State Street Global Markets, LLC (SSGM) serves as marketing agent; SSGM and State Street Global Advisors are affiliated.1 Official Institutions is a client type that includes all plan type assets including DB and DC.
24DC‐3546
A global leader in asset management relied on by sophisticated institutions worldwide for their investment needs• Over 35 years of dedicated index management across a variety of mandates and through all types of markets
• 30 years of cash management experience; supported by a highly skilled investment team and dedicated client service organization
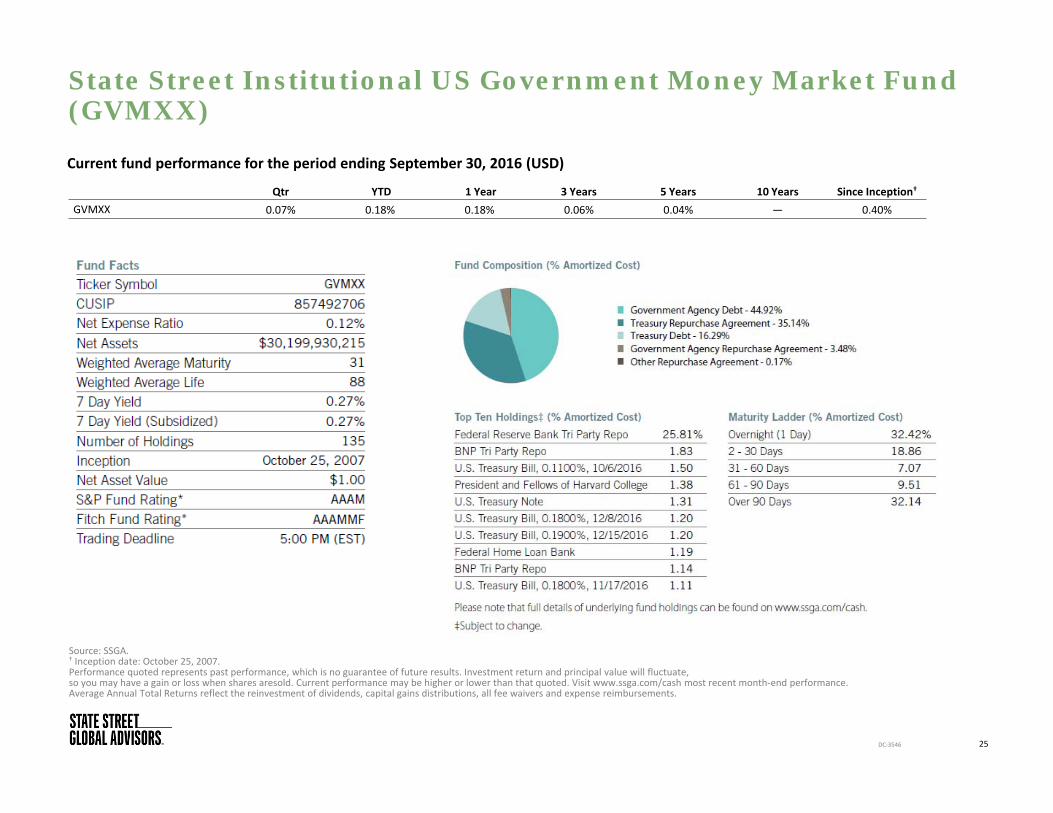
State Street Institutional US Government Money Market Fund(GVMXX)
25DC‐3546
Source: SSGA.† Inception date: October 25, 2007.Performance quoted represents past performance, which is no guarantee of future results. Investment return and principal value will fluctuate, so you may have a gain or loss when shares aresold. Current performance may be higher or lower than that quoted. Visit www.ssga.com/cash most recent month‐end performance. Average Annual Total Returns reflect the reinvestment of dividends, capital gains distributions, all fee waivers and expense reimbursements.
Current fund performance for the period ending September 30, 2016 (USD)
Qtr YTD 1 Year 3 Years 5 Years 10 Years Since Inception†
GVMXX 0.07% 0.18% 0.18% 0.06% 0.04% — 0.40%
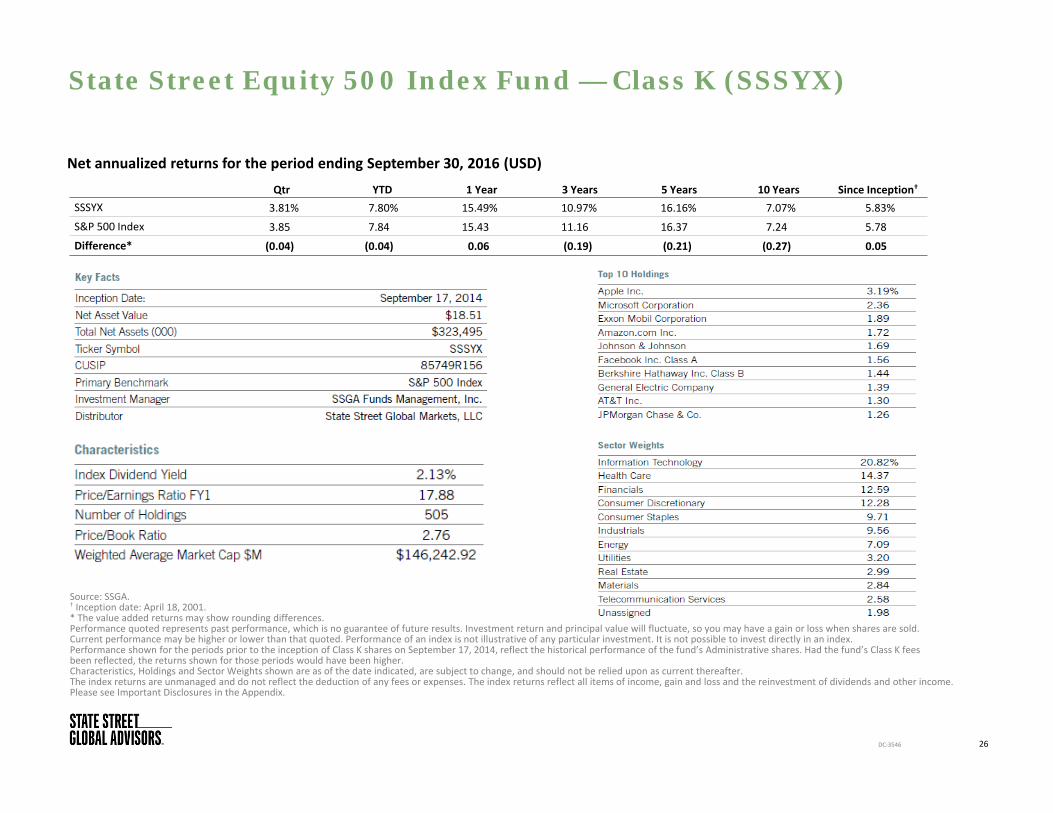
State Street Equity 500 Index Fund — Class K (SSSYX)
26DC‐3546
Source: SSGA.† Inception date: April 18, 2001.* The value added returns may show rounding differences.Performance quoted represents past performance, which is no guarantee of future results. Investment return and principal value will fluctuate, so you may have a gain or loss when shares are sold. Current performance may be higher or lower than that quoted. Performance of an index is not illustrative of any particular investment. It is not possible to invest directly in an index.Performance shown for the periods prior to the inception of Class K shares on September 17, 2014, reflect the historical performance of the fund’s Administrative shares. Had the fund’s Class K fees been reflected, the returns shown for those periods would have been higher.Characteristics, Holdings and Sector Weights shown are as of the date indicated, are subject to change, and should not be relied upon as current thereafter.The index returns are unmanaged and do not reflect the deduction of any fees or expenses. The index returns reflect all items of income, gain and loss and the reinvestment of dividends and other income. Please see Important Disclosures in the Appendix.
Net annualized returns for the period ending September 30, 2016 (USD)
Qtr YTD 1 Year 3 Years 5 Years 10 Years Since Inception†
SSSYX 3.81% 7.80% 15.49% 10.97% 16.16% 7.07% 5.83%S&P 500 Index 3.85 7.84 15.43 11.16 16.37 7.24 5.78Difference* (0.04) (0.04) 0.06 (0.19) (0.21) (0.27) 0.05
Appendix B: Target Retirement Mutual Fund Offering
27DC‐3546
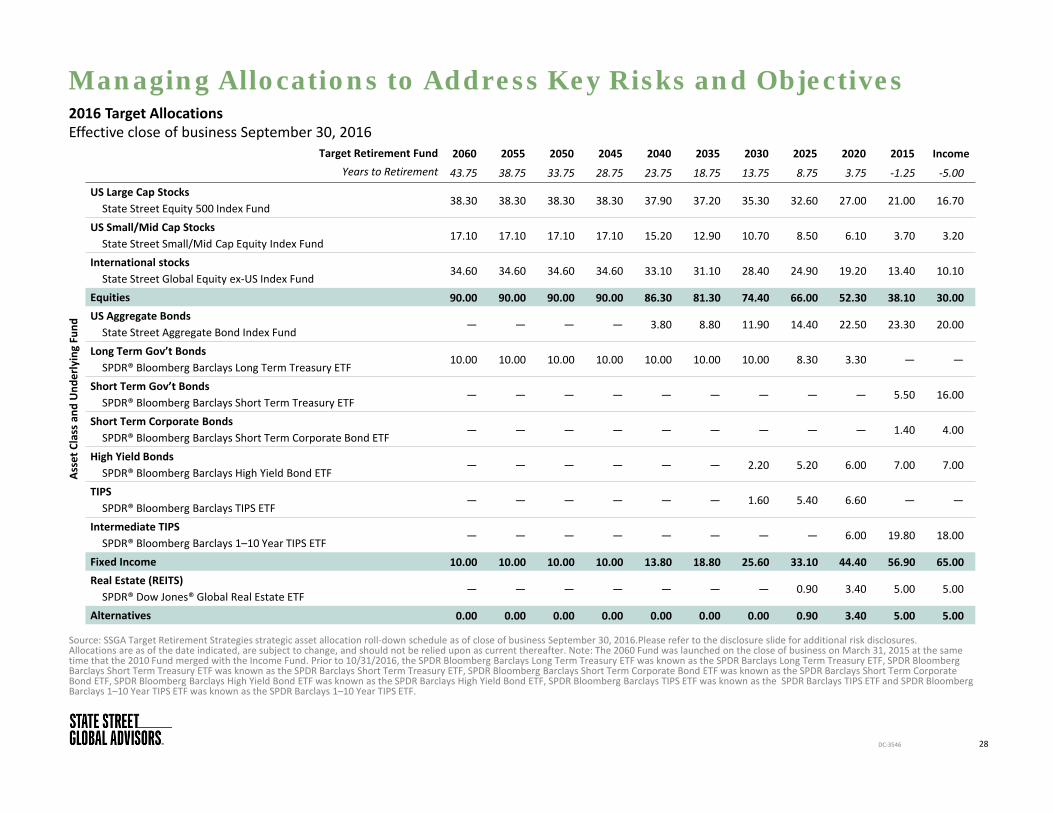
Managing Allocations to Address Key Risks and Objectives
28DC‐3546
Source: SSGA Target Retirement Strategies strategic asset allocation roll‐down schedule as of close of business September 30, 2016.Please refer to the disclosure slide for additional risk disclosures. Allocations are as of the date indicated, are subject to change, and should not be relied upon as current thereafter. Note: The 2060 Fund was launched on the close of business on March 31, 2015 at the same time that the 2010 Fund merged with the Income Fund. Prior to 10/31/2016, the SPDR Bloomberg Barclays Long Term Treasury ETF was known as the SPDR Barclays Long Term Treasury ETF, SPDR Bloomberg Barclays Short Term Treasury ETF was known as the SPDR Barclays Short Term Treasury ETF, SPDR Bloomberg Barclays Short Term Corporate Bond ETF was known as the SPDR Barclays Short Term Corporate Bond ETF, SPDR Bloomberg Barclays High Yield Bond ETF was known as the SPDR Barclays High Yield Bond ETF, SPDR Bloomberg Barclays TIPS ETF was known as the SPDR Barclays TIPS ETF and SPDR Bloomberg Barclays 1–10 Year TIPS ETF was known as the SPDR Barclays 1–10 Year TIPS ETF.
Target Retirement Fund 2060 2055 2050 2045 2040 2035 2030 2025 2020 2015 IncomeYears to Retirement 43.75 38.75 33.75 28.75 23.75 18.75 13.75 8.75 3.75 ‐1.25 ‐5.00
US Large Cap StocksState Street Equity 500 Index Fund
38.30 38.30 38.30 38.30 37.90 37.20 35.30 32.60 27.00 21.00 16.70
US Small/Mid Cap StocksState Street Small/Mid Cap Equity Index Fund
17.10 17.10 17.10 17.10 15.20 12.90 10.70 8.50 6.10 3.70 3.20
International stocksState Street Global Equity ex‐US Index Fund
34.60 34.60 34.60 34.60 33.10 31.10 28.40 24.90 19.20 13.40 10.10
Equities 90.00 90.00 90.00 90.00 86.30 81.30 74.40 66.00 52.30 38.10 30.00US Aggregate BondsState Street Aggregate Bond Index Fund
— — — — 3.80 8.80 11.90 14.40 22.50 23.30 20.00
Long Term Gov’t BondsSPDR® Bloomberg Barclays Long Term Treasury ETF
10.00 10.00 10.00 10.00 10.00 10.00 10.00 8.30 3.30 — —
Short Term Gov’t BondsSPDR® Bloomberg Barclays Short Term Treasury ETF
— — — — — — — — — 5.50 16.00
Short Term Corporate BondsSPDR® Bloomberg Barclays Short Term Corporate Bond ETF
— — — — — — — — — 1.40 4.00
High Yield BondsSPDR® Bloomberg Barclays High Yield Bond ETF
— — — — — — 2.20 5.20 6.00 7.00 7.00
TIPSSPDR® Bloomberg Barclays TIPS ETF
— — — — — — 1.60 5.40 6.60 — —
Intermediate TIPSSPDR® Bloomberg Barclays 1–10 Year TIPS ETF
— — — — — — — — 6.00 19.80 18.00
Fixed Income 10.00 10.00 10.00 10.00 13.80 18.80 25.60 33.10 44.40 56.90 65.00Real Estate (REITS)SPDR® Dow Jones® Global Real Estate ETF
— — — — — — — 0.90 3.40 5.00 5.00
Alternatives 0.00 0.00 0.00 0.00 0.00 0.00 0.00 0.90 3.40 5.00 5.00
2016 Target AllocationsEffective close of business September 30, 2016
Asset C
lass and
Und
erlying Fund
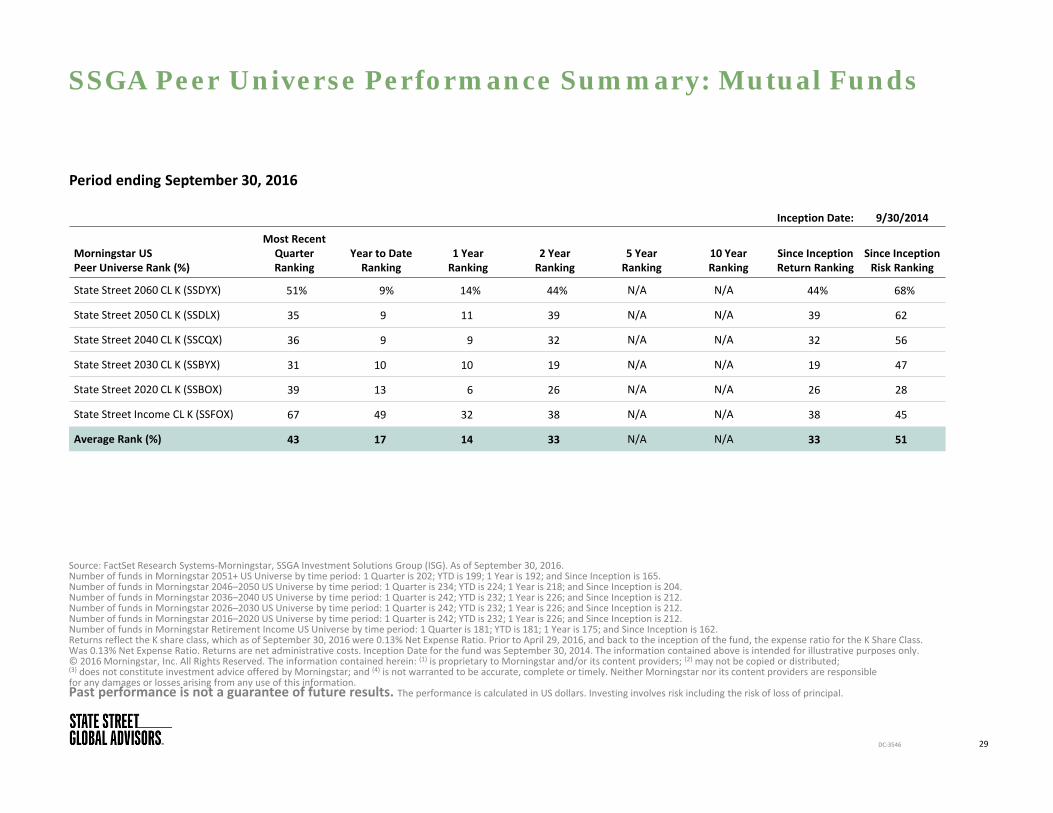
SSGA Peer Universe Performance Summary: Mutual Funds
29DC‐3546
Source: FactSet Research Systems‐Morningstar, SSGA Investment Solutions Group (ISG). As of September 30, 2016.Number of funds in Morningstar 2051+ US Universe by time period: 1 Quarter is 202; YTD is 199; 1 Year is 192; and Since Inception is 165. Number of funds in Morningstar 2046–2050 US Universe by time period: 1 Quarter is 234; YTD is 224; 1 Year is 218; and Since Inception is 204. Number of funds in Morningstar 2036–2040 US Universe by time period: 1 Quarter is 242; YTD is 232; 1 Year is 226; and Since Inception is 212. Number of funds in Morningstar 2026–2030 US Universe by time period: 1 Quarter is 242; YTD is 232; 1 Year is 226; and Since Inception is 212. Number of funds in Morningstar 2016–2020 US Universe by time period: 1 Quarter is 242; YTD is 232; 1 Year is 226; and Since Inception is 212. Number of funds in Morningstar Retirement Income US Universe by time period: 1 Quarter is 181; YTD is 181; 1 Year is 175; and Since Inception is 162.Returns reflect the K share class, which as of September 30, 2016 were 0.13% Net Expense Ratio. Prior to April 29, 2016, and back to the inception of the fund, the expense ratio for the K Share Class. Was 0.13% Net Expense Ratio. Returns are net administrative costs. Inception Date for the fund was September 30, 2014. The information contained above is intended for illustrative purposes only. © 2016 Morningstar, Inc. All Rights Reserved. The information contained herein: (1) is proprietary to Morningstar and/or its content providers; (2) may not be copied or distributed; (3) does not constitute investment advice offered by Morningstar; and (4) is not warranted to be accurate, complete or timely. Neither Morningstar nor its content providers are responsible for any damages or losses arising from any use of this information. Past performance is not a guarantee of future results. The performance is calculated in US dollars. Investing involves risk including the risk of loss of principal.
Period ending September 30, 2016
Inception Date: 9/30/2014
Morningstar USPeer Universe Rank (%)
Most Recent Quarter Ranking
Year to Date Ranking
1 Year Ranking
2 Year Ranking
5 Year Ranking
10 Year Ranking
Since Inception Return Ranking
Since Inception Risk Ranking
State Street 2060 CL K (SSDYX) 51% 9% 14% 44% N/A N/A 44% 68%
State Street 2050 CL K (SSDLX) 35 9 11 39 N/A N/A 39 62
State Street 2040 CL K (SSCQX) 36 9 9 32 N/A N/A 32 56
State Street 2030 CL K (SSBYX) 31 10 10 19 N/A N/A 19 47
State Street 2020 CL K (SSBOX) 39 13 6 26 N/A N/A 26 28
State Street Income CL K (SSFOX) 67 49 32 38 N/A N/A 38 45
Average Rank (%) 43 17 14 33 N/A N/A 33 51
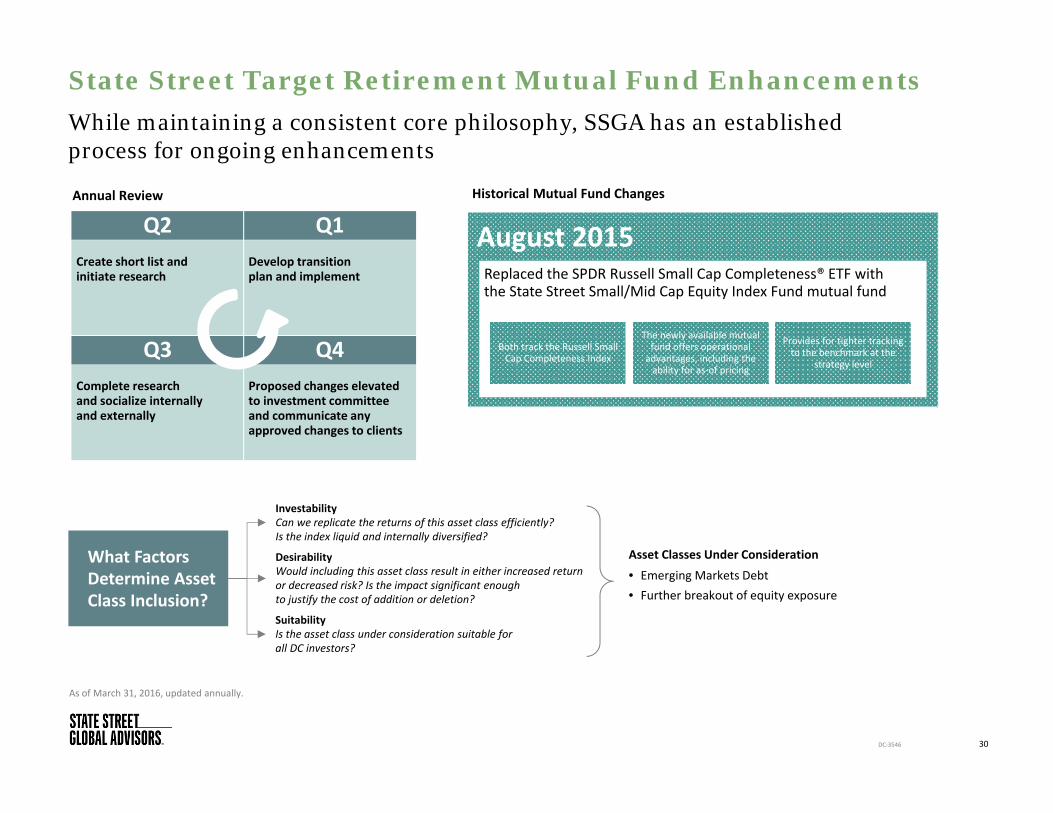
State Street Target Retirement Mutual Fund EnhancementsWhile maintaining a consistent core philosophy, SSGA has an established process for ongoing enhancements
30DC‐3546
As of March 31, 2016, updated annually.
Annual Review Historical Mutual Fund Changes
Proposed changes elevated to investment committee and communicate any approved changes to clients
Complete researchand socialize internally and externally
Q3
Develop transition plan and implement
Create short list and initiate research
Q2 Q1
Q3 Q4
Asset Classes Under Consideration
• Emerging Markets Debt• Further breakout of equity exposure
What Factors Determine Asset Class Inclusion?
SuitabilityIs the asset class under consideration suitable forall DC investors?
Desirability Would including this asset class result in either increased return or decreased risk? Is the impact significant enough to justify the cost of addition or deletion?
InvestabilityCan we replicate the returns of this asset class efficiently? Is the index liquid and internally diversified?
August 2015Replaced the SPDR Russell Small Cap Completeness® ETF withthe State Street Small/Mid Cap Equity Index Fund mutual fund
Both track the Russell Small Cap Completeness Index
The newly available mutual fund offers operational advantages, including the ability for as‐of pricing
Provides for tighter tracking to the benchmark at the
strategy level
Appendix C: Target Retirement CIT Offering
31DC‐3546
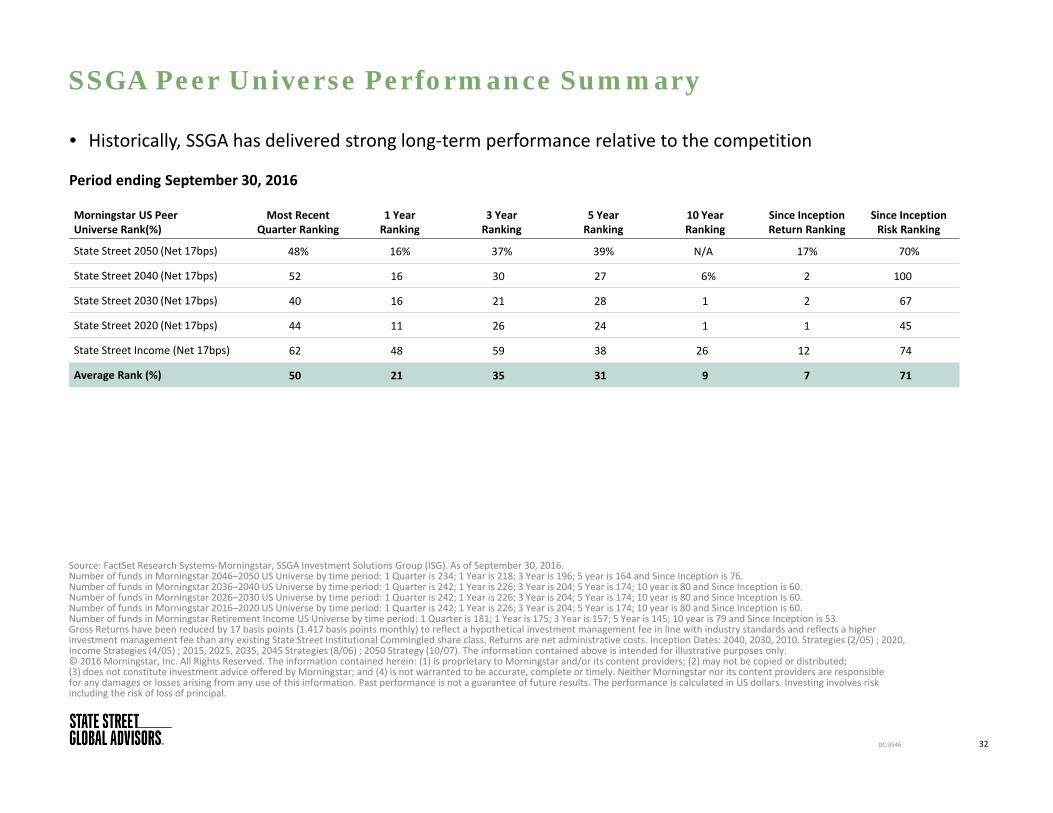
SSGA Peer Universe Performance Summary
Source: FactSet Research Systems‐Morningstar, SSGA Investment Solutions Group (ISG). As of September 30, 2016.Number of funds in Morningstar 2046–2050 US Universe by time period: 1 Quarter is 234; 1 Year is 218; 3 Year is 196; 5 year is 164 and Since Inception is 76. Number of funds in Morningstar 2036–2040 US Universe by time period: 1 Quarter is 242; 1 Year is 226; 3 Year is 204; 5 Year is 174; 10 year is 80 and Since Inception is 60. Number of funds in Morningstar 2026–2030 US Universe by time period: 1 Quarter is 242; 1 Year is 226; 3 Year is 204; 5 Year is 174; 10 year is 80 and Since Inception is 60. Number of funds in Morningstar 2016–2020 US Universe by time period: 1 Quarter is 242; 1 Year is 226; 3 Year is 204; 5 Year is 174; 10 year is 80 and Since Inception is 60. Number of funds in Morningstar Retirement Income US Universe by time period: 1 Quarter is 181; 1 Year is 175; 3 Year is 157; 5 Year is 145; 10 year is 79 and Since Inception is 53.Gross Returns have been reduced by 17 basis points (1.417 basis points monthly) to reflect a hypothetical investment management fee in line with industry standards and reflects a higher investment management fee than any existing State Street Institutional Commingled share class. Returns are net administrative costs. Inception Dates: 2040, 2030, 2010. Strategies (2/05) ; 2020, Income Strategies (4/05) ; 2015, 2025, 2035, 2045 Strategies (8/06) ; 2050 Strategy (10/07). The information contained above is intended for illustrative purposes only. © 2016 Morningstar, Inc. All Rights Reserved. The information contained herein: (1) is proprietary to Morningstar and/or its content providers; (2) may not be copied or distributed; (3) does not constitute investment advice offered by Morningstar; and (4) is not warranted to be accurate, complete or timely. Neither Morningstar nor its content providers are responsiblefor any damages or losses arising from any use of this information. Past performance is not a guarantee of future results. The performance is calculated in US dollars. Investing involves risk including the risk of loss of principal.
32DC‐3546
• Historically, SSGA has delivered strong long‐term performance relative to the competition
Period ending September 30, 2016
Morningstar US Peer Universe Rank(%)
Most Recent Quarter Ranking
1 Year Ranking
3 Year Ranking
5 Year Ranking
10 Year Ranking
Since Inception Return Ranking
Since Inception Risk Ranking
State Street 2050 (Net 17bps) 48% 16% 37% 39% N/A 17% 70%
State Street 2040 (Net 17bps) 52 16 30 27 6% 2 100
State Street 2030 (Net 17bps) 40 16 21 28 1 2 67
State Street 2020 (Net 17bps) 44 11 26 24 1 1 45
State Street Income (Net 17bps) 62 48 59 38 26 12 74
Average Rank (%) 50 21 35 31 9 7 71
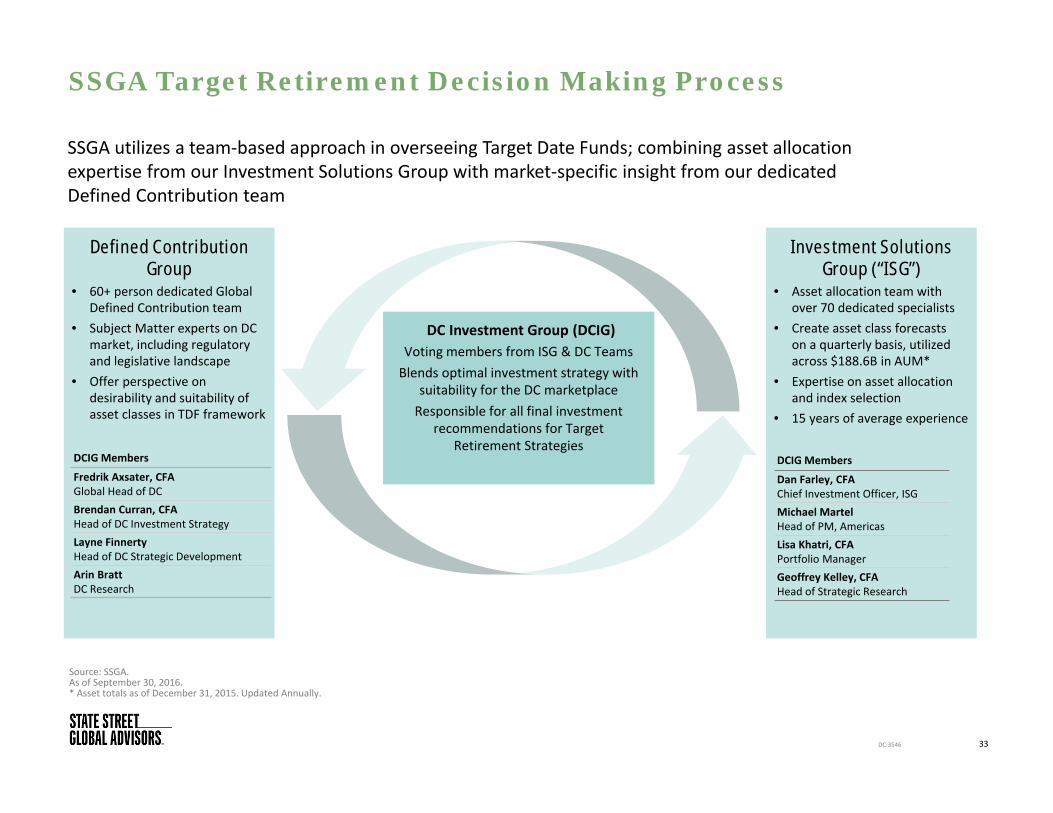
SSGA Target Retirement Decision Making Process
33DC‐3546
Source: SSGA.As of September 30, 2016.* Asset totals as of December 31, 2015. Updated Annually.
Investment Solutions Group (“ISG”)
• Asset allocation team with over 70 dedicated specialists
• Create asset class forecasts on a quarterly basis, utilized across $188.6B in AUM*
• Expertise on asset allocation and index selection
• 15 years of average experience
Defined Contribution Group
• 60+ person dedicated Global Defined Contribution team
• Subject Matter experts on DC market, including regulatory and legislative landscape
• Offer perspective on desirability and suitability of asset classes in TDF framework
DCIG Members
Dan Farley, CFAChief Investment Officer, ISGMichael MartelHead of PM, AmericasLisa Khatri, CFAPortfolio ManagerGeoffrey Kelley, CFAHead of Strategic Research
DCIG Members
Fredrik Axsater, CFAGlobal Head of DCBrendan Curran, CFAHead of DC Investment StrategyLayne FinnertyHead of DC Strategic DevelopmentArin BrattDC Research
DC Investment Group (DCIG)Voting members from ISG & DC TeamsBlends optimal investment strategy with
suitability for the DC marketplaceResponsible for all final investment
recommendations for Target Retirement Strategies
SSGA utilizes a team‐based approach in overseeing Target Date Funds; combining asset allocation expertise from our Investment Solutions Group with market‐specific insight from our dedicated Defined Contribution team
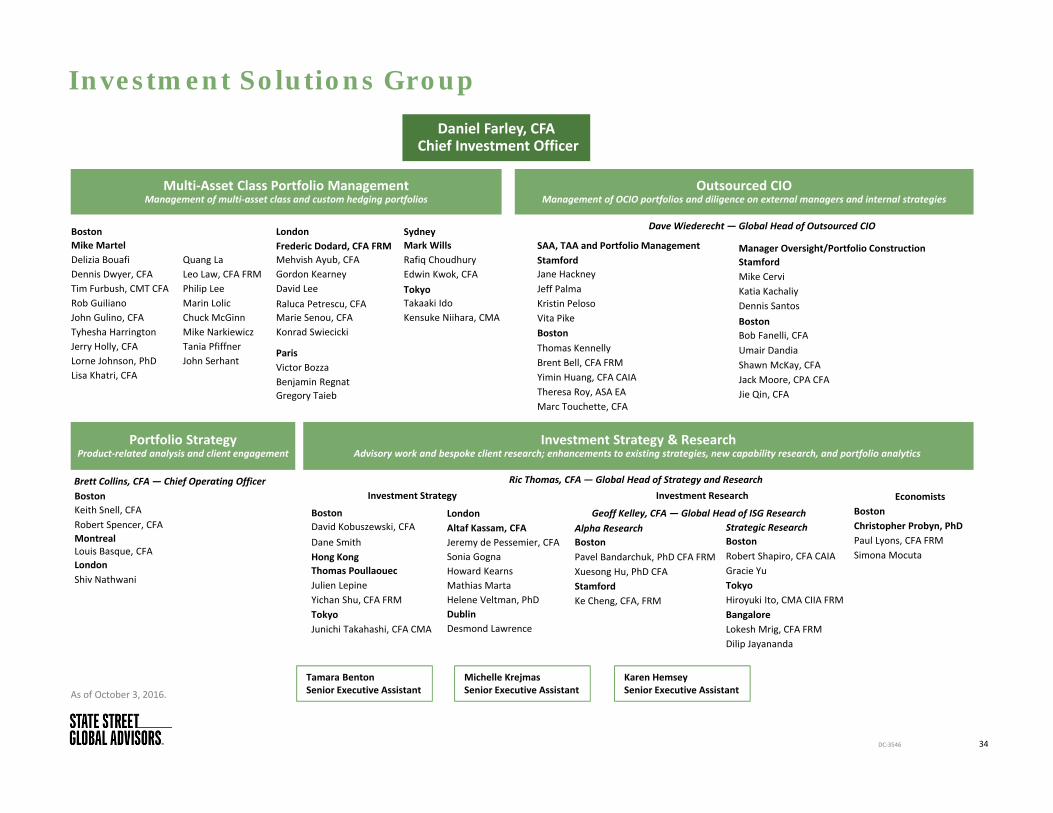
Investment Solutions Group
As of October 3, 2016.
34DC‐3546
EconomistsBostonChristopher Probyn, PhD Paul Lyons, CFA FRMSimona Mocuta
Investment Strategy & ResearchAdvisory work and bespoke client research; enhancements to existing strategies, new capability research, and portfolio analytics
Daniel Farley, CFAChief Investment Officer
Multi‐Asset Class Portfolio ManagementManagement of multi‐asset class and custom hedging portfolios
BostonMike MartelDelizia BouafiDennis Dwyer, CFATim Furbush, CMT CFARob GuilianoJohn Gulino, CFATyhesha HarringtonJerry Holly, CFALorne Johnson, PhDLisa Khatri, CFA
LondonFrederic Dodard, CFA FRMMehvish Ayub, CFAGordon KearneyDavid LeeRaluca Petrescu, CFAMarie Senou, CFAKonrad Swiecicki
ParisVictor BozzaBenjamin RegnatGregory Taieb
BostonDavid Kobuszewski, CFADane SmithHong KongThomas PoullaouecJulien LepineYichan Shu, CFA FRMTokyoJunichi Takahashi, CFA CMA
Manager Oversight/Portfolio ConstructionStamfordMike CerviKatia KachaliyDennis SantosBostonBob Fanelli, CFAUmair DandiaShawn McKay, CFAJack Moore, CPA CFAJie Qin, CFA
Ric Thomas, CFA —Global Head of Strategy and ResearchBostonKeith Snell, CFARobert Spencer, CFAMontrealLouis Basque, CFALondonShiv Nathwani
Portfolio StrategyProduct‐related analysis and client engagement
Brett Collins, CFA — Chief Operating Officer
Alpha ResearchBostonPavel Bandarchuk, PhD CFA FRMXuesong Hu, PhD CFAStamfordKe Cheng, CFA, FRM
Geoff Kelley, CFA —Global Head of ISG ResearchStrategic ResearchBostonRobert Shapiro, CFA CAIAGracie YuTokyoHiroyuki Ito, CMA CIIA FRMBangaloreLokesh Mrig, CFA FRMDilip Jayananda
Tamara BentonSenior Executive Assistant
Michelle KrejmasSenior Executive Assistant
Quang LaLeo Law, CFA FRMPhilip LeeMarin LolicChuck McGinnMike NarkiewiczTania PfiffnerJohn Serhant
SydneyMark WillsRafiq ChoudhuryEdwin Kwok, CFATokyoTakaaki IdoKensuke Niihara, CMA
LondonAltaf Kassam, CFAJeremy de Pessemier, CFASonia GognaHoward KearnsMathias MartaHelene Veltman, PhDDublinDesmond Lawrence
SAA, TAA and Portfolio ManagementStamfordJane HackneyJeff PalmaKristin PelosoVita PikeBostonThomas KennellyBrent Bell, CFA FRMYimin Huang, CFA CAIATheresa Roy, ASA EAMarc Touchette, CFA
Dave Wiederecht — Global Head of Outsourced CIO
Karen HemseySenior Executive Assistant
Outsourced CIOManagement of OCIO portfolios and diligence on external managers and internal strategies
Investment Strategy Investment Research
0%
10%
20%
30%
40%
50%
60%
70%
80%
90%
100%
45 40 35 30 25 20 15 10 5 0 ‐5 ‐10
US Large Cap Equities US Small/Mid Cap Equities International (ACWI — ex‐US IMI) Real Estate (REITs)Commodities Intermediate TIPS TIPS High Yield BondsLong‐Term Government Bonds Barclays Aggregate Bond Index 1–3 Gov't/Credit Bonds Equity/Bond Split
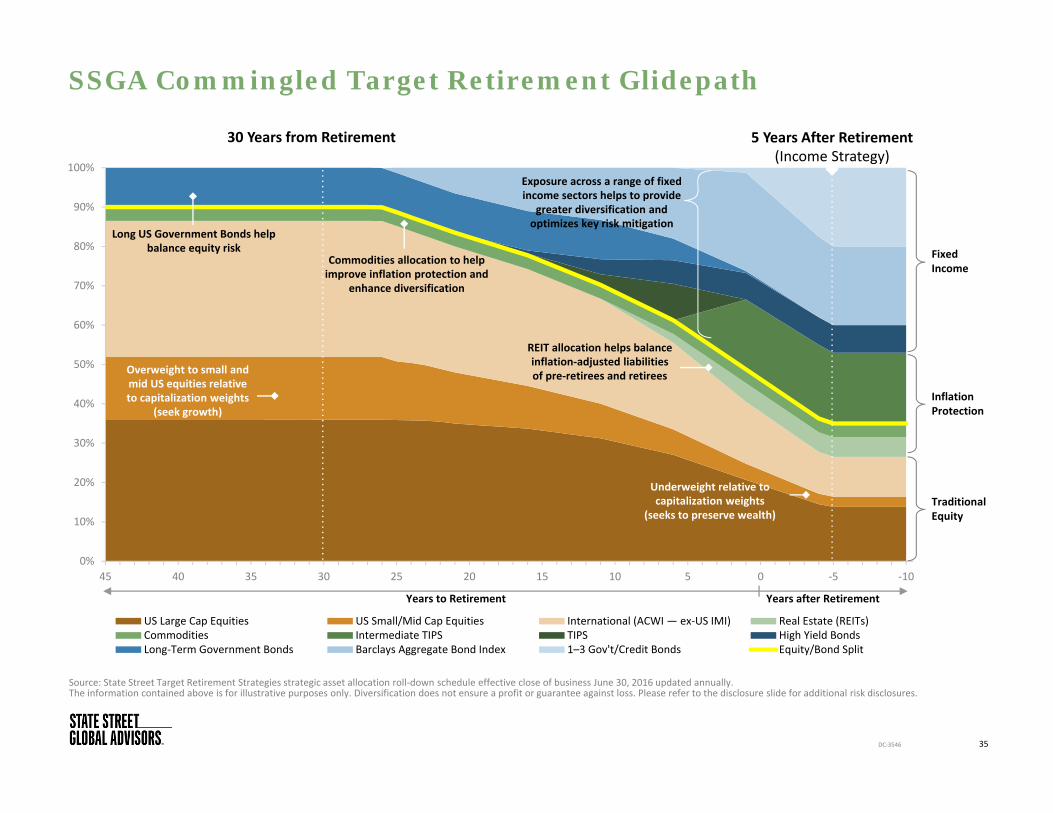
SSGA Commingled Target Retirement Glidepath
Source: State Street Target Retirement Strategies strategic asset allocation roll‐down schedule effective close of business June 30, 2016 updated annually.The information contained above is for illustrative purposes only. Diversification does not ensure a profit or guarantee against loss. Please refer to the disclosure slide for additional risk disclosures.
35DC‐3546
5 Years After Retirement (Income Strategy)
30 Years from Retirement
Years to Retirement Years after Retirement
Inflation Protection
Fixed Income
TraditionalEquity
Long US Government Bonds help balance equity risk
Overweight to small and mid US equities relative to capitalization weights
(seek growth)
Commodities allocation to help improve inflation protection and
enhance diversification
REIT allocation helps balance inflation‐adjusted liabilitiesof pre‐retirees and retirees
Underweight relative to capitalization weights
(seeks to preserve wealth)
Exposure across a range of fixed income sectors helps to provide
greater diversification and optimizes key risk mitigation

Appendix D: Important Disclosures
36DC‐3546
Important Risk Disclosures
37DC‐3546
FOR INVESTMENT PROFESSIONAL USE ONLY. Not for use with the public.
Investing involves risk including the risk of loss of principal.
SSGA Target Date Fund are designed for investors expecting to retire around the year indicated in each fund’s name. When choosing a Fund, investors should consider whether they anticipate retiring significantly earlier or later than age 65 even if such investors retire on or near a fund’s approximate target date. There may be other considerations relevant to fund selection and investors should select the fund that best meets their individual circumstances and investment goals. The funds’ asset allocation strategy becomes increasingly conservative as it approaches the target date and beyond. The investment risks of each Fund change over time as its asset allocation changes.
Equity securities may fluctuate in value in response to the activities of individual companies and general market and economic conditions. Companies with large market capitalizations go in and out of favor based on market and economic conditions. Larger companies tend to be less volatile than companies with smaller market capitalizations. In exchange for this potentially lower risk, the value of the security may not rise as much as companies with smaller market capitalizations. risk and volatility than stocks, but contain interest rate risk (as interest rates rise bond prices usually fall); issuer default risk; issuer credit risk; liquidity risk; and inflation risk. These effects are usually pronounced for longer‐term securities. Any fixed income security sold or redeemed prior to maturity may be subject to a substantial gain or loss.
Increase in real interest rates can cause the price of inflation‐protected debt securities to decrease. Interest payments on inflation‐protected debt securities can be unpredictable.
All the index performance results referred to are provided exclusively for comparison purposes only. It should not be assumed that they represent the performance of any particular investment. Assumptions and forecasts used by SSGA in developing the Portfolio’s asset allocation glide path may not be in line with future capital market returns and participant savings activities, which could result in losses near, at or after the target date year or could result in the Portfolio not providing adequate income at and through retirement.
Investments in mid/small‐sized companies may involve greater risks than in those of larger, better known companies.
Investing in REITs involves certain distinct risks in addition to those risks associated with investing in the real estate industry in general. Equity REITs may be affected by changes in the value of the underlying property owned by the REITs, while mortgage REITs may be affected by the quality of credit extended. REITs are subject to heavy cash flow dependency, default by borrowers and self‐liquidation. REITs, especially mortgage REITs, are also subject to interest rate risk (i.e., as interest rates rise, the value of the REIT may decline).
Investing in commodities entail significant risk and is not appropriate for all investors. Commodities investing entail significant risk as commodity prices can be extremely volatile due to wide range of factors. A few such factors include overall market movements, real or perceived inflationary trends, commodity index volatility, international, economic and political changes, change in interest and currency exchange rates. Investing in high yield fixed income securities, otherwise known as junk bonds, is considered speculative and involves greater risk of loss of principal and interest than investing in investment grade fixed income securities. These Lower‐quality debt securities involve greater risk of default or price changes due to potential changes in the credit quality of the issuer. Diversification does not ensure a profit or guarantee against loss. Investing in foreign domiciled securities may involve risk of capital loss from unfavorable fluctuation in currency values, withholding taxes, from differences in generally accepted accounting principles or from economic or political instability in other nations. Investments in emerging or developing markets may be more volatile and less liquid than investing in developed markets and may involve exposure to economic structures that are generally less diverse and mature and to political systems which have less stability than those of more developed countries.
Important Risk Disclosures
38DC‐3546
Asset Allocation is a method of diversification which positions assets among major investment categories. Asset Allocation may be used in an effort to manage risk andenhance returns. It does not, however, guarantee a profit or protect against loss.ETFs trade like stocks, are subject to investment risk, fluctuate in market value and may trade at prices above or below the ETFs net asset value. Brokerage commissions and ETF expenses will reduce returns. The company plans presented herein have different demographics, investment objectives, costs and expenses. The performance of each plan will necessarily depend on the ability of their respective managers to select portfolio investments. These differences, among others, may result in significant disparity in the funds' portfolio assets and performance.Standard & Poor’s, S&P and SPDR are registered trademarks of Standard & Poor’s Financial Services LLC (S&P); Dow Jones is a registered trademark of Dow Jones Trademark Holdings LLC (Dow Jones); and these trademarks have been licensed for use by S&P Dow Jones Indices LLC (SPDJI) and sublicensed for certain purposes by State Street Corporation. State Street Corporation’s financial products are not sponsored, endorsed, sold or promoted by SPDJI, Dow Jones, S&P, their respective affiliates and third party licensors and none of such parties make any representation regarding the advisability of investing in such product(s) nor do they have any liability in relation thereto, including for any errors, omissions, or interruptions of any index.The trademarks and service marks referenced herein are the property of their respective owners. Third party data providers make no warranties or representations of any kind relating to the accuracy, completeness or timeliness of the data and have no liability for damages of any kind relating to the use of such data.Distributor: State Street Global Markets, LLC, member FINRA, SIPC, a wholly owned subsidiary of State Street Corporation. References to State Street may include State Street Corporation and its affiliates. Certain State Street affiliates provide services and receive fees from the SPDR ETFs. The SSGA Funds pay State Street Bank and Trust Company for its services as custodian, transfer agent and shareholder servicing agent and pays SSGA Funds Management, Inc. for investment advisory services.Derivative investments may involve risks such as potential illiquidity of the markets and additional risk of loss of principal.Passively managed funds invest by sampling the index, holding a range of securities that, in the aggregate, approximates the full Index in terms of key risk factors and other characteristics. This may cause the fund to experience tracking errors relative to performance of the index.Non‐diversified funds that focus on a relatively small number of issuers tend to be more volatile than diversified funds and the market as a whole.These investments may have difficulty in liquidating an investment position without taking a significant discount from current market value, which can be a significant problem with certain lightly traded securities.Generally, among asset classes, stocks are more volatile than bonds or short‐term instruments. Government bonds and corporate bonds generally have more moderate short‐term price fluctuations than stocks, but provide lower potential long‐term returns. US Treasury Bills maintain a stable value if held to maturity, but returns are generally only slightly above the inflation rate. Certain Supplemental Information being provided is that of a representative account within the Composite and should not deemed to be reflective of the overall Composite. Certain Supplemental Information may be rounded to the nearest hundredth decimal and may result in the total not adding up to 100.Investing in futures is highly risky. Futures positions are considered highly leveraged because the initial margins are significantly smaller than the cash value of the contracts. The smaller the value of the margin in comparison to the cash value of the futures contract, the higher the leverage. There are a number of risks associated with futures investing including but not limited to counterparty credit risk, currency risk, derivatives risk, foreign issuer exposure risk, sector concentration risk, leveraging and liquidity risks.

This document provides summary information regarding the Strategy. This document should be read in conjunction with the Strategy’s Disclosure Document, which is available from SSGA. The Strategy Disclosure Document contains important information about the Strategy, including a description of a number of risks.The S&P 500 Index is a product of S&P Dow Jones Indices LLC (“SPDJI”), and has been licensed for use by SSGA. Standard & Poor’s®, S&P® and S&P 500® are registered trademarks of Standard & Poor’s Financial Services LLC (“S&P”).Risk associated with equity investing include stock values which may fluctuate in response to the activities of individual companies and general market and economic conditions.Securities lending programs and the subsequent reinvestment of the posted collateral are subject to a number of risks, including the risk that the value of the investments held in the collateral may decline in value and may at any point be worth less than the original cost of that investment.Investing involves risk, including the loss of principal.The whole or any part of this work may not be reproduced, copied or transmitted or any of its contents disclosed to third parties without SSGA’s express written consent.DC Investor Survey, March 2015. The survey was fielded in partnership with TRC Market Research, an independent marketing research firm. The data were collected in January 2015 through a 20‐minute internet survey using a panel of 1,009 verified 401(k), 403(b), 457(b), and profit‐sharing plan participants, aged 20 to 69, who were working at least part‐time.The information provided does not constitute investment advice and it should not be relied on as such. It should not be considered a solicitation to buy or an offer to sell a security. It does not take into account any investor’s particular investment objectives, strategies, tax status, or investment horizon. You should consult your tax and financial advisor. All material has been obtained from sources believed to be reliable. There is no representation or warranty as to the accuracy of the information and State Street shall have no liability for decisions based on such information.This document contains certain statements that may be deemed forward‐looking statements. Please note that any such statements are not guarantees of any future performance and actual results or developments may differ materially from those projected.SPDR ETF Distributor: State Street Global Markets, LLC, member FINRA, SIPC, a wholly owned subsidiary of State Street Corporation. References to State Street may include State Street Corporation and its affiliates. Certain State Street affiliates provide services and receive fees from the SPDR ETFs. ALPS Distributors, Inc., a registered broker‐dealer,is distributor for SPDR® S&P® 500, SPDR® S&P® MidCap 400 and SPDR® Dow Jones Industrial Average, and all unit investment trusts. ALPS Portfolio Solutions Distributor, Inc.is distributor for Select Sector SPDRs. ALPS Distributors, Inc. and ALPS Portfolio Solutions Distributor, Inc. are not affiliated with State Street Global Markets, LLC. SSGA Funds Distributor: State Street Global Markets, LLC, member FINRA, SIPC, a wholly owned subsidiary of State Street Corporation. References to State Street may include State Street Corporation and its affiliates. The SSGA Funds pay State Street Bank and Trust Company for its services as custodian, transfer agent and shareholder servicing agent and pays SSGA Funds Management, Inc. for investment advisory services.Before investing, consider the funds, investment objectives, risks, charges and expenses. To obtain a prospectus or summary prospectus which contains this and other information on SSGA Mutual Funds call 1‐800‐997‐7327 or visit www.ssgafunds.com, and on SPDR ETFs call 1‐866‐787‐2257 or visit www.spdrs.com. Read it carefully.Not FDIC Insured —No Bank Guarantee —May Lose Value.
United States: State Street Global Advisors, One Lincoln Street, Boston, MA 02111‐2900.Web: www.ssga.com© 2017 State Street Corporation —All Rights Reserved.Tracking Code: DC‐3546Expiration Date: February 28, 2017
Important Disclosures
39DC‐3546

Appendix E: Biographies
40DC‐3546

Biographies
Fredrik Axsater, CFA
Fredrik is a Senior Managing Director of State Street Global Advisors and the Global Head of the Defined Contribution and ESG businesses. In this role, he is responsible for advancing SSGA’s retirement and ESG initiatives, including product development, distribution, client service, operations and marketing infrastructure. He works closely with our global teams to create and deliver competitive offerings tailored to meet regional and country‐specific requirements. Additionally, Fredrik is a member of SSGA’s Senior Leadership Team.
Prior to joining SSGA, Fredrik was a Managing Director and Head of Investment Strategy and Product Management for Blackrock’s DC business. He started working within Defined Contribution in 1996, and has deep investment knowledge, with a particular expertise in target date and retirement income solutions, as well as best‐practice DC plan architecture. The mission‐oriented principles for retirement investing also apply to impact investing, and Fredrik oversees the rapid growth of this team and business. Earlier in Fredrik’s career, he spent ten years in multiple portfolio management roles, across both Defined Contribution and Global Macro Strategies.
Fredrik earned a BS/BA in Electrical Engineering from the University of San Diego, an MBA from the University of Illinois, and the Chartered Financial Analyst designation. He has co‐led the strategic partnership between State Street and the CFA Institute, and for many years he has also worked closely with the CFA Institute to evolve the CFA curriculum.
41DC‐3546
Megan M. Hart
Megan is a Vice President of State Street Global Advisors and a Senior Relationship Manager in the San Francisco Office. She is primarily responsible for managing client relationships for SSGA’s existing West Coast client base.
Prior to joining State Street Global Advisors in 2007, Megan was a Vice President at Standish Mellon Asset Management, serving as a Relationship Manager as well as the Product Manager for their Stable Value Strategies.
Megan earned a BS from Santa Clara University and has been working in the investment management field since 1995. Megan holds the FINRA 3, 7 and 63 registrations.

Biographies
42DC‐3546
Vidur is a Vice President of State Street Global Advisors and a Senior Investment Strategist within the Defined Contribution team. In this role, he is responsible for representing SSGA’s DC investment strategies, supporting existing client relationships and expanding SSGA’s DC initiative. He also serves as a resource to plan sponsors working with them on a variety of plan design considerations.
Vidur joined SSGA’s Investment Strategy team from his most recent position as a Senior Investment Consultant at Towers Watson, where he worked with Institutional Retirement Plan Sponsors on various aspects of the management of their DB and DC Pension Plans including asset allocation, investment structure, manager selection and ongoing performance monitoring.
Vidur earned a BA in Economics and Mathematics from Ohio Wesleyan University. He earned the Chartered Financial Analyst designation and is an Associate of the Society of Actuaries.
Vidur Mehra, CFA Megan Yost
Megan is Vice President and Head of Participant Engagement within State Street Global Advisors' Defined Contribution Team. In this role, Megan works with employers across the globe to help improve the employee experience and engagement with retirement readiness. Her work with employers includes creating differentiated communications campaigns, advising on engagement techniques and facilitating the creation of financial wellness programs that are focused on saving, investing and overall financial wellbeing.
A P&I Eddy award‐winning communications specialist, Megan has published articles and is frequently quoted in the press and trade publications including The Boston Globe, CNBC, Plan Sponsor, Investment News, Human Resource Executive, The Irish Times, and The Sunday Business Post among others. She often speaks at conferences about financial wellness and increasing participation in workforce retirement plans and regularly shares her insights with policy makers as well.
Before joining the Global DC team, Megan worked as a Senior Client Service Manager responsible for managing institutional client relationships at SSGA. She also served as a Product Engineer for SSGA’s Global Equity Beta Solutions investment team where she was responsible for product positioning across multiple traditional and smart beta equity strategies.
Prior to her career in finance, Megan worked in educational publishing where she managed notable authors on content development across a suite of media, conducted market‐seeding activities, and oversaw product messaging. Megan holds a Master of Business Administration degree from Boston University and a Bachelor’s degree in English from Colby College.