Systems Review: Schoolwide Reading Support Cohort 5: Elementary Schools Winter, 2009.

1
Oregon Reading FirstInstitute on Beginning Reading I
Cohort B
Day 3:
The Foundations of DIBELS /
The 90 Minute BlockAugust 25, 2005

2
Oregon Reading FirstInstitutes on Beginning Reading
Content developed by: Roland H. Good, Ph.D. Beth Harn, Ph.D. College of Education College of Education University of Oregon University of Oregon
Edward J. Kame’enui, Ph.D. Deborah C. Simmons, Ph.D. Professor, College of Education Professor, College of Education University of Oregon University of Oregon
Michael D. Coyne, Ph.D. University of Connecticut
Prepared by: Patrick Kennedy-Paine Katie Tate University of Oregon University of Oregon

3
Cohort B, IBR 1, Day 3Content Development
Content developed by:
Rachell Katz
Jeanie Mercier Smith
Trish Travers
Additional support:
Deni BasarabaJulia KeplerKatie Tate
Janet Otterstedt
Dynamic Measurement Group

4
Copyright
• All materials are copy written and should notbe reproduced or used without expressedpermission of Dr. Carrie Thomas Beck,Oregon Reading First Center. Selectedslides were reproduced from other sourcesand original references cited.

5
Dynamic Indicators of Basic Early Literacy Skills(DIBELS™)
http://dibels.uoregon.edu

6
Objectives
1. Become familiar with the conceptual and research foundations of
DIBELS
2. Understand how the big ideas of early literacy map onto DIBELS
3. Understand how to interpret DIBELS class list results
4. Become familiar with how to use DIBELS in an Outcomes-Driven Model
5. Become familiar with methods of collecting DIBELS data and how to access
the DIBELS website

(c) 2005 Dynamic Measurement Group7
Components of an Effective School-wideLiteracy Model
Adapted from Logan City School District, 2002
Curriculumand
InstructionAssessment
LiteracyEnvironment
andResources
StudentSuccess
100% of Studentswill Read

(c) 2005 Dynamic Measurement Group8
Research on Early Literacy:What Do We Know?
Wo
rds
Per
Min
ute Reading Trajectory for Second-Grade Reader

(c) 2005 Dynamic Measurement Group9
Middle and Low Trajectoriesfor Second Graders
Wo
rds
Per
Min
ute

(c) 2005 Dynamic Measurement Group10
Nonreader at End of First Grade
My uncle, my dad,and my brother and I
built a giant sandcastle. Then we got
out buckets andshovels. We drew aline to show where it
would be.

(c) 2005 Dynamic Measurement Group11
Reader at End of First Grade
My uncle, my dad, and mybrother and I built a giantsand castle at the beach.First we picked a spot farfrom the waves. Then we
got out buckets andshovels. We drew a line toshow where it would be. Itwas going to be big! We
all brought buckets of wetsand to make the walls.

(c) 2005 Dynamic Measurement Group12
40 Words per Minute at the End of First Grade Puts Childrenon Trajectory to Reading
Wo
rds
Per
Min
ute

(c) 2005 Dynamic Measurement Group13
Third Grade Oral Reading Fluency andOregon Statewide Assessment Test scores
• Odds of “meets expectation” on OSAT given 3rd gradeTORF of 110 : 90 of 91 or 99%.
• Odds of “meets expectation” on OSAT given 3rd gradeTORF below 70: 4 of 23 or 17%.
160
170
180
190
200
210
220
230
240
250
0 20 40 60 80 100 120 140 160 180 200 220 240TORF May Grade 3
OS
AT
To
tal S
core
r = .7353% of Variance
Meets
Does not meetExpectations
Exceeds
Good, 2003
14
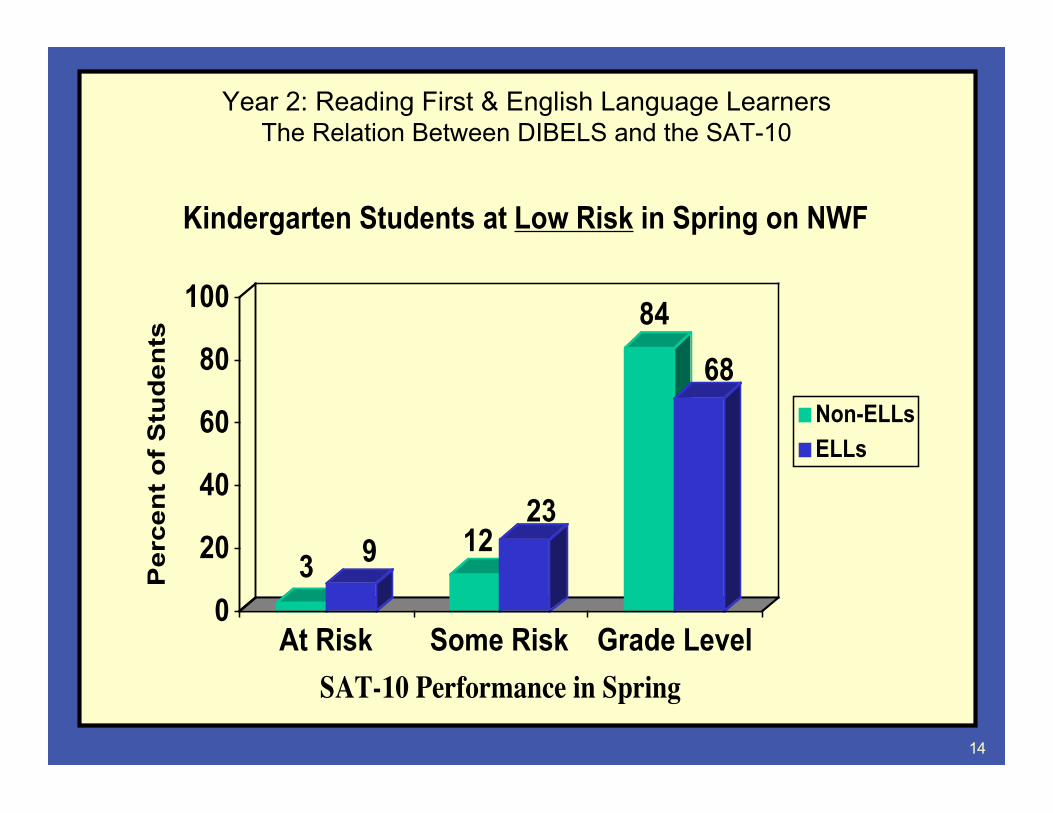
Year 2: Reading First & English Language LearnersThe Relation Between DIBELS and the SAT-10
3 9 1223
84
68
0
20
40
60
80
100
Pe
rce
nt
of
Stu
de
nts
At Risk Some Risk Grade Level
SAT-10 Performance in Spring
Kindergarten Students at Low Risk in Spring on NWF
Non-ELLs
ELLs

15
Year 2: Cohort A Reading First & English Language LearnersThe Relation Between DIBELS and the SAT-10
1 2 622
94
76
0
20
40
60
80
100
Pe
rce
nt
of
Stu
de
nts
At Risk Some Risk Grade Level
Sat-10 Performance in Spring
Grade 1 Students at Low Risk in Spring on ORF
Non-ELLs
ELLs

16
Year 2: Reading First & English Language LearnersThe Relation Between DIBELS and the SAT-10
5767
28 2515
8
0
20
40
60
80
100
Pe
rce
nt
of
Stu
de
nts
At Risk Some Risk Grade Level
SAT-10 Performance in Spring
Kindergarten Students at High Risk in Spring on NWF
Non-ELLs
ELLs

17
Year 2: Reading First & English Language LearnersThe Relation Between DIBELS and the SAT-10
7787
2212
2 10
20
40
60
80
100
Pe
rce
nt
of
Stu
de
nts
At Risk Some Risk Grade LevelSAT-10 Performance in Spring
Grade 1 Students at High Risk in Spring on ORF
Non-ELLs
ELLs

(c) 2005 Dynamic Measurement Group18
Summary:What Do We Know?
• Reading trajectories are established early.• Readers on a low trajectory tend to stay on that
trajectory.• Students on a low trajectory tend to fall further
and further behind.• The later children are identified as needing
support, the more difficult it is to catch up!

(c) 2005 Dynamic Measurement Group19
We CAN Change Trajectories
How?
• Identify students early.
• Focus instruction on Big Ideas of literacy.
• Focus assessment on indicators of importantoutcomes.

20
Oregon Reading First- Year 2:Cohort A Students At Risk in the Fall Who Got On
Track by the Spring
61
42 40
11 146
17
30
102030405060708090
100
Perc
ent O
n Tr
ack
K 1 2 3
Grade
PSFNWF(K)/ORFSAT-10

(c) 2005 Dynamic Measurement Group21
Identify Students Early
Reading trajectories cannot be identified by readingmeasures until the end of first grade.
Wo
rds
Per
Min
ute

(c) 2005 Dynamic Measurement Group22
Identify Students EarlyNeed for DIBELS™
Wo
rds
Per
Min
ute

(c) 2005 Dynamic Measurement Group23
Relevant Features of DIBELS™
• Measure Basic Early Literacy Skills: Big Ideas of earlyliteracy
• Efficient and economical
• Standardized
• Replicable
• Familiar/routine contexts
• Technically adequate
• Sensitive to growth and change over time and to effects ofintervention

(c) 2005 Dynamic Measurement Group24
What Are DIBELS™?
Dynamic
98.6
Indicators
ofBasic Early Literacy Skills

(c) 2005 Dynamic Measurement Group25
Height and Weight are Indicators of PhysicalDevelopment

(c) 2005 Dynamic Measurement Group26
How Can We Use DIBELS™ toChange Reading Outcomes?
• Begin early.• Focus instruction on the Big Ideas of
early literacy.• Focus assessment on outcomes for
students.

(c) 2005 Dynamic Measurement Group27
The Bottom Line
• Children enter school with widelydiscrepant language/literacy experiences.
– Literacy: 1,000 hours of exposure to print versus 0-10 (Adams, 1990)
– Language: 2,153 words versus 616 words heard per hour (Hart & Risley,1995)
– Confidence Building: 32 Affirmations/5 prohibitions per hour versus 5affirmations and 11 prohibitions per hour (Hart & Risley, 1995)
• Need to know where children are as they enter school

Tale of Two Schools
School A
• 52% low risk
• 33% some risk
• 14% at risk
School B
• 87% low risk
• 6% some risk
• 6% at risk
28

(c) 2005 Dynamic Measurement Group29
Tale of Two Classrooms
Classroom 119/24 children (79%) are on track
5/24 children (21%) have some risk
0 children (0%) are at risk
Classroom 28/23 children (35%) are on track
11/23 children (48%) have some risk
3/23 children (13%) are at risk
Kindergarten Class List Report
School:Date:
District: Hope County School DistrictMelody Mountain SchoolFall
Class: MrFrizzleAM
Student
Initial Sound FluencyGoal: 8 initial sounds
Status
Letter Naming FluencyGoal: 8 letter names
Status Instructional RecommendationsAmanda 8 N/A Low Risk 13 N/A Low risk Benchmark - At Grade LevelBo 9 N/A Low Risk 2 N/A Some risk Strategic - Additional InterventionCassius 11 N/A Low Risk 20 N/A Low risk Benchmark - At Grade LevelDario 1 2 N/A Low Risk 17 N/A Low risk Benchmark - At Grade LevelEstelle 1 5 N/A Low Risk 1 N/A At risk Strategic - Additional InterventionFilene 15 N/A Low Risk 11 N/A Low risk Benchmark - At Grade LevelGeorgie 1 7 N/A Low Risk 20 N/A Low risk Benchmark - At Grade LevelHall 20 N/A Low Risk 32 N/A Low risk Benchmark - At Grade LevelIyla 2 1 N/A Low Risk 22 N/A Low risk Benchmark - At Grade LevelJake 22 N/A Low Risk 23 N/A Low risk Benchmark - At Grade LevelKaylie 2 4 N/A Low Risk 36 N/A Low risk Benchmark - At Grade LevelLuke 2 4 N/A Low Risk 43 N/A Low risk Benchmark - At Grade LevelMcKenna 2 5 N/A Low Risk 4 N/A Some risk Strategic - Additional InterventionNeela 2 5 N/A Low Risk 18 N/A Low risk Benchmark - At Grade LevelOwen 2 5 N/A Low Risk 20 N/A Low risk Benchmark - At Grade LevelParsons 2 5 N/A Low Risk 38 N/A Low risk Benchmark - At Grade LevelQuinn 26 N/A Low Risk 30 N/A Low risk Benchmark - At Grade LevelRowen 2 7 N/A Low Risk 33 N/A Low risk Benchmark - At Grade LevelTyson 2 9 N/A Low Risk 23 N/A Low risk Benchmark - At Grade LevelUsher 2 9 N/A Low Risk 32 N/A Low risk Benchmark - At Grade LevelVince 3 1 N/A Low Risk 18 N/A Low risk Benchmark - At Grade LevelWindy 3 3 N/A Low Risk 6 N/A Some risk Strategic - Additional InterventionYancy 3 8 N/A Low Risk 15 N/A Low risk Benchmark - At Grade LevelZane 4 2 N/A Low Risk 2 N/A Some risk Strategic - Additional Intervention
23 Mean 20 Mean
Kindergarten Class List Report, 08/24/2004, 15

(c) 2005 Dynamic Measurement Group30
• As a teacher, administrator, specialist,will you do anything differently with regard to:
– Curriculum?
– Instruction?
– Professional development?
– Service delivery?
– Resource allocation?
Important to Know Where ChildrenStart…

31
DIBELS and the
Big Ideas of Early Literacy
(c) 2005 Dynamic Measurement Group32
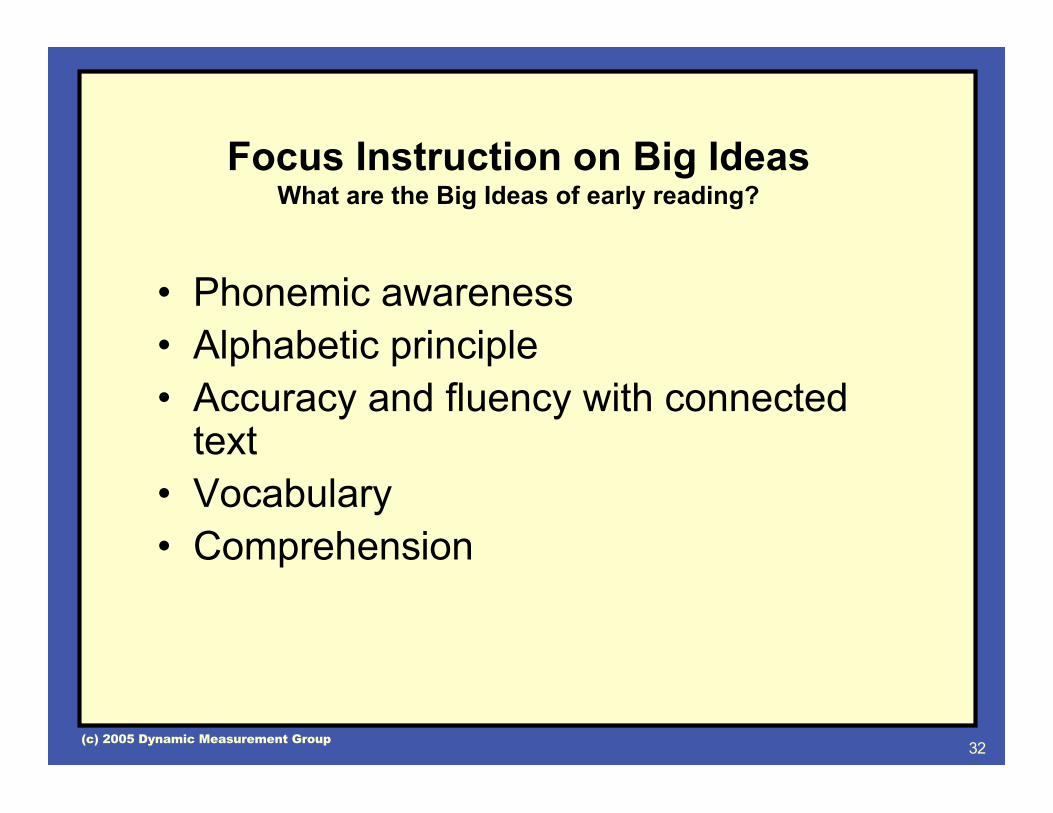
Focus Instruction on Big IdeasWhat are the Big Ideas of early reading?
• Phonemic awareness• Alphabetic principle• Accuracy and fluency with connected
text• Vocabulary• Comprehension

(c) 2005 Dynamic Measurement Group33
What Makes a Big Ideaa Big Idea?
• A Big Idea is:
– Predictive of reading acquisition and laterreading achievement
– Something we can do something about, i.e.,something we can teach
– Something that improves outcomes for childrenif/when we teach it

(c) 2005 Dynamic Measurement Group34
Why focus on BIG IDEAS?
• Intensive instruction means teachless more thoroughly– If you don’t know what is important,
everything is.– If everything is important, you will try to
do everything.– If you try to do everything you will be
asked to do more.– If you do everything you won’t have time
to figure out what is important.

(c) 2005 Dynamic Measurement Group35
– With a partner, match the example onthe left with the big idea on the right.
Breakout Activity

(c) 2005 Dynamic Measurement Group36
Which Big Idea?
Child accurately and fluency reads apassage from a basal reader.
Child uses a word in a sentence.
Child looks at the letter “b” and says, /b/.
Child says that the first sound in the word“ball” is /b/.
Child answers questions about a passagehe/she has read.
Child looks at the word, “hat” and says,/h/…/a/…/t/…/hat/.
Child completes a phrase with a rhymingword, e.g., the kitten has lost it’s mitten.
Phonemic awareness
Alphabetic principle
Accuracy and fluencyreading connected text
Vocabulary
Comprehension

(c) 2005 Dynamic Measurement Group37
Which Big Idea?
Child accurately and fluency reads apassage from a basal reader.
Child uses a word in a sentence.
Child looks at the letter “b” and says, /b/.
Child says that the first sound in the word“ball” is /b/.
Child answers questions about a passagehe/she has read.
Child looks at the word, “hat” and says,/h/…/a/…/t/…/hat/.
Child completes a phrase with a rhymingword, e.g., the kitten has lost it’s mitten.
Phonemic awareness
Alphabetic principle
Accuracy and fluencyreading connected text
Vocabulary
Comprehension

Steppingstones to Literacy
PhonemicAwareness
Vocabulary andComprehension
AlphabeticPrinciple
Vocabulary andComprehension
Oral ReadingFluency
Vocabulary andComprehension
NonReading
Reading to Learn

(c) 2005 Dynamic Measurement Group39
ReferencesAdams, M.J. (1990). Beginning to read: Thinking and learning about print.
McCardle, P. (2004). The voice of evidence in reading research. Baltimore, MD:Brookes.
National Reading Panel (2000). Teaching children to read: An evidence-basedassessment of the scientific research literature on reading and its implicationsfor reading instruction. Washington, DC: National Institute of Child Health andHuman Development.
National Research Council (1998). Preventing reading difficulties in young children,(Committee on the Prevention of Reading Difficulties in Young Children; C.E.Snow, M.S. Burns, and P. Griffin, Eds.) Washington, DC: National AcademyPress.
Shaywitz, S. (2003). Overcoming dyslexia: A new and complete science-basedprogram for reading problems at any level. New York, NY: Alfred A. Knopf.
(c) 2005 Dynamic Measurement Group40
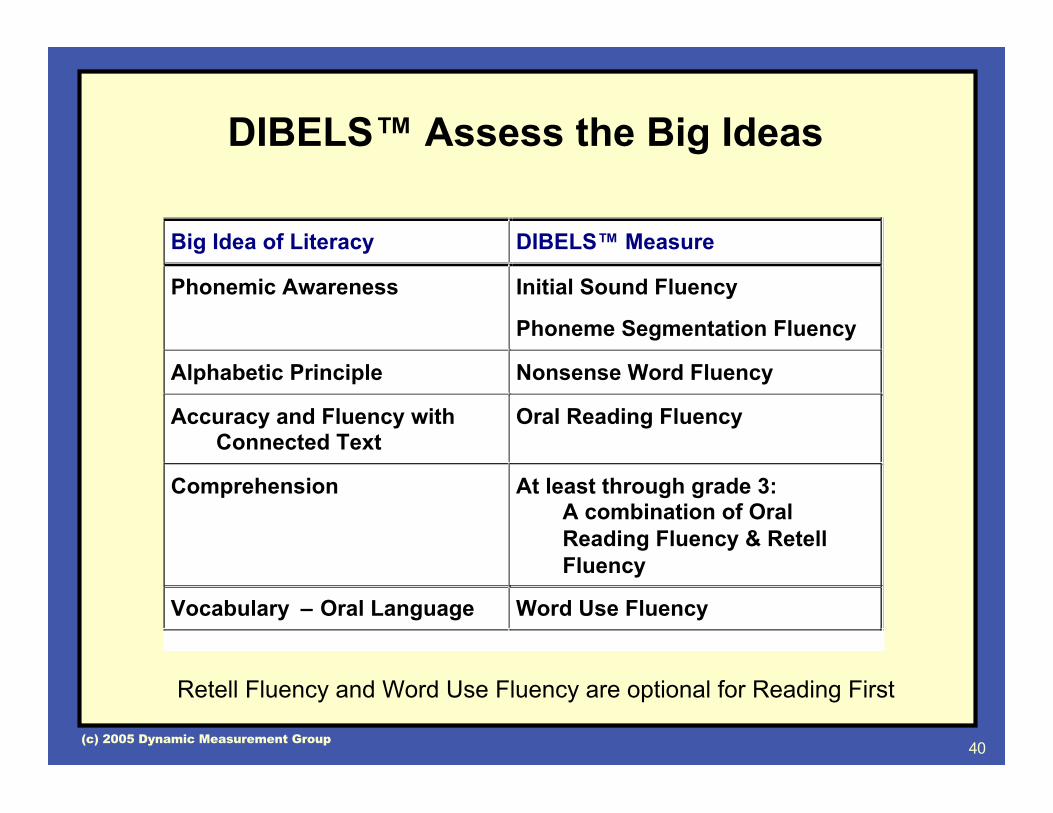
DIBELS™ Assess the Big Ideas
Big Idea of Literacy DIBELS™ Measure
Phonemic Awareness Initial Sound Fluency
Phoneme Segmentation Fluency
Alphabetic Principle Nonsense Word Fluency
Accuracy and Fluency with Connected Text
Oral Reading Fluency
Comprehension At least through grade 3: A combination of Oral Reading Fluency & Retell Fluency
Vocabulary – Oral Language Word Use Fluency
Retell Fluency and Word Use Fluency are optional for Reading First

(c) 2005 Dynamic Measurement Group41
Letter Naming Fluency is an AddedIndicator of Risk*
Letter Naming FluencyIndicator of Risk
DIBELS™ Measure
Note: Letter Naming is not a Big Idea of early literacy; itis not the most powerful instructional target thus there areno benchmark goals nor progress monitoring materials forLNF.
42
Interpreting DIBELS Results

(c) 2005 Dynamic Measurement Group43
OutcomesDIBELS Benchmark Goals
• Initial Sound Fluency:
• Phoneme Segmentation Fluency:
• Nonsense Word Fluency:
• DIBELS™ Oral Reading Fluency:
(goals are minimum scores for lowest reader)
–35 sounds per minute by Spring Kindergarten
–25 sounds per minute by Winter Kindergarten
–40 words correct per minute by Spring First Grade
–50 sounds per minute by Winter First Grade withat least 15 words recoded
–90 words correct per minute by Spring Second Grade
–110 words correct per minute by Spring Third Grade

44

45

46

(c) Dynamic Measurement Group47
Model of Big Ideas, Indicators, and Timeline
Adapted from Good, R. H., Simmons, D. C., & Kame'enui, E. J. (2001). The importance anddecision-making utility of a continuum of fluency-based indicators of foundational readingskills for third-grade high-stakes outcomes. Scientific Studies of Reading, 5, 257-288.

(c) Dynamic Measurement Group48
Using DIBELS™:Three Levels of Assessment
• Benchmarking• Strategic Monitoring• Continuous or Intensive Care Monitoring

(c) Dynamic Measurement Group49
Three Status Categories:Used at or after benchmark
goal time
• Established -- Child has achieved the benchmark goal• Emerging -- Child has not achieved the benchmark goal; has
emerging skills but may need to increase consistency, accuracyand/or fluency to achieve benchmark goal
• Deficit -- Child has low skills and is at risk for not achievingbenchmark goal

(c) Dynamic Measurement Group50
Three Risk CategoriesUsed prior to benchmark time
• Low risk -- On track to achieve benchmark goal• Some risk -- Low emerging skills/ 50-50 chance of achieving
benchmark goal• At risk -- Very low skills; at risk for difficulty in achieving
benchmark goal

(c) Dynamic Measurement Group51
Three levels of Instruction
– Benchmark Instruction - At Grade Level: Core Curriculumfocused on big ideas
– Strategic Instructional Support - Additional Intervention• Extra practice• Adaptations of core curriculum
– Intensive Instructional Support - Substantial Intervention• Focused, explicit instruction with supplementary
curriculum• Individual instruction

(c) Dynamic Measurement Group52
What do we Need to Know fromBenchmark Data?
• In general, what skills do the children in myclass/school/district have?
• Are there children who may need additional support?• How many children may need additional support?• Which children may need additional support to
achieve outcomes?• What supports do I need to address the needs of my
students?

(c) Dynamic Measurement Group53
Three Levels ofInstructional Support
Instructional Recommendations Are Based onPerformance Across All Measures
• Benchmark: Established skill performance across all administeredmeasures
• Strategic: One or more skill areas are not within the expectedperformance range
• Intensive: One or many skill areas are within the significantly at-riskrange for later reading difficulty

54
Levels of Support:Reality?
Intensive
Strategic
Benchmark5%
15%
80%

55
Levels of Support:Goal!
Intensive
Strategic
Benchmark
5%
15%
80%

(c) 2005 Dynamic Measurement Group56
How Do We Use DIBELS™?Types of Assessment
• Benchmark assessment
– All students 3-4 times per year
• Progress monitoring
– Students who need support more frequently
• Progress monitoring for intensive and strategicstudents should take place once every otherweek.
• This will provide the necessary information tomake instructional decisions.

57
Using DIBELS in an
Outcomes-Driven Model

(c) 2005 Dynamic Measurement Group58
How do we Make Educational Decisionswith DIBELS™?
An Outcomes-Driven model: Decision making stepsdesigned to answer specific questions for specificpurposes
! Identify long term outcomes and benchmarks to achieve1. Identify Need for Support2. Validate Need for Support3. Plan Support Strategies4. Implement Support strategies5. Evaluate Support6. Outcome Evaluation

(c) 2005 Dynamic Measurement Group59
Outcomes-Driven Model
Identify Needfor Support
Validate Needfor Support
Plan Support
EvaluateEffectivenessof Support
ImplementSupport
ReviewOutcomes
Progress Monitoring
Benchmark Assessment
Benchmark Assessment

(c) 2005 Dynamic Measurement Group60
Step 1. Identify Need for Support
What do you need to know?• Are there children who may need additional
instructional support?• How many children may need additional
instructional support?• Which children may need additional instructional
support?
What to do:• Evaluate benchmark assessment data for district,
school, classroom, and individual children.

(c) 2005 Dynamic Measurement Group61
Are There Children Who May Need AdditionalInstructional Support?
• Winter of Kindergarten• Approximately 1/5 of students are at risk for poor reading outcomes.
Phoneme Segmentation Fluency
0
2
4
6
8
10
12
14
16
0 - 4
5 - 9
10 -
14
15 -
19
20 -
24
25 -
29
30 -
34
35 -
39
40 -
44
45 -
49
50 -
54
55 -
59
60 -
64
65 -
69
70 -
7475
+
Correct Phonemes
Fre
qu
ency
25%
54%
21%
Low risk
Some risk
At risk

(c) 2005 Dynamic Measurement Group62
Class List Report
• For each child and each Measure administered atthat benchmark:
– Score
– Percentile: (based on school/district norms)
– Skill status: Established, Emerging, Deficit orLow Risk, Some Risk, At-Risk
– Instructional Recommendation: Benchmark,Strategic, Intensive

(c) 2005 Dynamic Measurement Group63
Guidelines for Class List Reports
• Instructional recommendations are guidelines only.
• Important to validate need for support if there isany question about a child’s score.
• Focus resources on lowest performing group ofchildren in class.

(c) 2005 Dynamic Measurement Group64
Interpreting Class List ReportsTips and Notes
• ISF and PSF both measure the same Big Idea:phonemic awareness. PSF is more reliable measure;use it in winter of K as primary measure of phonemicawareness.
– If child is doing well on PSF can assume skills onISF
– Use ISF if PSF is too difficult and child achievesscore of 0.

(c) 2005 Dynamic Measurement Group65
Interpreting Class List ReportsTips and Notes
• PSF and NWF measure different Big Ideas, both ofwhich are necessary (but not sufficient in and ofthemselves) for acquisition of reading. We teach andmeasure both.– Skills in PA facilitate development of AP; however
children can begin to acquire AP and not bestrong in PA.
• If a child seems to be doing well in AP, do notassume PA skills if a child is at risk.
• Continue to provide support on PA and monitorprogress. These children may have difficultywith fluent phonological recoding and with oralreading fluency.

(c) 2005 Dynamic Measurement Group66
Interpreting Class List ReportsTips and Notes
• PSF has a “threshold effect”, i.e., children reach benchmarkgoal and then scores slightly decrease on that measure asthey focus on acquiring new skills (alphabetic principle,fluency in reading connected text)

(c) 2005 Dynamic Measurement Group67
Interpreting Class List ReportsTips and Notes
• Letter Naming Fluency is an added indicator ofrisk. Use it in conjunction with scores on otherDIBELS measures.– Example: In a group of children with low
scores on ISF at the beginning of K, those withlow scores also on LNF are at higher risk
• LNF is not our most powerful instructional target

(c) 2005 Dynamic Measurement Group68
Interpreting Class List ReportsTips and Notes
• Have list of scores for Benchmark Goals andIndicators of Risk available to refer to as you reviewthe Class List Reports. Pay special attention tochildren whose scores are near the “cut-offs”
– E.g., in the middle of K,a child with a score of 6 onPSF is “at risk”, a score of 7 is “some risk”.

(c) 2005 Dynamic Measurement Group69
Interpreting Class List ReportsTips and Notes
• When interpreting NWF scores it is important to takenote of the level of blending by the student.
• Note if the student is reading the words sound-by-sound or if the student is recoding the words. Aminimum score of 15 words recoded has been addedto the benchmark score of 50 sounds per minute bythe winter of first grade.

Kame'enui, Simmons, Coyne & Harn 200370
A class list provides a report of children’sperformance on all measures administered at a givenbenchmark period in relation to established goals.
DIBELS: Class List
BenchmarkLow risk9058Low risk7044Established3941Jose
BenchmarkLow risk4927Low risk7546Established3640Kim
StrategicSome risk2619Somerisk3831Established9567Ken
StrategicSome risk2014At risk25Established5847Susan
StrategicSome risk2013At risk814Emerging919Jill
IntensiveAt risk55At risk13Emerging1022Sam
InstructionalRecommendationStatus%ileScoreStatus%ileScoreStatus%ileScoreStudent
Nonsense Word FluencyLetter Naming FluencyPhoneme Segmentation Fluency
Fall of First Grade

Kame'enui, Simmons, Coyne & Harn 200371
Each student inthe class
DIBELS: Class List Fall of First Grade
BenchmarkLow risk9058Low risk7044Established3941Jose
BenchmarkLow risk4927Low risk7546Established3640Kim
StrategicSome risk2619Somerisk3831Established9567Ken
StrategicSome risk2014At risk25Established5847Susan
StrategicSome risk2013At risk814Emerging919Jill
IntensiveAt risk55At risk13Emerging1022Sam
InstructionalRecommendationStatus%ileScoreStatus%ileScoreStatus%ileScoreStudent
Nonsense Word FluencyLetter Naming FluencyPhoneme Segmentation Fluency

Kame'enui, Simmons, Coyne, & Harn 200372
DIBELS: Class List Fall of First Grade
BenchmarkLow risk9058Low risk7044Established3941Jose
BenchmarkLow risk4927Low risk7546Established3640Kim
StrategicSome risk2619Somerisk3831Established9567Ken
StrategicSome risk2014At risk25Established5847Susan
StrategicSome risk2013At risk814Emerging919Jill
IntensiveAt risk55At risk13Emerging1022Sam
InstructionalRecommendationStatus%ileScoreStatus%ileScoreStatus%ileScoreStudent
Nonsense Word FluencyLetter Naming FluencyPhoneme Segmentation Fluency
Measures administered atbenchmark period (Fall of Grade 1)

Kame'enui, Simmons, Coyne, & Harn 200373
Raw score for eachmeasure
DIBELS: Class List Fall of First Grade
BenchmarkLow risk9058Low risk7044Established3941Jose
BenchmarkLow risk4927Low risk7546Established3640Kim
StrategicSome risk2619Somerisk3831Established9567Ken
StrategicSome risk2014At risk25Established5847Susan
StrategicSome risk2013At risk814Emerging919Jill
IntensiveAt risk55At risk13Emerging1022Sam
InstructionalRecommendationStatus%ileScoreStatus%ileScoreStatus%ileScoreStudent
Nonsense Word FluencyLetter Naming FluencyPhoneme Segmentation Fluency

Kame'enui, Simmons, Coyne, & Harn 200374
Percentile comparedto school/district
DIBELS: Class List Fall of First Grade
BenchmarkLow risk9058Low risk7044Established3941Jose
BenchmarkLow risk4927Low risk7546Established3640Kim
StrategicSome risk2619Somerisk3831Established9567Ken
StrategicSome risk2014At risk25Established5847Susan
StrategicSome risk2013At risk814Emerging919Jill
IntensiveAt risk55At risk13Emerging1022Sam
InstructionalRecommendationStatus%ileScoreStatus%ileScoreStatus%ileScoreStudent
Nonsense Word FluencyLetter Naming FluencyPhoneme Segmentation Fluency

Kame'enui, Simmons, Coyne, & Harn 200375
Status on each skill(established, emerging, deficit)
DIBELS: Class List Fall of First Grade
BenchmarkLow risk9058Low risk7044Established3941Jose
BenchmarkLow risk4927Low risk7546Established3640Kim
StrategicSome risk2619Somerisk3831Established9567Ken
StrategicSome risk2014At risk25Established5847Susan
StrategicSome risk2013At risk814Emerging919Jill
IntensiveAt risk55At risk13Emerging1022Sam
InstructionalRecommendationStatus%ileScoreStatus%ileScoreStatus%ileScoreStudent
Nonsense Word FluencyLetter Naming FluencyPhoneme Segmentation Fluency

Kame'enui, Simmons, Coyne, & Harn 200376
Overall Instructional Recommendation Across Measures(Benchmark, Strategic, or Intensive Support)
DIBELS: Class List Fall of First Grade
BenchmarkLow risk9058Low risk7044Established3941Jose
BenchmarkLow risk4927Low risk7546Established3640Kim
StrategicSome risk2619Somerisk3831Established9567Ken
StrategicSome risk2014At risk25Established5847Susan
StrategicSome risk2013At risk814Emerging919Jill
IntensiveAt risk55At risk13Emerging1022Sam
InstructionalRecommendationStatus%ileScoreStatus%ileScoreStatus%ileScoreStudent
Nonsense Word FluencyLetter Naming FluencyPhoneme Segmentation Fluency

Kame'enui, Simmons, Coyne & Harn 200377
DIBELS: Class List
Instructional Recommendations Are Based onPerformance Across All Measures
• Benchmark: Established skill performance across alladministered measures
• Strategic: One or more skill areas are not within theexpected performance range
• Intensive: One or many skill areas are within thesignificantly at-risk range for later reading difficulty

© 2003 Kameenui, Simmons, Coyne, & Harn78
What are the established goals for these measures?
NWF – 50 by the middle of Grade 1
PSF – 35 by the end of Kindergarten
Breakout Activity: Example
BenchmarkLow risk9058Low risk7044Established3941Jose
BenchmarkLow risk4927Low risk7546Established3640Kim
StrategicSome risk2619Somerisk3831Established9567Ken
StrategicSome risk2014At risk25Established5847Susan
StrategicSome risk2013At risk814Emerging919Jill
IntensiveAt risk55At risk13Emerging1022Sam
InstructionalRecommendationStatus%ileScoreStatus%ileScoreStatus%ileScoreStudent
Nonsense Word FluencyLetter Naming FluencyPhoneme Segmentation Fluency

© 2003 Kameenui, Simmons, Coyne, & Harn79
What type of instruction does this student need tomeet the winter goal of 50 on NWF?
Continue current instructional approach
Breakout Activity: Example
BenchmarkLow risk9058Low risk7044Established3941Jose
BenchmarkLow risk4927Low risk7546Established3640Kim
StrategicSome risk2619Somerisk3831Established9567Ken
StrategicSome risk2014At risk25Established5847Susan
StrategicSome risk2013At risk814Emerging919Jill
IntensiveAt risk55At risk13Emerging1022Sam
InstructionalRecommendationStatus%ileScoreStatus%ileScoreStatus%ileScoreStudent
Nonsense Word FluencyLetter Naming FluencyPhoneme Segmentation Fluency

© 2003 Kameenui, Simmons, Coyne, & Harn80
What type of instruction does this student need tomeet the winter goal of 50 on NWF?
Intensify current instruction significantly and monitor development
Breakout Activity: Example
BenchmarkLow risk9058Low risk7044Established3941Jose
BenchmarkLow risk4927Low risk7546Established3640Kim
StrategicSome risk2619Somerisk3831Established9567Ken
StrategicSome risk2014At risk25Established5847Susan
StrategicSome risk2013At risk814Emerging919Jill
IntensiveAt risk55At risk13Emerging1022Sam
InstructionalRecommendationStatus%ileScoreStatus%ileScoreStatus%ileScoreStudent
Nonsense Word FluencyLetter Naming FluencyPhoneme Segmentation Fluency

© 2003 Kameenui, Simmons, Coyne, & Harn81
What type of instruction does this student need tomeet the winter goal of 50 on NWF?
Intensify current instruction strategically and monitor progress
Breakout Activity: Example
BenchmarkLow risk9058Low risk7044Established3941Jose
BenchmarkLow risk4927Low risk7546Established3640Kim
StrategicSome risk2619Somerisk3831Established9567Ken
StrategicSome risk2014At risk25Established5847Susan
StrategicSome risk2013At risk814Emerging919Jill
IntensiveAt risk55At risk13Emerging1022Sam
InstructionalRecommendationStatus%ileScoreStatus%ileScoreStatus%ileScoreStudent
Nonsense Word FluencyLetter Naming FluencyPhoneme Segmentation Fluency

© 2003 Kameenui, Simmons, Coyne, & Harn82
ÿ In school teams, complete the breakoutactivity on reading and interpretingDIBELS class reports
Breakout Activity

In January of Kindergarten: Sandra, Max, Brandon, and Danielle have a deficit on Initial Sound Fluency. They mayneed additional instructional support to attain kindergarten benchmarks.Joseph and Tiffany are on track with established skills on ISF.Halley and Latisha have emerging skills and should be monitored strategically
T.,Sandra 9 4 Deficit 1 7 At risk 8 13 At risk Intensive support indicated.R., Max 7 2 Deficit 1 7 At risk 10 18 At risk Intensive support indicated.W., Halley 14 12 Emerging 2 9 Some risk 29 46 Low risk Strategic support.M., Latisha 19 22 Emerging 3 11 Some risk 35 59 Low risk Strategic support.A., Brandon 9 4 Deficit 3 11 Some risk 8 13 Some risk Intensive support indicated.R., Tiffany 42 86 Established 13 31 Low risk 48 85 Low risk Benchmark.M., Danielle 5 1 Deficit 14 33 Low risk 8 13 Some risk Strategic support.M., Joseph 38 75 Established 15 35 Low risk 37 66 Low risk Benchmark.
Identify Need:Which Children May Need Support?
© 2005 Dynamic Measurement Group 83

© 2005 Dynamic Measurement Group84
Focus on Four Children
9 4 DeficitA., Brandon
9 4 DeficitT., Sandra
7 2 DeficitR., Max
5 1 DeficitM., Danielle

© 2005 Dynamic Measurement Group85
Step 2. Validate Need for Support
This step would be used for children whose scores aresurprising or unexpected.**********
• Are we reasonably confident the student needs instructionalsupport?– Rule out easy reasons for poor performance:– Bad day, confused on directions or task, ill, shy, or
similar.
What to do:• Use additional information, e.g., other assessment data,
knowledge about child.• Repeat assessments.

© 2005 Dynamic Measurement Group86
Validate Need for Support
Verify Need for Instructional Support by Retesting with Different FormsUntil We Are Reasonably Confident.
10
20
30
40
Dec.Scores
Feb.Scores
Jan.Scores
MarchScores
AprilScores
MayScores
JuneScores
60
50
Cor
rect
Pho
nem
es
January cutoffBrandon

© 2005 Dynamic Measurement Group87
Validate Need for SupportVerify Need for Instructional Support by Retesting with Different Forms Until We Are
Reasonably Confident.
10
20
30
40
Dec.Scores
Feb.Scores
Jan.Scores
MarchScores
AprilScores
MayScores
JuneScores
60
50
Cor
rect
Pho
nem
es
January cutoffSandra

© 2005 Dynamic Measurement Group88
Step 3. Plan Instructional Support
What do you need to know?• What are the goals of instruction?• What specific skills should we teach?• What instructional curriculum/program to use?• What specific instructional strategies to use?• How much instructional support may be
needed?
What to do: What are Goals?• Determine goals.• Draw aimline.

© 2005 Dynamic Measurement Group89
LNF
1109040ORF
50NWF
3535PSF
25ISF
SpWFSpWFSpWFSpWF
Third GradeSecond GradeFirst GradeKindergarten
= Urgent Instructional Focus = Benchmark Goal = Past Benchmark Goal
= Instructional Focus = Added Indicator of Risk
Which Measures When?

© 2005 Dynamic Measurement Group90
Plan Support:Aimline for Brandon
The aimline connects where you are to where you want to get to, and showsthe course to follow to get there.
10
20
30
40
Dec.Scores
Feb.Scores
Jan.Scores
MarchScores
AprilScores
MayScores
JuneScores
60
50
Aimline

© 2005 Dynamic Measurement Group91
Plan Support:Aimline for Sandra
10
20
30
40
Dec.Scores
Feb.Scores
Jan.Scores
MarchScores
AprilScores
MayScores
JuneScores
60
50
Cor
rect
Pho
nem
es
Aimline

© 2005 Dynamic Measurement Group92
Plan Support:
• What specific skills, program/curriculum,strategies?– Three-tiered model of support in place:
Core, Supplemental, Intervention– Use additional assessment if needed (e.g.,
diagnostic assessment, curriculum/programplacement tests, knowledge of child)
– Do whatever it takes to get the child back ontrack!

© 2005 Dynamic Measurement Group93
Step 4. Evaluate and Modify Support
Key decision:• Is the support effective in improving the child’s early literacy
skills?
• Is the child progressing at a sufficient rate to achieve the nextbenchmark goal?
What to do:• Monitor child’s progress and use decision rules to evaluate data .
– Three consecutive data points below the aimlineindicates a need to modify instructional support.

94
Progress Monitoring
ÿ Performance monitored frequently for all students who areat risk of reading difficulty
ÿ Data used to make instructional decisions
ÿ Example of a progress monitoring schedule
Students at low risk: Monitor progress three times a year
Students at some risk: Monitor progress every other week
Students at high risk: Monitor progress every other week
Early identification and frequent monitoring ofstudents experiencing reading difficulties

© 2005 Dynamic Measurement Group95
Evaluate Support:Modify Instruction for Sandra?
10
20
30
40
Dec.Scores
Feb.Scores
Jan.Scores
MarchScores
AprilScores
MayScores
JuneScores
60
50
Cor
rect
Pho
nem
es
Aimline

© 2005 Dynamic Measurement Group96
Evaluate Support:Modify Instruction for Brandon?
Brandon: Whoops! Time to make a change!
10
20
30
40
Dec.Scores
Feb.Scores
Jan.Scores
MarchScores
AprilScores
MayScores
JuneScores
60
50
Cor
rect
Pho
nem
es
Aimline

© 2005 Dynamic Measurement Group97
Evaluating SupportModify Instruction for Brandon Now?
10
20
30
40
Dec.Scores
Feb.Scores
Jan.Scores
MarchScores
AprilScores
MayScores
JuneScores
60
50
Cor
rect
Pho
nem
es
Aimline

© 2005 Dynamic Measurement Group98
Outcomes Driven Model
Identify Needfor Support
Validate Needfor Support
Plan Support
EvaluateEffectivenessof Support
ImplementSupport
ReviewOutcomes
Progress Monitoring
Benchmark Assessment
Benchmark Assessment

© 2005 Dynamic Measurement Group99
Step 5. Review OutcomesSystems Level
• What is a system?
– Classroom, class, school, district, educationalagency, region, state
• Key questions
– How is the curriculum/program working?
– Who is the curriculum/program working for?
– Are we doing better this year than last year?

© 2005 Dynamic Measurement Group100
DIBELS™ are the GPSfor Educators
10
20
30
40
Dec.Scores
Feb.Scores
Jan.Scores
MarchScores
AprilScores
MayScores
JuneScores
60
50
Cor
rect
Pho
nem
es
Aimline

101
Collecting Schoolwide Data and
Accessing the DIBELS Website

© 2003 Kameenui, Simmons, Coyne, & Harn102
Developing a Plan To Collect SchoolwideData
Areas Needing to be Considered When Developing A Plan:
1. Who will collect the data?
2. How long will it take?
3. How do we want to collect the data?
4. What materials does the school need?
5. How do I use the DIBELS Website?
6. How will the results be shared with the school?
More details are available in the document entitled“Approaches and Considerations of Collecting Schoolwide Early Literacy and
Reading Performance Data” in your supplemental materials

© 2003 Good, Harn, Kame'enui, Simmons & Coyne103
Who Will Collect the Data?
• At the school-level, determine who will assist incollecting the data
– Each school is unique in terms of the resourcesavailable for this purpose, but consider the following:
• Teachers, Principals, educational assistants, Title 1 staff,
Special Education staff, parent volunteers, practicum
students, PE/Music Specialist Teachers
– The role of teachers in data collection:
• If they collect all the data, less time spent in teaching
• If they collect no data, the results have little meaning

© 2003 Kameenui, Simmons, Coyne, & Harn104
How Do We Want to Collect Data?
• Common Approaches to Data Collection:
– Team Approach
– Class Approach
– Combination of the Class and Team
• Determining who will collect the data will impact
the approach to the collection

© 2003 Kameenui, Simmons, Coyne, & Harn105
Team Approach
ÿWho? A core group of people will collect all the data
– One or multiple day (e.g., afternoons)
ÿWhere Does it Take Place?
– Team goes to the classroom
– Classrooms go to the team (e.g., cafeteria, library)
ÿPros: Efficient way to collect and distribute results,limited instructional disruption
ÿCons: Need a team of people, place, materials,limited teacher involvement, scheduling ofclassrooms

© 2003 Kameenui, Simmons, Coyne, & Harn106
Class Approach
ÿWho? Teachers collect the data
ÿWhere Does it Take Place?
– The classroom
ÿPros: Teachers receive immediate feedback onstudent performance
ÿCons: Data collection will occur over multiple days,time taken away from instruction, organization ofmaterials

© 2003 Kameenui, Simmons, Coyne, & Harn107
Combination of Team & ClassApproaches
ÿWho? Both teachers and a team
ÿWhere Does it Take Place?
– Teachers collect the data
– Team goes to the classroom
ÿWhat Might it Look Like?
– Kindergarten and First grade teachers collect theirown data and a team collects 2nd-3rd grade
ÿPros: Increases teacher participation, data can becollected in a few days, limited instructional disruption
ÿCons: Need a team of people, place, materials,scheduling

© 2003 Kameenui, Simmons, Coyne, & Harn108
How Long Will It Take?Kindergarten
18-326-8
12-204-5
6-82
3-41
9 min.End
ISF, LNF, PSF, & NWF
24-406-8
16-254-5
8-102
4-51
6-7 min.Middle
ISF, LNF, PSF
36-486-8
24-404-5
18-243
12-162
6-81
4 min.BeginningISF & LNF
PupilsAssessed per
30 Minute Period
Number of DataCollectors
ApproximateTime per Pupil
Time of Year /Measure(s)

© 2003 Kameenui, Simmons, Coyne, & Harn109
How Long Will It Take?First Grade
24-406-8
16-254-5
12-153
8-102
4-51
7 min.End of YearNWF & ORF
18-326-8
12-204-5
6-82
3-41
8-9 min.Middle
PSF, NWF, &ORF
24-406-8
16-254-5
8-102
4-51
6-7 min.Beginning
LNF, PSF, & NWF
PupilsAssessed per
30 Minute Period
Number of DataCollectors
Time per PupilTime of Year /
Measure(s)

© 2003 Kameenui, Simmons, Coyne, & Harn110
How Long Will it Take?Second & Third Grade
36-566-8
24-354-5
18-213
12-142
6-71
5 min.ORF
Pupils Assessedper 30 Minute
Period
Number ofCollectorsTime per PupilMeasure

© 2003 Kameenui, Simmons, Coyne, & Harn111
What Materials Does the School Need?
• DIBELS Materials– Benchmark booklets
• Color coding• Labeling
– Student stimulus materials• Binding, laminating, etc.
• Other Materials– Stopwatches– Pencils, clipboards– Class rosters
See document entitled “Approaches and Considerations ofCollecting Schoolwide Early Literacy and Reading
Performance Data” at website:http://dibels.uoregon.edu/logistics/data_collection.pdf

© 2003 Kameenui, Simmons, Coyne, & Harn112
How Do I Use the DIBELS Website?
Introduction
Data System
MeasuresDownloadBenchmarksGrade Level
Logistics
Sponsors
TrainersFAQContact
Information
http://dibels.uoregon.edu

© 2003 Kameenui, Simmons, Coyne, & Harn113
Generating Reports• Two main types of
reports generated fromDIBELS Website:– PDF Reports:
Downloadablereports designed forprinting. The schooland district PDFreports combine themost commonreports into a singlefile.
– Web Reports:Individual reportsdesigned for quickonline viewing.Select the specificreport you wouldlike.
Enter/Edit Data
View/CreateReports
InterpretReports
AdministrativeMenu
MigrateStudents
System Status
FAQ
ManualContact
Information

© 2003 Kameenui, Simmons, Coyne, & Harn114
Web Resources
ÿ Materials
– Administration and scoring manual
– All grade-level benchmark materials
– Progress monitoring materials for each measure (PSF, NWF,ORF, etc.)
ÿ Website
– Tutorial for training on each measure with video examples
– Manual for using the DIBELS Web Data Entry website
– Sample schoolwide reports and technical reports on themeasures
ÿ Logistics
– Tips and suggestions for collecting schoolwide data (seewebsite)

115
Objectives
1. Become familiar with the conceptual and research foundations of
DIBELS
2. Understand how the big ideas of early literacy map onto DIBELS
3. Understand how to interpret DIBELS class list results
4. Become familiar with how to use DIBELS in an Outcomes Driven
Model
5. Become familiar with methods of collecting DIBELS data and how to
access the DIBELS website