Public Finance Seminar Spring 2015, Professor Yinger Property Tax Capitalization.
Upload
statesman-journalCategory
view
223download
0
8/12/2019 Oregon Property Tax Capitalization report
http://slidepdf.com/reader/full/oregon-property-tax-capitalization-report 1/35
Oregon Property Tax Capitalization:Evidence from Portland
Northwest Economic Research CenterCollege of Urban and Public Affairs
FINAL REPORMarch 2014

8/12/2019 Oregon Property Tax Capitalization report
http://slidepdf.com/reader/full/oregon-property-tax-capitalization-report 2/35
Oregon’s Electric Vehicle Industry
ACKNOWLEDGEMENTS
This research report is produced by the Northwest EconomicResearch Center (NERC) with support from The League ofOregon Cities (LOC).
The League of Oregon Cities was founded in1925 and it is formed by anintergovernmental agreement among all ofOregon's 242 incorporated cities. The Leagueof Oregon Cities is the effective and collective
voice of Oregon's cities and their authoritative and bestsource of information and training. More LOC informationcan be found on their website: www.orcities.org.
NERC is based at Portland State University in TheCollege of Urban and Public Affairs. The Center
focuses on economic research that supportspublic-policy decision-making, and relates to
issues important to Oregon and the Portland MetropolitanArea. NERC serves the public, nonprofit, and private sectorcommunities with high quality, unbiased, and credibleeconomic analysis. The Director of NERC is Dr. ThomasPotiowsky, who also serves as the Chair of the Departmentof Economics at Portland State University. Dr. Jenny Liu isNERC’s Assistant Director, a s well as an Assistant Professorin the Toulan School of Urban Studies at PSU. This report was
researched and written by Dr. Jenny Liu, Assistant Director,and Jeff Renfro, Senior Economist. Research support wasprovided by Janai Kessi and Marisol Cáceres, NERC ResearchInterns. The report was formatted by Marisol Cáceres.
Cite as: Liu, Jenny H. and Renfro, Jeff. (2014) Oregon
Property Tax Capitalization: Evidence from Portland.Northwest Economic Research Center Report.http://www.pdx.edu/nerc/proptax2014
Northwest Economic Research Center
Portland State UniversityCollege of Urban and Public AffairsPO Box 751Portland, OR [email protected]
www.pdx.edu/NERC@nercpdx

8/12/2019 Oregon Property Tax Capitalization report
http://slidepdf.com/reader/full/oregon-property-tax-capitalization-report 3/35
1
OREGON PROPERTY TAX CAPITALIZATION: EVIDENCE FROM PORTLAND
Oregon’s Electric Vehicle Industry
Northwest Economic Research Center
Table of ContentsEXECUTIVE SUMMARY ......................................................................................................... 2
I. INTRODUCTION ............................................................................................................. 4
II. RELEVANT LITERATURE ................................................................................................. 8
III. METHODOLOGY & DATA ............................................................................................ 11
IV. ESTIMATION RESULTS ................................................................................................. 22
V. FURTHER RESEARCH ................................................................................................... 28
VI. CONCLUSIONS ............................................................................................................. 30
APPENDIX: Portland Neighborhood Map .......................................................................... 31BIBLIOGRAPHY ................................................................................................................... 32
8/12/2019 Oregon Property Tax Capitalization report
http://slidepdf.com/reader/full/oregon-property-tax-capitalization-report 4/35
2
OREGON PROPERTY TAX CAPITALIZATION: EVIDENCE FROM PORTLAND
Oregon’s Electric Vehicle Industry
Northwest Economic Research Center
EXECUTIVE SUMMARYThe passage of Measures 5 and 50 drastically changed the way property taxes were assessed inOregon. The measures were intended to limit the ability of government to raise property taxes,while achieving other goals such as equalizing school funding across the state. The property taxsystem that resulted is complex and has introduced inequities into the system based ondiffering rates of changes between assessed value (AV) and real market value (RMV).
The League of Oregon Cities (LOC) asked the Northwest Economic Research Center (NERC) toinvestigate the effect of the tax structure on residential sale prices as part of ongoing efforts tounderstand the impacts of Oregon’s property tax system on local governments . Specifically, wewanted to investigate the magnitude of property tax capitalization - if two houses are similar inall ways except for their property tax payments, do their sale prices differ as a result?
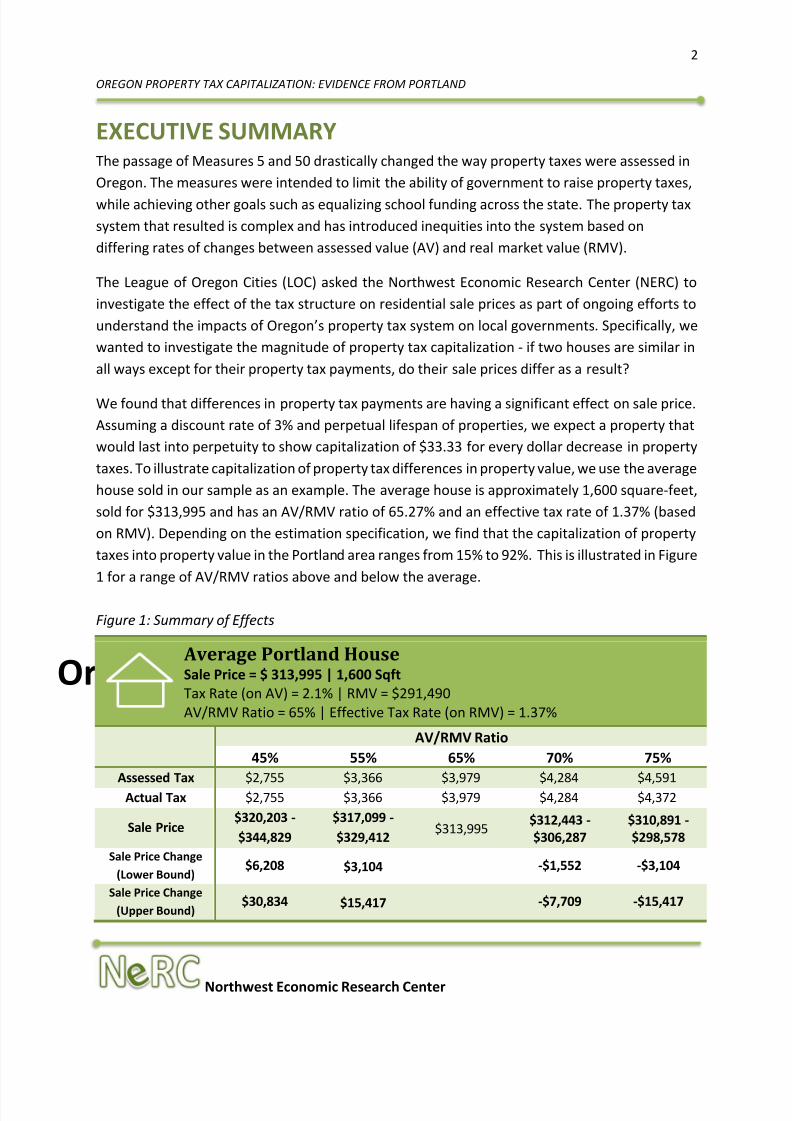
We found that differences in property tax payments are having a significant effect on sale price.Assuming a discount rate of 3% and perpetual lifespan of properties, we expect a property thatwould last into perpetuity to show capitalization of $33.33 for every dollar decrease in propertytaxes. To illustrate capitalization of property tax differences in property value, we use the averagehouse sold in our sample as an example. The average house is approximately 1,600 square-feet,sold for $313,995 and has an AV/RMV ratio of 65.27% and an effective tax rate of 1.37% (basedon RMV). Depending on the estimation specification, we find that the capitalization of propertytaxes into property value in the Portland area ranges from 15% to 92%. This is illustrated in Figure1 for a range of AV/RMV ratios above and below the average.
Figure 1: Summary of Effects
Average Portland House Sale Price = $ 313,995 | 1,600 SqftTax Rate (on AV) = 2.1% | RMV = $291,490AV/RMV Ratio = 65% | Effective Tax Rate (on RMV) = 1.37%
AV/RMV Ratio45% 55% 65% 70% 75%
Assessed Tax $2,755 $3,366 $3,979 $4,284 $4,591Actual Tax $2,755 $3,366 $3,979 $4,284 $4,372
Sale Price$320,203 -$344,829
$317,099 -$329,412
$313,995 $312,443 -$306,287
$310,891 -$298,578
Sale Price Change(Lower Bound)
$6,208 $3,104 -$1,552 -$3,104
Sale Price Change(Upper Bound)
$30,834 $15,417 -$7,709 -$15,417
8/12/2019 Oregon Property Tax Capitalization report
http://slidepdf.com/reader/full/oregon-property-tax-capitalization-report 5/35
3
OREGON PROPERTY TAX CAPITALIZATION: EVIDENCE FROM PORTLAND
Oregon’s Electric Vehicle Industry
Northwest Economic Research Center
In order to quantify this effect, we used regression analysis to isolate the influence of propertytaxes while controlling for other relevant determinants of sale price. Certified tax rolls from
Multnomah County were combined with sales data to create a database with residentialcharacteristics for Portland tax lots. We considered only single-family homes (and condominiumsoccupied by single families) that were sold between 2010-2013, and dropped from the datasetsales that were classified as “distressed” or not as “arm’s length.” Neighborhood characteristicsand school quality are also important determinants of residential value. We geocoded ouraddresses and joined them with geographical characteristics like crime rate, school quality, anddistance to downtown.
Using a variety of regression specifications, we estimated the effect of property tax on sale price.To measure the effect of property tax on sale price we used three variables: AV/RMV ratio,
compression ratio, and effective tax rate. Due to estimation issues, we did not arrive at onedefinitive coefficient estimating property tax capitalization. We are confident that property taxpolicy is having an effect on sale price, but must report a range of possible values.
The inequities in the property tax system are largely driven by changes in RMV. Although thiseffect is not uniform because of differing tax rates, houses that have experienced large growthin value since the inception of the current system tend to be paying less as a percentage of theirhomes’ value i n taxes, which is increasing sale price. From a policy perspective, the distributionof this effect is arbitrary and may be disproportionately benefitting property owners who can
afford to buy in areas with faster increases in property values. This report focuses on Portland,but this same dynamic is likely at play in the rest of the state. We would expect to see this effectin other Oregon cities in which there are large disparities in the increase in home values since theinception of Measures 5 and 50 by neighborhood or area. The property tax system creates ahidden subsidy for these property owners. Some of the burden of funding government andschool services is transferred away from these properties. This results in revenue shortfalls, orcreates the need for property owners in areas with a smaller increase in RMV to fill the gap.

8/12/2019 Oregon Property Tax Capitalization report
http://slidepdf.com/reader/full/oregon-property-tax-capitalization-report 6/35
4
OREGON PROPERTY TAX CAPITALIZATION: EVIDENCE FROM PORTLAND
Oregon’s Electric Vehicle Industry
Northwest Economic Research Center
I. INTRODUCTION
Northwest Economic Research Center (NERC) has been charged with examining how differencesin property taxes due to Measure 5 and 50 have impacted the real estate market in Oregon. Inparticular, we will examine whether housing prices have been impacted by differences inassessed values and property taxes imposed by these two measures. We begin our study with anoverview of Oregon’s property tax system. The follo wing sections describe relevant literaturethat guides our research direction, data sources, methodology, estimation results and discussionof further research.
Oregon’s Property Tax System Since 1990 – Measure 5 and 50In the 1990s, Oregonians passed Measures 5 and 50, setting off a series of major changes. The
intent was to limit and establish predictability of property taxes. While these intentions havebeen mostly realized, there have been additional outcomes which have wreaked havoc on localgovernment revenue streams and potentially affected purchasing decisions of Oregonhomebuyers, the subject of this report.
8/12/2019 Oregon Property Tax Capitalization report
http://slidepdf.com/reader/full/oregon-property-tax-capitalization-report 7/35
5
OREGON PROPERTY TAX CAPITALIZATION: EVIDENCE FROM PORTLAND
Oregon’s Electric Vehicle Industry
Northwest Economic Research Center
History of Oregon’s Property Tax Legislation Property owners, especially homeowners, became increasingly concerned by growing tax ratesin the 1980s. This was mostly driven by two factors: property values were stagnant and localgovernments continued to expand the tax base at the maximum allowed six percent per year.Voters responded to their concerns by passing Measure 5 in 1990 (City Club of Portland, 2013).This was the first in the series of pivotal acts passed by voters in the 1990s. Measure 5 placedlimits on property tax collected per $1,000 of real market value (RMV). The measure set a $5 per$1,000 limit on property taxes going to fund schools - to be phased in between the 1991-92 and1995-96 biennia - and a limit of $10 per $1,000 of RMV for all other government services. In manyareas taxes exceed these limits. In each case where the limit is exceeded, taxes are reduced downto the limit. This process, called compression , lowers property tax bills for many residents, butalso results in millions of dollars of decreased revenues for many local governments (cities,counties and special districts) and schools.
Unfortunately, for those voters expecting Measure 5 to reduce their property tax bill, the 1990swere characterized by a surge in property values. Because the Measure 5 property tax caps arelinked to RMV, some tax bills grew in spite of the imposed limits. This gave voters the impressionthat their vote to limit property taxes had done little to nothing (Linhares & Provost 2011).
Seven years after Oregon voters showed their support for Measure 5 they approved Measure 50,an even more aggressive attempt to limit property taxes. Where Measure 5 imposed limits in theform of rates, Measure 50 went further; it changed the concepts of both tax rates and assessedtaxable values (Oregon Department of Revenue, 2009). Essentially, local district tax rates werereduced and made permanent. This action officially moved Oregon’s system from a levy to a ratebased system. In addition, the measure de-coupled real market values from taxable, or assessedvalues. The measure pegged the new assessed value at 90% of a property’s 1995-96 value andrestricted annual growth in assessed value to three percent. Furthermore, this new law stipulatedthat assessed value could not exceed real market value.
In Portland, property values in 1995-96 varied significantly across the city. These variations wereessentially locked into the system in perpetuity by Measure 50. As home values have grown ordecreased at different rates since the mid-90s, it is now possible for property owners with similarand even proximate properties to pay drastically different taxes. Although the objectives ofstabilizing property taxes have been achiev ed, the structure of Oregon’s property tax laws mayhave produced unintentional costs and inequalities.
8/12/2019 Oregon Property Tax Capitalization report
http://slidepdf.com/reader/full/oregon-property-tax-capitalization-report 8/35
6
OREGON PROPERTY TAX CAPITALIZATION: EVIDENCE FROM PORTLAND
Oregon’s Electric Vehicle Industry
Northwest Economic Research Center
Effects of Measure 5 and Measure 50The two measures created two separate limits thatcome into play depending on the AV and RMV of a
property.
Measure 50 Limit: AV * Tax Rates = Tax Extended Measure 5 Limit: RMV * Maximum Category Rate
($5 schools/ $10 general gov’t) = Maximum Allowable Tax
If the tax extended is greater than the maximumallowable tax, compression occurs, reducing the
amount of tax each jurisdiction can collect.
According to Linhares & Provost (2011), the Oregonproperty tax system is functioning in line with whatvoters approved more than two decades ago. Theyexplain that the bulk of responsibility to fund publiceducation has been shifted to the state and propertytax bills have been made more predictable; however,these outcomes are tilted in favor of the property
owner. When other key stakeholders are consideredthe viability of the system as it exists may bequestioned.
These other stakeholders -- citizens in general, thelocal governments, and the state government -- haveeach felt the pinch of restricted revenue streams andthe subsequent struggle of state and local governmentto provide adequate services. In a recent report, the City Club of Portland identified several issues
with the Oregon system as it is currently functioning:
The system contains and is exacerbating inequities It appears to be undermining local control It is failing to maintain voter approved service levels The system is “wretchedly” complex, effectively undermining constituent confidence in its
functionality (City Club of Portland 2013).
Calculating Property Taxes
Calculating the actual tax due for ahousehold can be complicated due to themultiple rates and valuation methods. Thecalculation begins with the comparison oftwo values, based on a property’s AV andRMV. Based on its location in various taxingdistricts, each property will have a numberof government tax rates and a number ofeducation tax rates. The sum of these ratesis then multiplied by the AV to calculate thebase tax. If the calculated base tax exceedsthe Measure 5 cap [1.5% of current RMV(1% for general government and 0.5% foreducational taxes)], any temporary voter-approved property tax measure for specificservices (such as increased funding forpublic safety, libraries or schools) isreduced first, all the way to $0 if necessary.If the taxes still exceed Measure 5 caps,each permanent tax rate component withinthe base tax is then compressedproportionally such that the base tax willequal the Measure 5 cap.
In order to calculate final taxes, the bondedgeneral government and bonded educationrates, which fund capital constructionprojects, such as new buildings orequipment, are multiplied by the AV andadded to the base tax. These bonded ratesare not subject to the property tax caps.
8/12/2019 Oregon Property Tax Capitalization report
http://slidepdf.com/reader/full/oregon-property-tax-capitalization-report 9/35
7
OREGON PROPERTY TAX CAPITALIZATION: EVIDENCE FROM PORTLAND
Oregon’s Electric Vehicle Industry
Northwest Economic Research Center
In addition, it appears the system may be inconsistent with market movements. Property taximposed in Oregon as a whole has been growing at a decreasing rate since 2010, while inflationhas been growing at a consistently higher rate. This relationship can be observed in Multnomah
County where total property tax imposed grew by a little less than 1.4 percent between 2011 and2012 while inflation grew by 2.3 percent (Oregon Department of Revenue 2013).
Among the above mentioned issues, perhaps one of the most prominent is that the Oregonsystem has effectively disconnected the amount paid in property taxes from the value of theproperty. This is made apparent by horizontal inequity, the case in which property owners withsimilarly valued properties and levels of service pay dramatically different property tax rates.
8/12/2019 Oregon Property Tax Capitalization report
http://slidepdf.com/reader/full/oregon-property-tax-capitalization-report 10/35
8
OREGON PROPERTY TAX CAPITALIZATION: EVIDENCE FROM PORTLAND
Oregon’s Electric Vehicle Industry
Northwest Economic Research Center
II. RELEVANT LITERATURE
Over the years there has been substantial attention given to the economic effects of the propertytax, and up until the late 1960s it was generally considered to be much like any other tax - i.e., itcreated deadweight loss, leaving some capital un-invested and some property unproduced
(Hamilton 1976). But Hamilton points out that this assumption was challenged by Mieszkowskiin 1969. 1 Mieszkowski (1969) suggested that the variation in property tax rates between localitieswould be capitalized into the value of the property, whether it is land, buildings, etc. This conceptof capitalization is the underlying interest in this analysis.
1 Note that Mieszkowski (1969) did not challenge Hamilton (1976) but rather Hamilton cited Mieszkowski ’s work.The publishing dates may create confusion but they do not contradict each other.
8/12/2019 Oregon Property Tax Capitalization report
http://slidepdf.com/reader/full/oregon-property-tax-capitalization-report 11/35
9
OREGON PROPERTY TAX CAPITALIZATION: EVIDENCE FROM PORTLAND
Oregon’s Electric Vehicle Industry
Northwest Economic Research Center
Full Capitalization and the ImplicationsExpanding on the work of Mieszkowski, Hamilton (1976) concluded that perfect capitalizationmay result in horizontal equity – i.e., property owners that are in similar economic situations pay
the same tax. Hamilton bases his findings in a theoretical model that assumes a proportionalproperty tax in every community as well as an equal distribution of public services. It is importantto note that his model is highly stylized. For instance, it only considers residential property and itassumes that there are only two classes of property – high income and low income. Furthermore,it holds that there are communities which are only composed of one or the other of theseproperty types.
The Incidence of the Property TaxWhile much attention – e.g., Mieszkowski and Hamilton – has been given to the economic effects
of the property tax, the incidence is still a contested point among researchers. Zodrow (2007)presents an overview and analysis of the research to date. He compares and contrasts the threeprinciple views of property tax incidence: the Traditional, Benefit, and Capital Tax views. Theauthor suggests that the capital tax view is grounded in the traditional view and incorporateselements of the benefit view; namely, that local residents will shoulder the full burden of anyincrease in property tax. This being said, there are distinct differences between the two views.The capital tax view holds that a property tax distorts the distribution of capital (e.g., land,buildings, etc.) within a local region, whereas the benefit view holds that a property tax has noeffect on the distribution of resources.
Examples of Capitalization from Other LocalesThe theoretical discussions of capitalization and incidence of the property tax are useful, butempirical proof is necessary. Two studies looking at the effects of property tax legislation inCalifornia and Massachusetts helped provide this empirical proof. The passage of California’sProposition 13 in 1978 and Massachusetts’s Proposition 212 in 1980 both placed significantlimitations on the amount of property tax levied. These major shifts in tax policy inspired manyresearch inquiries, looking at topics ranging from the political economy that led to the passageof the propositions to the distributional effects; but there was also the question of whether the
tax reductions were capitalized into the value of the property.
In 1982 Kenneth Rosen analyzed home value and property tax rate data across 64 jurisdictions inthe San Francisco Bay area. He looked at data pre- and post- Proposition 13 and found compellingevidence that the reduced property taxes were in fact capitalized into the property values. Usingregression techniques, Rosen found that a one dollar decrease in property tax in California led toa seven dollar increase in property value (Rosen 1982). However, there may be longer term

8/12/2019 Oregon Property Tax Capitalization report
http://slidepdf.com/reader/full/oregon-property-tax-capitalization-report 12/35
10
OREGON PROPERTY TAX CAPITALIZATION: EVIDENCE FROM PORTLAND
Oregon’s Electric Vehicle Industry
Northwest Economic Research Center
effects associated with decreased levels of public services associated with lower property taxrevenues.
Similarly Bradbury, Mayer, and Case analyze the effects of property tax limitations resulting from
Massachusetts’ Proposition 212 (2001). Their analysis sought to identify whether towns thatwere more restricted in their ability to generate revenue tended to spend less on local services,effectively reduc ing the town’s attractiveness to potential home buyers. They found that schoolspending was affected the most and their analysis revealed that cities with “good schools” - asmeasured by 1990 test scores - saw significantly greater rates of appreciation in home values.
8/12/2019 Oregon Property Tax Capitalization report
http://slidepdf.com/reader/full/oregon-property-tax-capitalization-report 13/35
11
OREGON PROPERTY TAX CAPITALIZATION: EVIDENCE FROM PORTLAND
Oregon’s Electric Vehicle Industry
Northwest Economic Research Center
III. METHODOLOGY & DATABefore performing the regression analysis detailed in the next section, we needed to combinedata from a variety of sources to allow us to isolate the effect of tax policy from the other
determinants of house sale price.
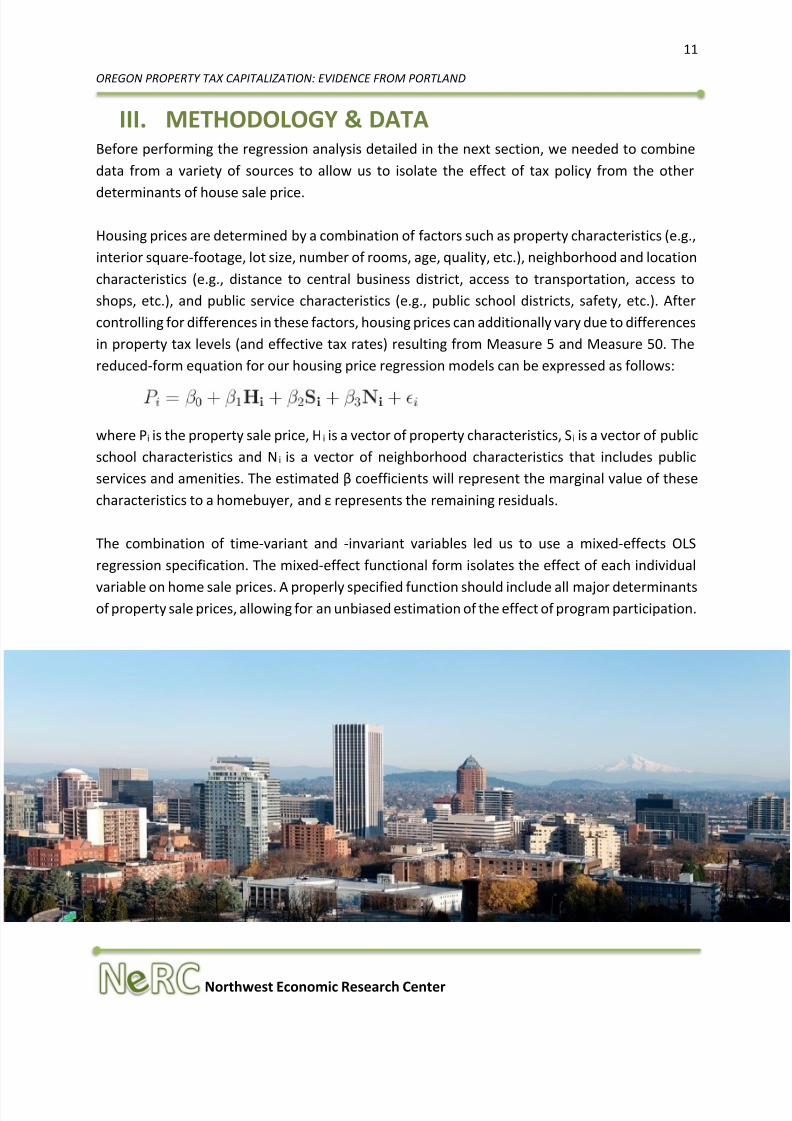
Housing prices are determined by a combination of factors such as property characteristics (e.g.,interior square-footage, lot size, number of rooms, age, quality, etc.), neighborhood and locationcharacteristics (e.g., distance to central business district, access to transportation, access toshops, etc.), and public service characteristics (e.g., public school districts, safety, etc.). Aftercontrolling for differences in these factors, housing prices can additionally vary due to differencesin property tax levels (and effective tax rates) resulting from Measure 5 and Measure 50. Thereduced-form equation for our housing price regression models can be expressed as follows:
where P i is the property sale price, H i is a vector of property characteristics, S i is a vector of publicschool characteristics and N i is a vector of neighborhood characteristics that includes publicservices and amenities. The estimated β coefficients will represent the marginal value of thesecharacteristics to a homebuyer, and ε represents the remaining residuals.
The combination of time-variant and -invariant variables led us to use a mixed-effects OLSregression specification. The mixed-effect functional form isolates the effect of each individual
variable on home sale prices. A properly specified function should include all major determinantsof property sale prices, allowing for an unbiased estimation of the effect of program participation.

8/12/2019 Oregon Property Tax Capitalization report
http://slidepdf.com/reader/full/oregon-property-tax-capitalization-report 14/35
12
OREGON PROPERTY TAX CAPITALIZATION: EVIDENCE FROM PORTLAND
Oregon’s Electric Vehicle Industry
Northwest Economic Research Center
Whether housing prices have increased as a result of lower assessed values dictated by thecombination of Measure 5 and 50 can be answered by examining the degree of capitalization ofproperty tax differences into property values. In the Handbook of Regional and Urban Economics ,Ross and Yinger (1999) specify the capitalization of property tax differences into property values
as follows:
where ΔV represents the change in property value, ΔT represents the difference in property taxpaid, r represents the d iscount rate and α represents the degree of capitalization. The equationcan be altered to represent capitalization with a limited lifespan of n years as follows:
Assuming known discount rates and known lifespan of properties, the estimated coefficients onproperty tax measures in the regression analysis will provide the basis to calculate the degree ofcapitalization for properties in the Portland area.
Specification refers to the functional form of the estimation equation, and includes the choice ofvariables. Sensitivity analysis involves making small changes to the regression specification. Theway in which estimates react to small changes gives the researcher clues about the validity of themodel, and can also draw attention to issues that still need to be resolved. If the estimated effect
of the variable in question changes drastically due to changes in other variables, or by changingthe functional form, then the estimates are not trustworthy. We utilized sensitivity analysis tovalidate our regression results as well as the capitalization measures.
DataIn order to construct the dataset for our estimations, we began with the last four years of certifiedtax rolls from Multnomah County (including the most recent, 2013-2014). This dataset coversevery tax lot in Multnomah County. From this dataset, we had the location of the house andinformation about the house itself, like square footage, number of bedrooms, etc. Each record
also included the current RMV, AV, and tax code for each property (more on these measureslater).
The study only considers single family, residential units so commercial properties, multi-familyhousing, and other properties that did not fit our definition were dropped. The tax lots weconsidered were made up almost exclusively of single-family houses and single-family

8/12/2019 Oregon Property Tax Capitalization report
http://slidepdf.com/reader/full/oregon-property-tax-capitalization-report 15/35
13
OREGON PROPERTY TAX CAPITALIZATION: EVIDENCE FROM PORTLAND
Oregon’s Electric Vehicle Industry
Northwest Economic Research Center
condominiums 2. Because we are measuring the effect of tax policy on sale price, we needed tofurther reduce the records to only include houses that had been sold during the period for whichwe had certified tax information. To do this, we combined a separate dataset of MultnomahCounty home sales dating back to 2000. This allowed us to identify which houses had been sold
during our study period, and when they were sold. It also allowed us to track the type of sale.During our study period, there were an unusually large number of foreclosures, short sales, andother types of distressed transactions. We eliminated these types of distressed sales, as well assales that were not conducted at “arm’s length” (transfer between family members, forexample).
The dataset included RMV and AV for each property, which we used to calculate the actual taxpaid in each year. Multnomah County publishes the tax limited and bonded tax rates for eachtaxing district in the county. These taxing districts overlap, meaning that houses relatively close
to each other could be subject to different rates. Using the tax code for each property from thecertified tax rolls, we matched education and government rates (both limited and bond), andused these rates to calculate the actual tax paid. The sidebar on page 6 explains this process. Inaddition, we calculated the compression ratio and the effective tax rate on RMV as alternativemeasures of property tax levels. The compression ratio is calculated as calculated taxes(excluding bond rates) divided by the Measure 5 cap of 1.5% of RMV times 100, representing thepercentage of the total calculated taxes that is actually paid by the household. Effective tax rateis the actual tax paid divided by RMV, representing the effective tax rate as a percentage of thereal market value.
A goal of this study was to move beyond existing measures of tax policy on property value andincorporate controls related to other determinants of value. To do this, we geocoded all of ourproperty addresses, and assigned a neighborhood to each property. Then, we used a datasetshowing incidence of crime in Portland to calculate a crime rate for each neighborhood (numberof crime per 1000 residents) in 2012. The distance from each neighborhood centroid todowntown was used to measure distance to the central business district. Walk Score® producesmeasures of the walkability, bikeability, and quality of public transit in each neighborhood. Wefound collinearity between these neighborhood amenities measures, which indicated that
neighborhoods that tended to have good walkability also tended to be highly bikeable and havebetter access to public transportation. Therefore, the specifications shown in this report utilizeonly the Walk Score® as a measure of neighborhood accessibility.
2 Single family condominiums refer to multi-family properties that have been converted to condominiums, whereownership of each unit is separate. Apartment buildings (and other types of multi-family units) that are owned bycommercial entities are not considered in this study.
8/12/2019 Oregon Property Tax Capitalization report
http://slidepdf.com/reader/full/oregon-property-tax-capitalization-report 16/35
14
OREGON PROPERTY TAX CAPITALIZATION: EVIDENCE FROM PORTLAND
Oregon’s Electric Vehicle Industry
Northwest Economic Research Center
In the literature covering the determinants of sale price, school quality is frequently found to besignificant. To incorporate this variable, we used the geocoded addresses and joined each to anelementary school catchment area. Most of the properties were assigned a Portland PublicSchools elementary school, but the properties in East Portland were assigned to the appropriate
school in the Reynolds, David Douglas, Parkrose, or Centennial School Districts. The statepublishes reading and math scores for each school which represented the percentage of studentsthat met or exceeded state standards; these were used as our measure of school quality.
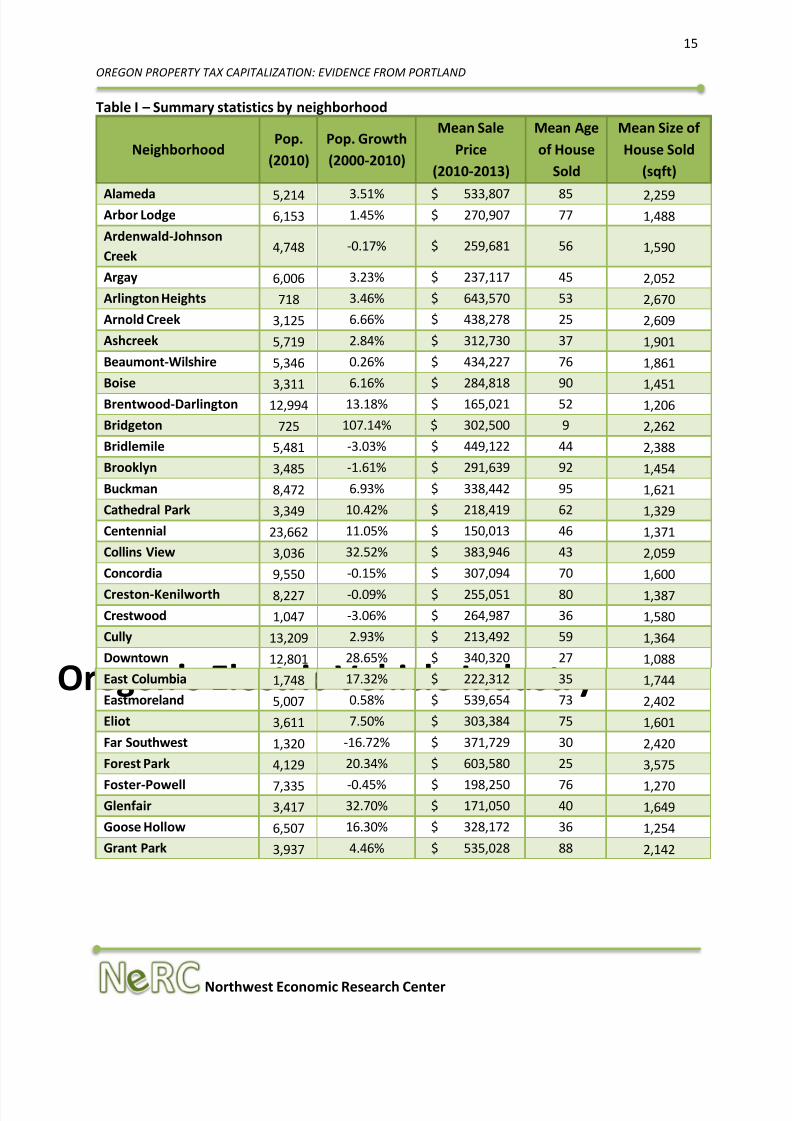
The following figures illustrate differences in sale property characteristics by neighborhood. Aswe explain in later sections, property characteristics and neighborhood amenities tend to clustergeographically; properties tend to be grouped by size, age, and sale price. This means that wecan experience confounding effects when using all potential variables. Table I below summarizespopulation, population growth, mean sale price, mean age of house sold and mean size of house
sold as a supplement to the graphical presentations.
8/12/2019 Oregon Property Tax Capitalization report
http://slidepdf.com/reader/full/oregon-property-tax-capitalization-report 17/35
15
OREGON PROPERTY TAX CAPITALIZATION: EVIDENCE FROM PORTLAND
Oregon’s Electric Vehicle Industry
Northwest Economic Research Center
Table I – Summary statistics by neighborhood
NeighborhoodPop.
(2010)Pop. Growth(2000-2010)
Mean SalePrice
(2010-2013)
Mean Ageof House
Sold
Mean Size ofHouse Sold
(sqft)
Alameda 5,214 3.51% $ 533,807 85 2,259Arbor Lodge 6,153 1.45% $ 270,907 77 1,488Ardenwald-JohnsonCreek
4,748 -0.17% $ 259,681 56 1,590
Argay 6,006 3.23% $ 237,117 45 2,052Arlington Heights 718 3.46% $ 643,570 53 2,670Arnold Creek 3,125 6.66% $ 438,278 25 2,609Ashcreek 5,719 2.84% $ 312,730 37 1,901Beaumont-Wilshire 5,346 0.26% $ 434,227 76 1,861Boise 3,311 6.16% $ 284,818 90 1,451Brentwood-Darlington 12,994 13.18% $ 165,021 52 1,206Bridgeton 725 107.14% $ 302,500 9 2,262Bridlemile 5,481 -3.03% $ 449,122 44 2,388Brooklyn 3,485 -1.61% $ 291,639 92 1,454Buckman 8,472 6.93% $ 338,442 95 1,621Cathedral Park 3,349 10.42% $ 218,419 62 1,329Centennial 23,662 11.05% $ 150,013 46 1,371Collins View 3,036 32.52% $ 383,946 43 2,059Concordia 9,550 -0.15% $ 307,094 70 1,600Creston-Kenilworth 8,227 -0.09% $ 255,051 80 1,387Crestwood 1,047 -3.06% $ 264,987 36 1,580Cully 13,209 2.93% $ 213,492 59 1,364Downtown 12,801 28.65% $ 340,320 27 1,088East Columbia 1,748 17.32% $ 222,312 35 1,744Eastmoreland 5,007 0.58% $ 539,654 73 2,402Eliot 3,611 7.50% $ 303,384 75 1,601Far Southwest 1,320 -16.72% $ 371,729 30 2,420Forest Park 4,129 20.34% $ 603,580 25 3,575
Foster-Powell 7,335 -0.45% $ 198,250 76 1,270Glenfair 3,417 32.70% $ 171,050 40 1,649Goose Hollow 6,507 16.30% $ 328,172 36 1,254Grant Park 3,937 4.46% $ 535,028 88 2,142
8/12/2019 Oregon Property Tax Capitalization report
http://slidepdf.com/reader/full/oregon-property-tax-capitalization-report 18/35
16
OREGON PROPERTY TAX CAPITALIZATION: EVIDENCE FROM PORTLAND
Oregon’s Electric Vehicle Industry
Northwest Economic Research Center
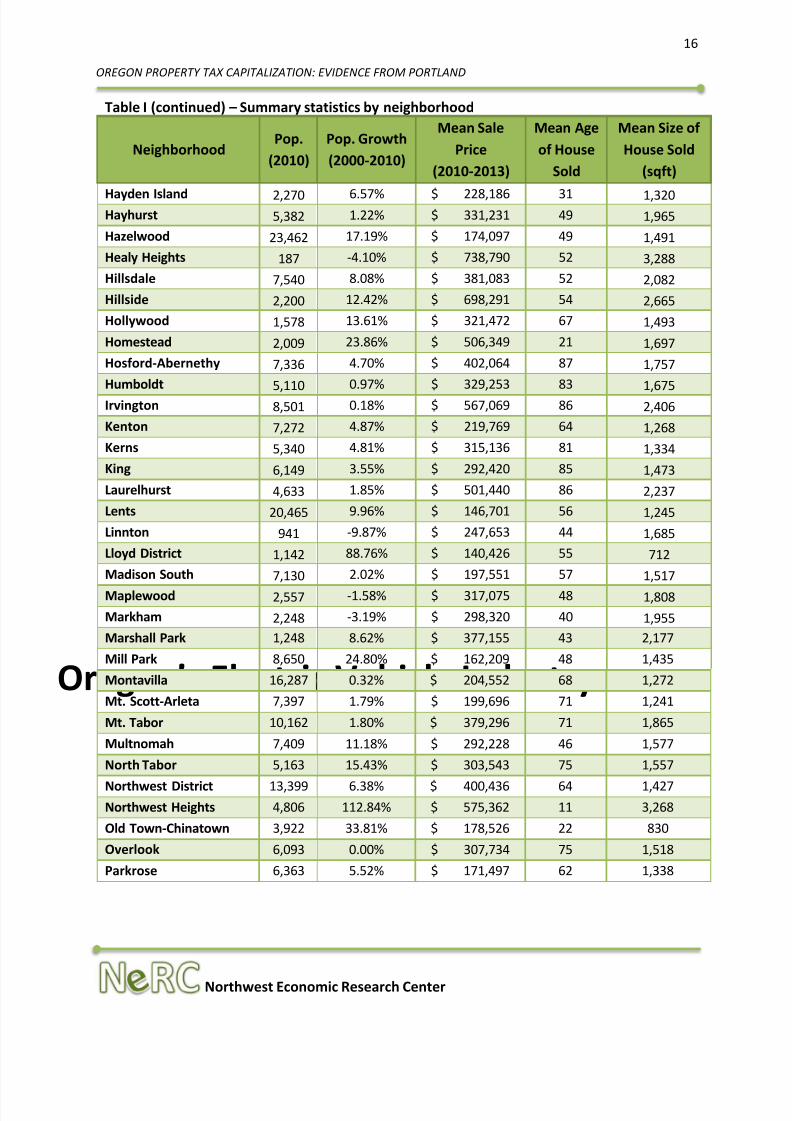
Table I (continued) – Summary statistics by neighborhood
NeighborhoodPop.
(2010)Pop. Growth(2000-2010)
Mean SalePrice
(2010-2013)
Mean Ageof House
Sold
Mean Size ofHouse Sold
(sqft)
Hayden Island 2,270 6.57% $ 228,186 31 1,320Hayhurst 5,382 1.22% $ 331,231 49 1,965Hazelwood 23,462 17.19% $ 174,097 49 1,491Healy Heights 187 -4.10% $ 738,790 52 3,288Hillsdale 7,540 8.08% $ 381,083 52 2,082Hillside 2,200 12.42% $ 698,291 54 2,665Hollywood 1,578 13.61% $ 321,472 67 1,493Homestead 2,009 23.86% $ 506,349 21 1,697Hosford-Abernethy 7,336 4.70% $ 402,064 87 1,757Humboldt 5,110 0.97% $ 329,253 83 1,675Irvington 8,501 0.18% $ 567,069 86 2,406Kenton 7,272 4.87% $ 219,769 64 1,268Kerns 5,340 4.81% $ 315,136 81 1,334King 6,149 3.55% $ 292,420 85 1,473Laurelhurst 4,633 1.85% $ 501,440 86 2,237Lents 20,465 9.96% $ 146,701 56 1,245Linnton 941 -9.87% $ 247,653 44 1,685Lloyd District 1,142 88.76% $ 140,426 55 712Madison South 7,130 2.02% $ 197,551 57 1,517Maplewood 2,557 -1.58% $ 317,075 48 1,808Markham 2,248 -3.19% $ 298,320 40 1,955Marshall Park 1,248 8.62% $ 377,155 43 2,177Mill Park 8,650 24.80% $ 162,209 48 1,435Montavilla 16,287 0.32% $ 204,552 68 1,272Mt. Scott-Arleta 7,397 1.79% $ 199,696 71 1,241Mt. Tabor 10,162 1.80% $ 379,296 71 1,865Multnomah 7,409 11.18% $ 292,228 46 1,577North Tabor 5,163 15.43% $ 303,543 75 1,557
Northwest District 13,399 6.38% $ 400,436 64 1,427Northwest Heights 4,806 112.84% $ 575,362 11 3,268Old Town-Chinatown 3,922 33.81% $ 178,526 22 830Overlook 6,093 0.00% $ 307,734 75 1,518Parkrose 6,363 5.52% $ 171,497 62 1,338
8/12/2019 Oregon Property Tax Capitalization report
http://slidepdf.com/reader/full/oregon-property-tax-capitalization-report 19/35
17
OREGON PROPERTY TAX CAPITALIZATION: EVIDENCE FROM PORTLAND
Oregon’s Electric Vehicle Industry
Northwest Economic Research Center
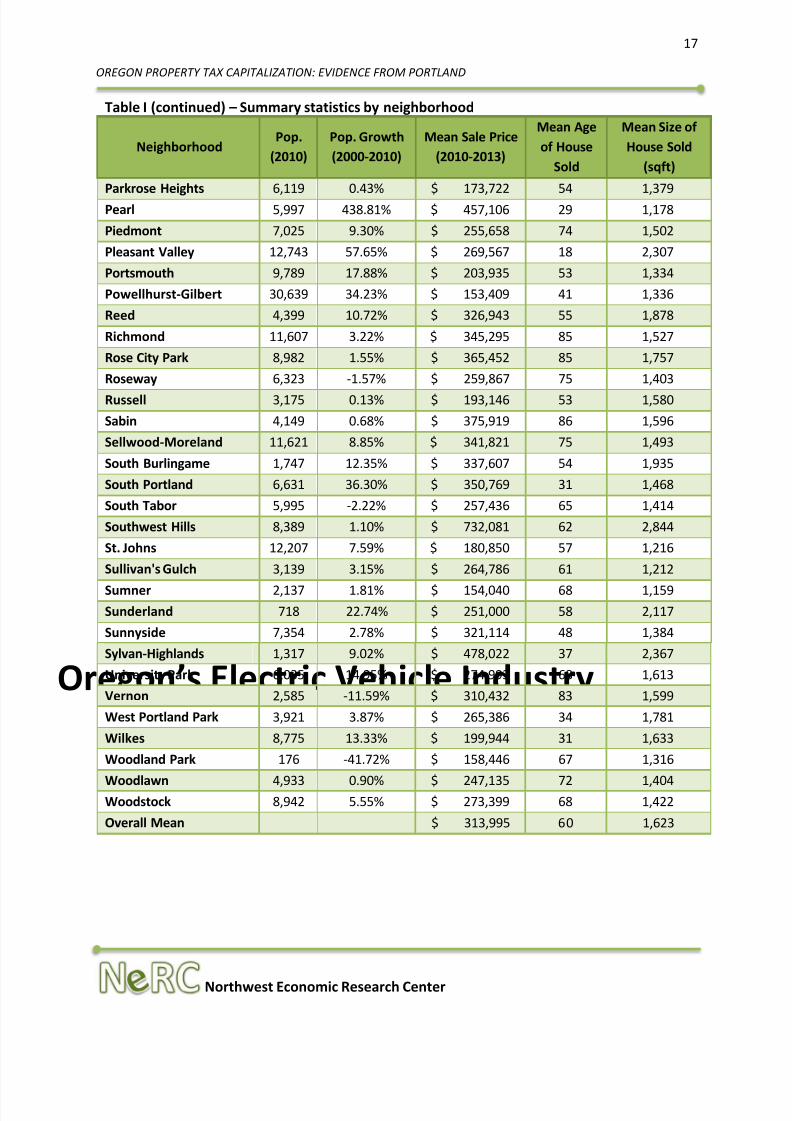
Table I (continued) – Summary statistics by neighborhood
NeighborhoodPop.
(2010)Pop. Growth(2000-2010)
Mean Sale Price(2010-2013)
Mean Ageof House
Sold
Mean Size ofHouse Sold
(sqft)
Parkrose Heights 6,119 0.43% $ 173,722 54 1,379Pearl 5,997 438.81% $ 457,106 29 1,178Piedmont 7,025 9.30% $ 255,658 74 1,502Pleasant Valley 12,743 57.65% $ 269,567 18 2,307Portsmouth 9,789 17.88% $ 203,935 53 1,334Powellhurst-Gilbert 30,639 34.23% $ 153,409 41 1,336Reed 4,399 10.72% $ 326,943 55 1,878Richmond 11,607 3.22% $ 345,295 85 1,527Rose City Park 8,982 1.55% $ 365,452 85 1,757Roseway 6,323 -1.57% $ 259,867 75 1,403Russell 3,175 0.13% $ 193,146 53 1,580Sabin 4,149 0.68% $ 375,919 86 1,596Sellwood-Moreland 11,621 8.85% $ 341,821 75 1,493South Burlingame 1,747 12.35% $ 337,607 54 1,935South Portland 6,631 36.30% $ 350,769 31 1,468South Tabor 5,995 -2.22% $ 257,436 65 1,414Southwest Hills 8,389 1.10% $ 732,081 62 2,844St. Johns 12,207 7.59% $ 180,850 57 1,216Sullivan's Gulch 3,139 3.15% $ 264,786 61 1,212
Sumner 2,137 1.81% $ 154,040 68 1,159Sunderland 718 22.74% $ 251,000 58 2,117Sunnyside 7,354 2.78% $ 321,114 48 1,384Sylvan-Highlands 1,317 9.02% $ 478,022 37 2,367University Park 6,035 14.95% $ 274,993 68 1,613Vernon 2,585 -11.59% $ 310,432 83 1,599West Portland Park 3,921 3.87% $ 265,386 34 1,781Wilkes 8,775 13.33% $ 199,944 31 1,633Woodland Park 176 -41.72% $ 158,446 67 1,316
Woodlawn 4,933 0.90% $ 247,135 72 1,404Woodstock 8,942 5.55% $ 273,399 68 1,422Overall Mean $ 313,995 60 1,623
8/12/2019 Oregon Property Tax Capitalization report
http://slidepdf.com/reader/full/oregon-property-tax-capitalization-report 20/35
18
OREGON PROPERTY TAX CAPITALIZATION: EVIDENCE FROM PORTLAND
Oregon’s Electric Vehicle Industry
Northwest Economic Research Center
Figure 2 displays the mean sale price of each property in our dataset by neighborhood. Thereappears to be a tendency for prices to decrease the further the property is from the city center.It should be noted that even with a large dataset featuring a large number of records, some
neighborhoods had few sales during the study period. Forest Park has a high mean sale price,but this is driven by a relatively small number of high-value houses. In contrast, the dark area inthe center of the map includes the Irvington neighborhood which had a large number of salesand is still in the highest sale price category.
Mean square footage of sale properties (Figure 3) is more dispersed than sale price. Again, wecan identify two neighborhoods (Irvington and Eastmoreland) in the inner-east side that tend tohave larger houses, but there are also clusters of larger properties in the southwest and far-southeast. The combination of high sale prices and small properties in the central part of the city on
both sides of the river again demonstrate the premium placed on living in the city center.
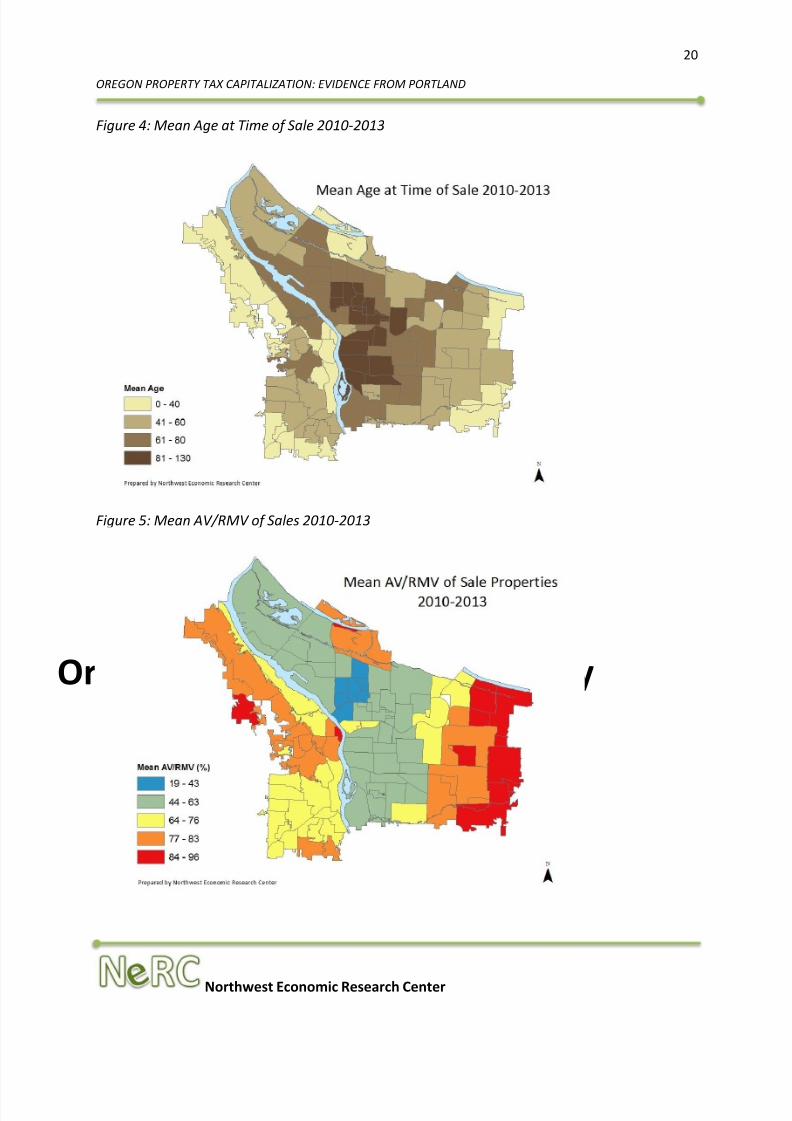
Figure 4 displays the mean age of properties at time of sale by neighborhood. There is a clearclustering of older properties in the inner-south east and inner-north east areas. The Downtownand Pearl neighborhoods have clusters of relatively new residences.
Figures 5 and 6 taken together illustrate a primary driver of the findings of the analysis. Figure 5displays the AV/RMV ratio as a percentage. The inner-eastside in general has a larger split,reflecting the fact that properties values in this area have increased faster than in other areaswith older residences. The grouping of neighborhoods in blue includes the areas of North andNortheast Portland that have rapidly increased in value over the last decade. When we checkthese areas on Figure 6, which shows actual tax paid, some of these same neighborhoods fall inthe low-tax categories. A large gap between AV and RMV does not mean that the owner of aproperty is paying low taxes because of differences in rates. Instead it means that theseneighborhoods are paying less than what is expected based on location and sale price.

8/12/2019 Oregon Property Tax Capitalization report
http://slidepdf.com/reader/full/oregon-property-tax-capitalization-report 21/35
19
OREGON PROPERTY TAX CAPITALIZATION: EVIDENCE FROM PORTLAND
Oregon’s Electric Vehicle Industry
Northwest Economic Research Center
Figure 2: Mean Sale Price 2010-2013 3
Figure 3: Mean Square Footage of Sales 2010-2013
3 A map showing neighborhood groupings and names can be found in the Appendix (pg. 31)
8/12/2019 Oregon Property Tax Capitalization report
http://slidepdf.com/reader/full/oregon-property-tax-capitalization-report 22/35
20
OREGON PROPERTY TAX CAPITALIZATION: EVIDENCE FROM PORTLAND
Oregon’s Electric Vehicle Industry
Northwest Economic Research Center
Figure 4: Mean Age at Time of Sale 2010-2013
Figure 5: Mean AV/RMV of Sales 2010-2013

8/12/2019 Oregon Property Tax Capitalization report
http://slidepdf.com/reader/full/oregon-property-tax-capitalization-report 23/35
21
OREGON PROPERTY TAX CAPITALIZATION: EVIDENCE FROM PORTLAND
Oregon’s Electric Vehicle Industry
Northwest Economic Research Center
Figure 6: Mean Tax Paid on Sale Properties 2010-2013

8/12/2019 Oregon Property Tax Capitalization report
http://slidepdf.com/reader/full/oregon-property-tax-capitalization-report 24/35
22
OREGON PROPERTY TAX CAPITALIZATION: EVIDENCE FROM PORTLAND
Oregon’s Electric Vehicle Industry
Northwest Economic Research Center
IV. ESTIMATION RESULTS
Tables II through V present regression results using variables and methodology discussed inprevious sections. We estimated the effects of property tax capitalization using multiplespecifications.
Because the main purpose of this study is toestimate the effects of property taxdifferences on home values, we utilize threedifferent measures of property taxes:AV/RMV ratio, combined AV/RMV ratio andcompression ratio, and effective propertytax rate (defined as taxes paid divided byRMV). All model specifications include thethree measures, denoted as (a), (b) and (c),respectively. Across all three measures, wefind that home values are generally higherwhen the property taxes are relatively lowercompared to other properties with similarcharacteristics. However, the magnitude ofinfluence varied significantly across modelspecifications.
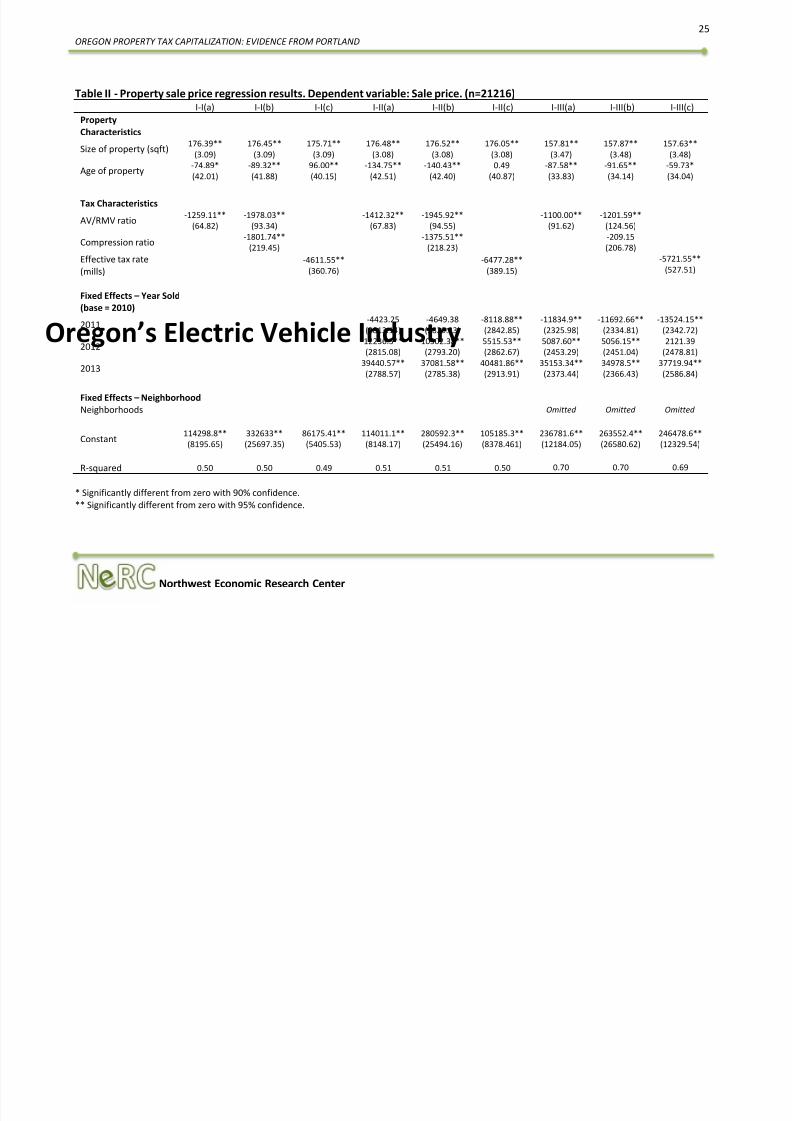
In Table II, we start with a simple specification (model I-I) to estimate property sale prices as afunction of property size, age and AV/RMV ratio. The results show that every square-footincreases sale price by $176.39, each additional year of age decreases sale price by $74.89 andeach additional percentage point increase in AV/RMV ratio (bringing assessed value closer to thereal market value) decreases sale price by $1259.11. The R-squared value is known statisticallyas a coefficient of determination. It denotes the proportion of variation in property sale pricesexplained by the regression models. Model I-I(a) has an R-square equal to 50%, which indicates
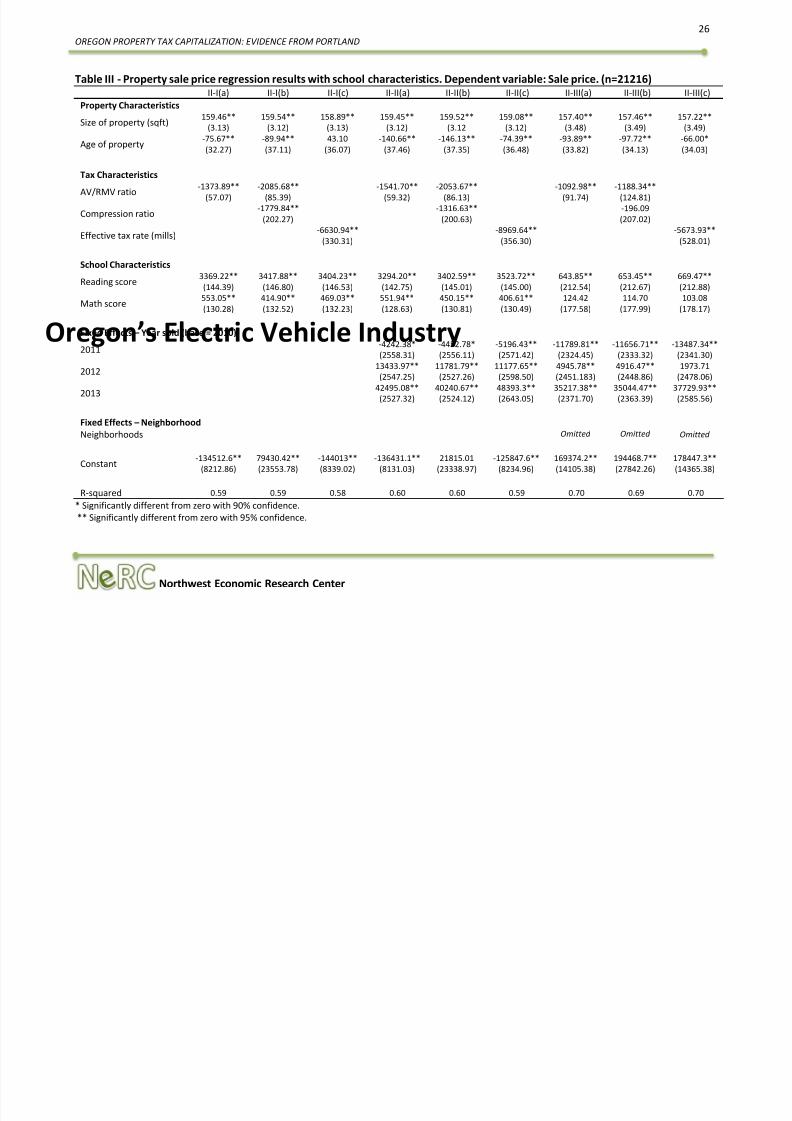
that the model captures 50% of the variation in sale prices without controlling for other factorsthat may also contribute. The regression results show that every additional square-footconsistently adds approximately $157 to $176 to home values, but property age did not alwaysshow a consistent sign. When measures of public school quality were incorporated, theestimations showed statistically significant positive impacts of both elementary level reading andmath scores (percentage of students in a given public elementary school who meet or exceedstandards on state exams) on home values. In addition, homes generally garnered higher sale
Property Tax Measures - Notation
AV/RMV ratio =
Compression ratio =
Effective Tax Rate =
8/12/2019 Oregon Property Tax Capitalization report
http://slidepdf.com/reader/full/oregon-property-tax-capitalization-report 25/35
23
OREGON PROPERTY TAX CAPITALIZATION: EVIDENCE FROM PORTLAND
Oregon’s Electric Vehicle Industry
Northwest Economic Research Center
prices when they were located closer to the central business district, had higher accessibility toamenities (as measured by the Walk Score®) and when crime rate per 1000 residents were lower.
R-squared values ranged from 49% to 70% depending on model specifications, indicating thatbetween 49% and 70% of the variation in housing prices is explained by our explanatory variables.We report robust standard errors (heteroscedasticity-consistent standard errors) to account forheteroscedasticity, or differences in variance across sub-populations of our dataset. In order todeal with endogeneity, we employed two separate sets of strategies: mixed-effects models andinstrumental variable (IV) approach. We incorporated time fixed-effects using the year that thesale occurred to account for overall economic conditions and other omitted variables that varyacross time. We also estimated additional neighborhood fixed-effects in order to captureunobserved heterogeneity that only varies across neighborhoods. Due to a lack of properinstrumental variables in our dataset, we only used whether a property was built before Measure50 (1997) as an instrument for the AV/RMV ratio, but did not find convincing estimation results(specification tests showed that this particular instrument did not effectively deal withendogeneity).
CapitalizationUsing the definition of property capitalization presented by Ross and Yinger (1999), at discountrates of 3%, 5% and 7%, we expect a property that would last into perpetuity to showcapitalization of $33.33, $20.00 and $14.29, respectively, for every dollar decrease in property
taxes. If we assumed a 40 year lifespan for the properties, the capitalization of property taxdecreases would become $23.11, $17.16 and $13.33, respectively.
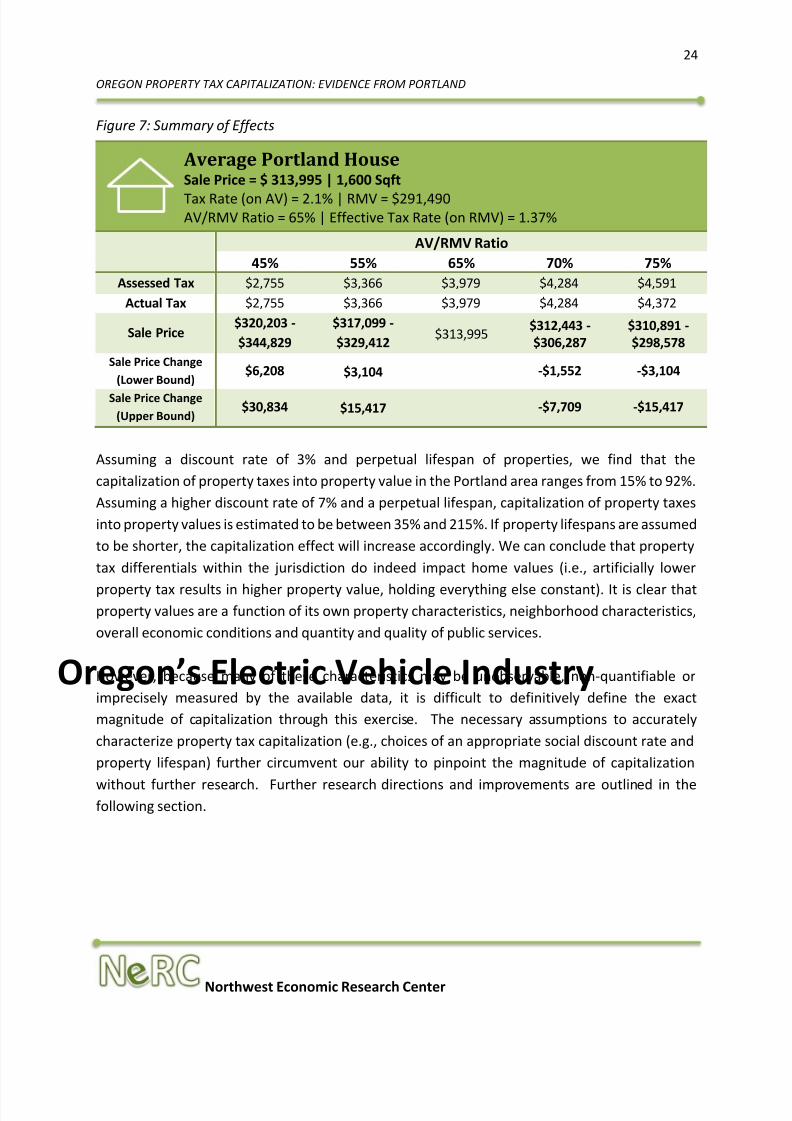
To illustrate capitalization of property tax differences in property value, we use the averagehouse sold in our sample as an example. The average house is approximately 1600 square-feet,sold for $313,995 and has an AV/RMV ratio of 65.27% and an effective tax rate of 1.369%. Usingthe AV/RMV ratio as our variable of interest, our regressions show changes of -$310.39 to -$1541.70 in property sale price for every percentage point increase in the AV/RMV ratio.Therefore, every dollar decrease of property tax results in a property value increase from $5.06
to $25.11. Using the effective tax rate on RMV as our variable of interest, we estimate a changeof between -$1766.49 to -$8969.64 in property value per 0.1% increase in the effective tax rate(or increase of one mill). In this case, every dollar decrease of property tax translates to between$6.05 and $30.72 of increase in the property value.
8/12/2019 Oregon Property Tax Capitalization report
http://slidepdf.com/reader/full/oregon-property-tax-capitalization-report 26/35
24
OREGON PROPERTY TAX CAPITALIZATION: EVIDENCE FROM PORTLAND
Oregon’s Electric Vehicle Industry
Northwest Economic Research Center
Figure 7: Summary of Effects
Assuming a discount rate of 3% and perpetual lifespan of properties, we find that thecapitalization of property taxes into property value in the Portland area ranges from 15% to 92%.Assuming a higher discount rate of 7% and a perpetual lifespan, capitalization of property taxesinto property values is estimated to be between 35% and 215%. If property lifespans are assumedto be shorter, the capitalization effect will increase accordingly. We can conclude that propertytax differentials within the jurisdiction do indeed impact home values (i.e., artificially lower
property tax results in higher property value, holding everything else constant). It is clear thatproperty values are a function of its own property characteristics, neighborhood characteristics,overall economic conditions and quantity and quality of public services.
However, because many of these characteristics may be unobservable, non-quantifiable orimprecisely measured by the available data, it is difficult to definitively define the exactmagnitude of capitalization through this exercise. The necessary assumptions to accuratelycharacterize property tax capitalization (e.g., choices of an appropriate social discount rate andproperty lifespan) further circumvent our ability to pinpoint the magnitude of capitalization
without further research. Further research directions and improvements are outlined in thefollowing section.
Average Portland House Sale Price = $ 313,995 | 1,600 Sqft
Tax Rate (on AV) = 2.1% | RMV = $291,490AV/RMV Ratio = 65% | Effective Tax Rate (on RMV) = 1.37%
AV/RMV Ratio45% 55% 65% 70% 75%
Assessed Tax $2,755 $3,366 $3,979 $4,284 $4,591Actual Tax $2,755 $3,366 $3,979 $4,284 $4,372
Sale Price$320,203 -$344,829
$317,099 -$329,412
$313,995 $312,443 -$306,287
$310,891 -$298,578
Sale Price Change(Lower Bound)
$6,208 $3,104 -$1,552 -$3,104
Sale Price Change(Upper Bound)
$30,834 $15,417 -$7,709 -$15,417
8/12/2019 Oregon Property Tax Capitalization report
http://slidepdf.com/reader/full/oregon-property-tax-capitalization-report 27/35
25OREGON PROPERTY TAX CAPITALIZATION: EVIDENCE FROM PORTLAND
Oregon’s Electric Vehicle Industry
Northwest Economic Research Center
Table II - Property sale price regression results. Dependent variable: Sale price. (n=21216)I-I(a) I-I(b) I-I(c) I-II(a) I-II(b) I-II(c) I-III(a) I-III(b) I-III(c)
PropertyCharacteristics
Size of property (sqft) 176.39**(3.09)
176.45**(3.09)
175.71**(3.09)
176.48**(3.08)
176.52**(3.08)
176.05**(3.08)
157.81**(3.47)
157.87**(3.48)
157.63**(3.48)
Age of property -74.89*(42.01)
-89.32**(41.88)
96.00**(40.15)
-134.75**(42.51)
-140.43**(42.40)
0.49(40.87)
-87.58**(33.83)
-91.65**(34.14)
-59.73*(34.04)
Tax Characteristics
AV/RMV ratio -1259.11**(64.82)
-1978.03**(93.34)
-1412.32**(67.83)
-1945.92**(94.55)
-1100.00**(91.62)
-1201.59**(124.56)
Compression ratio -1801.74**(219.45)
-1375.51**(218.23)
-209.15(206.78)
Effective tax rate(mills)
-4611.55**(360.76)
-6477.28**(389.15)
-5721.55**(527.51)
Fixed Effects – Year Sold(base = 2010)
2011 -4423.25(2813.14)
-4649.38(2829.23)
-8118.88**(2842.85)
-11834.9**(2325.98)
-11692.66**(2334.81)
-13524.15**(2342.72)
2012 12236.5**(2815.08)
10502.38**(2793.20)
5515.53**(2862.67)
5087.60**(2453.29)
5056.15**(2451.04)
2121.39(2478.81)
2013 39440.57**(2788.57)
37081.58**(2785.38)
40481.86**(2913.91)
35153.34**(2373.44)
34978.5**(2366.43)
37719.94**(2586.84)
Fixed Effects – NeighborhoodNeighborhoods Omitted Omitted Omitted
Constant 114298.8**(8195.65)
332633**(25697.35)
86175.41**(5405.53)
114011.1**(8148.17)
280592.3**(25494.16)
105185.3**(8378.461)
236781.6**(12184.05)
263552.4**(26580.62)
246478.6**(12329.54)
R-squared 0.50 0.50 0.49 0.51 0.51 0.50 0.70 0.70 0.69
* Significantly different from zero with 90% confidence.** Significantly different from zero with 95% confidence.
8/12/2019 Oregon Property Tax Capitalization report
http://slidepdf.com/reader/full/oregon-property-tax-capitalization-report 28/35
26OREGON PROPERTY TAX CAPITALIZATION: EVIDENCE FROM PORTLAND
Oregon’s Electric Vehicle Industry
Northwest Economic Research Center
Table III - Property sale price regression results with school characteristics. Dependent variable: Sale price. (n=21216)II-I(a) II-I(b) II-I(c) II-II(a) II-II(b) II-II(c) II-III(a) II-III(b) II-III(c)
Property Characteristics
Size of property (sqft) 159.46**(3.13)
159.54**(3.12)
158.89**(3.13)
159.45**(3.12)
159.52**(3.12
159.08**(3.12)
157.40**(3.48)
157.46**(3.49)
157.22**(3.49)
Age of property -75.67**(32.27)
-89.94**(37.11)
43.10(36.07)
-140.66**(37.46)
-146.13**(37.35)
-74.39**(36.48)
-93.89**(33.82)
-97.72**(34.13)
-66.00*(34.03)
Tax Characteristics
AV/RMV ratio-1373.89**
(57.07)-2085.68**
(85.39)-1541.70**
(59.32)-2053.67**
(86.13)-1092.98**
(91.74)-1188.34**
(124.81)
Compression ratio -1779.84**(202.27)
-1316.63**(200.63)
-196.09(207.02)
Effective tax rate (mills) -6630.94**(330.31)
-8969.64**(356.30)
-5673.93**(528.01)
School Characteristics
Reading score 3369.22**(144.39)
3417.88**(146.80)
3404.23**(146.53)
3294.20**(142.75)
3402.59**(145.01)
3523.72**(145.00)
643.85**(212.54)
653.45**(212.67)
669.47**(212.88)
Math score 553.05**(130.28)
414.90**(132.52)
469.03**(132.23)
551.94**(128.63)
450.15**(130.81)
406.61**(130.49)
124.42(177.58)
114.70(177.99)
103.08(178.17)
Fixed Effects – Year sold (base = 2010)
2011 -4242.38*(2558.31)
-4452.78*(2556.11)
-5196.43**(2571.42)
-11789.81**(2324.45)
-11656.71**(2333.32)
-13487.34**(2341.30)
2012 13433.97**(2547.25)
11781.79**(2527.26)
11177.65**(2598.50)
4945.78**(2451.183)
4916.47**(2448.86)
1973.71(2478.06)
2013 42495.08**(2527.32) 40240.67**(2524.12) 48393.3**(2643.05) 35217.38**(2371.70) 35044.47**(2363.39) 37729.93**(2585.56)
Fixed Effects – NeighborhoodNeighborhoods Omitted Omitted Omitted
Constant -134512.6**(8212.86)
79430.42**(23553.78)
-144013**(8339.02)
-136431.1**(8131.03)
21815.01(23338.97)
-125847.6**(8234.96)
169374.2**(14105.38)
194468.7**(27842.26)
178447.3**(14365.38)
R-squared 0.59 0.59 0.58 0.60 0.60 0.59 0.70 0.69 0.70* Significantly different from zero with 90% confidence.** Significantly different from zero with 95% confidence.

8/12/2019 Oregon Property Tax Capitalization report
http://slidepdf.com/reader/full/oregon-property-tax-capitalization-report 29/35
27OREGON PROPERTY TAX CAPITALIZATION: EVIDENCE FROM PORTLAND
Oregon’s Electric Vehicle Industry
Northwest Economic Research Center
Table IV - Property sale price regression results with school and neighborhood characteristics. . Dependent variable: Sale price. (n=21216)
III-I(a) I II-I(b) III-I(c) III-II(a) III-II(b) III-II(c)Property Characteristics
Size of property (sqft)164.06**
(3.07)164.03**
(3.07)165.96**
(3.14)165.96**
(3.14)165.88**
(3.18)165.84**
(3.19)
Age of property-76.02**(34.72)
-62.82*(33.92)
-93.53**(36.06)
-81.64**(35.30)
-95.04**(35.95)
-84.68**(35.18)
Tax Characteristics
AV/RMV ratio -345.12**(67.54) -319.33**(67.33) -310.39**(67.52)
Effective tax rate (mills)-1985.21**
(383.84)-1835.66**
(383.33)-1766.49**
(381.84)
School Characteristics
Reading score1005.51**(146.40)
1036.38**(147.49)
1150.78**(146.80)
1181.60**(147.89)
1144.85**(147.10)
1172.08**(148.06)
Math score462.22**(126.59)
428.56**(126.69)
410.33**(126.31)
378.41**(126.40)
414.06**(126.90)
385.11**(127.12)
Neighborhood Characteristics
Distance to CBD-28773.46**
(702.10)-29035.75**
(661.03)-26714.68**
(855.78)-26925.35**
(824.63)-26749.76**
(850.29)-26965.56**
(818.84)
Walk Score ®299.23**(81.35)
303.77**(81.42)
313.90**(82.33)
325.42**(82.56)
Crime rate per 1000-7480.78
(13323.83)-11180.14(13295.42)
Fixed Effects – Year sold (base = 2010) 2011
-16138.94**(2479.90)
-16387.63**(2479.57)
-16422.04**(2483.07)
-16654.52**(2482.35)
-11491.54**(2473.94)
-16736.22**(2474.68)
2012-696.30
(2457.47)-1230.60(2490.98)
-1071.76(2460.97)
-1569.195(2494.28)
-1173.51(2454.79)
-1685.06(2470.63)
201331382.46**(2423.29)
32661.75**(2530.01)
31089.68**(2423.79)
32270.01**(2531.66)
31011.08**(2420.52)
32121.99**(2527.02)
Constant81457.21**(7405.97)
86266.8**(7722.52)
42712.21**(11505.74)
46577.58**(11737.05)
42440.79**(11475.12)
46078.11**(11697.75)
R-squared 0.64 0.64 0.64 0.64 0.64 0.64
* Significantly different from zero with 90% confidence.** Significantly different from zero with 95% confidence.
Table V - Instrumental variableregression results with schooland neighborhood characteristics.Dependent variable: Sale price.(n=21216)
IVProperty Characteristics
Size of property (sqft)166.25**
(3.26)
Age of property-1622.76**
(128.86)
Tax Characteristics
AV/RMV ratio-6374.25**
(447.71)
School Characteristics
Reading score3500.60**(272.09)
Math score39.89
(176.97)
Neighborhood Characteristics
Distance to CBD-5949.47**(1729.37)
Fixed Effects – Year sold (base = 2010)
2011 44687.62**(5481.80)
201278550.89**(6598.84)
201394671.16**(5522.21)
Constant257221.7**(16156.86)
R-squared 0.48
* Significantly different from zero with 90% confidenc** Significantly different from zero with 95% confiden

8/12/2019 Oregon Property Tax Capitalization report
http://slidepdf.com/reader/full/oregon-property-tax-capitalization-report 30/35
28
OREGON PROPERTY TAX CAPITALIZATION: EVIDENCE FROM PORTLAND
Northwest Economic Research Center
V. FURTHER RESEARCH
In order to deal with potential selection bias and endogeneity that may exist within our sampleof home sales, we may be able to construct a time series dataset that includes multiple sales ofthe same properties. In this alternative specification, we can then employ the change in saleprices as the dependent variable, and changes in property characteristics, property taxcharacteristics, neighborhood/location characteristics and public service characteristics asexplanatory variables. Additional socioeconomic and demographic data from the Census orAmerican Community Survey (ACS) may also be incorporated into the analysis to provideadditional instruments for statistical issues, and to provide better controls for neighborhoodheterogeneity.
Before Measure 50 was implemented, home values were re-evaluated on a 7 year rollingschedule. When Measure 50 was implemented, assessed values were set at 90% of 1995-1996tax rolls. Home values may or may not have been subject to a recent re-evaluation, adding an
8/12/2019 Oregon Property Tax Capitalization report
http://slidepdf.com/reader/full/oregon-property-tax-capitalization-report 31/35
29
OREGON PROPERTY TAX CAPITALIZATION: EVIDENCE FROM PORTLAND
Northwest Economic Research Center
additional layer of arbitrary treatment of properties in the property tax system. If we are able toobtain data on when the most recent re-assessment occurred before Measure 50, it may enableus to better explain more of the property tax variations.
One method of estimating how differences in property tax treatment can capitalize into propertyvalues is to utilize the difference-in-difference (DID) approach. This approach was popularized byCard and Krueger (1994) in their article studying the effects of increasing minimum wages in NewJersey by including Pennsylvania (which did not have an increase in minimum wage) as a control.Because of Portland metropolitan area’s unique geographic location with portions located inboth Oregon and Washington, we may be able to adopt the DID approach with property datafrom neighboring Oregon and Washington counties to isolate the impacts of differential propertytax regimes. Additionally, this approach may also be applied across different Oregon jurisdictionsthat experienced booms in property development during varying time periods (before and after
Measure 5 and 50 were implemented).
8/12/2019 Oregon Property Tax Capitalization report
http://slidepdf.com/reader/full/oregon-property-tax-capitalization-report 32/35
30
OREGON PROPERTY TAX CAPITALIZATION: EVIDENCE FROM PORTLAND
Northwest Economic Research Center
VI. CONCLUSIONS
Based on our estimation results, we believe that Oregon’s property tax structure is significantlyaffecting home sale prices in Portland. Statistical issues prevent us from confidently stating theexact size of the effect, but the consistent sign and high significance of the estimated coefficientslead us to that conclusion. The structure of the tax is creating a distortion in the market forhouses and condos, which benefits certain property owners (and harms others) for reasons thatare arbitrary from a policy perspective.
Changes in the ratio between assessed value (AV) and real market value (RMV) are driven mostlyby changes in RMV; in areas where RMV has risen quickly, this gap grows. Our study indicatesthat this gap adds additional value to homes, exacerbating existing inequities. Property owners
living in areas where RMV rises quickly relative to AV are enjoying an increase in their propertyvalue that is not derived from property or neighborhood improvements. Instead this increase isa by-product of a property tax system separated from the market.
Expanding this analysis was beyond the scope of the project, but it is reasonable to expect thesedynamics to be present in other parts of Oregon. In cities where properties in differentneighborhoods or areas have appreciated faster than in others since the passage of Measures 5and 50, we would expect to see similar results. The size of the distortion would vary based onlocal characteristics, but we would expect to see evidence of capitalization.
Because these inequities are concentrated in areas where residential values have increasedrapidly relative to AV, the property tax system creates a hidden subsidy for these propertyowners. Some of the burden of funding government and school services is transferred away fromthese homeowners. This results in revenue shortfalls, or creates the need for property ownersin areas with a smaller increase in RMV to disproportionately fill the gap. The unequaldistribution of funding responsibility created by the property tax system may clash with existinggovernment priorities in a way that is not understood by policymakers or voters.
8/12/2019 Oregon Property Tax Capitalization report
http://slidepdf.com/reader/full/oregon-property-tax-capitalization-report 33/35
31
OREGON PROPERTY TAX CAPITALIZATION: EVIDENCE FROM PORTLAND
Northwest Economic Research Center
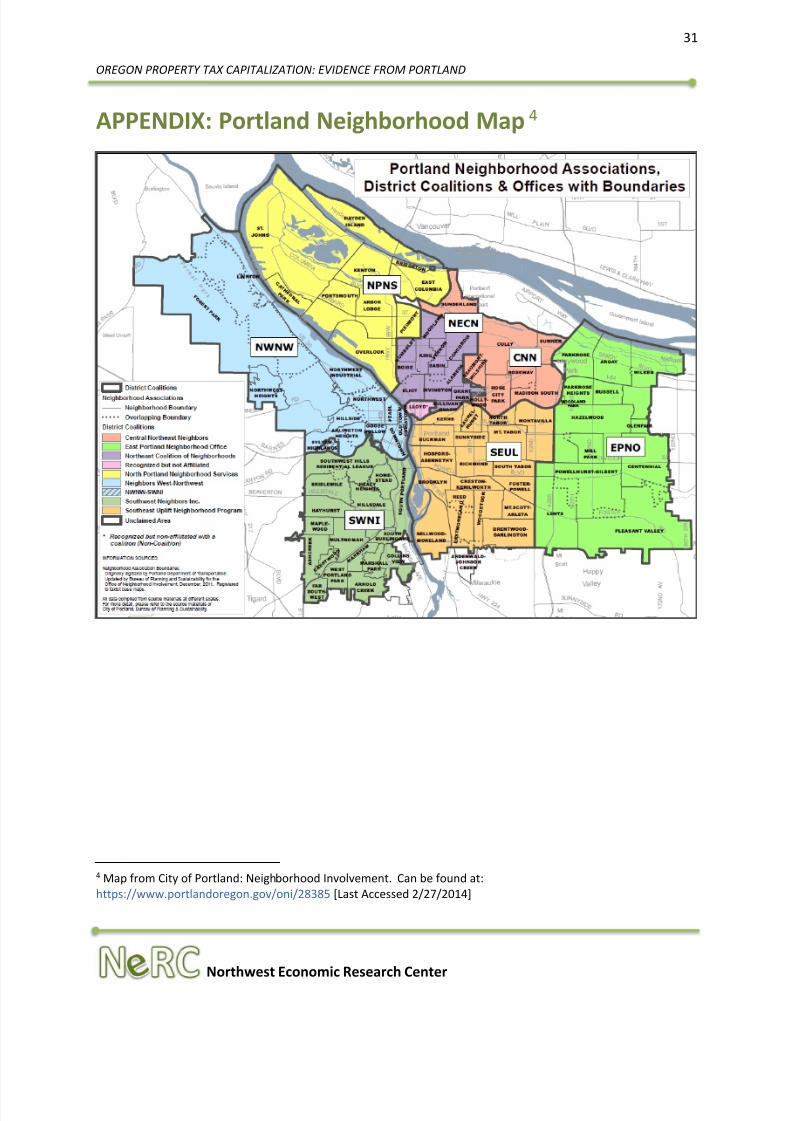
APPENDIX: Portland Neighborhood Map 4
4 Map from City of Portland: Neighborhood Involvement. Can be found at:https://www.portlandoregon.gov/oni/28385 [Last Accessed 2/27/2014]
8/12/2019 Oregon Property Tax Capitalization report
http://slidepdf.com/reader/full/oregon-property-tax-capitalization-report 34/35
32
OREGON PROPERTY TAX CAPITALIZATION: EVIDENCE FROM PORTLAND
Northwest Economic Research Center
BIBLIOGRAPHY
Bradbury, K. L., Mayer, C. J., & Case, K. E. (2001). Property tax limits, local fiscal behavior, and
property values: Evidence from Massachusetts under Proposition 212. Journal of PublicEconomics , 80(2), 287-311.
City Club of Portland. (November 7, 2013). Reconstructing Oregon’s Franken tax: Improving theEquity, Financial Sustainability, and Efficiency of Property Taxes. City Club of PortlandBulletin, Vol. 95, No. 8. Retrieved fromhttp://www.pdxcityclub.org/2013/Report/Oregon-Property-Tax/HTML
Downes, T. A., & Zabel, J. E. (2002). The impact of school characteristics on house prices:Chicago 1987 –1991. Journal of Urban Economics , 52(1), 1-25.
Hamilton, B. W. (1976). Capitalization of intrajurisdictional differences in local tax prices. The American Economic Review , 66(5), 743-753.

8/12/2019 Oregon Property Tax Capitalization report
http://slidepdf.com/reader/full/oregon-property-tax-capitalization-report 35/35
33
OREGON PROPERTY TAX CAPITALIZATION: EVIDENCE FROM PORTLAND
Linhares, T., & Provost, E. (December 2011). Recent History of Oregon’s Property Tax System:With an Emphasis on its Impact on Multnomah County Local Governments . Retrievedfrom http://www.tsccmultco.com/graphics/Recent_History_jan_2012.pdf
Mieszkowski, P. (1969). Tax incidence theory: the effects of taxes on the distribution ofincome. Journal of Economic Literature , 7 (4), 1103-1124.
Oregon Department of Revenue. (2009). A Brief History of Oregon Property Taxation. Retrievedfrom http://www.oregon.gov/dor/STATS/docs/303-405-1.pdf
Oregon Department of Revenue. (2013). Oregon Property Tax Statistics (150-303-405) | fromfiscal year 1997-98 to present [Data file]. Retrieved fromhttp://www.oregon.gov/dor/STATS/Pages/statistics.aspx#property
Ross, S., & Yinger, J. (1999). Sorting and voting: A review of the literature on urban publicfinance. Handbook of regional and urban economics , 3, 2001-2060.
Rosen, K. T. (1982). The impact of Proposition 13 on house prices in Northern California: A testof the interjurisdictional capitalization hypothesis. The Journal of Political Economy ,90(1), 191-200.
Zodrow, G. R. (2007). The property tax as a capital tax: A room with three views. National Tax Journal , 54(1), 139-156.