OREGON JUDICIAL DEPARTMENT - Oregon State...
68
OREGON JUDICIAL DEPARTMENT AFFIRMATIVE ACTION REPORT Issued: JANUARY 2011
Transcript of OREGON JUDICIAL DEPARTMENT - Oregon State...
OREGON JUDICIAL DEPARTMENT
AFFIRMATIVE ACTION REPORT
Issued: JANUARY 2011
TABLE OF CONTENTS
AFFIRMATIVE ACTION STATEMENT i I. AFFIRMATIVE ACTION REPORT ..............................................................1
A. Purpose ..............................................................................................1 B. Policy ..................................................................................................1
II. ORGANIZATION AND FUNCTIONS ...........................................................1
A. Overview ............................................................................................1 B. Appellate and Tax Courts ...................................................................2 C. Office of the State Court Administrator...............................................2 D. Circuit Courts ......................................................................................2
III. OREGON’S JUDICIAL DISTRICTS ............................................................3 IV. EEO/AA RESPONSIBILITIES AND DUTIES ..............................................4
A. Chief Justice and State Court Administrator ......................................4 B. Human Resource Services Director ...................................................4 C. Administrative Authorities ...................................................................5 D. Managers and Supervisors ................................................................5 E. Employees Who Regularly Represent the Department to External
Organizations .....................................................................................5 V. UTILIZATION ANALYSIS ............................................................................6 VI. DATA DURING PERIOD OF REPORT .......................................................8 VII. SUMMARY OF FINDINGS ........................................................................ 11 VIII. JUDICIAL DEPARTMENT NEW AND ONGOING INITIATIVES ............. 16 IX. 2011-2013 AFFIRMATIVE ACTION GOALS AND STRATEGIES .......... 19
APPENDIX
Workforce Analysis by EEO Category – Departmentwide ........................ 20
Utilization Analysis by Gender, Race and Disability - Statewide Summary: All Categories ........................................................................... 21
Utilization Analysis by Gender, Race and Disability - Statewide Summary: Officials and Administrators Category ..................................... 22
Utilization Analysis by Gender, Race and Disability - Statewide Summary: Professionals Category ............................................................ 23
Utilization Analysis by Gender, Race and Disability - Statewide Summary: Technicians Category .............................................................. 24 Utilization Analysis by Gender, Race and Disability - Salem PMSA (Marion and Polk): Service and Maintenance Category ............... 25 Utilization Analysis by Gender, Race and Disability – County Summary: Administrative Support Category ............................................ 26
Utilization Analysis by Gender, Race and Disability - Salem PMSA (Marion and Polk), OSCA and Appellate Courts only: Administrative Support Category ............................................................... 27
Utilization Analysis by Gender, Race and Disability - Individual County Summaries: Administrative Support Category ....................... 28 - 63
1
I. AFFIRMATIVE ACTION REPORT
A. Purpose
This Affirmative Action Report has been developed to assure that the Oregon Judicial Department (OJD) is providing equal employment opportunities.
B. Policy
OJD’s rule on Equal Employment Opportunity is set forth in the Judicial Department Personnel Rules as follows:
Rule 5, Equal Employment Opportunity
All recruitment, hiring, training, promotions, transfers, and administration of all personnel policies, procedures, practices, programs, and services shall be conducted or administered without regard to race, color, religion, national origin, sex, political affiliation, age, marital status, mental or physical disability, or sexual orientation.
Administrative authorities are required to assure that equal employment opportunity provisions are applied to all employment practices. (Also see the OJD Policy on Unlawful Discrimination and Harassment.)
II. ORGANIZATION AND FUNCTIONS
A. Overview
OJD is created in Article III, Section 1, of the Oregon Constitution. The Chief Justice is responsible for the administration of the judicial branch of government and is designated as the administrative head of OJD which includes the appellate, tax, and circuit courts. It is the Chief Justice’s responsibility to promulgate a personnel plan for all officers and employees of the courts governing appointment, compensation, promotion, discipline, and all other aspects of employment. The Chief Justice is also charged with the duty of supervising a statewide plan for budgeting, accounting, and fiscal management of OJD. The department has 1,611 employees as of September 30, 2010. Judges are elected officials and not employees and, as such, not subject to the report. There are a total of 191 judges in the Oregon appellate, tax, and circuit courts.
2
B. Appellate and Tax Courts
The Supreme Court consists of seven justices and is the court of last appellate resort in the state court system. The Court of Appeals consists of ten judges who hear appeals from circuit courts, agencies, and boards. One Tax Court judge hears matters arising from Oregon tax law. The Tax Magistrate Division includes three tax magistrates, appointed by the Tax Judge, who oversee less formal tax appeal proceedings.
C. Office of the State Court Administrator
ORS Chapter 8 (primarily) establishes and defines the duties of the Office of the State Court Administrator. The State Court Administrator serves under the direction of the Chief Justice. The State Court Administrator is generally responsible for certain centralized functions of the unified Oregon State court system including legal counsel, internal audit, judicial and staff education, enterprise technology systems, budget and financial administration, court statistics and program support, human resource management, and intergovernmental relations. Administration of the Citizens Review Board Program, Court Interpreter Services Program, State of Oregon Law Library, and Appellate Court Records Section are also funded and managed within the office.
D. Circuit Courts
The circuit courts are general jurisdiction trial courts located in each of the 36 counties, organized as 27 judicial districts, and served by 173 judges (as of September 30, 2010). These courts adjudicate matters and disputes in criminal, civil, domestic relations, traffic, juvenile, small claims, violations, abuse prevention act, probate, civil commitment, adoption, and guardianship cases.
Pursuant to ORS 1.003, the Chief Justice has appointed 27 judges to serve as presiding judge in each district for administrative purposes. Their general authority is described in ORS 1.171. The nonjudicial operations of the circuit courts are managed by 27 trial court administrators who are appointed and supervised by the presiding judges. Their general authority is described in ORS 8.225. Their duties include personnel administration, budget and financial management, court operations, and jury management.

3
III. OREGON’S JUDICIAL DISTRICTS
There are 27 judicial districts with a circuit court in each county. 1st Judicial District Jackson County 2nd Judicial District Lane County 3rd Judicial District Marion County 4th Judicial District Multnomah County 5th Judicial District Clackamas County 6th Judicial District Morrow and Umatilla Counties 7th Judicial District Gilliam, Hood River, Sherman,
Wasco, and Wheeler Counties 8th Judicial District Baker County 9th Judicial District Malheur County 10th Judicial District Union and Wallowa Counties 11th Judicial District Deschutes County 12th Judicial District Polk County 13th Judicial District Klamath County
14th Judicial District Josephine County 15th Judicial District Coos and Curry Counties 16th Judicial District Douglas County 17th Judicial District Lincoln County 18th Judicial District Clatsop County 19th Judicial District Columbia County 20th Judicial District Washington County 21st Judicial District Benton County 22nd Judicial District Crook and Jefferson Counties 23rd Judicial District Linn County 24th Judicial District Grant and Harney Counties 25th Judicial District Yamhill County 26th Judicial District Lake County 27th Judicial District Tillamook County
4
IV. EEO/AA RESPONSIBILITIES AND DUTIES
A. Chief Justice and State Court Administrator
The Chief Justice has committed OJD to a policy of equal employment opportunity. The Chief Justice has delegated the overall administrative responsibility for ensuring equal employment opportunity to the State Court Administrator through the OJD Personnel Rules.
B. Human Resource Services Director
The Human Resource Services Director, as directed by the State Court Administrator, has day-to-day responsibility for the implementation of the Equal Employment Opportunity (EEO) Plan. Such responsibility includes:
1. Developing and monitoring the department’s written EEO Plan. The plan is periodically updated as deemed appropriate by the Human Resource Services Director.
2. Disseminating the plan internally.
3. Assisting trial court administrators, managers, and supervisors as necessary.
4. Providing employee counseling related to informal discrimination complaints.
5. Auditing and insuring that all OJD policies are in compliance with equal opportunity (and affirmative action) laws and regulations.
6. Serving as liaison between the department and enforcement agencies.
7. Identifying the need for and developing EEO management and supervisory training programs.
8. Assisting hiring authorities in broad dissemination of recruitment announcements in order to attract diverse applicant pools.
5
C. Administrative Authorities
Within their respective jurisdictions, administrative authorities are responsible for:
1. Establishing a positive climate for equal employment.
2. Evaluating subordinate managers and supervisors on the basis of their EEO practices.
3. Assuring that all personnel practices and procedures, including training, hiring, and promoting, are applied equally and in compliance with OJD Personnel Rule 5.
4. Communicating the availability of the department’s Affirmative Action Report to each judge and each manager and supervisor.
5. Reviewing diversity goals and employing outreach strategies to achieve such goals.
D. Managers and Supervisors
The following responsibilities are assigned to managers and supervisors as it relates to employees under their supervision:
1. Establishing a positive climate for equal employment.
2. Assuring that all personnel practices and procedures, including training, hiring, and promotion, are applied equally and in compliance with OJD Personnel Rule 5.
3. Taking necessary action(s) to prevent discrimination and/or harassment.
4. Reviewing diversity goals and employing outreach strategies to achieve such goals.
E. Employees Who Regularly Represent the Department to External Organizations
Employees who regularly present information to external organizations should, when feasible, make a statement that affirms OJD’s commitment to workforce diversity and that employment applications are welcome from all qualified persons.
6
V. UTILIZATION ANALYSIS
The goal of OJD is to have an employee workforce which reflects the Oregon labor force in terms of the representation of women, people of color, and persons with disabilities. To determine how close OJD is to this goal, the following steps were taken:
A. The Oregon labor force was identified in the “Census 2000 EEO Data Tool” published by the U.S. Census Bureau. This report outlines EEO residence data for each occupational category by race and ethnicity.
B. The Oregon labor force was summarized by EEO job categories (as defined by current EEOC guidelines).
C. OJD workforce was summarized by county and by EEO job categories based on the workforce as of September 30, 2010.
D. A form requesting information on race/ethnicity and disability status is provided to new employees.
E. OJD workforce was compared with the Oregon labor force.
County labor force data was used to evaluate the EEO job categories of Administrative Support and Service and Maintenance. In the Administrative Support job category, this equals 73.43 percent of the OJD workforce. Most persons who apply for jobs in these two job categories reside within the county where the jobs are located.
Statewide labor force data was used to evaluate the remaining EEO job categories of Officials and Administrators, Professionals, and Technicians. These jobs tend to attract applicants from all areas of the state as well as outside the state. In addition, they represent such a small number of positions per circuit court that a countywide utilization analysis would be irrelevant.
The analysis of OJD’s workforce included individual racial/ethnic groups and also a combined total of all racial/ethnic groups. The analysis further separates the racial/ethnic groups and job categories by gender.
The analysis also included a report (by county) of the department’s (self-reported) disabled workforce and is compared to the state’s disabled workforce published by the Employment Department as of October 2004. This report is not separated by occupational category therefore the data is less exact.
7
In determining the FTE underutilization, all fractions were dropped, rounding down to the nearest whole number.
A designation was added to this Affirmative Action Report (as of 2003) to provide employees the option of choosing “multi-racial/ethnic” (now titled “two or more races”) as their primary designation. (Employees so electing were also asked to select from among the state of Oregon’s recognized racial/ethnic categories for reporting purposes.) A work force analysis report in the Appendix reflects this information. The percentage of employees designating “two or more races” decreased from the previous report period (4.48 percent) to 4.15 percent. During the 2009 report period, OJD revised the racial/ethnic categories as directed by the U.S. Department of Justice, Office of Justice Programs. The revision (from five racial/ethnic categories to seven) brings the OJD into compliance with the reporting requirements for obtaining federal grant monies. As a result, a new census survey was conducted and a database was developed to store and analyze the information. In addition to reporting to the U.S. Department of Justice, OJD is using the revised categories to report to the Oregon Legislature. (Note: The State of Oregon still uses the five racial/ethnic categories as required to report to the U.S. Equal Employment Opportunity Commission. The OJD reports this information to the Executive Branch using a “cross-walk” matrix.) During this report period, OJD experienced unprecedented budget shortfalls which no doubt have impacted the percentages of the workforce in the race/ethnicity categories (since new, and even replacement, hiring was at a minimum). For example, the number of regular status vacancies filled was 531 (July 2006 – June 2008) and was 214 (July 2008 – June 2010). The changes are also evidenced by the reduction of 132 employees in the total OJD workforce since the last report period. OJD experienced a budgetary inability to fill many mission-critical positions after employees separated, and some courts and divisions had to effect layoffs. As an example, the Court Programs and Services Division of the Office of the State Court Administrator was abolished during this report period. This resulted in laying off 32 employees and reassigning a few employees. Budget shortfalls are expected to continue in the 2011-13 biennium.
8
VI. DATA DURING PERIOD OF REPORT
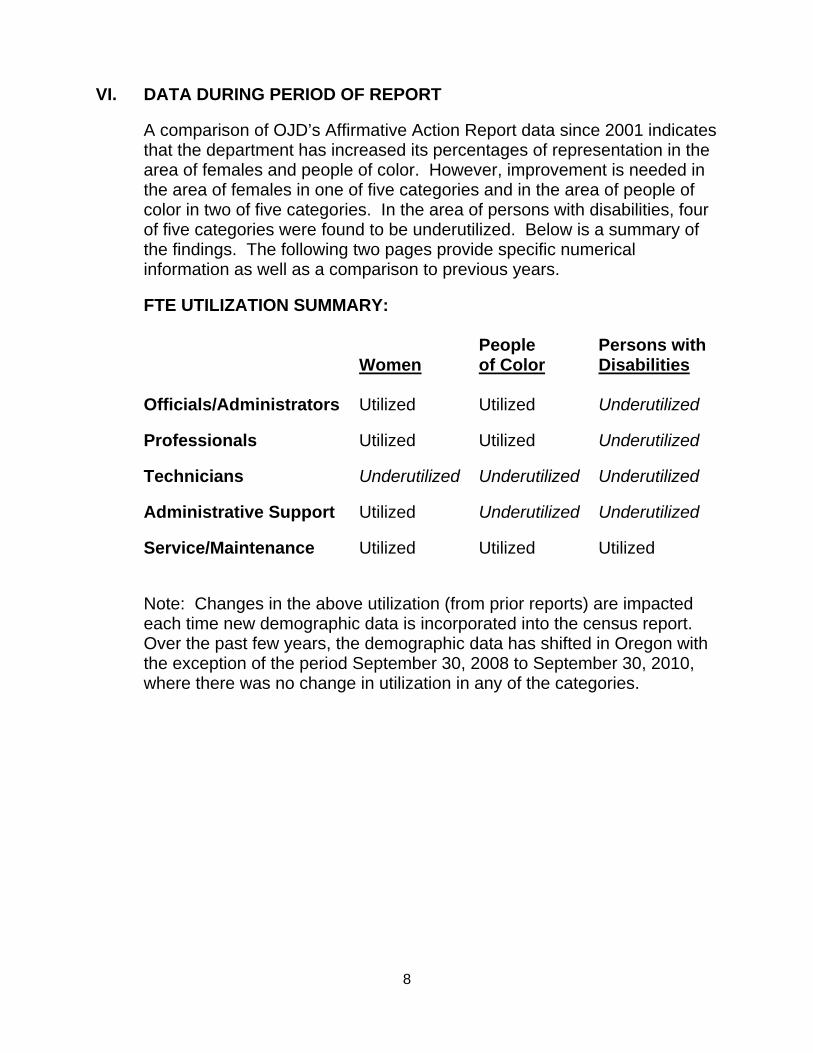
A comparison of OJD’s Affirmative Action Report data since 2001 indicates that the department has increased its percentages of representation in the area of females and people of color. However, improvement is needed in the area of females in one of five categories and in the area of people of color in two of five categories. In the area of persons with disabilities, four of five categories were found to be underutilized. Below is a summary of the findings. The following two pages provide specific numerical information as well as a comparison to previous years.
FTE UTILIZATION SUMMARY:
People Persons with Women of Color Disabilities Officials/Administrators Utilized Utilized Underutilized
Professionals Utilized Utilized Underutilized
Technicians Underutilized Underutilized Underutilized
Administrative Support Utilized Underutilized Underutilized
Service/Maintenance Utilized Utilized Utilized
Note: Changes in the above utilization (from prior reports) are impacted each time new demographic data is incorporated into the census report. Over the past few years, the demographic data has shifted in Oregon with the exception of the period September 30, 2008 to September 30, 2010, where there was no change in utilization in any of the categories.
9
9
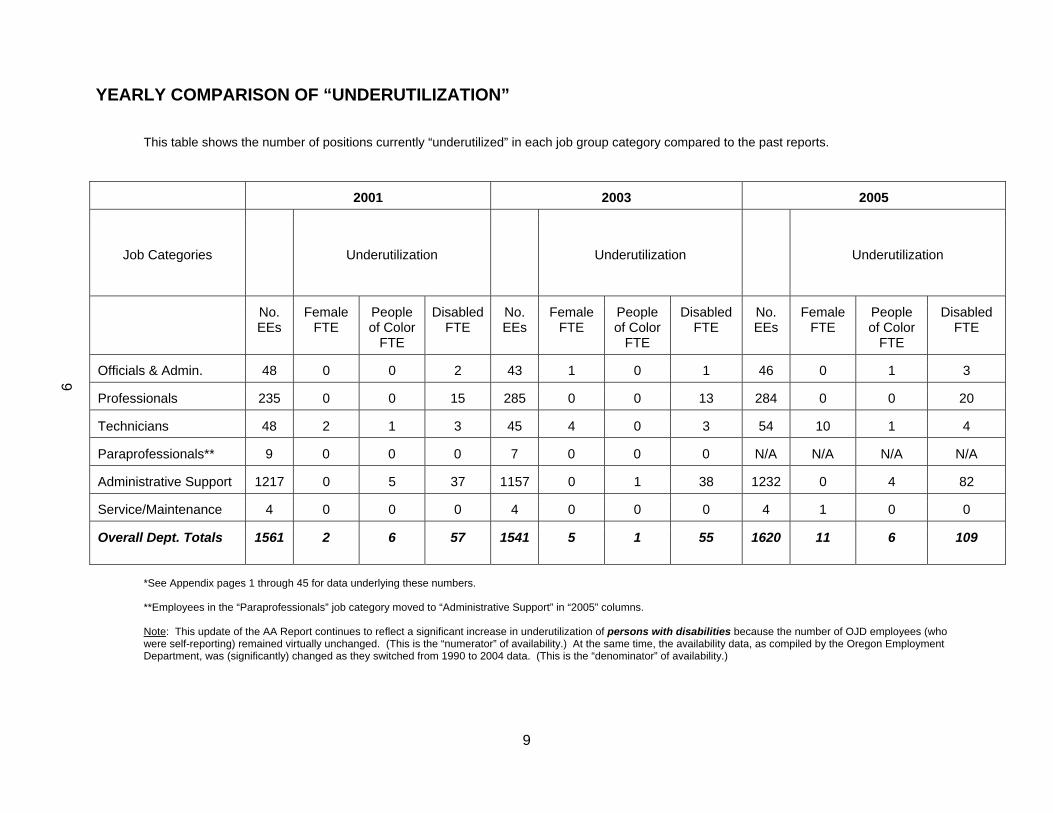
YEARLY COMPARISON OF “UNDERUTILIZATION”
This table shows the number of positions currently “underutilized” in each job group category compared to the past reports.
2001 2003 2005
Job Categories
Underutilization
Underutilization
Underutilization
No. EEs
Female FTE
People of Color
FTE
Disabled FTE
No. EEs
Female FTE
People of Color
FTE
Disabled FTE
No. EEs
Female FTE
People of Color
FTE
Disabled FTE
Officials & Admin. 48 0 0 2 43 1 0 1 46 0 1 3
Professionals 235 0 0 15 285 0 0 13 284 0 0 20
Technicians 48 2 1 3 45 4 0 3 54 10 1 4
Paraprofessionals** 9 0 0 0 7 0 0 0 N/A N/A N/A N/A
Administrative Support 1217 0 5 37 1157 0 1 38 1232 0 4 82
Service/Maintenance 4 0 0 0 4 0 0 0 4 1 0 0
Overall Dept. Totals 1561 2 6 57 1541 5 1 55 1620 11 6 109
*See Appendix pages 1 through 45 for data underlying these numbers.
**Employees in the “Paraprofessionals” job category moved to “Administrative Support” in “2005” columns.
Note: This update of the AA Report continues to reflect a significant increase in underutilization of persons with disabilities because the number of OJD employees (who were self-reporting) remained virtually unchanged. (This is the “numerator” of availability.) At the same time, the availability data, as compiled by the Oregon Employment Department, was (significantly) changed as they switched from 1990 to 2004 data. (This is the “denominator” of availability.)
10
10
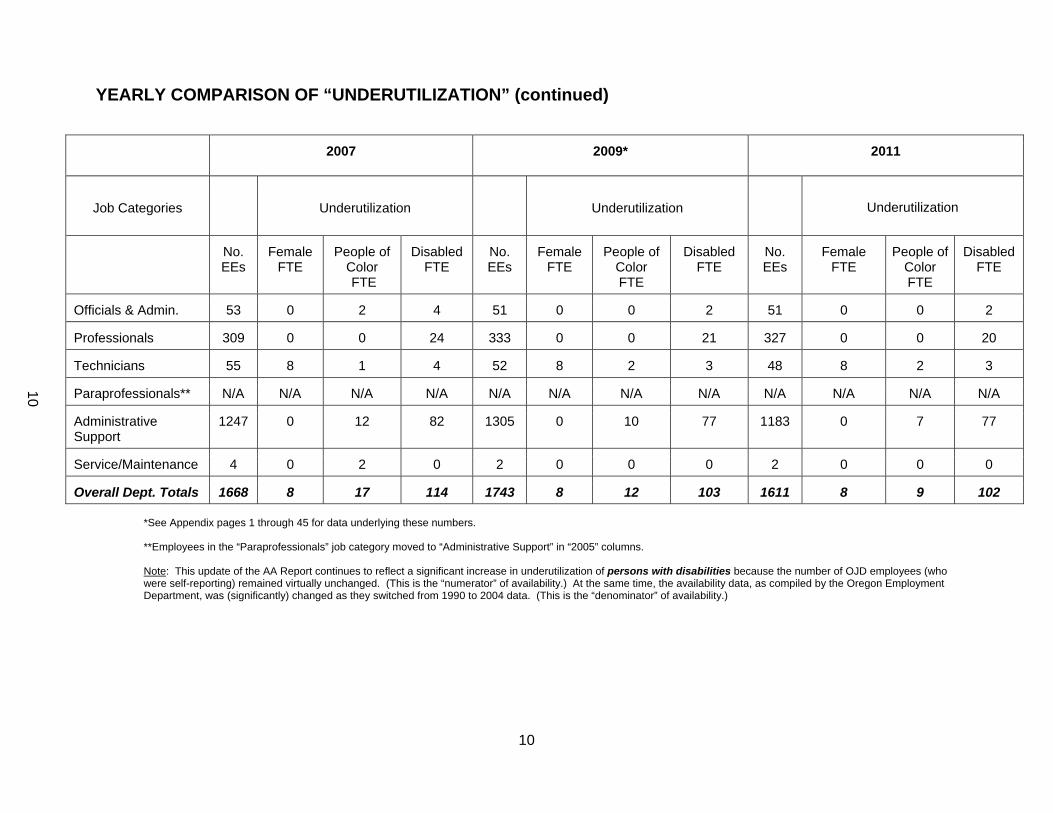
YEARLY COMPARISON OF “UNDERUTILIZATION” (continued)
2007 2009* 2011
Job Categories
Underutilization
Underutilization
Underutilization
No. EEs
Female FTE
People of Color FTE
Disabled FTE
No. EEs
Female FTE
People of Color FTE
Disabled FTE
No. EEs
Female FTE
People of Color FTE
Disabled FTE
Officials & Admin. 53 0 2 4 51 0 0 2 51 0 0 2
Professionals 309 0 0 24 333 0 0 21 327 0 0 20
Technicians 55 8 1 4 52 8 2 3 48 8 2 3
Paraprofessionals** N/A N/A N/A N/A N/A N/A N/A N/A N/A N/A N/A N/A
Administrative Support
1247 0 12 82 1305 0 10 77 1183 0 7 77
Service/Maintenance 4 0 2 0 2 0 0 0 2 0 0 0
Overall Dept. Totals 1668 8 17 114 1743 8 12 103 1611 8 9 102
*See Appendix pages 1 through 45 for data underlying these numbers.
**Employees in the “Paraprofessionals” job category moved to “Administrative Support” in “2005” columns.
Note: This update of the AA Report continues to reflect a significant increase in underutilization of persons with disabilities because the number of OJD employees (who were self-reporting) remained virtually unchanged. (This is the “numerator” of availability.) At the same time, the availability data, as compiled by the Oregon Employment Department, was (significantly) changed as they switched from 1990 to 2004 data. (This is the “denominator” of availability.)
11
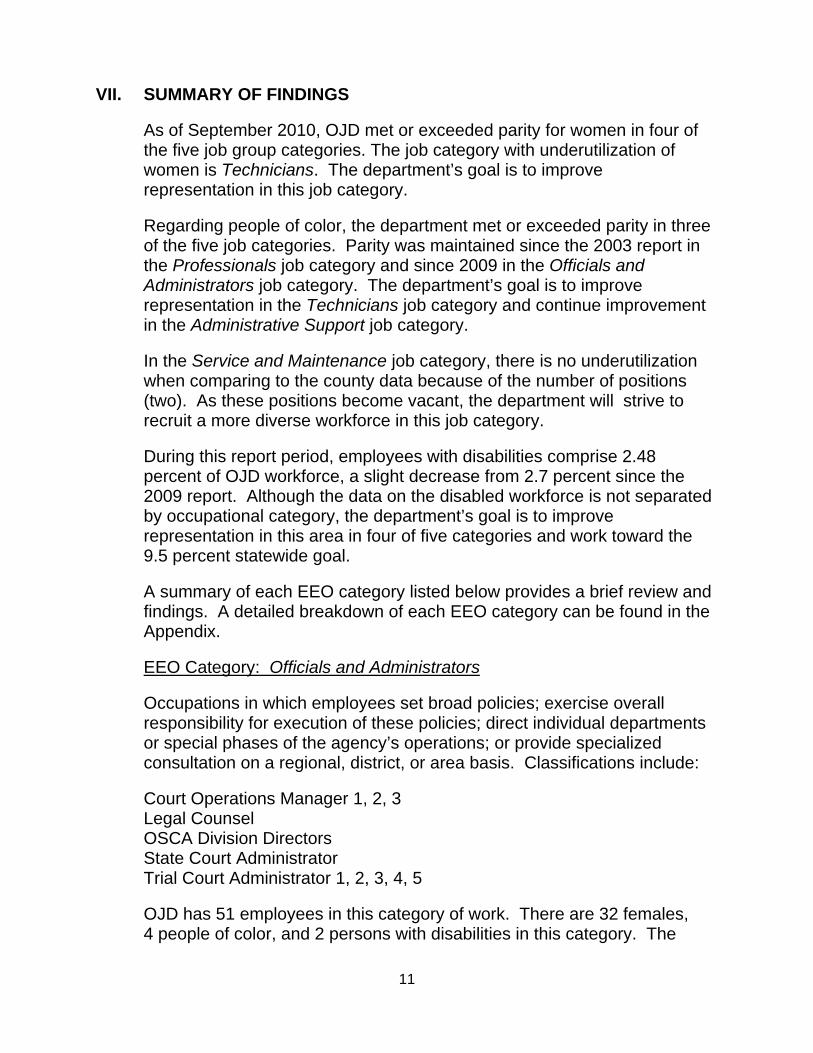
VII. SUMMARY OF FINDINGS
As of September 2010, OJD met or exceeded parity for women in four of the five job group categories. The job category with underutilization of women is Technicians. The department’s goal is to improve representation in this job category.
Regarding people of color, the department met or exceeded parity in three of the five job categories. Parity was maintained since the 2003 report in the Professionals job category and since 2009 in the Officials and Administrators job category. The department’s goal is to improve representation in the Technicians job category and continue improvement in the Administrative Support job category.
In the Service and Maintenance job category, there is no underutilization when comparing to the county data because of the number of positions (two). As these positions become vacant, the department will strive to recruit a more diverse workforce in this job category.
During this report period, employees with disabilities comprise 2.48 percent of OJD workforce, a slight decrease from 2.7 percent since the 2009 report. Although the data on the disabled workforce is not separated by occupational category, the department’s goal is to improve representation in this area in four of five categories and work toward the 9.5 percent statewide goal.
A summary of each EEO category listed below provides a brief review and findings. A detailed breakdown of each EEO category can be found in the Appendix.
EEO Category: Officials and Administrators
Occupations in which employees set broad policies; exercise overall responsibility for execution of these policies; direct individual departments or special phases of the agency’s operations; or provide specialized consultation on a regional, district, or area basis. Classifications include:
Court Operations Manager 1, 2, 3 Legal Counsel OSCA Division Directors State Court Administrator Trial Court Administrator 1, 2, 3, 4, 5
OJD has 51 employees in this category of work. There are 32 females, 4 people of color, and 2 persons with disabilities in this category. The
12
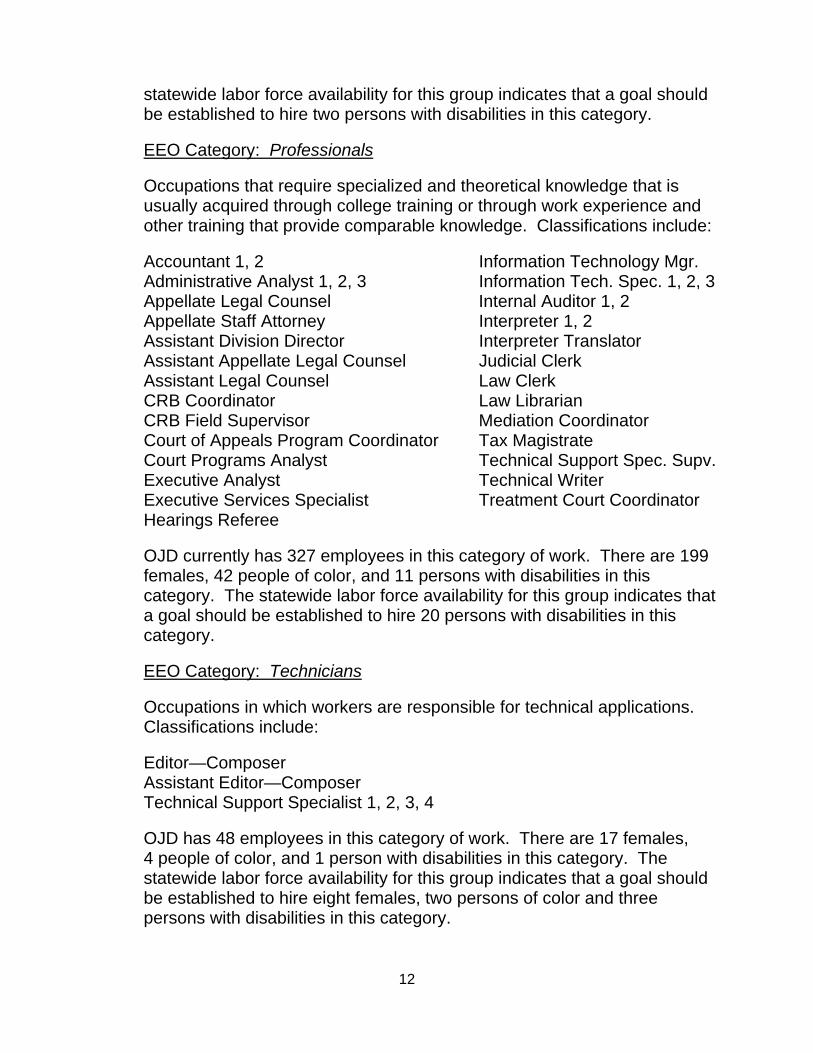
statewide labor force availability for this group indicates that a goal should be established to hire two persons with disabilities in this category.
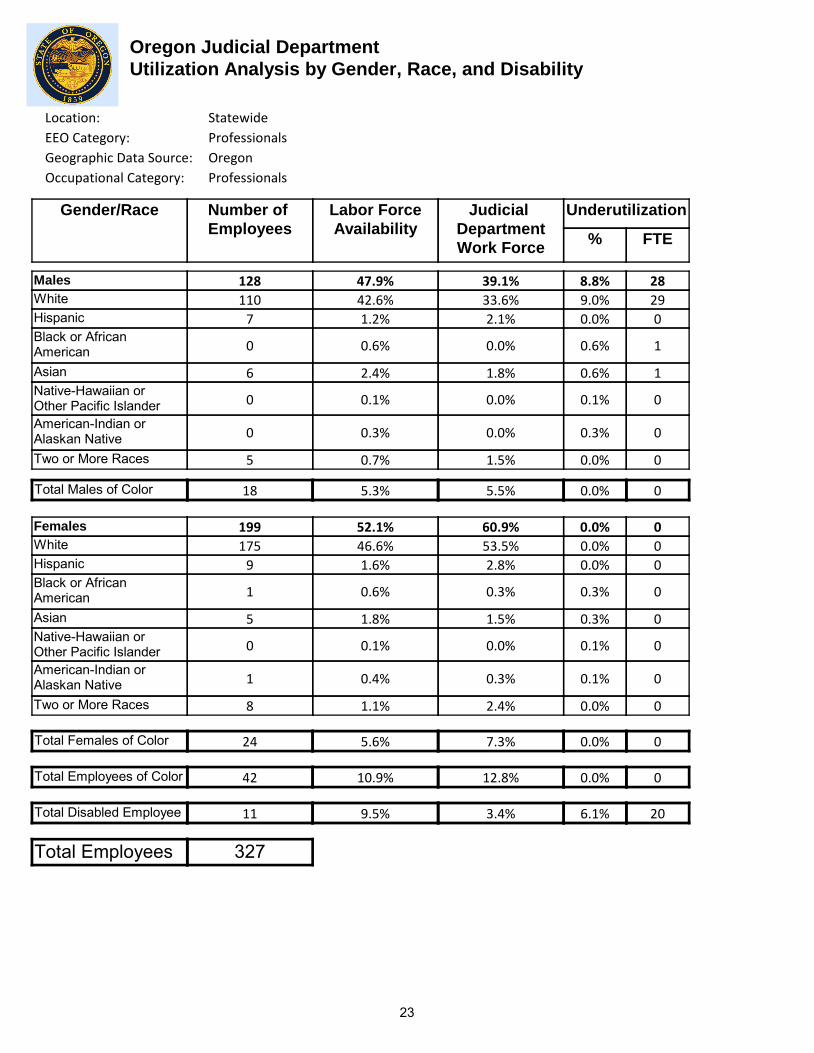
EEO Category: Professionals
Occupations that require specialized and theoretical knowledge that is usually acquired through college training or through work experience and other training that provide comparable knowledge. Classifications include:
Accountant 1, 2 Information Technology Mgr. Administrative Analyst 1, 2, 3 Information Tech. Spec. 1, 2, 3 Appellate Legal Counsel Internal Auditor 1, 2 Appellate Staff Attorney Interpreter 1, 2 Assistant Division Director Interpreter Translator Assistant Appellate Legal Counsel Judicial Clerk Assistant Legal Counsel Law Clerk CRB Coordinator Law Librarian CRB Field Supervisor Mediation Coordinator Court of Appeals Program Coordinator Tax Magistrate Court Programs Analyst Technical Support Spec. Supv. Executive Analyst Technical Writer Executive Services Specialist Treatment Court Coordinator Hearings Referee
OJD currently has 327 employees in this category of work. There are 199 females, 42 people of color, and 11 persons with disabilities in this category. The statewide labor force availability for this group indicates that a goal should be established to hire 20 persons with disabilities in this category.
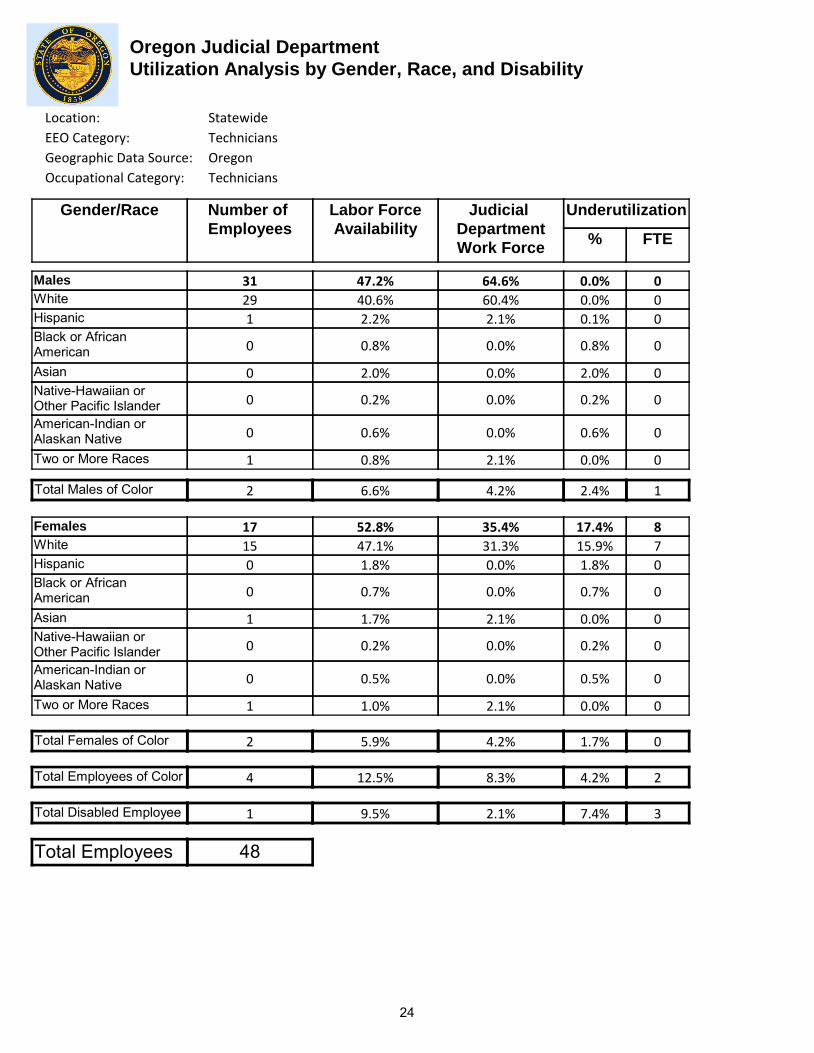
EEO Category: Technicians
Occupations in which workers are responsible for technical applications. Classifications include:
Editor—Composer Assistant Editor—Composer Technical Support Specialist 1, 2, 3, 4
OJD has 48 employees in this category of work. There are 17 females, 4 people of color, and 1 person with disabilities in this category. The statewide labor force availability for this group indicates that a goal should be established to hire eight females, two persons of color and three persons with disabilities in this category.
13
EEO Category: Administrative Support (including Office/Clerical)
Occupations in which workers are responsible for internal and external communication, recording and retrieval of data and/or information, and other paperwork required in an office. Classifications include:
Appellate Court Office Manager Management Assistant 1, 2 Budget and Finance Specialist 1, 2 Paralegal Collection Specialist Payroll/Benefits Tech. 1, 2 Court Operations Supervisor 1, 2, 3 Release Assist. Officer Judicial Services Specialist 1, 2, 3, 4 Stenographic Court Reporter Library Assistant Treatment Court Specialist
OJD currently has 1,183 employees in this category of work. There are 1,074 females, 166 people of color, and 26 persons with disabilities. The chart on the following page recommends specific goals.
14
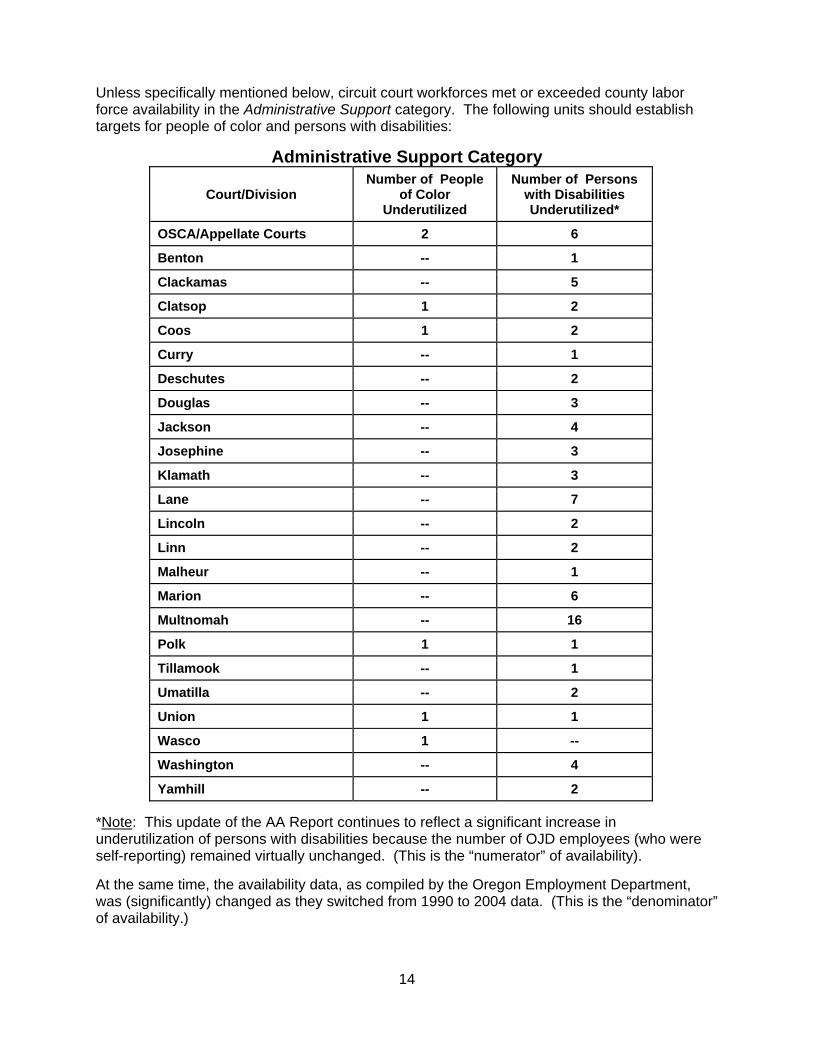
Unless specifically mentioned below, circuit court workforces met or exceeded county labor force availability in the Administrative Support category. The following units should establish targets for people of color and persons with disabilities:
Administrative Support Category
Court/Division Number of People
of Color Underutilized
Number of Persons with Disabilities Underutilized*
OSCA/Appellate Courts 2 6
Benton -- 1
Clackamas -- 5
Clatsop 1 2
Coos 1 2
Curry -- 1
Deschutes -- 2
Douglas -- 3
Jackson -- 4
Josephine -- 3
Klamath -- 3
Lane -- 7
Lincoln -- 2
Linn -- 2
Malheur -- 1
Marion -- 6
Multnomah -- 16
Polk 1 1
Tillamook -- 1
Umatilla -- 2
Union 1 1
Wasco 1 --
Washington -- 4
Yamhill -- 2
*Note: This update of the AA Report continues to reflect a significant increase in underutilization of persons with disabilities because the number of OJD employees (who were self-reporting) remained virtually unchanged. (This is the “numerator” of availability).
At the same time, the availability data, as compiled by the Oregon Employment Department, was (significantly) changed as they switched from 1990 to 2004 data. (This is the “denominator” of availability.)
15
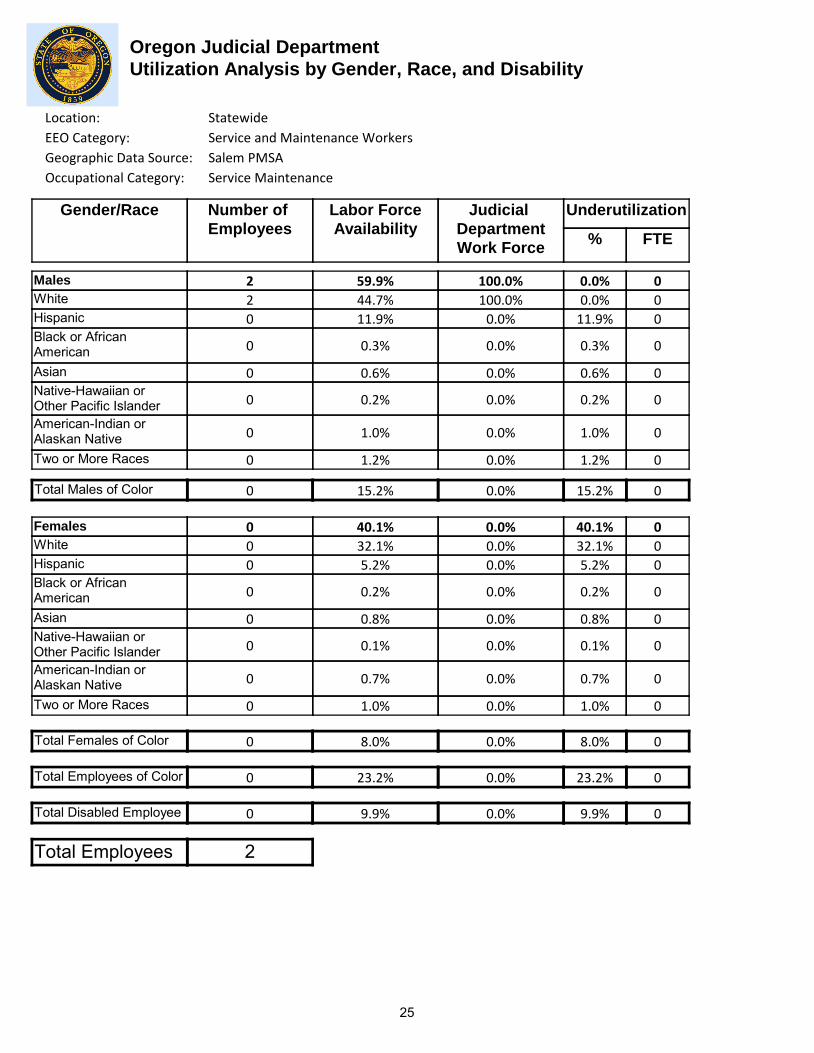
EEO Category: Service and Maintenance Workers
Service and maintenance workers provide a wide variety of services which do not produce a good or provide transportation. Classifications include:
Custodian Facilities Services Coordinator
OJD has two employees in this category of work. There are no females, people of color, or persons with disabilities in this category. The county labor force availability for this group indicates that no goals should be established in this category.
16
VIII. JUDICIAL DEPARTMENT NEW AND ONGOING INITIATIVES
OJD is working to develop and implement initiatives which attract and recognize diversity in the work place and provide better customer service.
Some of the initiatives include:
Language Initiatives
Providing testing and a pay differential for eligible department employees who possess bilingual skills. (This has been ongoing since 2000.)
Training
Providing a separate, comprehensive recruitment and selection training module to supervisors and lead workers with a component on affirmative action and diversity. (Training began in June 2004, 13 courts [over 75 management and lead staff] have participated to date.)
OJD Job Announcements
Posting of all department job announcements on popular web sites as well as the department’s internet and intranet web pages. (Ongoing)
Posting all department job announcements on the state of Oregon jobs page. (Ongoing)
Posting announcements of professional-level positions on the National Center for State Courts (NCSC) web page and other related sites. (This has been ongoing since 2002.)
OJD Recruitment
Implementing a new recruitment software system (Neogov) purchased by the executive branch for use in all three branches. This will allow applicants to apply for OJD jobs online and to follow the recruitment process, and also allows hiring managers to expedite the recruitment process by up to 30%. (This was implemented January 2010.)
17
OJD EEO Census
Updating the census form regarding race/ethnicity and disability status in the new employee packet information to reflect the additional racial/ethnic categories. (This occurred in May 2008.)
School-to-Work
Participating in mock interviews of high school students to provide feedback on their interviewing skills, resumés, and appearance. (This has been ongoing since 2001.)
Job Fairs and Employee Development
Creating developmental and rotational job opportunities and job shadowing for those employees interested in furthering their career with OJD. (This has been ongoing since 2004.)
Developing opportunities for underfilling positions for those employees who do not meet the minimum qualifications and where recruitment for qualified individuals is difficult. (This has been ongoing since 2002.)
Providing a centrally coordinated mentorship program for new trial court administrators and division directors. (This has been ongoing since 2002.)
Including in all personnel-related training programs (for employees and judges) relevant information on affirmative action and discrimination. (Ongoing)
Attending selected job fairs throughout the state, including the state of Oregon’s “Careerfair Oregon,” to conduct outreach and promote the work of OJD. (This has been ongoing since 2006.)
Other Initiatives
Posting the Affirmative Action Report, personnel rules/policies, and other personnel-related information to the department’s intranet web page for all employees to access. (This has been ongoing since 2001.)
Posting the Equal Employment Opportunity Plan (EEOP) to the department’s intranet web page for all employees to access. (This has been ongoing since 2006.)

18
Incorporating the Affirmative Action Report into the existing EEO module of supervisory training. (Ongoing)
Ensuring OJD statewide committees and boards represent the diversity of the workforce. (Ongoing)
Implementing recruitment software (Neogov) which tracks applicant data for analysis in the next Affirmative Action Report. (This was implemented January 2010.)
19
IX. 2011-13 AFFIRMATIVE ACTION GOALS AND STRATEGIES
The department has maintained parity for representation of women in the Officials and Administrators, Professionals, Administrative Support, and Service and Maintenance job categories. Improvement is needed to achieve parity for representation of women in the Technicians job category. Parity for representation of people of color was maintained in the Officials and Administrators, Professionals and Service and Maintenance job categories. OJD continues to work to achieve parity for people of color in the Technicians and Administrative Support job categories. Although parity was maintained for representation of persons with disabilities in the Service and Maintenance job category, more effort and emphasis is needed to recruit for persons with disabilities in the remaining job categories.
In the 2011-13 biennium, OJD will continue to pursue the following goals and strategies:
1. Recruit open competitively; use diverse interview panels where possible.
2. Prioritize efforts to recruit people of color, women, and persons with disabilities to reflect an improved representation in all job categories.
3. Maintain gains during the 2009-11 biennium and continue to strive to reach parity in all categories.
4. Participate annually in career fairs and other outreach events targeting women, people of color, and persons with disabilities.
5. Provide developmental and rotational job opportunities for current employees to enhance their careers.
6. Promote efforts to utilize underfill recruitments and establish career ladders for current employees.
7. Capture applicant data for inclusion in the next Affirmative Action Report.
8. Encourage participation in programs to reach out to students interested in a career in the judicial branch of state government.
AFFIRMATIVE ACTION REPORT
APPENDIX
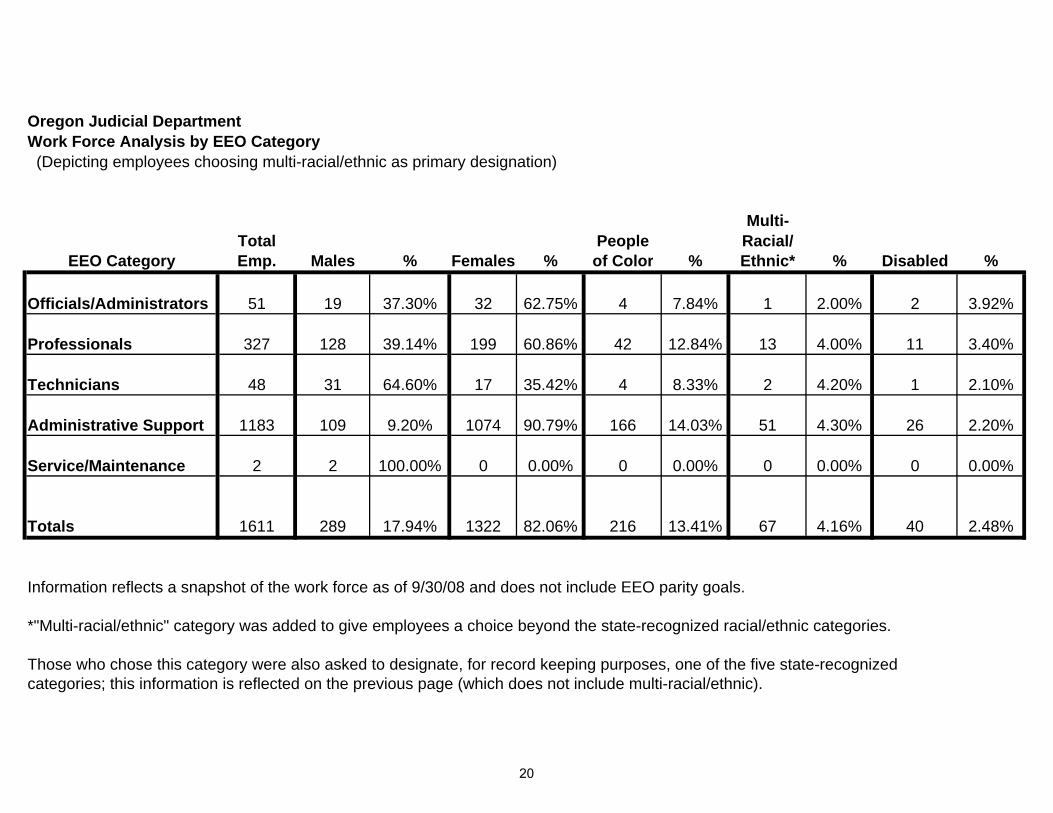
Multi-Total People Racial/
EEO Category Emp. Males % Females % of Color % Ethnic* % Disabled %
Officials/Administrators 51 19 37.30% 32 62.75% 4 7.84% 1 2.00% 2 3.92%
Professionals 327 128 39.14% 199 60.86% 42 12.84% 13 4.00% 11 3.40%
Technicians 48 31 64.60% 17 35.42% 4 8.33% 2 4.20% 1 2.10%
Administrative Support 1183 109 9.20% 1074 90.79% 166 14.03% 51 4.30% 26 2.20%
Service/Maintenance 2 2 100.00% 0 0.00% 0 0.00% 0 0.00% 0 0.00%
Totals 1611 289 17.94% 1322 82.06% 216 13.41% 67 4.16% 40 2.48%
Those who chose this category were also asked to designate, for record keeping purposes, one of the five state-recognizedcategories; this information is reflected on the previous page (which does not include multi-racial/ethnic).
Oregon Judicial DepartmentWork Force Analysis by EEO Category
Information reflects a snapshot of the work force as of 9/30/08 and does not include EEO parity goals.
(Depicting employees choosing multi-racial/ethnic as primary designation)
*"Multi-racial/ethnic" category was added to give employees a choice beyond the state-recognized racial/ethnic categories.
20
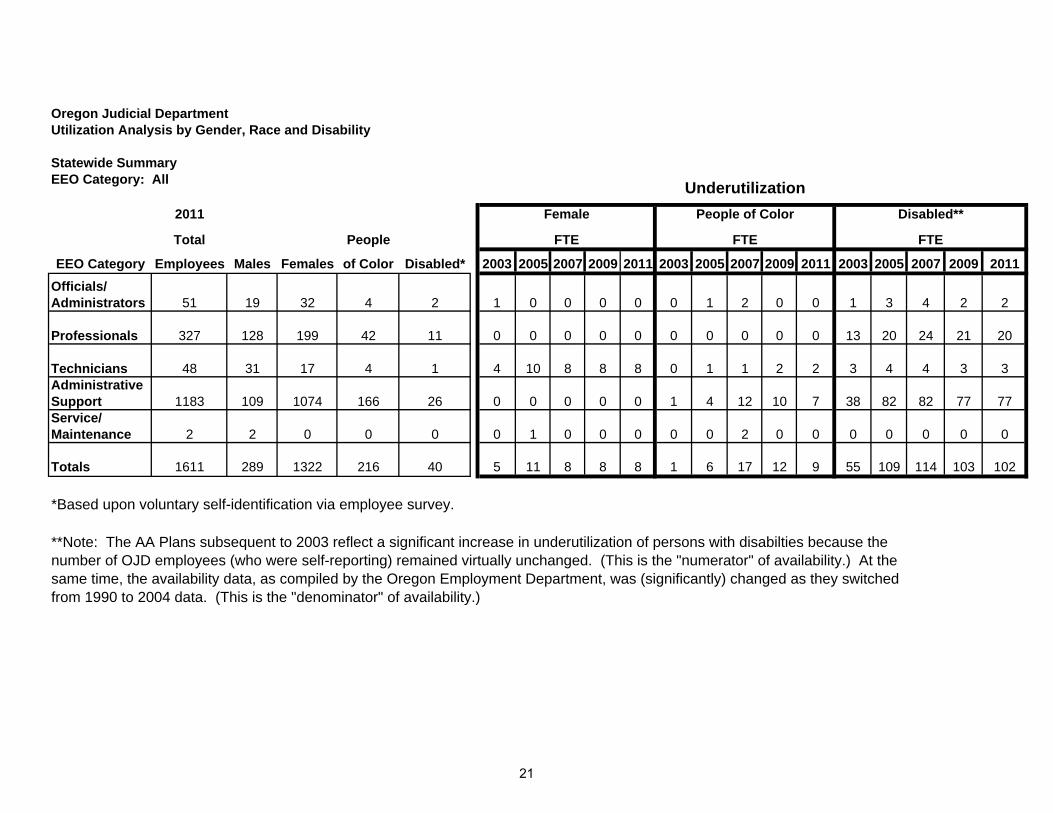
Statewide SummaryEEO Category: All
2011
Total People
EEO Category Employees Males Females of Color Disabled* 2003 2005 2007 2009 2011 2003 2005 2007 2009 2011 2003 2005 2007 2009 2011
Officials/Administrators 51 19 32 4 2 1 0 0 0 0 0 1 2 0 0 1 3 4 2 2
Professionals 327 128 199 42 11 0 0 0 0 0 0 0 0 0 0 13 20 24 21 20
Technicians 48 31 17 4 1 4 10 8 8 8 0 1 1 2 2 3 4 4 3 3Administrative Support 1183 109 1074 166 26 0 0 0 0 0 1 4 12 10 7 38 82 82 77 77Service/Maintenance 2 2 0 0 0 0 1 0 0 0 0 0 2 0 0 0 0 0 0 0
Totals 1611 289 1322 216 40 5 11 8 8 8 1 6 17 12 9 55 109 114 103 102
from 1990 to 2004 data. (This is the "denominator" of availability.)
Oregon Judicial Department
Female People of Color
Utilization Analysis by Gender, Race and Disability
**Note: The AA Plans subsequent to 2003 reflect a significant increase in underutilization of persons with disabilties because the
Underutilization
number of OJD employees (who were self-reporting) remained virtually unchanged. (This is the "numerator" of availability.) At thesame time, the availability data, as compiled by the Oregon Employment Department, was (significantly) changed as they switched
Disabled**
FTE FTEFTE
*Based upon voluntary self-identification via employee survey.
21

Oregon Judicial Department
Utilization Analysis by Gender, Race, and Disability
Location: Statewide
EEO Category: Officials and Administrators
Gender/Race Number of
Employees
Labor Force
Availability
Judicial
Department
Work Force
Underutilization
% FTE
Males
WhiteHispanicBlack or AfricanAmericanAsianNative-Hawaiian or Other Pacific IslanderAmerican-Indian or Alaskan NativeTwo or More Races
Females
WhiteHispanicBlack or AfricanAmericanAsianNative-Hawaiian or Other Pacific IslanderAmerican-Indian or Alaskan NativeTwo or More Races
Total Males of Color
Total Females of Color
Total Employees of Color
Total Employees
Total Disabled Employee
19 60.7% 37.3% 23.4%
18 55.2% 35.3% 19.9%
0 1.8% 0.0% 1.8%
0 0.5% 0.0% 0.5%
1 1.6% 2.0% 0.0%
0 0.1% 0.0% 0.1%
0 0.4% 0.0% 0.4%
0 1.1% 0.0% 1.1%
1 5.5% 2.0% 3.5%
32 39.3% 62.7% 0.0%
29 35.5% 56.9% 0.0%
1 1.2% 2.0% 0.0%
0 0.3% 0.0% 0.3%
0 1.1% 0.0% 1.1%
0 0.1% 0.0% 0.1%
1 0.4% 2.0% 0.0%
1 0.7% 2.0% 0.0%
3 3.8% 5.9% 0.0%
4 9.3% 7.8% 1.5%
2 9.5% 3.9% 5.6%
51
11
10
0
0
0
0
0
0
1
0
0
0
0
0
0
0
0
0
0
2
Geographic Data Source: Oregon
Occupational Category: Officials and Managers
22
Oregon Judicial Department
Utilization Analysis by Gender, Race, and Disability
Location: Statewide
EEO Category: Professionals
Gender/Race Number of
Employees
Labor Force
Availability
Judicial
Department
Work Force
Underutilization
% FTE
Males
WhiteHispanicBlack or AfricanAmericanAsianNative-Hawaiian or Other Pacific IslanderAmerican-Indian or Alaskan NativeTwo or More Races
Females
WhiteHispanicBlack or AfricanAmericanAsianNative-Hawaiian or Other Pacific IslanderAmerican-Indian or Alaskan NativeTwo or More Races
Total Males of Color
Total Females of Color
Total Employees of Color
Total Employees
Total Disabled Employee
128 47.9% 39.1% 8.8%
110 42.6% 33.6% 9.0%
7 1.2% 2.1% 0.0%
0 0.6% 0.0% 0.6%
6 2.4% 1.8% 0.6%
0 0.1% 0.0% 0.1%
0 0.3% 0.0% 0.3%
5 0.7% 1.5% 0.0%
18 5.3% 5.5% 0.0%
199 52.1% 60.9% 0.0%
175 46.6% 53.5% 0.0%
9 1.6% 2.8% 0.0%
1 0.6% 0.3% 0.3%
5 1.8% 1.5% 0.3%
0 0.1% 0.0% 0.1%
1 0.4% 0.3% 0.1%
8 1.1% 2.4% 0.0%
24 5.6% 7.3% 0.0%
42 10.9% 12.8% 0.0%
11 9.5% 3.4% 6.1%
327
28
29
0
1
1
0
0
0
0
0
0
0
0
0
0
0
0
0
0
20
Geographic Data Source: Oregon
Occupational Category: Professionals
23
Oregon Judicial Department
Utilization Analysis by Gender, Race, and Disability
Location: Statewide
EEO Category: Technicians
Gender/Race Number of
Employees
Labor Force
Availability
Judicial
Department
Work Force
Underutilization
% FTE
Males
WhiteHispanicBlack or AfricanAmericanAsianNative-Hawaiian or Other Pacific IslanderAmerican-Indian or Alaskan NativeTwo or More Races
Females
WhiteHispanicBlack or AfricanAmericanAsianNative-Hawaiian or Other Pacific IslanderAmerican-Indian or Alaskan NativeTwo or More Races
Total Males of Color
Total Females of Color
Total Employees of Color
Total Employees
Total Disabled Employee
31 47.2% 64.6% 0.0%
29 40.6% 60.4% 0.0%
1 2.2% 2.1% 0.1%
0 0.8% 0.0% 0.8%
0 2.0% 0.0% 2.0%
0 0.2% 0.0% 0.2%
0 0.6% 0.0% 0.6%
1 0.8% 2.1% 0.0%
2 6.6% 4.2% 2.4%
17 52.8% 35.4% 17.4%
15 47.1% 31.3% 15.9%
0 1.8% 0.0% 1.8%
0 0.7% 0.0% 0.7%
1 1.7% 2.1% 0.0%
0 0.2% 0.0% 0.2%
0 0.5% 0.0% 0.5%
1 1.0% 2.1% 0.0%
2 5.9% 4.2% 1.7%
4 12.5% 8.3% 4.2%
1 9.5% 2.1% 7.4%
48
0
0
0
0
0
0
0
0
1
8
7
0
0
0
0
0
0
0
2
3
Geographic Data Source: Oregon
Occupational Category: Technicians
24
Oregon Judicial Department
Utilization Analysis by Gender, Race, and Disability
Location: Statewide
EEO Category: Service and Maintenance Workers
Gender/Race Number of
Employees
Labor Force
Availability
Judicial
Department
Work Force
Underutilization
% FTE
Males
WhiteHispanicBlack or AfricanAmericanAsianNative-Hawaiian or Other Pacific IslanderAmerican-Indian or Alaskan NativeTwo or More Races
Females
WhiteHispanicBlack or AfricanAmericanAsianNative-Hawaiian or Other Pacific IslanderAmerican-Indian or Alaskan NativeTwo or More Races
Total Males of Color
Total Females of Color
Total Employees of Color
Total Employees
Total Disabled Employee
2 59.9% 100.0% 0.0%
2 44.7% 100.0% 0.0%
0 11.9% 0.0% 11.9%
0 0.3% 0.0% 0.3%
0 0.6% 0.0% 0.6%
0 0.2% 0.0% 0.2%
0 1.0% 0.0% 1.0%
0 1.2% 0.0% 1.2%
0 15.2% 0.0% 15.2%
0 40.1% 0.0% 40.1%
0 32.1% 0.0% 32.1%
0 5.2% 0.0% 5.2%
0 0.2% 0.0% 0.2%
0 0.8% 0.0% 0.8%
0 0.1% 0.0% 0.1%
0 0.7% 0.0% 0.7%
0 1.0% 0.0% 1.0%
0 8.0% 0.0% 8.0%
0 23.2% 0.0% 23.2%
0 9.9% 0.0% 9.9%
2
0
0
0
0
0
0
0
0
0
0
0
0
0
0
0
0
0
0
0
0
Geographic Data Source: Salem PMSA
Occupational Category: Service Maintenance
25
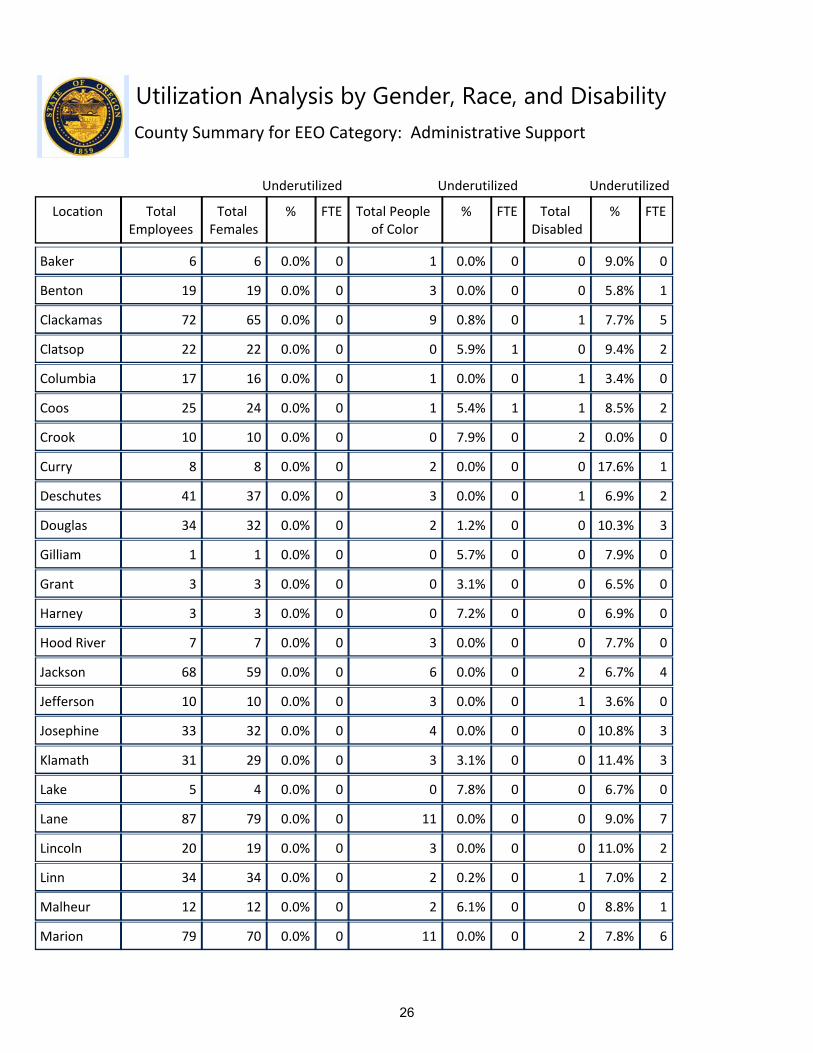
Utilization Analysis by Gender, Race, and DisabilityCounty Summary for EEO Category: Administrative Support
Location TotalEmployees
Total Females
% FTE Total People of Color
% FTE Total Disabled
% FTE
Underutilized Underutilized Underutilized
Baker 6 6 0.0% 0 1 0.0% 0 0 9.0% 0
Benton 19 19 0.0% 0 3 0.0% 0 0 5.8% 1
Clackamas 72 65 0.0% 0 9 0.8% 0 1 7.7% 5
Clatsop 22 22 0.0% 0 0 5.9% 1 0 9.4% 2
Columbia 17 16 0.0% 0 1 0.0% 0 1 3.4% 0
Coos 25 24 0.0% 0 1 5.4% 1 1 8.5% 2
Crook 10 10 0.0% 0 0 7.9% 0 2 0.0% 0
Curry 8 8 0.0% 0 2 0.0% 0 0 17.6% 1
Deschutes 41 37 0.0% 0 3 0.0% 0 1 6.9% 2
Douglas 34 32 0.0% 0 2 1.2% 0 0 10.3% 3
Gilliam 1 1 0.0% 0 0 5.7% 0 0 7.9% 0
Grant 3 3 0.0% 0 0 3.1% 0 0 6.5% 0
Harney 3 3 0.0% 0 0 7.2% 0 0 6.9% 0
Hood River 7 7 0.0% 0 3 0.0% 0 0 7.7% 0
Jackson 68 59 0.0% 0 6 0.0% 0 2 6.7% 4
Jefferson 10 10 0.0% 0 3 0.0% 0 1 3.6% 0
Josephine 33 32 0.0% 0 4 0.0% 0 0 10.8% 3
Klamath 31 29 0.0% 0 3 3.1% 0 0 11.4% 3
Lake 5 4 0.0% 0 0 7.8% 0 0 6.7% 0
Lane 87 79 0.0% 0 11 0.0% 0 0 9.0% 7
Lincoln 20 19 0.0% 0 3 0.0% 0 0 11.0% 2
Linn 34 34 0.0% 0 2 0.2% 0 1 7.0% 2
Malheur 12 12 0.0% 0 2 6.1% 0 0 8.8% 1
Marion 79 70 0.0% 0 11 0.0% 0 2 7.8% 6
26

Location TotalEmployees
Total Females
% FTE Total People of Color
% FTE Total Disabled
% FTE
Underutilized Underutilized Underutilized
Morrow 3 3 0.0% 0 0 11.7% 0 0 8.6% 0
Multnomah 234 197 0.0% 0 59 0.0% 0 5 7.0% 16
OSCA‐Appellate
89 76 0.0% 0 10 2.3% 2 3 6.9% 6
Polk 18 16 0.0% 0 1 7.9% 1 0 10.3% 1
Sherman 1 1 0.0% 0 0 7.2% 0 0 6.3% 0
Tillamook 9 9 0.0% 0 0 7.2% 0 0 14.1% 1
Umatilla 30 30 0.0% 0 4 0.0% 0 1 6.7% 2
Union 15 14 0.0% 0 0 6.8% 1 0 9.1% 1
Wallowa 3 3 0.0% 0 0 3.0% 0 0 8.7% 0
Wasco 10 10 0.0% 0 0 10.2% 1 0 7.7% 0
Washington 94 85 0.0% 0 20 0.0% 0 4 4.8% 4
Yamhill 30 29 0.0% 0 2 1.5% 0 1 8.4% 2
1183Totals 1074 166 260 7 77* * *
* % calculation by county only
27
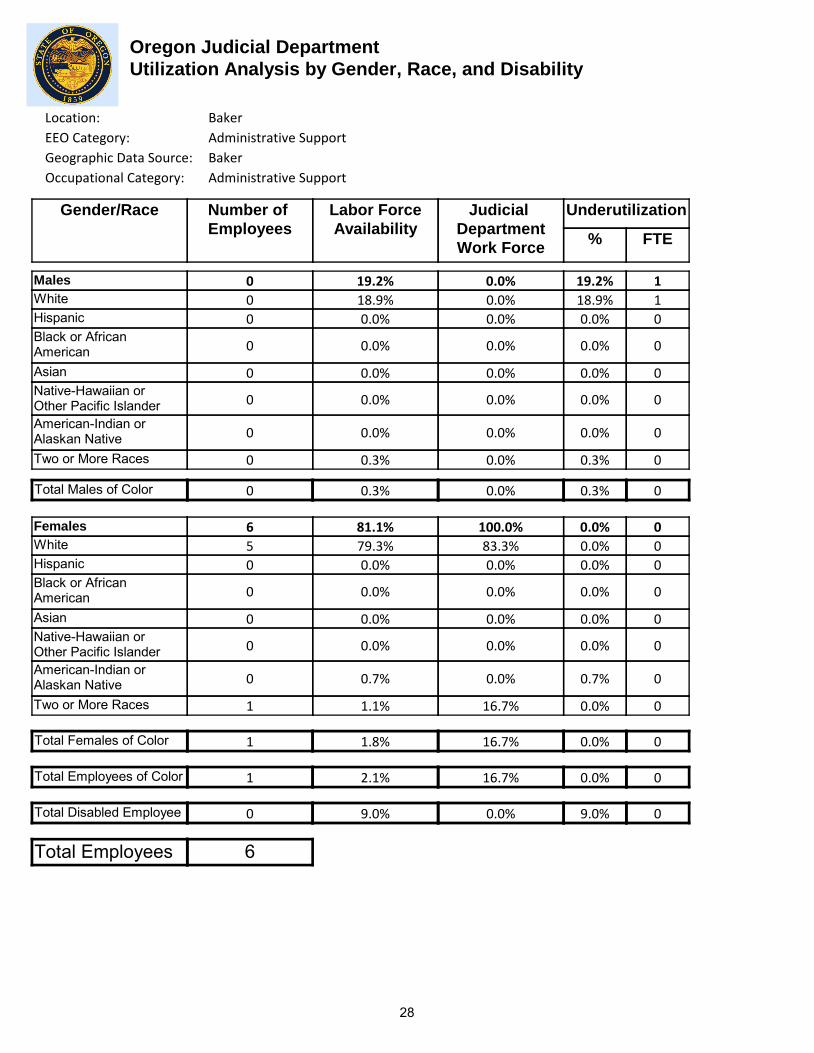
Oregon Judicial Department
Utilization Analysis by Gender, Race, and Disability
Location: Baker
EEO Category: Administrative Support
Gender/Race Number of
Employees
Labor Force
Availability
Judicial
Department
Work Force
Underutilization
% FTE
Males
WhiteHispanicBlack or AfricanAmericanAsianNative-Hawaiian or Other Pacific IslanderAmerican-Indian or Alaskan NativeTwo or More Races
Females
WhiteHispanicBlack or AfricanAmericanAsianNative-Hawaiian or Other Pacific IslanderAmerican-Indian or Alaskan NativeTwo or More Races
Total Males of Color
Total Females of Color
Total Employees of Color
Total Employees
Total Disabled Employee
0 19.2% 0.0% 19.2%
0 18.9% 0.0% 18.9%
0 0.0% 0.0% 0.0%
0 0.0% 0.0% 0.0%
0 0.0% 0.0% 0.0%
0 0.0% 0.0% 0.0%
0 0.0% 0.0% 0.0%
0 0.3% 0.0% 0.3%
0 0.3% 0.0% 0.3%
6 81.1% 100.0% 0.0%
5 79.3% 83.3% 0.0%
0 0.0% 0.0% 0.0%
0 0.0% 0.0% 0.0%
0 0.0% 0.0% 0.0%
0 0.0% 0.0% 0.0%
0 0.7% 0.0% 0.7%
1 1.1% 16.7% 0.0%
1 1.8% 16.7% 0.0%
1 2.1% 16.7% 0.0%
0 9.0% 0.0% 9.0%
6
1
1
0
0
0
0
0
0
0
0
0
0
0
0
0
0
0
0
0
0
Geographic Data Source: Baker
Occupational Category: Administrative Support
28

Oregon Judicial Department
Utilization Analysis by Gender, Race, and Disability
Location: Benton
EEO Category: Administrative Support
Gender/Race Number of
Employees
Labor Force
Availability
Judicial
Department
Work Force
Underutilization
% FTE
Males
WhiteHispanicBlack or AfricanAmericanAsianNative-Hawaiian or Other Pacific IslanderAmerican-Indian or Alaskan NativeTwo or More Races
Females
WhiteHispanicBlack or AfricanAmericanAsianNative-Hawaiian or Other Pacific IslanderAmerican-Indian or Alaskan NativeTwo or More Races
Total Males of Color
Total Females of Color
Total Employees of Color
Total Employees
Total Disabled Employee
0 28.7% 0.0% 28.7%
0 24.6% 0.0% 24.6%
0 1.3% 0.0% 1.3%
0 0.9% 0.0% 0.9%
0 0.4% 0.0% 0.4%
0 0.0% 0.0% 0.0%
0 0.4% 0.0% 0.4%
0 1.0% 0.0% 1.0%
0 4.0% 0.0% 4.0%
19 71.3% 100.0% 0.0%
16 65.1% 84.2% 0.0%
1 2.6% 5.3% 0.0%
0 0.3% 0.0% 0.3%
0 2.2% 0.0% 2.2%
0 0.0% 0.0% 0.0%
0 0.4% 0.0% 0.4%
2 0.7% 10.5% 0.0%
3 6.2% 15.8% 0.0%
3 10.2% 15.8% 0.0%
0 5.8% 0.0% 5.8%
19
5
4
0
0
0
0
0
0
0
0
0
0
0
0
0
0
0
0
0
1
Geographic Data Source: Benton
Occupational Category: Administrative Support
29

Oregon Judicial Department
Utilization Analysis by Gender, Race, and Disability
Location: Clackamas
EEO Category: Administrative Support
Gender/Race Number of
Employees
Labor Force
Availability
Judicial
Department
Work Force
Underutilization
% FTE
Males
WhiteHispanicBlack or AfricanAmericanAsianNative-Hawaiian or Other Pacific IslanderAmerican-Indian or Alaskan NativeTwo or More Races
Females
WhiteHispanicBlack or AfricanAmericanAsianNative-Hawaiian or Other Pacific IslanderAmerican-Indian or Alaskan NativeTwo or More Races
Total Males of Color
Total Females of Color
Total Employees of Color
Total Employees
Total Disabled Employee
7 33.6% 9.7% 23.9%
5 28.8% 6.9% 21.9%
1 1.5% 1.4% 0.1%
0 0.9% 0.0% 0.9%
0 1.2% 0.0% 1.2%
0 0.1% 0.0% 0.1%
0 0.2% 0.0% 0.2%
1 0.8% 1.4% 0.0%
2 4.7% 2.8% 1.9%
65 66.4% 90.3% 0.0%
58 57.8% 80.6% 0.0%
4 2.7% 5.6% 0.0%
0 1.4% 0.0% 1.4%
0 2.1% 0.0% 2.1%
1 0.2% 1.4% 0.0%
0 0.6% 0.0% 0.6%
2 1.6% 2.8% 0.0%
7 8.6% 9.7% 0.0%
9 13.3% 12.5% 0.8%
1 9.1% 1.4% 7.7%
72
17
15
0
0
0
0
0
0
1
0
0
0
1
1
0
0
0
0
0
5
Geographic Data Source: Portland-Vancouver PMSA
Occupational Category: Administrative Support
30

Oregon Judicial Department
Utilization Analysis by Gender, Race, and Disability
Location: Clatsop
EEO Category: Administrative Support
Gender/Race Number of
Employees
Labor Force
Availability
Judicial
Department
Work Force
Underutilization
% FTE
Males
WhiteHispanicBlack or AfricanAmericanAsianNative-Hawaiian or Other Pacific IslanderAmerican-Indian or Alaskan NativeTwo or More Races
Females
WhiteHispanicBlack or AfricanAmericanAsianNative-Hawaiian or Other Pacific IslanderAmerican-Indian or Alaskan NativeTwo or More Races
Total Males of Color
Total Females of Color
Total Employees of Color
Total Employees
Total Disabled Employee
0 25.5% 0.0% 25.5%
0 23.4% 0.0% 23.4%
0 1.0% 0.0% 1.0%
0 0.3% 0.0% 0.3%
0 0.3% 0.0% 0.3%
0 0.0% 0.0% 0.0%
0 0.4% 0.0% 0.4%
0 0.1% 0.0% 0.1%
0 2.1% 0.0% 2.1%
22 74.6% 100.0% 0.0%
22 70.8% 100.0% 0.0%
0 1.0% 0.0% 1.0%
0 0.3% 0.0% 0.3%
0 1.0% 0.0% 1.0%
0 0.1% 0.0% 0.1%
0 0.7% 0.0% 0.7%
0 0.7% 0.0% 0.7%
0 3.8% 0.0% 3.8%
0 5.9% 0.0% 5.9%
0 9.4% 0.0% 9.4%
22
5
5
0
0
0
0
0
0
0
0
0
0
0
0
0
0
0
0
1
2
Geographic Data Source: Clatsop
Occupational Category: Administrative Support
31

Oregon Judicial Department
Utilization Analysis by Gender, Race, and Disability
Location: Columbia
EEO Category: Administrative Support
Gender/Race Number of
Employees
Labor Force
Availability
Judicial
Department
Work Force
Underutilization
% FTE
Males
WhiteHispanicBlack or AfricanAmericanAsianNative-Hawaiian or Other Pacific IslanderAmerican-Indian or Alaskan NativeTwo or More Races
Females
WhiteHispanicBlack or AfricanAmericanAsianNative-Hawaiian or Other Pacific IslanderAmerican-Indian or Alaskan NativeTwo or More Races
Total Males of Color
Total Females of Color
Total Employees of Color
Total Employees
Total Disabled Employee
1 26.1% 5.9% 20.2%
1 24.9% 5.9% 19.0%
0 0.3% 0.0% 0.3%
0 0.0% 0.0% 0.0%
0 0.0% 0.0% 0.0%
0 0.0% 0.0% 0.0%
0 0.3% 0.0% 0.3%
0 0.5% 0.0% 0.5%
0 1.1% 0.0% 1.1%
16 73.8% 94.1% 0.0%
15 70.2% 88.2% 0.0%
0 1.0% 0.0% 1.0%
0 0.0% 0.0% 0.0%
0 0.2% 0.0% 0.2%
0 0.0% 0.0% 0.0%
0 1.1% 0.0% 1.1%
1 1.3% 5.9% 0.0%
1 3.6% 5.9% 0.0%
1 4.7% 5.9% 0.0%
1 9.3% 5.9% 3.4%
17
3
3
0
0
0
0
0
0
0
0
0
0
0
0
0
0
0
0
0
0
Geographic Data Source: Columbia
Occupational Category: Administrative Support
32

Oregon Judicial Department
Utilization Analysis by Gender, Race, and Disability
Location: Coos
EEO Category: Administrative Support
Gender/Race Number of
Employees
Labor Force
Availability
Judicial
Department
Work Force
Underutilization
% FTE
Males
WhiteHispanicBlack or AfricanAmericanAsianNative-Hawaiian or Other Pacific IslanderAmerican-Indian or Alaskan NativeTwo or More Races
Females
WhiteHispanicBlack or AfricanAmericanAsianNative-Hawaiian or Other Pacific IslanderAmerican-Indian or Alaskan NativeTwo or More Races
Total Males of Color
Total Females of Color
Total Employees of Color
Total Employees
Total Disabled Employee
1 25.7% 4.0% 21.7%
1 22.9% 4.0% 18.9%
0 0.6% 0.0% 0.6%
0 0.2% 0.0% 0.2%
0 0.2% 0.0% 0.2%
0 0.0% 0.0% 0.0%
0 0.8% 0.0% 0.8%
0 1.1% 0.0% 1.1%
0 2.9% 0.0% 2.9%
24 74.3% 96.0% 0.0%
23 67.9% 92.0% 0.0%
0 1.8% 0.0% 1.8%
0 0.0% 0.0% 0.0%
0 0.5% 0.0% 0.5%
0 0.0% 0.0% 0.0%
1 1.4% 4.0% 0.0%
0 2.8% 0.0% 2.8%
1 6.5% 4.0% 2.5%
1 9.4% 4.0% 5.4%
1 12.5% 4.0% 8.5%
25
5
4
0
0
0
0
0
0
0
0
0
0
0
0
0
0
0
0
1
2
Geographic Data Source: Coos
Occupational Category: Administrative Support
33

Oregon Judicial Department
Utilization Analysis by Gender, Race, and Disability
Location: Crook
EEO Category: Administrative Support
Gender/Race Number of
Employees
Labor Force
Availability
Judicial
Department
Work Force
Underutilization
% FTE
Males
WhiteHispanicBlack or AfricanAmericanAsianNative-Hawaiian or Other Pacific IslanderAmerican-Indian or Alaskan NativeTwo or More Races
Females
WhiteHispanicBlack or AfricanAmericanAsianNative-Hawaiian or Other Pacific IslanderAmerican-Indian or Alaskan NativeTwo or More Races
Total Males of Color
Total Females of Color
Total Employees of Color
Total Employees
Total Disabled Employee
0 23.2% 0.0% 23.2%
0 22.9% 0.0% 22.9%
0 0.0% 0.0% 0.0%
0 0.0% 0.0% 0.0%
0 0.0% 0.0% 0.0%
0 0.0% 0.0% 0.0%
0 0.2% 0.0% 0.2%
0 0.0% 0.0% 0.0%
0 0.2% 0.0% 0.2%
10 76.8% 100.0% 0.0%
10 69.1% 100.0% 0.0%
0 2.1% 0.0% 2.1%
0 0.0% 0.0% 0.0%
0 0.9% 0.0% 0.9%
0 0.0% 0.0% 0.0%
0 2.6% 0.0% 2.6%
0 2.1% 0.0% 2.1%
0 7.7% 0.0% 7.7%
0 7.9% 0.0% 7.9%
2 12.0% 20.0% 0.0%
10
2
2
0
0
0
0
0
0
0
0
0
0
0
0
0
0
0
0
0
0
Geographic Data Source: Crook
Occupational Category: Administrative Support
34

Oregon Judicial Department
Utilization Analysis by Gender, Race, and Disability
Location: Curry
EEO Category: Administrative Support
Gender/Race Number of
Employees
Labor Force
Availability
Judicial
Department
Work Force
Underutilization
% FTE
Males
WhiteHispanicBlack or AfricanAmericanAsianNative-Hawaiian or Other Pacific IslanderAmerican-Indian or Alaskan NativeTwo or More Races
Females
WhiteHispanicBlack or AfricanAmericanAsianNative-Hawaiian or Other Pacific IslanderAmerican-Indian or Alaskan NativeTwo or More Races
Total Males of Color
Total Females of Color
Total Employees of Color
Total Employees
Total Disabled Employee
0 22.2% 0.0% 22.2%
0 19.7% 0.0% 19.7%
0 0.8% 0.0% 0.8%
0 0.0% 0.0% 0.0%
0 0.0% 0.0% 0.0%
0 0.0% 0.0% 0.0%
0 1.0% 0.0% 1.0%
0 0.7% 0.0% 0.7%
0 2.5% 0.0% 2.5%
8 78.2% 100.0% 0.0%
6 69.3% 75.0% 0.0%
0 1.5% 0.0% 1.5%
0 0.5% 0.0% 0.5%
0 0.0% 0.0% 0.0%
0 0.0% 0.0% 0.0%
1 3.8% 12.5% 0.0%
1 3.1% 12.5% 0.0%
2 8.9% 25.0% 0.0%
2 11.4% 25.0% 0.0%
0 17.6% 0.0% 17.6%
8
1
1
0
0
0
0
0
0
0
0
0
0
0
0
0
0
0
0
0
1
Geographic Data Source: Curry
Occupational Category: Administrative Support
35

Oregon Judicial Department
Utilization Analysis by Gender, Race, and Disability
Location: Deschutes
EEO Category: Administrative Support
Gender/Race Number of
Employees
Labor Force
Availability
Judicial
Department
Work Force
Underutilization
% FTE
Males
WhiteHispanicBlack or AfricanAmericanAsianNative-Hawaiian or Other Pacific IslanderAmerican-Indian or Alaskan NativeTwo or More Races
Females
WhiteHispanicBlack or AfricanAmericanAsianNative-Hawaiian or Other Pacific IslanderAmerican-Indian or Alaskan NativeTwo or More Races
Total Males of Color
Total Females of Color
Total Employees of Color
Total Employees
Total Disabled Employee
4 31.2% 9.8% 21.4%
4 29.5% 9.8% 19.7%
0 0.7% 0.0% 0.7%
0 0.1% 0.0% 0.1%
0 0.0% 0.0% 0.0%
0 0.0% 0.0% 0.0%
0 0.4% 0.0% 0.4%
0 0.5% 0.0% 0.5%
0 1.7% 0.0% 1.7%
37 68.8% 90.2% 0.0%
34 64.3% 82.9% 0.0%
0 2.6% 0.0% 2.6%
0 0.0% 0.0% 0.0%
0 0.2% 0.0% 0.2%
1 0.3% 2.4% 0.0%
0 0.5% 0.0% 0.5%
2 1.0% 4.9% 0.0%
3 4.6% 7.3% 0.0%
3 6.3% 7.3% 0.0%
1 9.3% 2.4% 6.9%
41
8
8
0
0
0
0
0
0
0
0
0
1
0
0
0
0
0
0
0
2
Geographic Data Source: Deschutes
Occupational Category: Administrative Support
36

Oregon Judicial Department
Utilization Analysis by Gender, Race, and Disability
Location: Douglas
EEO Category: Administrative Support
Gender/Race Number of
Employees
Labor Force
Availability
Judicial
Department
Work Force
Underutilization
% FTE
Males
WhiteHispanicBlack or AfricanAmericanAsianNative-Hawaiian or Other Pacific IslanderAmerican-Indian or Alaskan NativeTwo or More Races
Females
WhiteHispanicBlack or AfricanAmericanAsianNative-Hawaiian or Other Pacific IslanderAmerican-Indian or Alaskan NativeTwo or More Races
Total Males of Color
Total Females of Color
Total Employees of Color
Total Employees
Total Disabled Employee
2 22.4% 5.9% 16.5%
2 20.9% 5.9% 15.0%
0 0.7% 0.0% 0.7%
0 0.0% 0.0% 0.0%
0 0.0% 0.0% 0.0%
0 0.1% 0.0% 0.1%
0 0.3% 0.0% 0.3%
0 0.4% 0.0% 0.4%
0 1.5% 0.0% 1.5%
32 77.6% 94.1% 0.0%
30 72.2% 88.2% 0.0%
2 1.4% 5.9% 0.0%
0 0.2% 0.0% 0.2%
0 0.4% 0.0% 0.4%
0 0.1% 0.0% 0.1%
0 1.1% 0.0% 1.1%
0 2.4% 0.0% 2.4%
2 5.6% 5.9% 0.0%
2 7.1% 5.9% 1.2%
0 10.3% 0.0% 10.3%
34
5
5
0
0
0
0
0
0
0
0
0
0
0
0
0
0
0
0
0
3
Geographic Data Source: Douglas
Occupational Category: Administrative Support
37

Oregon Judicial Department
Utilization Analysis by Gender, Race, and Disability
Location: Gilliam/Wheeler*
EEO Category: Administrative Support
Gender/Race Number of
Employees
Labor Force
Availability
Judicial
Department
Work Force
Underutilization
% FTE
Males
WhiteHispanicBlack or AfricanAmericanAsianNative-Hawaiian or Other Pacific IslanderAmerican-Indian or Alaskan NativeTwo or More Races
Females
WhiteHispanicBlack or AfricanAmericanAsianNative-Hawaiian or Other Pacific IslanderAmerican-Indian or Alaskan NativeTwo or More Races
Total Males of Color
Total Females of Color
Total Employees of Color
Total Employees
Total Disabled Employee
0 16.7% 0.0% 16.7%
0 16.7% 0.0% 16.7%
0 0.0% 0.0% 0.0%
0 0.0% 0.0% 0.0%
0 0.0% 0.0% 0.0%
0 0.0% 0.0% 0.0%
0 0.0% 0.0% 0.0%
0 0.0% 0.0% 0.0%
0 0.0% 0.0% 0.0%
1 86.7% 100.0% 0.0%
1 81.0% 100.0% 0.0%
0 1.9% 0.0% 1.9%
0 0.0% 0.0% 0.0%
0 0.0% 0.0% 0.0%
0 0.0% 0.0% 0.0%
0 0.0% 0.0% 0.0%
0 3.8% 0.0% 3.8%
0 5.7% 0.0% 5.7%
0 5.7% 0.0% 5.7%
0 7.9% 0.0% 7.9%
1
0
0
0
0
0
0
0
0
0
0
0
0
0
0
0
0
0
0
0
0
Geographic Data Source: Gilliam
Occupational Category: Administrative Support
*One employee works at Gilliam and Wheeler locations.
38
ray
Highlight
ray
Text Box
ray
Typewritten Text
ray
Typewritten Text

Oregon Judicial Department
Utilization Analysis by Gender, Race, and Disability
Location: Grant
EEO Category: Administrative Support
Gender/Race Number of
Employees
Labor Force
Availability
Judicial
Department
Work Force
Underutilization
% FTE
Males
WhiteHispanicBlack or AfricanAmericanAsianNative-Hawaiian or Other Pacific IslanderAmerican-Indian or Alaskan NativeTwo or More Races
Females
WhiteHispanicBlack or AfricanAmericanAsianNative-Hawaiian or Other Pacific IslanderAmerican-Indian or Alaskan NativeTwo or More Races
Total Males of Color
Total Females of Color
Total Employees of Color
Total Employees
Total Disabled Employee
0 18.1% 0.0% 18.1%
0 18.1% 0.0% 18.1%
0 0.0% 0.0% 0.0%
0 0.0% 0.0% 0.0%
0 0.0% 0.0% 0.0%
0 0.0% 0.0% 0.0%
0 0.0% 0.0% 0.0%
0 0.0% 0.0% 0.0%
0 0.0% 0.0% 0.0%
3 82.7% 100.0% 0.0%
3 79.5% 100.0% 0.0%
0 1.3% 0.0% 1.3%
0 0.0% 0.0% 0.0%
0 0.6% 0.0% 0.6%
0 0.0% 0.0% 0.0%
0 0.6% 0.0% 0.6%
0 0.6% 0.0% 0.6%
0 3.1% 0.0% 3.1%
0 3.1% 0.0% 3.1%
0 6.5% 0.0% 6.5%
3
0
0
0
0
0
0
0
0
0
0
0
0
0
0
0
0
0
0
0
0
Geographic Data Source: Grant
Occupational Category: Administrative Support
39

Oregon Judicial Department
Utilization Analysis by Gender, Race, and Disability
Location: Harney
EEO Category: Administrative Support
Gender/Race Number of
Employees
Labor Force
Availability
Judicial
Department
Work Force
Underutilization
% FTE
Males
WhiteHispanicBlack or AfricanAmericanAsianNative-Hawaiian or Other Pacific IslanderAmerican-Indian or Alaskan NativeTwo or More Races
Females
WhiteHispanicBlack or AfricanAmericanAsianNative-Hawaiian or Other Pacific IslanderAmerican-Indian or Alaskan NativeTwo or More Races
Total Males of Color
Total Females of Color
Total Employees of Color
Total Employees
Total Disabled Employee
0 24.1% 0.0% 24.1%
0 23.6% 0.0% 23.6%
0 0.0% 0.0% 0.0%
0 0.0% 0.0% 0.0%
0 0.0% 0.0% 0.0%
0 0.0% 0.0% 0.0%
0 0.6% 0.0% 0.6%
0 0.0% 0.0% 0.0%
0 0.6% 0.0% 0.6%
3 75.9% 100.0% 0.0%
3 69.3% 100.0% 0.0%
0 1.1% 0.0% 1.1%
0 0.0% 0.0% 0.0%
0 0.0% 0.0% 0.0%
0 0.6% 0.0% 0.6%
0 2.9% 0.0% 2.9%
0 2.0% 0.0% 2.0%
0 6.6% 0.0% 6.6%
0 7.2% 0.0% 7.2%
0 6.9% 0.0% 6.9%
3
0
0
0
0
0
0
0
0
0
0
0
0
0
0
0
0
0
0
0
0
Geographic Data Source: Harney
Occupational Category: Administrative Support
40

Oregon Judicial Department
Utilization Analysis by Gender, Race, and Disability
Location: Hood River
EEO Category: Administrative Support
Gender/Race Number of
Employees
Labor Force
Availability
Judicial
Department
Work Force
Underutilization
% FTE
Males
WhiteHispanicBlack or AfricanAmericanAsianNative-Hawaiian or Other Pacific IslanderAmerican-Indian or Alaskan NativeTwo or More Races
Females
WhiteHispanicBlack or AfricanAmericanAsianNative-Hawaiian or Other Pacific IslanderAmerican-Indian or Alaskan NativeTwo or More Races
Total Males of Color
Total Females of Color
Total Employees of Color
Total Employees
Total Disabled Employee
0 29.9% 0.0% 29.9%
0 22.4% 0.0% 22.4%
0 6.4% 0.0% 6.4%
0 0.0% 0.0% 0.0%
0 1.1% 0.0% 1.1%
0 0.0% 0.0% 0.0%
0 0.0% 0.0% 0.0%
0 0.0% 0.0% 0.0%
0 7.5% 0.0% 7.5%
7 70.3% 100.0% 0.0%
4 56.8% 57.1% 0.0%
3 10.2% 42.9% 0.0%
0 0.0% 0.0% 0.0%
0 0.2% 0.0% 0.2%
0 0.8% 0.0% 0.8%
0 0.8% 0.0% 0.8%
0 1.4% 0.0% 1.4%
3 13.4% 42.9% 0.0%
3 20.9% 42.9% 0.0%
0 7.7% 0.0% 7.7%
7
2
1
0
0
0
0
0
0
0
0
0
0
0
0
0
0
0
0
0
0
Geographic Data Source: Hood River
Occupational Category: Administrative Support
41
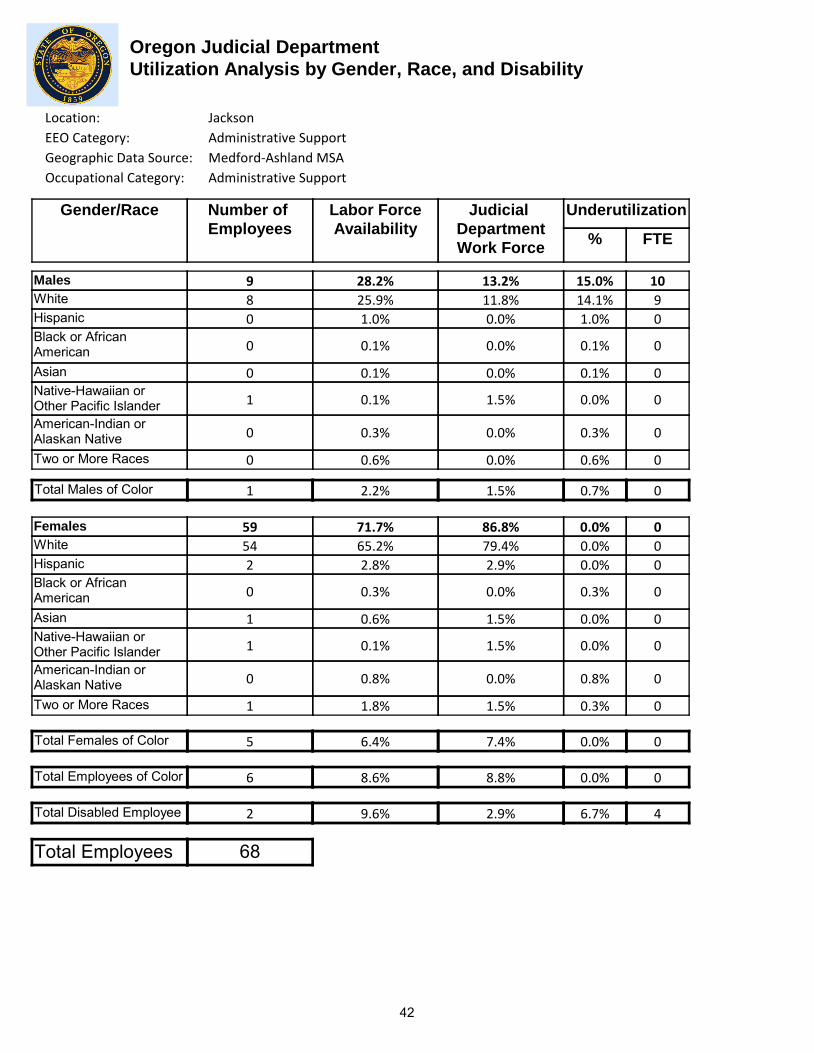
Oregon Judicial Department
Utilization Analysis by Gender, Race, and Disability
Location: Jackson
EEO Category: Administrative Support
Gender/Race Number of
Employees
Labor Force
Availability
Judicial
Department
Work Force
Underutilization
% FTE
Males
WhiteHispanicBlack or AfricanAmericanAsianNative-Hawaiian or Other Pacific IslanderAmerican-Indian or Alaskan NativeTwo or More Races
Females
WhiteHispanicBlack or AfricanAmericanAsianNative-Hawaiian or Other Pacific IslanderAmerican-Indian or Alaskan NativeTwo or More Races
Total Males of Color
Total Females of Color
Total Employees of Color
Total Employees
Total Disabled Employee
9 28.2% 13.2% 15.0%
8 25.9% 11.8% 14.1%
0 1.0% 0.0% 1.0%
0 0.1% 0.0% 0.1%
0 0.1% 0.0% 0.1%
1 0.1% 1.5% 0.0%
0 0.3% 0.0% 0.3%
0 0.6% 0.0% 0.6%
1 2.2% 1.5% 0.7%
59 71.7% 86.8% 0.0%
54 65.2% 79.4% 0.0%
2 2.8% 2.9% 0.0%
0 0.3% 0.0% 0.3%
1 0.6% 1.5% 0.0%
1 0.1% 1.5% 0.0%
0 0.8% 0.0% 0.8%
1 1.8% 1.5% 0.3%
5 6.4% 7.4% 0.0%
6 8.6% 8.8% 0.0%
2 9.6% 2.9% 6.7%
68
10
9
0
0
0
0
0
0
0
0
0
0
0
0
0
0
0
0
0
4
Geographic Data Source: Medford-Ashland MSA
Occupational Category: Administrative Support
42

Oregon Judicial Department
Utilization Analysis by Gender, Race, and Disability
Location: Jefferson
EEO Category: Administrative Support
Gender/Race Number of
Employees
Labor Force
Availability
Judicial
Department
Work Force
Underutilization
% FTE
Males
WhiteHispanicBlack or AfricanAmericanAsianNative-Hawaiian or Other Pacific IslanderAmerican-Indian or Alaskan NativeTwo or More Races
Females
WhiteHispanicBlack or AfricanAmericanAsianNative-Hawaiian or Other Pacific IslanderAmerican-Indian or Alaskan NativeTwo or More Races
Total Males of Color
Total Females of Color
Total Employees of Color
Total Employees
Total Disabled Employee
0 19.0% 0.0% 19.0%
0 13.4% 0.0% 13.4%
0 2.6% 0.0% 2.6%
0 0.0% 0.0% 0.0%
0 0.2% 0.0% 0.2%
0 0.0% 0.0% 0.0%
0 2.0% 0.0% 2.0%
0 0.8% 0.0% 0.8%
0 5.6% 0.0% 5.6%
10 81.1% 100.0% 0.0%
7 56.9% 70.0% 0.0%
2 6.0% 20.0% 0.0%
0 0.2% 0.0% 0.2%
0 0.0% 0.0% 0.0%
0 0.0% 0.0% 0.0%
0 15.4% 0.0% 15.4%
1 2.6% 10.0% 0.0%
3 24.2% 30.0% 0.0%
3 29.8% 30.0% 0.0%
1 13.6% 10.0% 3.6%
10
1
1
0
0
0
0
0
0
0
0
0
0
0
0
0
1
0
0
0
0
Geographic Data Source: Jefferson
Occupational Category: Administrative Support
43

Oregon Judicial Department
Utilization Analysis by Gender, Race, and Disability
Location: Josephine
EEO Category: Administrative Support
Gender/Race Number of
Employees
Labor Force
Availability
Judicial
Department
Work Force
Underutilization
% FTE
Males
WhiteHispanicBlack or AfricanAmericanAsianNative-Hawaiian or Other Pacific IslanderAmerican-Indian or Alaskan NativeTwo or More Races
Females
WhiteHispanicBlack or AfricanAmericanAsianNative-Hawaiian or Other Pacific IslanderAmerican-Indian or Alaskan NativeTwo or More Races
Total Males of Color
Total Females of Color
Total Employees of Color
Total Employees
Total Disabled Employee
1 28.9% 3.0% 25.9%
0 26.6% 0.0% 26.6%
1 1.6% 3.0% 0.0%
0 0.0% 0.0% 0.0%
0 0.4% 0.0% 0.4%
0 0.0% 0.0% 0.0%
0 0.3% 0.0% 0.3%
0 0.1% 0.0% 0.1%
1 2.4% 3.0% 0.0%
32 71.1% 97.0% 0.0%
29 65.2% 87.9% 0.0%
2 2.6% 6.1% 0.0%
0 0.0% 0.0% 0.0%
0 0.9% 0.0% 0.9%
0 0.0% 0.0% 0.0%
0 0.7% 0.0% 0.7%
1 1.7% 3.0% 0.0%
3 5.9% 9.1% 0.0%
4 8.3% 12.1% 0.0%
0 10.8% 0.0% 10.8%
33
8
8
0
0
0
0
0
0
0
0
0
0
0
0
0
0
0
0
0
3
Geographic Data Source: Josephine
Occupational Category: Administrative Support
44

Oregon Judicial Department
Utilization Analysis by Gender, Race, and Disability
Location: Klamath
EEO Category: Administrative Support
Gender/Race Number of
Employees
Labor Force
Availability
Judicial
Department
Work Force
Underutilization
% FTE
Males
WhiteHispanicBlack or AfricanAmericanAsianNative-Hawaiian or Other Pacific IslanderAmerican-Indian or Alaskan NativeTwo or More Races
Females
WhiteHispanicBlack or AfricanAmericanAsianNative-Hawaiian or Other Pacific IslanderAmerican-Indian or Alaskan NativeTwo or More Races
Total Males of Color
Total Females of Color
Total Employees of Color
Total Employees
Total Disabled Employee
2 25.0% 6.5% 18.5%
2 22.8% 6.5% 16.3%
0 0.6% 0.0% 0.6%
0 0.2% 0.0% 0.2%
0 0.1% 0.0% 0.1%
0 0.0% 0.0% 0.0%
0 0.9% 0.0% 0.9%
0 0.6% 0.0% 0.6%
0 2.4% 0.0% 2.4%
29 74.8% 93.5% 0.0%
26 64.5% 83.9% 0.0%
2 4.3% 6.5% 0.0%
0 0.3% 0.0% 0.3%
0 0.7% 0.0% 0.7%
0 0.2% 0.0% 0.2%
1 2.8% 3.2% 0.0%
0 2.1% 0.0% 2.1%
3 10.4% 9.7% 0.7%
3 12.8% 9.7% 3.1%
0 11.4% 0.0% 11.4%
31
5
5
0
0
0
0
0
0
0
0
0
0
0
0
0
0
0
0
0
3
Geographic Data Source: Klamath
Occupational Category: Administrative Support
45

Oregon Judicial Department
Utilization Analysis by Gender, Race, and Disability
Location: Lake
EEO Category: Administrative Support
Gender/Race Number of
Employees
Labor Force
Availability
Judicial
Department
Work Force
Underutilization
% FTE
Males
WhiteHispanicBlack or AfricanAmericanAsianNative-Hawaiian or Other Pacific IslanderAmerican-Indian or Alaskan NativeTwo or More Races
Females
WhiteHispanicBlack or AfricanAmericanAsianNative-Hawaiian or Other Pacific IslanderAmerican-Indian or Alaskan NativeTwo or More Races
Total Males of Color
Total Females of Color
Total Employees of Color
Total Employees
Total Disabled Employee
1 20.2% 20.0% 0.2%
1 16.2% 20.0% 0.0%
0 2.6% 0.0% 2.6%
0 0.0% 0.0% 0.0%
0 0.0% 0.0% 0.0%
0 0.0% 0.0% 0.0%
0 0.7% 0.0% 0.7%
0 0.7% 0.0% 0.7%
0 4.0% 0.0% 4.0%
4 79.0% 80.0% 0.0%
4 75.2% 80.0% 0.0%
0 1.4% 0.0% 1.4%
0 0.0% 0.0% 0.0%
0 0.0% 0.0% 0.0%
0 0.0% 0.0% 0.0%
0 1.7% 0.0% 1.7%
0 0.7% 0.0% 0.7%
0 3.8% 0.0% 3.8%
0 7.8% 0.0% 7.8%
0 6.7% 0.0% 6.7%
5
0
0
0
0
0
0
0
0
0
0
0
0
0
0
0
0
0
0
0
0
Geographic Data Source: Lake
Occupational Category: Administrative Support
46

Oregon Judicial Department
Utilization Analysis by Gender, Race, and Disability
Location: Lane
EEO Category: Administrative Support
Gender/Race Number of
Employees
Labor Force
Availability
Judicial
Department
Work Force
Underutilization
% FTE
Males
WhiteHispanicBlack or AfricanAmericanAsianNative-Hawaiian or Other Pacific IslanderAmerican-Indian or Alaskan NativeTwo or More Races
Females
WhiteHispanicBlack or AfricanAmericanAsianNative-Hawaiian or Other Pacific IslanderAmerican-Indian or Alaskan NativeTwo or More Races
Total Males of Color
Total Females of Color
Total Employees of Color
Total Employees
Total Disabled Employee
8 31.8% 9.2% 22.6%
6 28.6% 6.9% 21.7%
0 0.9% 0.0% 0.9%
0 0.4% 0.0% 0.4%
0 0.4% 0.0% 0.4%
0 0.1% 0.0% 0.1%
0 0.4% 0.0% 0.4%
2 1.1% 2.3% 0.0%
2 3.3% 2.3% 1.0%
79 68.2% 90.8% 0.0%
70 62.3% 80.5% 0.0%
5 1.8% 5.7% 0.0%
1 0.3% 1.1% 0.0%
1 1.2% 1.1% 0.1%
0 0.1% 0.0% 0.1%
0 0.7% 0.0% 0.7%
2 1.9% 2.3% 0.0%
9 6.0% 10.3% 0.0%
11 9.3% 12.6% 0.0%
0 9.0% 0.0% 9.0%
87
19
18
0
0
0
0
0
0
0
0
0
0
0
0
0
0
0
0
0
7
Geographic Data Source: Eugene-Springfield MSA
Occupational Category: Administrative Support
47

Oregon Judicial Department
Utilization Analysis by Gender, Race, and Disability
Location: Lincoln
EEO Category: Administrative Support
Gender/Race Number of
Employees
Labor Force
Availability
Judicial
Department
Work Force
Underutilization
% FTE
Males
WhiteHispanicBlack or AfricanAmericanAsianNative-Hawaiian or Other Pacific IslanderAmerican-Indian or Alaskan NativeTwo or More Races
Females
WhiteHispanicBlack or AfricanAmericanAsianNative-Hawaiian or Other Pacific IslanderAmerican-Indian or Alaskan NativeTwo or More Races
Total Males of Color
Total Females of Color
Total Employees of Color
Total Employees
Total Disabled Employee
1 26.4% 5.0% 21.4%
1 24.3% 5.0% 19.3%
0 1.0% 0.0% 1.0%
0 0.2% 0.0% 0.2%
0 0.1% 0.0% 0.1%
0 0.1% 0.0% 0.1%
0 0.4% 0.0% 0.4%
0 0.3% 0.0% 0.3%
0 2.1% 0.0% 2.1%
19 73.5% 95.0% 0.0%
16 67.4% 80.0% 0.0%
0 2.0% 0.0% 2.0%
0 0.1% 0.0% 0.1%
0 0.7% 0.0% 0.7%
0 0.3% 0.0% 0.3%
1 1.6% 5.0% 0.0%
2 1.5% 10.0% 0.0%
3 6.2% 15.0% 0.0%
3 8.3% 15.0% 0.0%
0 11.0% 0.0% 11.0%
20
4
3
0
0
0
0
0
0
0
0
0
0
0
0
0
0
0
0
0
2
Geographic Data Source: Lincoln
Occupational Category: Administrative Support
48
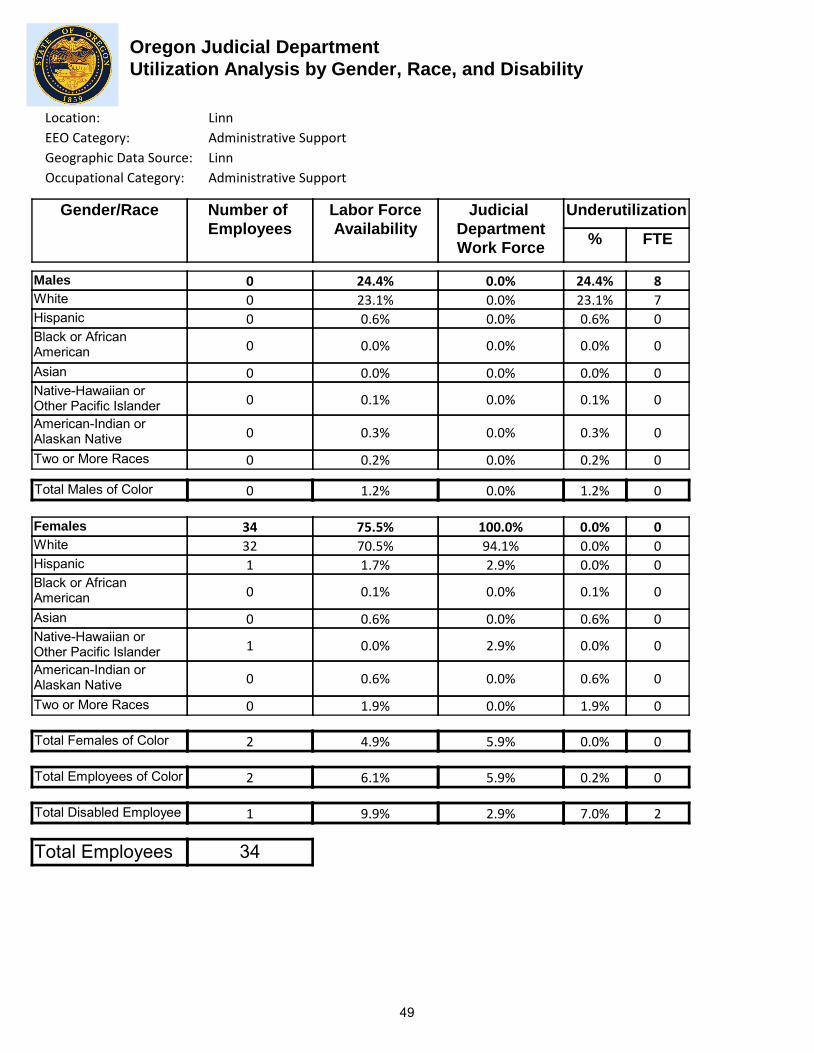
Oregon Judicial Department
Utilization Analysis by Gender, Race, and Disability
Location: Linn
EEO Category: Administrative Support
Gender/Race Number of
Employees
Labor Force
Availability
Judicial
Department
Work Force
Underutilization
% FTE
Males
WhiteHispanicBlack or AfricanAmericanAsianNative-Hawaiian or Other Pacific IslanderAmerican-Indian or Alaskan NativeTwo or More Races
Females
WhiteHispanicBlack or AfricanAmericanAsianNative-Hawaiian or Other Pacific IslanderAmerican-Indian or Alaskan NativeTwo or More Races
Total Males of Color
Total Females of Color
Total Employees of Color
Total Employees
Total Disabled Employee
0 24.4% 0.0% 24.4%
0 23.1% 0.0% 23.1%
0 0.6% 0.0% 0.6%
0 0.0% 0.0% 0.0%
0 0.0% 0.0% 0.0%
0 0.1% 0.0% 0.1%
0 0.3% 0.0% 0.3%
0 0.2% 0.0% 0.2%
0 1.2% 0.0% 1.2%
34 75.5% 100.0% 0.0%
32 70.5% 94.1% 0.0%
1 1.7% 2.9% 0.0%
0 0.1% 0.0% 0.1%
0 0.6% 0.0% 0.6%
1 0.0% 2.9% 0.0%
0 0.6% 0.0% 0.6%
0 1.9% 0.0% 1.9%
2 4.9% 5.9% 0.0%
2 6.1% 5.9% 0.2%
1 9.9% 2.9% 7.0%
34
8
7
0
0
0
0
0
0
0
0
0
0
0
0
0
0
0
0
0
2
Geographic Data Source: Linn
Occupational Category: Administrative Support
49

Oregon Judicial Department
Utilization Analysis by Gender, Race, and Disability
Location: Malheur
EEO Category: Administrative Support
Gender/Race Number of
Employees
Labor Force
Availability
Judicial
Department
Work Force
Underutilization
% FTE
Males
WhiteHispanicBlack or AfricanAmericanAsianNative-Hawaiian or Other Pacific IslanderAmerican-Indian or Alaskan NativeTwo or More Races
Females
WhiteHispanicBlack or AfricanAmericanAsianNative-Hawaiian or Other Pacific IslanderAmerican-Indian or Alaskan NativeTwo or More Races
Total Males of Color
Total Females of Color
Total Employees of Color
Total Employees
Total Disabled Employee
0 22.8% 0.0% 22.8%
0 16.2% 0.0% 16.2%
0 5.0% 0.0% 5.0%
0 0.0% 0.0% 0.0%
0 0.6% 0.0% 0.6%
0 0.0% 0.0% 0.0%
0 0.0% 0.0% 0.0%
0 1.0% 0.0% 1.0%
0 6.6% 0.0% 6.6%
12 77.1% 100.0% 0.0%
10 60.9% 83.3% 0.0%
2 11.6% 16.7% 0.0%
0 0.0% 0.0% 0.0%
0 1.6% 0.0% 1.6%
0 0.0% 0.0% 0.0%
0 0.8% 0.0% 0.8%
0 2.2% 0.0% 2.2%
2 16.2% 16.7% 0.0%
2 22.8% 16.7% 6.1%
0 8.8% 0.0% 8.8%
12
2
1
0
0
0
0
0
0
0
0
0
0
0
0
0
0
0
0
0
1
Geographic Data Source: Malheur
Occupational Category: Administrative Support
50

Oregon Judicial Department
Utilization Analysis by Gender, Race, and Disability
Location: Marion
EEO Category: Administrative Support
Gender/Race Number of
Employees
Labor Force
Availability
Judicial
Department
Work Force
Underutilization
% FTE
Males
WhiteHispanicBlack or AfricanAmericanAsianNative-Hawaiian or Other Pacific IslanderAmerican-Indian or Alaskan NativeTwo or More Races
Females
WhiteHispanicBlack or AfricanAmericanAsianNative-Hawaiian or Other Pacific IslanderAmerican-Indian or Alaskan NativeTwo or More Races
Total Males of Color
Total Females of Color
Total Employees of Color
Total Employees
Total Disabled Employee
9 29.7% 11.4% 18.3%
7 25.2% 8.9% 16.3%
1 2.6% 1.3% 1.3%
0 0.4% 0.0% 0.4%
0 0.5% 0.0% 0.5%
0 0.2% 0.0% 0.2%
0 0.3% 0.0% 0.3%
1 0.8% 1.3% 0.0%
2 4.8% 2.5% 2.3%
70 70.3% 88.6% 0.0%
61 61.6% 77.2% 0.0%
7 4.8% 8.9% 0.0%
0 0.3% 0.0% 0.3%
0 0.8% 0.0% 0.8%
0 0.1% 0.0% 0.1%
0 0.9% 0.0% 0.9%
2 1.8% 2.5% 0.0%
9 8.7% 11.4% 0.0%
11 13.5% 13.9% 0.0%
2 10.3% 2.5% 7.8%
79
14
12
1
0
0
0
0
0
1
0
0
0
0
0
0
0
0
0
0
6
Geographic Data Source: Salem PMSA
Occupational Category: Administrative Support
51

Oregon Judicial Department
Utilization Analysis by Gender, Race, and Disability
Location: Morrow
EEO Category: Administrative Support
Gender/Race Number of
Employees
Labor Force
Availability
Judicial
Department
Work Force
Underutilization
% FTE
Males
WhiteHispanicBlack or AfricanAmericanAsianNative-Hawaiian or Other Pacific IslanderAmerican-Indian or Alaskan NativeTwo or More Races
Females
WhiteHispanicBlack or AfricanAmericanAsianNative-Hawaiian or Other Pacific IslanderAmerican-Indian or Alaskan NativeTwo or More Races
Total Males of Color
Total Females of Color
Total Employees of Color
Total Employees
Total Disabled Employee
0 21.6% 0.0% 21.6%
0 17.5% 0.0% 17.5%
0 2.6% 0.0% 2.6%
0 0.0% 0.0% 0.0%
0 0.0% 0.0% 0.0%
0 0.0% 0.0% 0.0%
0 0.4% 0.0% 0.4%
0 1.1% 0.0% 1.1%
0 4.1% 0.0% 4.1%
3 78.5% 100.0% 0.0%
3 70.9% 100.0% 0.0%
0 4.1% 0.0% 4.1%
0 0.4% 0.0% 0.4%
0 0.4% 0.0% 0.4%
0 0.0% 0.0% 0.0%
0 1.6% 0.0% 1.6%
0 1.1% 0.0% 1.1%
0 7.6% 0.0% 7.6%
0 11.7% 0.0% 11.7%
0 8.6% 0.0% 8.6%
3
0
0
0
0
0
0
0
0
0
0
0
0
0
0
0
0
0
0
0
0
Geographic Data Source: Morrow
Occupational Category: Administrative Support
52

Oregon Judicial Department
Utilization Analysis by Gender, Race, and Disability
Location: Multnomah
EEO Category: Administrative Support
Gender/Race Number of
Employees
Labor Force
Availability
Judicial
Department
Work Force
Underutilization
% FTE
Males
WhiteHispanicBlack or AfricanAmericanAsianNative-Hawaiian or Other Pacific IslanderAmerican-Indian or Alaskan NativeTwo or More Races
Females
WhiteHispanicBlack or AfricanAmericanAsianNative-Hawaiian or Other Pacific IslanderAmerican-Indian or Alaskan NativeTwo or More Races
Total Males of Color
Total Females of Color
Total Employees of Color
Total Employees
Total Disabled Employee
37 33.6% 15.8% 17.8%
26 28.8% 11.1% 17.7%
6 1.5% 2.6% 0.0%
2 0.9% 0.9% 0.0%
0 1.2% 0.0% 1.2%
0 0.1% 0.0% 0.1%
0 0.2% 0.0% 0.2%
3 0.8% 1.3% 0.0%
11 4.7% 4.7% 0.0%
197 66.4% 84.2% 0.0%
149 57.8% 63.7% 0.0%
7 2.7% 3.0% 0.0%
9 1.4% 3.8% 0.0%
15 2.1% 6.4% 0.0%
1 0.2% 0.4% 0.0%
0 0.6% 0.0% 0.6%
16 1.6% 6.8% 0.0%
48 8.6% 20.5% 0.0%
59 13.3% 25.2% 0.0%
5 9.1% 2.1% 7.0%
234
41
41
0
0
2
0
0
0
0
0
0
0
0
0
0
1
0
0
0
16
Geographic Data Source: Portland-Vancouver PMSA
Occupational Category: Administrative Support
53

Oregon Judicial Department
Utilization Analysis by Gender, Race, and Disability
Location: OSCA-Appellate
EEO Category: Administrative Support
Gender/Race Number of
Employees
Labor Force
Availability
Judicial
Department
Work Force
Underutilization
% FTE
Males
WhiteHispanicBlack or AfricanAmericanAsianNative-Hawaiian or Other Pacific IslanderAmerican-Indian or Alaskan NativeTwo or More Races
Females
WhiteHispanicBlack or AfricanAmericanAsianNative-Hawaiian or Other Pacific IslanderAmerican-Indian or Alaskan NativeTwo or More Races
Total Males of Color
Total Females of Color
Total Employees of Color
Total Employees
Total Disabled Employee
13 29.7% 14.6% 15.1%
12 25.2% 13.5% 11.7%
0 2.6% 0.0% 2.6%
1 0.4% 1.1% 0.0%
0 0.5% 0.0% 0.5%
0 0.2% 0.0% 0.2%
0 0.3% 0.0% 0.3%
0 0.8% 0.0% 0.8%
1 4.8% 1.1% 3.7%
76 70.3% 85.4% 0.0%
67 61.6% 75.3% 0.0%
5 4.8% 5.6% 0.0%
1 0.3% 1.1% 0.0%
0 0.8% 0.0% 0.8%
1 0.1% 1.1% 0.0%
1 0.9% 1.1% 0.0%
1 1.8% 1.1% 0.7%
9 8.7% 10.1% 0.0%
10 13.5% 11.2% 2.3%
3 10.3% 3.4% 6.9%
89
13
10
2
0
0
0
0
0
3
0
0
0
0
0
0
0
0
0
2
6
Geographic Data Source: Salem PMSA
Occupational Category: Administrative Support
54

Oregon Judicial Department
Utilization Analysis by Gender, Race, and Disability
Location: Polk
EEO Category: Administrative Support
Gender/Race Number of
Employees
Labor Force
Availability
Judicial
Department
Work Force
Underutilization
% FTE
Males
WhiteHispanicBlack or AfricanAmericanAsianNative-Hawaiian or Other Pacific IslanderAmerican-Indian or Alaskan NativeTwo or More Races
Females
WhiteHispanicBlack or AfricanAmericanAsianNative-Hawaiian or Other Pacific IslanderAmerican-Indian or Alaskan NativeTwo or More Races
Total Males of Color
Total Females of Color
Total Employees of Color
Total Employees
Total Disabled Employee
2 29.7% 11.1% 18.6%
2 25.2% 11.1% 14.1%
0 2.6% 0.0% 2.6%
0 0.4% 0.0% 0.4%
0 0.5% 0.0% 0.5%
0 0.2% 0.0% 0.2%
0 0.3% 0.0% 0.3%
0 0.8% 0.0% 0.8%
0 4.8% 0.0% 4.8%
16 70.3% 88.9% 0.0%
15 61.6% 83.3% 0.0%
1 4.8% 5.6% 0.0%
0 0.3% 0.0% 0.3%
0 0.8% 0.0% 0.8%
0 0.1% 0.0% 0.1%
0 0.9% 0.0% 0.9%
0 1.8% 0.0% 1.8%
1 8.7% 5.6% 3.1%
1 13.5% 5.6% 7.9%
0 10.3% 0.0% 10.3%
18
3
2
0
0
0
0
0
0
0
0
0
0
0
0
0
0
0
0
1
1
Geographic Data Source: Salem PMSA
Occupational Category: Administrative Support
55

Oregon Judicial Department
Utilization Analysis by Gender, Race, and Disability
Location: Sherman
EEO Category: Administrative Support
Gender/Race Number of
Employees
Labor Force
Availability
Judicial
Department
Work Force
Underutilization
% FTE
Males
WhiteHispanicBlack or AfricanAmericanAsianNative-Hawaiian or Other Pacific IslanderAmerican-Indian or Alaskan NativeTwo or More Races
Females
WhiteHispanicBlack or AfricanAmericanAsianNative-Hawaiian or Other Pacific IslanderAmerican-Indian or Alaskan NativeTwo or More Races
Total Males of Color
Total Females of Color
Total Employees of Color
Total Employees
Total Disabled Employee
0 22.4% 0.0% 22.4%
0 17.6% 0.0% 17.6%
0 2.4% 0.0% 2.4%
0 0.0% 0.0% 0.0%
0 0.0% 0.0% 0.0%
0 0.0% 0.0% 0.0%
0 2.4% 0.0% 2.4%
0 0.0% 0.0% 0.0%
0 4.8% 0.0% 4.8%
1 78.8% 100.0% 0.0%
1 76.5% 100.0% 0.0%
0 0.0% 0.0% 0.0%
0 0.0% 0.0% 0.0%
0 0.0% 0.0% 0.0%
0 0.0% 0.0% 0.0%
0 0.0% 0.0% 0.0%
0 2.4% 0.0% 2.4%
0 2.4% 0.0% 2.4%
0 7.2% 0.0% 7.2%
0 6.3% 0.0% 6.3%
1
0
0
0
0
0
0
0
0
0
0
0
0
0
0
0
0
0
0
0
0
Geographic Data Source: Sherman
Occupational Category: Administrative Support
56

Oregon Judicial Department
Utilization Analysis by Gender, Race, and Disability
Location: Tillamook
EEO Category: Administrative Support
Gender/Race Number of
Employees
Labor Force
Availability
Judicial
Department
Work Force
Underutilization
% FTE
Males
WhiteHispanicBlack or AfricanAmericanAsianNative-Hawaiian or Other Pacific IslanderAmerican-Indian or Alaskan NativeTwo or More Races
Females
WhiteHispanicBlack or AfricanAmericanAsianNative-Hawaiian or Other Pacific IslanderAmerican-Indian or Alaskan NativeTwo or More Races
Total Males of Color
Total Females of Color
Total Employees of Color
Total Employees
Total Disabled Employee
0 22.7% 0.0% 22.7%
0 21.0% 0.0% 21.0%
0 0.9% 0.0% 0.9%
0 0.0% 0.0% 0.0%
0 0.5% 0.0% 0.5%
0 0.2% 0.0% 0.2%
0 0.0% 0.0% 0.0%
0 0.2% 0.0% 0.2%
0 1.8% 0.0% 1.8%
9 77.2% 100.0% 0.0%
9 71.9% 100.0% 0.0%
0 2.0% 0.0% 2.0%
0 0.0% 0.0% 0.0%
0 0.2% 0.0% 0.2%
0 0.2% 0.0% 0.2%
0 0.2% 0.0% 0.2%
0 2.8% 0.0% 2.8%
0 5.4% 0.0% 5.4%
0 7.2% 0.0% 7.2%
0 14.1% 0.0% 14.1%
9
2
1
0
0
0
0
0
0
0
0
0
0
0
0
0
0
0
0
0
1
Geographic Data Source: Tillamook
Occupational Category: Administrative Support
57

Oregon Judicial Department
Utilization Analysis by Gender, Race, and Disability
Location: Umatilla
EEO Category: Administrative Support
Gender/Race Number of
Employees
Labor Force
Availability
Judicial
Department
Work Force
Underutilization
% FTE
Males
WhiteHispanicBlack or AfricanAmericanAsianNative-Hawaiian or Other Pacific IslanderAmerican-Indian or Alaskan NativeTwo or More Races
Females
WhiteHispanicBlack or AfricanAmericanAsianNative-Hawaiian or Other Pacific IslanderAmerican-Indian or Alaskan NativeTwo or More Races
Total Males of Color
Total Females of Color
Total Employees of Color
Total Employees
Total Disabled Employee
0 24.6% 0.0% 24.6%
0 21.1% 0.0% 21.1%
0 2.2% 0.0% 2.2%
0 0.1% 0.0% 0.1%
0 0.2% 0.0% 0.2%
0 0.0% 0.0% 0.0%
0 0.5% 0.0% 0.5%
0 0.3% 0.0% 0.3%
0 3.3% 0.0% 3.3%
30 75.5% 100.0% 0.0%
26 66.4% 86.7% 0.0%
3 5.2% 10.0% 0.0%
0 0.1% 0.0% 0.1%
0 0.7% 0.0% 0.7%
0 0.0% 0.0% 0.0%
0 1.9% 0.0% 1.9%
1 1.3% 3.3% 0.0%
4 9.2% 13.3% 0.0%
4 12.5% 13.3% 0.0%
1 10.0% 3.3% 6.7%
30
7
6
0
0
0
0
0
0
0
0
0
0
0
0
0
0
0
0
0
2
Geographic Data Source: Umatilla
Occupational Category: Administrative Support
58

Oregon Judicial Department
Utilization Analysis by Gender, Race, and Disability
Location: Union
EEO Category: Administrative Support
Gender/Race Number of
Employees
Labor Force
Availability
Judicial
Department
Work Force
Underutilization
% FTE
Males
WhiteHispanicBlack or AfricanAmericanAsianNative-Hawaiian or Other Pacific IslanderAmerican-Indian or Alaskan NativeTwo or More Races
Females
WhiteHispanicBlack or AfricanAmericanAsianNative-Hawaiian or Other Pacific IslanderAmerican-Indian or Alaskan NativeTwo or More Races
Total Males of Color
Total Females of Color
Total Employees of Color
Total Employees
Total Disabled Employee
1 26.6% 6.7% 19.9%
1 25.0% 6.7% 18.3%
0 0.5% 0.0% 0.5%
0 0.2% 0.0% 0.2%
0 0.0% 0.0% 0.0%
0 0.2% 0.0% 0.2%
0 0.4% 0.0% 0.4%
0 0.4% 0.0% 0.4%
0 1.7% 0.0% 1.7%
14 73.3% 93.3% 0.0%
14 68.3% 93.3% 0.0%
0 1.7% 0.0% 1.7%
0 0.0% 0.0% 0.0%
0 0.8% 0.0% 0.8%
0 1.2% 0.0% 1.2%
0 0.6% 0.0% 0.6%
0 0.8% 0.0% 0.8%
0 5.1% 0.0% 5.1%
0 6.8% 0.0% 6.8%
0 9.1% 0.0% 9.1%
15
2
2
0
0
0
0
0
0
0
0
0
0
0
0
0
0
0
0
1
1
Geographic Data Source: Union
Occupational Category: Administrative Support
59
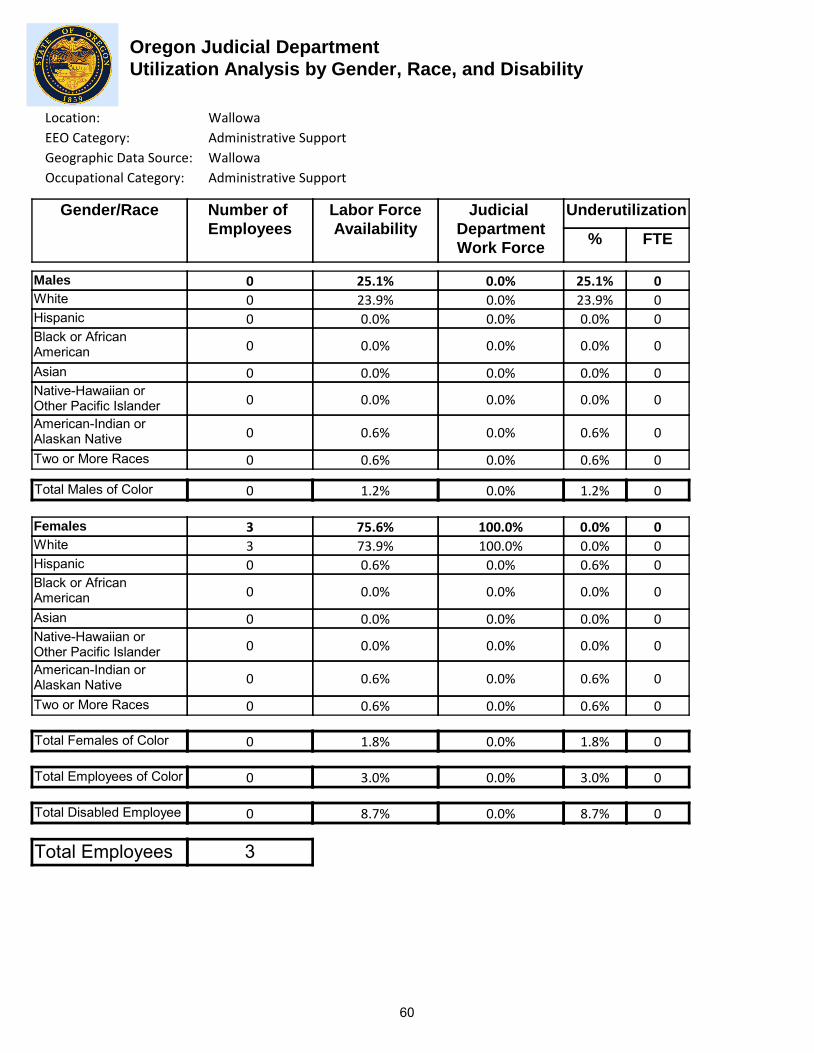
Oregon Judicial Department
Utilization Analysis by Gender, Race, and Disability
Location: Wallowa
EEO Category: Administrative Support
Gender/Race Number of
Employees
Labor Force
Availability
Judicial
Department
Work Force
Underutilization
% FTE
Males
WhiteHispanicBlack or AfricanAmericanAsianNative-Hawaiian or Other Pacific IslanderAmerican-Indian or Alaskan NativeTwo or More Races
Females
WhiteHispanicBlack or AfricanAmericanAsianNative-Hawaiian or Other Pacific IslanderAmerican-Indian or Alaskan NativeTwo or More Races
Total Males of Color
Total Females of Color
Total Employees of Color
Total Employees
Total Disabled Employee
0 25.1% 0.0% 25.1%
0 23.9% 0.0% 23.9%
0 0.0% 0.0% 0.0%
0 0.0% 0.0% 0.0%
0 0.0% 0.0% 0.0%
0 0.0% 0.0% 0.0%
0 0.6% 0.0% 0.6%
0 0.6% 0.0% 0.6%
0 1.2% 0.0% 1.2%
3 75.6% 100.0% 0.0%
3 73.9% 100.0% 0.0%
0 0.6% 0.0% 0.6%
0 0.0% 0.0% 0.0%
0 0.0% 0.0% 0.0%
0 0.0% 0.0% 0.0%
0 0.6% 0.0% 0.6%
0 0.6% 0.0% 0.6%
0 1.8% 0.0% 1.8%
0 3.0% 0.0% 3.0%
0 8.7% 0.0% 8.7%
3
0
0
0
0
0
0
0
0
0
0
0
0
0
0
0
0
0
0
0
0
Geographic Data Source: Wallowa
Occupational Category: Administrative Support
60

Oregon Judicial Department
Utilization Analysis by Gender, Race, and Disability
Location: Wasco
EEO Category: Administrative Support
Gender/Race Number of
Employees
Labor Force
Availability
Judicial
Department
Work Force
Underutilization
% FTE
Males
WhiteHispanicBlack or AfricanAmericanAsianNative-Hawaiian or Other Pacific IslanderAmerican-Indian or Alaskan NativeTwo or More Races
Females
WhiteHispanicBlack or AfricanAmericanAsianNative-Hawaiian or Other Pacific IslanderAmerican-Indian or Alaskan NativeTwo or More Races
Total Males of Color
Total Females of Color
Total Employees of Color
Total Employees
Total Disabled Employee
0 23.1% 0.0% 23.1%
0 20.9% 0.0% 20.9%
0 0.9% 0.0% 0.9%
0 0.0% 0.0% 0.0%
0 0.2% 0.0% 0.2%
0 0.0% 0.0% 0.0%
0 0.6% 0.0% 0.6%
0 0.6% 0.0% 0.6%
0 2.3% 0.0% 2.3%
10 77.0% 100.0% 0.0%
10 69.3% 100.0% 0.0%
0 4.5% 0.0% 4.5%
0 0.2% 0.0% 0.2%
0 0.6% 0.0% 0.6%
0 0.2% 0.0% 0.2%
0 2.0% 0.0% 2.0%
0 0.4% 0.0% 0.4%
0 7.9% 0.0% 7.9%
0 10.2% 0.0% 10.2%
0 7.7% 0.0% 7.7%
10
2
2
0
0
0
0
0
0
0
0
0
0
0
0
0
0
0
0
1
0
Geographic Data Source: Wasco
Occupational Category: Administrative Support
61
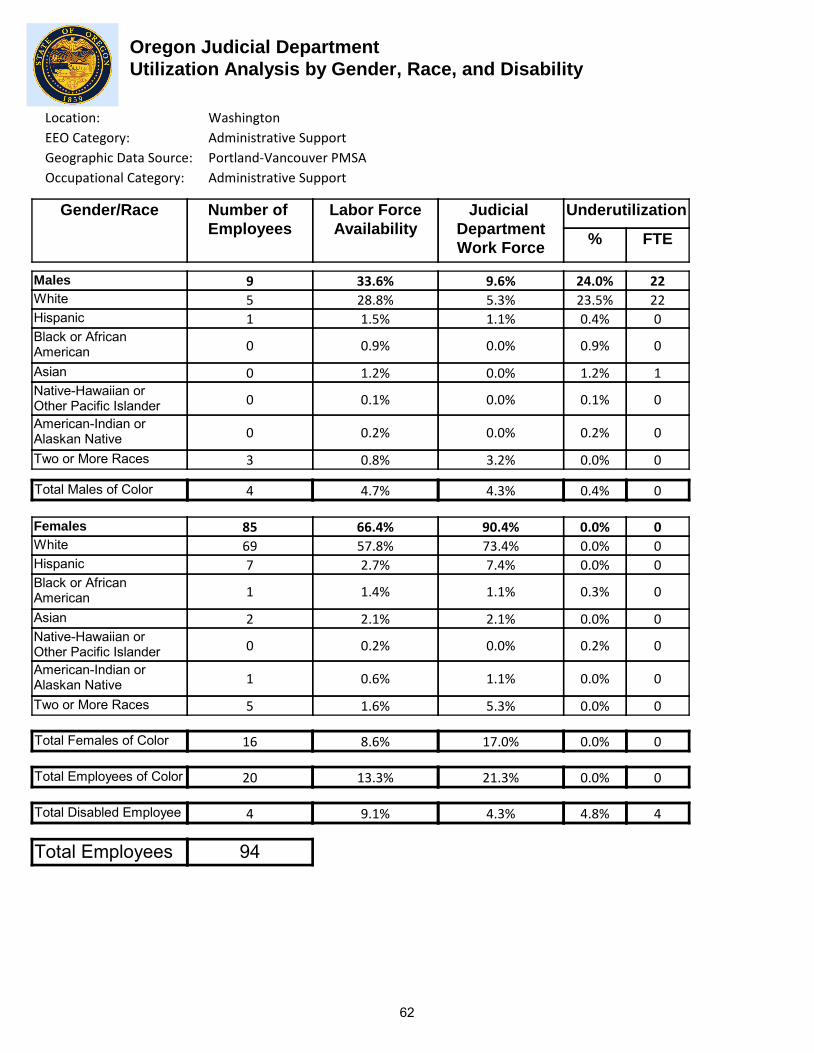
Oregon Judicial Department
Utilization Analysis by Gender, Race, and Disability
Location: Washington
EEO Category: Administrative Support
Gender/Race Number of
Employees
Labor Force
Availability
Judicial
Department
Work Force
Underutilization
% FTE
Males
WhiteHispanicBlack or AfricanAmericanAsianNative-Hawaiian or Other Pacific IslanderAmerican-Indian or Alaskan NativeTwo or More Races
Females
WhiteHispanicBlack or AfricanAmericanAsianNative-Hawaiian or Other Pacific IslanderAmerican-Indian or Alaskan NativeTwo or More Races
Total Males of Color
Total Females of Color
Total Employees of Color
Total Employees
Total Disabled Employee
9 33.6% 9.6% 24.0%
5 28.8% 5.3% 23.5%
1 1.5% 1.1% 0.4%
0 0.9% 0.0% 0.9%
0 1.2% 0.0% 1.2%
0 0.1% 0.0% 0.1%
0 0.2% 0.0% 0.2%
3 0.8% 3.2% 0.0%
4 4.7% 4.3% 0.4%
85 66.4% 90.4% 0.0%
69 57.8% 73.4% 0.0%
7 2.7% 7.4% 0.0%
1 1.4% 1.1% 0.3%
2 2.1% 2.1% 0.0%
0 0.2% 0.0% 0.2%
1 0.6% 1.1% 0.0%
5 1.6% 5.3% 0.0%
16 8.6% 17.0% 0.0%
20 13.3% 21.3% 0.0%
4 9.1% 4.3% 4.8%
94
22
22
0
0
1
0
0
0
0
0
0
0
0
0
0
0
0
0
0
4
Geographic Data Source: Portland-Vancouver PMSA
Occupational Category: Administrative Support
62

Oregon Judicial Department
Utilization Analysis by Gender, Race, and Disability
Location: Yamhill
EEO Category: Administrative Support
Gender/Race Number of
Employees
Labor Force
Availability
Judicial
Department
Work Force
Underutilization
% FTE
Males
WhiteHispanicBlack or AfricanAmericanAsianNative-Hawaiian or Other Pacific IslanderAmerican-Indian or Alaskan NativeTwo or More Races
Females
WhiteHispanicBlack or AfricanAmericanAsianNative-Hawaiian or Other Pacific IslanderAmerican-Indian or Alaskan NativeTwo or More Races
Total Males of Color
Total Females of Color
Total Employees of Color
Total Employees
Total Disabled Employee
1 27.4% 3.3% 24.1%
1 25.2% 3.3% 21.9%
0 1.6% 0.0% 1.6%
0 0.0% 0.0% 0.0%
0 0.0% 0.0% 0.0%
0 0.0% 0.0% 0.0%
0 0.2% 0.0% 0.2%
0 0.4% 0.0% 0.4%
0 2.2% 0.0% 2.2%
29 72.5% 96.7% 0.0%
27 66.4% 90.0% 0.0%
2 3.3% 6.7% 0.0%
0 0.1% 0.0% 0.1%
0 0.6% 0.0% 0.6%
0 0.1% 0.0% 0.1%
0 0.8% 0.0% 0.8%
0 1.1% 0.0% 1.1%
2 6.0% 6.7% 0.0%
2 8.2% 6.7% 1.5%
1 11.7% 3.3% 8.4%
30
7
6
0
0
0
0
0
0
0
0
0
0
0
0
0
0
0
0
0
2
Geographic Data Source: Yamhill
Occupational Category: Administrative Support
63