Oregon Investment Council...Dec 12, 2018 · investment approach based on combining industry...
168
Oregon Investment Council December 12, 2018 Rukaiyah Adams Chair John Skjervem Chief Investment Officer Tobias Read State Treasurer
Transcript of Oregon Investment Council...Dec 12, 2018 · investment approach based on combining industry...
Oregon Investment Council
December 12, 2018
Rukaiyah Adams
Chair
John Skjervem
Chief Investment Officer Tobias Read
State Treasurer


1
Global Infrastructure Partners Fund IV, L.P.
Purpose Staff and TorreyCove recommend a $400 million commitment to Global Infrastructure Partners Fund IV, L.P. (“GIP IV” or the “Fund”) for the OPERF Alternatives Portfolio, subject to the satisfactory negotiation of terms and conditions with Staff working in concert with legal counsel. This proposed commitment represents the continuation of a relationship on behalf of the OPERF Alternatives Portfolio. Background Global Infrastructure Partners (“GIP” or the “Firm”) is an independent fund manager focused on investing in infrastructure assets in the energy, transportation, and water/waste industries. GIP was founded in 2006 by a team of former Credit Suisse (“CS”) and General Electric (“GE”) professionals with the goal of creating an investment approach based on combining industry expertise with industrial best practice operational management. GIP currently manages $46 billion across its platforms. Oregon's relationship with GIP dates back to 2011, and consists of three mandates across two strategies:
Infrastructure equity – $150 million to Global Infrastructure Partners Fund II in 2011;
Infrastructure debt – $200 million to Global Infrastructure Partners Capital Solutions Fund in 2014; and
Infrastructure equity – $400 million to Global Infrastructure Partners Fund III in 2015. GIP is seeking $17.5 billion in aggregate L.P. capital commitments for the Fund with a $20.0 billion hard cap. The Firm plans to hold a first close on or about December 14, 2018. Well in excess of the Alternatives Portfolio's target return, the Fund is targeting a gross internal rate of return of 15% to 20%. Discussion/Investment Considerations With this Fund, GIP will continue its traditional focus on investing in infrastructure assets on a global basis, primarily in the energy, transportation, and water/waste sectors. Fundamental to its investment strategy, the Firm intends to focus on driving operational improvements, deploying its operating team to implement industrial best practices, with the goal of generating incremental returns for the Fund. An important feature of GIP IV strategy is the Firm's focus on large‐scale, complex transactions, which should provide less competition and more opportunities for operational value creation. Of note, this scale and expertise has allowed for strategic partnerships with industrial partners, positioning GIP to enter into joint venture relationships with industry leaders (to date, approximately half of GIP's equity investments have been through industrial JVs). The Firm expects to make between 10 to 15 equity investments and generally aims to secure a controlling stake. Attributes:
Experienced team. GIP has a deep and experienced team, with a balance of financial and operational backgrounds. The GIP team has been very stable, with many of its senior members joining from the original sponsoring partners Credit Suisse (including the former head of global investment banking) and GE (including the former CEO of GE Infrastructure). This breadth of experience provides GIP with the capabilities to evaluate the widest possible set of opportunities on behalf of the Fund.
Strong operational orientation. GIP has built out a 28‐member operations team, including a number of former GE executives who apply GE concepts to GIP assets. This operational focus seeks measurable gains in areas such as customer service, pricing, operating efficiency, process improvements, capital spending, working capital management and cost control. These operational improvements drive incremental EBITDA growth post‐investment, which in turn drives returns without requiring multiple expansion to achieve acceptable returns.
2
Global and large cap focus. The Firm’s focus with GIP IV will be on large, global infrastructure investments, a strategy that complements OPERF’s existing infrastructure portfolio. Moreover, GIP is differentiated by their focus on JV transactions with large industrial partners (which have encompassed a broad spectrum of partners, including Kinder Morgan, MSC, ACS, and Ørsted)
Market opportunity. The historical underinvestment in infrastructure, along with macroeconomic trends of growing populations and urbanization, has resulted in substantial and often imperative investment requirements in both Europe and North America. At the same time, traditional suppliers of infrastructure capital, such as governments and utilities, continue to face capital constraints. GIP expects continued high corporate asset disposal activity among relevant companies, which will be driven by an enhanced focus on core operations, financing restrictions, and a need to reduce balance sheets. Thus, Staff believes the target opportunity set for GIP’s strategy is very attractive.
Strong interim results. To date, GIP I and II have distributed approximately $14.0 billion to investors, primarily as a result of 13 exits. On an aggregate level, these exits have yielded a gross multiple of invested capital of 2.6x and a gross IRR of 25.1%.
Concerns:
Competitive market for investment opportunities. Interest from institutional investors in real assets, including infrastructure strategies, remains high. As more capital enters the market for private infrastructure, expected returns may decline. [Mitigant: Staff has confidence in GIP’s financial discipline and expertise in originating, structuring, and executing infrastructure transactions. Moreover, GIP focuses on large‐scale transactions, which tend to be more complex and less competitive than other market segments.]
Fund IV increase. Fund IV represents a substantial increase in capital commitments relative to Fund III. Such increases in assets under management may result in a deviation from stated objectives, i.e., “style drift,” as well as create strains on organizational infrastructure. [Mitigant: GIP's approach is to focus on large‐scale, complex transactions and the capital base allows for deployment of a significant amount of commitments. Furthermore, the Fund is subject to restrictions on the size and type of investments, limiting the potential impacts on investment approach.]
Significant unrealized value. As of June 30, 2018, the existing GIP Funds have an unrealized carrying value of $22.5 billion across 16 investments. Managing the unrealized portfolio will require significant time and attention from the investment and operating teams. [Mitigant: With an investment team of 78 professionals (an increase of 21 since the launch of Fund III), GIP feels that it is adequately staffed to manage the existing Funds and deploy Fund IV. GIP has demonstrated through the deployment and management of Fund III its ability to navigate these challenges successfully.]
Political/regulatory risks. The political and regulatory environment for infrastructure is evolving and changes therein may have an adverse effect on the Firm’s ability to pursue its investment strategy. [Mitigant: All investments in the infrastructure sector are subject to the aforementioned risks. Staff finds the risk/reward tradeoff to be reasonable and supported by: a) the team’s experience and technical expertise; b) the Fund’s proposed asset diversification; and, c) the Fund’s likely geographic focus on OECD countries.]
Terms Fund terms include a management fee on committed capital with a standard carry and preferred return. The Fund will have a five‐year investment period, and a 10‐year duration with up to two, one‐year extensions at the General Partner's discretion plus two additional one‐year extensions with Limited Partner consent. During fundraising efforts, no placement agent had contact with Treasury staff.
3
Conclusion The Alternatives Portfolio target allocation to infrastructure investments is 25%, with a range of 20% to 30%, or approximately $2.3 billion at current OPERF NAV. To complement this allocation’s current $1.8 billion NAV, Staff considers GIP IV an anchor commitment within the OPERF infrastructure portfolio. Staff also believes GIP IV represents an opportunity to invest with an experienced manager in an attractive sector. Since its formation in 2006, GIP has established a leading reputation in the global infrastructure space, with an investment team whose breadth and depth of resources are nearly unrivaled. Moreover, GIP is differentiated by their operational value‐add strategy and industrial JV focus. At a macro level, requirements for infrastructure investment are massive, underpinning positive demand dynamics for capital, and Staff believes GIP is well positioned to capitalize on the Fund’s target opportunity set.
MEMORANDUM
TO: Oregon Public Employees Retirement Fund (“OPERF”)
FROM: TorreyCove Capital Partners (“TorreyCove”)
DATE: December 3, 2018
RE: Global Infrastructure Partners IV, L.P.
Strategy:
GIP IV will be a continuation of the strategy deployed in the prior three funds, targeting core and core plus infrastructure assets in the energy, transport, and water/waste sectors in OECD markets. Fund IV does not have targeted allocation ranges by sector or geography but will have restrictions pertaining to investments made in non-OECD countries and single portfolio company concentration limits. The Firm believes that in pursuing larger transactions there will be less competition and greater opportunity to utilize their in-house operational expertise to drive growth within more complex businesses. Moreover, GIP will continue to pursue long-lived assets that provide essential services to an industry or economy that have strong and secure market positions with high barriers to entry, stable and predictable cash flows from regulated or contracted revenues, inflation protection, and downside protection with room for operational growth.
Please see attached investment memorandum for further detail on the investment opportunity.
Conclusion:
The Fund offers OPERF an opportunity to participate in a differentiated portfolio of private investments with relatively attractive overall terms. TorreyCove’s review of the General Partner and the proposed Fund indicates that the potential returns available justify the risks associated with an investment in the Fund. TorreyCove recommends that OPERF consider a commitment of $400.0 million to the Fund. TorreyCove’s recommendation is contingent upon the following:
(1) Satisfactory negotiation or clarification of certain terms of the investment;
(2) Satisfactory completion of legal documents;
(3) Satisfactory continuation and finalization of due diligence;
(4) No material changes to the investment opportunity as presented; and
(5) Confidentiality maintained regarding the commitment of OPERF to the Partnership until such time as all the preceding conditions are met.
Oregon Investment Council OPERF Public Equity Portfolio – Global Low Volatility
December 12, 2018 Purpose Staff recommends funding Dimensional Fund Advisors with an $800MM global low volatility portfolio. Background At the October 26, 2016 OIC meeting, Public Equity staff recommended and the OIC approved a 25 percent allocation to Low Volatility strategies within the OPERF Public Equity portfolio. The incorporation of defensive, Low Volatility strategies alongside existing systematic equity strategies that pursue excess returns through deliberate factor tilts has proven to be complementary and served to reduce total equity risk. Regarding the decades‐long persistence of the low volatility anomaly, several explanations exist. The first is that investors prefer a high‐return portfolio, but are reluctant to utilize leverage (or are prohibited from using leverage). In the absence of leverage, high return seeking investors prefer high beta stocks, which increases demand for risky (i.e., high beta) stocks relative to lower beta stocks. This increased demand pushes valuations on high beta stocks up, and subsequently pushes future expected returns on those same stocks down. The second explanation is an agency‐based theory predicated on the observation that long‐only retail mutual fund managers prefer high beta stocks due to those stocks’ positive effect on mutual fund inflows during bull markets. The majority of net, new mutual fund inflows occur during bull markets; moreover, most of these inflows go to funds with the best, recent absolute performance. Assets in retail mutual funds are also very sticky so that poor performance does not result in proportionately large outflows as retail investors typically make withdrawals based on their own personal liquidity needs, not relative mutual fund performance. This retail fund flow dynamic incents mutual fund managers to invest in stocks that do well in bull markets (i.e., high beta stocks) in order to gather more assets, which increases those fund managers’ compensation. The third explanation is based on the use of equity benchmarks for institutional active managers. Low volatility stocks often have low betas, and overweighting low beta stocks in a portfolio leads to higher tracking error relative to cap‐weighted benchmarks. Active managers prefer using their active risk budget (i.e., tracking error) for stocks they believe contain excess return potential (i.e., alpha). By focusing on alpha‐seeking opportunities, active managers attempt to outperform their assigned benchmark. Although low beta stocks often produce better risk‐adjusted return portfolios, active managers don’t get compensated for risk reduction and instead often get penalized or terminated for relative performance lags during bull markets. OPERF Global Low Volatility Implementation Staff has funded four externally‐managed global low volatility managers (Los Angeles Capital, Acadian, AQR, and Arrowstreet) and an internally‐managed Developed ex‐U.S. multifactor strategy that tilts towards low volatility. Total exposure to global low volatility relative to the OPERF Public Equity portfolio stands at approximately 17 percent. As of October 31, 2018, the OPERF Public Global Low Vol portfolio has outperformed the MSCI ACWI IMI Net over both the trailing 1‐ year and since inception (January 1, 2018) periods (Exhibit 1).
Global Low Volatility Staff Recommendation
December 12, 2018
2
Exhibit 1
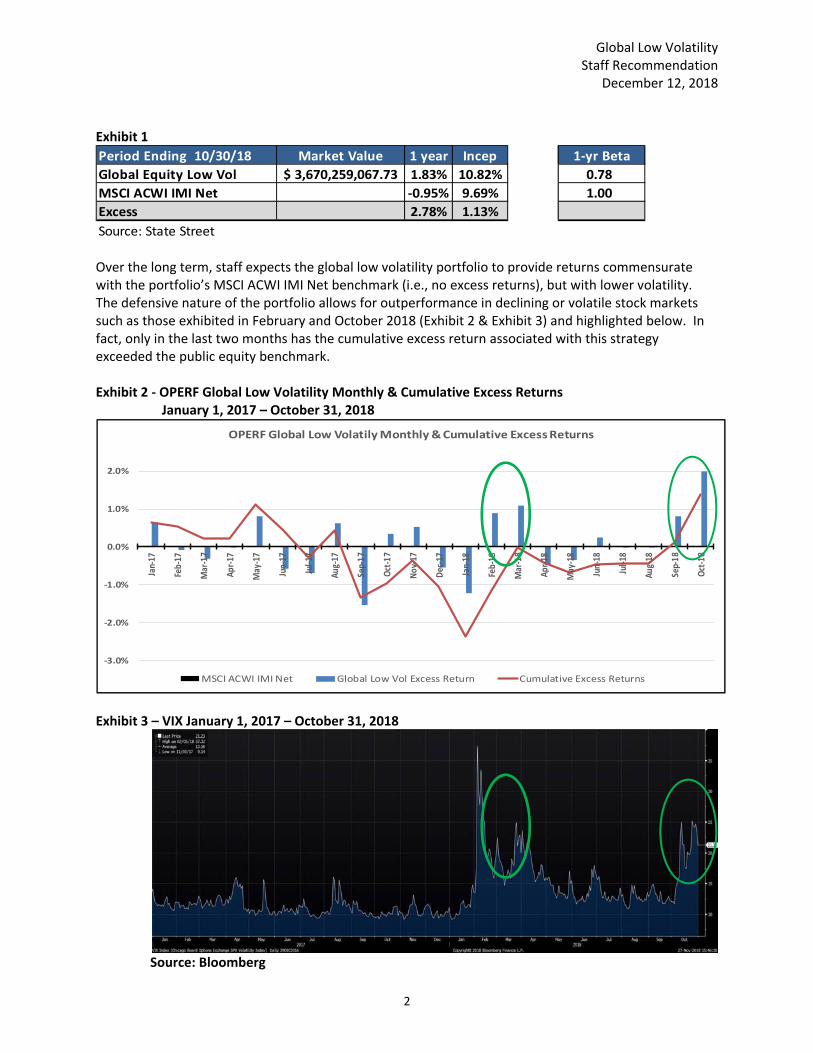
Period Ending 10/30/18 Market Value 1 year Incep 1‐yr Beta
Global Equity Low Vol 3,670,259,067.73$ 1.83% 10.82% 0.78
MSCI ACWI IMI Net ‐0.95% 9.69% 1.00
Excess 2.78% 1.13%
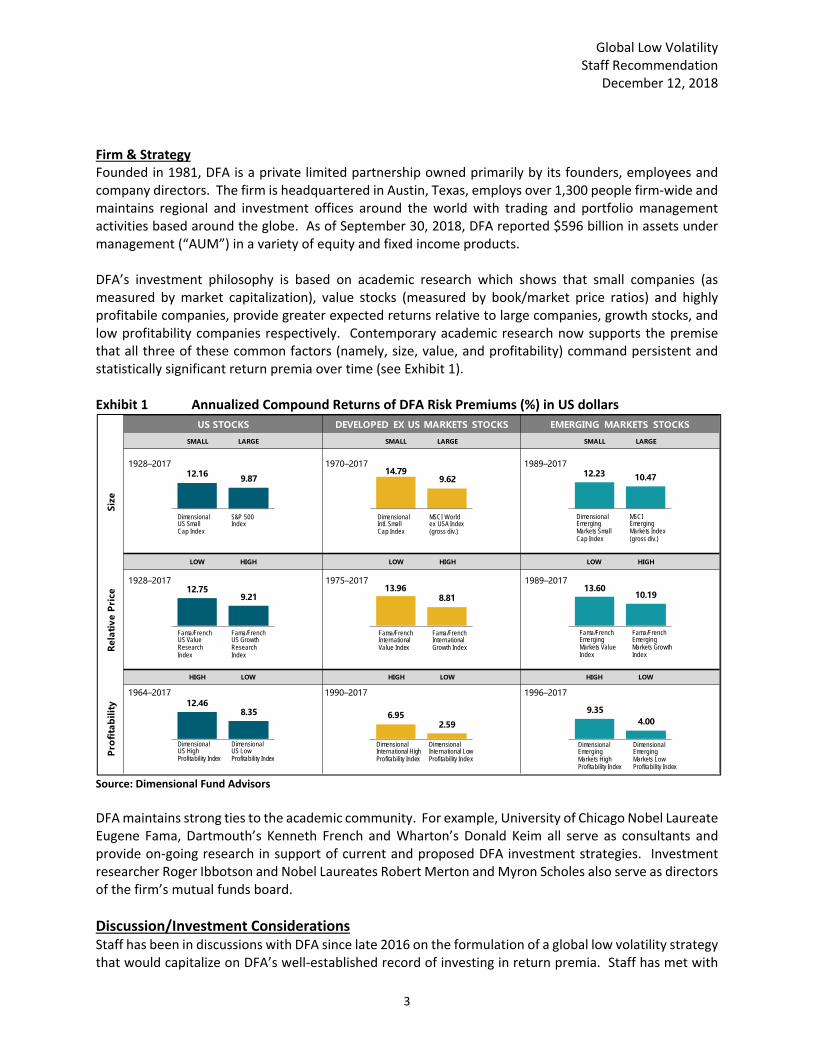
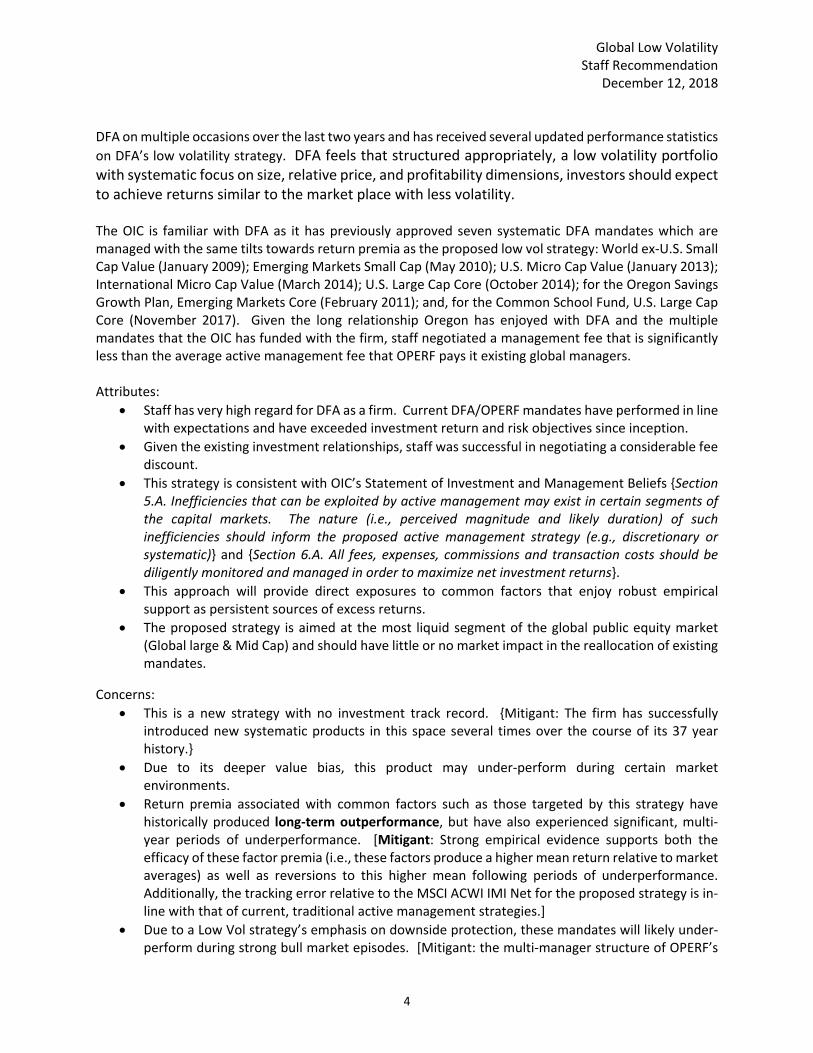
Source: State Street Over the long term, staff expects the global low volatility portfolio to provide returns commensurate with the portfolio’s MSCI ACWI IMI Net benchmark (i.e., no excess returns), but with lower volatility. The defensive nature of the portfolio allows for outperformance in declining or volatile stock markets such as those exhibited in February and October 2018 (Exhibit 2 & Exhibit 3) and highlighted below. In fact, only in the last two months has the cumulative excess return associated with this strategy exceeded the public equity benchmark. Exhibit 2 ‐ OPERF Global Low Volatility Monthly & Cumulative Excess Returns January 1, 2017 – October 31, 2018
Exhibit 3 – VIX January 1, 2017 – October 31, 2018
Source: Bloomberg
‐3.0%
‐2.0%
‐1.0%
0.0%
1.0%
2.0%
Jan‐17
Feb‐17
Mar‐17
Apr‐17
May
‐17
Jun‐17
Jul‐1
7
Aug‐17
Sep‐17
Oct‐17
Nov
‐17
Dec‐17
Jan‐18
Feb‐18
Mar‐18
Apr‐18
May
‐18
Jun‐18
Jul‐1
8
Aug‐18
Sep‐18
Oct‐18
OPERF Global Low Volatily Monthly & Cumulative Excess Returns
MSCI ACWI IMI Net Global Low Vol Excess Return Cumulative Excess Returns
Global Low Volatility Staff Recommendation
December 12, 2018
3
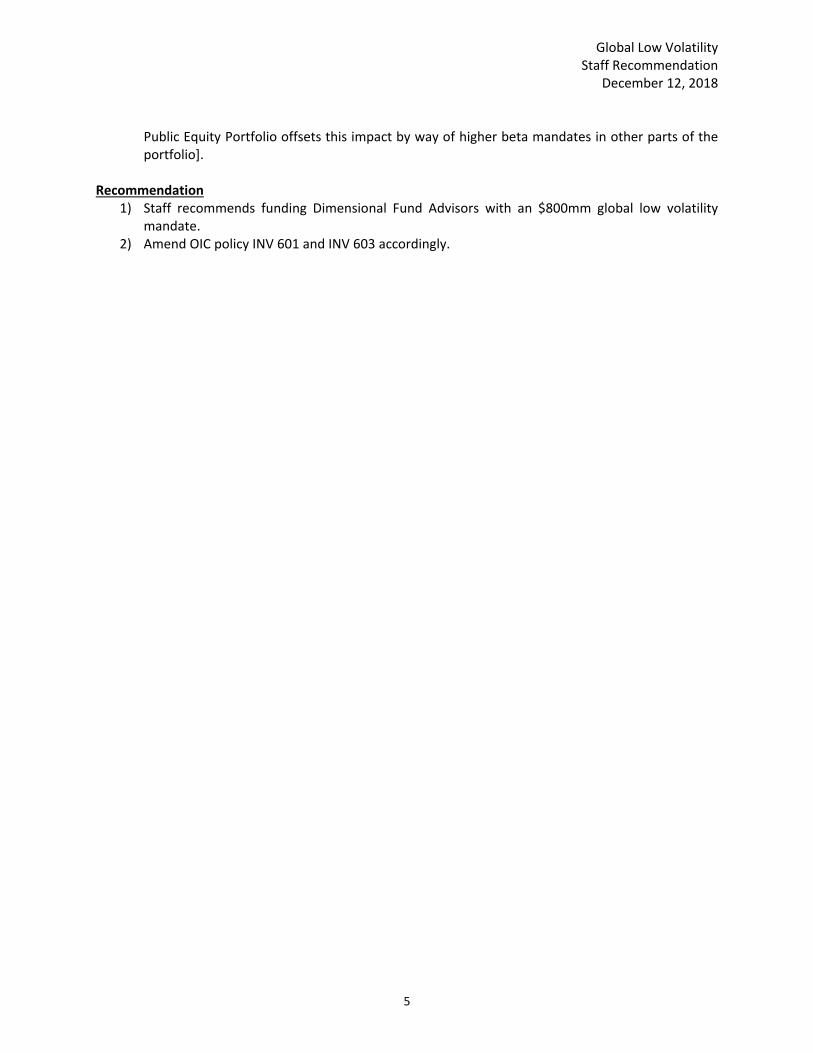
Firm & Strategy Founded in 1981, DFA is a private limited partnership owned primarily by its founders, employees and company directors. The firm is headquartered in Austin, Texas, employs over 1,300 people firm‐wide and maintains regional and investment offices around the world with trading and portfolio management activities based around the globe. As of September 30, 2018, DFA reported $596 billion in assets under management (“AUM”) in a variety of equity and fixed income products. DFA’s investment philosophy is based on academic research which shows that small companies (as measured by market capitalization), value stocks (measured by book/market price ratios) and highly profitabile companies, provide greater expected returns relative to large companies, growth stocks, and low profitability companies respectively. Contemporary academic research now supports the premise that all three of these common factors (namely, size, value, and profitability) command persistent and statistically significant return premia over time (see Exhibit 1). Exhibit 1 Annualized Compound Returns of DFA Risk Premiums (%) in US dollars
Source: Dimensional Fund Advisors
DFA maintains strong ties to the academic community. For example, University of Chicago Nobel Laureate Eugene Fama, Dartmouth’s Kenneth French and Wharton’s Donald Keim all serve as consultants and provide on‐going research in support of current and proposed DFA investment strategies. Investment researcher Roger Ibbotson and Nobel Laureates Robert Merton and Myron Scholes also serve as directors of the firm’s mutual funds board.
Discussion/Investment Considerations Staff has been in discussions with DFA since late 2016 on the formulation of a global low volatility strategy that would capitalize on DFA’s well‐established record of investing in return premia. Staff has met with
US STOCKS DEVELOPED EX US MARKETS STOCKS EMERGING MARKETS STOCKS
SMALL LARGE SMALL LARGE SMALL LARGE
Size
LOW HIGH LOW HIGH LOW HIGH
Rel
ativ
e P
rice
HIGH LOW HIGH LOW HIGH LOW
Pro
fita
bili
ty
1928–2017
1996–2017
1975–2017
12.16 9.87
S&P 500 Index
Dimensional US Small Cap Index
Fama/French International Growth Index
Fama/French International Value Index
Dimensional Emerging Markets High Profitability Index
Dimensional Emerging Markets Low Profitability Index
1928–2017
Fama/French US Growth ResearchIndex
Fama/French US Value ResearchIndex
1970–2017
MSCI World ex USA Index (gross div.)
Dimensional Intl. Small Cap Index
1964–2017
Dimensional US HighProfitability Index
Dimensional US Low Profitability Index
MSCI Emerging Markets Index(gross div.)
Dimensional EmergingMarkets Small Cap Index
1989–2017
1990–2017
Dimensional International High Profitability Index
Dimensional International Low Profitability Index
1989–2017
Fama/French Emerging Markets Growth Index
Fama/French Emerging Markets Value Index
14.799.62
12.23 10.47
12.759.21
13.968.81
13.6010.19
12.468.35 6.95
2.59
9.354.00
Global Low Volatility Staff Recommendation
December 12, 2018
4
DFA on multiple occasions over the last two years and has received several updated performance statistics
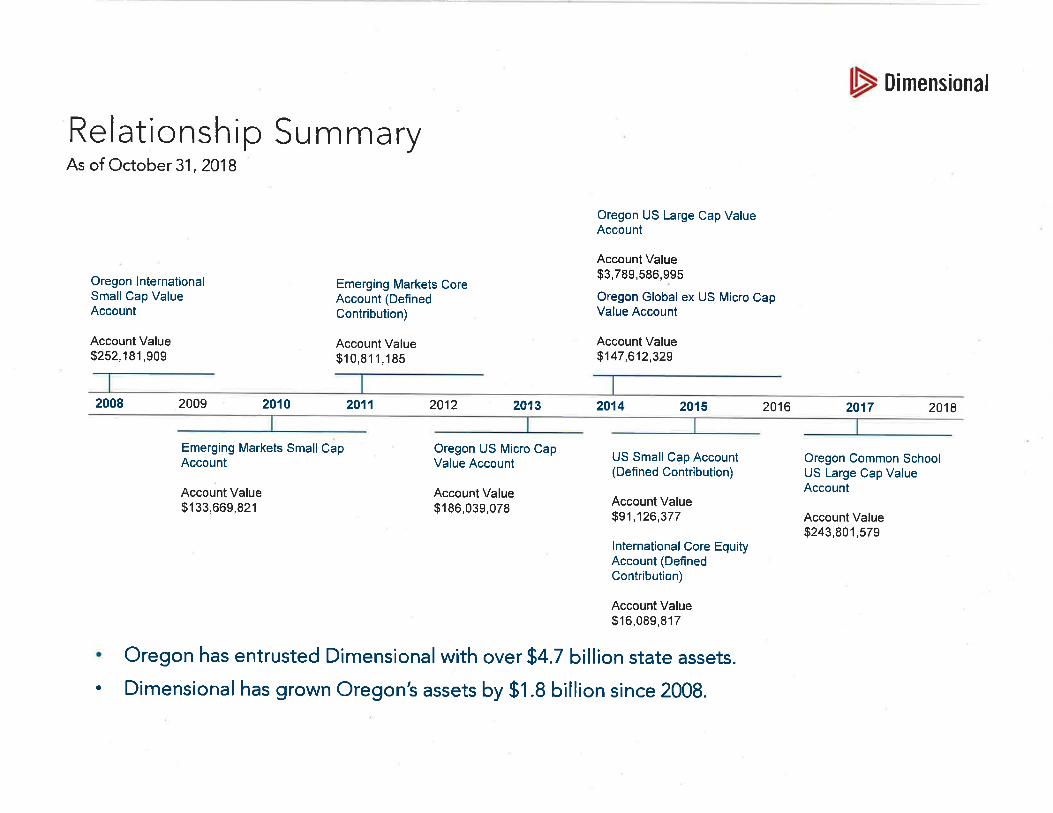
on DFA’s low volatility strategy. DFA feels that structured appropriately, a low volatility portfolio with systematic focus on size, relative price, and profitability dimensions, investors should expect to achieve returns similar to the market place with less volatility. The OIC is familiar with DFA as it has previously approved seven systematic DFA mandates which are managed with the same tilts towards return premia as the proposed low vol strategy: World ex‐U.S. Small Cap Value (January 2009); Emerging Markets Small Cap (May 2010); U.S. Micro Cap Value (January 2013); International Micro Cap Value (March 2014); U.S. Large Cap Core (October 2014); for the Oregon Savings Growth Plan, Emerging Markets Core (February 2011); and, for the Common School Fund, U.S. Large Cap Core (November 2017). Given the long relationship Oregon has enjoyed with DFA and the multiple mandates that the OIC has funded with the firm, staff negotiated a management fee that is significantly less than the average active management fee that OPERF pays it existing global managers. Attributes:
Staff has very high regard for DFA as a firm. Current DFA/OPERF mandates have performed in line with expectations and have exceeded investment return and risk objectives since inception.
Given the existing investment relationships, staff was successful in negotiating a considerable fee discount.
This strategy is consistent with OIC’s Statement of Investment and Management Beliefs {Section 5.A. Inefficiencies that can be exploited by active management may exist in certain segments of the capital markets. The nature (i.e., perceived magnitude and likely duration) of such inefficiencies should inform the proposed active management strategy (e.g., discretionary or systematic)} and {Section 6.A. All fees, expenses, commissions and transaction costs should be diligently monitored and managed in order to maximize net investment returns}.
This approach will provide direct exposures to common factors that enjoy robust empirical support as persistent sources of excess returns.
The proposed strategy is aimed at the most liquid segment of the global public equity market (Global large & Mid Cap) and should have little or no market impact in the reallocation of existing mandates.
Concerns:
This is a new strategy with no investment track record. {Mitigant: The firm has successfully introduced new systematic products in this space several times over the course of its 37 year history.}
Due to its deeper value bias, this product may under‐perform during certain market environments.
Return premia associated with common factors such as those targeted by this strategy have historically produced long‐term outperformance, but have also experienced significant, multi‐year periods of underperformance. [Mitigant: Strong empirical evidence supports both the efficacy of these factor premia (i.e., these factors produce a higher mean return relative to market averages) as well as reversions to this higher mean following periods of underperformance. Additionally, the tracking error relative to the MSCI ACWI IMI Net for the proposed strategy is in‐line with that of current, traditional active management strategies.]
Due to a Low Vol strategy’s emphasis on downside protection, these mandates will likely under‐perform during strong bull market episodes. [Mitigant: the multi‐manager structure of OPERF’s
Global Low Volatility Staff Recommendation
December 12, 2018
5
Public Equity Portfolio offsets this impact by way of higher beta mandates in other parts of the portfolio].
Recommendation
1) Staff recommends funding Dimensional Fund Advisors with an $800mm global low volatility mandate.
2) Amend OIC policy INV 601 and INV 603 accordingly.
Oregon Investment Council Global Low Volatility Strategy
December 12, 2018
Gerard O’Reilly, PhD, Co-Chief Executive Officer, Chief Investment
Officer, and Dimensional Director
Joseph Young, CFA, Vice President and Regional Director
This information is provided for Oregon State Treasury, an institutional investor, and is not intended for public use.
Dimensional Fund Advisors LP is an investment advisor registered with the Securities and Exchange Commission.
*”Dimensional Director” refers to a member of the Board of Directors of the general partner of Dimensional Fund Advisors LP.
#17625-1011

Agenda • Dimensional
• Investment Philosophy
• Oregon Global Low Volatility Strategy
• Appendix

Dimensional
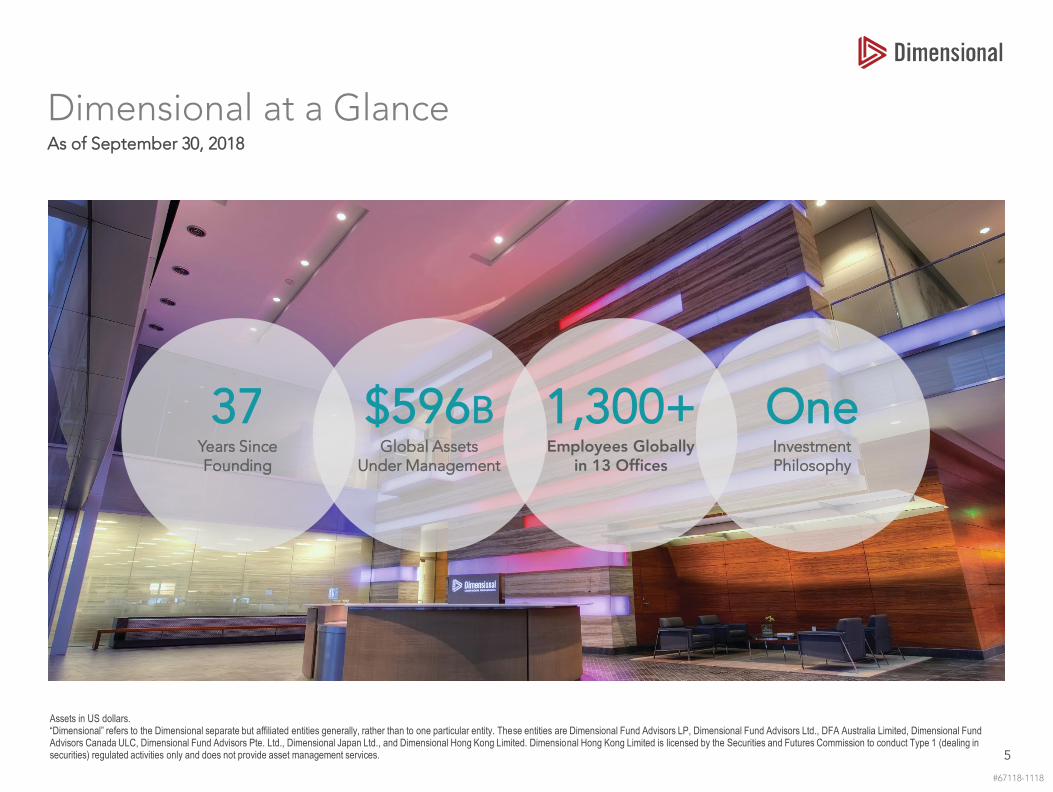
Dimensional at a Glance
5
As of September 30, 2018
Assets in US dollars.“Dimensional” refers to the Dimensional separate but affiliated entities generally, rather than to one particular entity. These entities are Dimensional Fund Advisors LP, Dimensional Fund Advisors Ltd., DFA Australia Limited, Dimensional Fund Advisors Canada ULC, Dimensional Fund Advisors Pte. Ltd., Dimensional Japan Ltd., and Dimensional Hong Kong Limited. Dimensional Hong Kong Limited is licensed by the Securities and Futures Commission to conduct Type 1 (dealing in securities) regulated activities only and does not provide asset management services.
#67118-1118
37 $596B 1,300+ OneYears Since Founding
Global Assets Under Management
Employees Globally in 13 Offices
Investment Philosophy

A Heritage of Leading ResearchThe bar for research at Dimensional has been set by the best in the field
University of Chicago
Independent Director, Dimensional Mutual Funds, 1981–2000
Merton Miller
Stanford University
Independent Director, Dimensional Mutual Funds, 1981–present
Myron Scholes
Dartmouth College
Consultant, 1986–present
Head of Investment Research Committee, Dimensional, 2006–present
Director, 2006–present
Kenneth French
University of Chicago
Director and Consultant, Dimensional, 1981–present
Eugene Fama
MIT
Director, Dimensional Mutual Funds, 2003–2009
Resident Scientist, Dimensional, 2010–present
Robert Merton
University of Rochester
Consultant, Dimensional, 2014–present
Robert Novy-Marx
“At Dimensional, we don’t jump on every new idea that comes along. We’re looking for what will stand up over a long period of time.”
Eugene Fama
#67077-1018
6
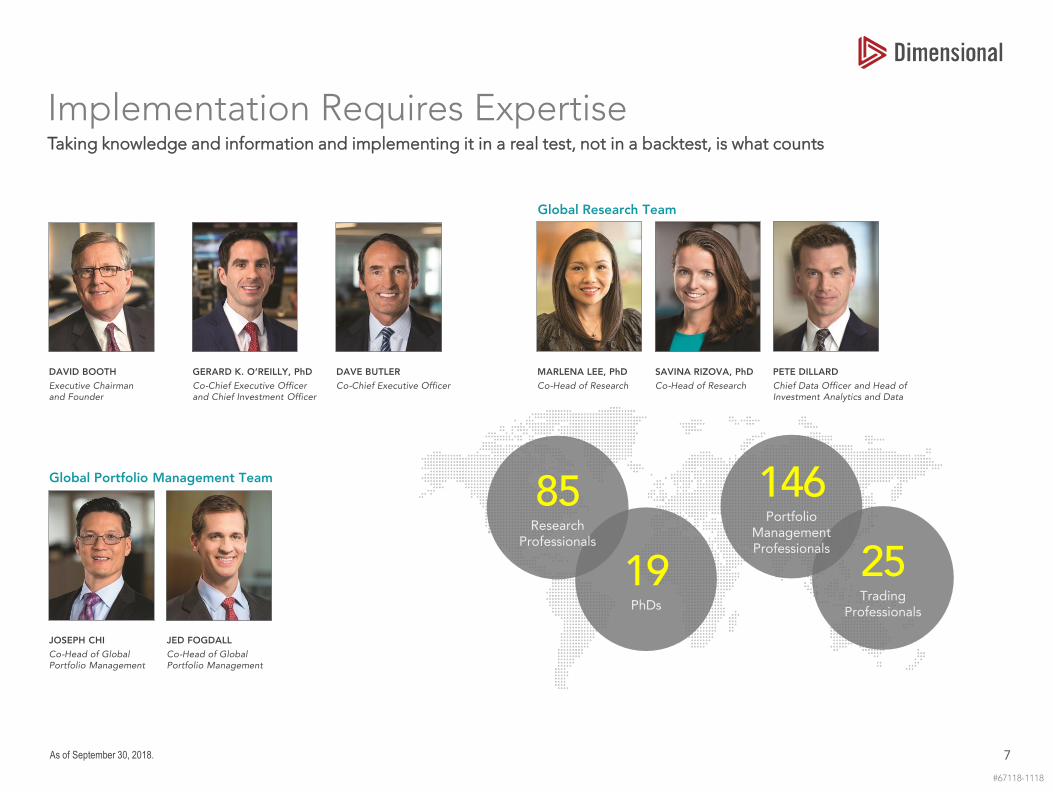
Implementation Requires Expertise
7
Taking knowledge and information and implementing it in a real test, not in a backtest, is what counts
As of September 30, 2018.
#67118-1118
DAVID BOOTH
Executive Chairman and Founder
GERARD K. O’REILLY, PhD
Co-Chief Executive Officer and Chief Investment Officer
DAVE BUTLER
Co-Chief Executive Officer
MARLENA LEE, PhD
Co-Head of Research
SAVINA RIZOVA, PhD
Co-Head of Research
PETE DILLARD
Chief Data Officer and Head of Investment Analytics and Data
Global Research Team
25Trading
Professionals
19PhDs
146Portfolio
Management Professionals
85Research
Professionals
Global Portfolio Management Team
JOSEPH CHI
Co-Head of Global Portfolio Management
JED FOGDALL
Co-Head of Global Portfolio Management

Investment Philosophy
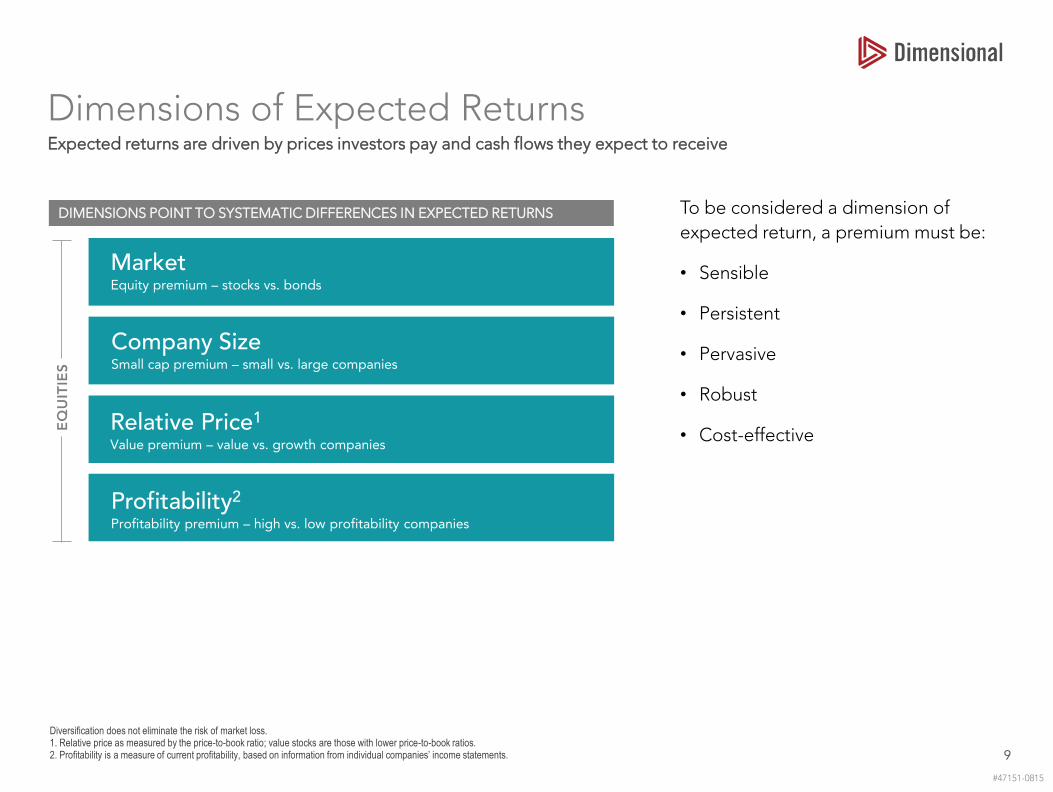
Dimensions of Expected Returns
9
Expected returns are driven by prices investors pay and cash flows they expect to receive
To be considered a dimension of
expected return, a premium must be:
• Sensible
• Persistent
• Pervasive
• Robust
• Cost-effective
DIMENSIONS POINT TO SYSTEMATIC DIFFERENCES IN EXPECTED RETURNS
Diversification does not eliminate the risk of market loss. 1. Relative price as measured by the price-to-book ratio; value stocks are those with lower price-to-book ratios. 2. Profitability is a measure of current profitability, based on information from individual companies’ income statements.
#47151-0815
EQ
UIT
IES
Company Size Small cap premium – small vs. large companies
Market Equity premium – stocks vs. bonds
Relative Price1
Value premium – value vs. growth companies
Profitability2
Profitability premium – high vs. low profitability companies
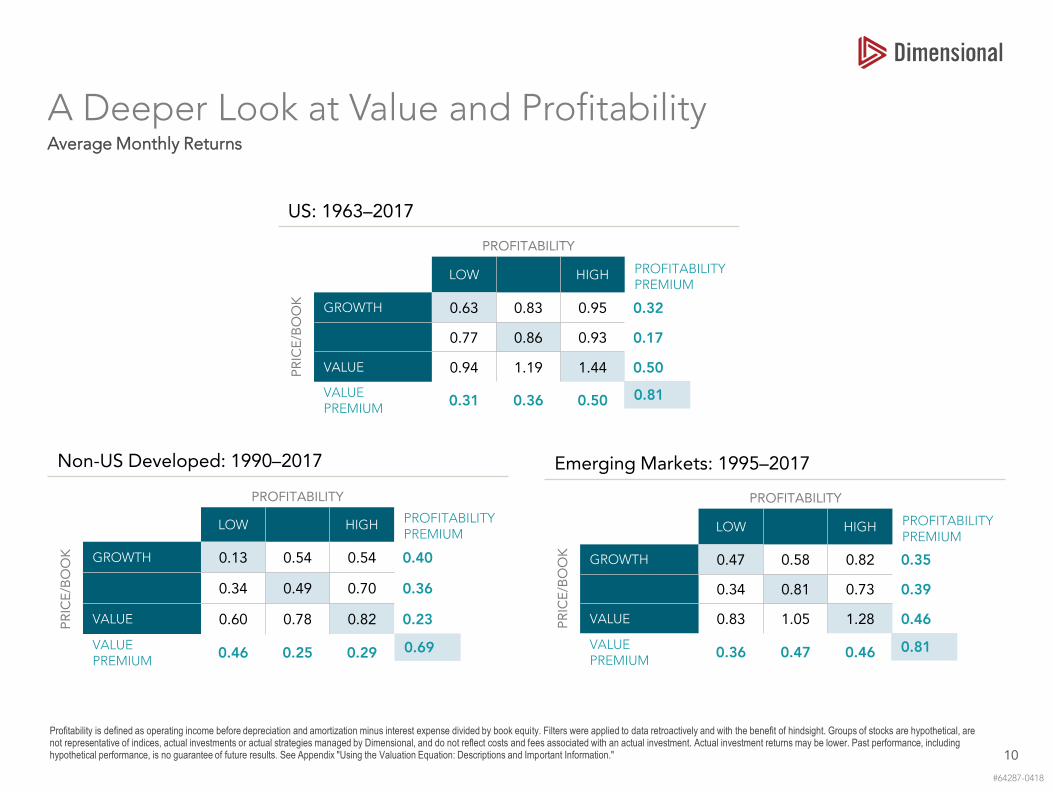
A Deeper Look at Value and Profitability
10
Average Monthly Returns
Profitability is defined as operating income before depreciation and amortization minus interest expense divided by book equity. Filters were applied to data retroactively and with the benefit of hindsight. Groups of stocks are hypothetical, are not representative of indices, actual investments or actual strategies managed by Dimensional, and do not reflect costs and fees associated with an actual investment. Actual investment returns may be lower. Past performance, including hypothetical performance, is no guarantee of future results. See Appendix "Using the Valuation Equation: Descriptions and Important Information."
#64287-0418
US: 1963–2017
PROFITABILITY
PROFITABILITY PREMIUM
PR
ICE
/BO
OK
LOW HIGH
GROWTH 0.63 0.83 0.95 0.32
0.77 0.86 0.93 0.17
VALUE 0.94 1.19 1.44 0.50
VALUE PREMIUM
0.31 0.36 0.50
Non-US Developed: 1990–2017
PROFITABILITY
PROFITABILITYPREMIUM
PR
ICE
/BO
OK
LOW HIGH
GROWTH 0.13 0.54 0.54 0.40
0.34 0.49 0.70 0.36
VALUE 0.60 0.78 0.82 0.23
VALUE PREMIUM
0.46 0.25 0.29
Emerging Markets: 1995–2017
PROFITABILITY
PROFITABILITY PREMIUM
PR
ICE
/BO
OK
LOW HIGH
GROWTH 0.47 0.58 0.82 0.35
0.34 0.81 0.73 0.39
VALUE 0.83 1.05 1.28 0.46
VALUE PREMIUM
0.36 0.47 0.46
0.81
0.810.69
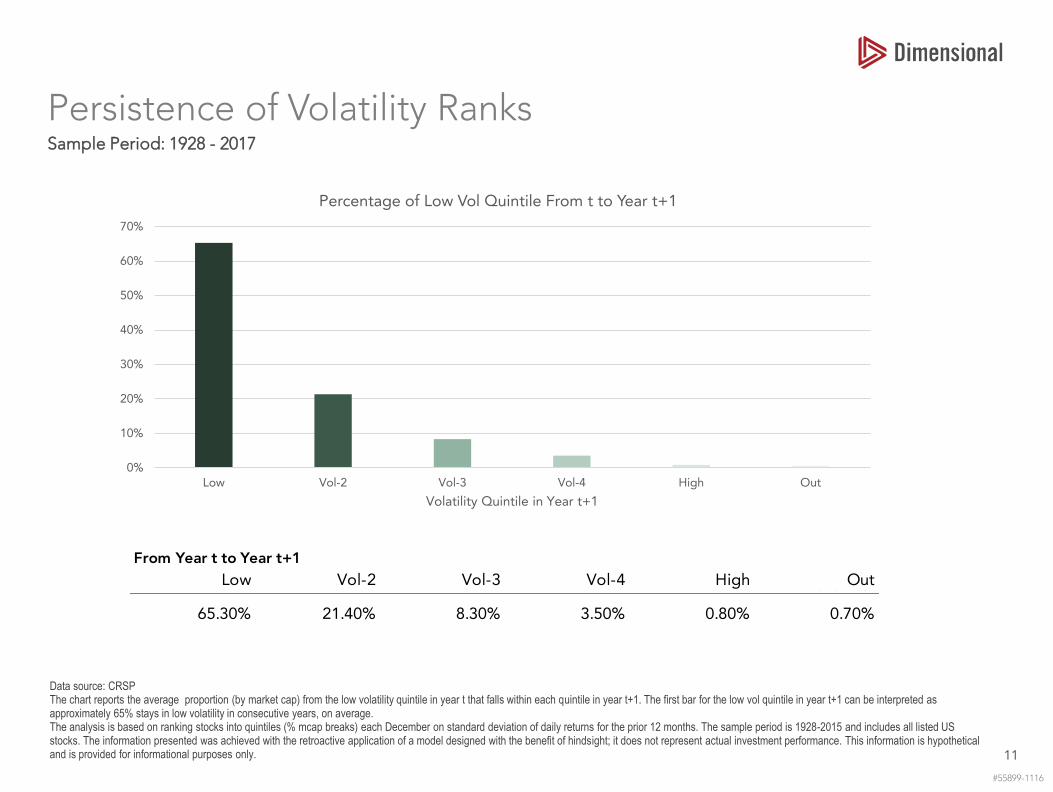
Persistence of Volatility Ranks
11
Sample Period: 1928 - 2017
Data source: CRSPThe chart reports the average proportion (by market cap) from the low volatility quintile in year t that falls within each quintile in year t+1. The first bar for the low vol quintile in year t+1 can be interpreted as approximately 65% stays in low volatility in consecutive years, on average.The analysis is based on ranking stocks into quintiles (% mcap breaks) each December on standard deviation of daily returns for the prior 12 months. The sample period is 1928-2015 and includes all listed US stocks. The information presented was achieved with the retroactive application of a model designed with the benefit of hindsight; it does not represent actual investment performance. This information is hypothetical and is provided for informational purposes only.
#55899-1116
From Year t to Year t+1
Low Vol-2 Vol-3 Vol-4 High OutWorld Index
65.30% 21.40% 8.30% 3.50% 0.80% 0.70%
0%
10%
20%
30%
40%
50%
60%
70%
Low Vol-2 Vol-3 Vol-4 High Out
Volatility Quintile in Year t+1
Percentage of Low Vol Quintile From t to Year t+1
Oregon Global Low Volatility Strategy
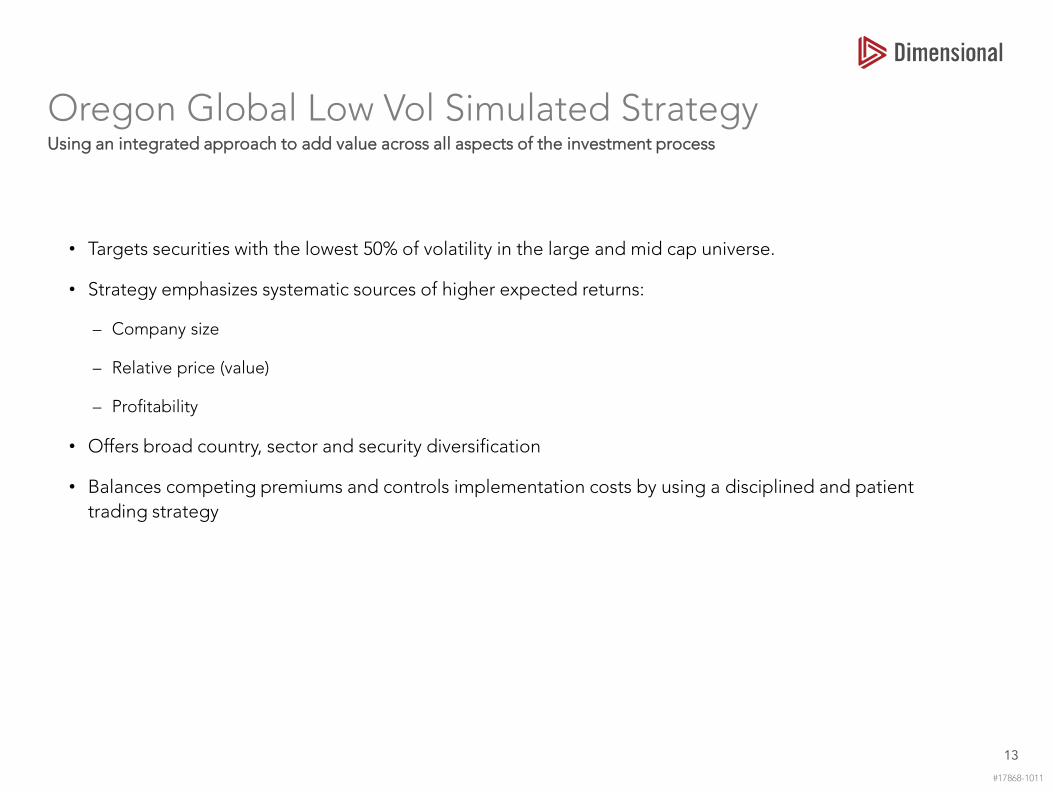
Oregon Global Low Vol Simulated StrategyUsing an integrated approach to add value across all aspects of the investment process
• Targets securities with the lowest 50% of volatility in the large and mid cap universe.
• Strategy emphasizes systematic sources of higher expected returns:
– Company size
– Relative price (value)
– Profitability
• Offers broad country, sector and security diversification
• Balances competing premiums and controls implementation costs by using a disciplined and patient
trading strategy
#17868-1011
13
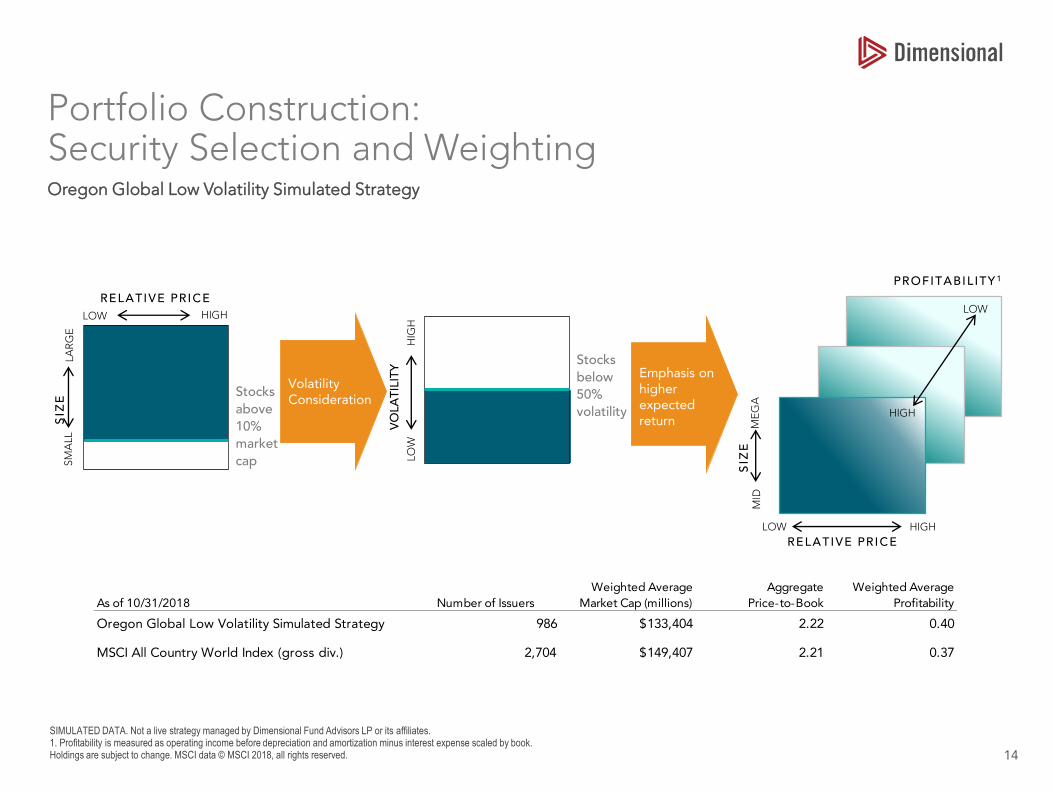
Portfolio Construction: Security Selection and Weighting
14
Oregon Global Low Volatility Simulated Strategy
SIMULATED DATA. Not a live strategy managed by Dimensional Fund Advisors LP or its affiliates. 1. Profitability is measured as operating income before depreciation and amortization minus interest expense scaled by book.Holdings are subject to change. MSCI data © MSCI 2018, all rights reserved.
HIGH
RELATIVE PRICE
MID
ME
GA
SIZ
E
PROFITABIL ITY 1
LOW
LOW
HIGH
SIZ
E
RELATIVE PRICE
LOW HIGH
SM
ALL
LA
RG
E
Stocks
above
10%
market
cap
As of 10/31/2018 Number of Issuers
Weighted Average
Market Cap (millions)
Aggregate
Price-to-Book
Weighted Average
Profitability
Oregon Global Low Volatility Simulated Strategy 986 $133,404 2.22 0.40
MSCI All Country World Index (gross div.) 2,704 $149,407 2.21 0.37
VO
LAT
ILIT
Y
LO
WH
IGH
Stocks
below
50%
volatility
Volatility Consideration
Emphasis on higher expected return
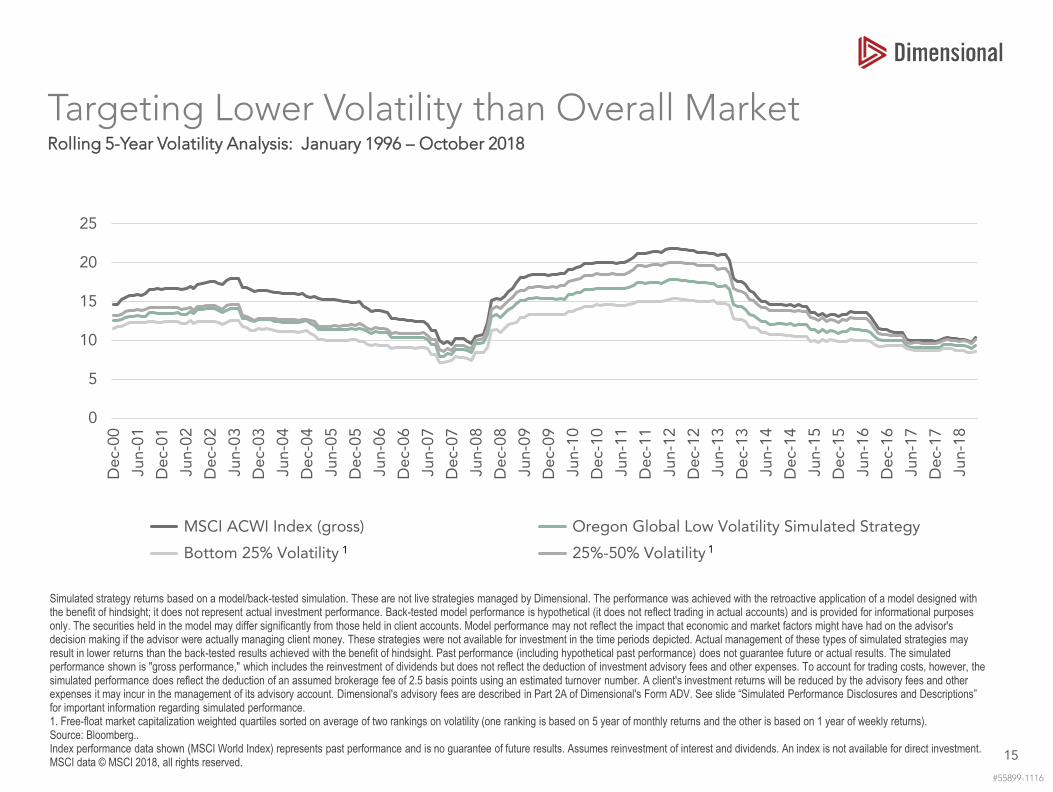
Targeting Lower Volatility than Overall Market
15
Rolling 5-Year Volatility Analysis: January 1996 – October 2018
Simulated strategy returns based on a model/back-tested simulation. These are not live strategies managed by Dimensional. The performance was achieved with the retroactive application of a model designed with the benefit of hindsight; it does not represent actual investment performance. Back-tested model performance is hypothetical (it does not reflect trading in actual accounts) and is provided for informational purposes only. The securities held in the model may differ significantly from those held in client accounts. Model performance may not reflect the impact that economic and market factors might have had on the advisor's decision making if the advisor were actually managing client money. These strategies were not available for investment in the time periods depicted. Actual management of these types of simulated strategies may result in lower returns than the back-tested results achieved with the benefit of hindsight. Past performance (including hypothetical past performance) does not guarantee future or actual results. The simulated performance shown is "gross performance," which includes the reinvestment of dividends but does not reflect the deduction of investment advisory fees and other expenses. To account for trading costs, however, the simulated performance does reflect the deduction of an assumed brokerage fee of 2.5 basis points using an estimated turnover number. A client's investment returns will be reduced by the advisory fees and other expenses it may incur in the management of its advisory account. Dimensional's advisory fees are described in Part 2A of Dimensional's Form ADV. See slide “Simulated Performance Disclosures and Descriptions” for important information regarding simulated performance. 1. Free-float market capitalization weighted quartiles sorted on average of two rankings on volatility (one ranking is based on 5 year of monthly returns and the other is based on 1 year of weekly returns). Source: Bloomberg.. Index performance data shown (MSCI World Index) represents past performance and is no guarantee of future results. Assumes reinvestment of interest and dividends. An index is not available for direct investment. MSCI data © MSCI 2018, all rights reserved.
#55899-1116
0
5
10
15
20
25
Dec-
00
Jun-0
1
Dec-
01
Jun-0
2
Dec-
02
Jun-0
3
Dec-
03
Jun-0
4
Dec-
04
Jun-0
5
Dec-
05
Jun-0
6
Dec-
06
Jun-0
7
Dec-
07
Jun-0
8
Dec-
08
Jun-0
9
Dec-
09
Jun-1
0
Dec-
10
Jun-1
1
Dec-
11
Jun-1
2
Dec-
12
Jun-1
3
Dec-
13
Jun-1
4
Dec-
14
Jun-1
5
Dec-
15
Jun-1
6
Dec-
16
Jun-1
7
Dec-
17
Jun-1
8
MSCI ACWI Index (gross) Oregon Global Low Volatility Simulated Strategy
Bottom 25% Volatility 25%-50% Volatility1 1
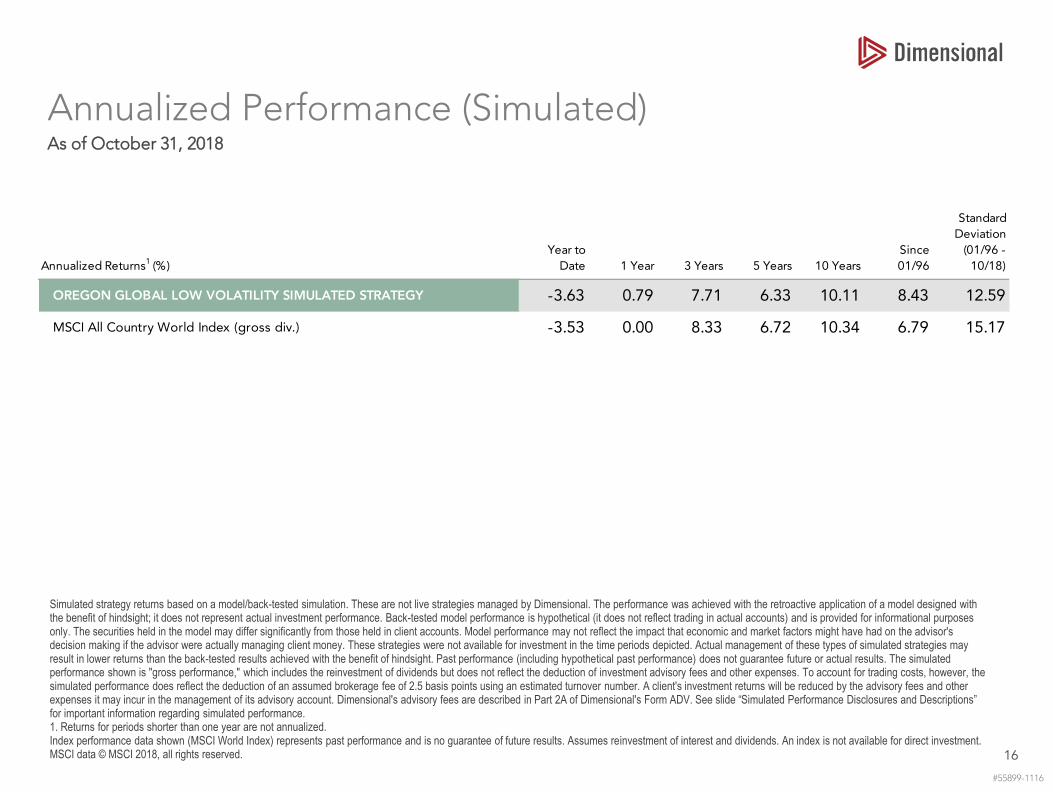
Annualized Performance (Simulated)
16
As of October 31, 2018
Simulated strategy returns based on a model/back-tested simulation. These are not live strategies managed by Dimensional. The performance was achieved with the retroactive application of a model designed with the benefit of hindsight; it does not represent actual investment performance. Back-tested model performance is hypothetical (it does not reflect trading in actual accounts) and is provided for informational purposes only. The securities held in the model may differ significantly from those held in client accounts. Model performance may not reflect the impact that economic and market factors might have had on the advisor's decision making if the advisor were actually managing client money. These strategies were not available for investment in the time periods depicted. Actual management of these types of simulated strategies may result in lower returns than the back-tested results achieved with the benefit of hindsight. Past performance (including hypothetical past performance) does not guarantee future or actual results. The simulated performance shown is "gross performance," which includes the reinvestment of dividends but does not reflect the deduction of investment advisory fees and other expenses. To account for trading costs, however, the simulated performance does reflect the deduction of an assumed brokerage fee of 2.5 basis points using an estimated turnover number. A client's investment returns will be reduced by the advisory fees and other expenses it may incur in the management of its advisory account. Dimensional's advisory fees are described in Part 2A of Dimensional's Form ADV. See slide “Simulated Performance Disclosures and Descriptions” for important information regarding simulated performance. 1. Returns for periods shorter than one year are not annualized. Index performance data shown (MSCI World Index) represents past performance and is no guarantee of future results. Assumes reinvestment of interest and dividends. An index is not available for direct investment. MSCI data © MSCI 2018, all rights reserved.
#55899-1116
Annualized Returns1 (%)
Year to
Date 1 Year 3 Years 5 Years 10 Years
Since
01/96
Annualized
Standard
Deviation
(01/96 -
10/18)
OREGON GLOBAL LOW VOLATILITY SIMULATED STRATEGY -3.63 0.79 7.71 6.33 10.11 8.43 12.59
MSCI All Country World Index (gross div.) -3.53 0.00 8.33 6.72 10.34 6.79 15.17
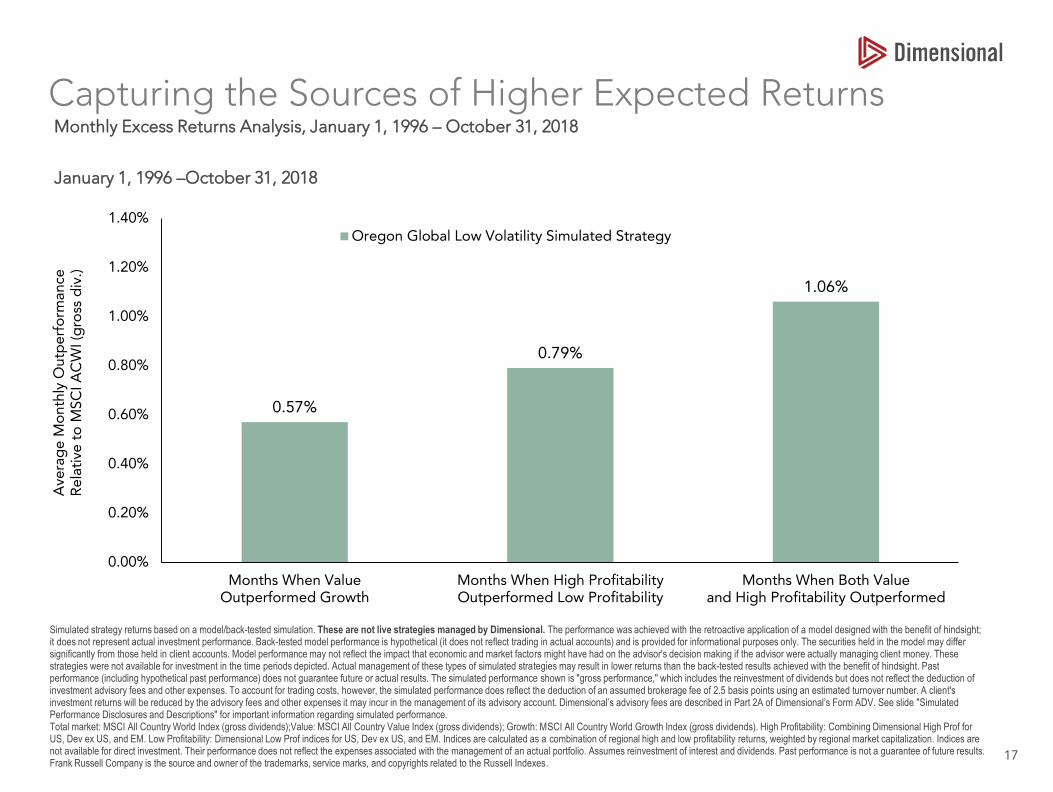
Capturing the Sources of Higher Expected Returns
17
January 1, 1996 –October 31, 2018
Simulated strategy returns based on a model/back-tested simulation. These are not live strategies managed by Dimensional. The performance was achieved with the retroactive application of a model designed with the benefit of hindsight; it does not represent actual investment performance. Back-tested model performance is hypothetical (it does not reflect trading in actual accounts) and is provided for informational purposes only. The securities held in the model may differ significantly from those held in client accounts. Model performance may not reflect the impact that economic and market factors might have had on the advisor's decision making if the advisor were actually managing client money. These strategies were not available for investment in the time periods depicted. Actual management of these types of simulated strategies may result in lower returns than the back-tested results achieved with the benefit of hindsight. Past performance (including hypothetical past performance) does not guarantee future or actual results. The simulated performance shown is "gross performance," which includes the reinvestment of dividends but does not reflect the deduction of investment advisory fees and other expenses. To account for trading costs, however, the simulated performance does reflect the deduction of an assumed brokerage fee of 2.5 basis points using an estimated turnover number. A client's investment returns will be reduced by the advisory fees and other expenses it may incur in the management of its advisory account. Dimensional’s advisory fees are described in Part 2A of Dimensional’s Form ADV. See slide "Simulated Performance Disclosures and Descriptions" for important information regarding simulated performance. Total market: MSCI All Country World Index (gross dividends);Value: MSCI All Country Value Index (gross dividends); Growth: MSCI All Country World Growth Index (gross dividends). High Profitability: Combining Dimensional High Prof for US, Dev ex US, and EM. Low Profitability: Dimensional Low Prof indices for US, Dev ex US, and EM. Indices are calculated as a combination of regional high and low profitability returns, weighted by regional market capitalization. Indices are not available for direct investment. Their performance does not reflect the expenses associated with the management of an actual portfolio. Assumes reinvestment of interest and dividends. Past performance is not a guarantee of future results. Frank Russell Company is the source and owner of the trademarks, service marks, and copyrights related to the Russell Indexes.
0.57%
0.79%
1.06%
0.00%
0.20%
0.40%
0.60%
0.80%
1.00%
1.20%
1.40%
Months When ValueOutperformed Growth
Months When High ProfitabilityOutperformed Low Profitability
Months When Both Valueand High Profitability Outperformed
Ave
rag
e M
on
thly
Ou
tpe
rfo
rman
ce
Rela
tive
to
MS
CI A
CW
I (g
ross
div
.)
Oregon Global Low Volatility Simulated Strategy
Monthly Excess Returns Analysis, January 1, 1996 – October 31, 2018
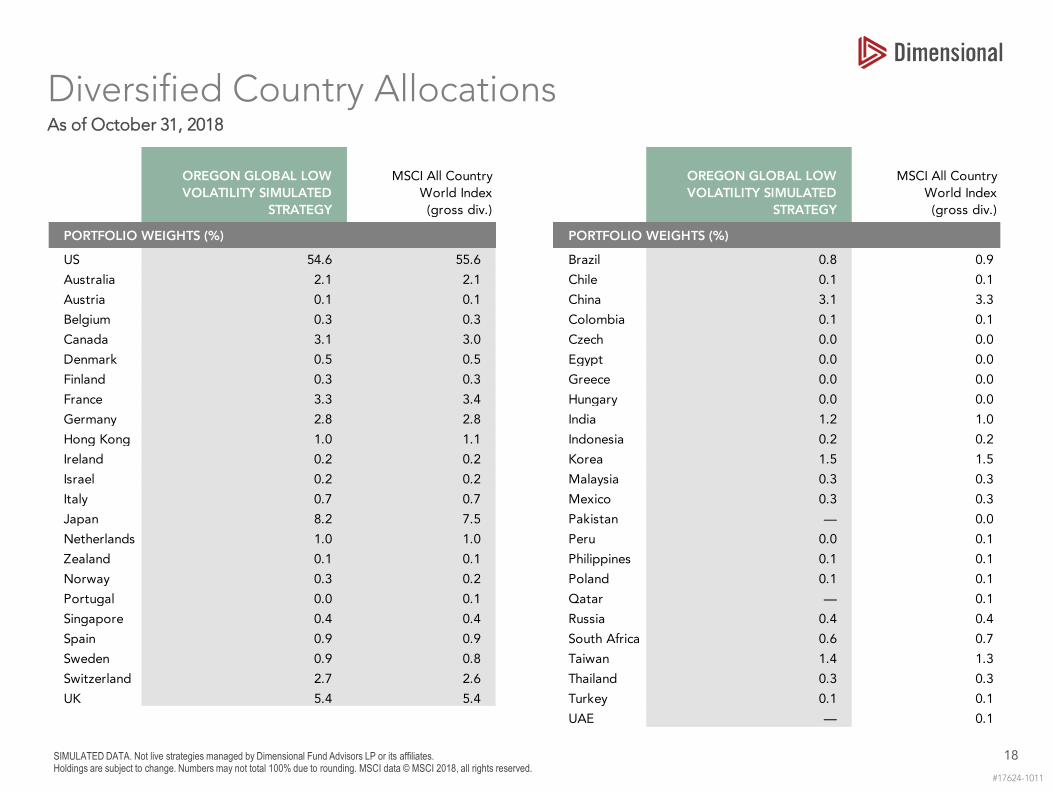
Diversified Country Allocations
18
As of October 31, 2018
SIMULATED DATA. Not live strategies managed by Dimensional Fund Advisors LP or its affiliates. Holdings are subject to change. Numbers may not total 100% due to rounding. MSCI data © MSCI 2018, all rights reserved.
#17624-1011
OREGON GLOBAL LOW
VOLATILITY SIMULATED
STRATEGY
MSCI All Country
World Index
(gross div.)
OREGON GLOBAL LOW
VOLATILITY SIMULATED
STRATEGY
MSCI All Country
World Index
(gross div.)
PORTFOLIO WEIGHTS (%) PORTFOLIO WEIGHTS (%)
US 54.6 55.6 Brazil 0.8 0.9
Australia 2.1 2.1 Chile 0.1 0.1
Austria 0.1 0.1 China 3.1 3.3
Belgium 0.3 0.3 Colombia 0.1 0.1
Canada 3.1 3.0 Czech 0.0 0.0
Denmark 0.5 0.5 Egypt 0.0 0.0
Finland 0.3 0.3 Greece 0.0 0.0
France 3.3 3.4 Hungary 0.0 0.0
Germany 2.8 2.8 India 1.2 1.0
Hong Kong 1.0 1.1 Indonesia 0.2 0.2
Ireland 0.2 0.2 Korea 1.5 1.5
Israel 0.2 0.2 Malaysia 0.3 0.3
Italy 0.7 0.7 Mexico 0.3 0.3
Japan 8.2 7.5 Pakistan — 0.0
Netherlands 1.0 1.0 Peru 0.0 0.1 New
Zealand 0.1 0.1 Philippines 0.1 0.1
Norway 0.3 0.2 Poland 0.1 0.1
Portugal 0.0 0.1 Qatar — 0.1
Singapore 0.4 0.4 Russia 0.4 0.4
Spain 0.9 0.9 South Africa 0.6 0.7
Sweden 0.9 0.8 Taiwan 1.4 1.3
Switzerland 2.7 2.6 Thailand 0.3 0.3
UK 5.4 5.4 Turkey 0.1 0.1
Brazil UAE — 0.1
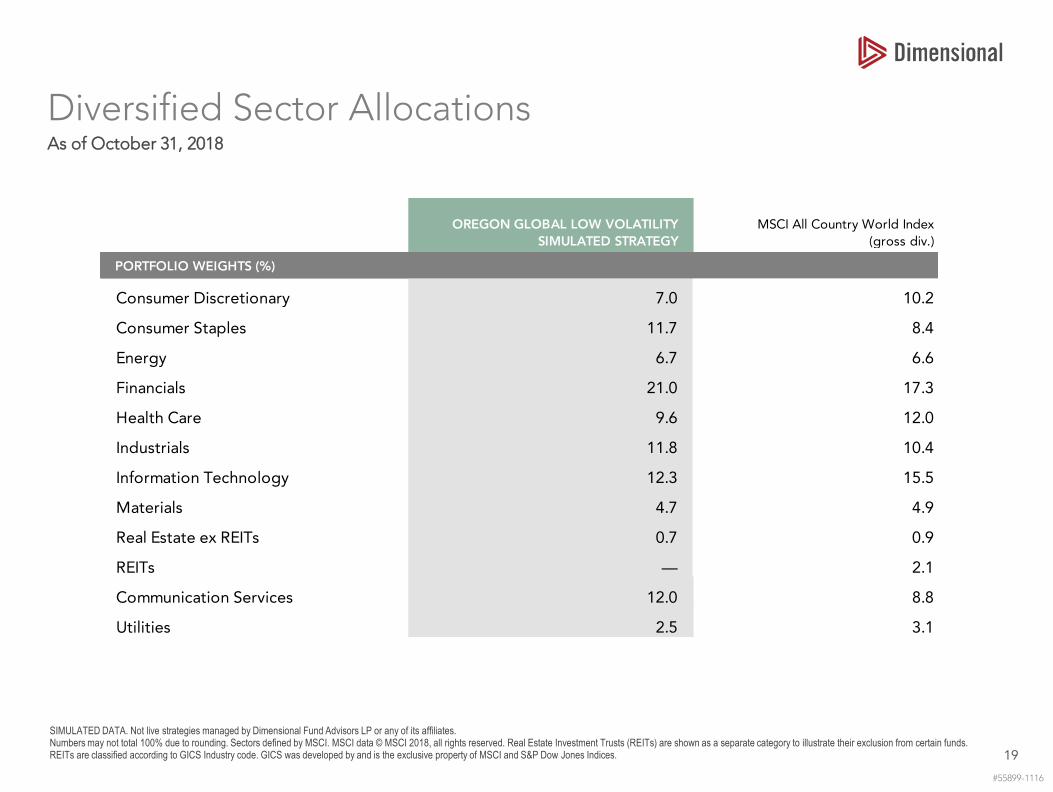
Diversified Sector Allocations
19
As of October 31, 2018
SIMULATED DATA. Not live strategies managed by Dimensional Fund Advisors LP or any of its affiliates. Numbers may not total 100% due to rounding. Sectors defined by MSCI. MSCI data © MSCI 2018, all rights reserved. Real Estate Investment Trusts (REITs) are shown as a separate category to illustrate their exclusion from certain funds. REITs are classified according to GICS Industry code. GICS was developed by and is the exclusive property of MSCI and S&P Dow Jones Indices.
#55899-1116
Q3 2016 v2 10/12/2016 OREGON GLOBAL LOW VOLATILITY
SIMULATED STRATEGY
MSCI All Country World Index
(gross div.)
PORTFOLIO WEIGHTS (%)
Consumer Discretionary 7.0 10.2
Consumer Staples 11.7 8.4
Energy 6.7 6.6
Financials 21.0 17.3
Health Care 9.6 12.0
Industrials 11.8 10.4
Information Technology 12.3 15.5
Materials 4.7 4.9
Real Estate ex REITs 0.7 0.9
REITs — 2.1
Communication Services 12.0 8.8
Utilities 2.5 3.1
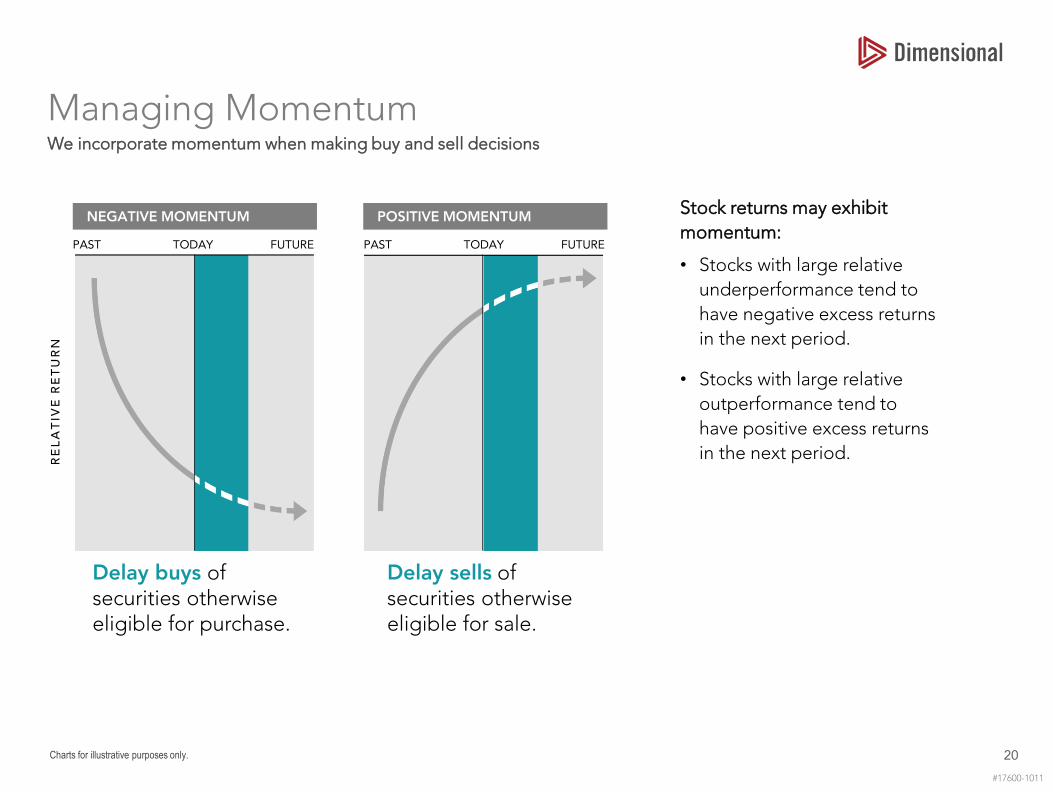
Managing Momentum
20
We incorporate momentum when making buy and sell decisions
Stock returns may exhibit
momentum:
• Stocks with large relative
underperformance tend to
have negative excess returns
in the next period.
• Stocks with large relative
outperformance tend to
have positive excess returns
in the next period.
Charts for illustrative purposes only.
#17600-1011
PAST FUTURE PAST FUTURETODAYTODAY
RE
LA
TIV
E R
ET
UR
N
Delay buys of securities otherwise eligible for purchase.
Delay sells of securities otherwise eligible for sale.
NEGATIVE MOMENTUM POSITIVE MOMENTUM
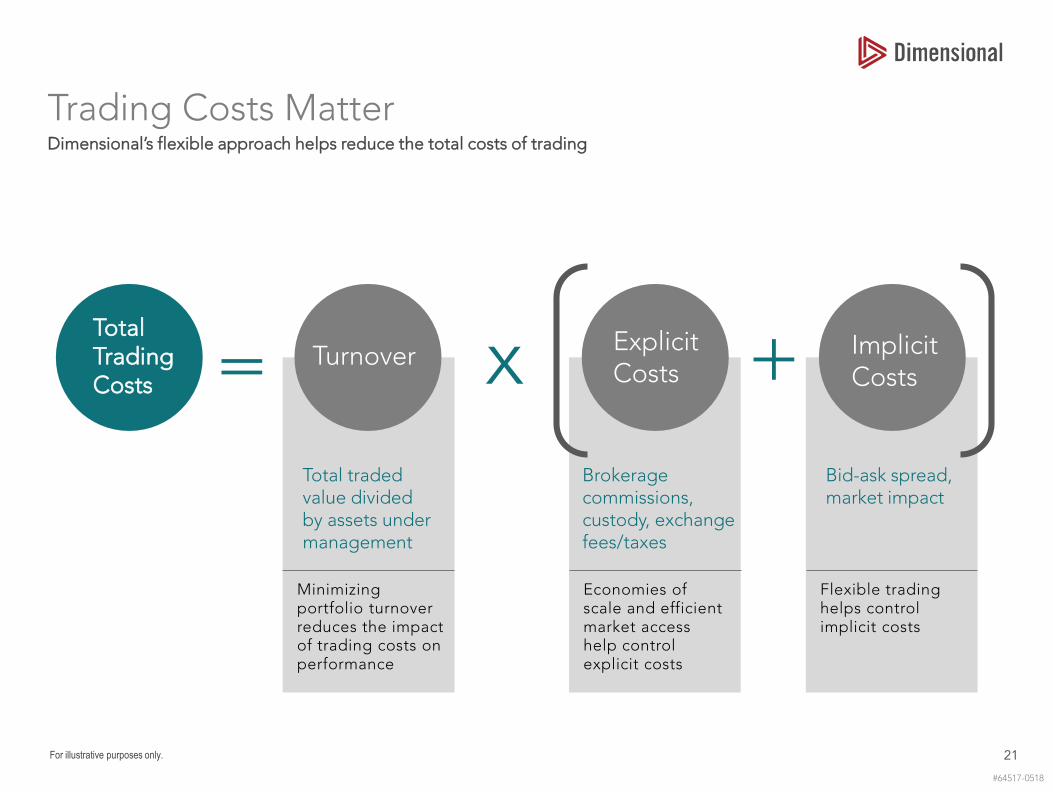
Trading Costs Matter
21
Dimensional’s flexible approach helps reduce the total costs of trading
For illustrative purposes only.
#64517-0518
Total Trading Costs = x +
Total traded value divided by assets under management
Minimizing portfolio turnover reduces the impact of trading costs on performance
Turnover
Brokerage commissions, custody, exchange fees/taxes
Economies of scale and efficient market access help control explicit costs
Explicit Costs
Bid-ask spread, market impact
Flexible trading helps control implicit costs
Implicit Costs

Appendix

Presenters’ Biographies
23
Gerard O’ReillyCo-Chief Executive Officer, Chief Investment Officer, and Dimensional Director
Gerard O'Reilly serves as Co-Chief Executive Officer and Chief Investment Officer and is a Dimensional Director.* He has been with Dimensional since 2004 and
was named Co-CIO in 2014. He oversees the design, development, and delivery of research that guides Dimensional’s scientific approach to investing. He has
been instrumental in the creation and implementation of investment solutions that meet the needs of Dimensional’s global clients.
Gerard works closely with clients and leads a team of researchers, portfolio managers, and traders in designing and managing reliable and cost-effective
investment strategies based on sound academic research. Gerard is the Co-Chair of the firm’s Investment Research Committee and a member of the Investment
Committee, which consists of senior executives and investment team leadership that oversee management of the portfolios and accounts managed by the
company. Prior to joining Dimensional in 2004, Gerard obtained his PhD in aeronautics from the California Institute of Technology. He holds a master of science
degree in high performance computing from Trinity College Dublin in his native country of Ireland, where he also received a first class honors degree in
theoretical physics and was a recipient of the Foundation Scholarship.
* "Dimensional Director" refers to a member of the Board of Directors of the general partner of Dimensional Fund Advisors LP.
Joseph L. YoungVice President
Joseph Young is a Vice President responsible for developing and maintaining relationships with public pension funds, foundations, endowments, Taft-Hartley
plan sponsors, and corporate pension and defined contribution plans.
Joe began his career with Dimensional in February 2002, focusing on consultant relations. Prior to joining Dimensional, he worked as a project management
analyst at Global Crossing. He is an active member of the CFA Society of Austin, National Society of Institutional Investment Professionals and the Texas
Association of Public Employee Retirement Systems (TEXPERS). He has been a guest lecturer for the College of Business at Colorado State University and
University of Idaho. Joe received a BS in finance from the University of Idaho and is a CFA® charterholder.
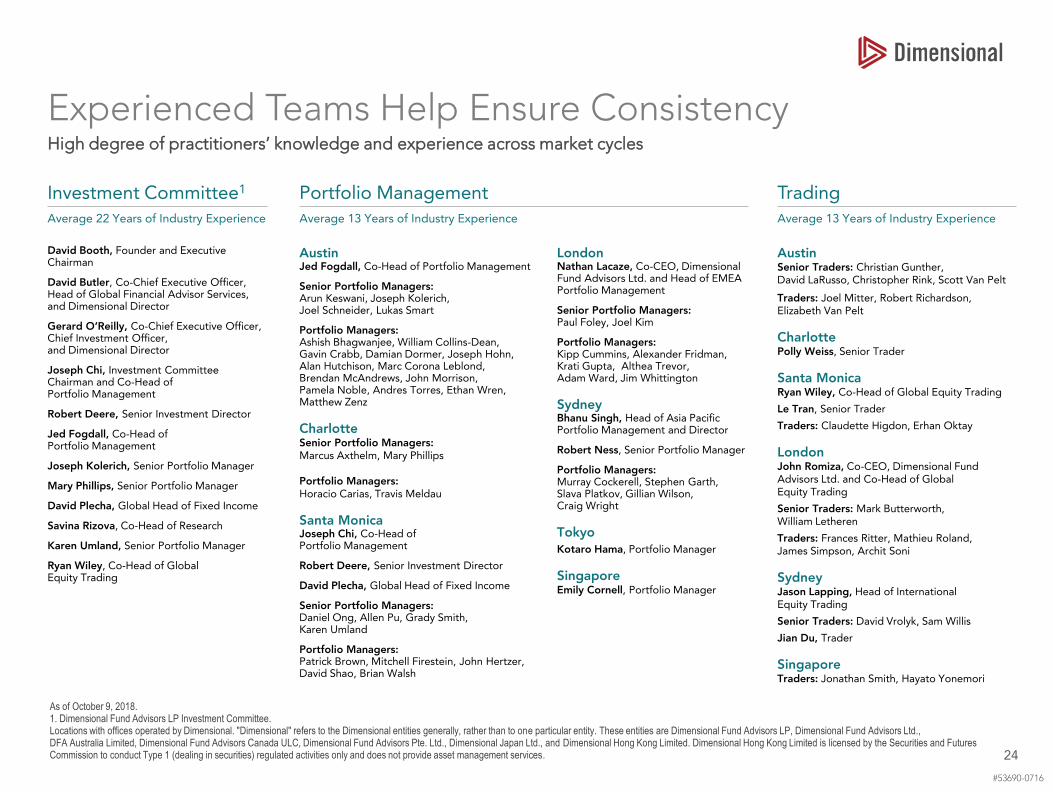
Experienced Teams Help Ensure Consistency
24
High degree of practitioners’ knowledge and experience across market cycles
As of October 9, 2018.1. Dimensional Fund Advisors LP Investment Committee.Locations with offices operated by Dimensional. "Dimensional" refers to the Dimensional entities generally, rather than to one particular entity. These entities are Dimensional Fund Advisors LP, Dimensional Fund Advisors Ltd., DFA Australia Limited, Dimensional Fund Advisors Canada ULC, Dimensional Fund Advisors Pte. Ltd., Dimensional Japan Ltd., and Dimensional Hong Kong Limited. Dimensional Hong Kong Limited is licensed by the Securities and Futures Commission to conduct Type 1 (dealing in securities) regulated activities only and does not provide asset management services.
#53690-0716
Investment Committee1 Portfolio Management Trading
Average 22 Years of Industry Experience Average 13 Years of Industry Experience Average 13 Years of Industry Experience
David Booth, Founder and Executive Chairman
David Butler, Co-Chief Executive Officer, Head of Global Financial Advisor Services, and Dimensional Director
Gerard O’Reilly, Co-Chief Executive Officer, Chief Investment Officer, and Dimensional Director
Joseph Chi, Investment Committee Chairman and Co-Head of Portfolio Management
Robert Deere, Senior Investment Director
Jed Fogdall, Co-Head of Portfolio Management
Joseph Kolerich, Senior Portfolio Manager
Mary Phillips, Senior Portfolio Manager
David Plecha, Global Head of Fixed Income
Savina Rizova, Co-Head of Research
Karen Umland, Senior Portfolio Manager
Ryan Wiley, Co-Head of Global Equity Trading
AustinJed Fogdall, Co-Head of Portfolio Management
Senior Portfolio Managers: Arun Keswani, Joseph Kolerich, Joel Schneider, Lukas Smart
Portfolio Managers: Ashish Bhagwanjee, William Collins-Dean, Gavin Crabb, Damian Dormer, Joseph Hohn,Alan Hutchison, Marc Corona Leblond, Brendan McAndrews, John Morrison, Pamela Noble, Andres Torres, Ethan Wren, Matthew Zenz
CharlotteSenior Portfolio Managers: Marcus Axthelm, Mary Phillips
Portfolio Managers:Horacio Carias, Travis Meldau
Santa MonicaJoseph Chi, Co-Head of Portfolio Management
Robert Deere, Senior Investment Director
David Plecha, Global Head of Fixed Income
Senior Portfolio Managers: Daniel Ong, Allen Pu, Grady Smith, Karen Umland
Portfolio Managers: Patrick Brown, Mitchell Firestein, John Hertzer,David Shao, Brian Walsh
LondonNathan Lacaze, Co-CEO, Dimensional Fund Advisors Ltd. and Head of EMEA Portfolio Management
Senior Portfolio Managers: Paul Foley, Joel Kim
Portfolio Managers: Kipp Cummins, Alexander Fridman, Krati Gupta, Althea Trevor, Adam Ward, Jim Whittington
SydneyBhanu Singh, Head of Asia Pacific Portfolio Management and Director
Robert Ness, Senior Portfolio Manager
Portfolio Managers: Murray Cockerell, Stephen Garth, Slava Platkov, Gillian Wilson, Craig Wright
TokyoKotaro Hama, Portfolio Manager
SingaporeEmily Cornell, Portfolio Manager
AustinSenior Traders: Christian Gunther, David LaRusso, Christopher Rink, Scott Van Pelt
Traders: Joel Mitter, Robert Richardson, Elizabeth Van Pelt
CharlottePolly Weiss, Senior Trader
Santa MonicaRyan Wiley, Co-Head of Global Equity Trading
Le Tran, Senior Trader
Traders: Claudette Higdon, Erhan Oktay
LondonJohn Romiza, Co-CEO, Dimensional Fund Advisors Ltd. and Co-Head of Global Equity Trading
Senior Traders: Mark Butterworth, William Letheren
Traders: Frances Ritter, Mathieu Roland, James Simpson, Archit Soni
SydneyJason Lapping, Head of International Equity Trading
Senior Traders: David Vrolyk, Sam Willis
Jian Du, Trader
SingaporeTraders: Jonathan Smith, Hayato Yonemori
SALES AND CLIENT SERVICE
David P. Butler1
Co-Chief Executive Officer, Head of Global Financial Advisor Services, and Dimensional Director
Stephen A. ClarkHead of Global Institutional Services
Mark GochnourHead of Financial Advisor Services International and Advisor Services
Craig HorvathGlobal Head of Consultant Relations
David R. JonesHead of Financial Advisor Services, EMEA
Kevin KandasamyHead of Institutional, Australia
Nathan KriegerHead of Financial Advisor Services, Australia
Bryce SkaffHead of US Financial Advisor Services and Strategic Relationship
Bradley G. SteimanDirector and Head of Canadian Financial Advisor Services
Joel TeasdelHead of Financial Advisor Services, Asia ex Japan
Erik van Houwelingen Head of European Sales, Dimensional Fund Advisors Ltd. (DFAL)
Carlo VenesHead of Institutional, Asia ex Japan
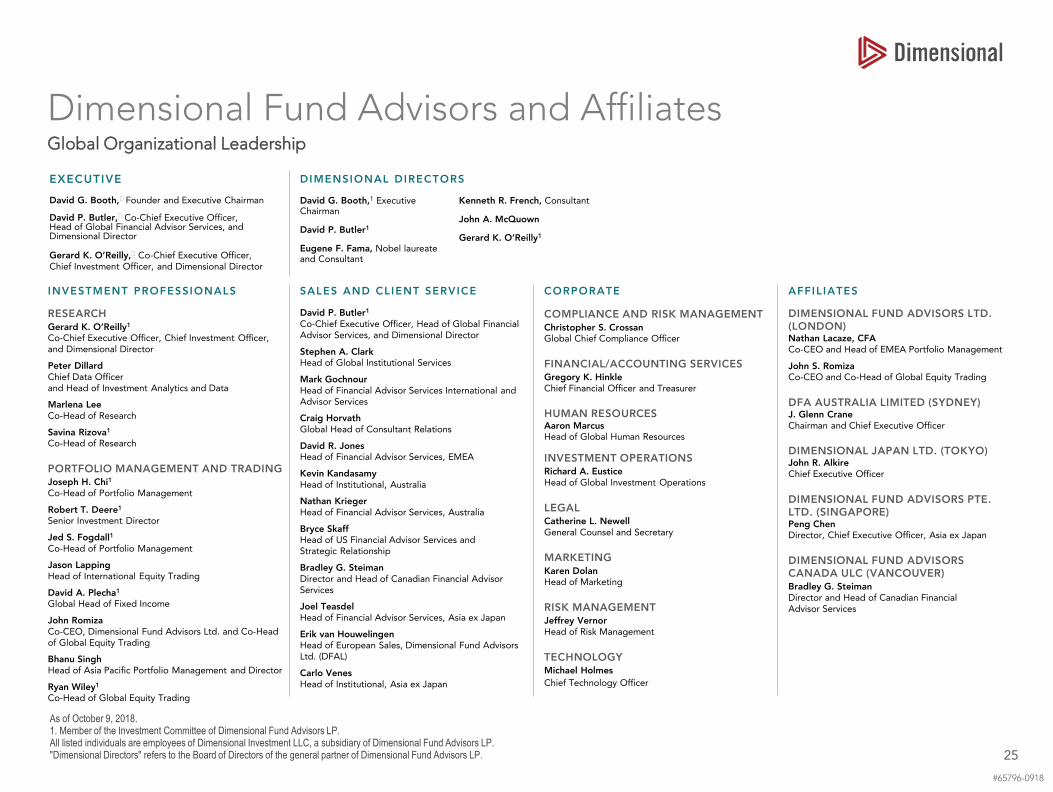
Dimensional Fund Advisors and Affiliates
25
Global Organizational Leadership
As of October 9, 2018.1. Member of the Investment Committee of Dimensional Fund Advisors LP.All listed individuals are employees of Dimensional Investment LLC, a subsidiary of Dimensional Fund Advisors LP."Dimensional Directors" refers to the Board of Directors of the general partner of Dimensional Fund Advisors LP.
#65796-0918
INVESTMENT PROFESSIONALS
RESEARCH Gerard K. O’Reilly1
Co-Chief Executive Officer, Chief Investment Officer,and Dimensional Director
Peter DillardChief Data Officer and Head of Investment Analytics and Data
Marlena LeeCo-Head of Research
Savina Rizova1
Co-Head of Research
PORTFOLIO MANAGEMENT AND TRADING Joseph H. Chi1
Co-Head of Portfolio Management
Robert T. Deere1
Senior Investment Director
Jed S. Fogdall1
Co-Head of Portfolio Management
Jason LappingHead of International Equity Trading
David A. Plecha1
Global Head of Fixed Income
John RomizaCo-CEO, Dimensional Fund Advisors Ltd. and Co-Head of Global Equity Trading
Bhanu SinghHead of Asia Pacific Portfolio Management and Director
Ryan Wiley1
Co-Head of Global Equity Trading
CORPORATE
COMPLIANCE AND RISK MANAGEMENTChristopher S. CrossanGlobal Chief Compliance Officer
FINANCIAL/ACCOUNTING SERVICES Gregory K. HinkleChief Financial Officer and Treasurer
HUMAN RESOURCES Aaron MarcusHead of Global Human Resources
INVESTMENT OPERATIONSRichard A. EusticeHead of Global Investment Operations
LEGAL Catherine L. NewellGeneral Counsel and Secretary
MARKETINGKaren DolanHead of Marketing
RISK MANAGEMENT Jeffrey VernorHead of Risk Management
TECHNOLOGYMichael Holmes
Chief Technology Officer
EXECUTIVE
David G. Booth,1 Founder and Executive Chairman
David P. Butler,1 Co-Chief Executive Officer, Head of Global Financial Advisor Services, and Dimensional Director
Gerard K. O’Reilly,1 Co-Chief Executive Officer, Chief Investment Officer, and Dimensional Director
DIMENSIONAL DIRECTORS
David G. Booth,1 Executive Chairman
David P. Butler1
Eugene F. Fama, Nobel laureate and Consultant
Kenneth R. French, Consultant
John A. McQuown
Gerard K. O’Reilly1
AFFIL IATES
DIMENSIONAL FUND ADVISORS LTD. (LONDON)Nathan Lacaze, CFACo-CEO and Head of EMEA Portfolio Management
John S. RomizaCo-CEO and Co-Head of Global Equity Trading
DFA AUSTRALIA LIMITED (SYDNEY) J. Glenn CraneChairman and Chief Executive Officer
DIMENSIONAL JAPAN LTD. (TOKYO) John R. AlkireChief Executive Officer
DIMENSIONAL FUND ADVISORS PTE. LTD. (SINGAPORE) Peng ChenDirector, Chief Executive Officer, Asia ex Japan
DIMENSIONAL FUND ADVISORS CANADA ULC (VANCOUVER)Bradley G. SteimanDirector and Head of Canadian Financial Advisor Services
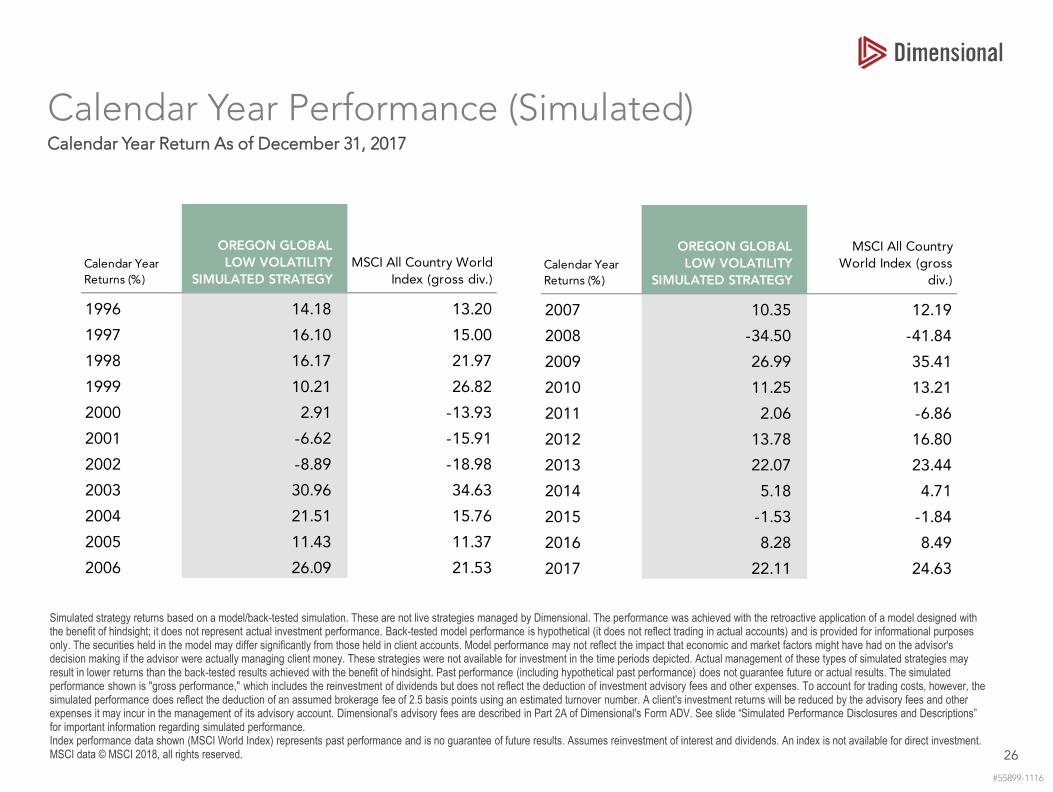
Calendar Year Performance (Simulated)
26
Calendar Year Return As of December 31, 2017
Simulated strategy returns based on a model/back-tested simulation. These are not live strategies managed by Dimensional. The performance was achieved with the retroactive application of a model designed with the benefit of hindsight; it does not represent actual investment performance. Back-tested model performance is hypothetical (it does not reflect trading in actual accounts) and is provided for informational purposes only. The securities held in the model may differ significantly from those held in client accounts. Model performance may not reflect the impact that economic and market factors might have had on the advisor's decision making if the advisor were actually managing client money. These strategies were not available for investment in the time periods depicted. Actual management of these types of simulated strategies may result in lower returns than the back-tested results achieved with the benefit of hindsight. Past performance (including hypothetical past performance) does not guarantee future or actual results. The simulated performance shown is "gross performance," which includes the reinvestment of dividends but does not reflect the deduction of investment advisory fees and other expenses. To account for trading costs, however, the simulated performance does reflect the deduction of an assumed brokerage fee of 2.5 basis points using an estimated turnover number. A client's investment returns will be reduced by the advisory fees and other expenses it may incur in the management of its advisory account. Dimensional's advisory fees are described in Part 2A of Dimensional's Form ADV. See slide “Simulated Performance Disclosures and Descriptions” for important information regarding simulated performance. Index performance data shown (MSCI World Index) represents past performance and is no guarantee of future results. Assumes reinvestment of interest and dividends. An index is not available for direct investment. MSCI data © MSCI 2018, all rights reserved.
#55899-1116
Calendar Year
Returns (%)
OREGON GLOBAL
LOW VOLATILITY
SIMULATED STRATEGY
MSCI All Country
World Index (gross
div.)
2007 10.35 12.19
2008 -34.50 -41.84
2009 26.99 35.41
2010 11.25 13.21
2011 2.06 -6.86
2012 13.78 16.80
2013 22.07 23.44
2014 5.18 4.71
2015 -1.53 -1.84
2016 8.28 8.49
2017 22.11 24.63
Calendar Year
Returns (%)
OREGON GLOBAL
LOW VOLATILITY
SIMULATED STRATEGY
MSCI All Country World
Index (gross div.)
1996 14.18 13.20
1997 16.10 15.00
1998 16.17 21.97
1999 10.21 26.82
2000 2.91 -13.93
2001 -6.62 -15.91
2002 -8.89 -18.98
2003 30.96 34.63
2004 21.51 15.76
2005 11.43 11.37
2006 26.09 21.53
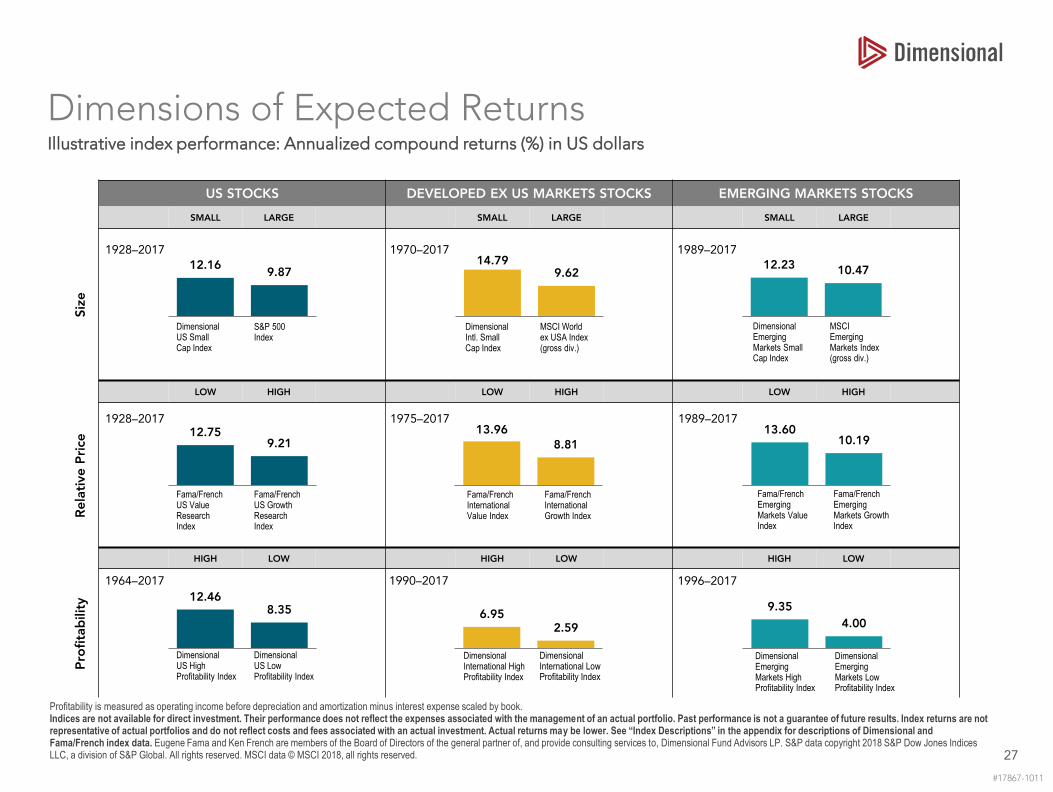
Dimensions of Expected Returns
27
Illustrative index performance: Annualized compound returns (%) in US dollars
Profitability is measured as operating income before depreciation and amortization minus interest expense scaled by book. Indices are not available for direct investment. Their performance does not reflect the expenses associated with the management of an actual portfolio. Past performance is not a guarantee of future results. Index returns are not representative of actual portfolios and do not reflect costs and fees associated with an actual investment. Actual returns may be lower. See “Index Descriptions” in the appendix for descriptions of Dimensional and Fama/French index data. Eugene Fama and Ken French are members of the Board of Directors of the general partner of, and provide consulting services to, Dimensional Fund Advisors LP. S&P data copyright 2018 S&P Dow Jones Indices LLC, a division of S&P Global. All rights reserved. MSCI data © MSCI 2018, all rights reserved.
#17867-1011
US STOCKS DEVELOPED EX US MARKETS STOCKS EMERGING MARKETS STOCKS
SMALL LARGE SMALL LARGE SMALL LARGE
Siz
e
LOW HIGH LOW HIGH LOW HIGH
Rela
tive P
rice
HIGH LOW HIGH LOW HIGH LOW
Pro
fita
bilit
y
1928–2017
1996–2017
1975–2017
12.169.87
S&P 500 Index
Dimensional US Small Cap Index
Fama/French International Growth Index
Fama/French International Value Index
Dimensional Emerging Markets High Profitability Index
Dimensional Emerging Markets Low Profitability Index
1928–2017
Fama/French US Growth ResearchIndex
Fama/French US Value ResearchIndex
1970–2017
MSCI World ex USA Index (gross div.)
Dimensional Intl. Small Cap Index
1964–2017
Dimensional US HighProfitability Index
Dimensional US Low Profitability Index
MSCI Emerging Markets Index(gross div.)
Dimensional EmergingMarkets Small Cap Index
1989–2017
1990–2017
Dimensional International High Profitability Index
Dimensional International Low Profitability Index
1989–2017
Fama/French Emerging Markets Growth Index
Fama/French Emerging Markets Value Index
14.799.62
12.23 10.47
12.759.21
13.96
8.81
13.6010.19
12.468.35 6.95
2.59
9.35
4.00
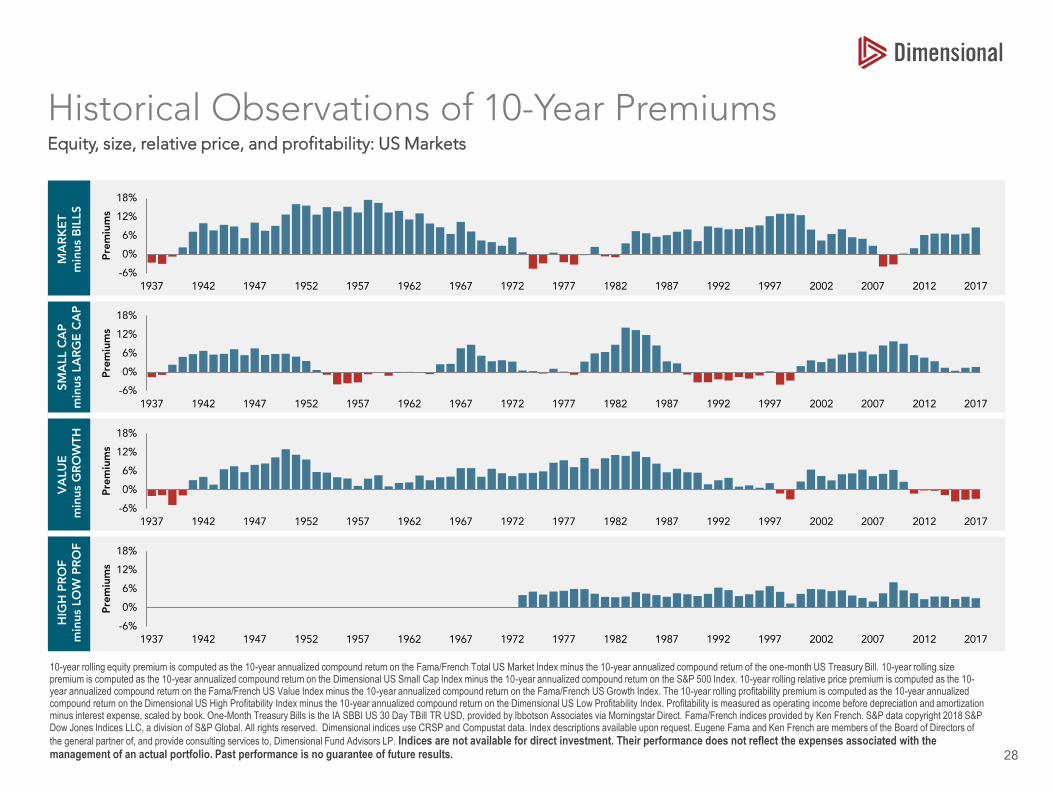
Historical Observations of 10-Year Premiums
28
Equity, size, relative price, and profitability: US Markets
10-year rolling equity premium is computed as the 10-year annualized compound return on the Fama/French Total US Market Index minus the 10-year annualized compound return of the one-month US Treasury Bill. 10-year rolling size premium is computed as the 10-year annualized compound return on the Dimensional US Small Cap Index minus the 10-year annualized compound return on the S&P 500 Index. 10-year rolling relative price premium is computed as the 10-year annualized compound return on the Fama/French US Value Index minus the 10-year annualized compound return on the Fama/French US Growth Index. The 10-year rolling profitability premium is computed as the 10-year annualized compound return on the Dimensional US High Profitability Index minus the 10-year annualized compound return on the Dimensional US Low Profitability Index. Profitability is measured as operating income before depreciation and amortization minus interest expense, scaled by book. One-Month Treasury Bills is the IA SBBI US 30 Day TBill TR USD, provided by Ibbotson Associates via Morningstar Direct. Fama/French indices provided by Ken French. S&P data copyright 2018 S&P Dow Jones Indices LLC, a division of S&P Global. All rights reserved. Dimensional indices use CRSP and Compustat data. Index descriptions available upon request. Eugene Fama and Ken French are members of the Board of Directors of
the general partner of, and provide consulting services to, Dimensional Fund Advisors LP. Indices are not available for direct investment. Their performance does not reflect the expenses associated with the management of an actual portfolio. Past performance is no guarantee of future results.
MA
RK
ET
min
us
BIL
LS
SM
ALL C
AP
min
us
LA
RG
E C
AP
VA
LU
Em
inus
GR
OW
TH
HIG
H P
RO
F
min
us
LO
W P
RO
F
1937 1942 1947 1952 1957 1962 1967 1972 1977 1982 1987 1992 1997 2002 2007 2012 2017
-6%
0%
6%
12%
18%
Pre
miu
ms
1937 1942 1947 1952 1957 1962 1967 1972 1977 1982 1987 1992 1997 2002 2007 2012 2017
-6%
0%
6%
12%
18%
Pre
miu
ms
1937 1942 1947 1952 1957 1962 1967 1972 1977 1982 1987 1992 1997 2002 2007 2012 2017
-6%
0%
6%
12%
18%
Pre
miu
ms
1937 1942 1947 1952 1957 1962 1967 1972 1977 1982 1987 1992 1997 2002 2007 2012 2017
-6%
0%
6%
12%
18%
Pre
miu
ms
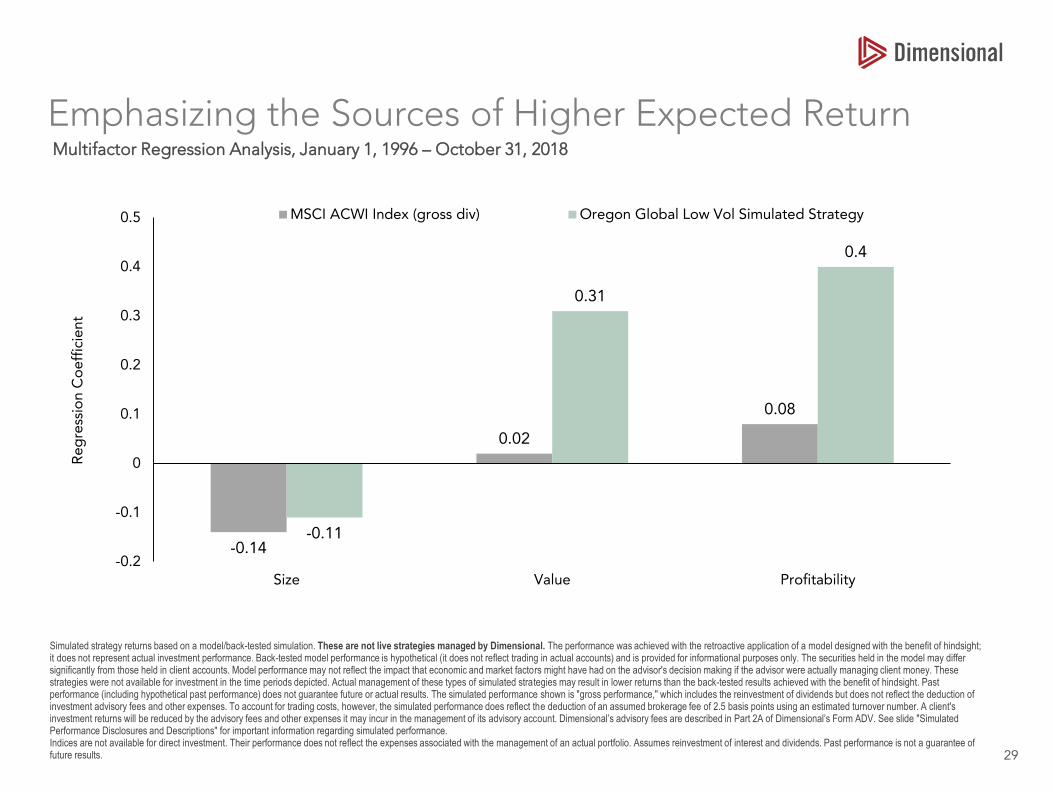
Emphasizing the Sources of Higher Expected Return
29
Multifactor Regression Analysis, January 1, 1996 – October 31, 2018
Simulated strategy returns based on a model/back-tested simulation. These are not live strategies managed by Dimensional. The performance was achieved with the retroactive application of a model designed with the benefit of hindsight; it does not represent actual investment performance. Back-tested model performance is hypothetical (it does not reflect trading in actual accounts) and is provided for informational purposes only. The securities held in the model may differ significantly from those held in client accounts. Model performance may not reflect the impact that economic and market factors might have had on the advisor's decision making if the advisor were actually managing client money. These strategies were not available for investment in the time periods depicted. Actual management of these types of simulated strategies may result in lower returns than the back-tested results achieved with the benefit of hindsight. Past performance (including hypothetical past performance) does not guarantee future or actual results. The simulated performance shown is "gross performance," which includes the reinvestment of dividends but does not reflect the deduction of investment advisory fees and other expenses. To account for trading costs, however, the simulated performance does reflect the deduction of an assumed brokerage fee of 2.5 basis points using an estimated turnover number. A client's investment returns will be reduced by the advisory fees and other expenses it may incur in the management of its advisory account. Dimensional’s advisory fees are described in Part 2A of Dimensional’s Form ADV. See slide "Simulated Performance Disclosures and Descriptions" for important information regarding simulated performance. Indices are not available for direct investment. Their performance does not reflect the expenses associated with the management of an actual portfolio. Assumes reinvestment of interest and dividends. Past performance is not a guarantee of future results.
-0.14
0.02
0.08
-0.11
0.31
0.4
-0.2
-0.1
0
0.1
0.2
0.3
0.4
0.5
Size Value Profitability
Reg
ress
ion
Co
eff
icie
nt
MSCI ACWI Index (gross div) Oregon Global Low Vol Simulated Strategy
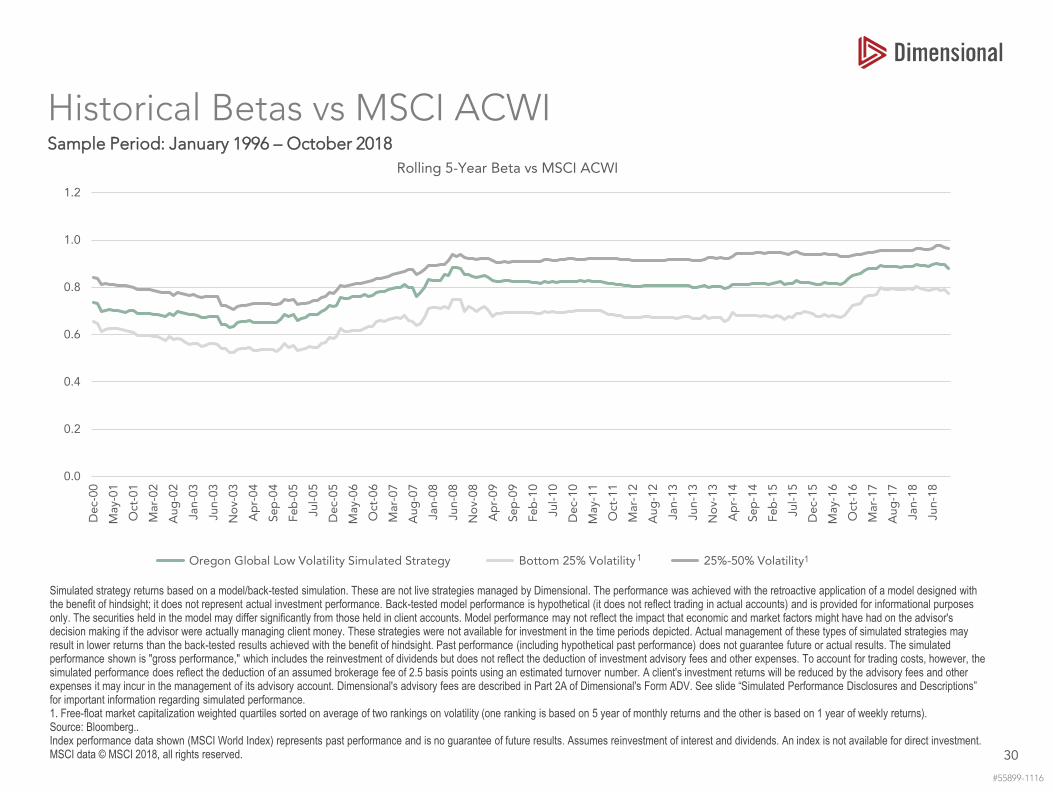
Historical Betas vs MSCI ACWI
30
Sample Period: January 1996 – October 2018
Simulated strategy returns based on a model/back-tested simulation. These are not live strategies managed by Dimensional. The performance was achieved with the retroactive application of a model designed with the benefit of hindsight; it does not represent actual investment performance. Back-tested model performance is hypothetical (it does not reflect trading in actual accounts) and is provided for informational purposes only. The securities held in the model may differ significantly from those held in client accounts. Model performance may not reflect the impact that economic and market factors might have had on the advisor's decision making if the advisor were actually managing client money. These strategies were not available for investment in the time periods depicted. Actual management of these types of simulated strategies may result in lower returns than the back-tested results achieved with the benefit of hindsight. Past performance (including hypothetical past performance) does not guarantee future or actual results. The simulated performance shown is "gross performance," which includes the reinvestment of dividends but does not reflect the deduction of investment advisory fees and other expenses. To account for trading costs, however, the simulated performance does reflect the deduction of an assumed brokerage fee of 2.5 basis points using an estimated turnover number. A client's investment returns will be reduced by the advisory fees and other expenses it may incur in the management of its advisory account. Dimensional's advisory fees are described in Part 2A of Dimensional's Form ADV. See slide “Simulated Performance Disclosures and Descriptions” for important information regarding simulated performance. 1. Free-float market capitalization weighted quartiles sorted on average of two rankings on volatility (one ranking is based on 5 year of monthly returns and the other is based on 1 year of weekly returns). Source: Bloomberg.. Index performance data shown (MSCI World Index) represents past performance and is no guarantee of future results. Assumes reinvestment of interest and dividends. An index is not available for direct investment. MSCI data © MSCI 2018, all rights reserved.
#55899-1116
1
0.0
0.2
0.4
0.6
0.8
1.0
1.2
Dec-
00
May-
01
Oct
-01
Mar-
02
Au
g-0
2
Jan
-03
Jun
-03
No
v-03
Ap
r-0
4
Sep
-04
Feb
-05
Jul-
05
Dec-
05
May-
06
Oct
-06
Mar-
07
Au
g-0
7
Jan
-08
Jun
-08
No
v-08
Ap
r-0
9
Sep
-09
Feb
-10
Jul-
10
Dec-
10
May-
11
Oct
-11
Mar-
12
Au
g-1
2
Jan
-13
Jun
-13
No
v-13
Ap
r-1
4
Sep
-14
Feb
-15
Jul-
15
Dec-
15
May-
16
Oct
-16
Mar-
17
Au
g-1
7
Jan
-18
Jun
-18
Rolling 5-Year Beta vs MSCI ACWI
Oregon Global Low Volatility Simulated Strategy Bottom 25% Volatility 25%-50% Volatility1
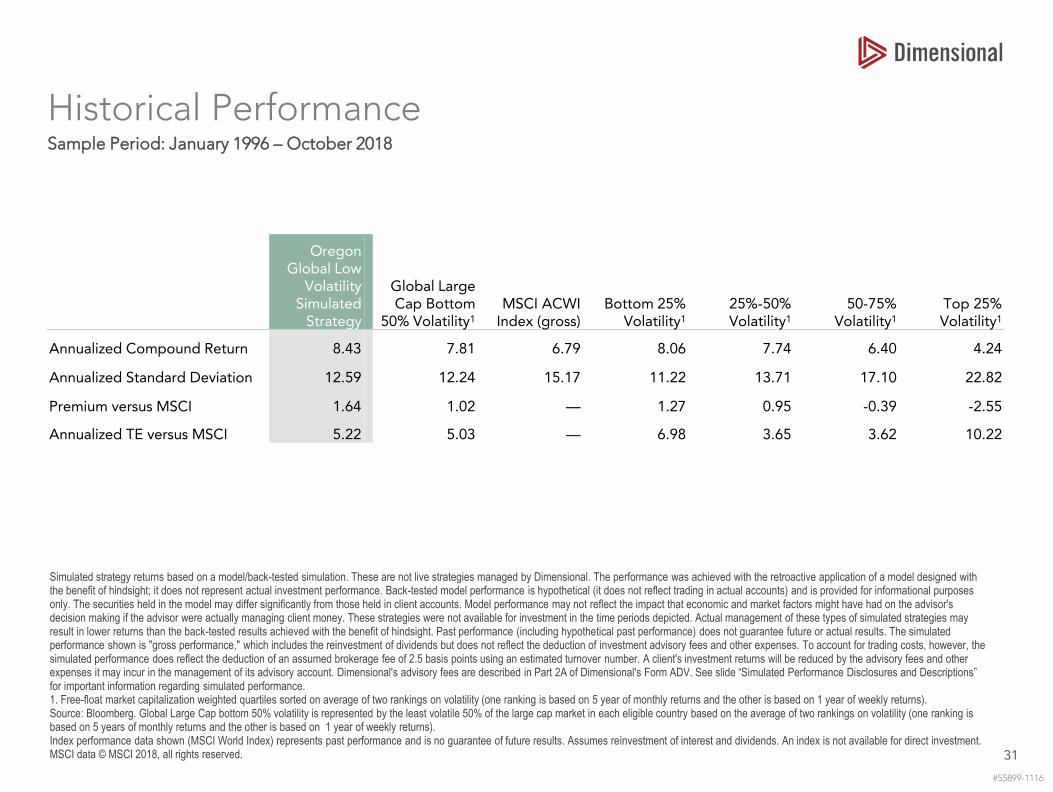
Historical Performance
31
Sample Period: January 1996 – October 2018
Simulated strategy returns based on a model/back-tested simulation. These are not live strategies managed by Dimensional. The performance was achieved with the retroactive application of a model designed with the benefit of hindsight; it does not represent actual investment performance. Back-tested model performance is hypothetical (it does not reflect trading in actual accounts) and is provided for informational purposes only. The securities held in the model may differ significantly from those held in client accounts. Model performance may not reflect the impact that economic and market factors might have had on the advisor's decision making if the advisor were actually managing client money. These strategies were not available for investment in the time periods depicted. Actual management of these types of simulated strategies may result in lower returns than the back-tested results achieved with the benefit of hindsight. Past performance (including hypothetical past performance) does not guarantee future or actual results. The simulated performance shown is "gross performance," which includes the reinvestment of dividends but does not reflect the deduction of investment advisory fees and other expenses. To account for trading costs, however, the simulated performance does reflect the deduction of an assumed brokerage fee of 2.5 basis points using an estimated turnover number. A client's investment returns will be reduced by the advisory fees and other expenses it may incur in the management of its advisory account. Dimensional's advisory fees are described in Part 2A of Dimensional's Form ADV. See slide “Simulated Performance Disclosures and Descriptions” for important information regarding simulated performance. 1. Free-float market capitalization weighted quartiles sorted on average of two rankings on volatility (one ranking is based on 5 year of monthly returns and the other is based on 1 year of weekly returns). Source: Bloomberg. Global Large Cap bottom 50% volatility is represented by the least volatile 50% of the large cap market in each eligible country based on the average of two rankings on volatility (one ranking is based on 5 years of monthly returns and the other is based on 1 year of weekly returns). Index performance data shown (MSCI World Index) represents past performance and is no guarantee of future results. Assumes reinvestment of interest and dividends. An index is not available for direct investment. MSCI data © MSCI 2018, all rights reserved.
#55899-1116
Oregon Global Low
Volatility Simulated
Strategy
Global Large Cap Bottom
50% Volatility1
MSCI ACWI Index (gross)
Bottom 25% Volatility1
25%-50% Volatility1
50-75% Volatility1
Top 25% Volatility1
Annualized Compound Return 8.43 7.81 6.79 8.06 7.74 6.40 4.24
Annualized Standard Deviation 12.59 12.24 15.17 11.22 13.71 17.10 22.82
Premium versus MSCI 1.64 1.02 — 1.27 0.95 -0.39 -2.55
Annualized TE versus MSCI 5.22 5.03 — 6.98 3.65 3.62 10.22
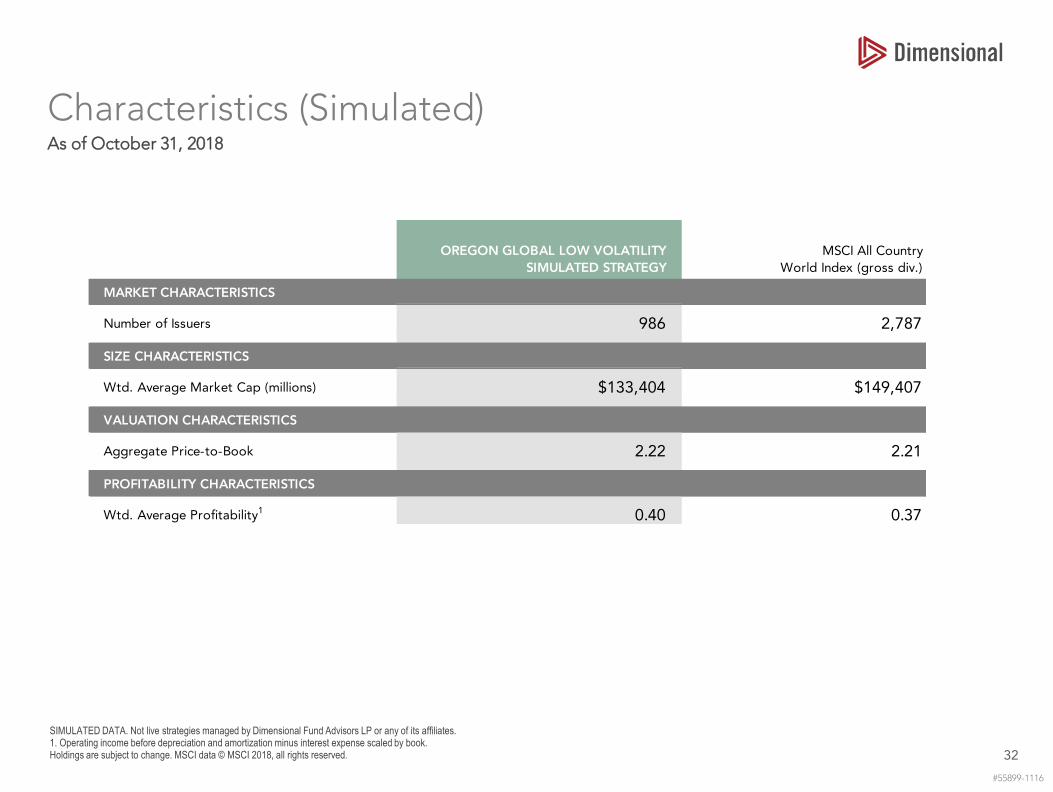
Characteristics (Simulated)
32
As of October 31, 2018
SIMULATED DATA. Not live strategies managed by Dimensional Fund Advisors LP or any of its affiliates. 1. Operating income before depreciation and amortization minus interest expense scaled by book.Holdings are subject to change. MSCI data © MSCI 2018, all rights reserved.
#55899-1116
Q3 2016 v2 10/12/2016 OREGON GLOBAL LOW VOLATILITY
SIMULATED STRATEGY
MSCI All Country
World Index (gross div.)
MARKET CHARACTERISTICS
Number of Issuers 986 2,787
SIZE CHARACTERISTICS
Wtd. Average Market Cap (millions) $133,404 $149,407
VALUATION CHARACTERISTICS
Aggregate Price-to-Book 2.22 2.21
PROFITABILITY CHARACTERISTICS
Wtd. Average Profitability1 0.40 0.37
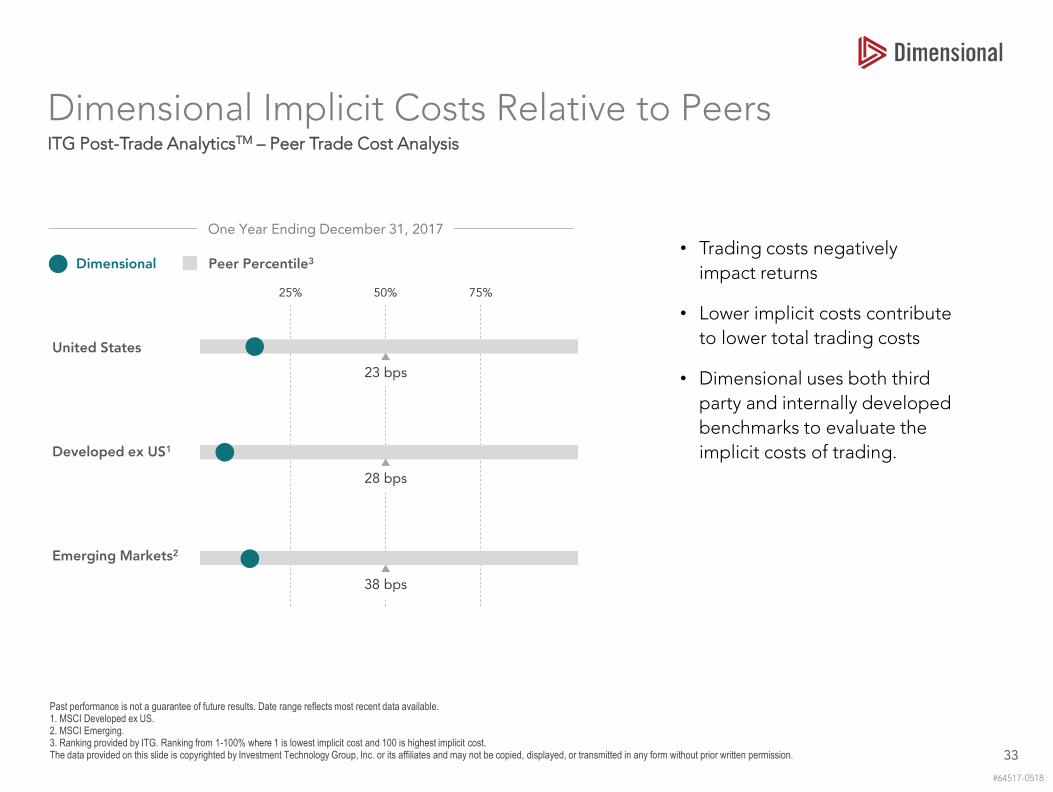
Dimensional Implicit Costs Relative to Peers
33
ITG Post-Trade AnalyticsTM – Peer Trade Cost Analysis
• Trading costs negatively
impact returns
• Lower implicit costs contribute
to lower total trading costs
• Dimensional uses both third
party and internally developed
benchmarks to evaluate the
implicit costs of trading.
Past performance is not a guarantee of future results. Date range reflects most recent data available.1. MSCI Developed ex US.2. MSCI Emerging.3. Ranking provided by ITG. Ranking from 1-100% where 1 is lowest implicit cost and 100 is highest implicit cost. The data provided on this slide is copyrighted by Investment Technology Group, Inc. or its affiliates and may not be copied, displayed, or transmitted in any form without prior written permission.
#64517-0518
One Year Ending December 31, 2017
United States
Developed ex US1
Emerging Markets2
23 bps
25% 50% 75%
28 bps
38 bps
Dimensional Peer Percentile3
Simulated Performance Disclosures and Descriptions
34
Simulated strategy returns based on a model/back-tested simulation. These are not live strategies managed by Dimensional. The performance was achieved with the retroactive application of a model designed with the benefit of hindsight; it does not represent actual investment performance. Back-tested model performance is hypothetical (it does not reflect trading in actual accounts) and is provided for informational purposes only. The securities held in the model may differ significantly from those held in client accounts. Model performance may not reflect the impact that economic and market factors might have had on the advisor's decision making if the advisor were actually managing client money. These strategies were not available for investment in the time periods depicted. Actual management of this type of simulated strategy may result in lower returns than the back-tested results achieved with the benefit of hindsight. Past performance (including hypothetical past performance) does not guarantee future or actual results.
The simulated performance shown is "gross performance," which includes the reinvestment of dividends but does not reflect the deduction of investment advisory fees and other expenses. A client's investment returns will be reduced by the advisory fees and other expenses that may be incurred in the management of the advisory account. For example, if a 1% annual advisory fee were deducted quarterly and a client's annual return were 10% (based on quarterly returns of approximately 2.41% each) before deduction of advisory fees, the deduction of advisory fees would result in an annual return of approximately 8.91% due, in part, to the compound effect of such fees. To account for trading costs, however, the simulated performance does reflect the deduction of an assumed brokerage fee of 2.5 basis points using an estimated turnover number. A client's investment returns will be reduced by the advisory fees and other expenses it may incur in the management of its advisory account. Dimensional's advisory fees are described in Part 2A of Dimensional's Form ADV.
Simulated Strategy DescriptionsOREGON GLOBAL LOW VOLATILITY SIMULATED STRATEGYSimulation excludes the most volatile 50% of the large cap market in each eligible country based on the average of two rankings on volatility (one ranking is based on 5 years of monthly returns and the other is based on 1 year of weekly returns). Within the remaining eligible stocks, we emphasize thesecurities with higher expected returns (companies with lower market capitalization, lower relative price and higher profitability) in a balanced manner. Country weights are based on the aggregate free float market cap of each eligible country. The simulated strategy is rebalanced semi-annually at December and June.
Using the Valuation Equation: Descriptions and Important Information
35
US: 1963-2017
Source: CRSP and Compustat. At the end of each June from 1963 to 2017 stocks are sorted on price-to-book into three portfolios, each representing one-third of the market. Similarly, stocks are sorted on profitability into three portfolios, each representing one-third of the market. The monthly returns reported above are for the intersections of the three portfolios formed on price-to-book and the three portfolios formed on profitability.
Non-US Developed: 1990-2016 and Emerging Markets: 1995-2017
Source: Bloomberg. Eligible stocks in each non-US developed market country are sorted on price-to-book into three portfolios, each representing one-third of the aggregate market capitalization of that country. Similarly, stocks are sorted on profitability into three portfolios, each representing one-third of the aggregate market capitalization of that country. From the intersections of the three portfolios formed on price-to-book and the three portfolios formed on profitability we form nine profitability/price-to-book portfolios within each country. The returns on the portfolios are constructed by averaging the returns on the respective country portfolios. Developed ex US portfolios are rebalanced semi-annually from December-end 1989 to June-end 2017. Emerging Markets portfolios are rebalanced semi-annually from June-end 1995 to June-end 2017.
US: Pre-1963
Source: Wahal, Sunil, The Profitability and Investment Premium: Pre-1963 Evidence (December 29, 2016). Available at SSRN: https://ssrn.com/abstract=2891491 or http://dx.doi.org/10.2139/ssrn.2891491. Sunil Wahal provides consulting services to Dimensional Fund Advisors LP.Using CRSP and Compustat data as well as hand-collected financials from the Moody's Industrial, Bank & Finance, and Utilities Manuals, at the end of June each year from 1940 to 1962 US stocks are sorted independently on book-to-market equity (B/M) and operating profitability (OP/B), defined as operating income before amortization and depreciation minus interest expense scaled by book equity. Stocks are sorted into three groups, each with one third of the number of stocks, based B/M. Similarly, stocks are sorted into three groups, each with one third of the number of stocks, based OP/B. From the intersection of the two independent sorts, six B/M-OP/B portfolios are formed. The exhibit reports average monthly value-weighted returns on those portfolios for July 1940 to June 1963.
Profitability is defined as operating income before depreciation and amortization minus interest expense divided by book equity.
#64287-0418
Index Descriptions
36
Dimensional US Small Cap Index was created by Dimensional in March 2007 and is compiled by Dimensional. It represents a market-capitalization-weighted index of securities of the smallest US companies whose market capitalization falls in the lowest 8% of the total market capitalization of the Eligible Market. The Eligible Market is composed of securities of US companies traded on the NYSE, NYSE MKT (formerly AMEX), and Nasdaq Global Market. Exclusions: Non-US companies, REITs, UITs, and investment companies. From January 1975 to the present, the index also excludes companies with the lowest profitability and highest relative price within the small cap universe. Profitability is measured as operating income before depreciation and amortization minus interest expense scaled by book. Source: CRSP and Compustat. The index monthly returns are computed as the simple average of the monthly returns of 12 sub-indices, each one reconstituted once a year at the end of a different month of the year. The calculation methodology for the Dimensional US Small Cap Index was amended on January 1, 2014, to include profitability as a factor in selecting securities for inclusion in the index.
Dimensional US High Profitability Index was created by Dimensional in January 2014 and represents an index consisting of US companies. It is compiled by Dimensional. Dimensional sorts stocks into three profitability groups from high to low. Each group represents one-third of the market capitalization. Similarly, stocks are sorted into three relative price groups. The intersections of the three profitability groups and the three relative price groups yield nine subgroups formed on profitability and relative price. The index represents the average return of the three high-profitability subgroups. It is rebalanced twice per year. Profitability is measured as operating income before depreciation and amortization minus interest expense scaled by book. Source: CRSP and Compustat.
Dimensional US Low Profitability Index was created by Dimensional in January 2014 and represents an index consisting of US companies. It is compiled by Dimensional. Dimensional sorts stocks into three profitability groups from high to low. Each group represents one-third of the market capitalization. Similarly, stocks are sorted into three relative price groups. The intersections of the three profitability groups and the three relative price groups yield nine subgroups formed on profitability and relative price. The index represents the average return of the three low-profitability subgroups. It is rebalanced twice per year. Profitability is measured as operating income before depreciation and amortization minus interest expense scaled by book. Source: CRSP and Compustat.
Dimensional International Small Cap Index was created by Dimensional in April 2008 and is compiled by Dimensional. July 1981–December 1993: It Includes non-US developed securities in the bottom 10% of market capitalization in each eligible country. All securities are market capitalization weighted. Each country is capped at 50%. Rebalanced semiannually. January 1994–Present: Market-capitalization-weighted index of small company securities in the eligible markets excluding those with the lowest profitability and highest relative price within the small cap universe. Profitability is measured as operating income before depreciation and amortization minus interest expense scaled by book. The index monthly returns are computed as the simple average of the monthly returns of four sub-indices, each one reconstituted once a year at the end of a different quarter of the year. Prior to July 1981, the index is 50% UK and 50% Japan. The calculation methodology for the Dimensional International Small Cap Index was amended on January 1, 2014, to include profitability as a factor in selecting securities for inclusion in the index.
The Dimensional Indices have been retrospectively calculated by Dimensional Fund Advisors LP and did not exist prior to their index inceptions dates. Accordingly, results shown during the periods prior to each Index’s index inception date do
not represent actual returns of the Index. Other periods selected may have different results, including losses. Backtested index performance is hypothetical and is provided for informational purposes only to indicate historical performance had
the index been calculated over the relevant time periods. Backtested performance results assume the reinvestment of dividends and capital gains.
Index Descriptions
37
Dimensional International Low Profitability Index was created by Dimensional in January 2013 and represents an index consisting of non-US developed companies. It is compiled by Dimensional. Dimensional sorts stocks into three profitability groups from high to low. Each group represents one-third of the market capitalization of each eligible country. Similarly, stocks are sorted into three relative price groups. The intersections of the three profitability groups and the three relative price groups yield nine subgroups formed on profitability and relative price. The index represents the average return of the three low-profitability subgroups. The index is rebalanced twice per year. Profitability is measured as operating income before depreciation and amortization minus interest expense scaled by book. Source: Bloomberg.
Dimensional International High Profitability Index was created by Dimensional in January 2013 and represents an index consisting of non-US developed companies. It is compiled by Dimensional. Dimensional sorts stocks into three profitability groups from high to low. Each group represents one-third of the market capitalization of each eligible country. Similarly, stocks are sorted into three relative price groups. The intersections of the three profitability groups and the three relative price groups yield nine subgroups formed on profitability and relative price. The index represents the average return of the three high-profitability subgroups. The index is rebalanced twice per year. Profitability is measured as operating income before depreciation and amortization minus interest expense scaled by book. Source: Bloomberg.
Dimensional Emerging Markets Low Profitability Index was created by Dimensional in April 2013 and represents an index consisting of emerging markets companies and is compiled by Dimensional. Dimensional sorts stocks into three profitability groups from high to low. Each group represents one-third of the market capitalization of each eligible country. Similarly, stocks are sorted into three relative price groups. The intersections of the three profitability groups and the three relative price groups yield nine subgroups formed on profitability and relative price. The index represents the average return of the three low-profitability subgroups. The index is rebalanced twice per year. Profitability is measured as operating income before depreciation and amortization minus interest expense scaled by book. Source: Bloomberg.
Dimensional Emerging Markets High Profitability Index was created by Dimensional in April 2013 and represents an index consisting of emerging markets companies and is compiled by Dimensional. Dimensional sorts stocks into three profitability groups from high to low. Each group represents one-third of the market capitalization of each eligible country. Similarly, stocks are sorted into three relative price groups. The intersections of the three profitability groups and the three relative price groups yield nine subgroups formed on profitability and relative price. The index represents the average return of the three high-profitability subgroups. The index is rebalanced twice per year. Profitability is measured as operating income before depreciation and amortization minus interest expense scaled by book. Source: Bloomberg.
Dimensional Emerging Markets Small Cap Index was created by Dimensional in April 2008 and is compiled by Dimensional. January 1989–December 1993: Fama/French Emerging Markets Small Cap Index. January 1994–Present: Dimensional Emerging Markets Small Index Composition: Market-capitalization-weighted index of small company securities in the eligible markets excluding those with the lowest profitability and highest relative price within the small cap universe. Profitability is measured as operating income before depreciation and amortization minus interest expense scaled by book. The index monthly returns are computed as the simple average of the monthly returns of four sub-indices, each one reconstituted once a year at the end of a different quarter of the year. Source: Bloomberg. The calculation methodology for the Dimensional Emerging Markets Small Cap Index was amended on January 1, 2014, to include profitability as a factor in selecting securities for inclusion in the index.
The Dimensional Indices have been retrospectively calculated by Dimensional Fund Advisors LP and did not exist prior to their index inceptions dates. Accordingly, results shown during the periods prior to each Index’s index inception date do not represent actual returns of the Index. Other periods selected may have different results, including losses. Backtested index performance is hypothetical and is provided for informational purposes only to indicate historical performance had the index been calculated over the relevant time periods. Backtested performance results assume the reinvestment of dividends and capital gains. Eugene Fama and Ken French are members of the Board of Directors of the general partner of, and provide consulting services to, Dimensional Fund Advisors LP.

Index Descriptions
38
Fama/French US Value Research Index: Provided by Fama/French from CRSP securities data. Includes the lower 30% in price-to-book of NYSE securities (plus NYSE Amex equivalents since July 1962 and Nasdaq equivalents since 1973).
Fama/French US Growth Research Index: Provided by Fama/French from CRSP securities data. Includes the higher 30% in price-to-book of NYSE securities (plus NYSE Amex equivalents since July 1962 and Nasdaq equivalents since 1973).
Fama/French Total US Market Index: Provided by Fama/French from CRSP securities data. Includes all US operating companies trading on the NYSE, AMEX or Nasdaq NMS. Excludes ADRs, Investment Companies, Tracking Stocks, non-US incorporated companies, Closed-end funds, Certificates, Shares of Beneficial Interests and Berkshire Hathaway Inc (Permco 540).
Fama/French International Value Index: 2008–present: Provided by Fama/French from Bloomberg securities data. Simulated strategy of MSCI EAFE + Canada countries in the lower 30% price-to-book range. 1975–2007: Provided by Fama/French from MSCI securities data.
Fama/French International Growth Index: 2008–present: Provided by Fama/French from Bloomberg securities data. Simulated strategy of MSCI EAFE + Canada countries in the higher 30% price-to-book range. 1975–2007: Provided by Fama/French from MSCI securities data.
Fama/French Emerging Markets Value Index: 2009–present: Provided by Fama/French from Bloomberg securities data. Simulated strategy using IFC investable universe countries. Companies in the lower 30% price-to-book range; companies weighted by float-adjusted market cap; countries weighted by country float-adjusted market cap; rebalanced monthly. 1989–2008: Provided by Fama/French from IFC securities data. IFC data provided by International Finance Corporation.
Fama/French Emerging Markets Growth Index: 2009–present: Provided by Fama/French from Bloomberg securities data. Simulated strategy using IFC investable universe countries. Companies in the higher 30% price-to-book range; companies weighted by float-adjusted market cap; countries weighted by country float-adjusted market cap; rebalanced monthly. 1989–2008: Provided by Fama/French from IFC securities data. IFC data provided by International Finance Corporation.
Results shown during periods prior to each Index’s index inception date do not represent actual returns of the respective index. Other periods selected may have different results, including losses. Backtested index performance is hypothetical and is provided for informational purposes only to indicate historical performance had the index been calculated over the relevant time periods. Backtested performance results assume the reinvestment of dividends and capital gains. Eugene Fama and Ken French are members of the Board of Directors of the general partner of, and provide consulting services to, Dimensional Fund Advisors LP.
Oregon Investment Council OPERF Capital Markets Policy Updates
1. Fixed Income Portfolio – Policy Revisions
2. Public Equity Portfolio – Manager Benchmark Changes
December 12, 2018
Purpose: 1) To update two policies in the OPERF Fixed Income Portfolio; and 2) to provide a recommendation to change benchmarks for two mandates within the OPERF Public Equity Portfolio. 1. Fixed Income. Staff recommends revisions to the fixed income policies to mirror the changes in the
public equity portfolio from the October meeting. Specifically, staff recommends reducing the number of policies in the fixed income portfolio from three to two, as follows:
a. INV 401: Strategic role of Fixed Income for OPERF;
b. INV 402: Internal Fixed Income Portfolio Investments; and
c. INV 403: Fixed Income Investments: Investment Manager Selection, Monitoring, and Termination (RETIRE and fold portions into INV 401).
2. Public Equity. Staff recommends two benchmark changes, as described below. Background In mid‐2014, the London Stock Exchange Group (LSEG) entered into an agreement to purchase the U.S.‐based, indexing and asset management firm, Russell Investments. Approximately one year later, LSEG merged its existing FTSE Group with the Russell Index brand, creating FTSE Russell, a single, global index business. Since then, the joint entity has conducted a comprehensive review of all index offerings and has decided to decommission a number of indices. FTSE Russell provides that an index may be decommissioned for a number of reasons, including inadequate supply of data, poor quality of data supply, insufficient number of clients using the index, insufficient revenue linked to the index or insufficient number of eligible constituents available for inclusion in the index. As a result, the Russell Global ex‐U.S. Microcap Index is scheduled to be decommissioned, effective December 31, 2018. This index serves as a benchmark for two mandates within the OPERF Public Equity portfolio (DFA Global ex‐U.S. Micro Cap and EAM Global ex‐U.S. Micro Cap). Although the Russell Global ex‐U.S. Microcap Index is scheduled to be decommissioned, the FTSE Russell group does offer a suitable replacement benchmark in the FTSE Global ex‐U.S. Micro Cap Index.
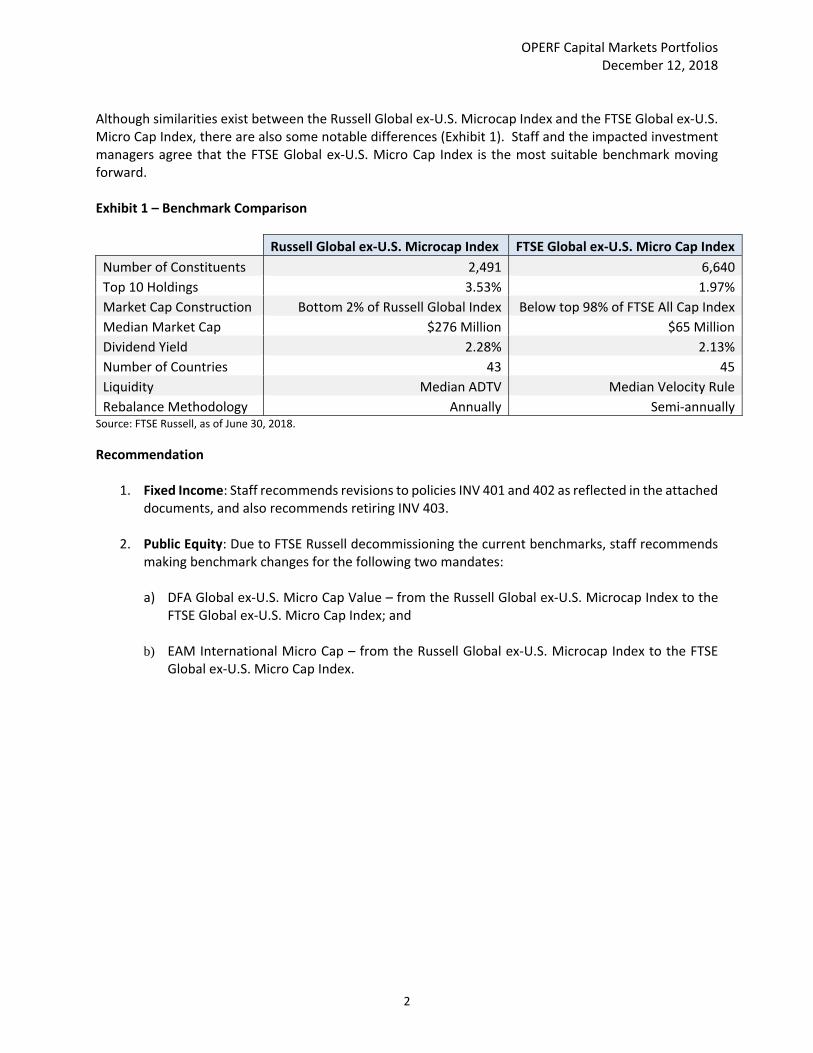
OPERF Capital Markets Portfolios December 12, 2018
2
Although similarities exist between the Russell Global ex‐U.S. Microcap Index and the FTSE Global ex‐U.S. Micro Cap Index, there are also some notable differences (Exhibit 1). Staff and the impacted investment managers agree that the FTSE Global ex‐U.S. Micro Cap Index is the most suitable benchmark moving forward. Exhibit 1 – Benchmark Comparison
Russell Global ex‐U.S. Microcap Index FTSE Global ex‐U.S. Micro Cap Index
Number of Constituents 2,491 6,640
Top 10 Holdings 3.53% 1.97%
Market Cap Construction Bottom 2% of Russell Global Index Below top 98% of FTSE All Cap Index
Median Market Cap $276 Million $65 Million
Dividend Yield 2.28% 2.13%
Number of Countries 43 45
Liquidity Median ADTV Median Velocity Rule
Rebalance Methodology Annually Semi‐annuallySource: FTSE Russell, as of June 30, 2018.
Recommendation
1. Fixed Income: Staff recommends revisions to policies INV 401 and 402 as reflected in the attached documents, and also recommends retiring INV 403.
2. Public Equity: Due to FTSE Russell decommissioning the current benchmarks, staff recommends
making benchmark changes for the following two mandates:
a) DFA Global ex‐U.S. Micro Cap Value – from the Russell Global ex‐U.S. Microcap Index to the FTSE Global ex‐U.S. Micro Cap Index; and
b) EAM International Micro Cap – from the Russell Global ex‐U.S. Microcap Index to the FTSE
Global ex‐U.S. Micro Cap Index.
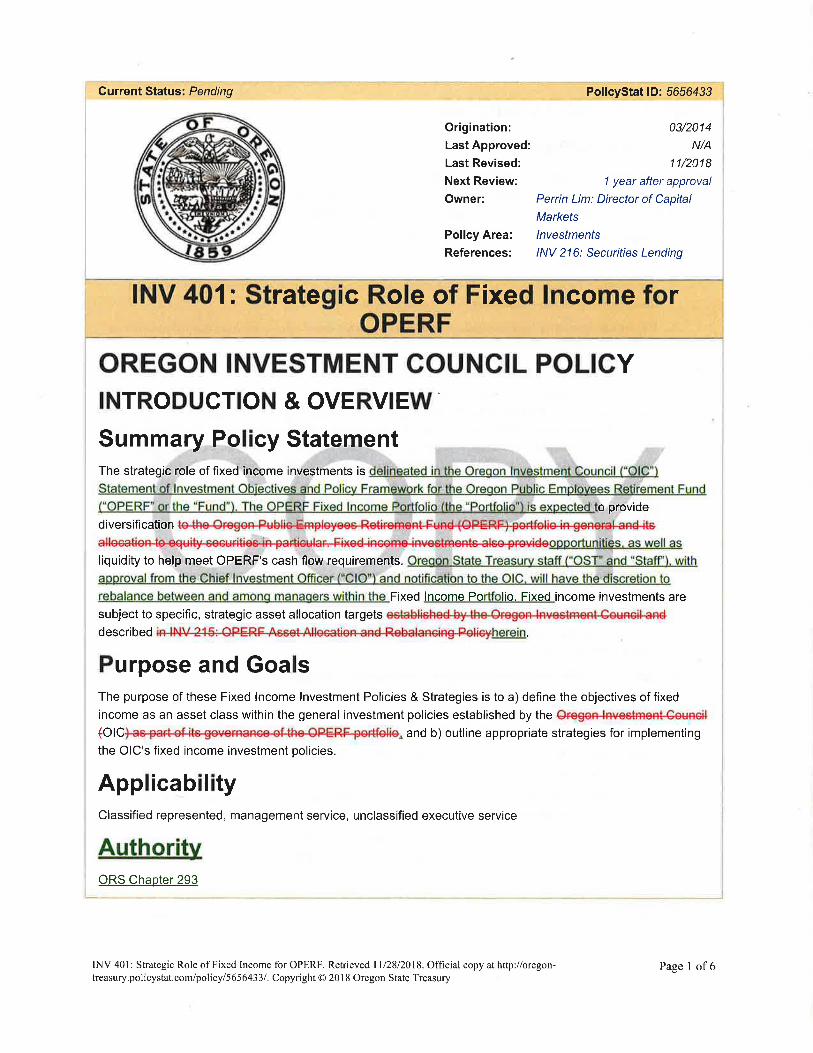
www.princexml.com
Prince - Non-commercial License
This document was created with Prince, a great way of getting web content onto paper.
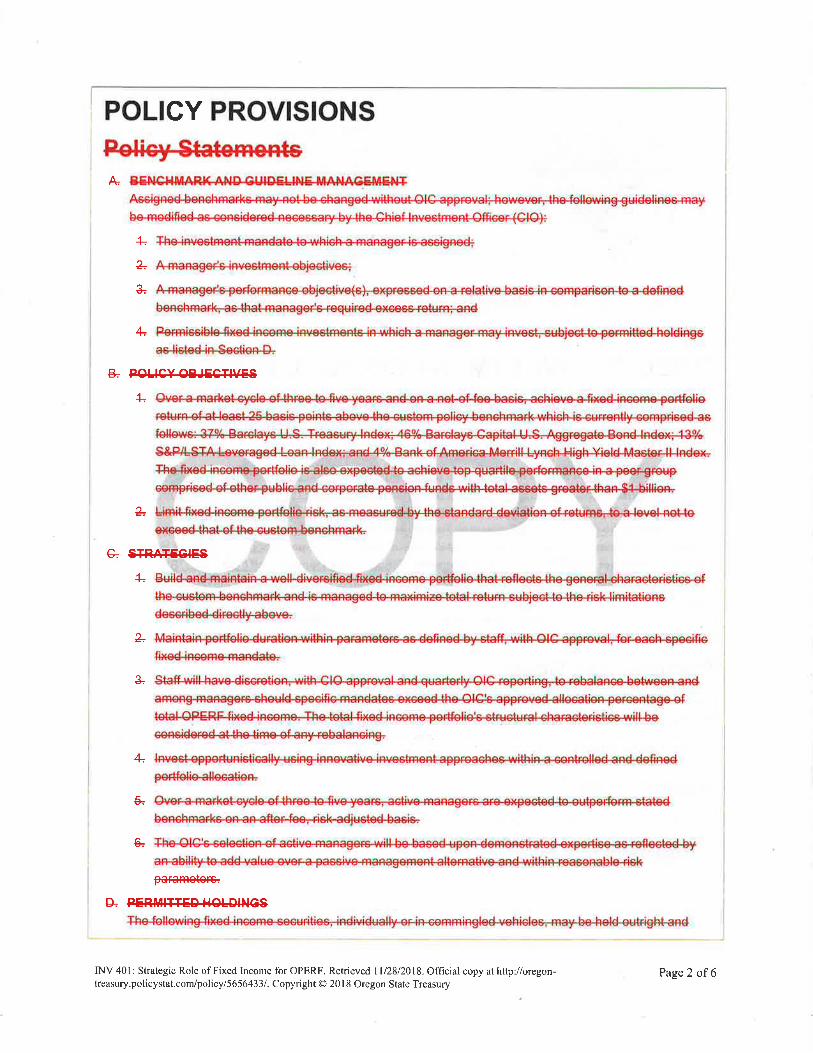
www.princexml.com
Prince - Non-commercial License
This document was created with Prince, a great way of getting web content onto paper.


www.princexml.com
Prince - Non-commercial License
This document was created with Prince, a great way of getting web content onto paper.
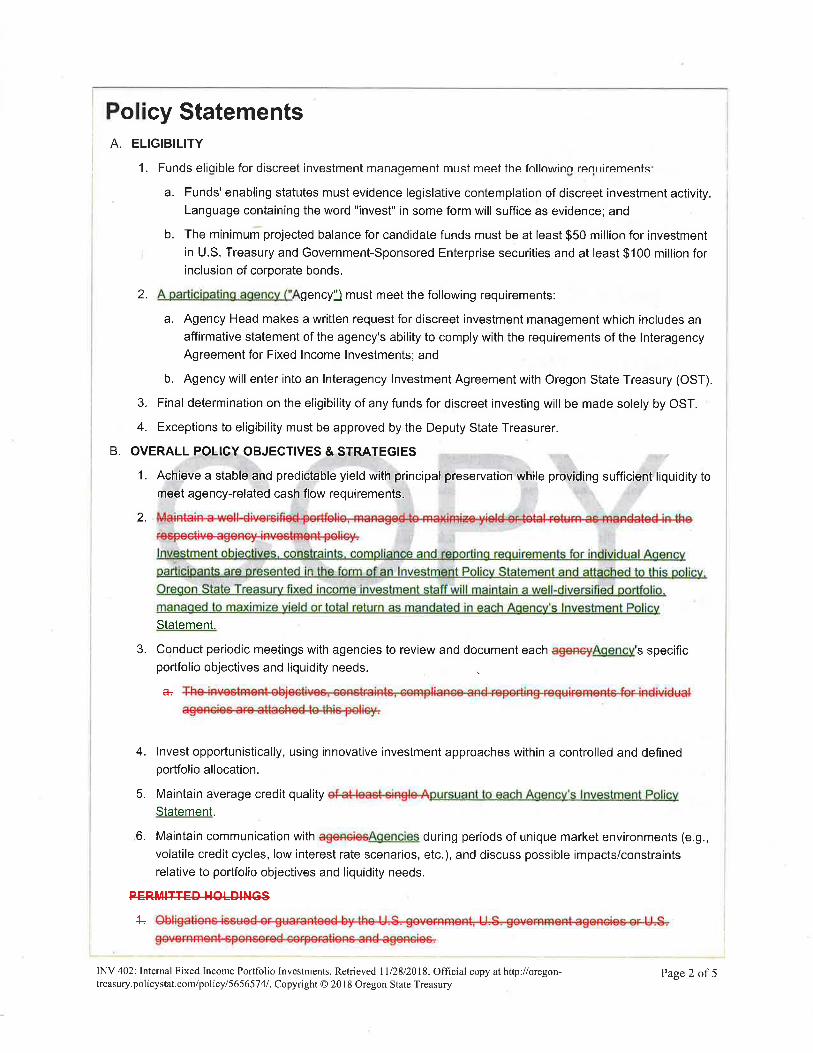
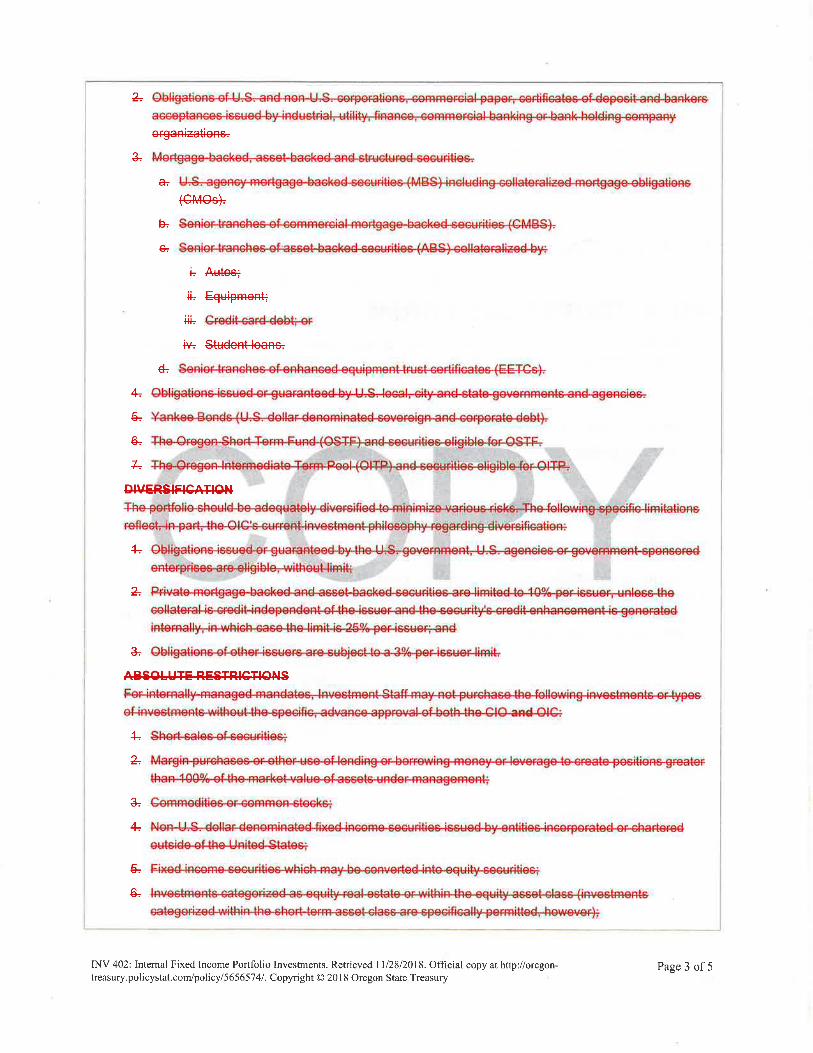

www.princexml.com
Prince - Non-commercial License
This document was created with Prince, a great way of getting web content onto paper.

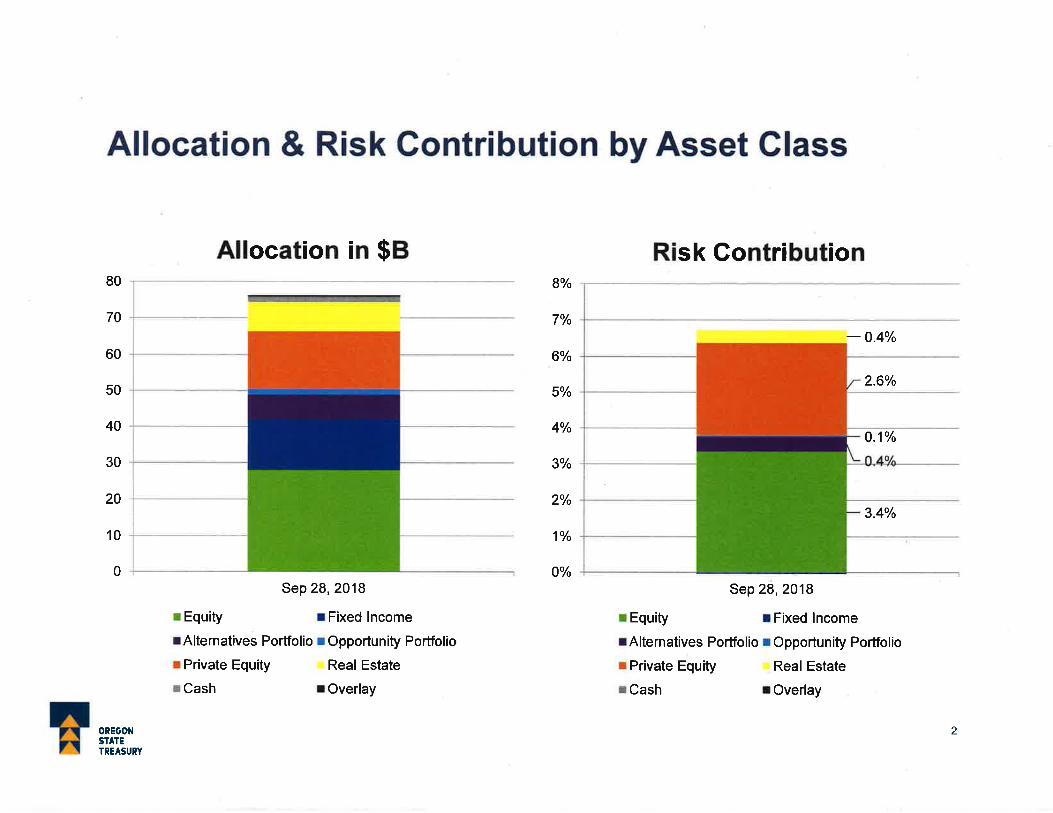
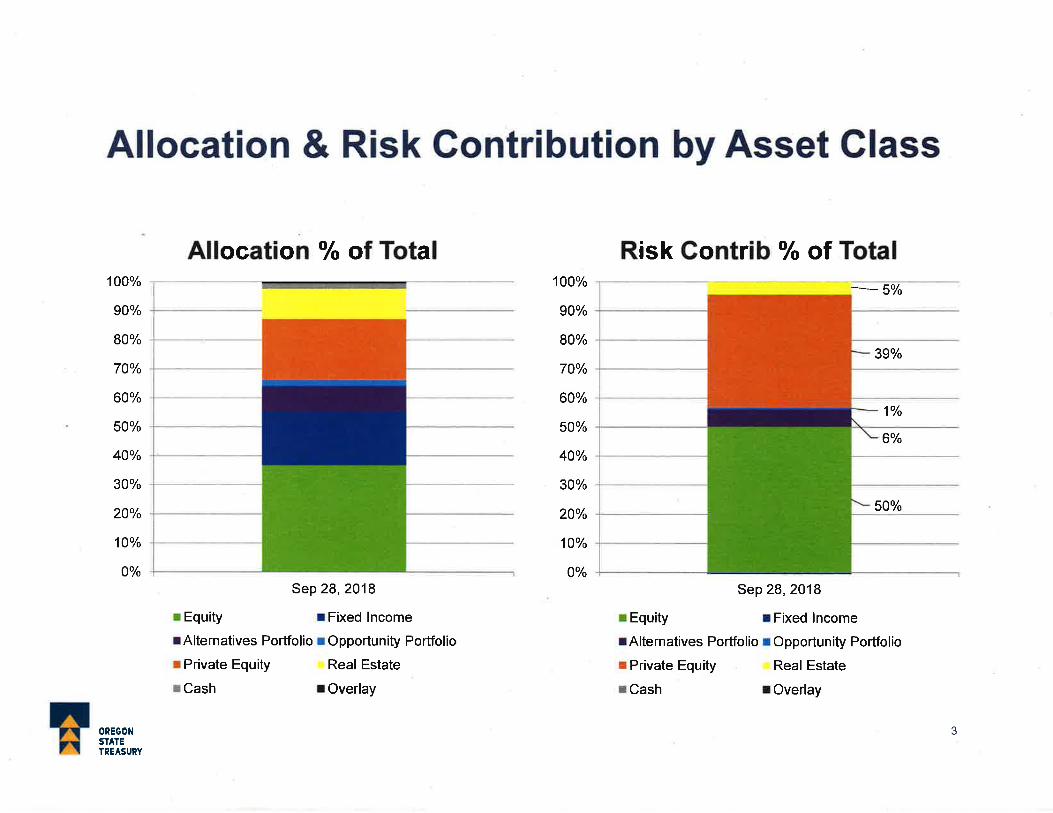
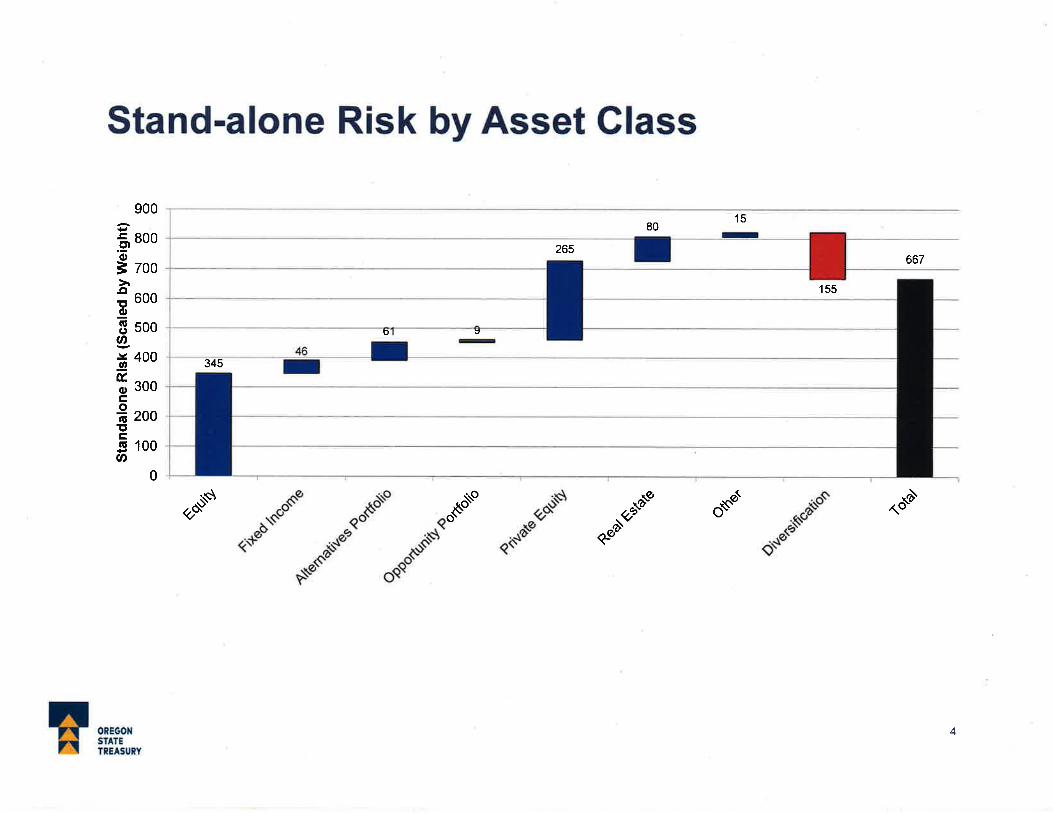
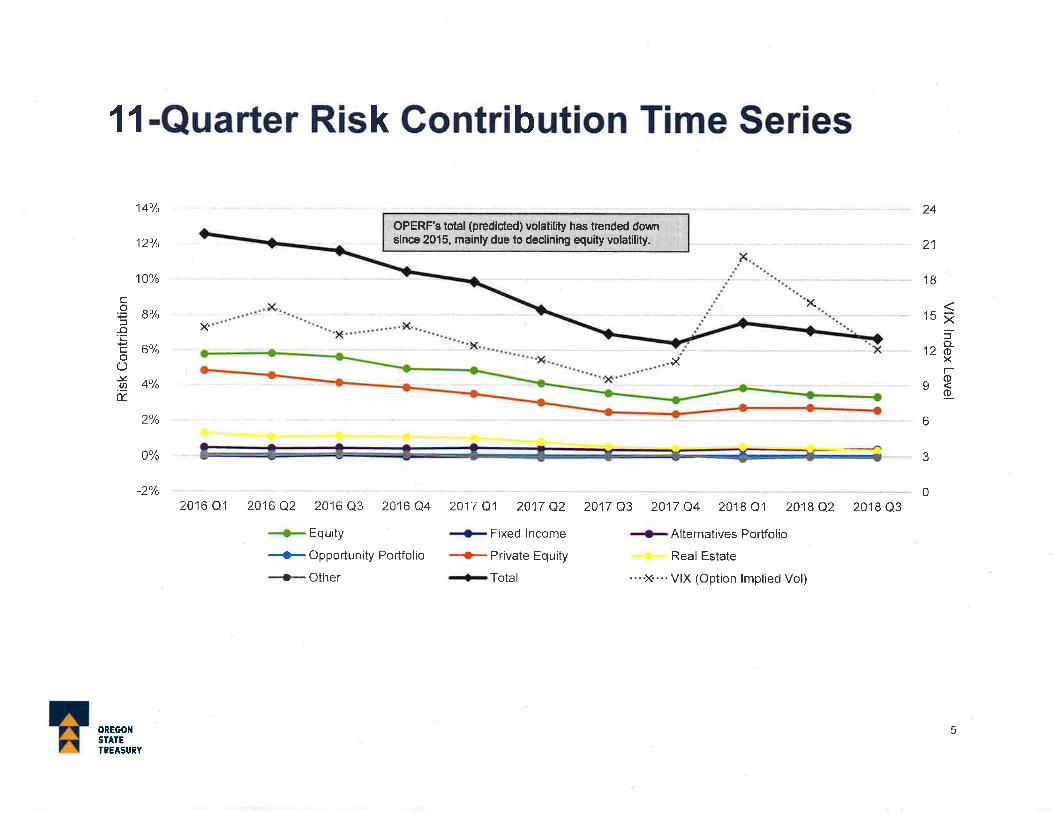
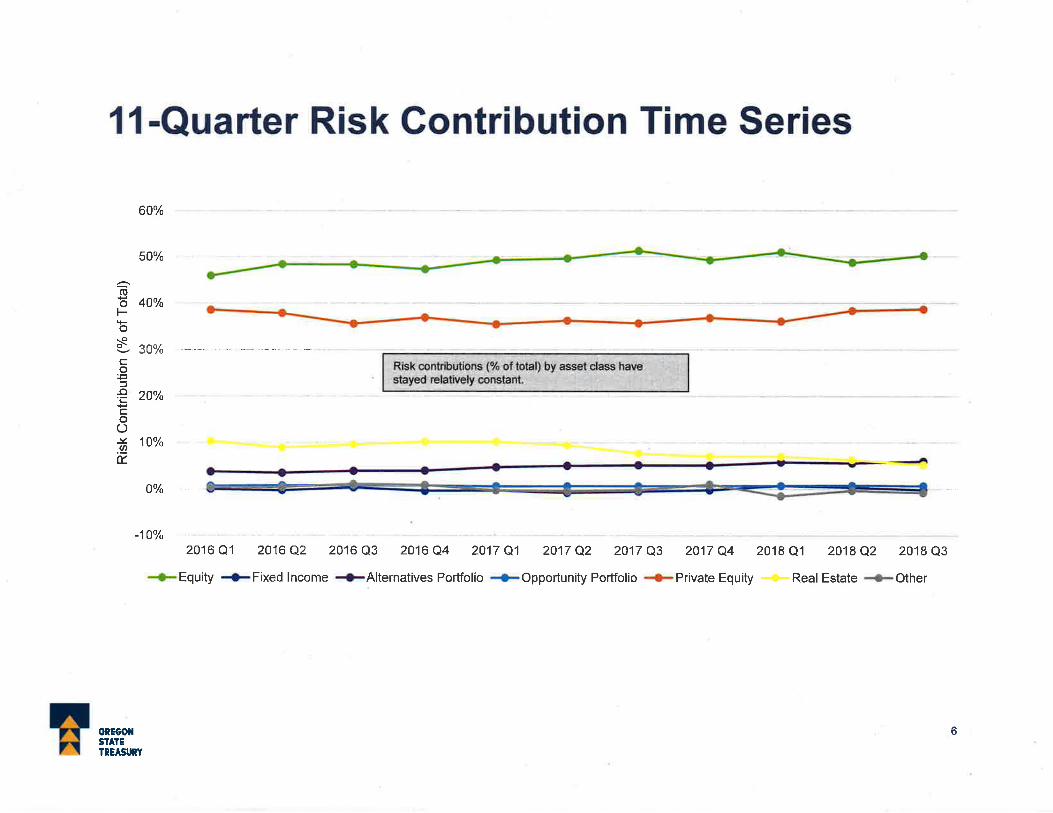
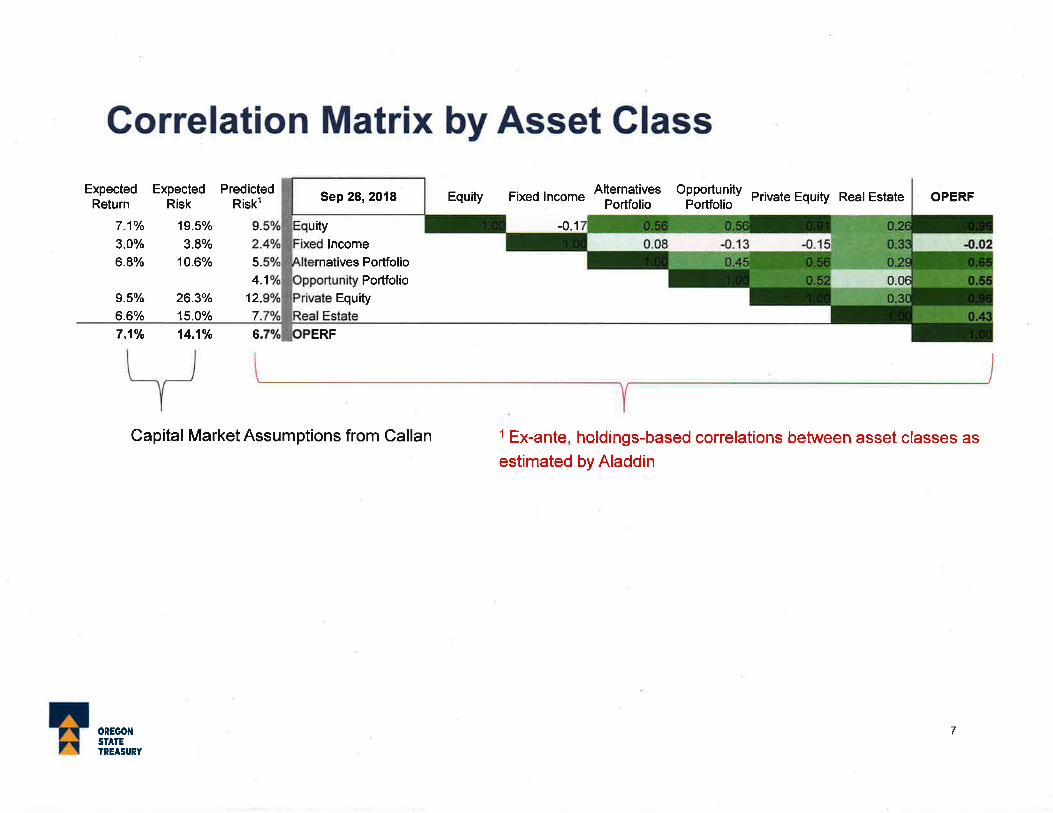
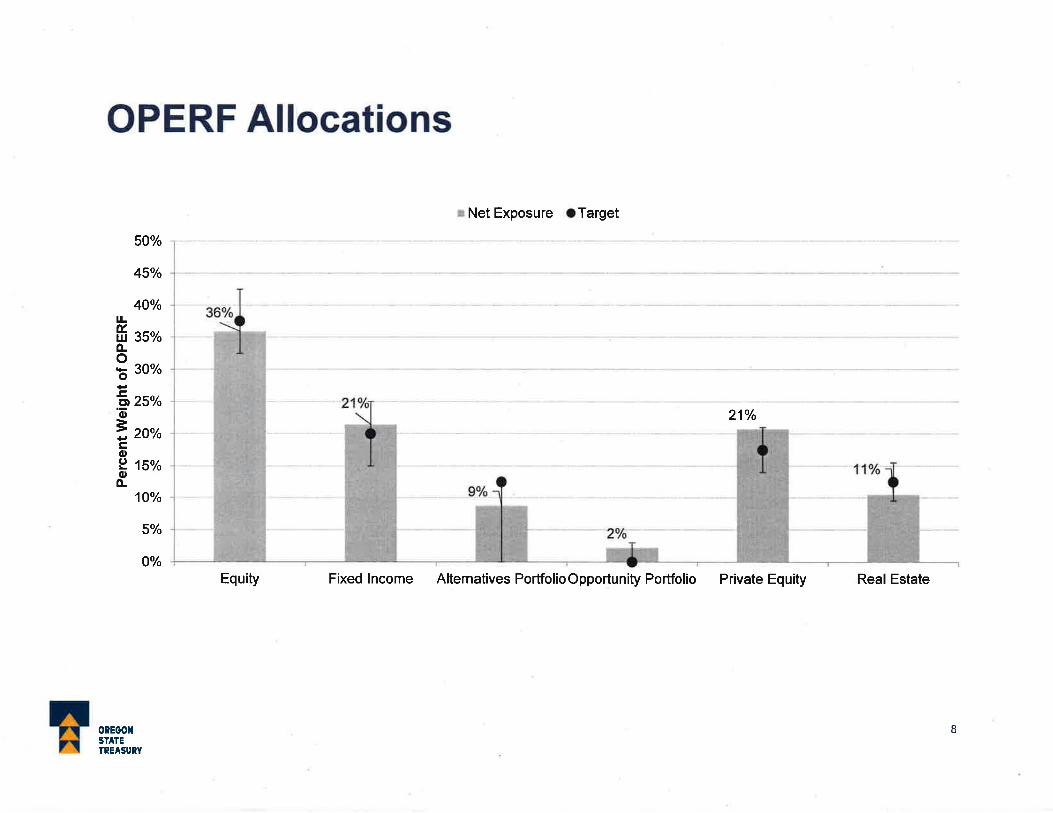
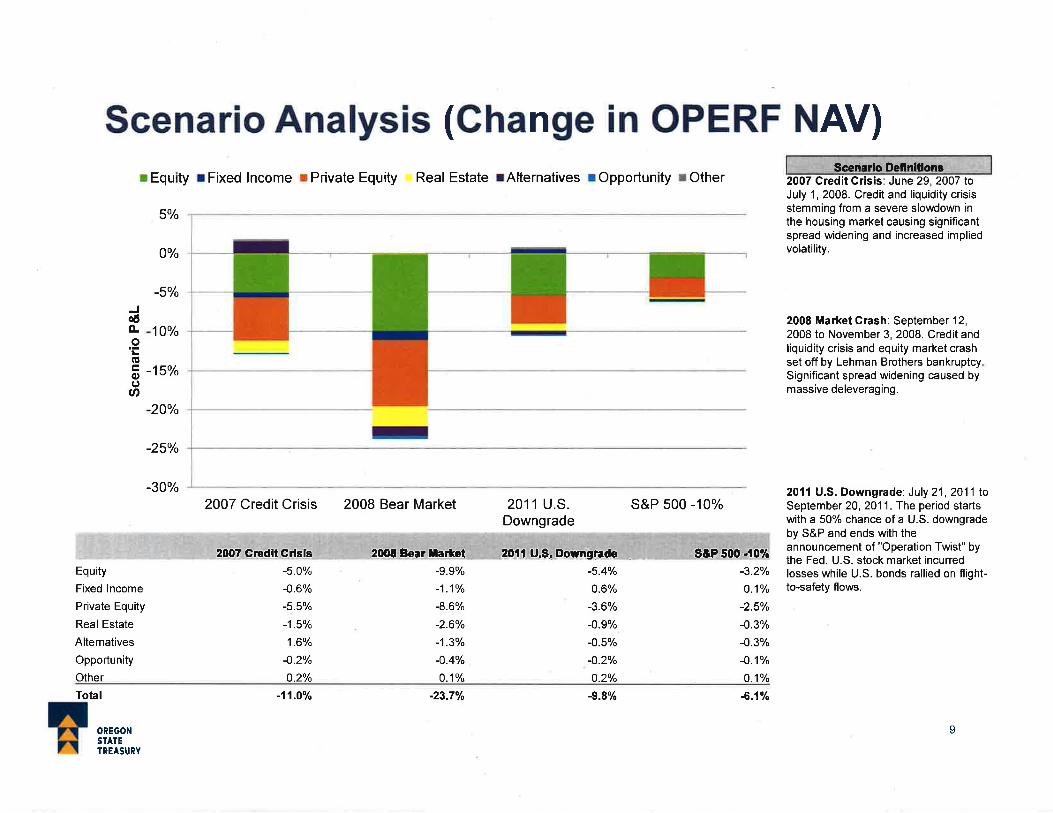
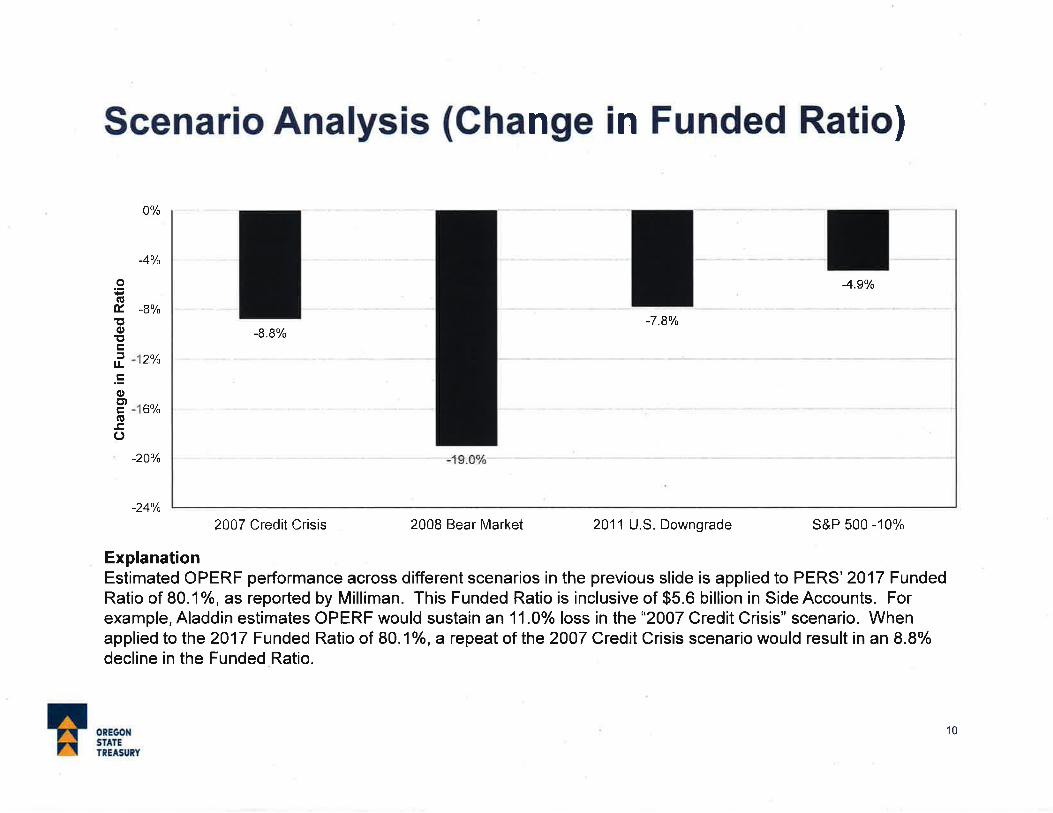
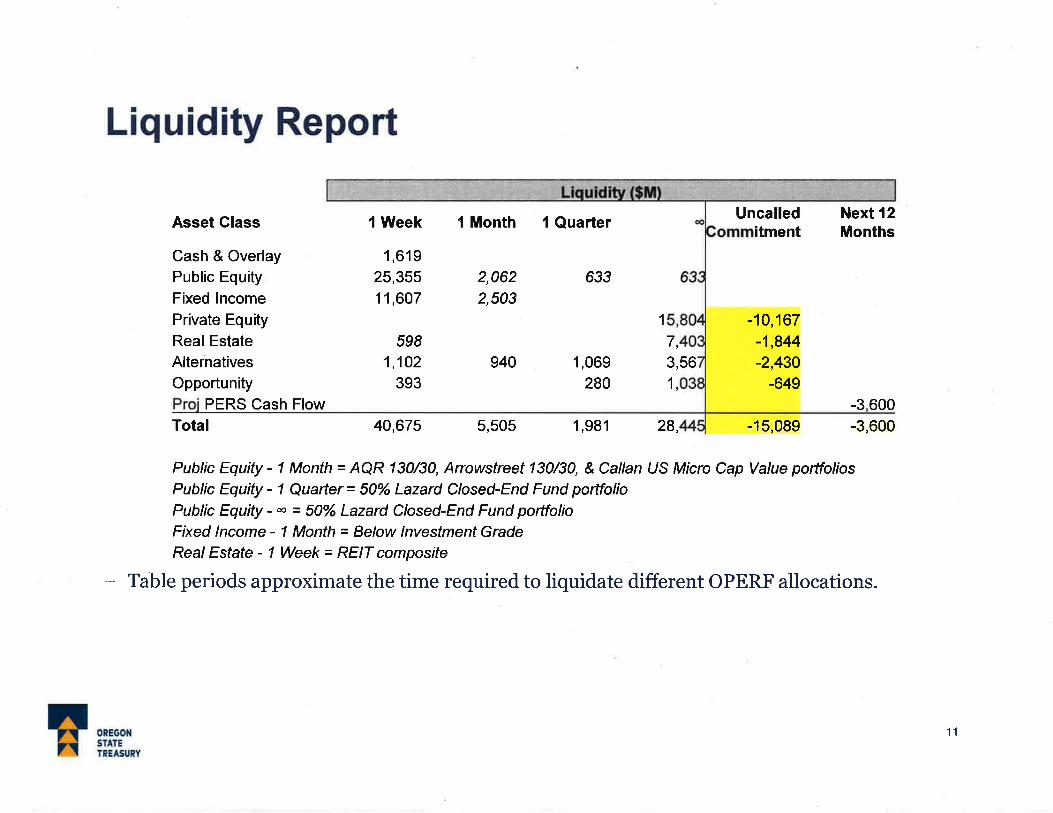
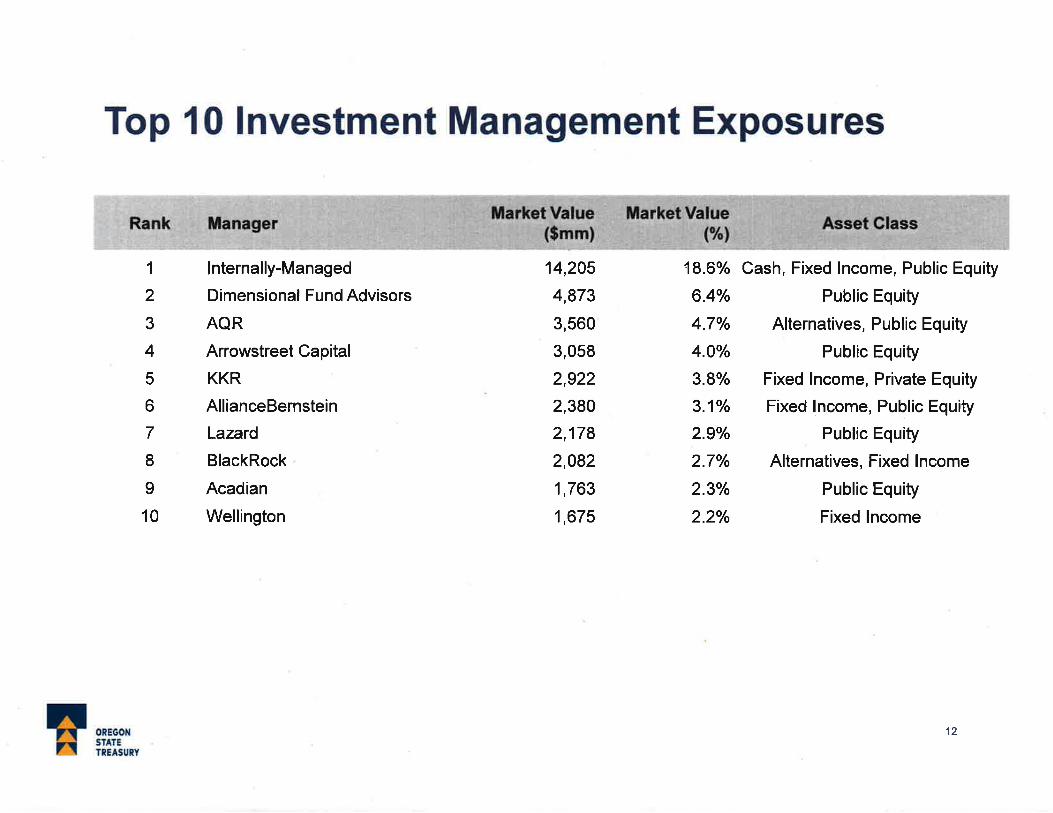

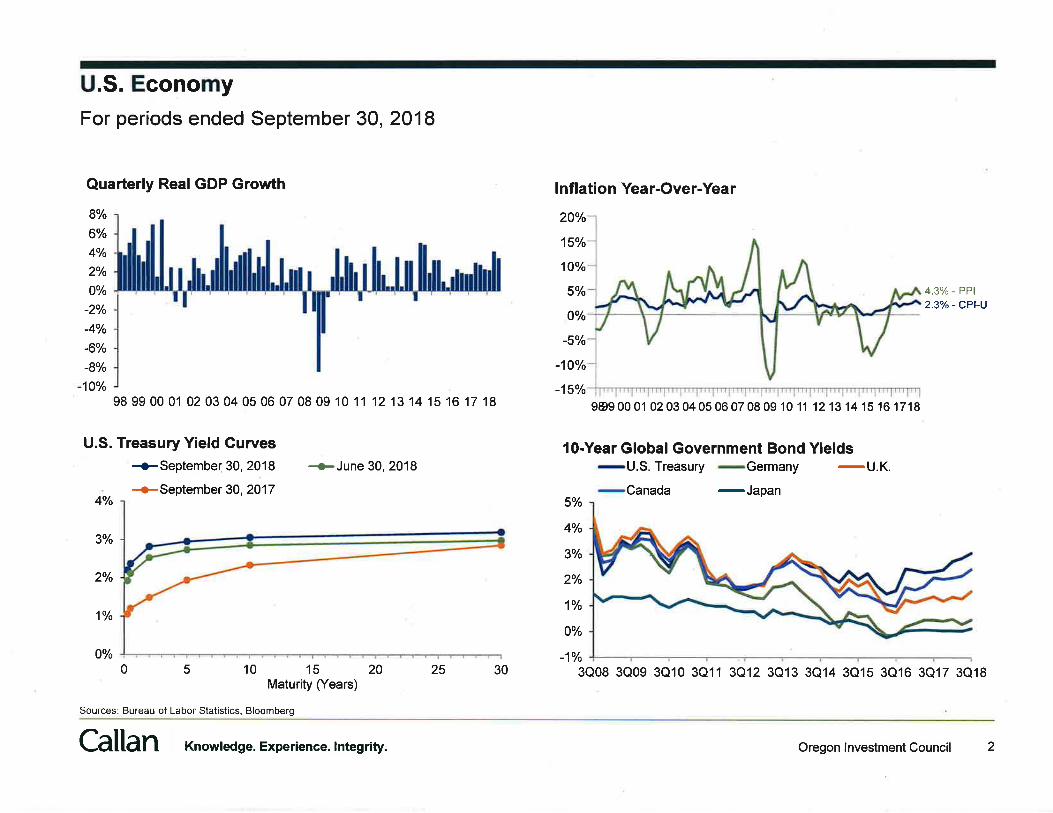
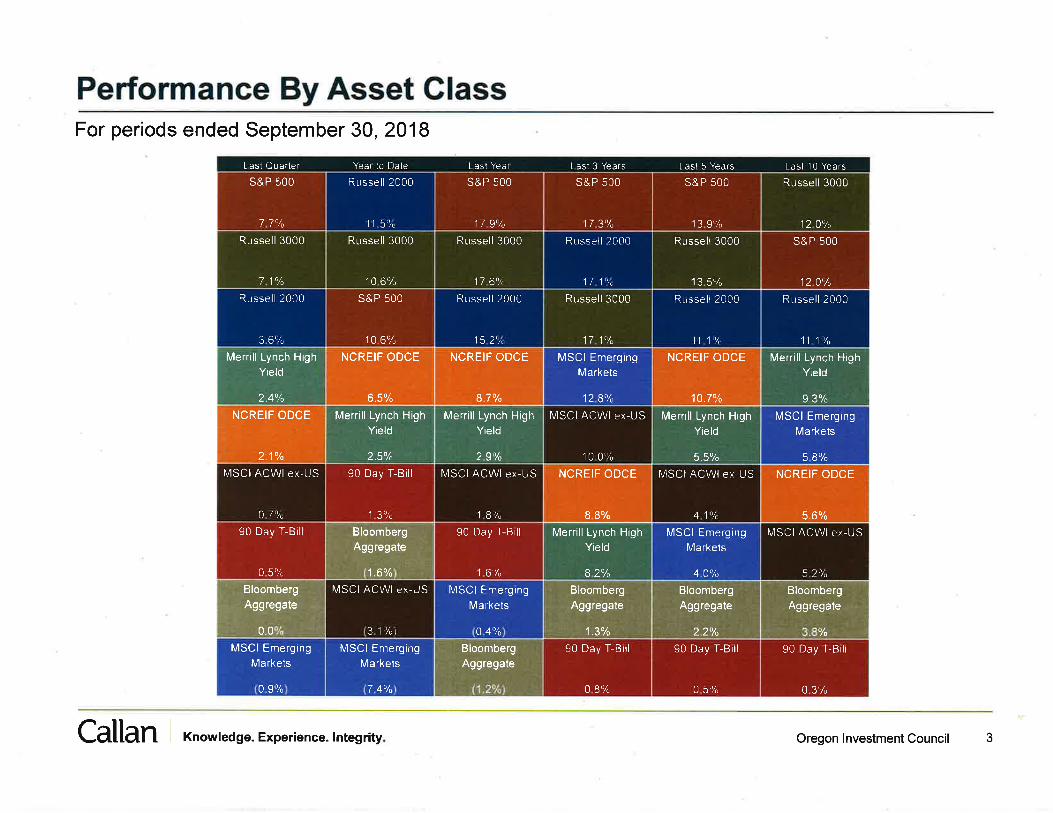
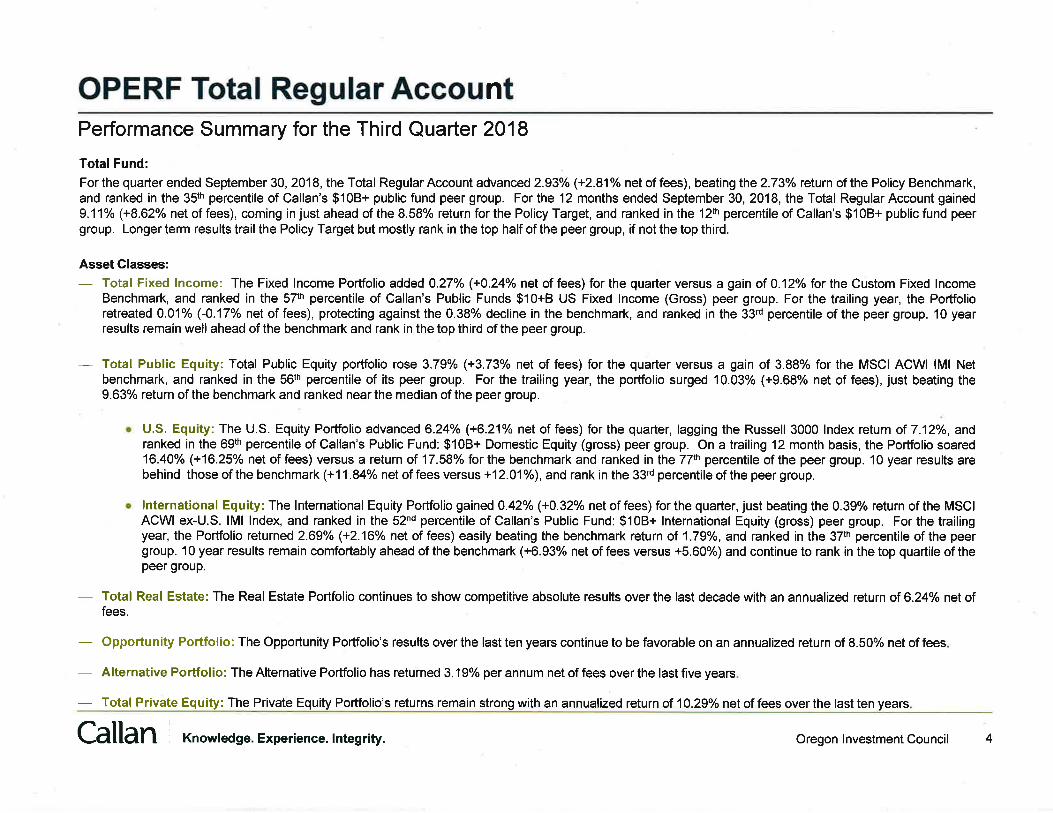
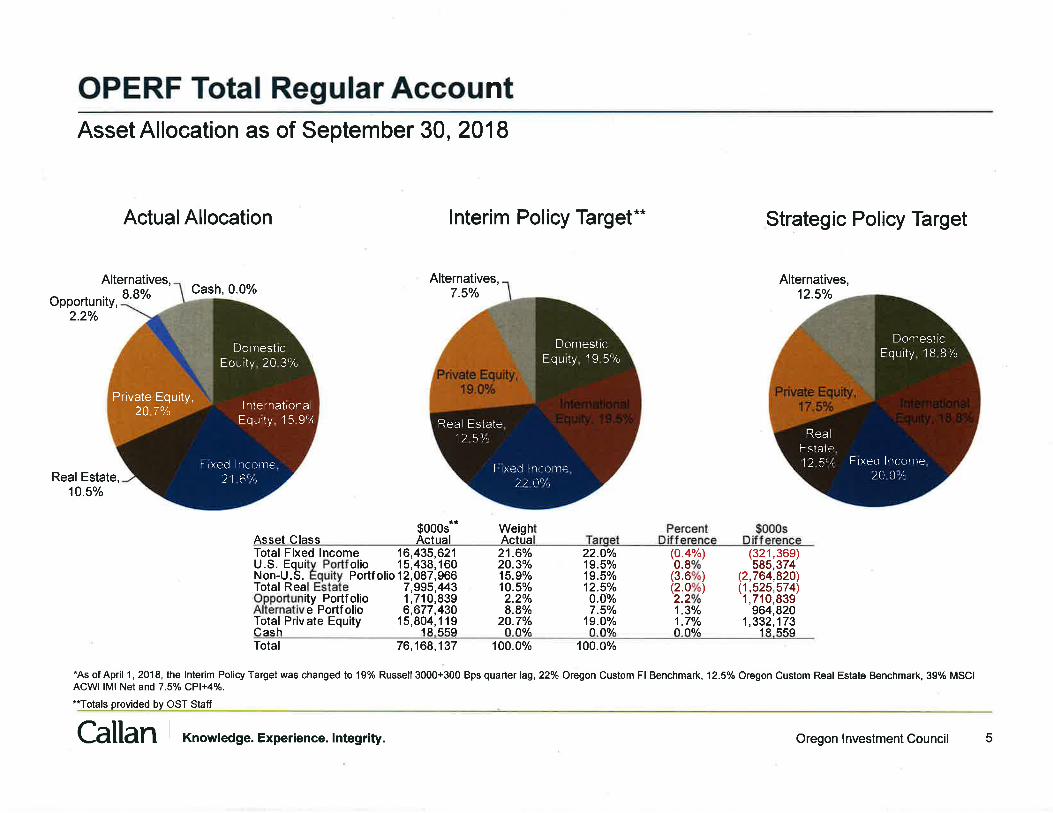
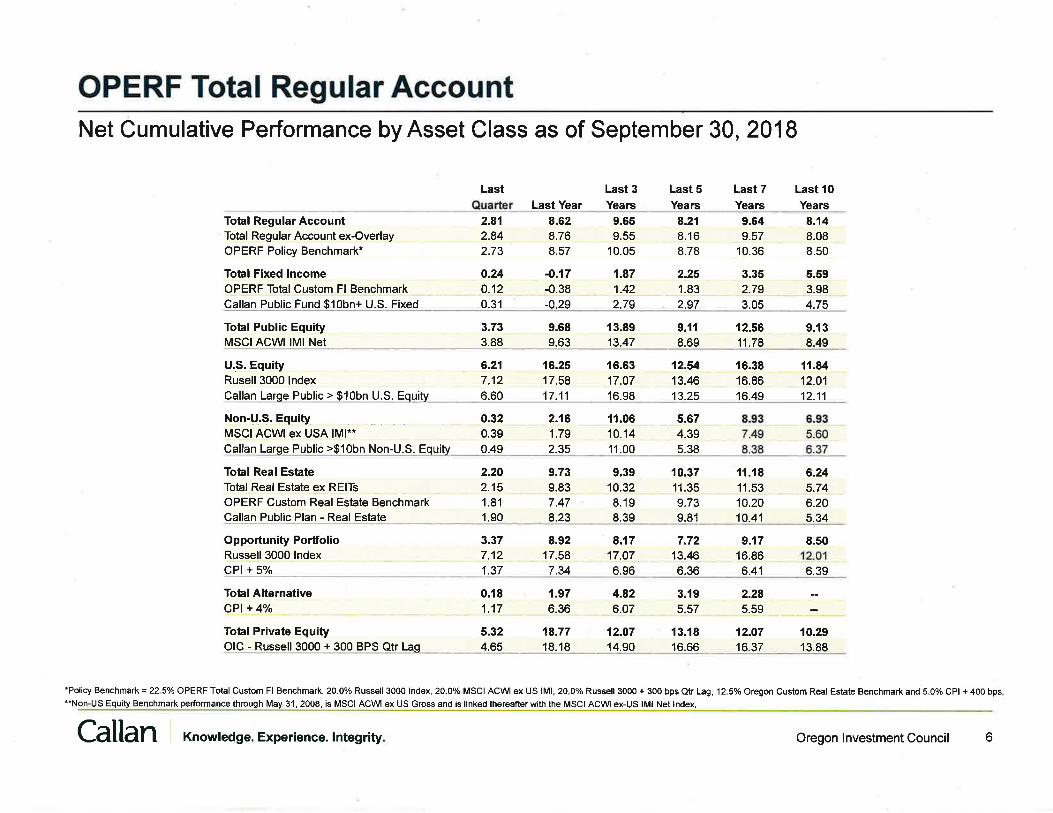
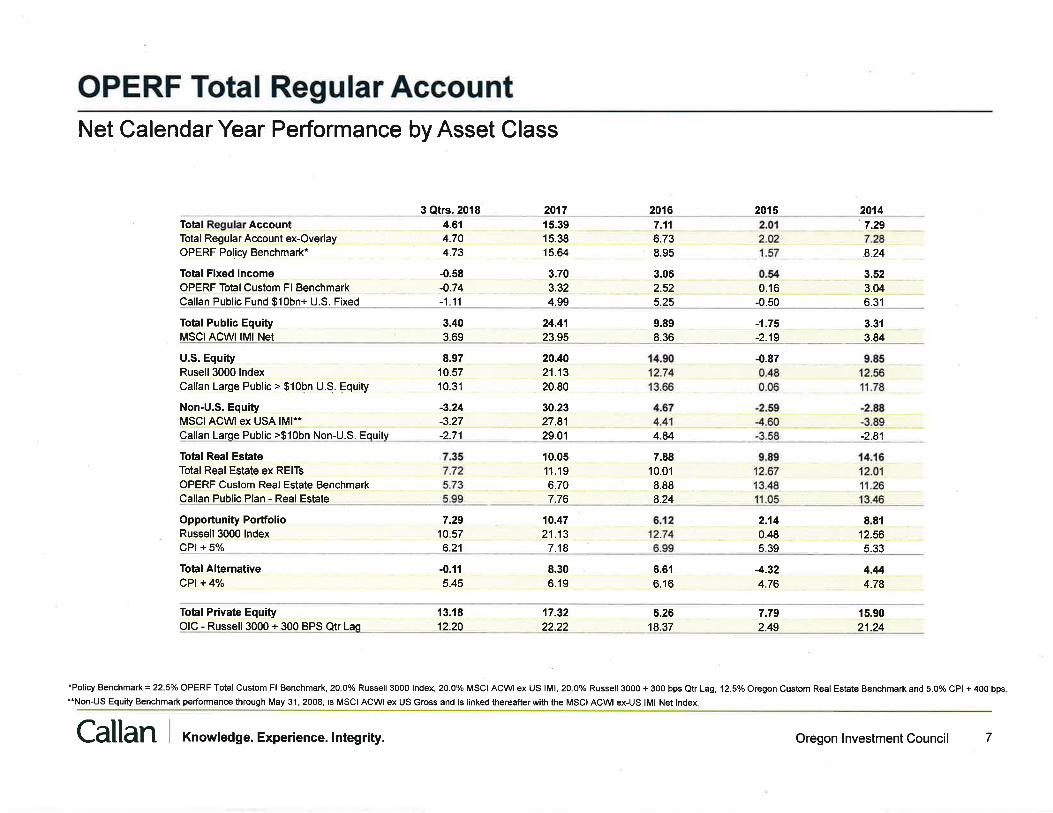
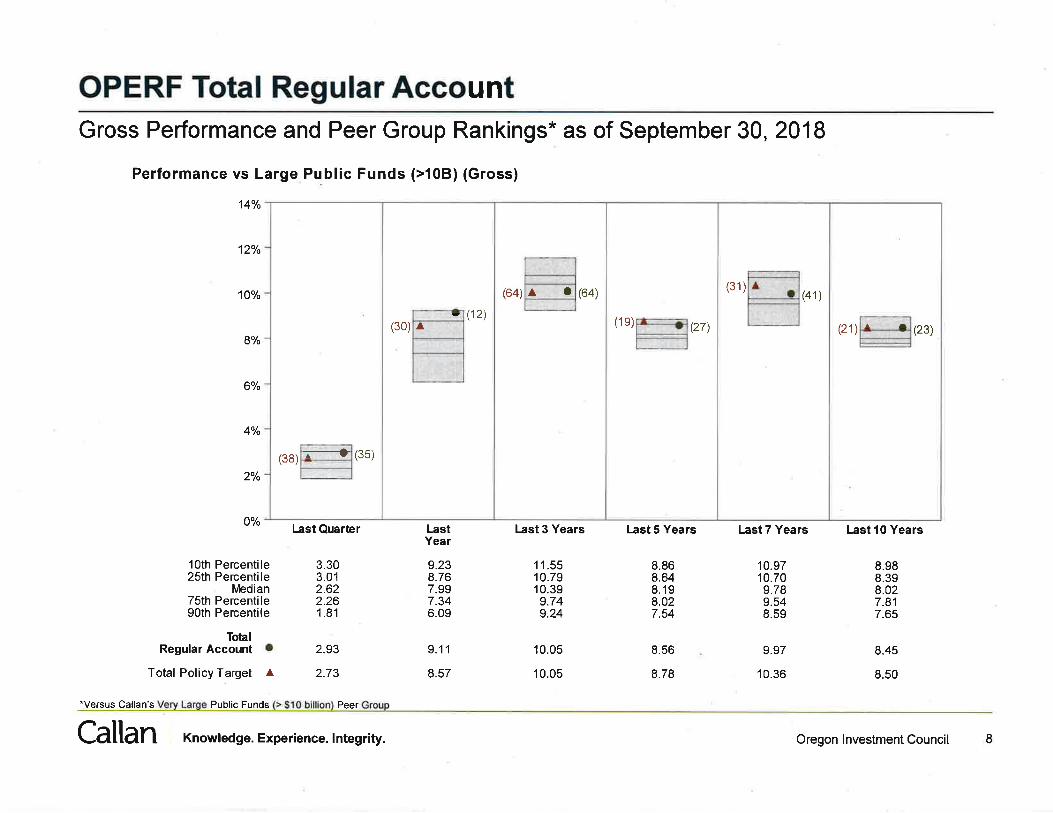
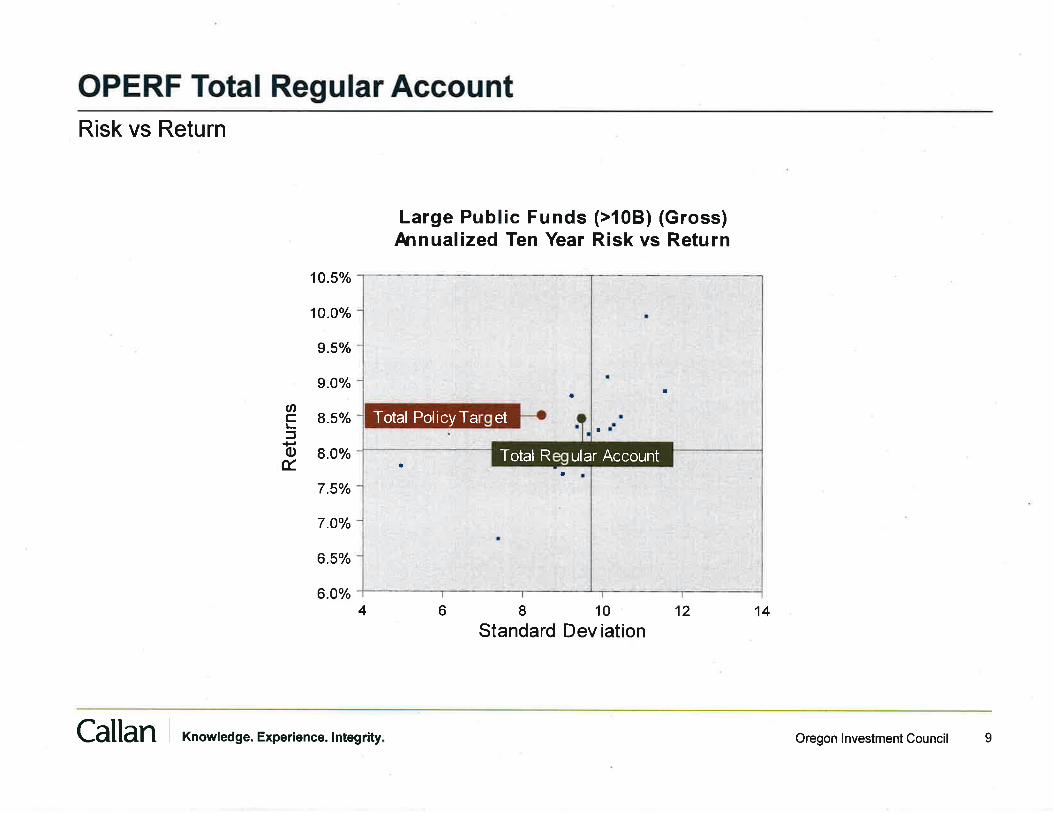
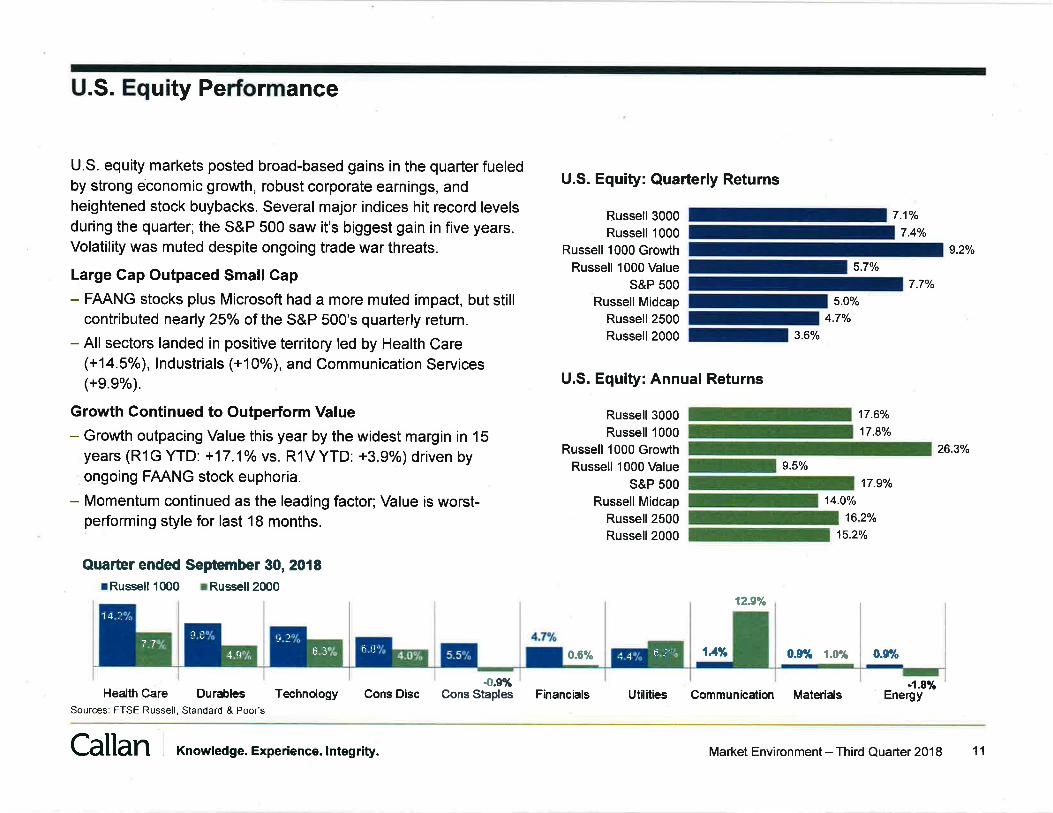
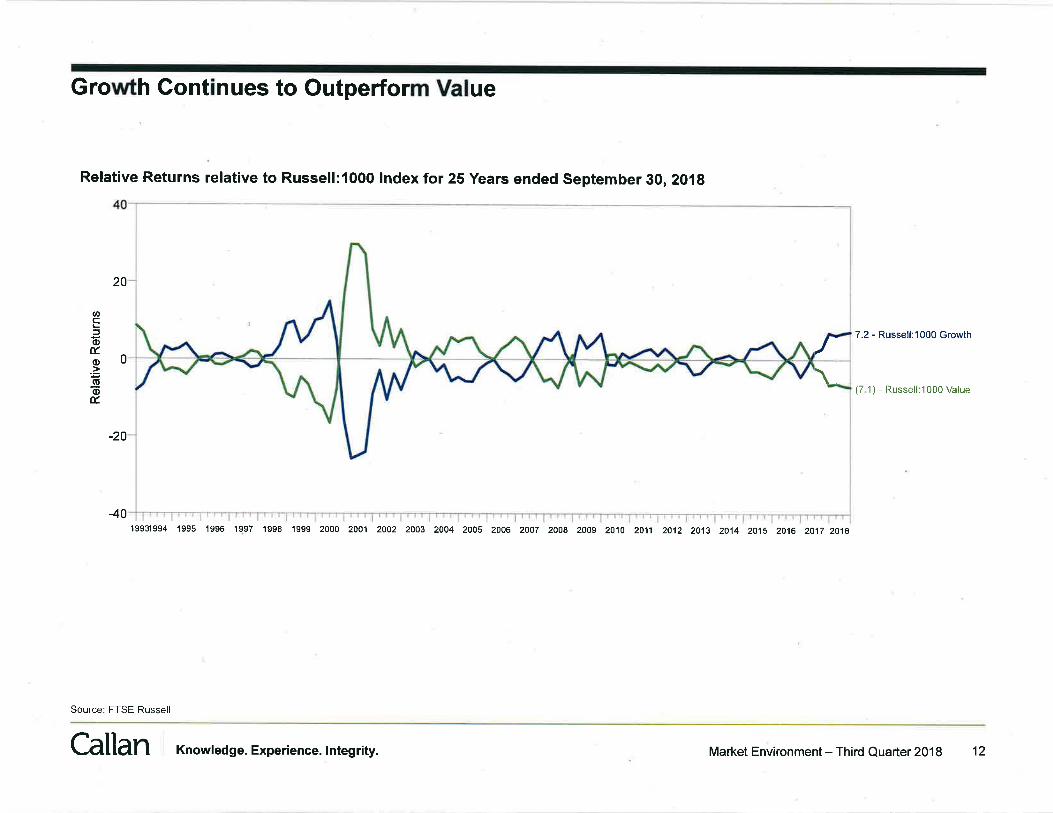
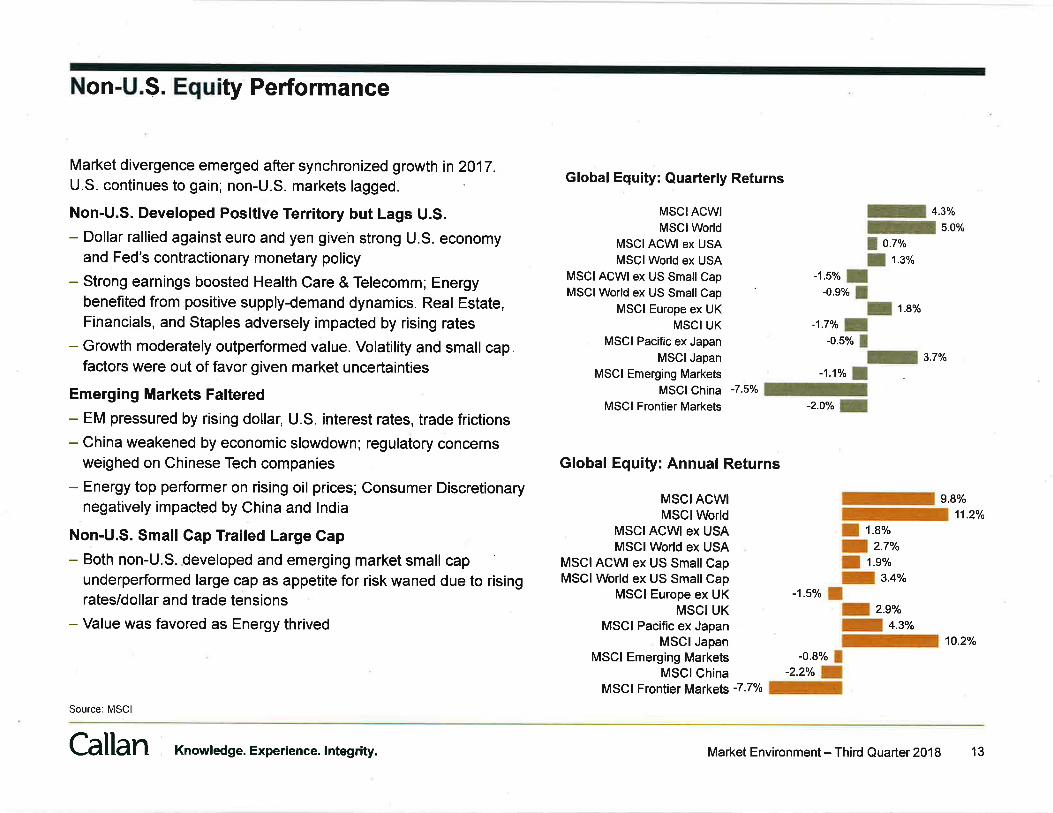
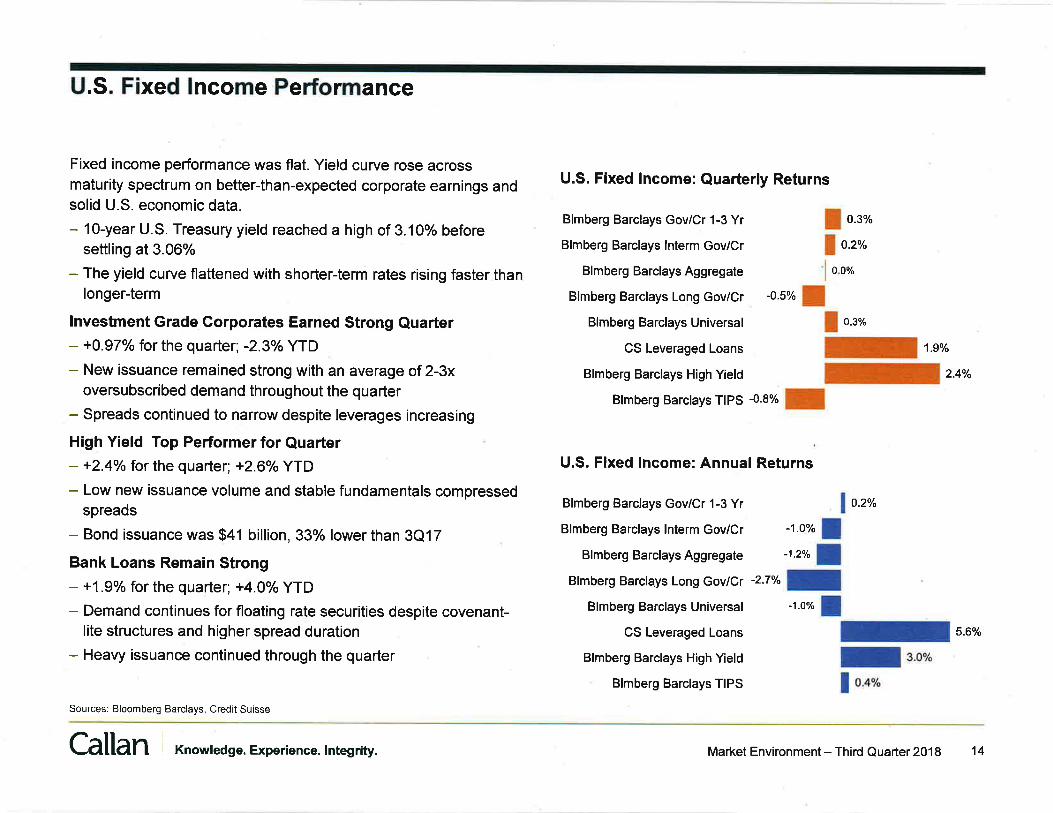
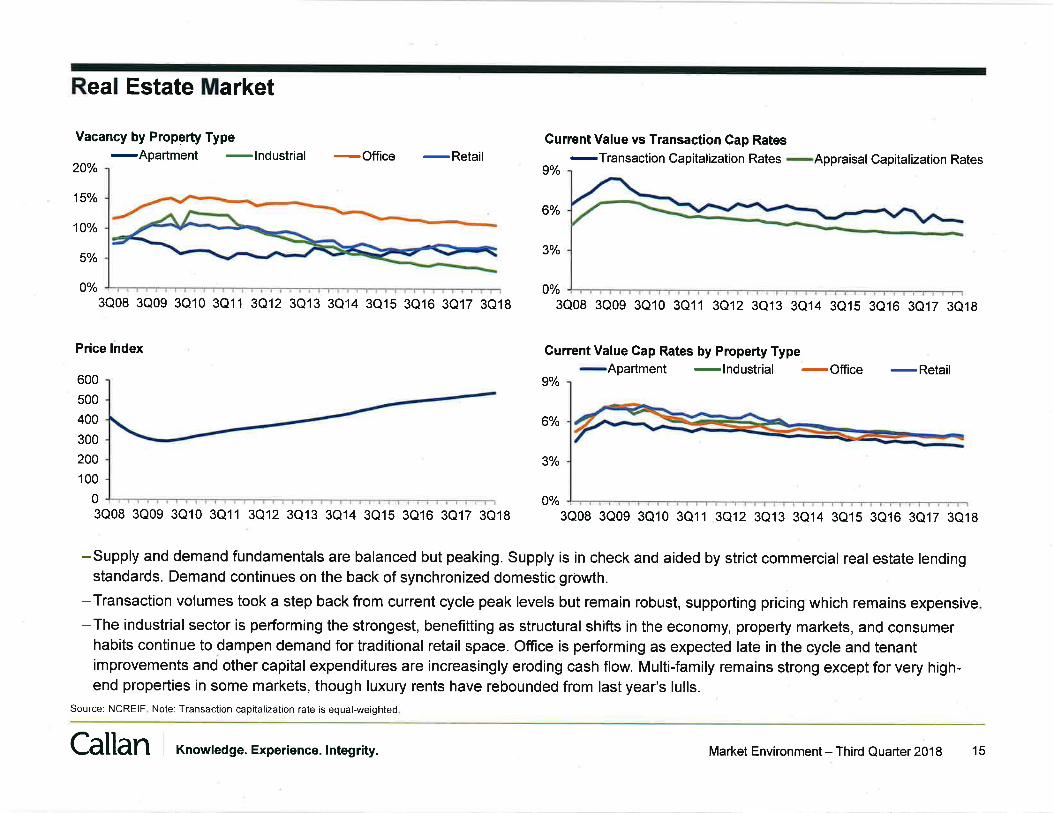
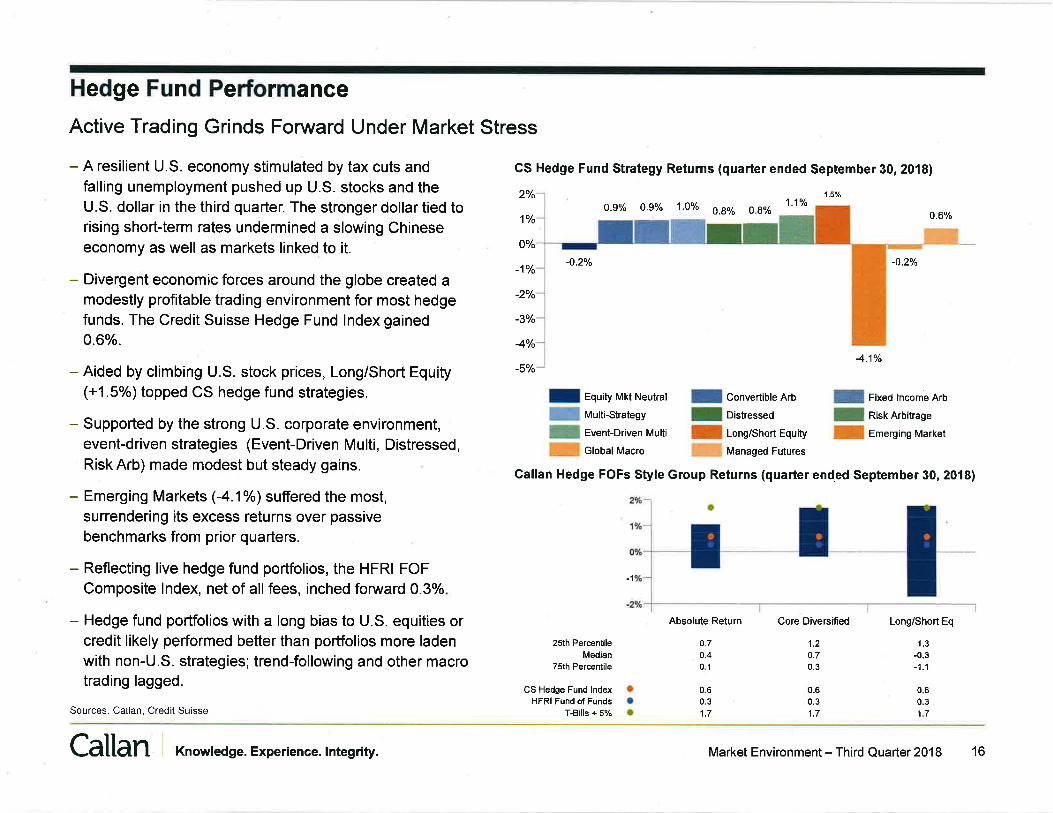
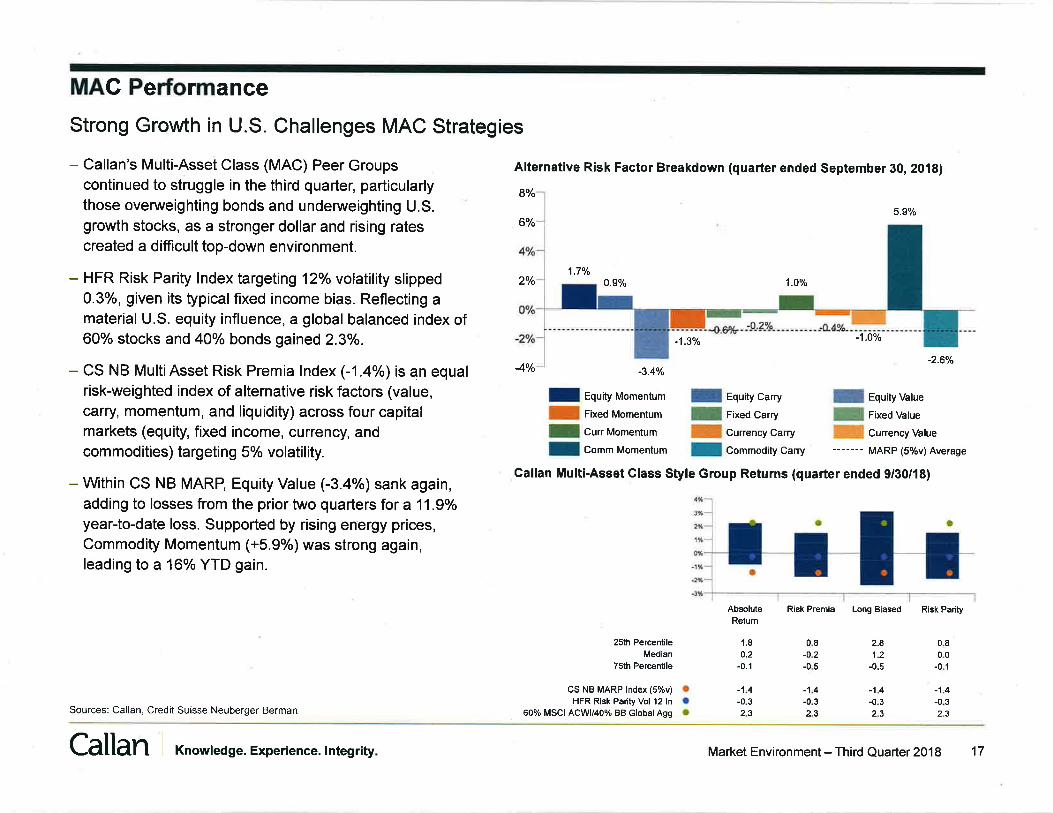
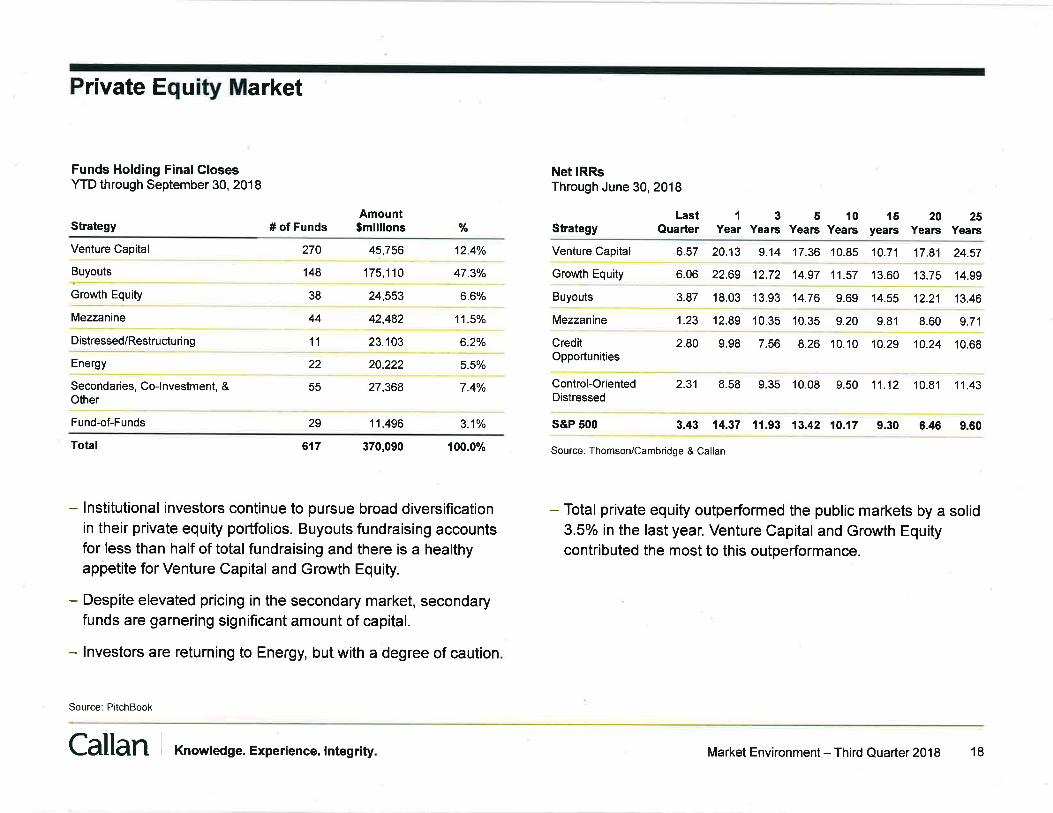

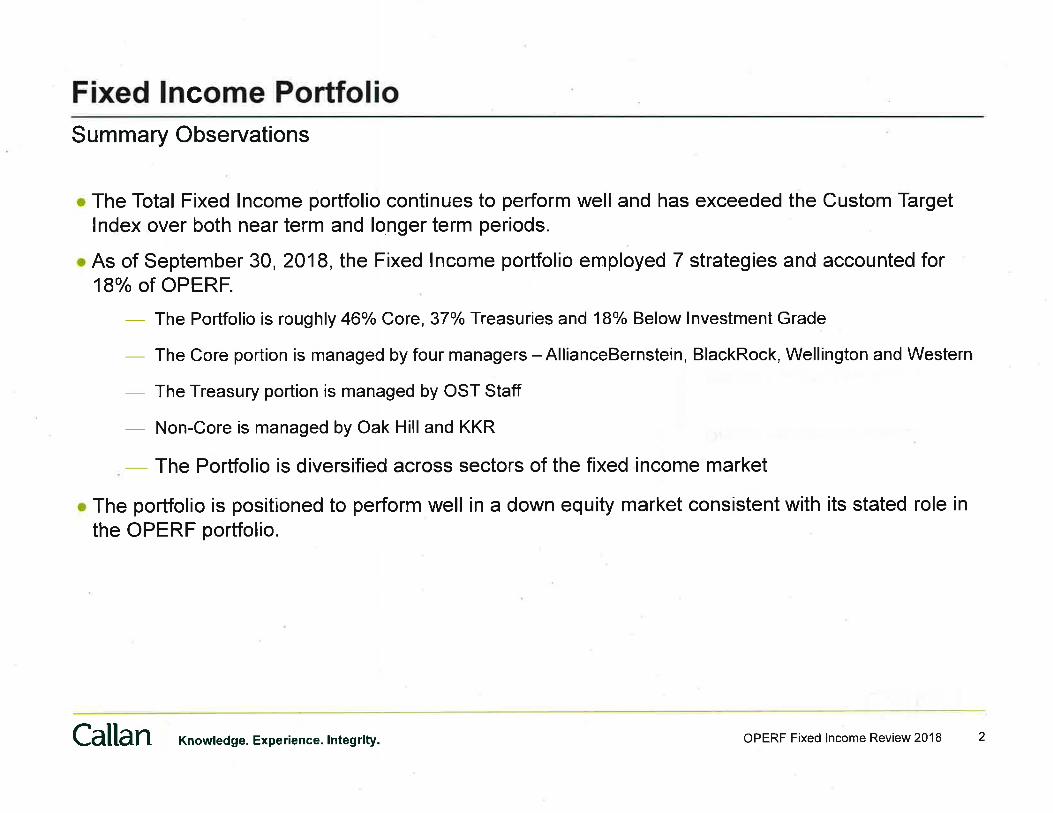
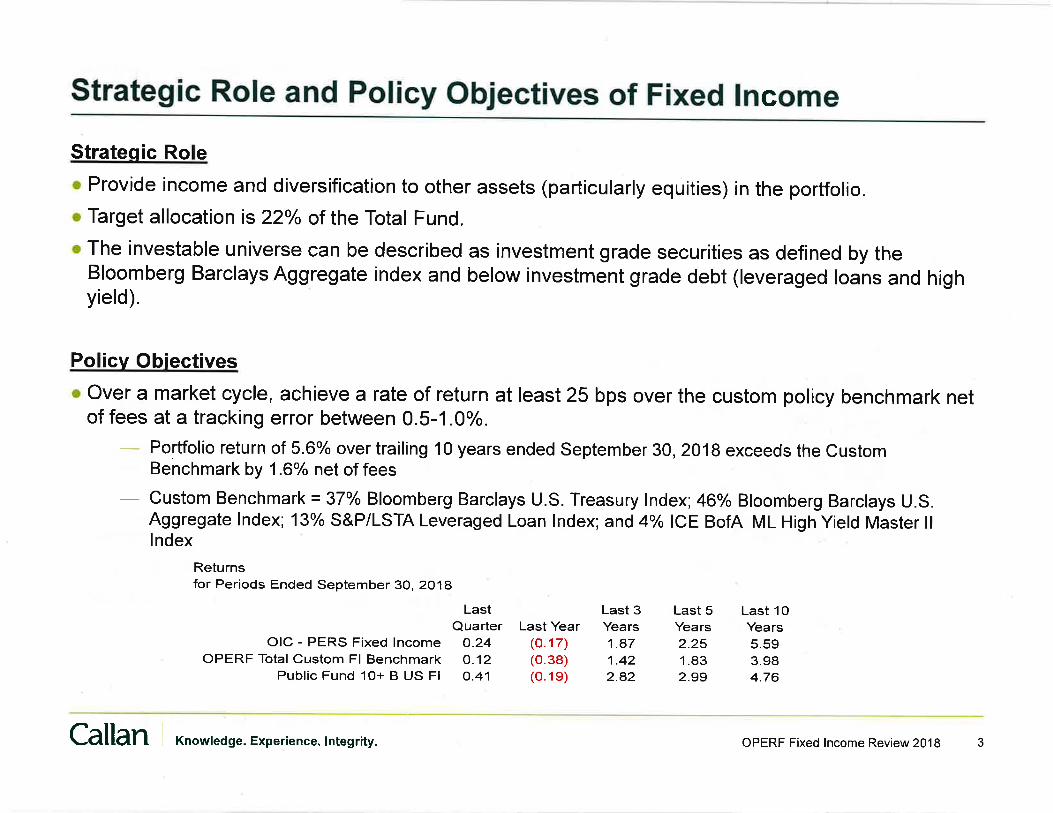
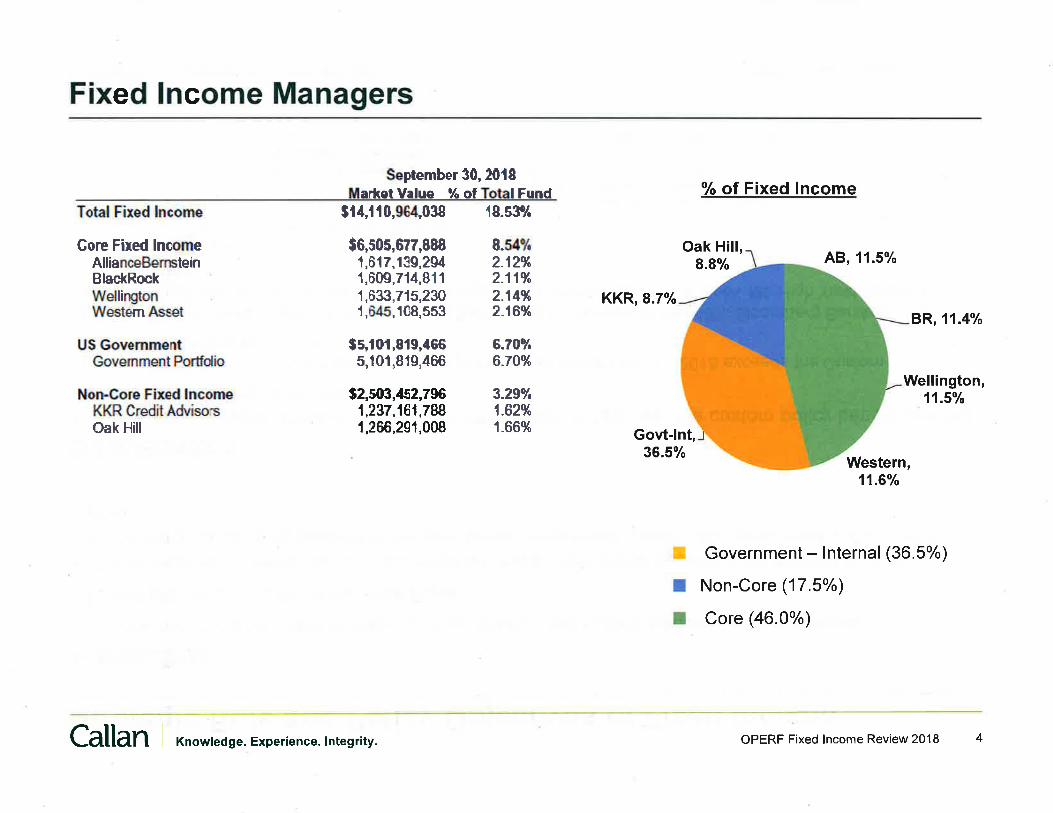
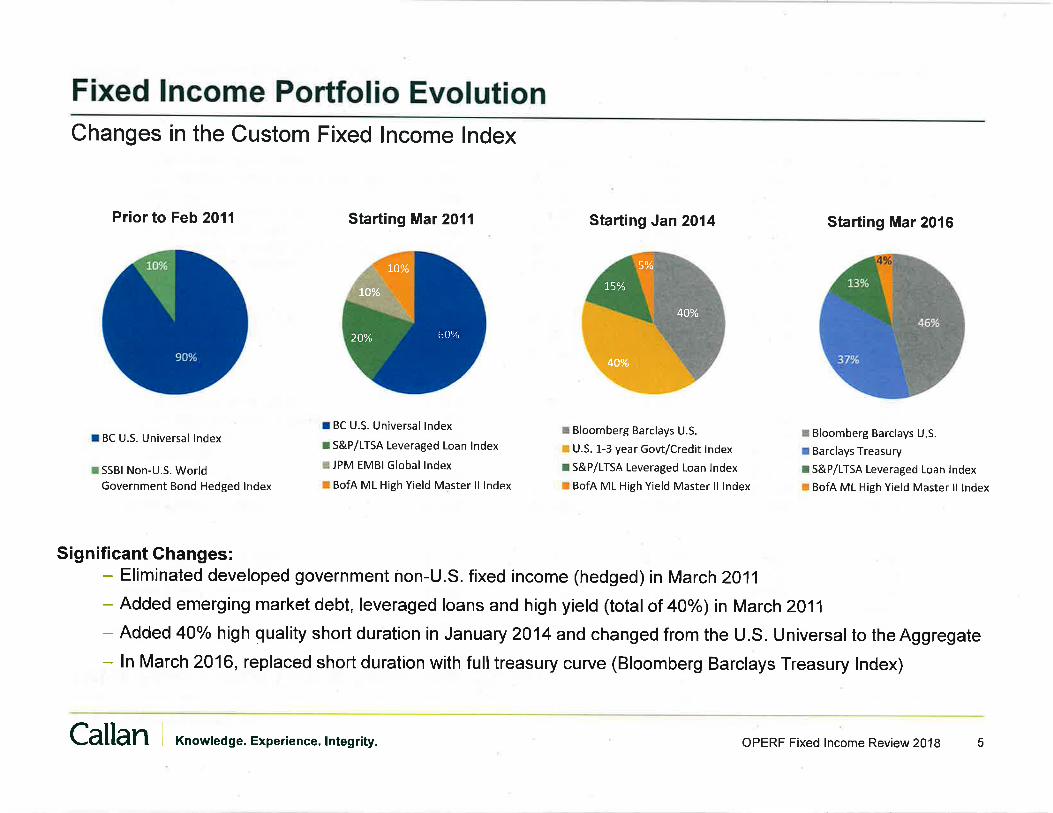
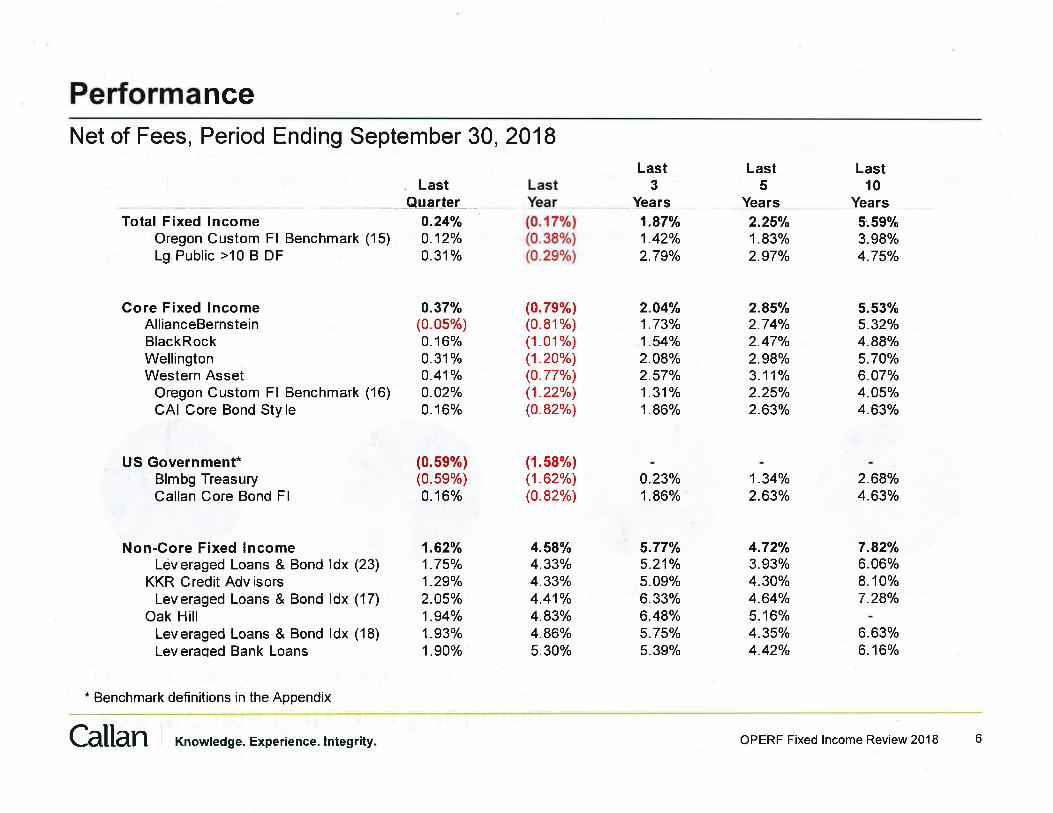
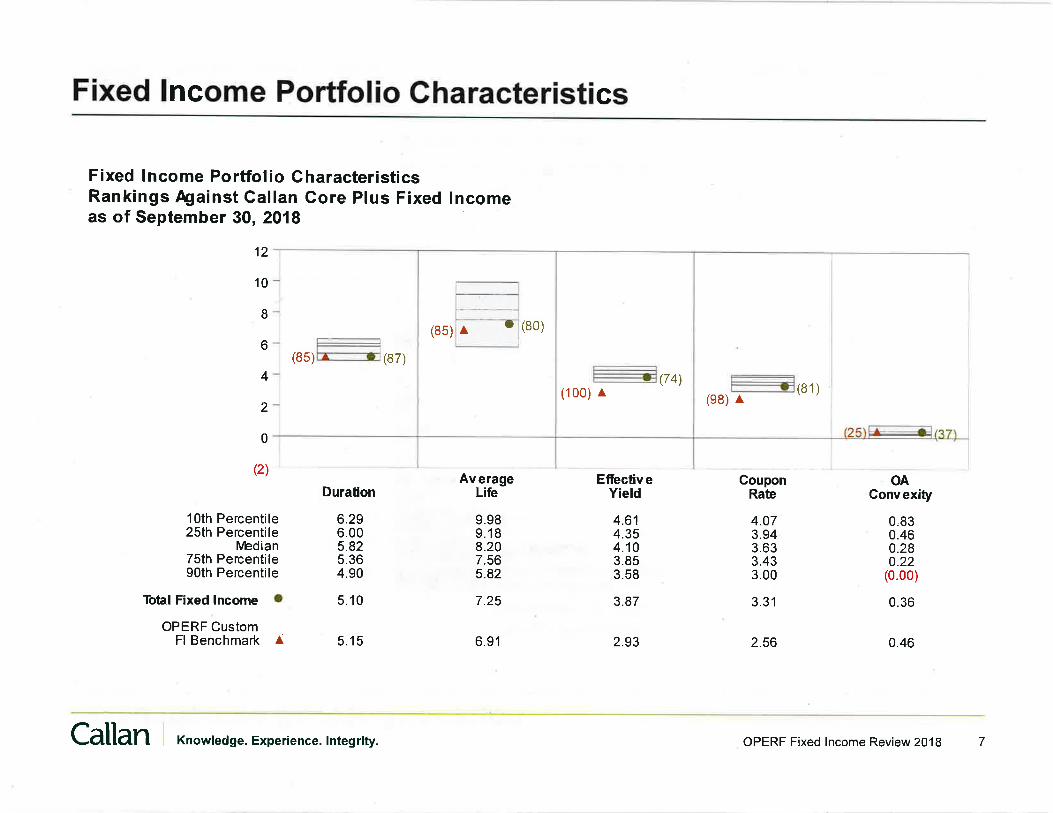
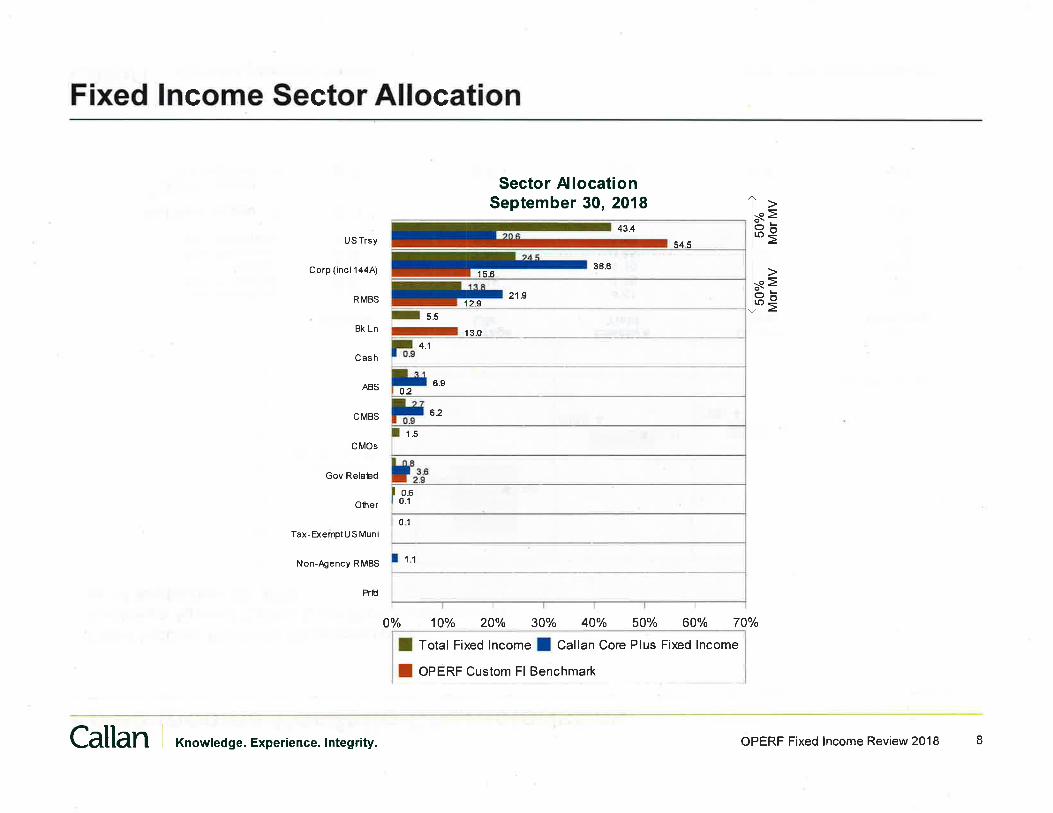
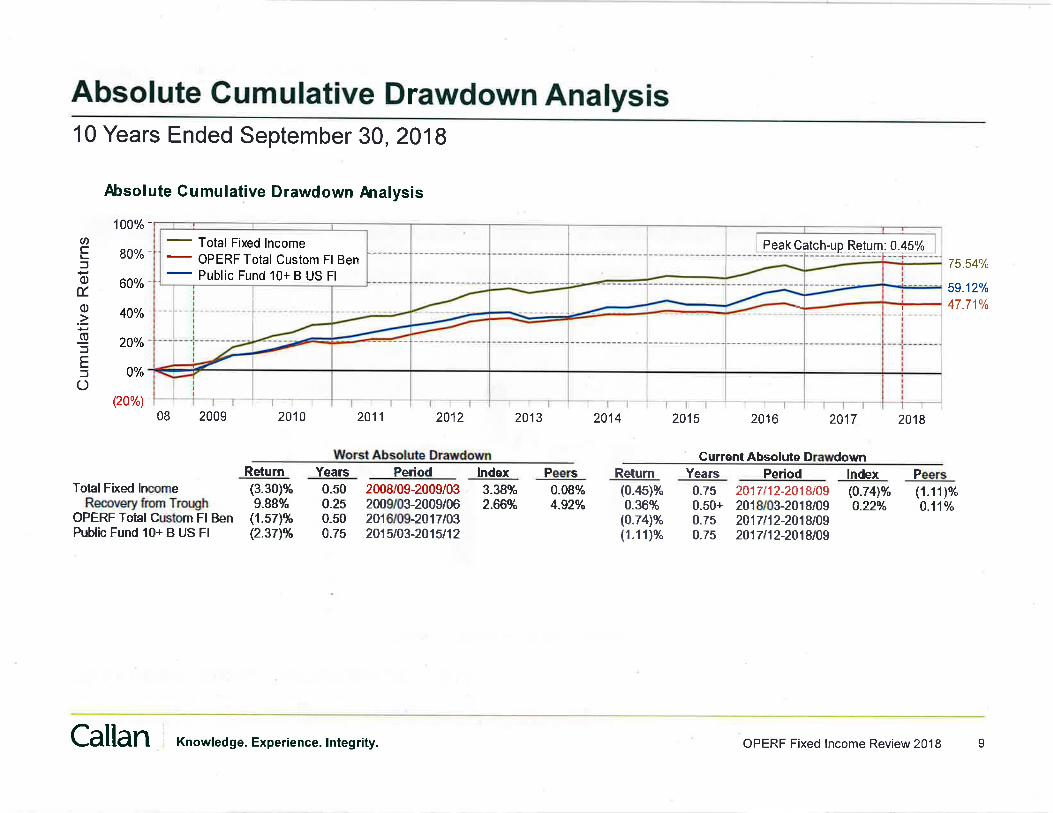
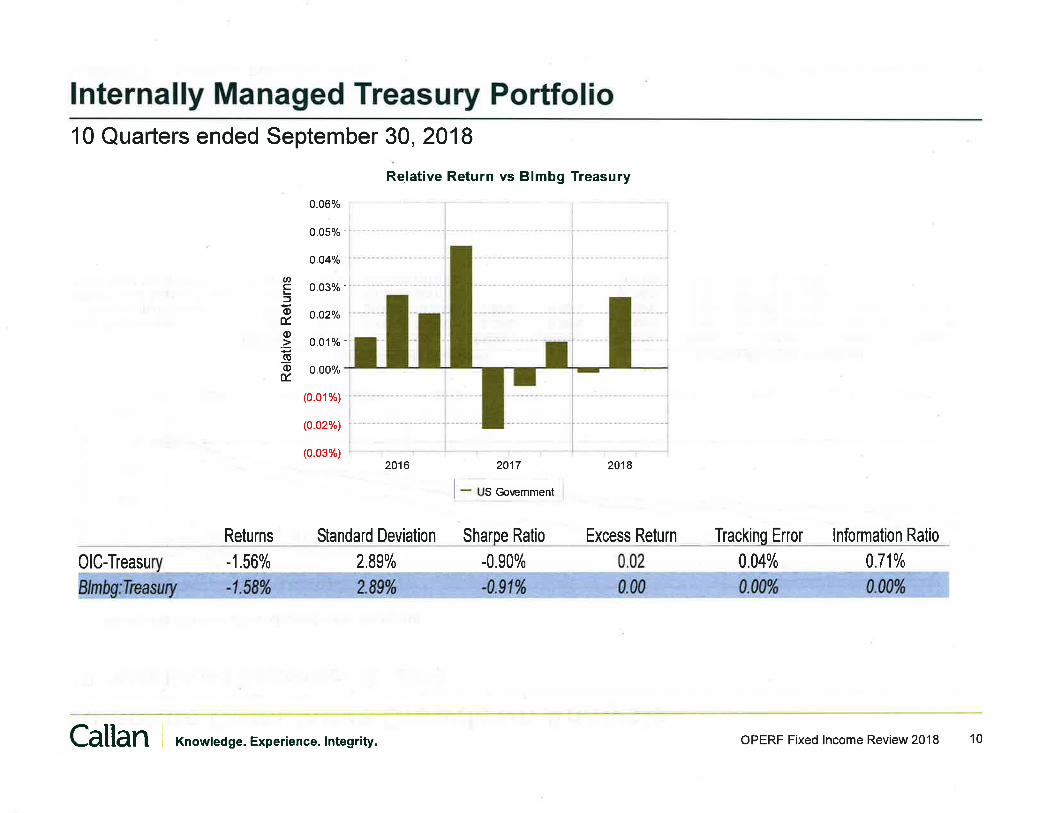
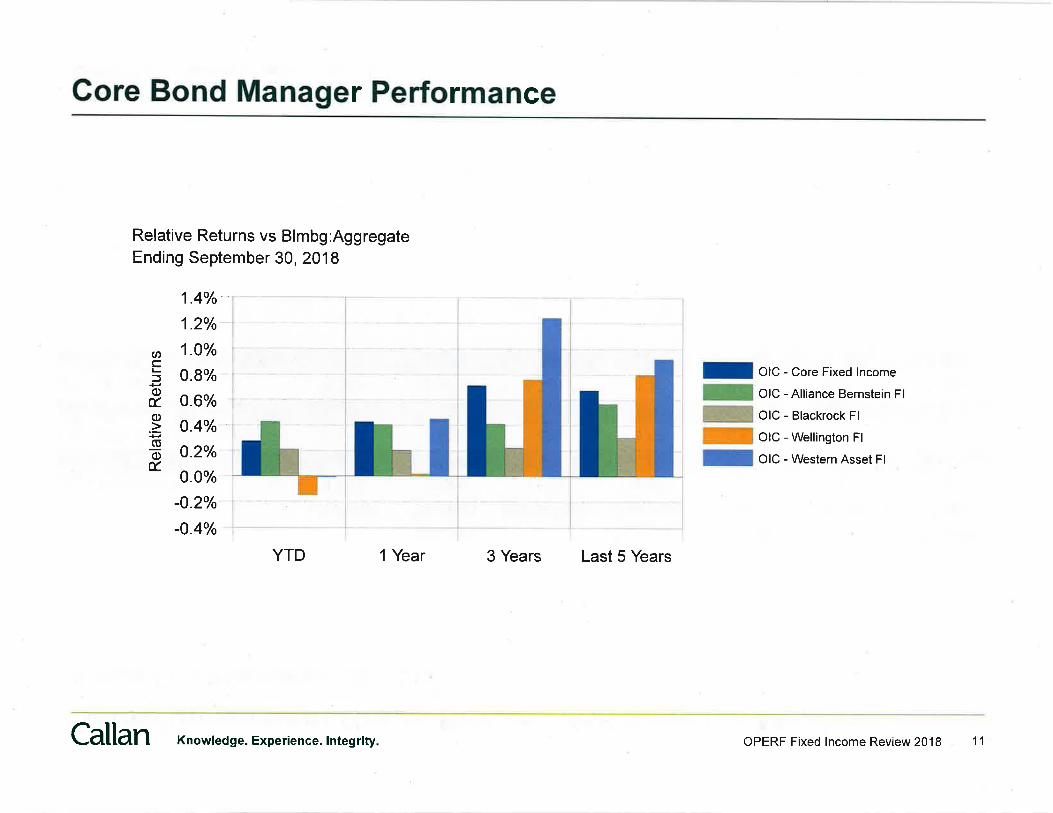

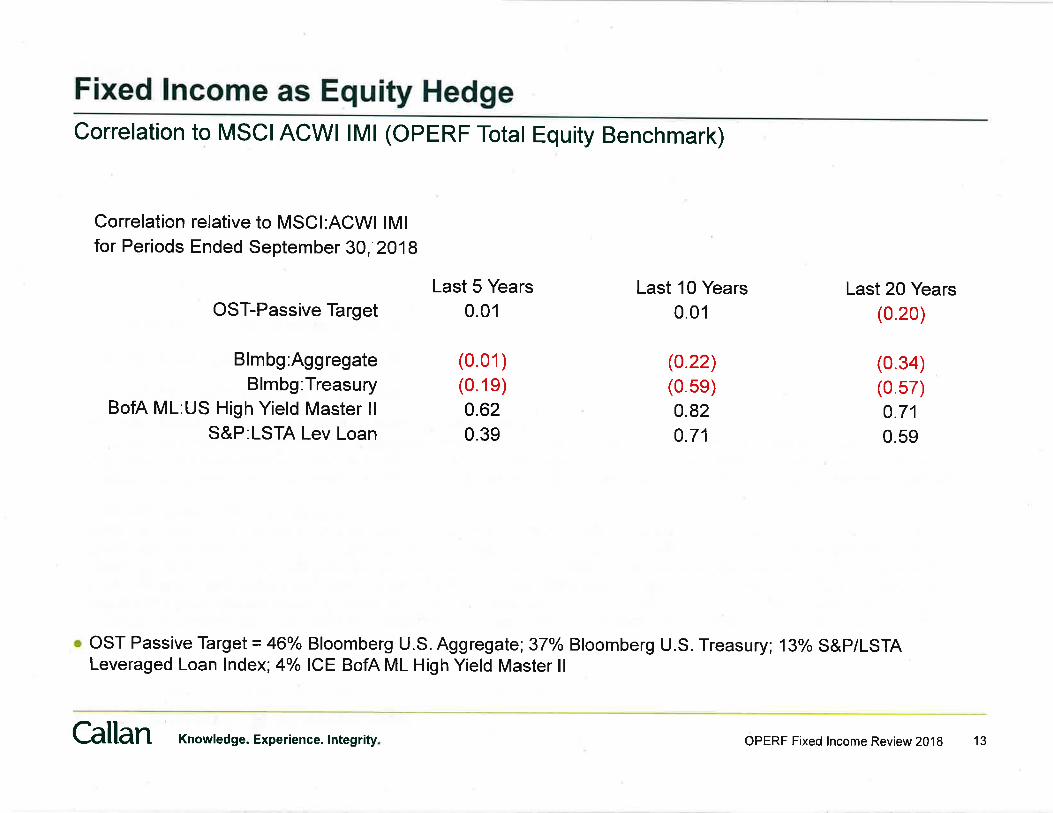
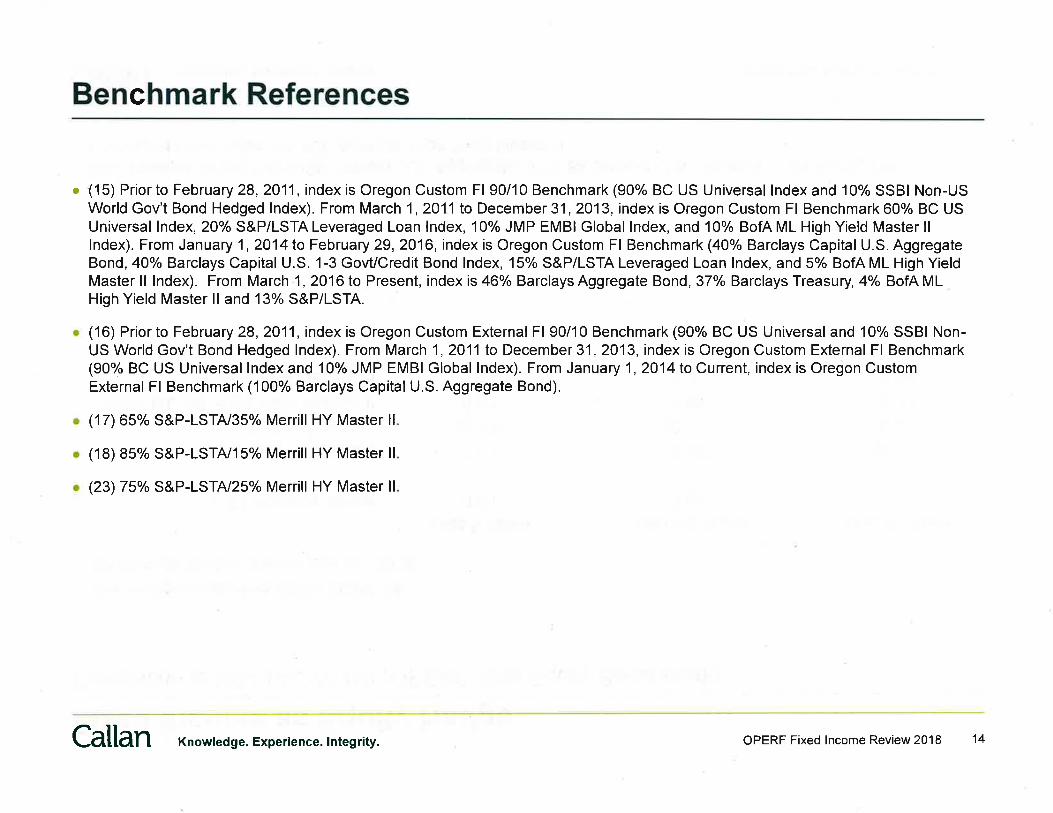
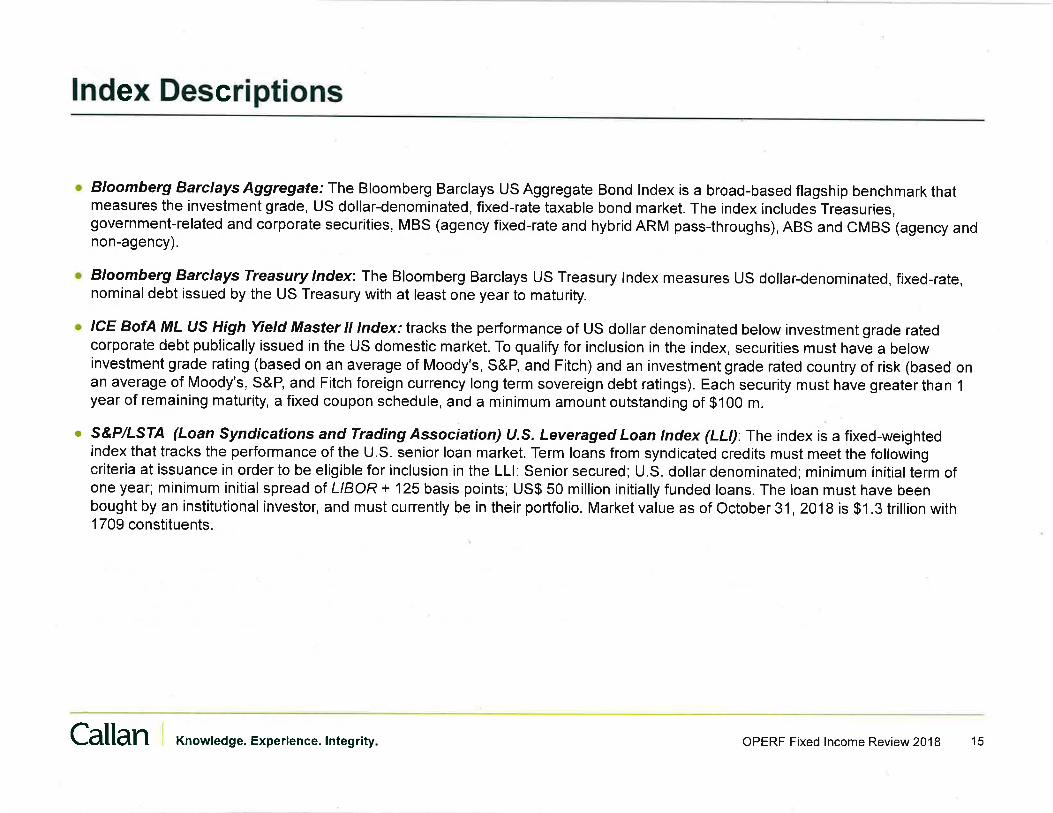
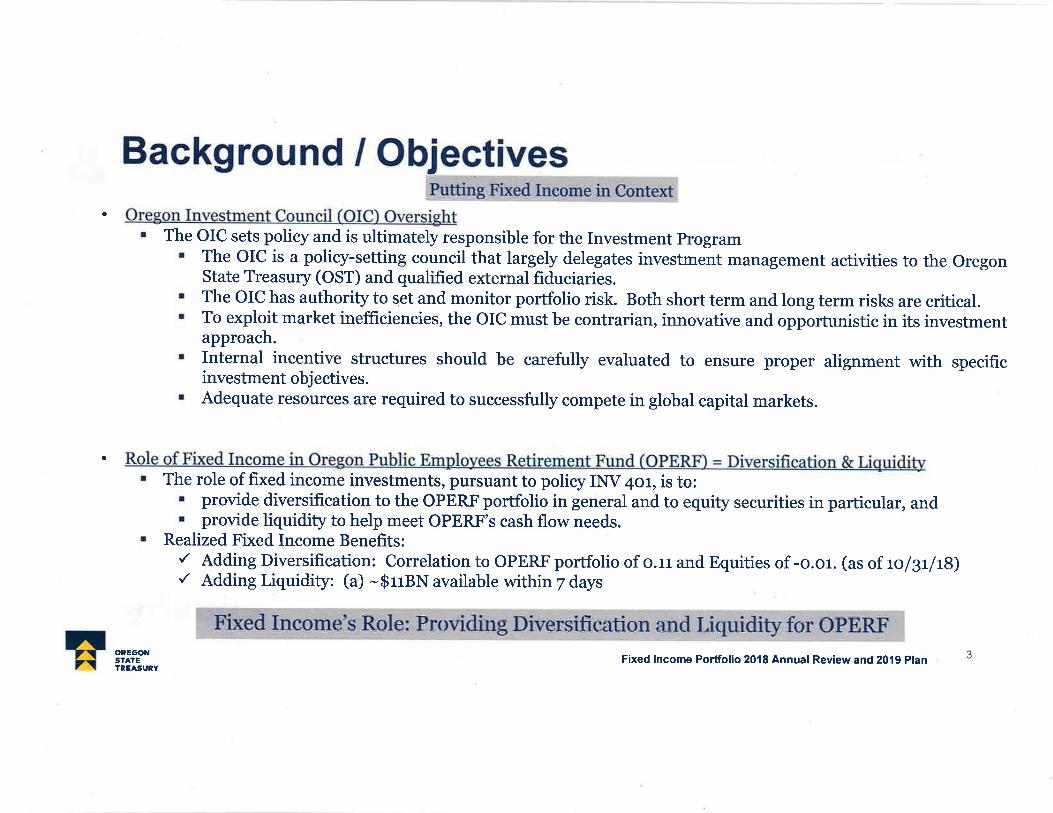

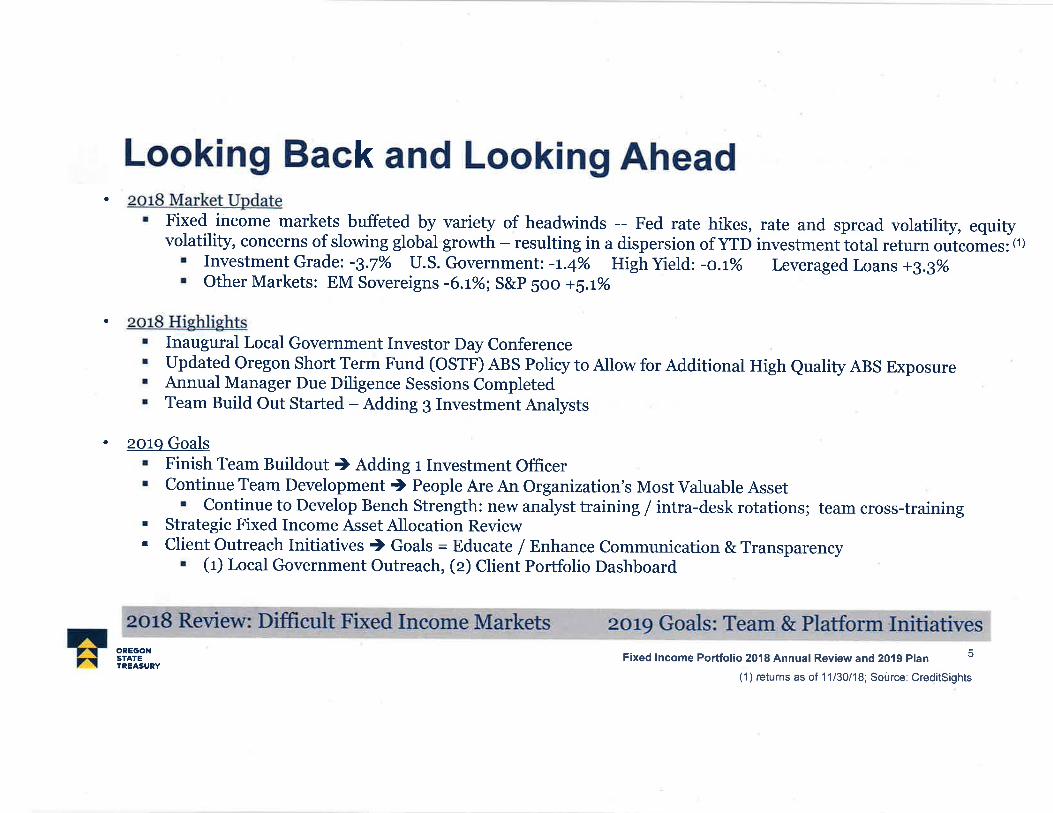
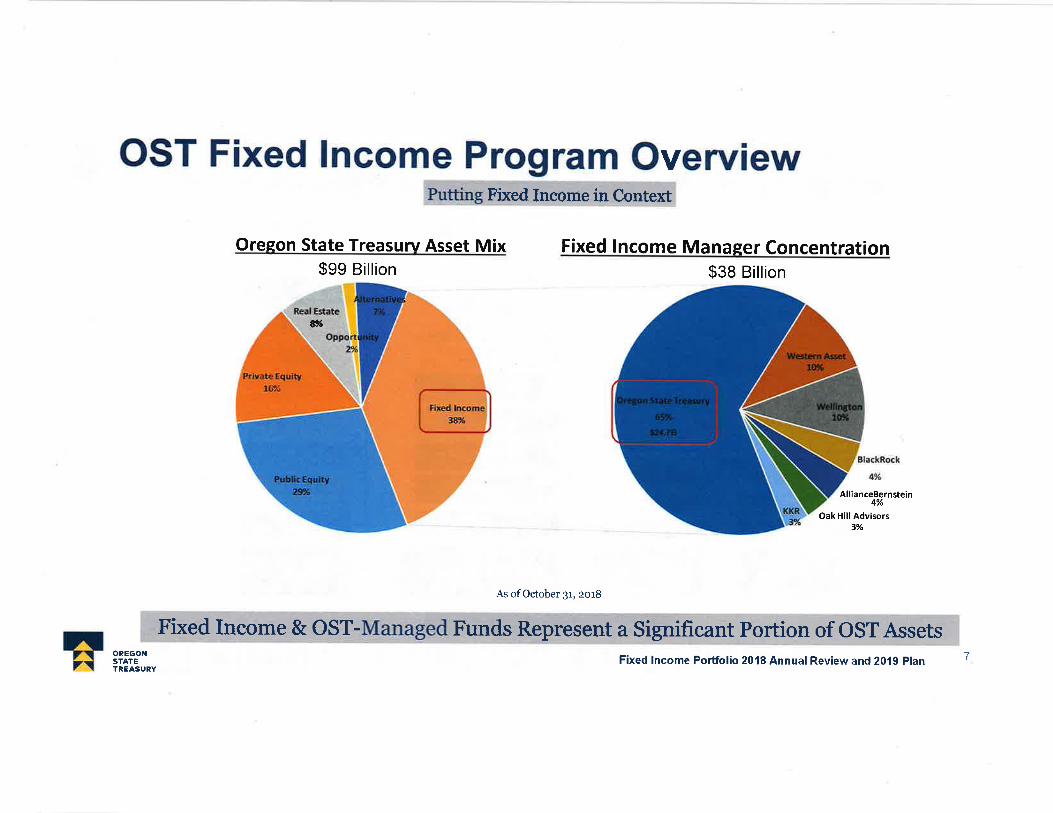
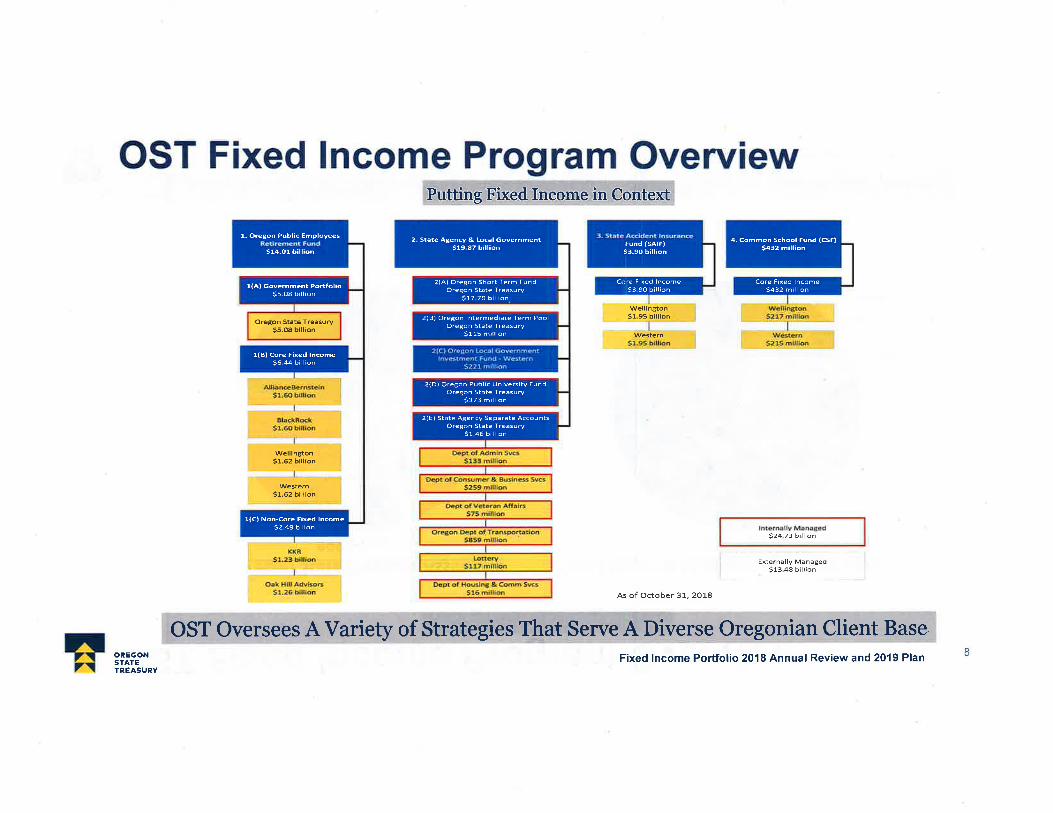
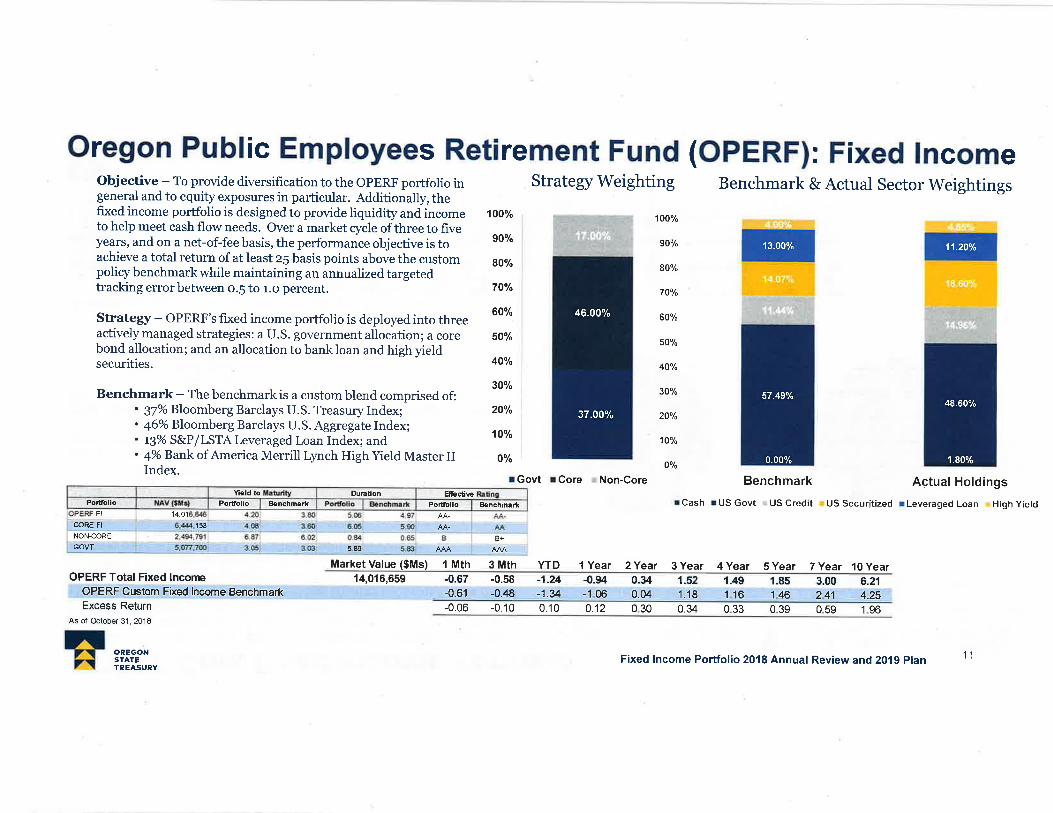
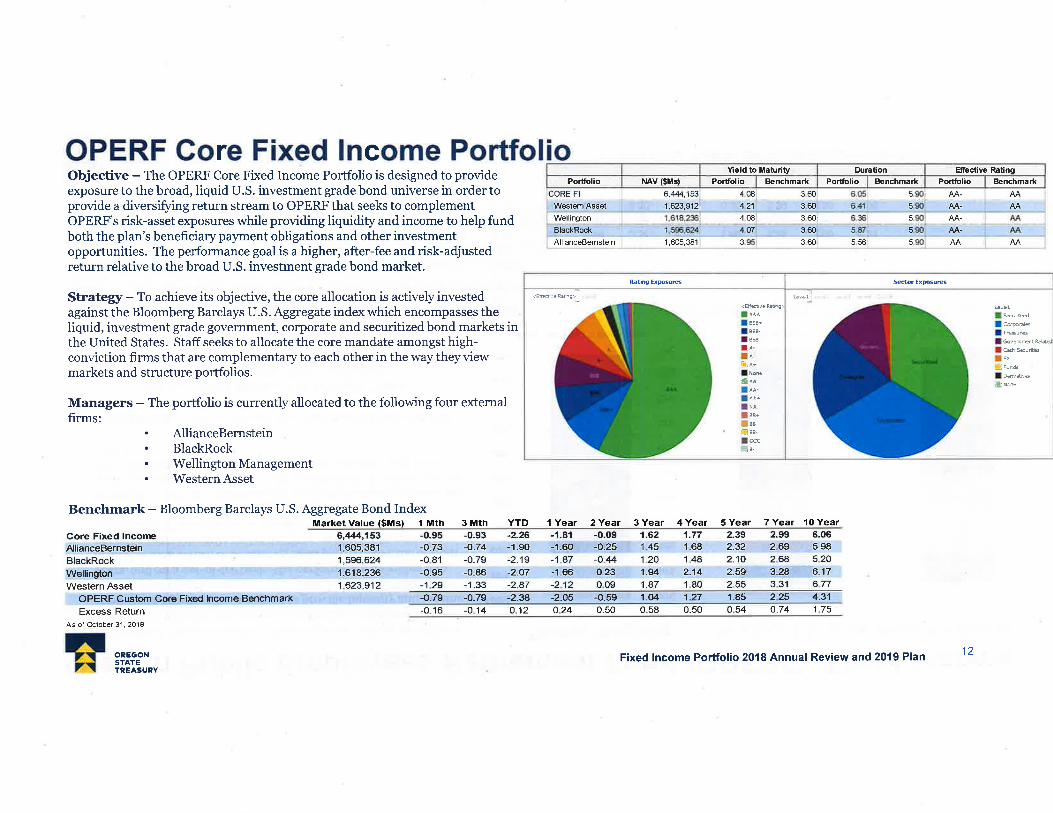

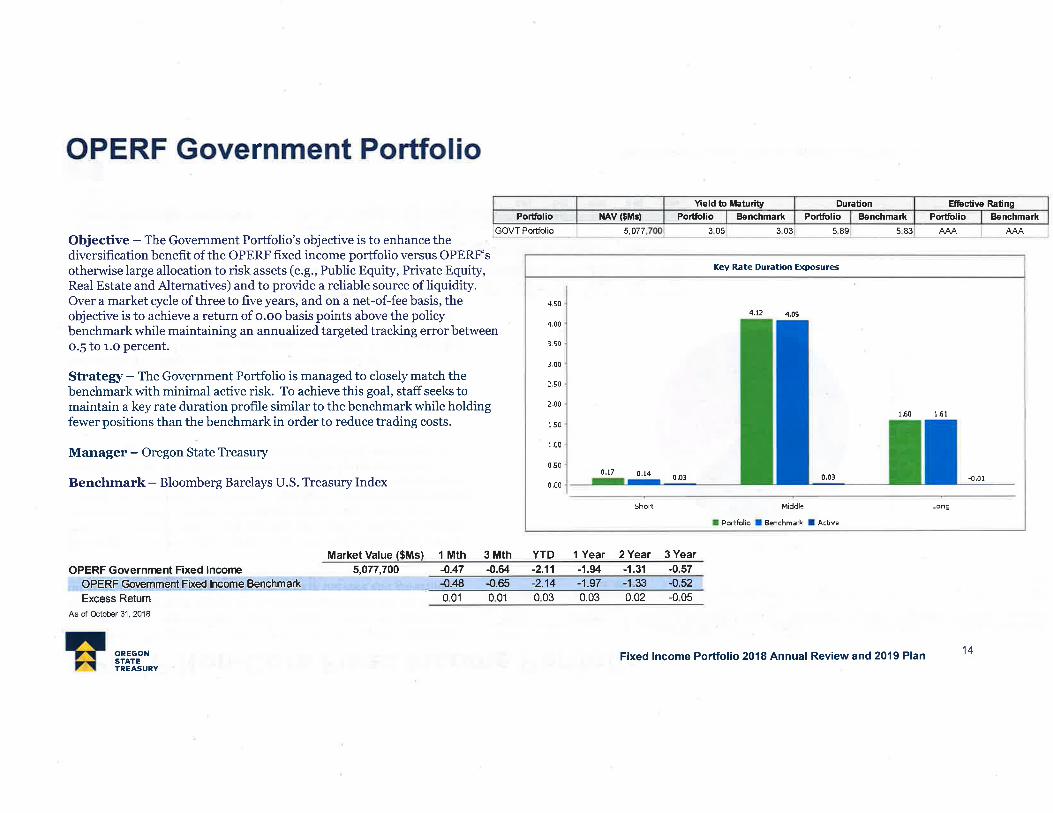
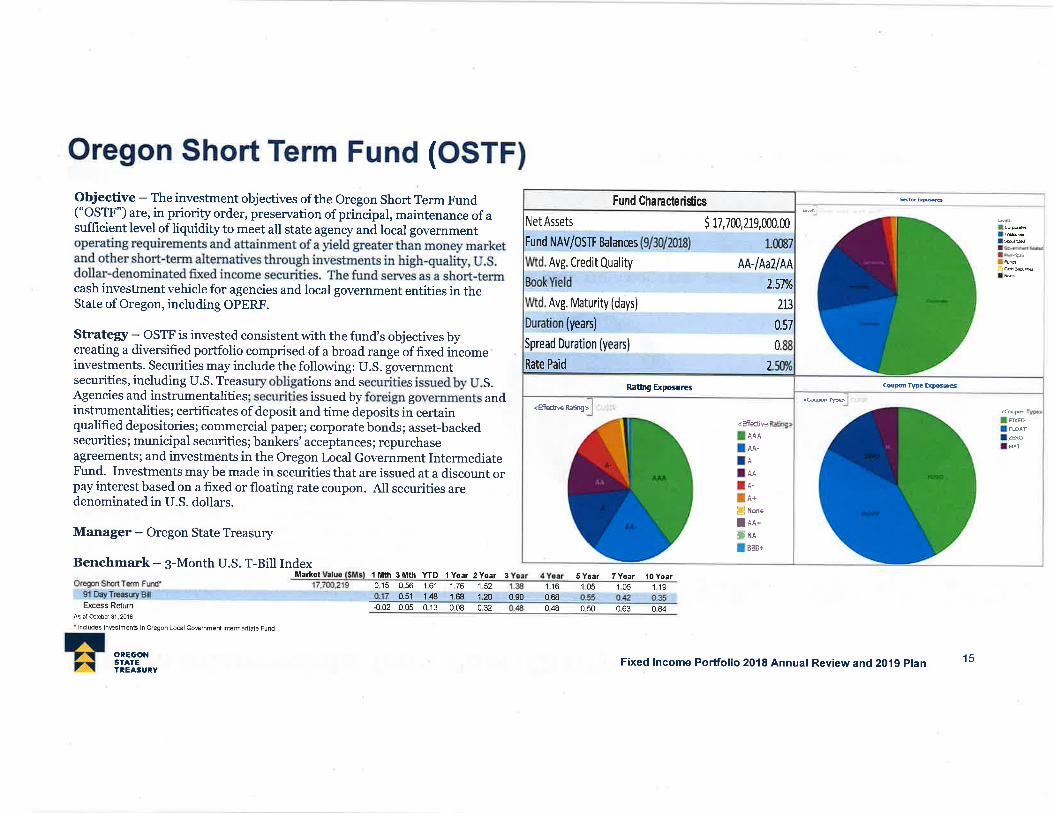
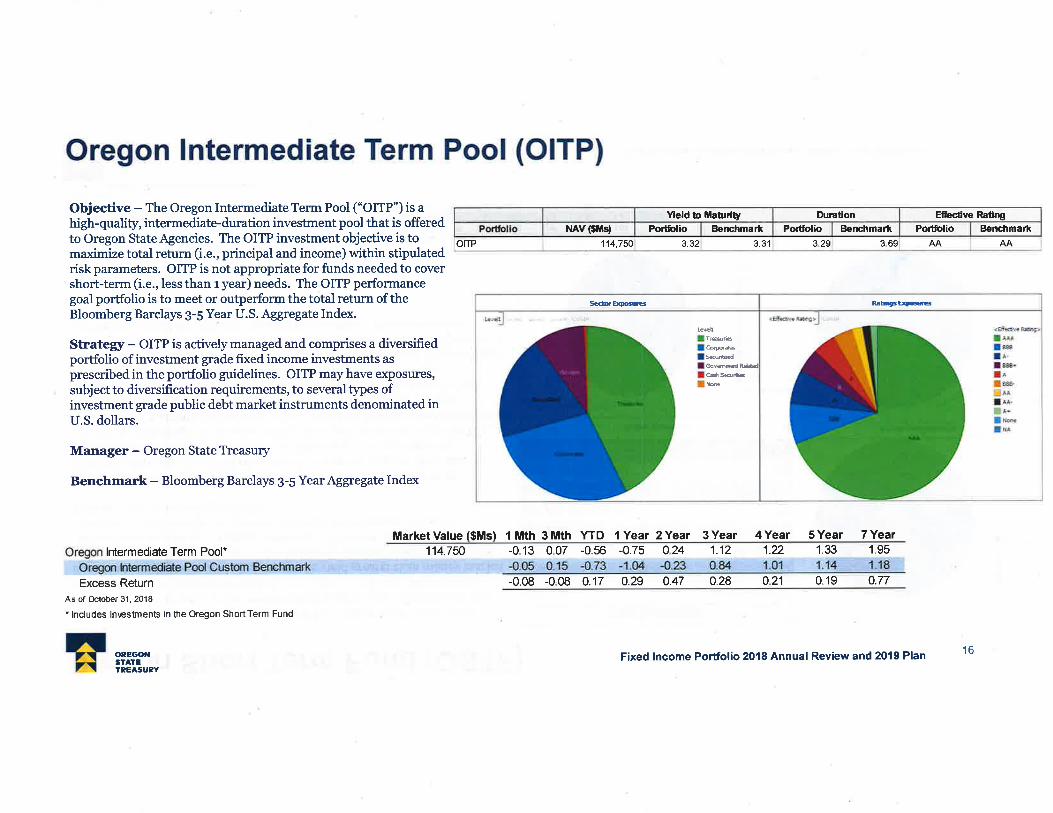
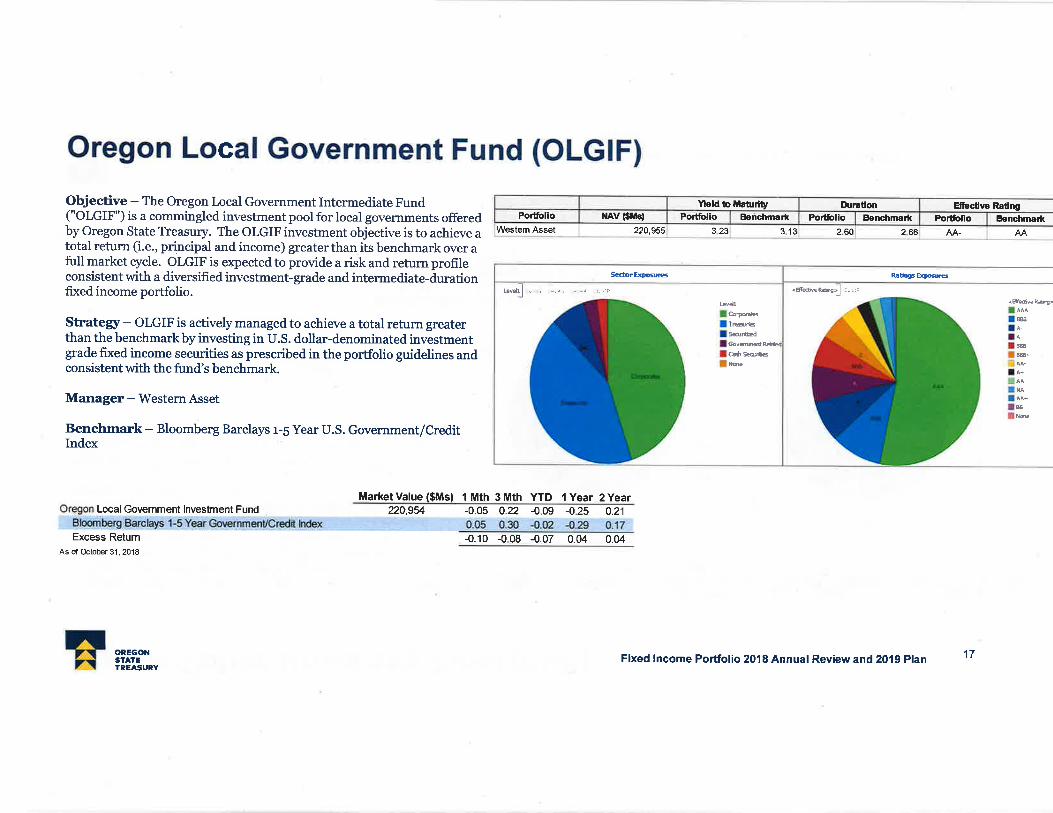
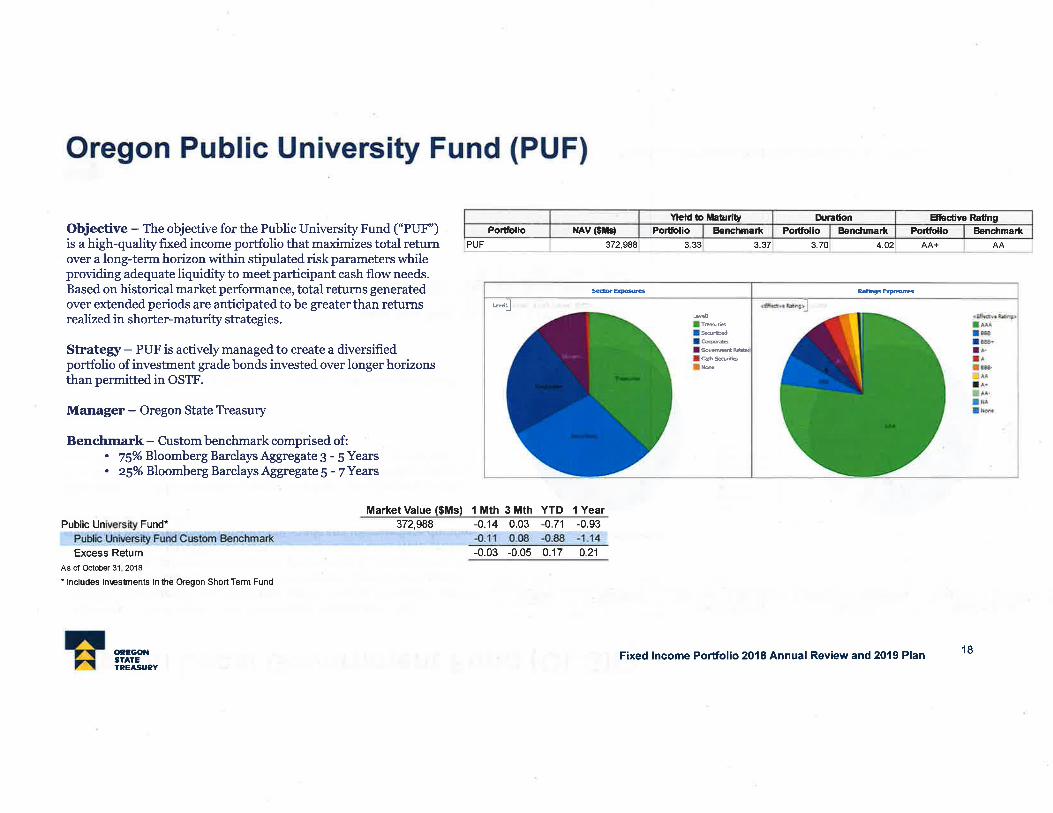

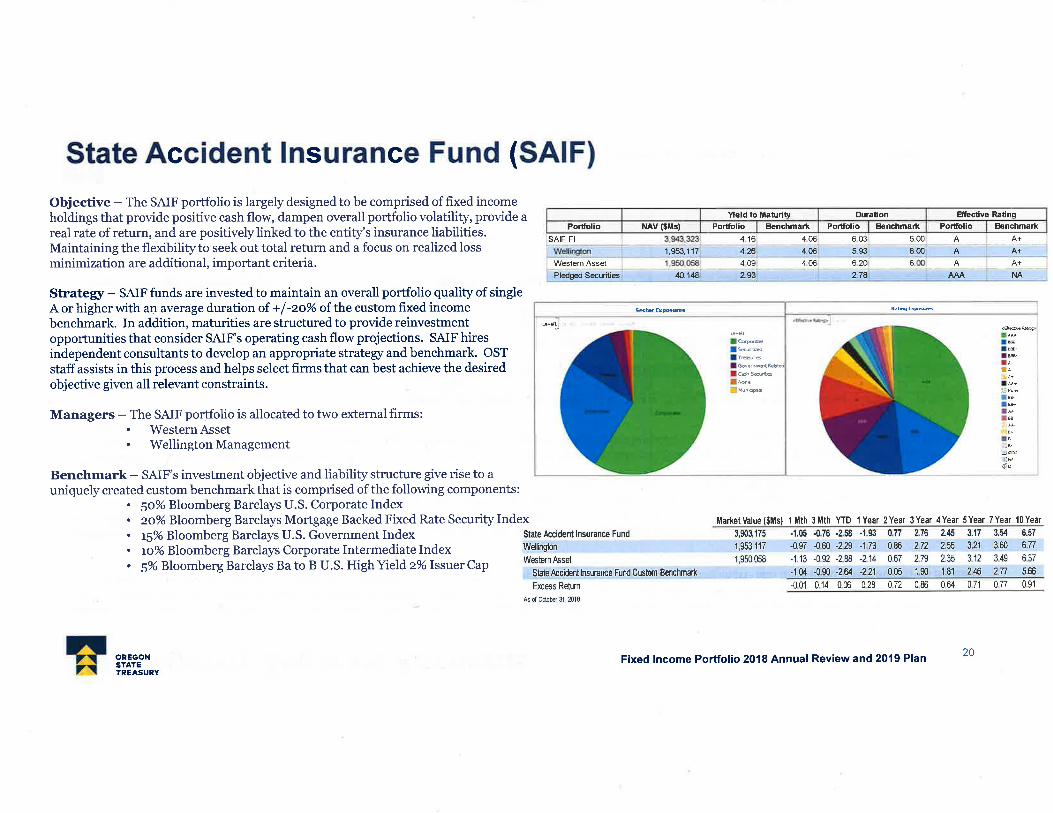
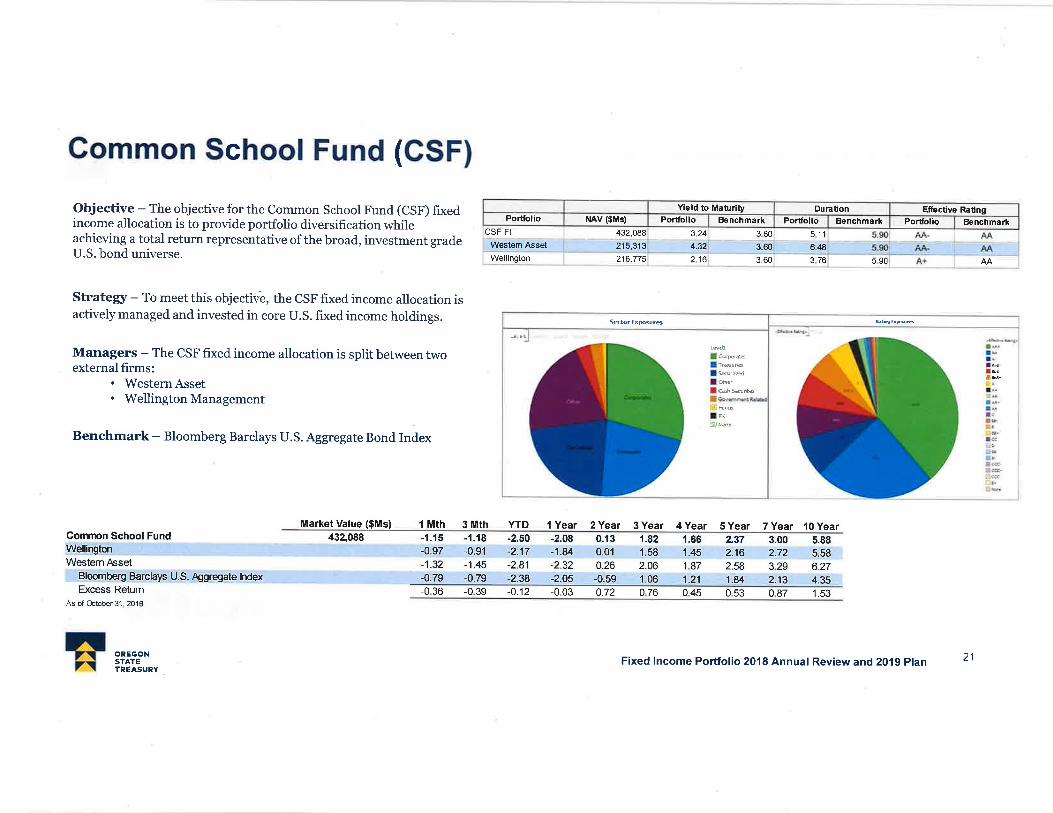
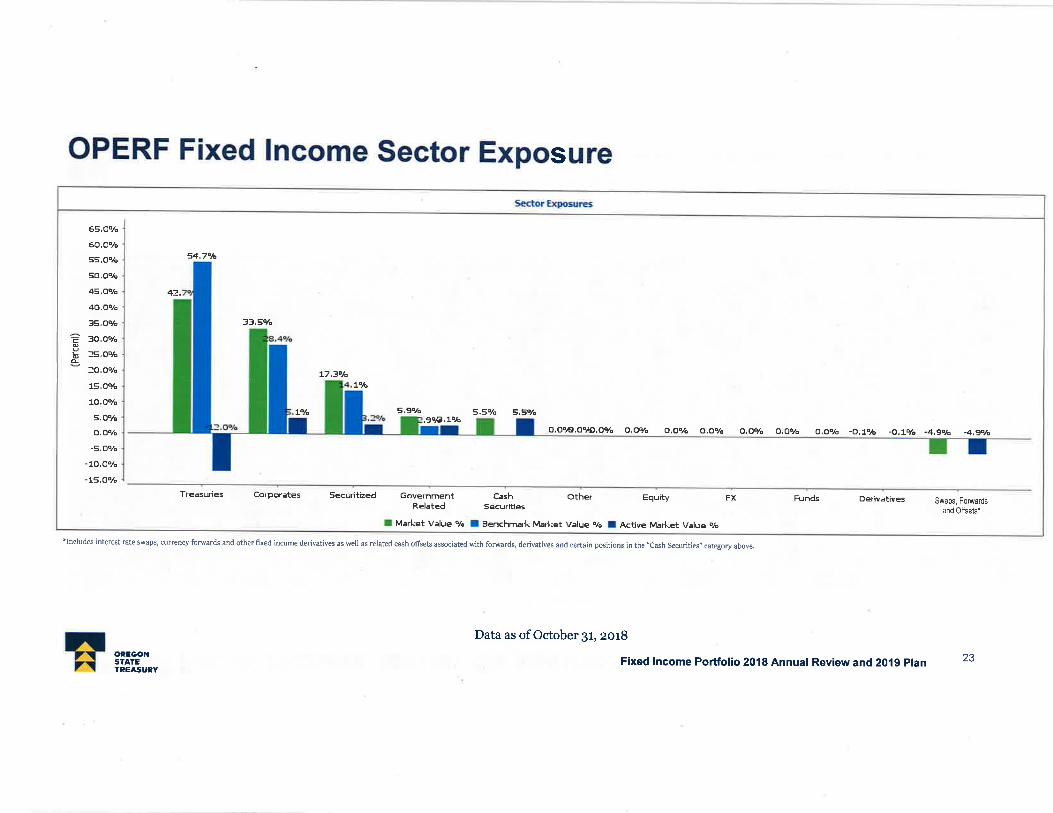
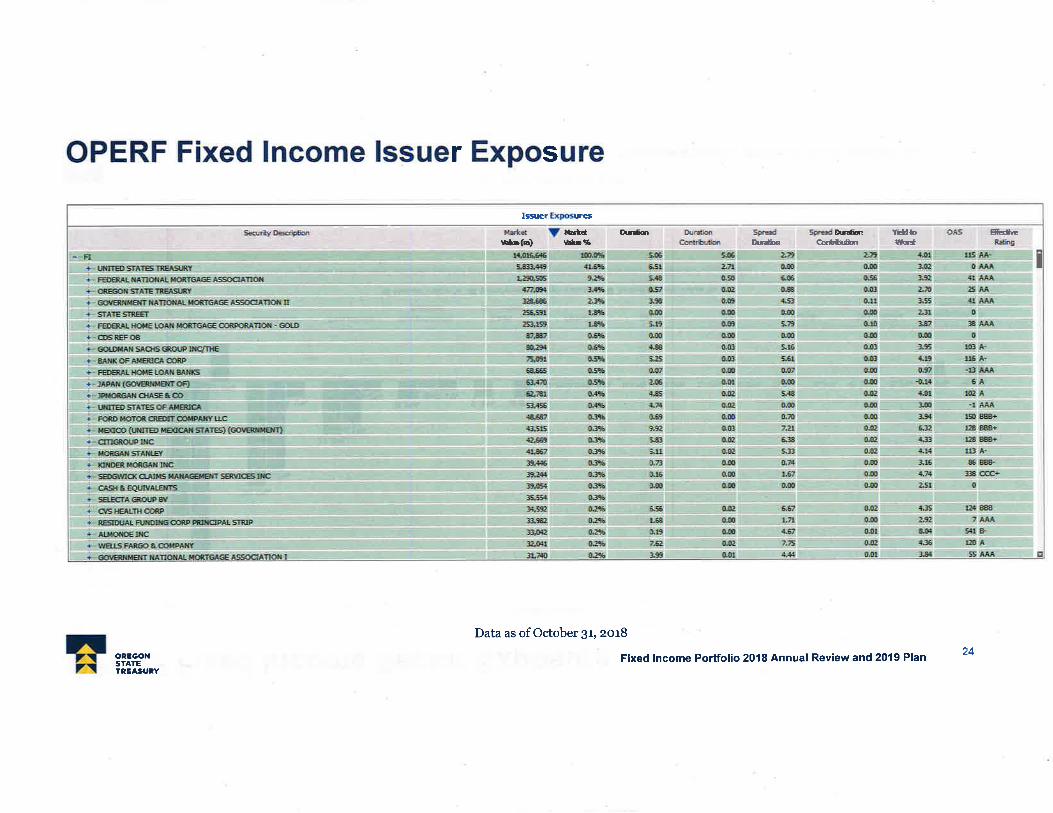

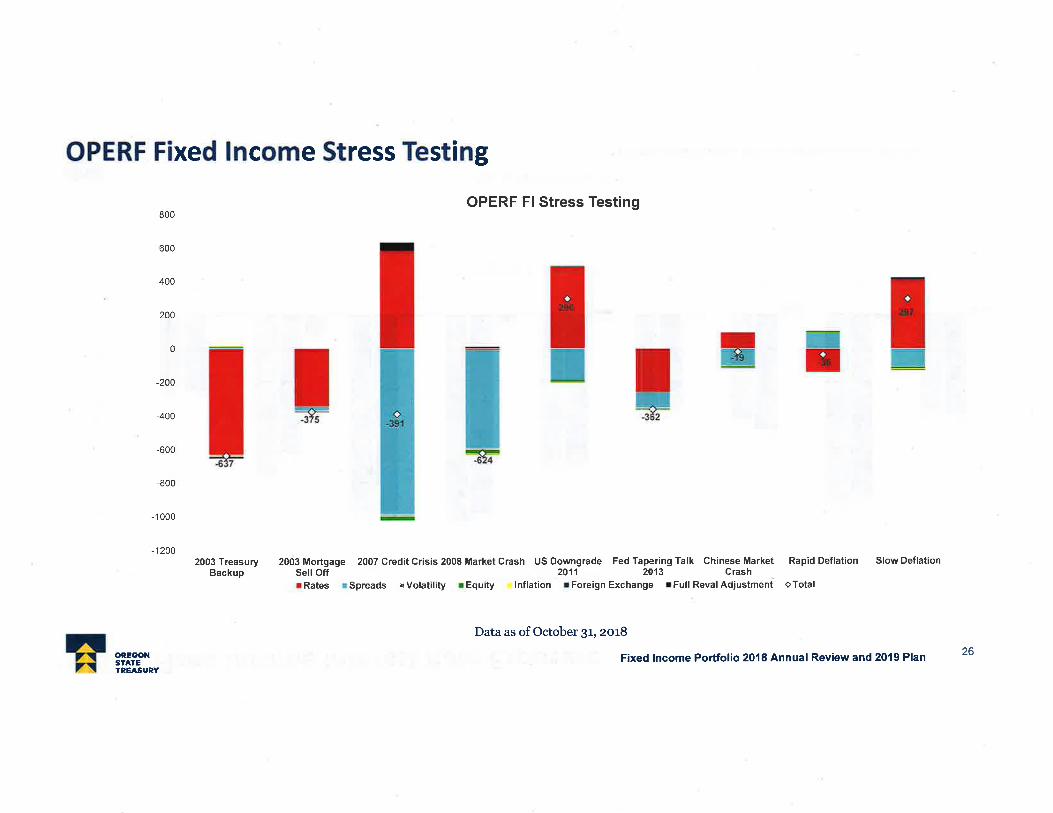
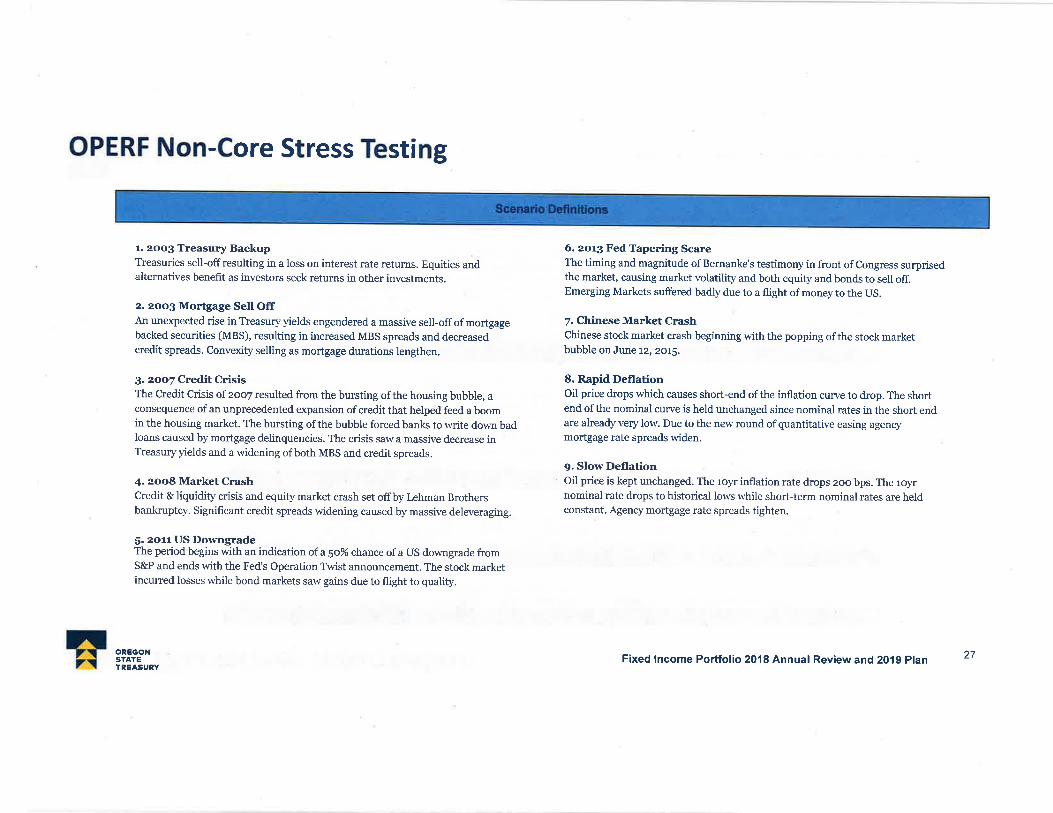


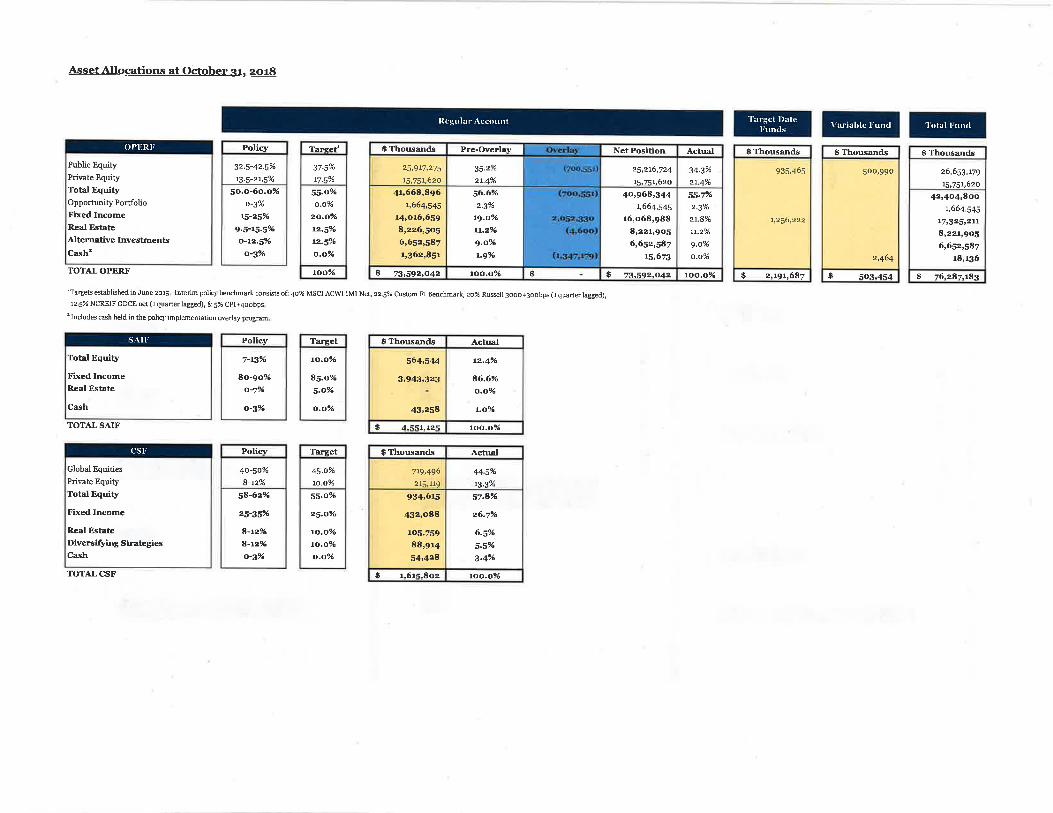
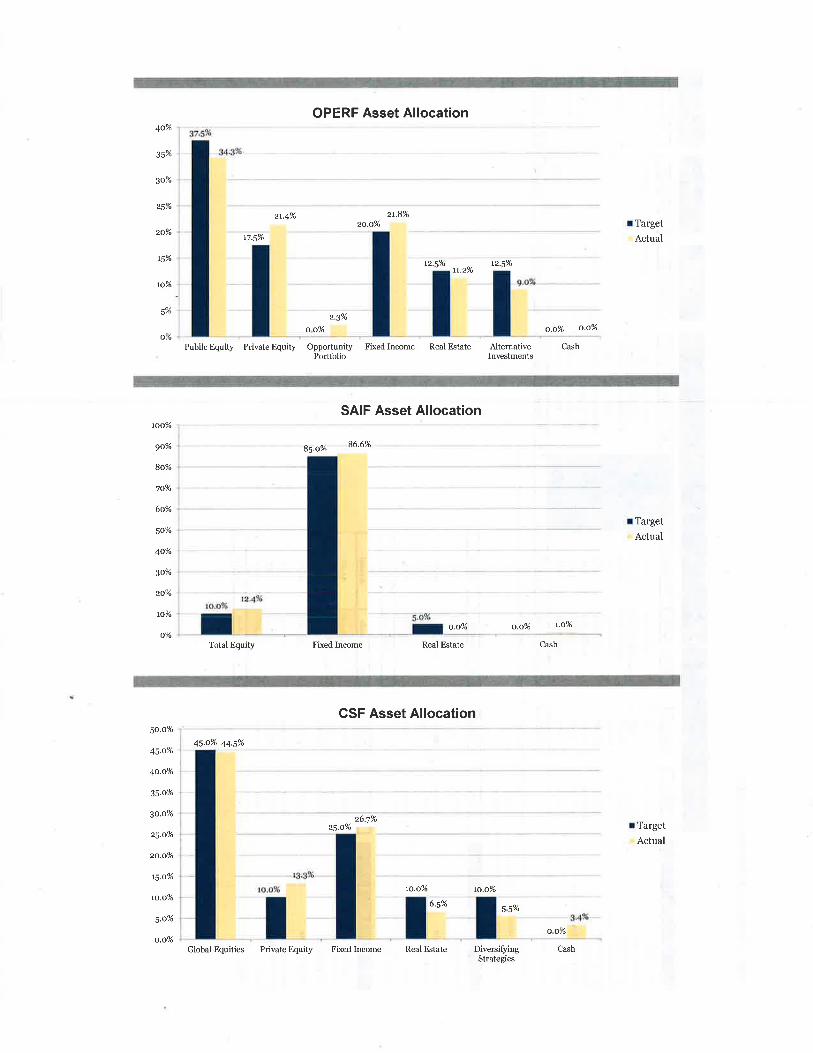
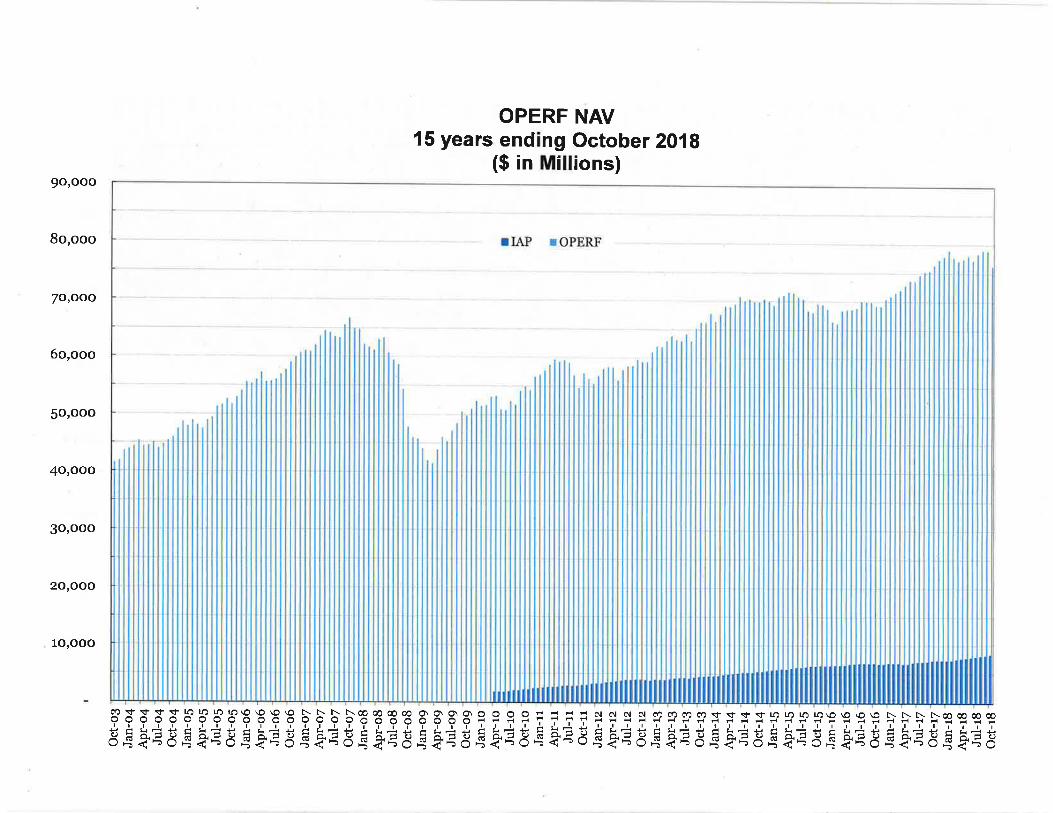
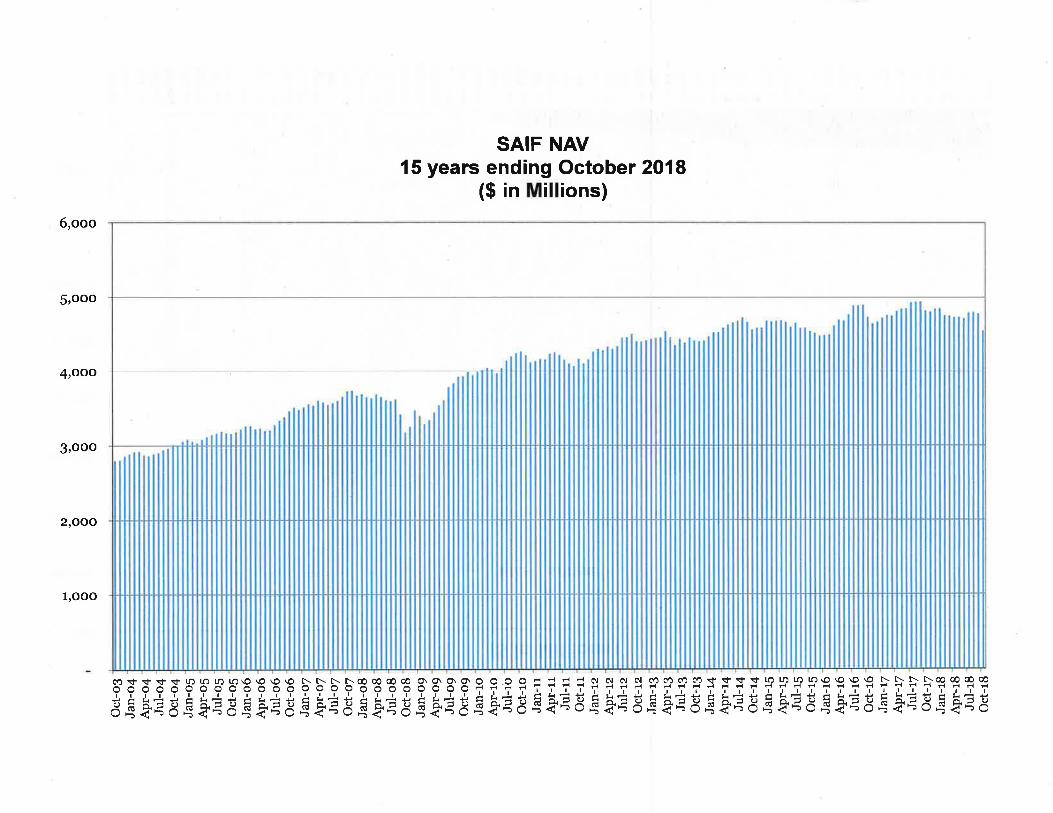
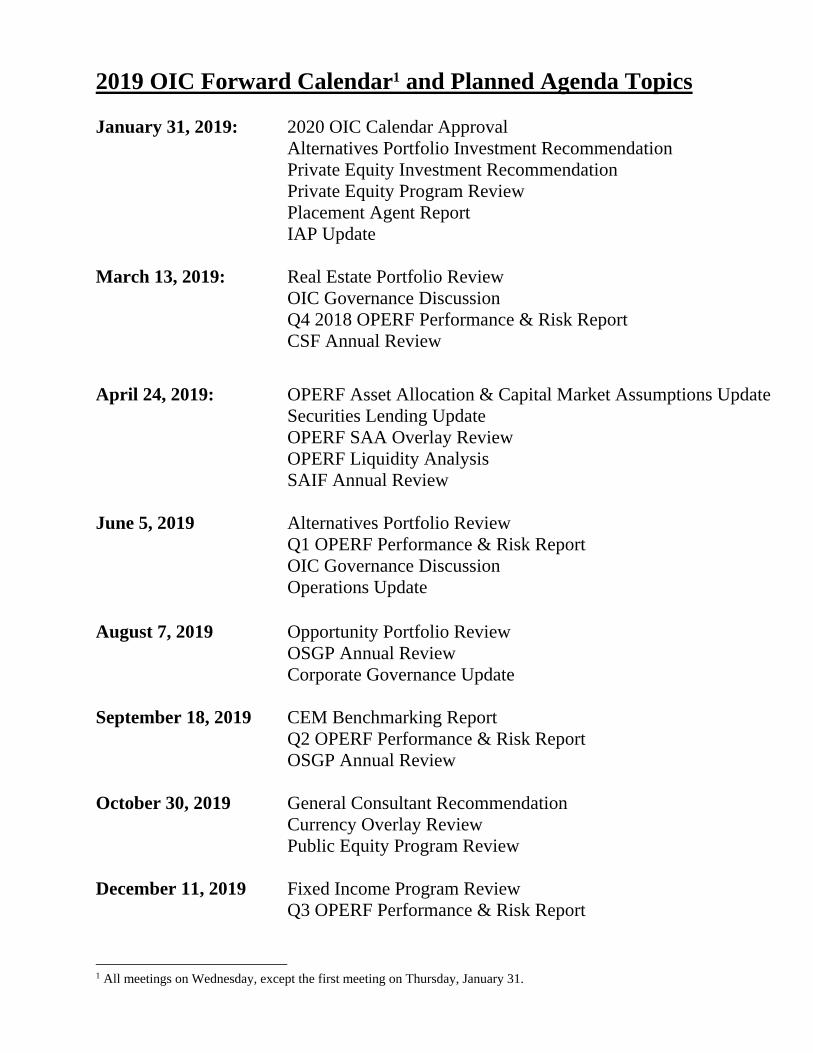
2019 OIC Forward Calendar1 and Planned Agenda Topics January 31, 2019: 2020 OIC Calendar Approval Alternatives Portfolio Investment Recommendation Private Equity Investment Recommendation Private Equity Program Review Placement Agent Report IAP Update March 13, 2019: Real Estate Portfolio Review OIC Governance Discussion Q4 2018 OPERF Performance & Risk Report CSF Annual Review
April 24, 2019: OPERF Asset Allocation & Capital Market Assumptions Update Securities Lending Update OPERF SAA Overlay Review OPERF Liquidity Analysis SAIF Annual Review June 5, 2019 Alternatives Portfolio Review Q1 OPERF Performance & Risk Report OIC Governance Discussion Operations Update August 7, 2019 Opportunity Portfolio Review OSGP Annual Review Corporate Governance Update September 18, 2019 CEM Benchmarking Report
Q2 OPERF Performance & Risk Report OSGP Annual Review October 30, 2019 General Consultant Recommendation Currency Overlay Review Public Equity Program Review December 11, 2019 Fixed Income Program Review Q3 OPERF Performance & Risk Report
1 All meetings on Wednesday, except the first meeting on Thursday, January 31.