Oregon Economic and Revenue Forecast, September 2016
28
OFFICE OF ECONOMIC ANALYSIS Economic and Revenue Outlook: September 2016 September 14 th , 2016 Oregon Office of Economic Analysis Mark McMullen Josh Lehner
-
Upload
oregon-office-of-economic-analysis -
Category
Economy & Finance
-
view
2.691 -
download
0
Transcript of Oregon Economic and Revenue Forecast, September 2016
OFFICE OF ECONOMIC ANALYSIS
Economic and Revenue Outlook: September 2016
September 14th, 2016 Oregon Office of Economic Analysis
Mark McMullen
Josh Lehner
OFFICE OF ECONOMIC ANALYSIS
Economic Update and Outlook
2
OFFICE OF ECONOMIC ANALYSIS
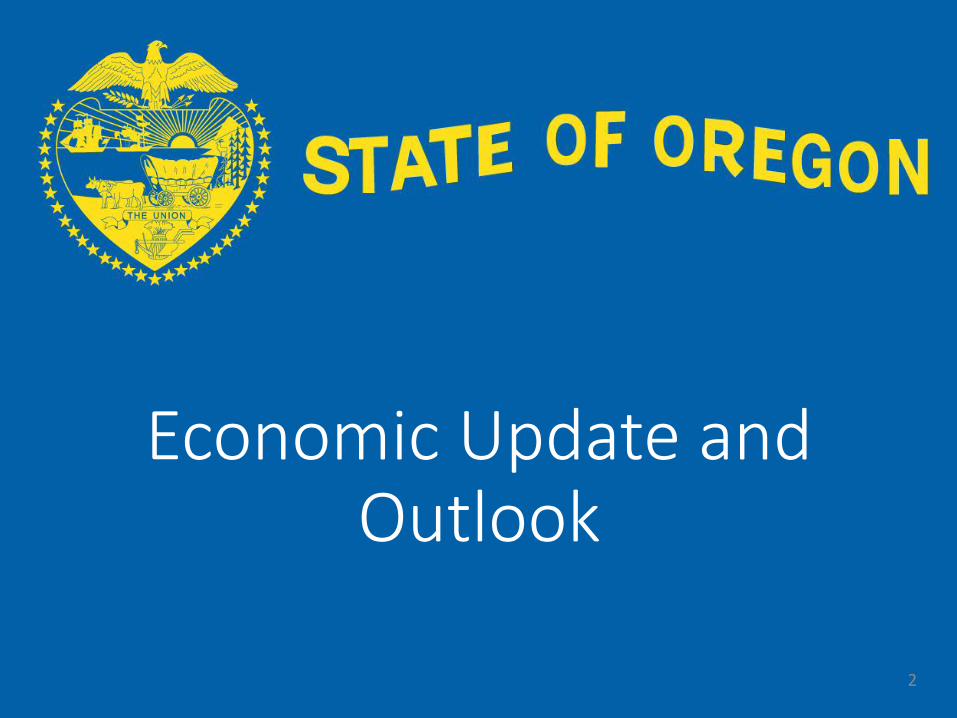
Oregon’s Job Market Continues to Impress
3
OFFICE OF ECONOMIC ANALYSIS
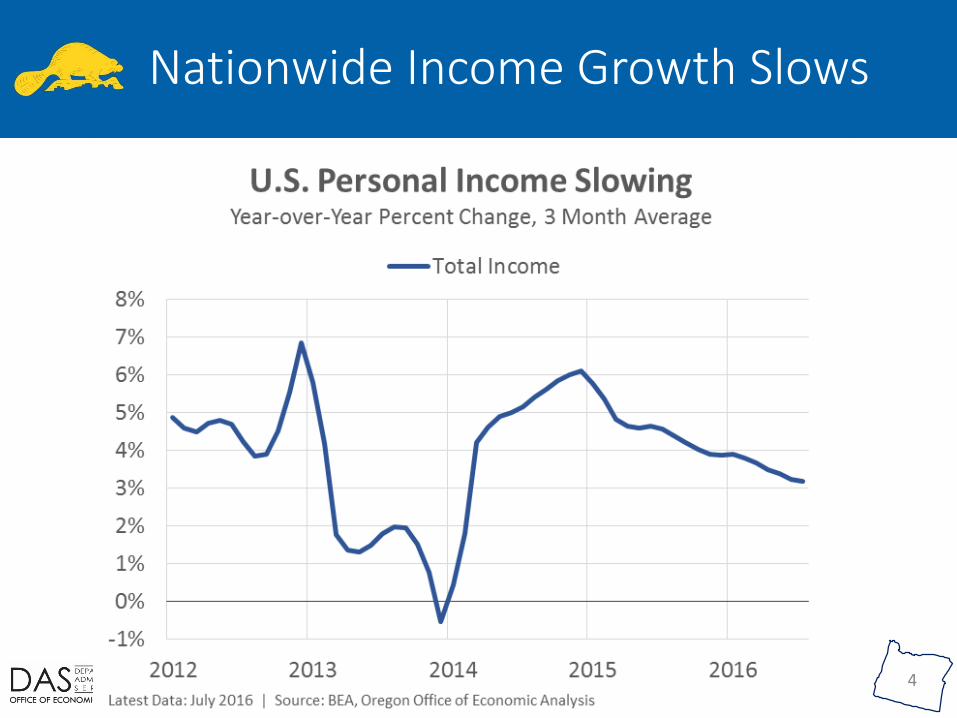
Nationwide Income Growth Slows
4
OFFICE OF ECONOMIC ANALYSIS
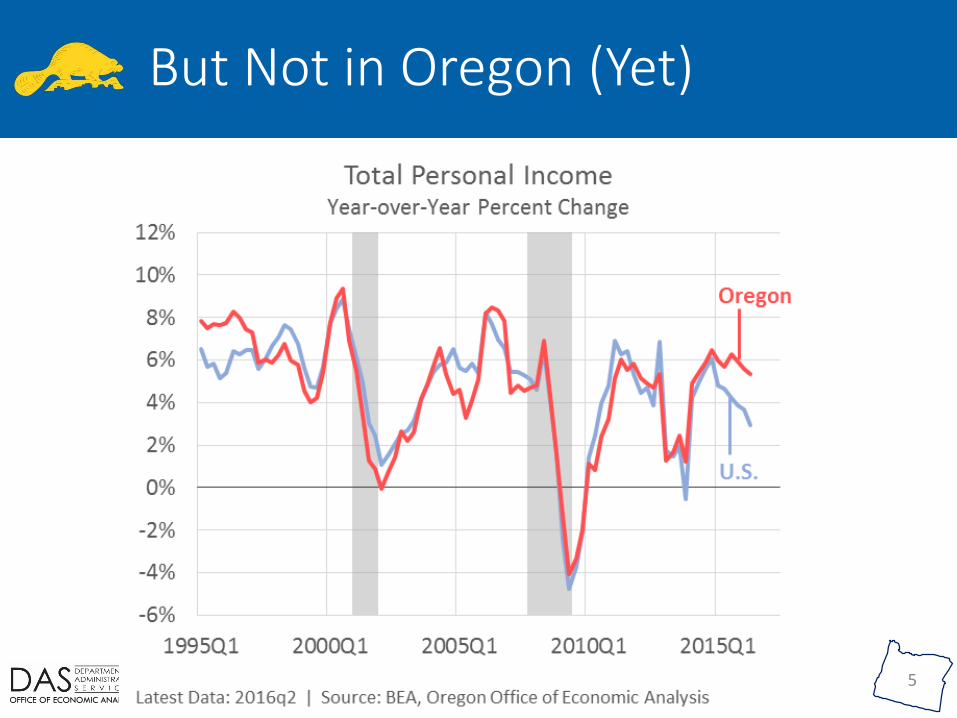
But Not in Oregon (Yet)
5
OFFICE OF ECONOMIC ANALYSIS
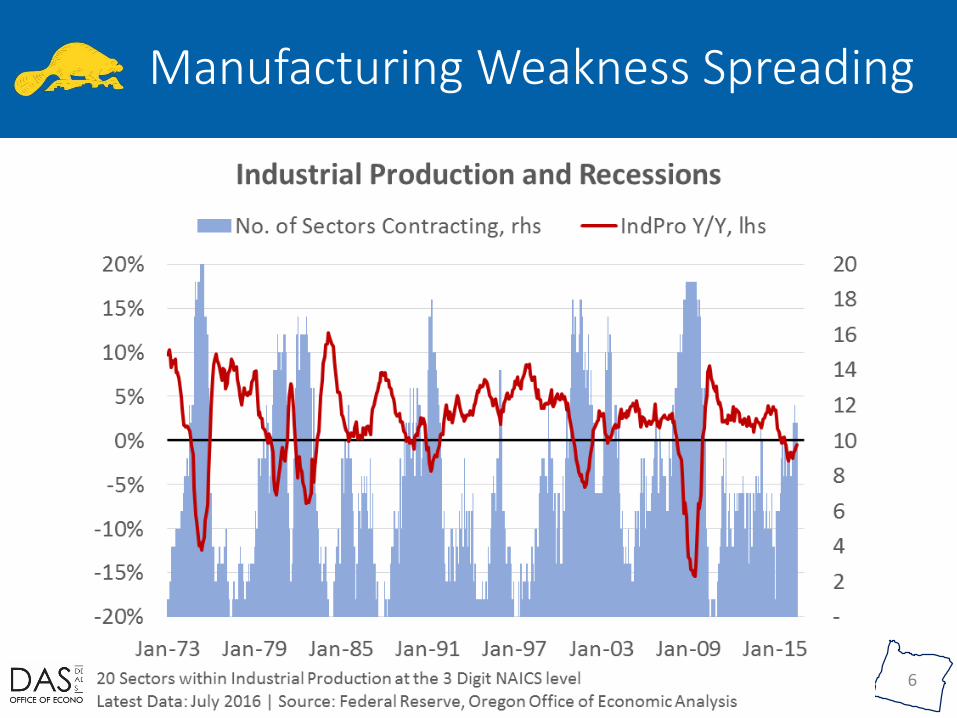
Manufacturing Weakness Spreading
6
OFFICE OF ECONOMIC ANALYSIS
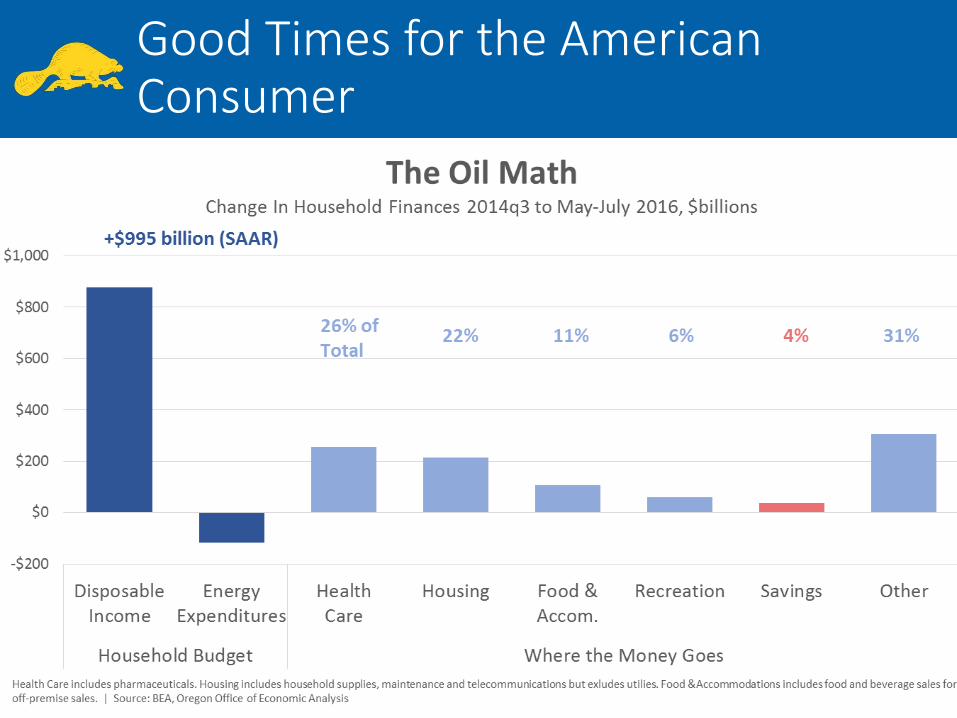
Good Times for the American Consumer
7
OFFICE OF ECONOMIC ANALYSIS
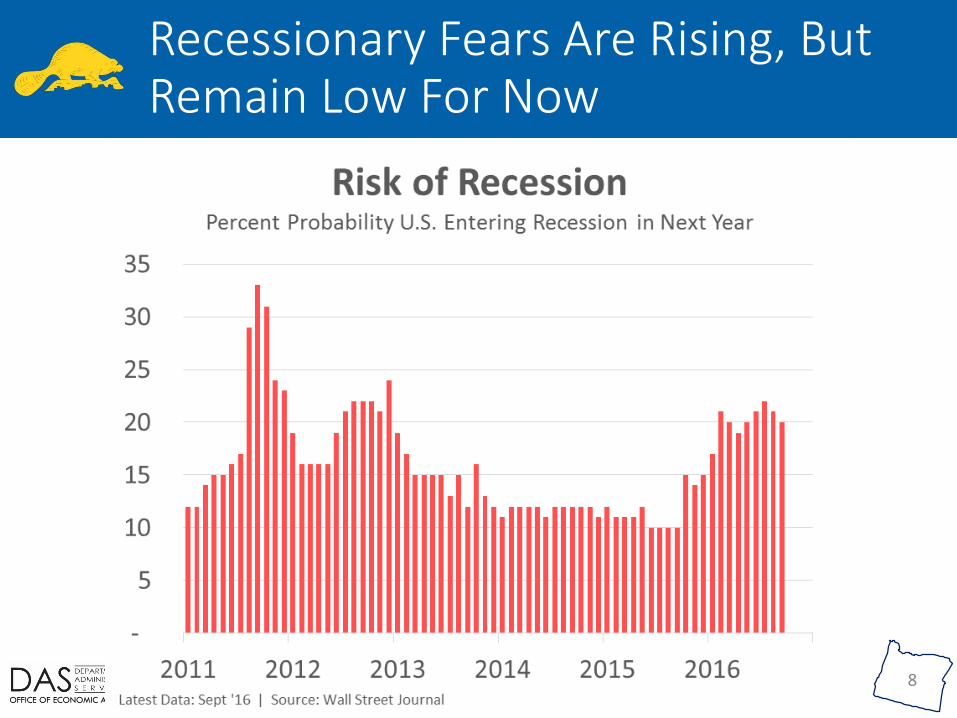
Recessionary Fears Are Rising, But Remain Low For Now
8
OFFICE OF ECONOMIC ANALYSIS
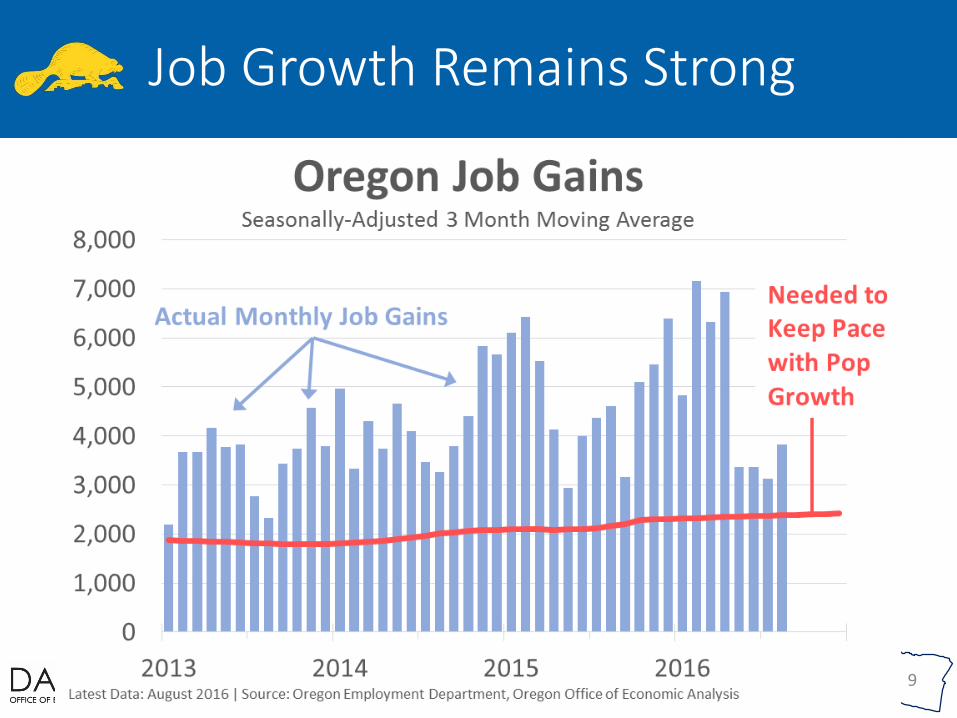
Job Growth Remains Strong
9
OFFICE OF ECONOMIC ANALYSIS
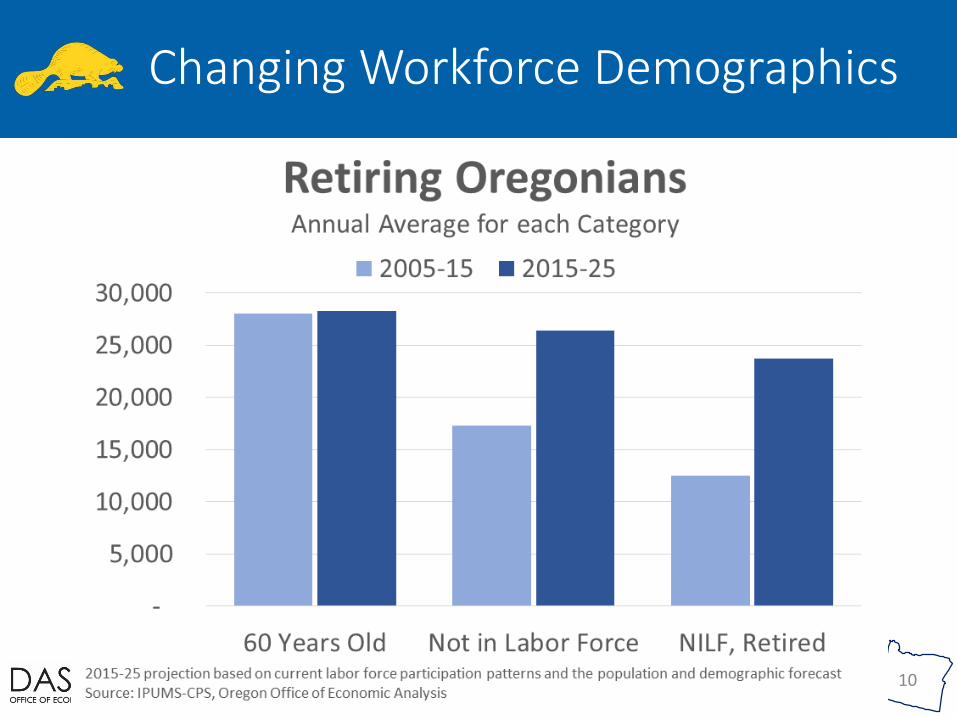
Changing Workforce Demographics
10
OFFICE OF ECONOMIC ANALYSIS
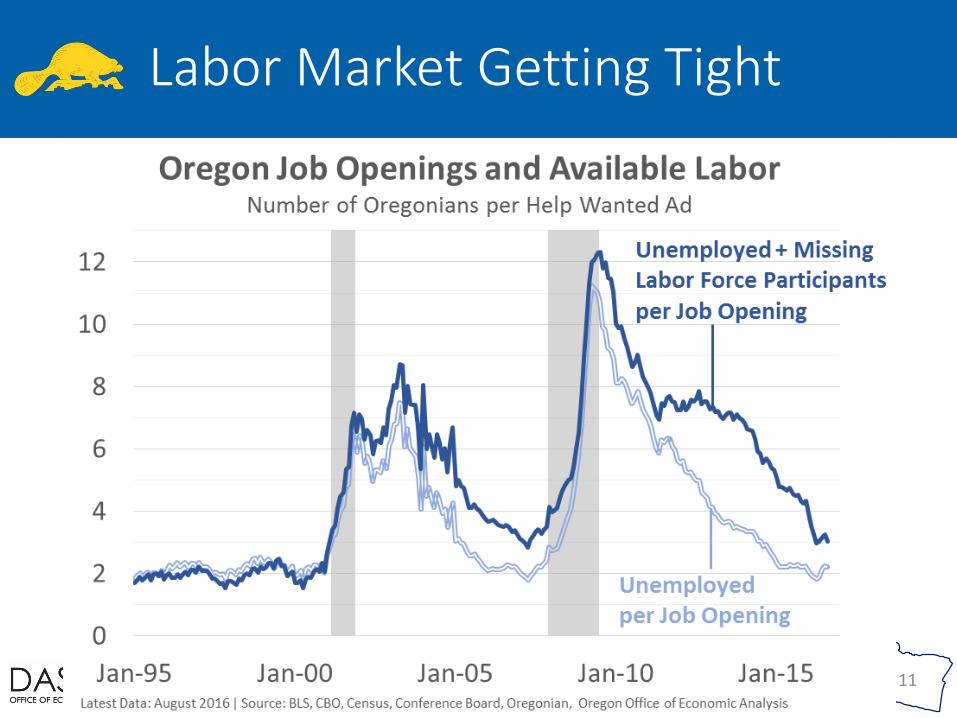
Labor Market Getting Tight
11
OFFICE OF ECONOMIC ANALYSIS
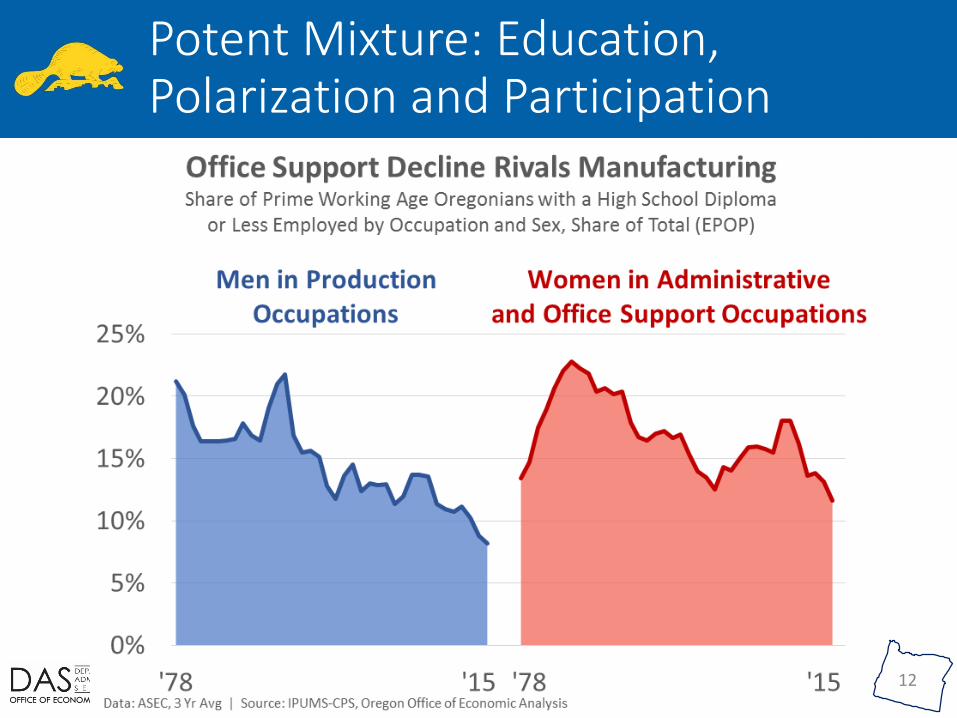
Potent Mixture: Education, Polarization and Participation
12
OFFICE OF ECONOMIC ANALYSIS
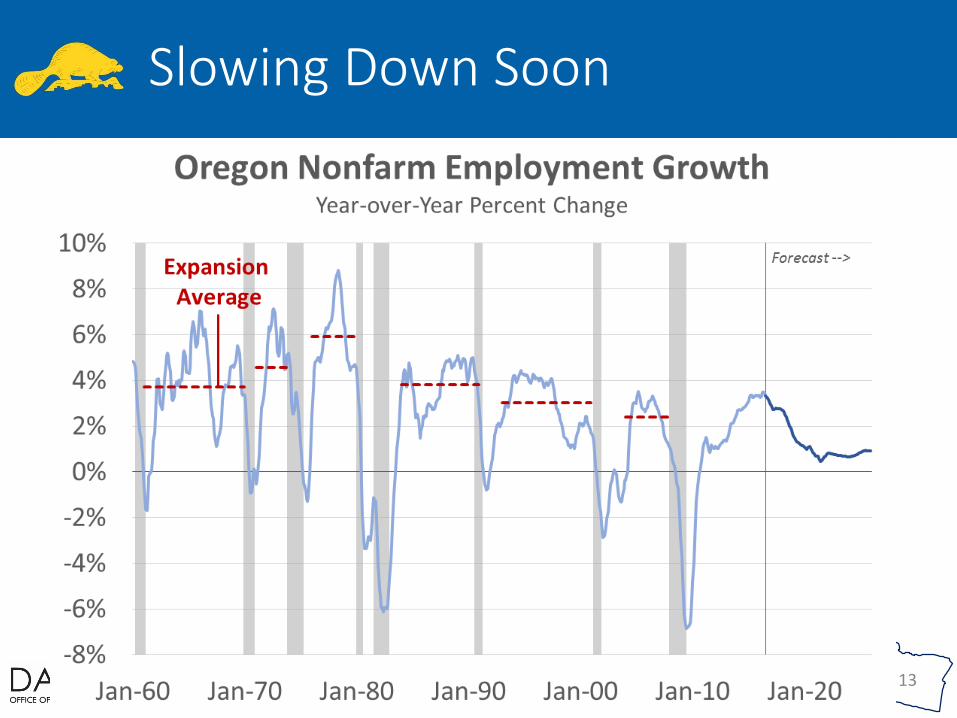
Slowing Down Soon
13
OFFICE OF ECONOMIC ANALYSIS
Revenue Update
14

OFFICE OF ECONOMIC ANALYSIS
Wages Still Strong…
15
OFFICE OF ECONOMIC ANALYSIS
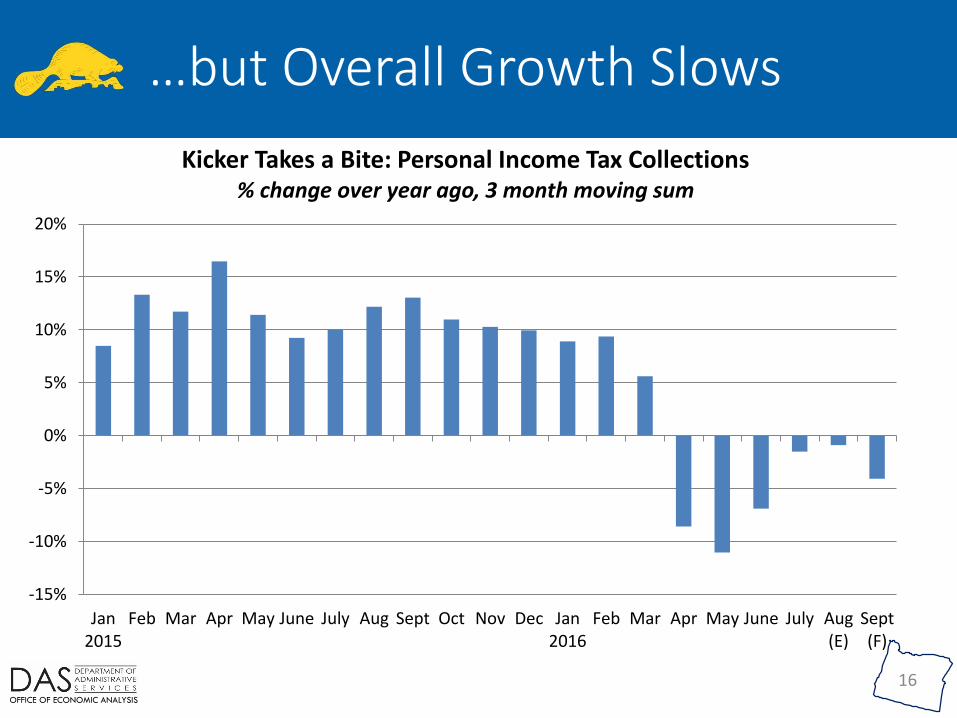
…but Overall Growth Slows
16
-15%
-10%
-5%
0%
5%
10%
15%
20%
Jan2015
Feb Mar Apr May June July Aug Sept Oct Nov Dec Jan2016
Feb Mar Apr May June July Aug(E)
Sept(F)
Kicker Takes a Bite: Personal Income Tax Collections% change over year ago, 3 month moving sum
OFFICE OF ECONOMIC ANALYSIS
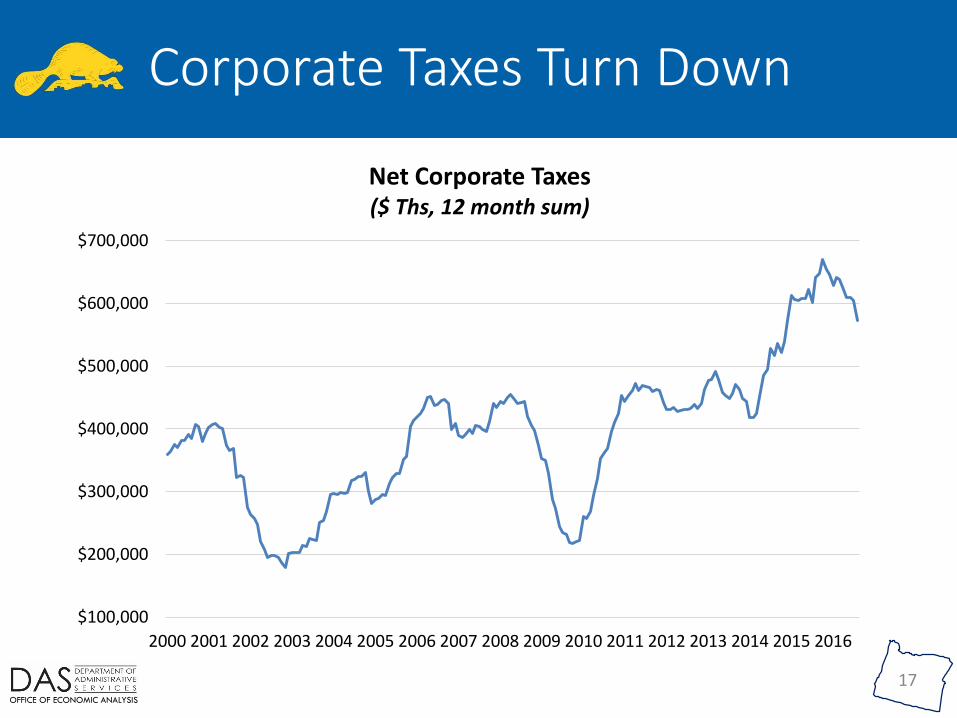
Corporate Taxes Turn Down
17
$100,000
$200,000
$300,000
$400,000
$500,000
$600,000
$700,000
2000 2001 2002 2003 2004 2005 2006 2007 2008 2009 2010 2011 2012 2013 2014 2015 2016
Net Corporate Taxes ($ Ths, 12 month sum)

OFFICE OF ECONOMIC ANALYSIS
Revenue Outlook
18
OFFICE OF ECONOMIC ANALYSIS
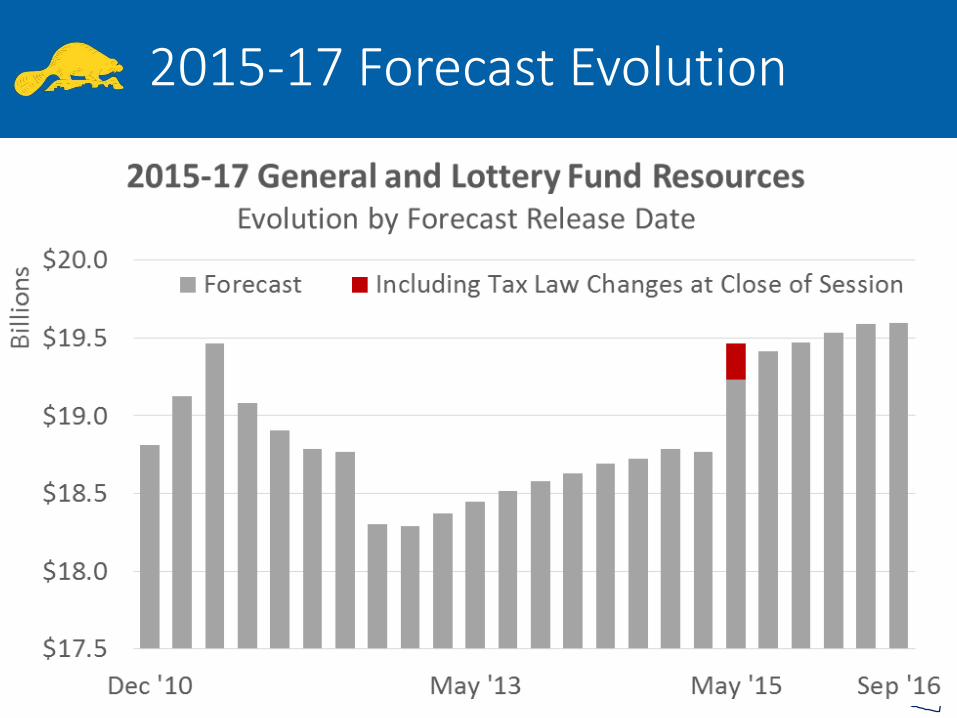
2015-17 Forecast Evolution
19
OFFICE OF ECONOMIC ANALYSIS
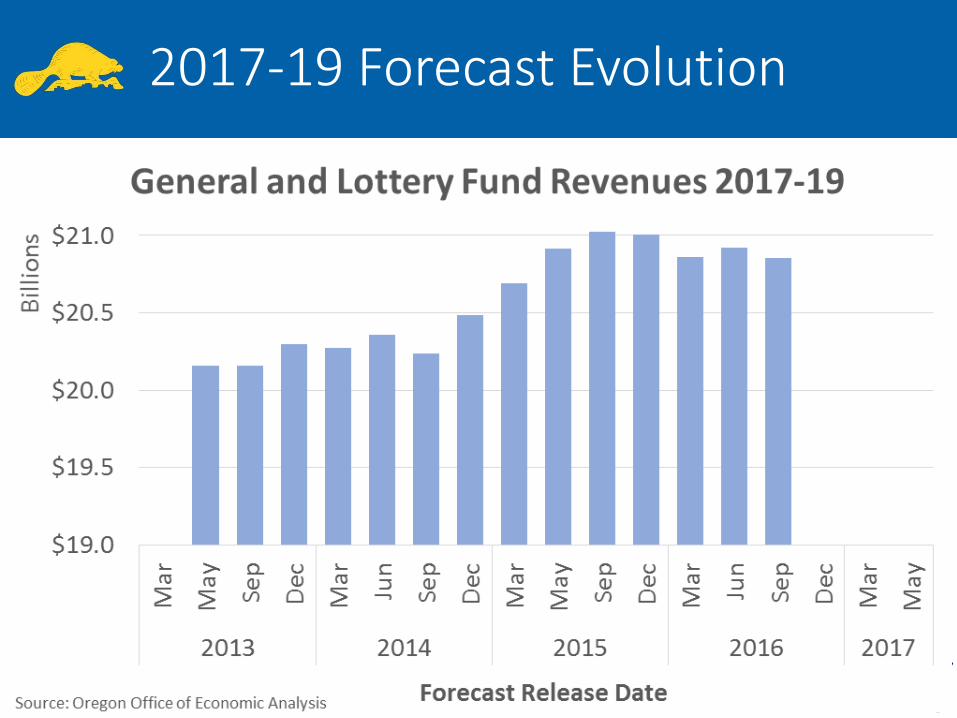
2017-19 Forecast Evolution
20
OFFICE OF ECONOMIC ANALYSIS
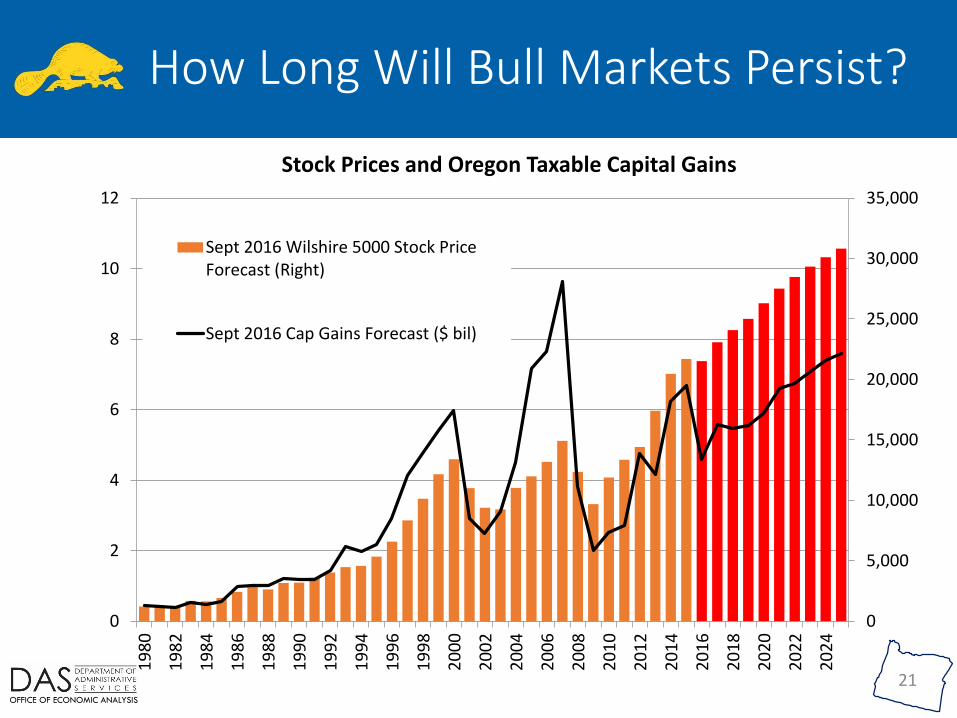
How Long Will Bull Markets Persist?
21
0
5,000
10,000
15,000
20,000
25,000
30,000
35,000
0
2
4
6
8
10
12
19
80
19
82
19
84
19
86
19
88
19
90
19
92
19
94
19
96
19
98
20
00
20
02
20
04
20
06
20
08
20
10
20
12
20
14
20
16
20
18
20
20
20
22
20
24
Stock Prices and Oregon Taxable Capital Gains
Sept 2016 Wilshire 5000 Stock PriceForecast (Right)
Sept 2016 Cap Gains Forecast ($ bil)
OFFICE OF ECONOMIC ANALYSIS
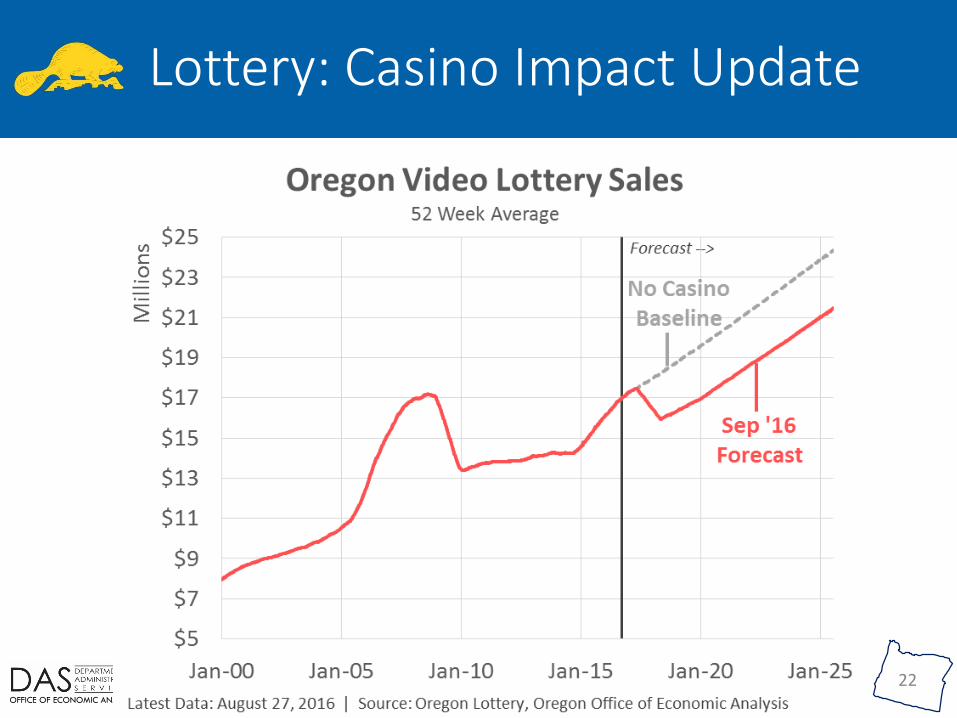
Lottery: Casino Impact Update
22
OFFICE OF ECONOMIC ANALYSIS
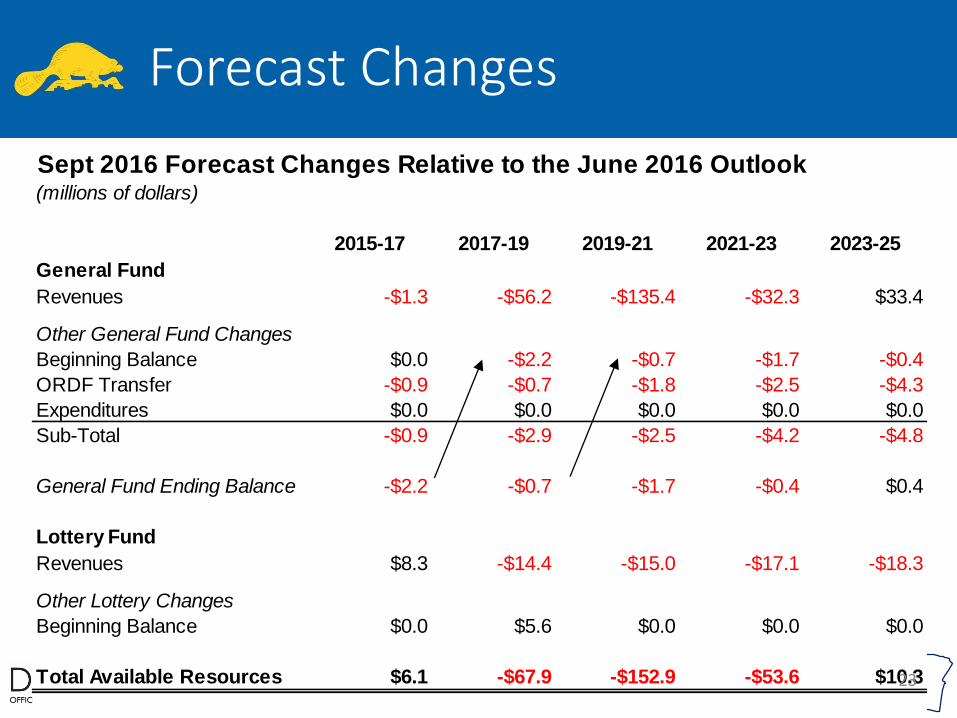
Sept 2016 Forecast Changes Relative to the June 2016 Outlook(millions of dollars)
2015-17 2017-19 2019-21 2021-23 2023-25
General Fund
Revenues -$1.3 -$56.2 -$135.4 -$32.3 $33.4
Other General Fund Changes
Beginning Balance $0.0 -$2.2 -$0.7 -$1.7 -$0.4
ORDF Transfer -$0.9 -$0.7 -$1.8 -$2.5 -$4.3
Expenditures $0.0 $0.0 $0.0 $0.0 $0.0
Sub-Total -$0.9 -$2.9 -$2.5 -$4.2 -$4.8
General Fund Ending Balance -$2.2 -$0.7 -$1.7 -$0.4 $0.4
Lottery Fund
Revenues $8.3 -$14.4 -$15.0 -$17.1 -$18.3
Other Lottery Changes
Beginning Balance $0.0 $5.6 $0.0 $0.0 $0.0
Total Available Resources $6.1 -$67.9 -$152.9 -$53.6 $10.3
Forecast Changes
23
OFFICE OF ECONOMIC ANALYSIS
2424
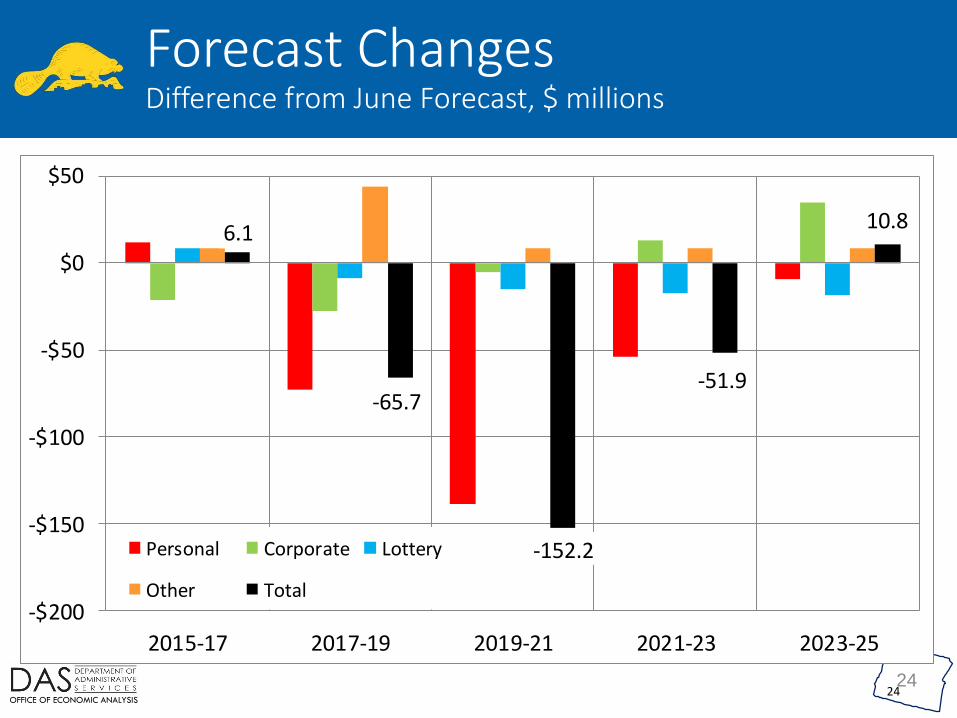
Forecast ChangesDifference from June Forecast, $ millions
6.1
-65.7
-152.2
-51.9
10.8
-$200
-$150
-$100
-$50
$0
$50
2015-17 2017-19 2019-21 2021-23 2023-25
Personal Corporate Lottery
Other Total
OFFICE OF ECONOMIC ANALYSIS
2525
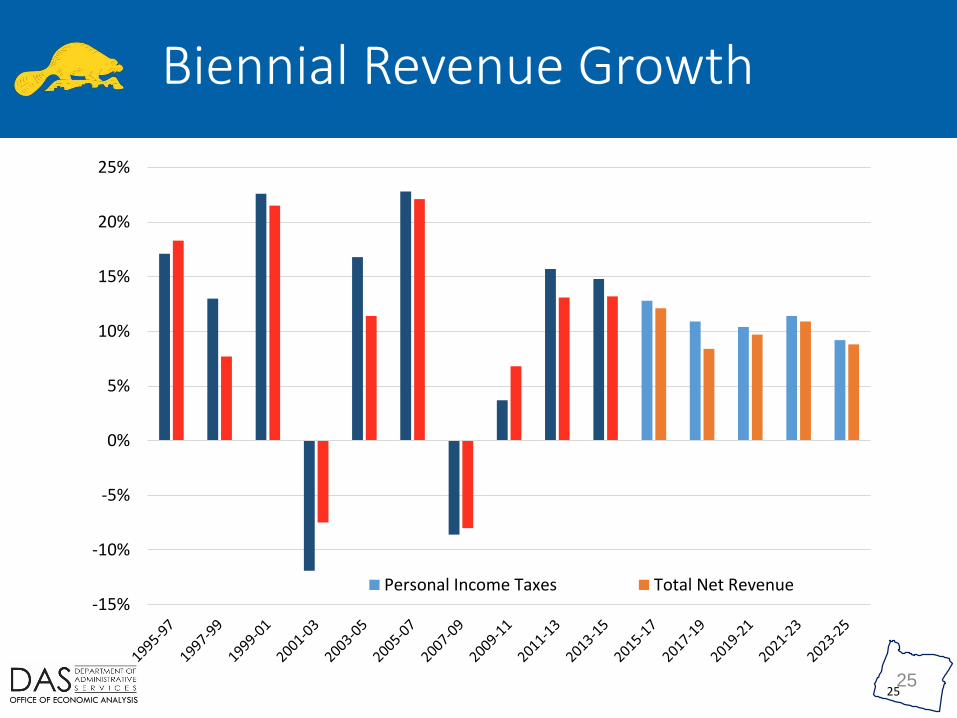
Biennial Revenue Growth
-15%
-10%
-5%
0%
5%
10%
15%
20%
25%
Personal Income Taxes Total Net Revenue
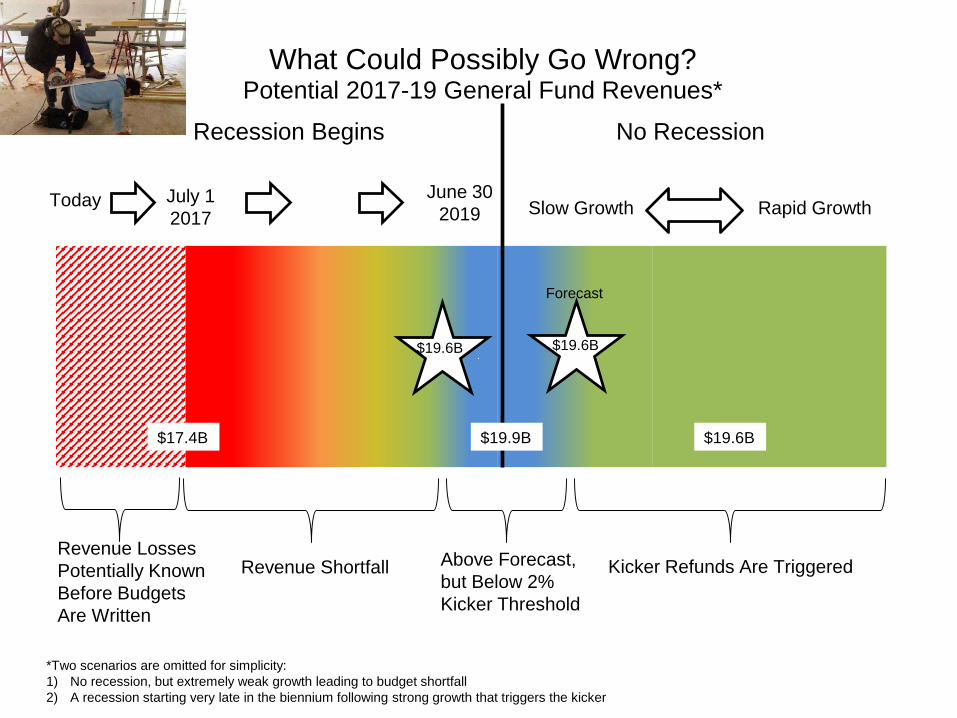
What Could Possibly Go Wrong?Potential 2017-19 General Fund Revenues*
No Recession
Slow Growth Rapid Growth Today July 1
2017
June 30
2019
$19.6B
$19.6B$19.9B$17.4B
Kicker Refunds Are Triggered Above Forecast,
but Below 2%
Kicker Threshold
Revenue ShortfallRevenue Losses
Potentially Known
Before Budgets
Are Written
$19.6B
*Two scenarios are omitted for simplicity:
1) No recession, but extremely weak growth leading to budget shortfall
2) A recession starting very late in the biennium following strong growth that triggers the kicker
Recession Begins
Forecast
OFFICE OF ECONOMIC ANALYSIS
27
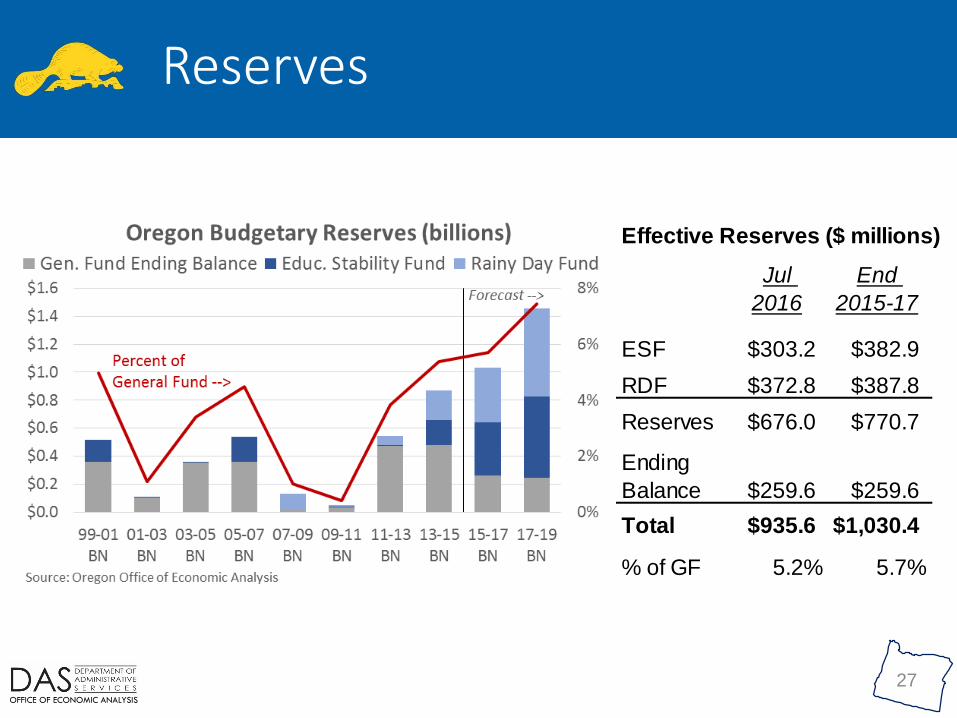
Reserves
Effective Reserves ($ millions)
Jul
2016
End
2015-17
ESF $303.2 $382.9
RDF $372.8 $387.8
Reserves $676.0 $770.7
Ending
Balance $259.6 $259.6
Total $935.6 $1,030.4
% of GF 5.2% 5.7%
OFFICE OF ECONOMIC ANALYSIS
28
For More Information
Standard Contact:
155 Cottage Street NE
Salem, OR 97301
(503) 378-3405
www.oregon.gov/das/oea
Social Media:
www.OregonEconomicAnalysis.com
@OR_EconAnalysis