Oregon Economic and Revenue Forecast · 16.02.2018 · Oregon Economic and Revenue Forecast ... The...
70
Oregon Economic and Revenue Forecast March 2018 Volume XXXVIII, No. 1 Release Date: February 16, 2018 Katy Coba Kate Brown Prepared By: Chief Operating Officer Governor Office of Economic Analysis DAS Director Department of Administrative Services
Transcript of Oregon Economic and Revenue Forecast · 16.02.2018 · Oregon Economic and Revenue Forecast ... The...
Oregon Economic and
Revenue Forecast
March 2018
Volume XXXVIII, No. 1
Release Date: February 16, 2018
Katy Coba Kate Brown Prepared By:
Chief Operating Officer Governor Office of Economic Analysis
DAS Director Department of Administrative Services

2
Department of Administrative Services Katy Coba
DAS Director Chief Operating Officer
Office of Economic Analysis
Mark McMullen, State Economist
Josh Lehner, Senior Economist
Kanhaiya Vaidya, Senior Demographer
Michael Kennedy, Senior Economist
http://oregon.gov/DAS/OEA
http://oregoneconomicanalysis.com
http://twitter.com/OR_EconAnalysis
3
Foreword
This document contains the Oregon economic and revenue forecasts. The Oregon economic forecast is published
to provide information to planners and policy makers in state agencies and private organizations for use in their
decision making processes. The Oregon revenue forecast is published to open the revenue forecasting process to
public review. It is the basis for much of the budgeting in state government.
The report is issued four times a year; in March, June, September, and December.
The economic model assumptions and results are reviewed by the Department of Administrative Services
Economic Advisory Committee and by the Governor's Council of Economic Advisors. The Department of
Administrative Services Economic Advisory Committee consists of 15 economists employed by state agencies,
while the Governor's Council of Economic Advisors is a group of 12 economists from academia, finance, utilities,
and industry.
Members of the Economic Advisory Committee and the Governor's Council of Economic Advisors provide a two-
way flow of information. The Department of Administrative Services makes preliminary forecasts and receives
feedback on the reasonableness of such forecasts and assumptions employed. After the discussion of the
preliminary forecast, the Department of Administrative Services makes a final forecast using the suggestions and
comments made by the two reviewing committees.
The results from the economic model are in turn used to provide a preliminary forecast for state tax revenues.
The preliminary results are reviewed by the Council of Revenue Forecast Advisors. The Council of Revenue
Forecast Advisors consists of 15 specialists with backgrounds in accounting, financial planning, and economics.
Members bring specific specialties in tax issues and represent private practices, accounting firms, corporations,
government (Oregon Department of Revenue and Legislative Revenue Office), and the Governor’s Council of
Economic Advisors. After discussion of the preliminary revenue forecast, the Department of Administrative
Services makes the final revenue forecast using the suggestions and comments made by the reviewing committee.
Readers who have questions or wish to submit suggestions may contact the Office of Economic Analysis by
telephone at 503-378-3405.
Katy Coba
DAS Director
Chief Operating Officer
4
Table of Contents
EXECUTIVE SUMMARY .………………………………………….……...…….…….....…………….. 1
ECONOMIC OUTLOOK ……………………………………………………………….……………….. 2
U.S. Economy ……………………………………………………………..….……………………. 2
Oregon Economy ……………………………………………………………...…………………… 4
Oregon Labor Market …………………………………………….……………..……….............. 6
Leading Indicators ……………………………………………………………..………………….. 9
Short-term Outlook ………………………………………………………………..………………. 10
Forecast Risks ………………………………………………………………..…………............... 13
Alternative Scenarios ………………………………………………………..……………………. 15
Extended Outlook ……………………………………………………………..…………………… 16
Regional Trends ……………………………………………..…………………………………….. 19
State Comparisons ………………………………………………………………………………… 21
REVENUE OUTLOOK ………………………………………………………………………………….. 22
General Fund Revenues, 2017-19 ………………………..…………………………………….. 25
Extended Outlook ………………………………………..………………………………………… 27
Tax Law Assumptions …………………………………..……………………………….............. 27
Alternative Scenarios ……………………………………..………………………………………. 29
Lottery Outlook …………………………………………..……………………………….............. 29
Budgetary Reserves …………………………………..………………………..………............... 32
POPULATION AND DEMOGRAPHIC OUTLOOK ………………………………………………….. 37
APPENDIX A: ECONOMIC …………………………………………………………………………….. 40
APPENDIX B: REVENUE ………………………………………………………………….................. 48
APPENDIX C: DEMOGRAPHIC ………….……………………………………………….................. 62
EXECUTIVE SUMMARY
March 2018
The U.S. economy continues to perform well. Economic growth has picked up in recent quarters and job gains
remain strong enough to pull down the unemployment rate even as more individuals are looking for a job. More
importantly the near-term prospects for economic growth are good. The business cycle is not yet waning. The
tight labor market drives wage growth higher. And as the economy approaches capacity, inflation is set to rise
after five years running below target. From this relatively strong cyclical vantage point, the recently passed Tax
Cut and Jobs Act by the federal government will boost near-term growth even further. However, longer-run
forecasts remain relatively unchanged, in part due to the temporary and expiring provisions in the legislation.
In Oregon, the outlook remains bright as the economy continues to hit the sweet spot. Employment growth is
more than enough to meet population gains and to absorb the workers coming back into the labor market.
Wages are rising faster than in the typical state, as are household incomes. That said, employment and
measures of economic wages have come in below expectations in the second half of 2017. From this somewhat
lower starting point, the modest economic boosts provided by federal tax changes results in a relatively
unchanged forecast overall.
Since the September 2017 forecast, two significant factors have come into play that have changed Oregon’s
General Fund revenue outlook. The first factor, the new federal tax law (Tax Cuts and Jobs Act), stands to reduce
state revenues in the near term, and will boost them in future budget periods. The second factor, a potential
equity market correction, draws down revenues after a short delay.
Oregon’s tax collections are tied to federal tax law both directly and indirectly. The starting point for calculating
Oregon income tax is taxable income from a filer’s federal return. As a result, most federal changes to what is
defined as income, or to what can be deducted or excluded from it, directly feed into Oregon tax collections.
The new 20% federal deduction for pass-through income will feed directly into lower Oregon taxable income,
and reduce Oregon revenues.
Ignoring behavioral responses and other dynamic effects for now, static impact estimates suggest that Oregon’s
General Fund revenues will be reduced by more than $200 million in the current biennium due to TCJA. This
impact reverses during the next decade, increasing revenues by more than $200 million per biennium. Several
provisions contribute to this pattern, including accelerated depreciation (expensing), new inflation factors,
expiring individual provisions and repatriated income from multinational corporations. Due to a quirk in current
tax law, multinational repatriation represents a near-term revenue loss in Oregon rather than a windfall.
These static revenue impact estimates only tell part of the story, however, as households, firms and tax
professionals are all certain to change their behavior in light of the new rules of the game. Many of these
behavioral responses, including the macroeconomic effects, will serve to mute the impact of TJCA on Oregon
General Fund collections. While changes in the timing of tax payments are already evident, it will take some
time before it becomes clear how many taxpayers will change their filing status in light of TJCA provisions.
Finally, Oregon’s General Fund is sensitive to equity prices, given our dependence on personal income taxes. The
performance of equity markets feed into personal and corporate tax liability in many complex ways, but capital
gains are the largest single piece. Although housing wealth is playing a larger role in driving taxable capital gains
during the current business cycle than in the past, earnings and losses in stock markets account for the lion’s
share of movements in taxable capital gains in the typical year.
2
ECONOMIC OUTLOOK
Economic Summary
The U.S. economy continues to perform well. Economic growth has picked up in recent quarters and job gains
remain strong enough to pull down the unemployment rate even as more individuals are looking for a job. More
importantly the near-term prospects for economic growth are good. The business cycle is not yet waning. The
tight labor market drives wage growth higher. And as the economy approaches capacity, inflation is set to rise
after five years running below target. From this relatively strong cyclical vantage point, the recently passed Tax
Cut and Jobs Act by the federal government will boost near-term growth even further. However, longer-run
forecasts remain relatively unchanged, in part due to the temporary and expiring provisions in the legislation.
In Oregon, the outlook remains bright as the economy continues to hit the sweet spot. Employment growth is
more than enough to meet population gains and to absorb the workers coming back into the labor market.
Wages are rising faster than in the typical state, as are household incomes. That said, employment and
measures of economic wages have come in below expectations in the second half of 2017. From this somewhat
lower starting point, the modest economic boosts provided by federal tax changes results in a relatively
unchanged forecast overall.
U.S. Economy
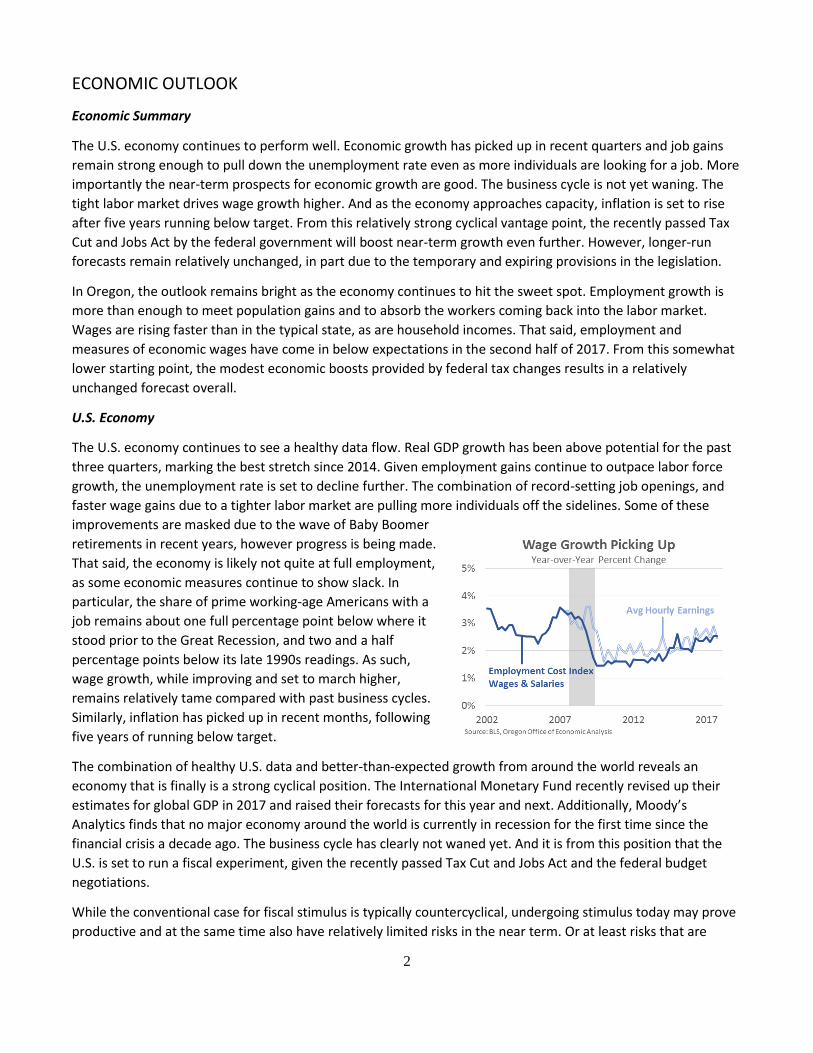
The U.S. economy continues to see a healthy data flow. Real GDP growth has been above potential for the past
three quarters, marking the best stretch since 2014. Given employment gains continue to outpace labor force
growth, the unemployment rate is set to decline further. The combination of record-setting job openings, and
faster wage gains due to a tighter labor market are pulling more individuals off the sidelines. Some of these
improvements are masked due to the wave of Baby Boomer
retirements in recent years, however progress is being made.
That said, the economy is likely not quite at full employment,
as some economic measures continue to show slack. In
particular, the share of prime working-age Americans with a
job remains about one full percentage point below where it
stood prior to the Great Recession, and two and a half
percentage points below its late 1990s readings. As such,
wage growth, while improving and set to march higher,
remains relatively tame compared with past business cycles.
Similarly, inflation has picked up in recent months, following
five years of running below target.
The combination of healthy U.S. data and better-than-expected growth from around the world reveals an
economy that is finally is a strong cyclical position. The International Monetary Fund recently revised up their
estimates for global GDP in 2017 and raised their forecasts for this year and next. Additionally, Moody’s
Analytics finds that no major economy around the world is currently in recession for the first time since the
financial crisis a decade ago. The business cycle has clearly not waned yet. And it is from this position that the
U.S. is set to run a fiscal experiment, given the recently passed Tax Cut and Jobs Act and the federal budget
negotiations.
While the conventional case for fiscal stimulus is typically countercyclical, undergoing stimulus today may prove
productive and at the same time also have relatively limited risks in the near term. Or at least risks that are
3
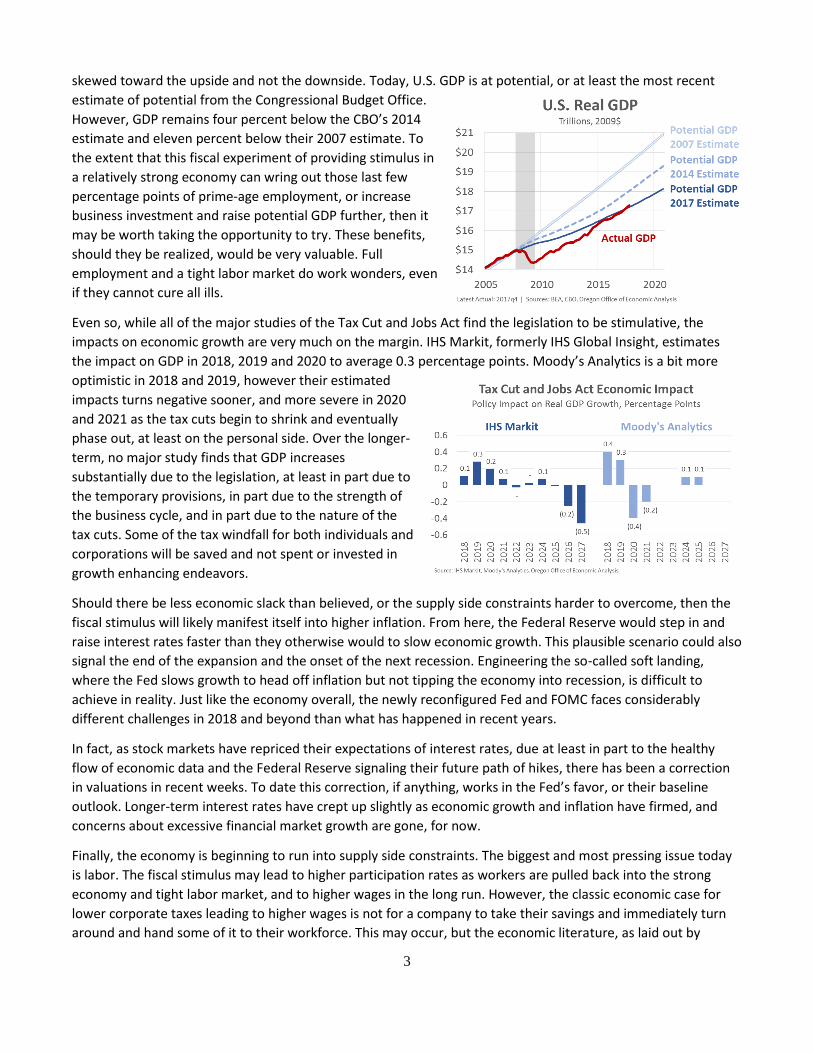
skewed toward the upside and not the downside. Today, U.S. GDP is at potential, or at least the most recent
estimate of potential from the Congressional Budget Office.
However, GDP remains four percent below the CBO’s 2014
estimate and eleven percent below their 2007 estimate. To
the extent that this fiscal experiment of providing stimulus in
a relatively strong economy can wring out those last few
percentage points of prime-age employment, or increase
business investment and raise potential GDP further, then it
may be worth taking the opportunity to try. These benefits,
should they be realized, would be very valuable. Full
employment and a tight labor market do work wonders, even
if they cannot cure all ills.
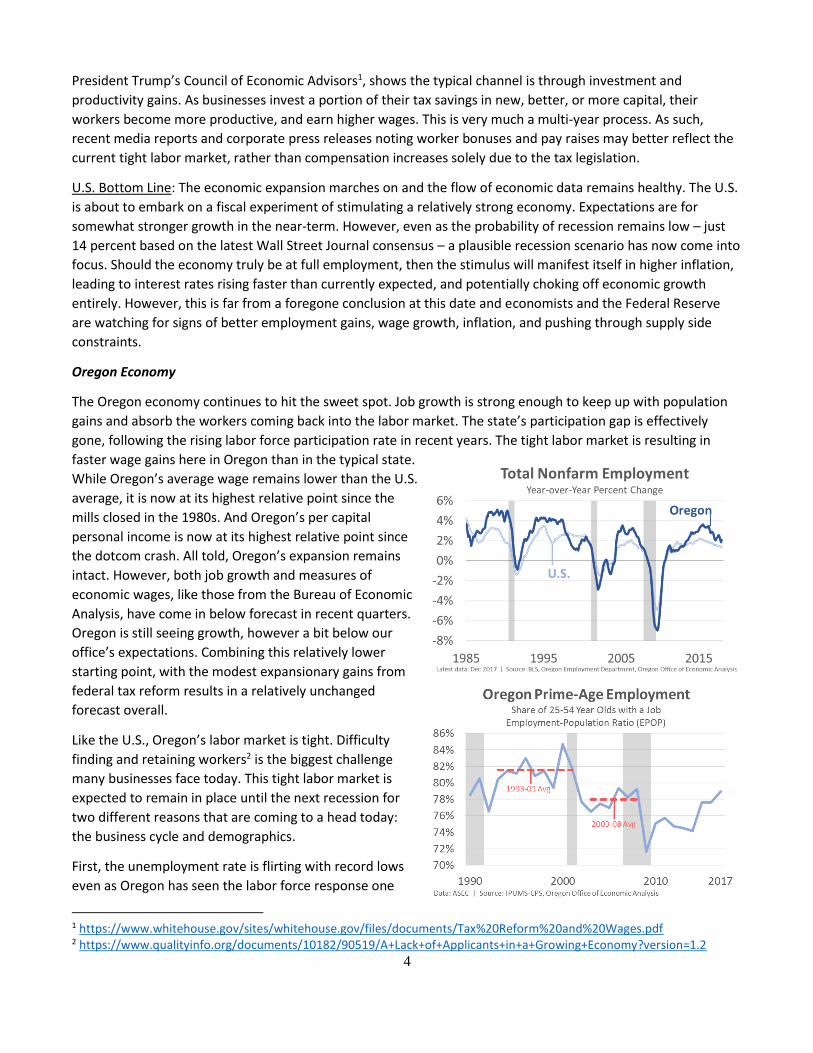
Even so, while all of the major studies of the Tax Cut and Jobs Act find the legislation to be stimulative, the
impacts on economic growth are very much on the margin. IHS Markit, formerly IHS Global Insight, estimates
the impact on GDP in 2018, 2019 and 2020 to average 0.3 percentage points. Moody’s Analytics is a bit more
optimistic in 2018 and 2019, however their estimated
impacts turns negative sooner, and more severe in 2020
and 2021 as the tax cuts begin to shrink and eventually
phase out, at least on the personal side. Over the longer-
term, no major study finds that GDP increases
substantially due to the legislation, at least in part due to
the temporary provisions, in part due to the strength of
the business cycle, and in part due to the nature of the
tax cuts. Some of the tax windfall for both individuals and
corporations will be saved and not spent or invested in
growth enhancing endeavors.
Should there be less economic slack than believed, or the supply side constraints harder to overcome, then the
fiscal stimulus will likely manifest itself into higher inflation. From here, the Federal Reserve would step in and
raise interest rates faster than they otherwise would to slow economic growth. This plausible scenario could also
signal the end of the expansion and the onset of the next recession. Engineering the so-called soft landing,
where the Fed slows growth to head off inflation but not tipping the economy into recession, is difficult to
achieve in reality. Just like the economy overall, the newly reconfigured Fed and FOMC faces considerably
different challenges in 2018 and beyond than what has happened in recent years.
In fact, as stock markets have repriced their expectations of interest rates, due at least in part to the healthy
flow of economic data and the Federal Reserve signaling their future path of hikes, there has been a correction
in valuations in recent weeks. To date this correction, if anything, works in the Fed’s favor, or their baseline
outlook. Longer-term interest rates have crept up slightly as economic growth and inflation have firmed, and
concerns about excessive financial market growth are gone, for now.
Finally, the economy is beginning to run into supply side constraints. The biggest and most pressing issue today
is labor. The fiscal stimulus may lead to higher participation rates as workers are pulled back into the strong
economy and tight labor market, and to higher wages in the long run. However, the classic economic case for
lower corporate taxes leading to higher wages is not for a company to take their savings and immediately turn
around and hand some of it to their workforce. This may occur, but the economic literature, as laid out by
4
President Trump’s Council of Economic Advisors1, shows the typical channel is through investment and
productivity gains. As businesses invest a portion of their tax savings in new, better, or more capital, their
workers become more productive, and earn higher wages. This is very much a multi-year process. As such,
recent media reports and corporate press releases noting worker bonuses and pay raises may better reflect the
current tight labor market, rather than compensation increases solely due to the tax legislation.
U.S. Bottom Line: The economic expansion marches on and the flow of economic data remains healthy. The U.S.
is about to embark on a fiscal experiment of stimulating a relatively strong economy. Expectations are for
somewhat stronger growth in the near-term. However, even as the probability of recession remains low – just
14 percent based on the latest Wall Street Journal consensus – a plausible recession scenario has now come into
focus. Should the economy truly be at full employment, then the stimulus will manifest itself in higher inflation,
leading to interest rates rising faster than currently expected, and potentially choking off economic growth
entirely. However, this is far from a foregone conclusion at this date and economists and the Federal Reserve
are watching for signs of better employment gains, wage growth, inflation, and pushing through supply side
constraints.
Oregon Economy
The Oregon economy continues to hit the sweet spot. Job growth is strong enough to keep up with population
gains and absorb the workers coming back into the labor market. The state’s participation gap is effectively
gone, following the rising labor force participation rate in recent years. The tight labor market is resulting in
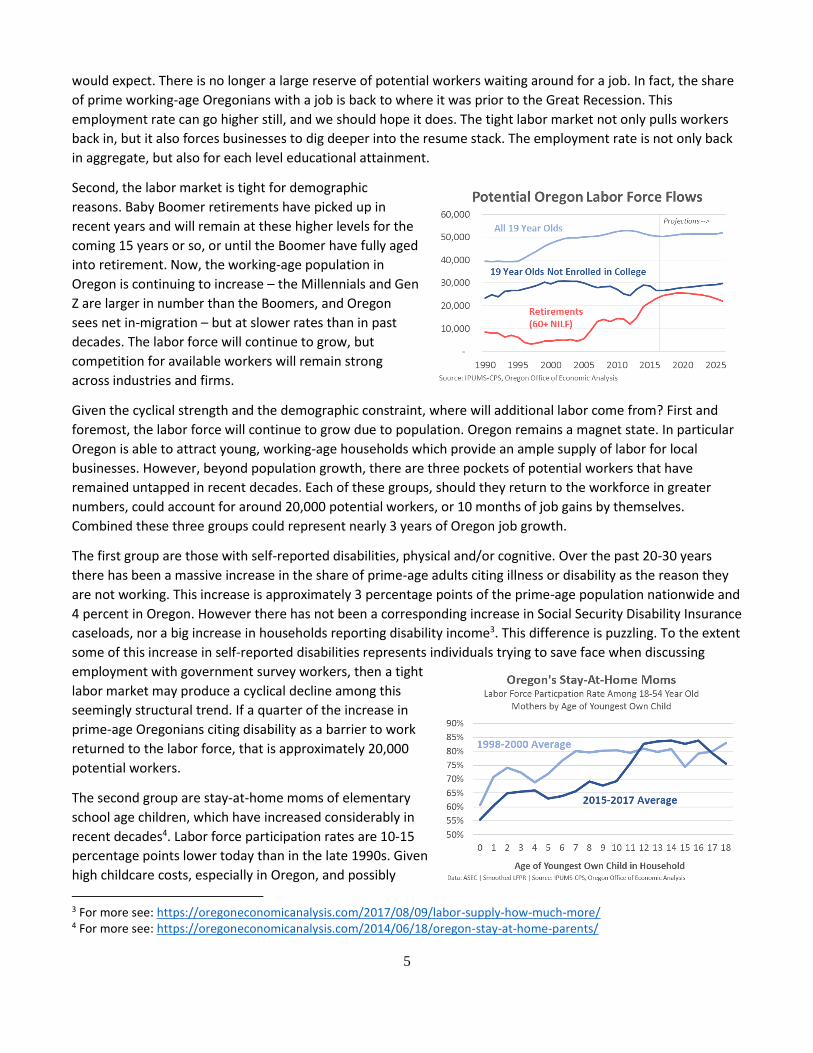
faster wage gains here in Oregon than in the typical state.
While Oregon’s average wage remains lower than the U.S.
average, it is now at its highest relative point since the
mills closed in the 1980s. And Oregon’s per capital
personal income is now at its highest relative point since
the dotcom crash. All told, Oregon’s expansion remains
intact. However, both job growth and measures of
economic wages, like those from the Bureau of Economic
Analysis, have come in below forecast in recent quarters.
Oregon is still seeing growth, however a bit below our
office’s expectations. Combining this relatively lower
starting point, with the modest expansionary gains from
federal tax reform results in a relatively unchanged
forecast overall.
Like the U.S., Oregon’s labor market is tight. Difficulty
finding and retaining workers2 is the biggest challenge
many businesses face today. This tight labor market is
expected to remain in place until the next recession for
two different reasons that are coming to a head today:
the business cycle and demographics.
First, the unemployment rate is flirting with record lows
even as Oregon has seen the labor force response one
1 https://www.whitehouse.gov/sites/whitehouse.gov/files/documents/Tax%20Reform%20and%20Wages.pdf 2 https://www.qualityinfo.org/documents/10182/90519/A+Lack+of+Applicants+in+a+Growing+Economy?version=1.2
5
would expect. There is no longer a large reserve of potential workers waiting around for a job. In fact, the share
of prime working-age Oregonians with a job is back to where it was prior to the Great Recession. This
employment rate can go higher still, and we should hope it does. The tight labor market not only pulls workers
back in, but it also forces businesses to dig deeper into the resume stack. The employment rate is not only back
in aggregate, but also for each level educational attainment.
Second, the labor market is tight for demographic
reasons. Baby Boomer retirements have picked up in
recent years and will remain at these higher levels for the
coming 15 years or so, or until the Boomer have fully aged
into retirement. Now, the working-age population in
Oregon is continuing to increase – the Millennials and Gen
Z are larger in number than the Boomers, and Oregon
sees net in-migration – but at slower rates than in past
decades. The labor force will continue to grow, but
competition for available workers will remain strong
across industries and firms.
Given the cyclical strength and the demographic constraint, where will additional labor come from? First and
foremost, the labor force will continue to grow due to population. Oregon remains a magnet state. In particular
Oregon is able to attract young, working-age households which provide an ample supply of labor for local
businesses. However, beyond population growth, there are three pockets of potential workers that have
remained untapped in recent decades. Each of these groups, should they return to the workforce in greater
numbers, could account for around 20,000 potential workers, or 10 months of job gains by themselves.
Combined these three groups could represent nearly 3 years of Oregon job growth.
The first group are those with self-reported disabilities, physical and/or cognitive. Over the past 20-30 years
there has been a massive increase in the share of prime-age adults citing illness or disability as the reason they
are not working. This increase is approximately 3 percentage points of the prime-age population nationwide and
4 percent in Oregon. However there has not been a corresponding increase in Social Security Disability Insurance
caseloads, nor a big increase in households reporting disability income3. This difference is puzzling. To the extent
some of this increase in self-reported disabilities represents individuals trying to save face when discussing
employment with government survey workers, then a tight
labor market may produce a cyclical decline among this
seemingly structural trend. If a quarter of the increase in
prime-age Oregonians citing disability as a barrier to work
returned to the labor force, that is approximately 20,000
potential workers.
The second group are stay-at-home moms of elementary
school age children, which have increased considerably in
recent decades4. Labor force participation rates are 10-15
percentage points lower today than in the late 1990s. Given
high childcare costs, especially in Oregon, and possibly
3 For more see: https://oregoneconomicanalysis.com/2017/08/09/labor-supply-how-much-more/ 4 For more see: https://oregoneconomicanalysis.com/2014/06/18/oregon-stay-at-home-parents/
6
family leave practices, it may be unlikely that mothers with newborns or preschoolers will return to the
workforce in greater numbers. However, moms with elementary schoolers may return in a stronger economy.
Today’s elementary school students were all born at the peak of the housing bubble, during the Great
Recession, or in its immediate aftermath. Job opportunities barely existed for anyone looking. It is possible that
today’s middle school and high school students were born long enough ago that their moms were able to stay in
or enter the labor market under better economic conditions. The big unknown, however is just how much of
these participation rate changes are economic related versus broader societal shifts or personal and family
preferences.
The third group are young adults, or teenagers and college-age kids. Participation rates among this population
have fallen around 15 percentage points since the turn of the century. However there was been a corresponding
increase in school enrollment. To the extent that falling participation rates reflected a weak economy with fewer
opportunities for young adults without work experience and fewer skills, then some reversal of these trends in a
strong economy would be expected. This reversal, should it come to pass, means lower enrollments in higher
education, particularly among the more cyclically sensitive institutions like community colleges and trade
schools. Whether or not this would be a good development is an open question. The silver lining to fewer young
adults working today is that when they return to the labor market in the future, they will have additional skills.
However, in a strong economy young adults face better employment prospects and higher wages, thus raising
the opportunity costs of attending college. Already, enrollments have fallen across the country in part due to
demographics, in part due to fewer international students choosing to come to America, and in part due to the
stronger economy.
Oregon Bottom Line: All told, the current outlook for Oregon remains positive. The labor market is tight due to
the strong economy and the demographic crunch. Oregon is expected to continue to transition down to a more
sustainable rate of growth over the medium term. However, boosts from federal fiscal policy raise the near-term
outlook slightly even as employment and wages have come in a bit below expectations to end 2017. Between
today and the next recession, Oregon is expected to continue to hit the sweet spot. Workers are being pulled
back into the labor market, household incomes are rising and poverty rates are falling.
Oregon’s Labor Market
The Office of Economic Analysis examines four main sources for jobs data: the monthly payroll employment
survey, the monthly household survey, monthly withholding tax receipts and the quarterly census of
employment and wages. Right now all four measures of the labor market are improving. Jobs are being added,
albeit at a slower rate. Wages are rising, both in aggregate and for each worker. The unemployment is under
what can be considered full employment for Oregon.
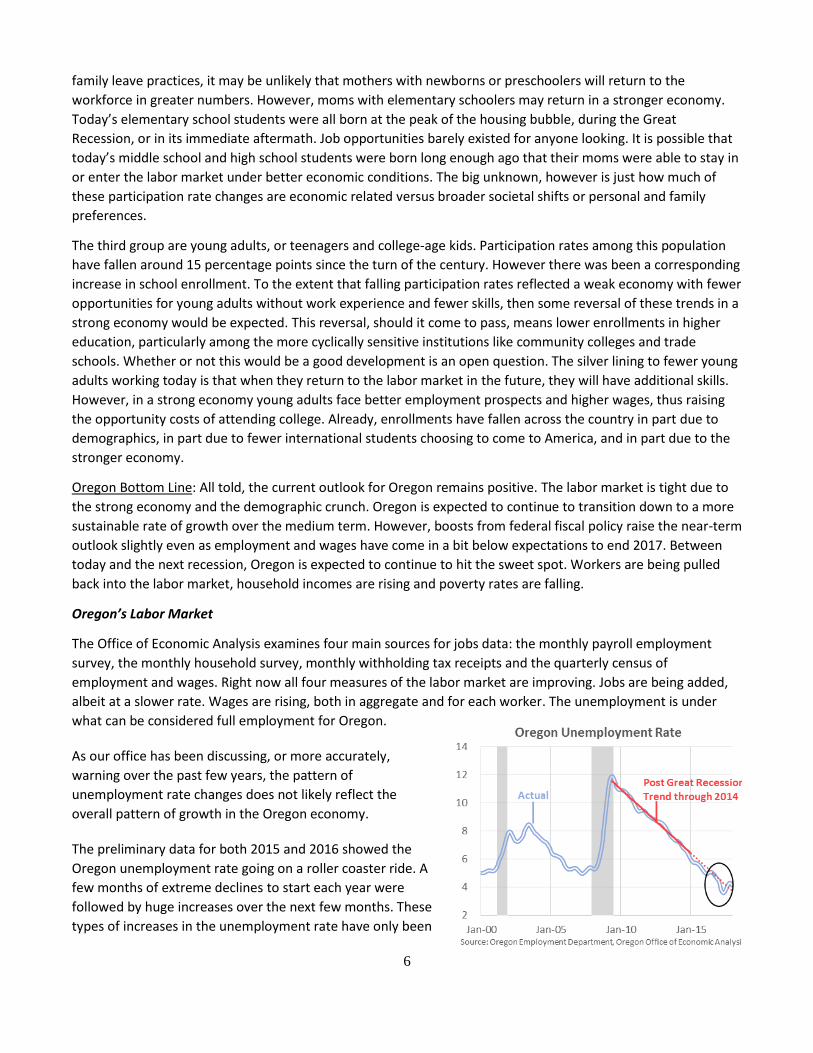
As our office has been discussing, or more accurately,
warning over the past few years, the pattern of
unemployment rate changes does not likely reflect the
overall pattern of growth in the Oregon economy.
The preliminary data for both 2015 and 2016 showed the
Oregon unemployment rate going on a roller coaster ride. A
few months of extreme declines to start each year were
followed by huge increases over the next few months. These
types of increases in the unemployment rate have only been
7
seen during recessions. These wild swings have largely been revised away each year during the annual
benchmarking process (i.e. revisions). The overall pattern of Oregon’s unemployment rate has been a fairly
steady decline since the depths of the Great Recession.
However, it must be noted that once again Oregon’s unemployment rate plunged again in early 2017 followed
by increases over the summer months. If the recent past is any guide, expect the month to month changes to be
moderated once the data is revised in early 2018 (March). That said, Oregon’s unemployment has continued to
decline in 2018, particularly relative to 2017.
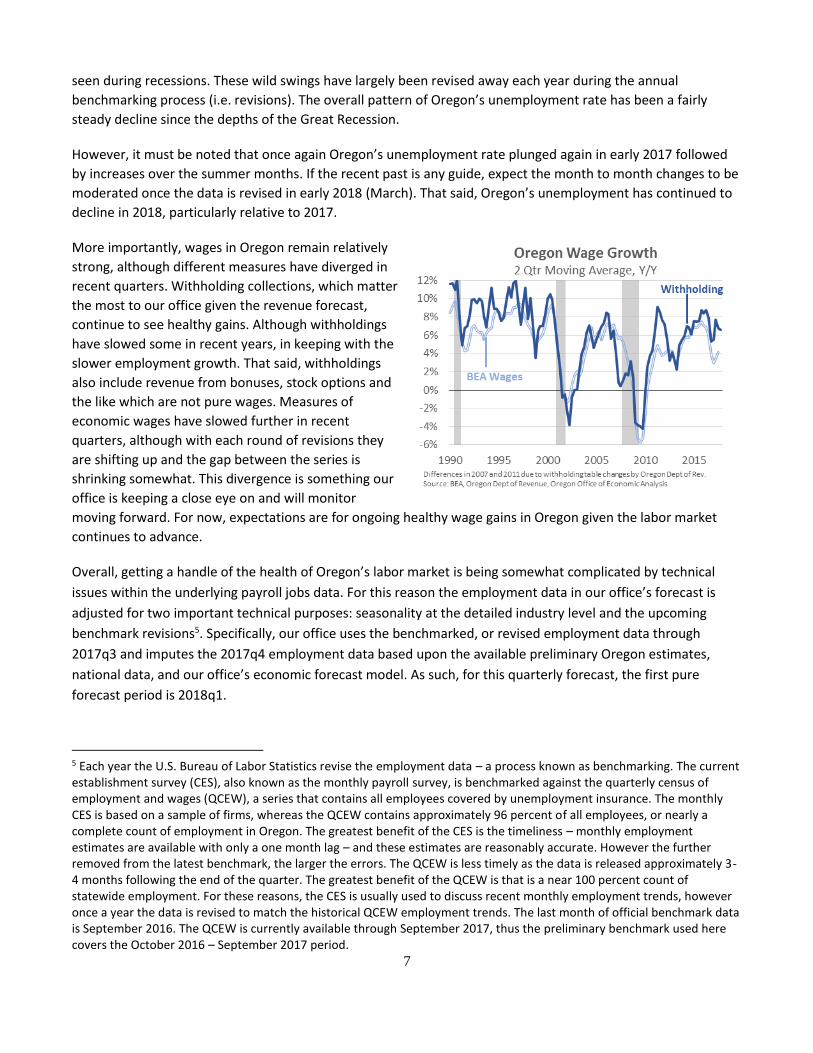
More importantly, wages in Oregon remain relatively
strong, although different measures have diverged in
recent quarters. Withholding collections, which matter
the most to our office given the revenue forecast,
continue to see healthy gains. Although withholdings
have slowed some in recent years, in keeping with the
slower employment growth. That said, withholdings
also include revenue from bonuses, stock options and
the like which are not pure wages. Measures of
economic wages have slowed further in recent
quarters, although with each round of revisions they
are shifting up and the gap between the series is
shrinking somewhat. This divergence is something our
office is keeping a close eye on and will monitor
moving forward. For now, expectations are for ongoing healthy wage gains in Oregon given the labor market
continues to advance.
Overall, getting a handle of the health of Oregon’s labor market is being somewhat complicated by technical
issues within the underlying payroll jobs data. For this reason the employment data in our office’s forecast is
adjusted for two important technical purposes: seasonality at the detailed industry level and the upcoming
benchmark revisions5. Specifically, our office uses the benchmarked, or revised employment data through
2017q3 and imputes the 2017q4 employment data based upon the available preliminary Oregon estimates,
national data, and our office’s economic forecast model. As such, for this quarterly forecast, the first pure
forecast period is 2018q1.
5 Each year the U.S. Bureau of Labor Statistics revise the employment data – a process known as benchmarking. The current establishment survey (CES), also known as the monthly payroll survey, is benchmarked against the quarterly census of employment and wages (QCEW), a series that contains all employees covered by unemployment insurance. The monthly CES is based on a sample of firms, whereas the QCEW contains approximately 96 percent of all employees, or nearly a complete count of employment in Oregon. The greatest benefit of the CES is the timeliness – monthly employment estimates are available with only a one month lag – and these estimates are reasonably accurate. However the further removed from the latest benchmark, the larger the errors. The QCEW is less timely as the data is released approximately 3-4 months following the end of the quarter. The greatest benefit of the QCEW is that is a near 100 percent count of statewide employment. For these reasons, the CES is usually used to discuss recent monthly employment trends, however once a year the data is revised to match the historical QCEW employment trends. The last month of official benchmark data is September 2016. The QCEW is currently available through September 2017, thus the preliminary benchmark used here covers the October 2016 – September 2017 period.
8
In the fourth quarter, total nonfarm employment increased 2.0 percent over the past year with the private
sector growing at 2.3 percent and the public sector at 0.9 percent. These rates of growth are a clear step down
from the full-throttle rates seen in recent years, however still remain faster than needed to keep pace with
population gains so far.
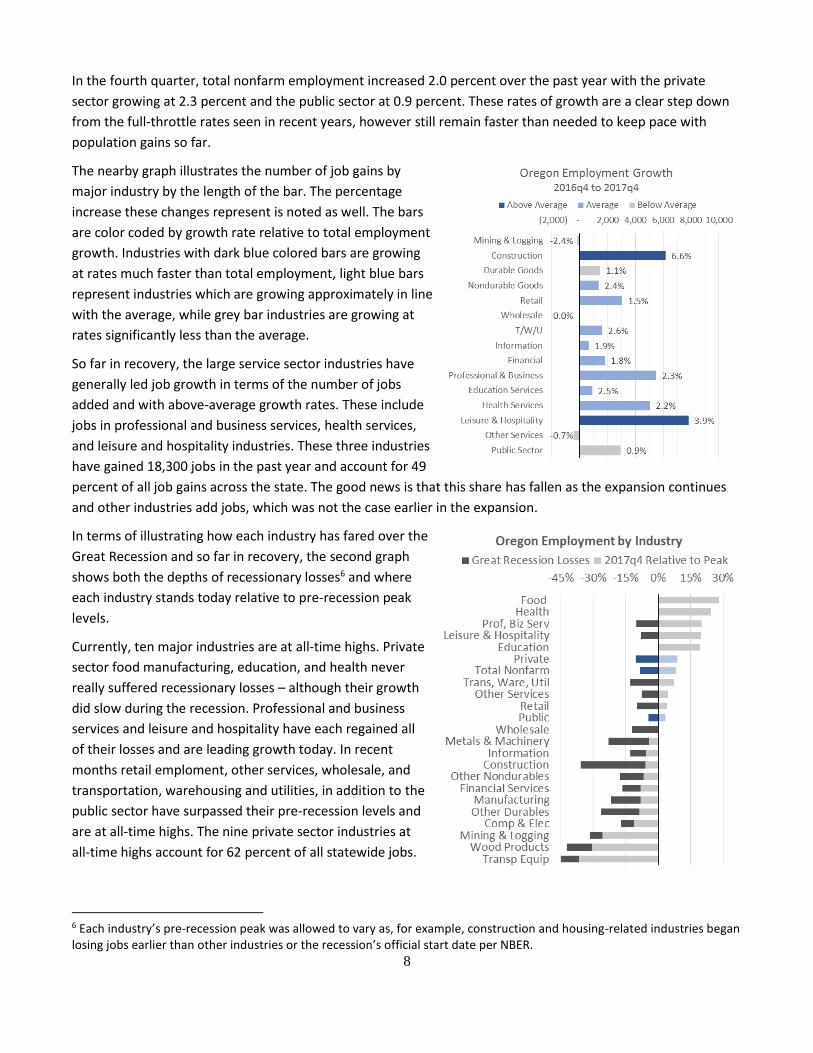
The nearby graph illustrates the number of job gains by
major industry by the length of the bar. The percentage
increase these changes represent is noted as well. The bars
are color coded by growth rate relative to total employment
growth. Industries with dark blue colored bars are growing
at rates much faster than total employment, light blue bars
represent industries which are growing approximately in line
with the average, while grey bar industries are growing at
rates significantly less than the average.
So far in recovery, the large service sector industries have
generally led job growth in terms of the number of jobs
added and with above-average growth rates. These include
jobs in professional and business services, health services,
and leisure and hospitality industries. These three industries
have gained 18,300 jobs in the past year and account for 49
percent of all job gains across the state. The good news is that this share has fallen as the expansion continues
and other industries add jobs, which was not the case earlier in the expansion.
In terms of illustrating how each industry has fared over the
Great Recession and so far in recovery, the second graph
shows both the depths of recessionary losses6 and where
each industry stands today relative to pre-recession peak
levels.
Currently, ten major industries are at all-time highs. Private
sector food manufacturing, education, and health never
really suffered recessionary losses – although their growth
did slow during the recession. Professional and business
services and leisure and hospitality have each regained all
of their losses and are leading growth today. In recent
months retail emploment, other services, wholesale, and
transportation, warehousing and utilities, in addition to the
public sector have surpassed their pre-recession levels and
are at all-time highs. The nine private sector industries at
all-time highs account for 62 percent of all statewide jobs.
6 Each industry’s pre-recession peak was allowed to vary as, for example, construction and housing-related industries began losing jobs earlier than other industries or the recession’s official start date per NBER.
9
The public sector accounts for an additional 17 percent of all jobs.
With the Great Recession being characterized by a housing bubble, it is no surprise to see wood products,
construction, mining and logging and financial services (losses are mostly real estate agents) among the hardest
hit industries. These housing and related sectors are now recovering, although they still have much ground to
make up. Transportation equipment manufacturing suffered the worst job cuts and is likely a structural decline
due to the RV industry’s collapse7. With that being said, the subsectors tied to aerospace are doing better and
the ship and boat building subsector is growing again. Metals and machinery manufacturing, along with mining
and logging, have shown the largest improvements since the depths of the recession.
Coming off such a deep recession, goods-producing industries exhibited stronger growth than in past cycles.
While all manufacturing subsectors have seen some growth, they are unlikely to fully regain all of their lost jobs.
The good news, certainly in the short-term, is that much of the manufacturing sector has returned to growth in
recent months following declines a year ago. All told, Oregon manufacturers typically outperform those in other
states, in large part due to the local industry make-up. Oregon does not rely upon old auto makers or textile
mills. The state’s manufacturing industry is comprised of newer technologies like aerospace and
semiconductors. Similarly Oregon’s food processing industry continues to boom.
All told, each of Oregon’s major industries has experienced some growth in recovery, albeit uneven. As the
economy continues to recover there will be net winners and net losers when it comes to jobs, income and sales.
Business cycles have a way of restructuring the economy.
For additional information on the most recent quarter’s
employment forecast errors, please refer to Table A.1 in
Appendix A.
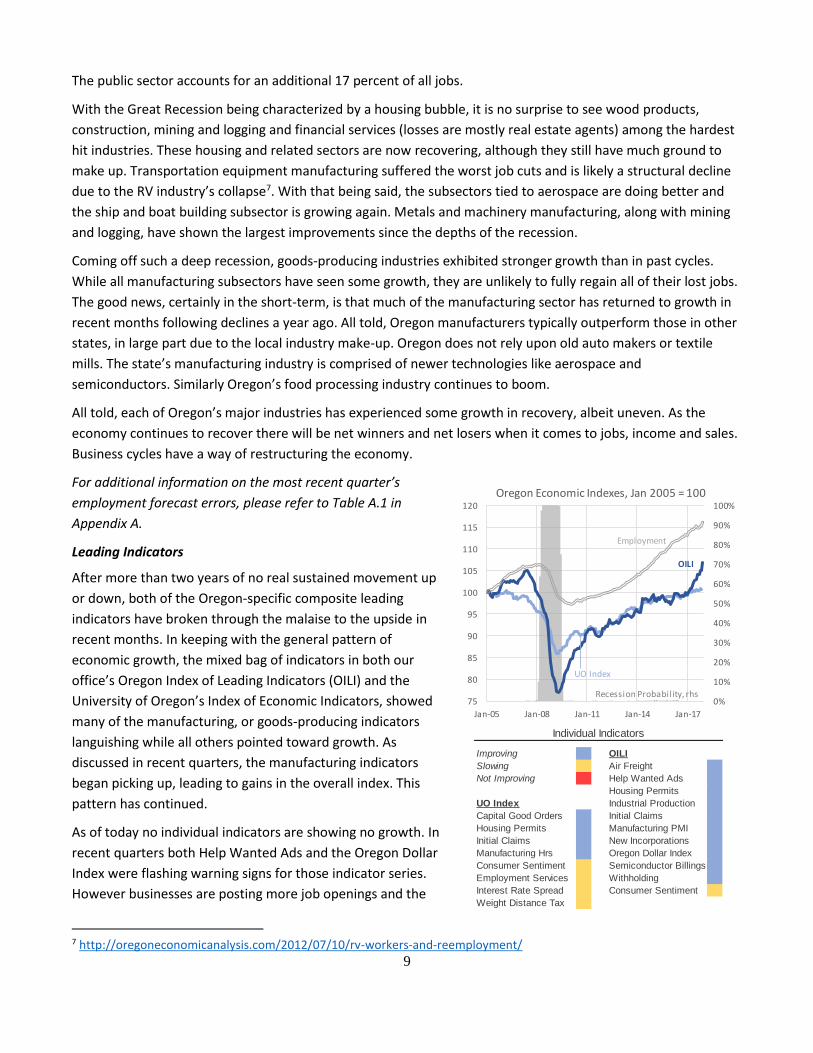
Leading Indicators
After more than two years of no real sustained movement up
or down, both of the Oregon-specific composite leading
indicators have broken through the malaise to the upside in
recent months. In keeping with the general pattern of
economic growth, the mixed bag of indicators in both our
office’s Oregon Index of Leading Indicators (OILI) and the
University of Oregon’s Index of Economic Indicators, showed
many of the manufacturing, or goods-producing indicators
languishing while all others pointed toward growth. As
discussed in recent quarters, the manufacturing indicators
began picking up, leading to gains in the overall index. This
pattern has continued.
As of today no individual indicators are showing no growth. In
recent quarters both Help Wanted Ads and the Oregon Dollar
Index were flashing warning signs for those indicator series.
However businesses are posting more job openings and the
7 http://oregoneconomicanalysis.com/2012/07/10/rv-workers-and-reemployment/
Improving OILI
Slowing Air Freight
Not Improving Help Wanted Ads
Housing Permits
UO Index Industrial Production
Capital Good Orders Initial Claims
Housing Permits Manufacturing PMI
Initial Claims New Incorporations
Manufacturing Hrs Oregon Dollar Index
Consumer Sentiment Semiconductor Billings
Employment Services Withholding
Interest Rate Spread Consumer Sentiment
Weight Distance Tax
Individual Indicators
0%
10%
20%
30%
40%
50%
60%
70%
80%
90%
100%
75
80
85
90
95
100
105
110
115
120
Jan-05 Jan-08 Jan-11 Jan-14 Jan-17
Oregon Economic Indexes, Jan 2005 = 100
Employment
OILI
UO Index
Recession Probability, rhs
10
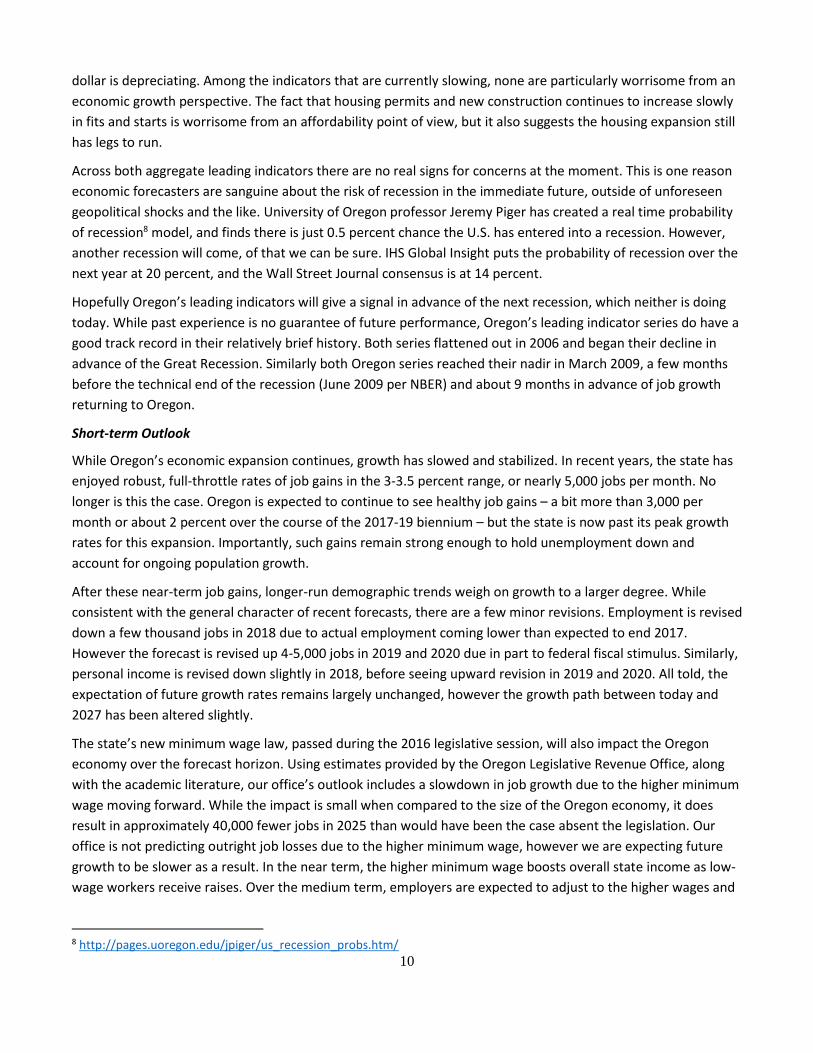
dollar is depreciating. Among the indicators that are currently slowing, none are particularly worrisome from an
economic growth perspective. The fact that housing permits and new construction continues to increase slowly
in fits and starts is worrisome from an affordability point of view, but it also suggests the housing expansion still
has legs to run.
Across both aggregate leading indicators there are no real signs for concerns at the moment. This is one reason
economic forecasters are sanguine about the risk of recession in the immediate future, outside of unforeseen
geopolitical shocks and the like. University of Oregon professor Jeremy Piger has created a real time probability
of recession8 model, and finds there is just 0.5 percent chance the U.S. has entered into a recession. However,
another recession will come, of that we can be sure. IHS Global Insight puts the probability of recession over the
next year at 20 percent, and the Wall Street Journal consensus is at 14 percent.
Hopefully Oregon’s leading indicators will give a signal in advance of the next recession, which neither is doing
today. While past experience is no guarantee of future performance, Oregon’s leading indicator series do have a
good track record in their relatively brief history. Both series flattened out in 2006 and began their decline in
advance of the Great Recession. Similarly both Oregon series reached their nadir in March 2009, a few months
before the technical end of the recession (June 2009 per NBER) and about 9 months in advance of job growth
returning to Oregon.
Short-term Outlook
While Oregon’s economic expansion continues, growth has slowed and stabilized. In recent years, the state has
enjoyed robust, full-throttle rates of job gains in the 3-3.5 percent range, or nearly 5,000 jobs per month. No
longer is this the case. Oregon is expected to continue to see healthy job gains – a bit more than 3,000 per
month or about 2 percent over the course of the 2017-19 biennium – but the state is now past its peak growth
rates for this expansion. Importantly, such gains remain strong enough to hold unemployment down and
account for ongoing population growth.
After these near-term job gains, longer-run demographic trends weigh on growth to a larger degree. While
consistent with the general character of recent forecasts, there are a few minor revisions. Employment is revised
down a few thousand jobs in 2018 due to actual employment coming lower than expected to end 2017.
However the forecast is revised up 4-5,000 jobs in 2019 and 2020 due in part to federal fiscal stimulus. Similarly,
personal income is revised down slightly in 2018, before seeing upward revision in 2019 and 2020. All told, the
expectation of future growth rates remains largely unchanged, however the growth path between today and
2027 has been altered slightly.
The state’s new minimum wage law, passed during the 2016 legislative session, will also impact the Oregon
economy over the forecast horizon. Using estimates provided by the Oregon Legislative Revenue Office, along
with the academic literature, our office’s outlook includes a slowdown in job growth due to the higher minimum
wage moving forward. While the impact is small when compared to the size of the Oregon economy, it does
result in approximately 40,000 fewer jobs in 2025 than would have been the case absent the legislation. Our
office is not predicting outright job losses due to the higher minimum wage, however we are expecting future
growth to be slower as a result. In the near term, the higher minimum wage boosts overall state income as low-
wage workers receive raises. Over the medium term, employers are expected to adjust to the higher wages and
8 http://pages.uoregon.edu/jpiger/us_recession_probs.htm/
11
increase worker productivity, possibly via capital for labor substitutions. Our office has incorporated these
overall effects into the outlook for wages and in the industries which employ the largest numbers of low-wage
workers. These include the obvious like leisure and hospitality, and retail trade, but also health care and food
processing manufacturing, among others.
Should this overall economic outlook come to pass, it will have matched the equivalent of previous expansions
in Oregon. Given demographic trends today, particularly the aging Baby Boomer cohort, job growth of 3 percent
is considered full throttle. In decades past, growth of 4 or 5 percent was common during expansions in Oregon,
however that time period also coincided with the Baby Boomers entering their prime working years. Today the
opposite is occurring. Even so, demographic trends are not all bad, as the even larger cohort of Millennials are
currently entering their prime working years. The net effect is overall lower rates of labor force and economic
growth, due to demographics.
Private sector growth, measured by the number of jobs created, will be dominated by the large, service sector
industries like professional and business services, leisure and hospitality and health.
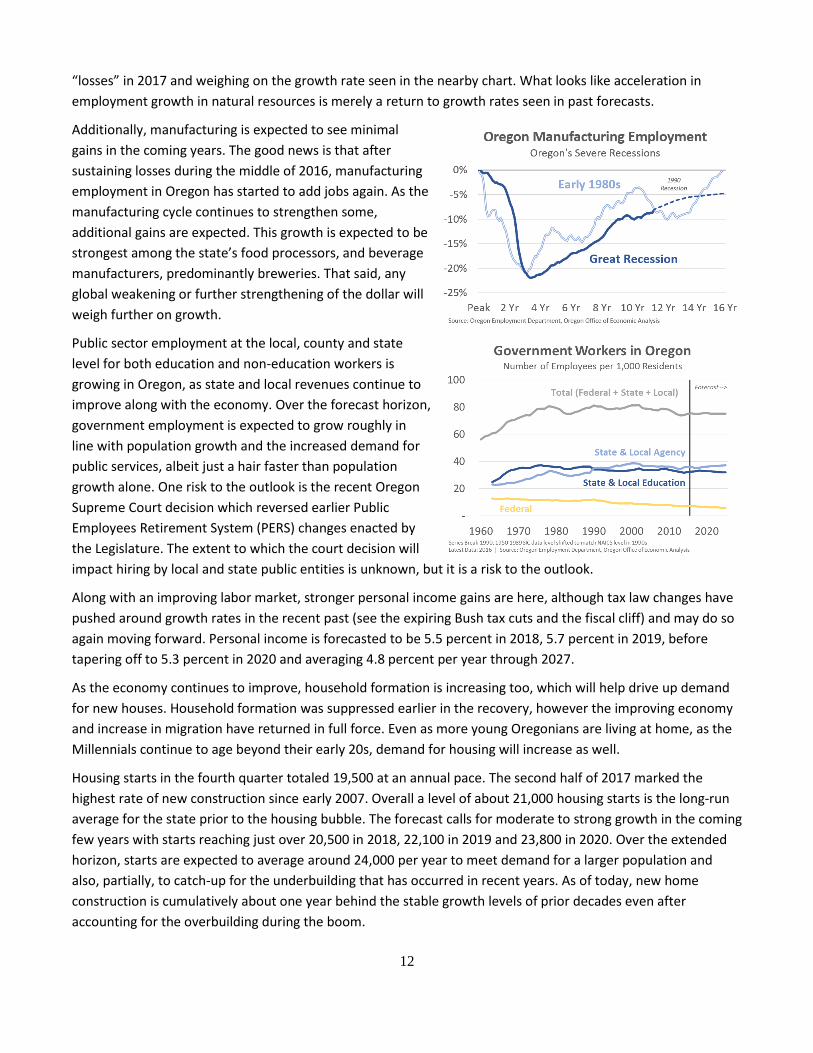
Nevertheless, goods-producing industries, while smaller,
had previously been growing at above-average rates.
Expectations in recent forecasts have been that these
goods-producing industries would slow. Growth over the
next few years would be considerably less than that seen in
the past few years. Even construction is expected to add
jobs at a slower pace even as the housing rebound
continues. This is in part due to the fact that growth must
cool off after the exceptionally strong gains in construction
in recent years.
Natural Resources (mining and logging) are somewhat of a
technical exception. There was a reclassification of a few firms out of this industry, leading to employment
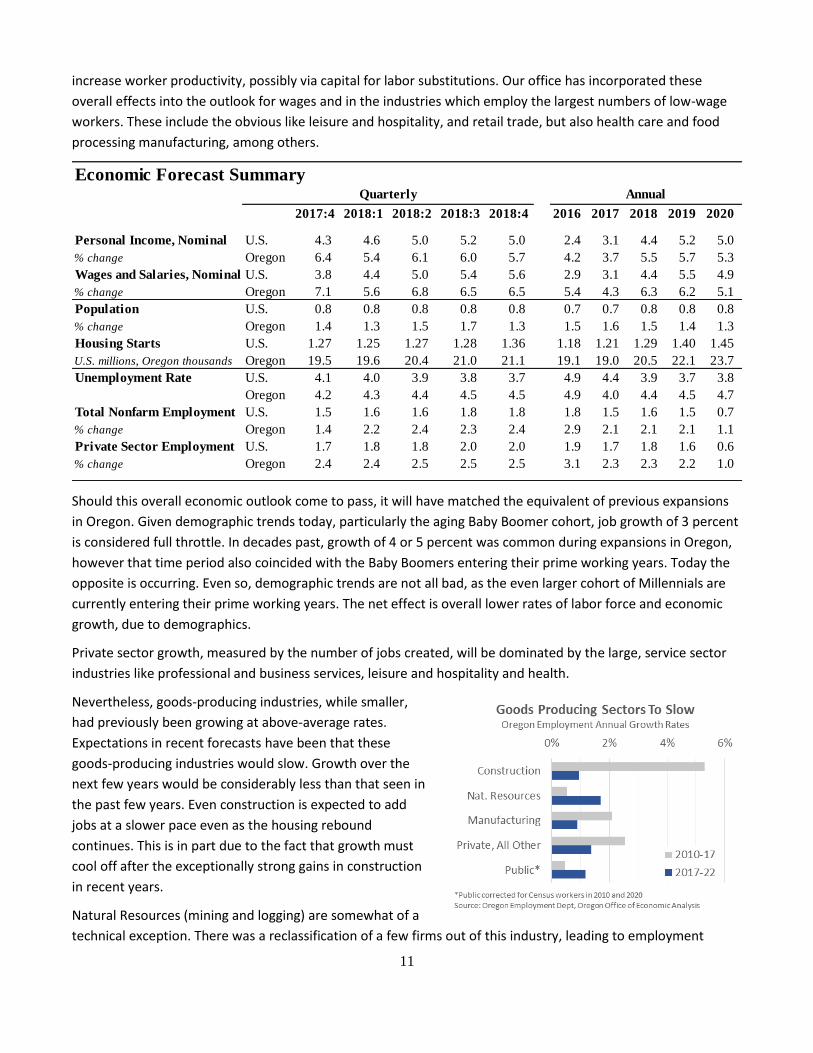
Economic Forecast Summary
2017:4 2018:1 2018:2 2018:3 2018:4 2016 2017 2018 2019 2020
Personal Income, Nominal U.S. 4.3 4.6 5.0 5.2 5.0 2.4 3.1 4.4 5.2 5.0
% change Oregon 6.4 5.4 6.1 6.0 5.7 4.2 3.7 5.5 5.7 5.3
Wages and Salaries, Nominal U.S. 3.8 4.4 5.0 5.4 5.6 2.9 3.1 4.4 5.5 4.9
% change Oregon 7.1 5.6 6.8 6.5 6.5 5.4 4.3 6.3 6.2 5.1
Population U.S. 0.8 0.8 0.8 0.8 0.8 0.7 0.7 0.8 0.8 0.8
% change Oregon 1.4 1.3 1.5 1.7 1.3 1.5 1.6 1.5 1.4 1.3
Housing Starts U.S. 1.27 1.25 1.27 1.28 1.36 1.18 1.21 1.29 1.40 1.45
U.S. millions, Oregon thousands Oregon 19.5 19.6 20.4 21.0 21.1 19.1 19.0 20.5 22.1 23.7
Unemployment Rate U.S. 4.1 4.0 3.9 3.8 3.7 4.9 4.4 3.9 3.7 3.8
Oregon 4.2 4.3 4.4 4.5 4.5 4.9 4.0 4.4 4.5 4.7
Total Nonfarm Employment U.S. 1.5 1.6 1.6 1.8 1.8 1.8 1.5 1.6 1.5 0.7
% change Oregon 1.4 2.2 2.4 2.3 2.4 2.9 2.1 2.1 2.1 1.1
Private Sector Employment U.S. 1.7 1.8 1.8 2.0 2.0 1.9 1.7 1.8 1.6 0.6
% change Oregon 2.4 2.4 2.5 2.5 2.5 3.1 2.3 2.3 2.2 1.0
Quarterly Annual
12
“losses” in 2017 and weighing on the growth rate seen in the nearby chart. What looks like acceleration in
employment growth in natural resources is merely a return to growth rates seen in past forecasts.
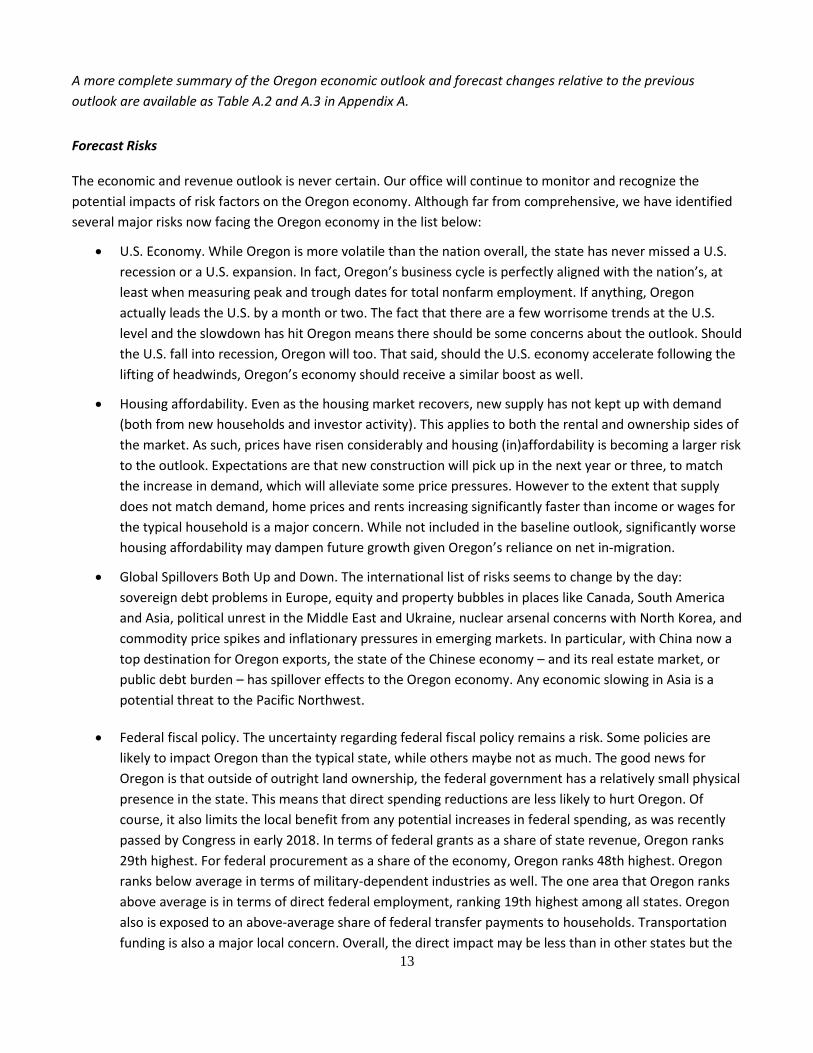
Additionally, manufacturing is expected to see minimal
gains in the coming years. The good news is that after
sustaining losses during the middle of 2016, manufacturing
employment in Oregon has started to add jobs again. As the
manufacturing cycle continues to strengthen some,
additional gains are expected. This growth is expected to be
strongest among the state’s food processors, and beverage
manufacturers, predominantly breweries. That said, any
global weakening or further strengthening of the dollar will
weigh further on growth.
Public sector employment at the local, county and state
level for both education and non-education workers is
growing in Oregon, as state and local revenues continue to
improve along with the economy. Over the forecast horizon,
government employment is expected to grow roughly in
line with population growth and the increased demand for
public services, albeit just a hair faster than population
growth alone. One risk to the outlook is the recent Oregon
Supreme Court decision which reversed earlier Public
Employees Retirement System (PERS) changes enacted by
the Legislature. The extent to which the court decision will
impact hiring by local and state public entities is unknown, but it is a risk to the outlook.
Along with an improving labor market, stronger personal income gains are here, although tax law changes have
pushed around growth rates in the recent past (see the expiring Bush tax cuts and the fiscal cliff) and may do so
again moving forward. Personal income is forecasted to be 5.5 percent in 2018, 5.7 percent in 2019, before
tapering off to 5.3 percent in 2020 and averaging 4.8 percent per year through 2027.
As the economy continues to improve, household formation is increasing too, which will help drive up demand
for new houses. Household formation was suppressed earlier in the recovery, however the improving economy
and increase in migration have returned in full force. Even as more young Oregonians are living at home, as the
Millennials continue to age beyond their early 20s, demand for housing will increase as well.
Housing starts in the fourth quarter totaled 19,500 at an annual pace. The second half of 2017 marked the
highest rate of new construction since early 2007. Overall a level of about 21,000 housing starts is the long-run
average for the state prior to the housing bubble. The forecast calls for moderate to strong growth in the coming
few years with starts reaching just over 20,500 in 2018, 22,100 in 2019 and 23,800 in 2020. Over the extended
horizon, starts are expected to average around 24,000 per year to meet demand for a larger population and
also, partially, to catch-up for the underbuilding that has occurred in recent years. As of today, new home
construction is cumulatively about one year behind the stable growth levels of prior decades even after
accounting for the overbuilding during the boom.
13
A more complete summary of the Oregon economic outlook and forecast changes relative to the previous
outlook are available as Table A.2 and A.3 in Appendix A.
Forecast Risks
The economic and revenue outlook is never certain. Our office will continue to monitor and recognize the
potential impacts of risk factors on the Oregon economy. Although far from comprehensive, we have identified
several major risks now facing the Oregon economy in the list below:
U.S. Economy. While Oregon is more volatile than the nation overall, the state has never missed a U.S.
recession or a U.S. expansion. In fact, Oregon’s business cycle is perfectly aligned with the nation’s, at
least when measuring peak and trough dates for total nonfarm employment. If anything, Oregon
actually leads the U.S. by a month or two. The fact that there are a few worrisome trends at the U.S.
level and the slowdown has hit Oregon means there should be some concerns about the outlook. Should
the U.S. fall into recession, Oregon will too. That said, should the U.S. economy accelerate following the
lifting of headwinds, Oregon’s economy should receive a similar boost as well.
Housing affordability. Even as the housing market recovers, new supply has not kept up with demand
(both from new households and investor activity). This applies to both the rental and ownership sides of
the market. As such, prices have risen considerably and housing (in)affordability is becoming a larger risk
to the outlook. Expectations are that new construction will pick up in the next year or three, to match
the increase in demand, which will alleviate some price pressures. However to the extent that supply
does not match demand, home prices and rents increasing significantly faster than income or wages for
the typical household is a major concern. While not included in the baseline outlook, significantly worse
housing affordability may dampen future growth given Oregon’s reliance on net in-migration.
Global Spillovers Both Up and Down. The international list of risks seems to change by the day:
sovereign debt problems in Europe, equity and property bubbles in places like Canada, South America
and Asia, political unrest in the Middle East and Ukraine, nuclear arsenal concerns with North Korea, and
commodity price spikes and inflationary pressures in emerging markets. In particular, with China now a
top destination for Oregon exports, the state of the Chinese economy – and its real estate market, or
public debt burden – has spillover effects to the Oregon economy. Any economic slowing in Asia is a
potential threat to the Pacific Northwest.
Federal fiscal policy. The uncertainty regarding federal fiscal policy remains a risk. Some policies are
likely to impact Oregon than the typical state, while others maybe not as much. The good news for
Oregon is that outside of outright land ownership, the federal government has a relatively small physical
presence in the state. This means that direct spending reductions are less likely to hurt Oregon. Of
course, it also limits the local benefit from any potential increases in federal spending, as was recently
passed by Congress in early 2018. In terms of federal grants as a share of state revenue, Oregon ranks
29th highest. For federal procurement as a share of the economy, Oregon ranks 48th highest. Oregon
ranks below average in terms of military-dependent industries as well. The one area that Oregon ranks
above average is in terms of direct federal employment, ranking 19th highest among all states. Oregon
also is exposed to an above-average share of federal transfer payments to households. Transportation
funding is also a major local concern. Overall, the direct impact may be less than in other states but the
14
impact will be felt nevertheless, particularly as our closest neighboring states have large federal and
military workforces.
Climate and Natural Disasters. Weather forecasting is even more difficult than economic forecasting a
year or two into the future. While the severity, duration and timing of catastrophic events like
earthquakes, wildfires and droughts are difficult to predict, we do know they impact regional
economies. Fires damage forests and tourism. Droughts in particular impact our agricultural sector and
rural economies to a larger degree. Whenever Cascadia, the big earthquake, hits, we know our regional
economy and its infrastructure will be crippled and in need of immediate repairs. Longer-term issues like
the potential impact of climate change on domestic migration patterns are likewise hard to predict and
outside our office’s forecast horizon. There is a reasonable expectation that migration flows will
continue to be strong as the rest of the country becomes less habitable over time.
Commodity price inflation. Always worrisome is the possibility of higher oil (and gasoline) prices. While
consumer spending has held up pretty consistently in this recovery, anytime there is a surge in gas
prices, it eats away at consumers’ disposable income, leaving less income to spend on all other, non-
energy related goods and services.
Federal timber policy. Even with a temporary reinstatement of payments, it has been and it is clear that
federal policymakers will not reinstate the program the same as before, however negotiations are
ongoing for more sustainable timber harvests and related revenue. In the meantime, reductions in
public employment and services are being felt in the impacted counties. For more information from a
historical perspective, see two recent blog posts, here and here9.
Initiatives, referendums, and referrals. Generally, the ballot box and legislative changes bring a number
of unknowns that could have sweeping impacts on the Oregon economy and revenue picture.
9 http://oregoneconomicanalysis.wordpress.com/2012/01/23/historical-look-at-oregons-wood-product-industry http://oregoneconomicanalysis.wordpress.com/2013/05/28/timber-counties/
15
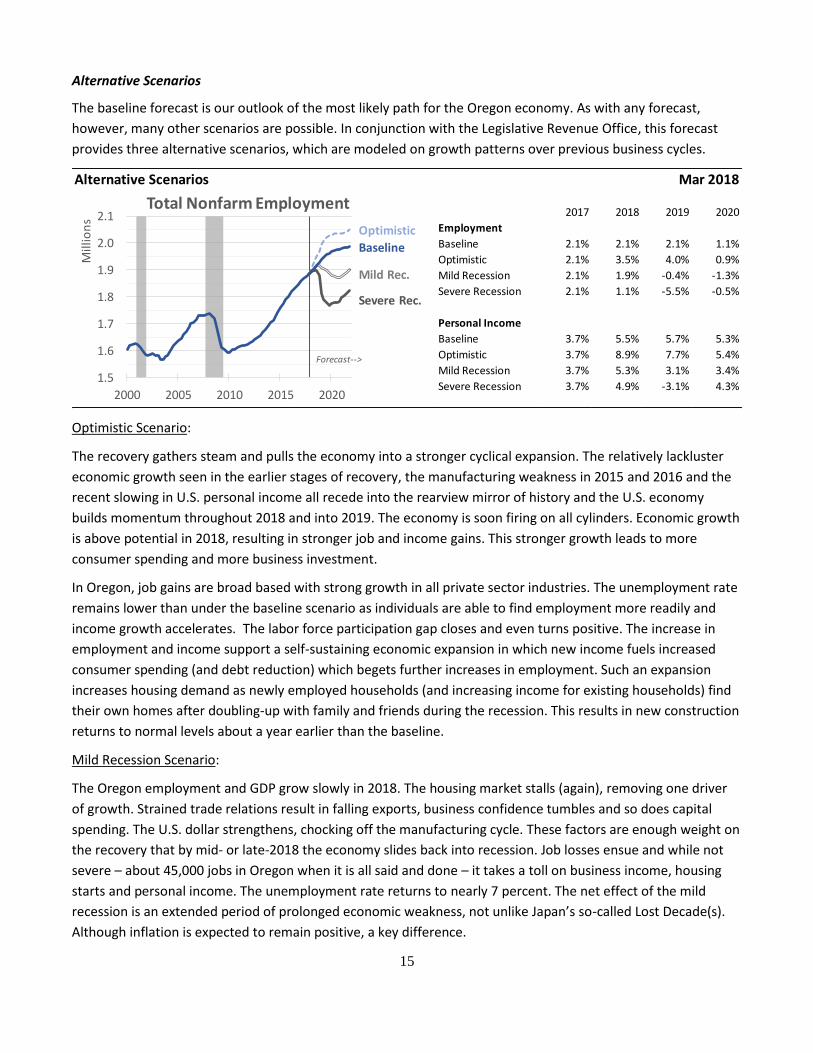
Alternative Scenarios
The baseline forecast is our outlook of the most likely path for the Oregon economy. As with any forecast,
however, many other scenarios are possible. In conjunction with the Legislative Revenue Office, this forecast
provides three alternative scenarios, which are modeled on growth patterns over previous business cycles.
Optimistic Scenario:
The recovery gathers steam and pulls the economy into a stronger cyclical expansion. The relatively lackluster
economic growth seen in the earlier stages of recovery, the manufacturing weakness in 2015 and 2016 and the
recent slowing in U.S. personal income all recede into the rearview mirror of history and the U.S. economy
builds momentum throughout 2018 and into 2019. The economy is soon firing on all cylinders. Economic growth
is above potential in 2018, resulting in stronger job and income gains. This stronger growth leads to more
consumer spending and more business investment.
In Oregon, job gains are broad based with strong growth in all private sector industries. The unemployment rate
remains lower than under the baseline scenario as individuals are able to find employment more readily and
income growth accelerates. The labor force participation gap closes and even turns positive. The increase in
employment and income support a self-sustaining economic expansion in which new income fuels increased
consumer spending (and debt reduction) which begets further increases in employment. Such an expansion
increases housing demand as newly employed households (and increasing income for existing households) find
their own homes after doubling-up with family and friends during the recession. This results in new construction
returns to normal levels about a year earlier than the baseline.
Mild Recession Scenario:
The Oregon employment and GDP grow slowly in 2018. The housing market stalls (again), removing one driver
of growth. Strained trade relations result in falling exports, business confidence tumbles and so does capital
spending. The U.S. dollar strengthens, chocking off the manufacturing cycle. These factors are enough weight on
the recovery that by mid- or late-2018 the economy slides back into recession. Job losses ensue and while not
severe – about 45,000 jobs in Oregon when it is all said and done – it takes a toll on business income, housing
starts and personal income. The unemployment rate returns to nearly 7 percent. The net effect of the mild
recession is an extended period of prolonged economic weakness, not unlike Japan’s so-called Lost Decade(s).
Although inflation is expected to remain positive, a key difference.
2017 2018 2019 2020
Employment
Baseline 2.1% 2.1% 2.1% 1.1%
Optimistic 2.1% 3.5% 4.0% 0.9%
Mild Recession 2.1% 1.9% -0.4% -1.3%
Severe Recession 2.1% 1.1% -5.5% -0.5%
Personal Income
Baseline 3.7% 5.5% 5.7% 5.3%
Optimistic 3.7% 8.9% 7.7% 5.4%
Mild Recession 3.7% 5.3% 3.1% 3.4%
Severe Recession 3.7% 4.9% -3.1% 4.3%
Mar 2018Alternative Scenarios
1.5
1.6
1.7
1.8
1.9
2.0
2.1
2000 2005 2010 2015 2020
Mill
ion
s
Total Nonfarm Employment
Forecast-->
Optimistic
Baseline
Mild Rec.
Severe Rec.
16
Severe Recession Scenario:
After expanding for 8+ years at relatively lackluster growth rates, the U.S. economy falls back into recession.
Industrial production declines and the slower personal income growth in the U.S. worsens. Strained trade
relations develop into an all-out trade war. The Fed, already lacking in traditional monetary policy ammunition,
is not able to stave off the impact. While the catalyst may be different, the economic effect is similar to late
2008 and early 2009, although not quite as severe when the dust settles. This is little comfort when the
unemployment spikes back to near 10 percent and nearly 135,000 Oregonians lose their jobs by late-2019.
Besides the domestic economic headwinds and Federal Reserve tightening, the likely culprit in this scenario is
either a meltdown of the financial markets sparked by some geopolitical shock, or quickly rising inflation in part
due to the fiscal stimulus. Economic growth in the U.S., while fairly steady as of late, is not nearly strong enough
to withstand an external financial shock of this magnitude, nor a Federal Reserve quickly raising rates to fight
inflation. Further economic effects of a recession this size are personal income losses of around 4 percent, about
three-quarters the size of the Great Recession losses in Oregon. Housing starts plummet to near historical low
levels of construction and home prices decline further. On the bright side, when construction does rebound, it
will result in a surge of new home building that will rise above the state’s long term average level of building due
to pent-up demand for housing and that the state will have under built housing during this time period.
Extended Outlook
IHS Economics projects Oregon’s economy to fare well relative to the rest of the country in the coming years.
The state’s Real Gross State Product is projected to be the fifth fastest among all states across the country in
terms of growth with gains averaging 2.7 percent through 2023. Total employment is expected to be the ninth
strongest among all states at an annualized 1.2 percent, while manufacturing employment will be the second
fastest in the country at 1.6 percent. Total personal income growth is expected to be 4.9 percent per year, the
fifteenth fastest among all states, according to IHS Economics.
Our office is equally bullish in terms of Oregon’s relative growth prospects. Much of Oregon’s advantage comes
from population growth, specifically the ability to attract and retain young, working-age households. In recent
years, IHS had been forecasting Oregon population growth of around 1 percent annually. Our office expects it to
average 1.3 per year over the next handful of years. In recent months, IHS has raised their Oregon population
forecast to 1.24 percent annually, which is very close to our office’s expectations. As such, our overall economic
outlooks are now similar.
OEA has identified three main avenues of economic growth that are important to continue to monitor over the
extended horizon: the state’s dynamic labor supply, the state’s industrial structure and the current number of
start-ups, or new businesses.
Oregon has typically benefited from an influx of households from other states, including an ample supply of
skilled workers. Households continue to move to Oregon even when local jobs are scarce, as long as the
economy is equally bad elsewhere, particularly in California. Relative housing prices also contribute to migration
flows in and out of the state. For Oregon’s recent history – data available from 1976 – the labor force in the
state has both grown faster than the nation overall and the labor force participation rate has been higher.
However while the past two years have brought considerable improvements there remain potentially worrisome
signs, particularly when the next recession comes.
17
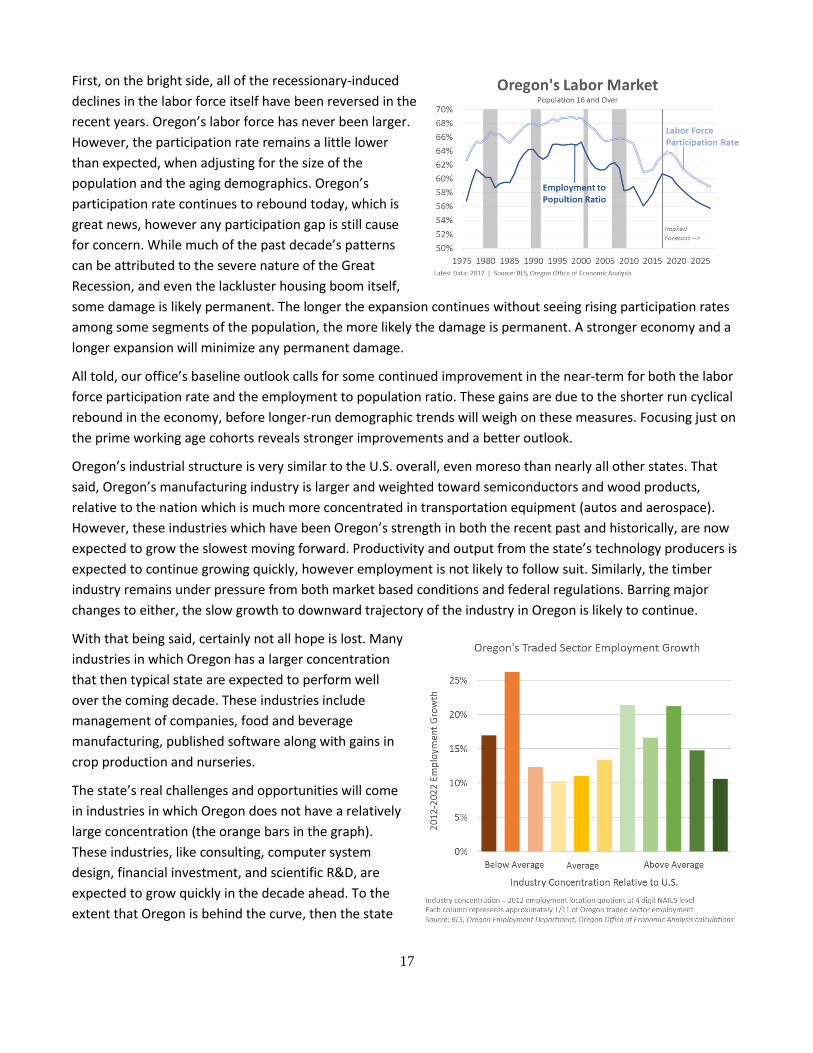
First, on the bright side, all of the recessionary-induced
declines in the labor force itself have been reversed in the
recent years. Oregon’s labor force has never been larger.
However, the participation rate remains a little lower
than expected, when adjusting for the size of the
population and the aging demographics. Oregon’s
participation rate continues to rebound today, which is
great news, however any participation gap is still cause
for concern. While much of the past decade’s patterns
can be attributed to the severe nature of the Great
Recession, and even the lackluster housing boom itself,
some damage is likely permanent. The longer the expansion continues without seeing rising participation rates
among some segments of the population, the more likely the damage is permanent. A stronger economy and a
longer expansion will minimize any permanent damage.
All told, our office’s baseline outlook calls for some continued improvement in the near-term for both the labor
force participation rate and the employment to population ratio. These gains are due to the shorter run cyclical
rebound in the economy, before longer-run demographic trends will weigh on these measures. Focusing just on
the prime working age cohorts reveals stronger improvements and a better outlook.
Oregon’s industrial structure is very similar to the U.S. overall, even moreso than nearly all other states. That
said, Oregon’s manufacturing industry is larger and weighted toward semiconductors and wood products,
relative to the nation which is much more concentrated in transportation equipment (autos and aerospace).
However, these industries which have been Oregon’s strength in both the recent past and historically, are now
expected to grow the slowest moving forward. Productivity and output from the state’s technology producers is
expected to continue growing quickly, however employment is not likely to follow suit. Similarly, the timber
industry remains under pressure from both market based conditions and federal regulations. Barring major
changes to either, the slow growth to downward trajectory of the industry in Oregon is likely to continue.
With that being said, certainly not all hope is lost. Many
industries in which Oregon has a larger concentration
that then typical state are expected to perform well
over the coming decade. These industries include
management of companies, food and beverage
manufacturing, published software along with gains in
crop production and nurseries.
The state’s real challenges and opportunities will come
in industries in which Oregon does not have a relatively
large concentration (the orange bars in the graph).
These industries, like consulting, computer system
design, financial investment, and scientific R&D, are
expected to grow quickly in the decade ahead. To the
extent that Oregon is behind the curve, then the state
18
may not fully realize these gains if they rely more on clusters and concentrations of similar firms that may
already exist elsewhere in the country.
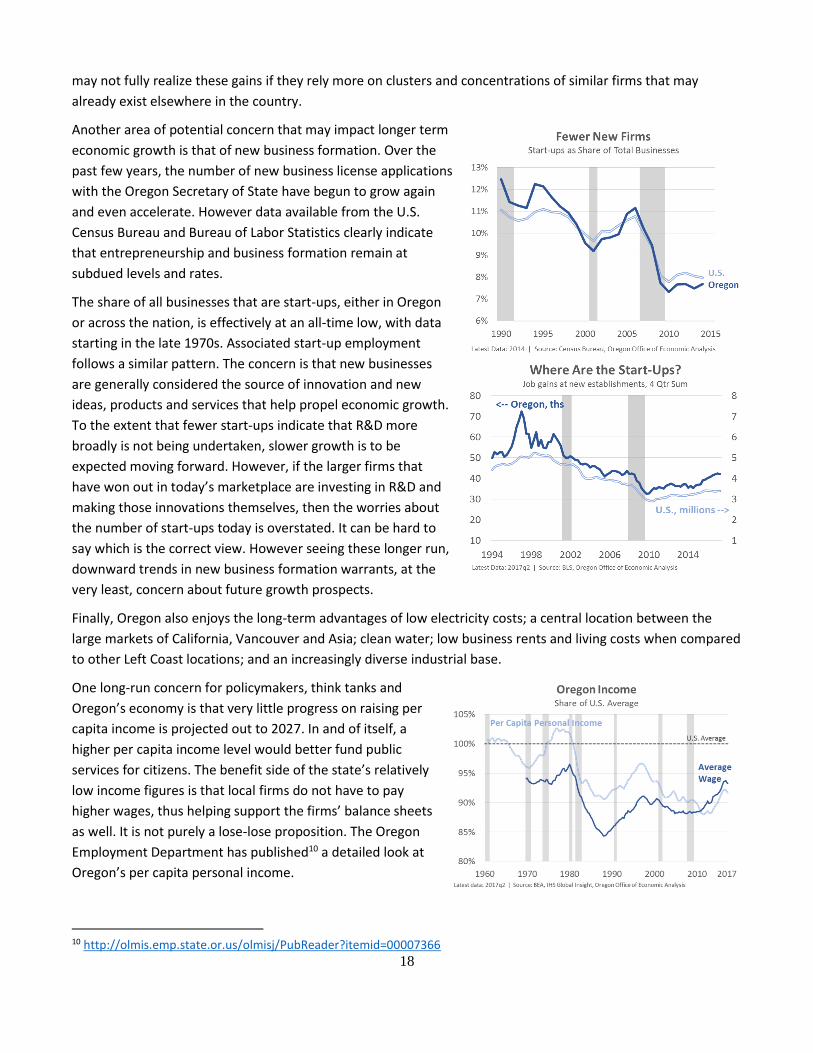
Another area of potential concern that may impact longer term
economic growth is that of new business formation. Over the
past few years, the number of new business license applications
with the Oregon Secretary of State have begun to grow again
and even accelerate. However data available from the U.S.
Census Bureau and Bureau of Labor Statistics clearly indicate
that entrepreneurship and business formation remain at
subdued levels and rates.
The share of all businesses that are start-ups, either in Oregon
or across the nation, is effectively at an all-time low, with data
starting in the late 1970s. Associated start-up employment
follows a similar pattern. The concern is that new businesses
are generally considered the source of innovation and new
ideas, products and services that help propel economic growth.
To the extent that fewer start-ups indicate that R&D more
broadly is not being undertaken, slower growth is to be
expected moving forward. However, if the larger firms that
have won out in today’s marketplace are investing in R&D and
making those innovations themselves, then the worries about
the number of start-ups today is overstated. It can be hard to
say which is the correct view. However seeing these longer run,
downward trends in new business formation warrants, at the
very least, concern about future growth prospects.
Finally, Oregon also enjoys the long-term advantages of low electricity costs; a central location between the
large markets of California, Vancouver and Asia; clean water; low business rents and living costs when compared
to other Left Coast locations; and an increasingly diverse industrial base.
One long-run concern for policymakers, think tanks and
Oregon’s economy is that very little progress on raising per
capita income is projected out to 2027. In and of itself, a
higher per capita income level would better fund public
services for citizens. The benefit side of the state’s relatively
low income figures is that local firms do not have to pay
higher wages, thus helping support the firms’ balance sheets
as well. It is not purely a lose-lose proposition. The Oregon
Employment Department has published10 a detailed look at
Oregon’s per capita personal income.
10 http://olmis.emp.state.or.us/olmisj/PubReader?itemid=00007366
19
Today, Oregon’s average wage relative to the nation is at its highest point since the mills closed in the 1980s.
While some industries are seeing stronger growth, these gains are broad-based across regions and industries in
Oregon. Similarly, Oregon’s per capita personal income is at its highest relative point since the dotcom crash.
In terms of the outlook, expectations are that wages will remain at this high watermark but not increase much
further, at least relative to the nation. The primary reason for this is that Oregon’s average wages have already
accelerated in recent years, even as U.S. wages are just now picking up. Our office expects Oregon’s average
wage to continue to increase by 4 percent per year. However as the U.S. accelerates closer to Oregon’s annual
rate, Oregon’s growth advantage in recent years will lessen.
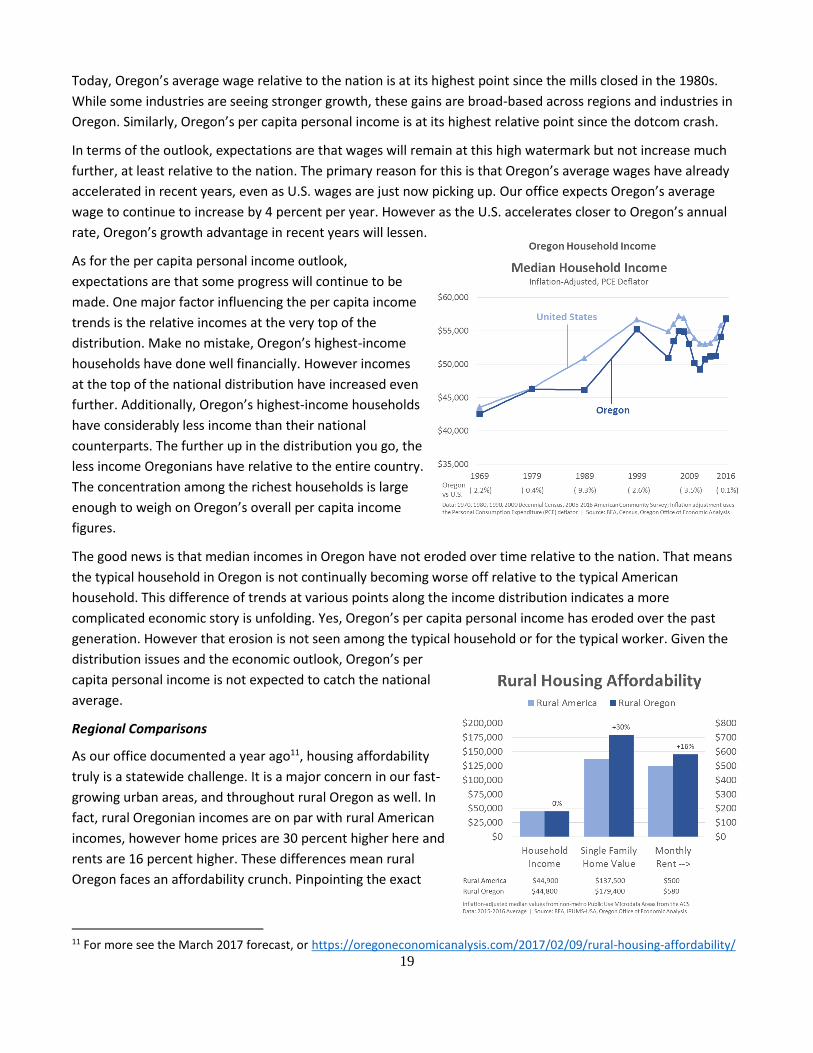
As for the per capita personal income outlook,
expectations are that some progress will continue to be
made. One major factor influencing the per capita income
trends is the relative incomes at the very top of the
distribution. Make no mistake, Oregon’s highest-income
households have done well financially. However incomes
at the top of the national distribution have increased even
further. Additionally, Oregon’s highest-income households
have considerably less income than their national
counterparts. The further up in the distribution you go, the
less income Oregonians have relative to the entire country.
The concentration among the richest households is large
enough to weigh on Oregon’s overall per capita income
figures.
The good news is that median incomes in Oregon have not eroded over time relative to the nation. That means
the typical household in Oregon is not continually becoming worse off relative to the typical American
household. This difference of trends at various points along the income distribution indicates a more
complicated economic story is unfolding. Yes, Oregon’s per capita personal income has eroded over the past
generation. However that erosion is not seen among the typical household or for the typical worker. Given the
distribution issues and the economic outlook, Oregon’s per
capita personal income is not expected to catch the national
average.
Regional Comparisons
As our office documented a year ago11, housing affordability
truly is a statewide challenge. It is a major concern in our fast-
growing urban areas, and throughout rural Oregon as well. In
fact, rural Oregonian incomes are on par with rural American
incomes, however home prices are 30 percent higher here and
rents are 16 percent higher. These differences mean rural
Oregon faces an affordability crunch. Pinpointing the exact
11 For more see the March 2017 forecast, or https://oregoneconomicanalysis.com/2017/02/09/rural-housing-affordability/
20
reason for rural Oregon’s housing challenges can be difficult, however the data do tell a clear, or at least
consistent story.
First, rural Oregon has experienced faster population growth than the rest of rural America. This results in
stronger demand for housing. Given that new construction is almost always more expensive compared to the
older housing stock, a more modern mix of housing, or a larger share of newer homes can lead to higher prices
when looking at the market overall. This does not appear to be the case in rural Oregon, however. There is not a
larger share of homes built in the last decade or two. Housing prices in rural Oregon are more expensive than
their national counterparts for all types of units and for all vintages in the housing stock.
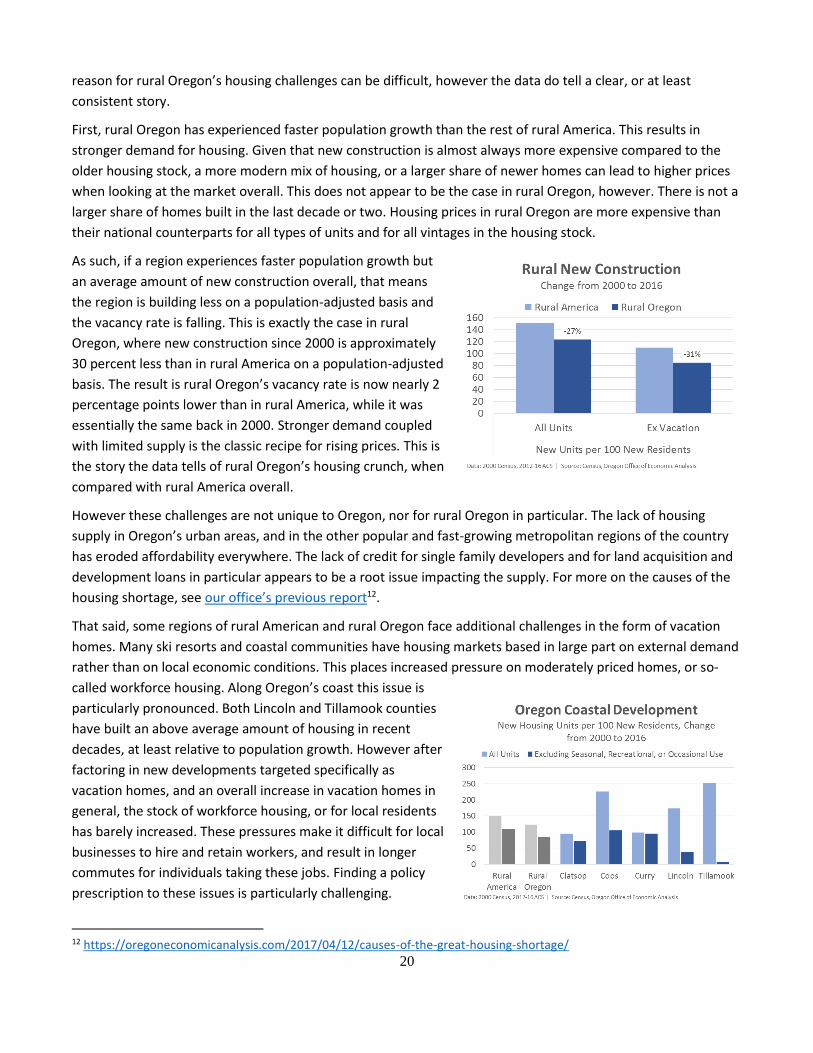
As such, if a region experiences faster population growth but
an average amount of new construction overall, that means
the region is building less on a population-adjusted basis and
the vacancy rate is falling. This is exactly the case in rural
Oregon, where new construction since 2000 is approximately
30 percent less than in rural America on a population-adjusted
basis. The result is rural Oregon’s vacancy rate is now nearly 2
percentage points lower than in rural America, while it was
essentially the same back in 2000. Stronger demand coupled
with limited supply is the classic recipe for rising prices. This is
the story the data tells of rural Oregon’s housing crunch, when
compared with rural America overall.
However these challenges are not unique to Oregon, nor for rural Oregon in particular. The lack of housing
supply in Oregon’s urban areas, and in the other popular and fast-growing metropolitan regions of the country
has eroded affordability everywhere. The lack of credit for single family developers and for land acquisition and
development loans in particular appears to be a root issue impacting the supply. For more on the causes of the
housing shortage, see our office’s previous report12.
That said, some regions of rural American and rural Oregon face additional challenges in the form of vacation
homes. Many ski resorts and coastal communities have housing markets based in large part on external demand
rather than on local economic conditions. This places increased pressure on moderately priced homes, or so-
called workforce housing. Along Oregon’s coast this issue is
particularly pronounced. Both Lincoln and Tillamook counties
have built an above average amount of housing in recent
decades, at least relative to population growth. However after
factoring in new developments targeted specifically as
vacation homes, and an overall increase in vacation homes in
general, the stock of workforce housing, or for local residents
has barely increased. These pressures make it difficult for local
businesses to hire and retain workers, and result in longer
commutes for individuals taking these jobs. Finding a policy
prescription to these issues is particularly challenging.
12 https://oregoneconomicanalysis.com/2017/04/12/causes-of-the-great-housing-shortage/
21
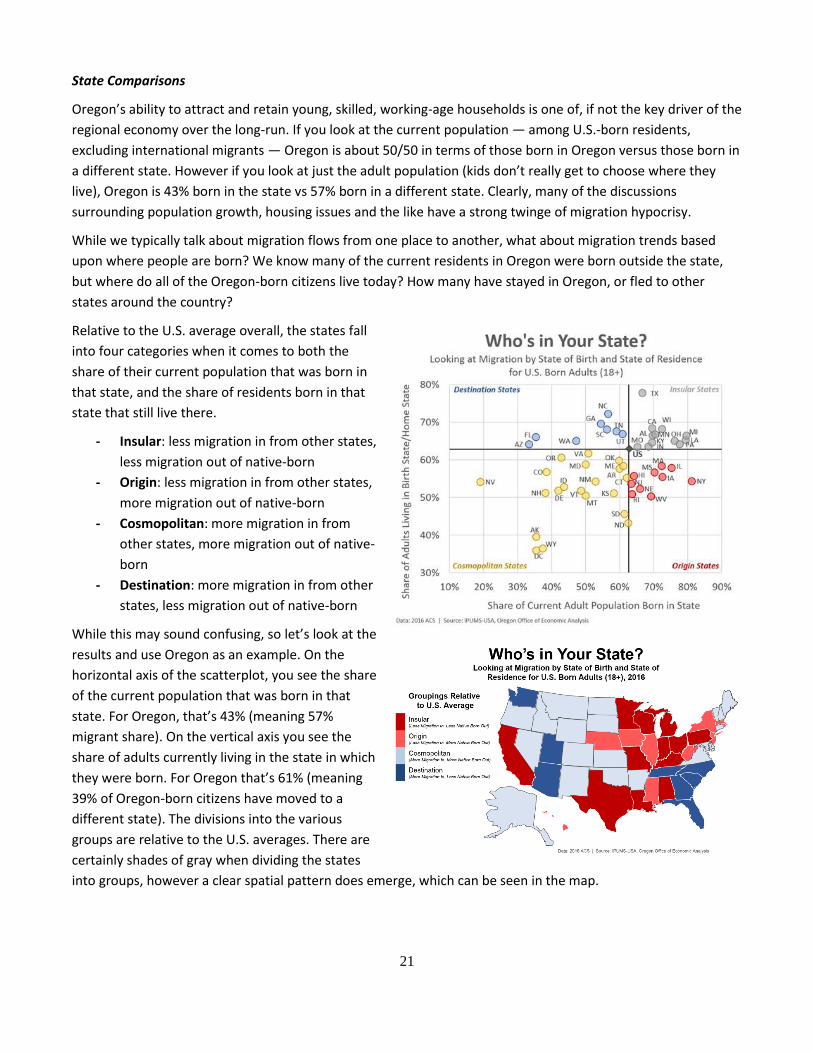
State Comparisons
Oregon’s ability to attract and retain young, skilled, working-age households is one of, if not the key driver of the
regional economy over the long-run. If you look at the current population — among U.S.-born residents,
excluding international migrants — Oregon is about 50/50 in terms of those born in Oregon versus those born in
a different state. However if you look at just the adult population (kids don’t really get to choose where they
live), Oregon is 43% born in the state vs 57% born in a different state. Clearly, many of the discussions
surrounding population growth, housing issues and the like have a strong twinge of migration hypocrisy.
While we typically talk about migration flows from one place to another, what about migration trends based
upon where people are born? We know many of the current residents in Oregon were born outside the state,
but where do all of the Oregon-born citizens live today? How many have stayed in Oregon, or fled to other
states around the country?
Relative to the U.S. average overall, the states fall
into four categories when it comes to both the
share of their current population that was born in
that state, and the share of residents born in that
state that still live there.
- Insular: less migration in from other states,
less migration out of native-born
- Origin: less migration in from other states,
more migration out of native-born
- Cosmopolitan: more migration in from
other states, more migration out of native-
born
- Destination: more migration in from other
states, less migration out of native-born
While this may sound confusing, so let’s look at the
results and use Oregon as an example. On the
horizontal axis of the scatterplot, you see the share
of the current population that was born in that
state. For Oregon, that’s 43% (meaning 57%
migrant share). On the vertical axis you see the
share of adults currently living in the state in which
they were born. For Oregon that’s 61% (meaning
39% of Oregon-born citizens have moved to a
different state). The divisions into the various
groups are relative to the U.S. averages. There are
certainly shades of gray when dividing the states
into groups, however a clear spatial pattern does emerge, which can be seen in the map.
22
Revenue Summary
Since the September 2017 forecast, two significant factors have come into play that have changed Oregon’s
General Fund revenue outlook. The first factor, the new federal tax law (Tax Cuts and Jobs Act), stands to reduce
state revenues in the near term, and will boost them in future budget periods. The second factor, a potential
equity market correction, draws down revenues after a short delay.
Oregon’s tax collections are tied to federal tax law both directly and indirectly. The starting point for calculating
Oregon income tax is taxable income from a filer’s federal return. As a result, most federal changes to what is
defined as income, or to what can be deducted or excluded from it, directly feed into Oregon tax collections.
After the last major federal tax reform in 1986, Oregon’s income tax revenues grew by 20% in the following
year. This time, the largest reform to the tax base will directly reduce, rather than increase, Oregon’s revenues.
The new 20% federal deduction for pass-through income will feed directly into lower Oregon taxable income.
Federal tax law changes also indirectly feed back into Oregon’s tax collections. The primary channel occurs
through the subtraction for federal taxes that is allowed on Oregon returns. Since some taxpayers can subtract
federal taxes from their Oregon income, when federal personal income taxes are cut, Oregon taxable income
goes up. These indirect effects outweighed the direct ones following the Bush Era tax cuts, leading to a net
increase in Oregon tax collections.
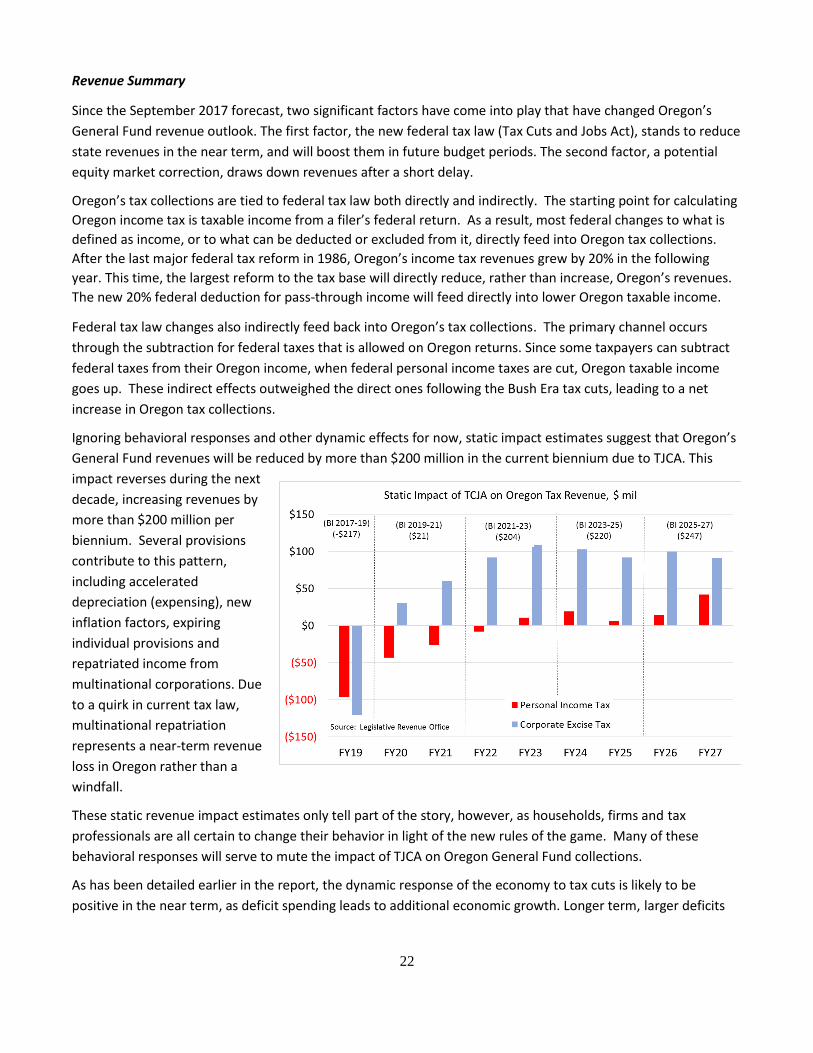
Ignoring behavioral responses and other dynamic effects for now, static impact estimates suggest that Oregon’s
General Fund revenues will be reduced by more than $200 million in the current biennium due to TJCA. This
impact reverses during the next
decade, increasing revenues by
more than $200 million per
biennium. Several provisions
contribute to this pattern,
including accelerated
depreciation (expensing), new
inflation factors, expiring
individual provisions and
repatriated income from
multinational corporations. Due
to a quirk in current tax law,
multinational repatriation
represents a near-term revenue
loss in Oregon rather than a
windfall.
These static revenue impact estimates only tell part of the story, however, as households, firms and tax
professionals are all certain to change their behavior in light of the new rules of the game. Many of these
behavioral responses will serve to mute the impact of TJCA on Oregon General Fund collections.
As has been detailed earlier in the report, the dynamic response of the economy to tax cuts is likely to be
positive in the near term, as deficit spending leads to additional economic growth. Longer term, larger deficits
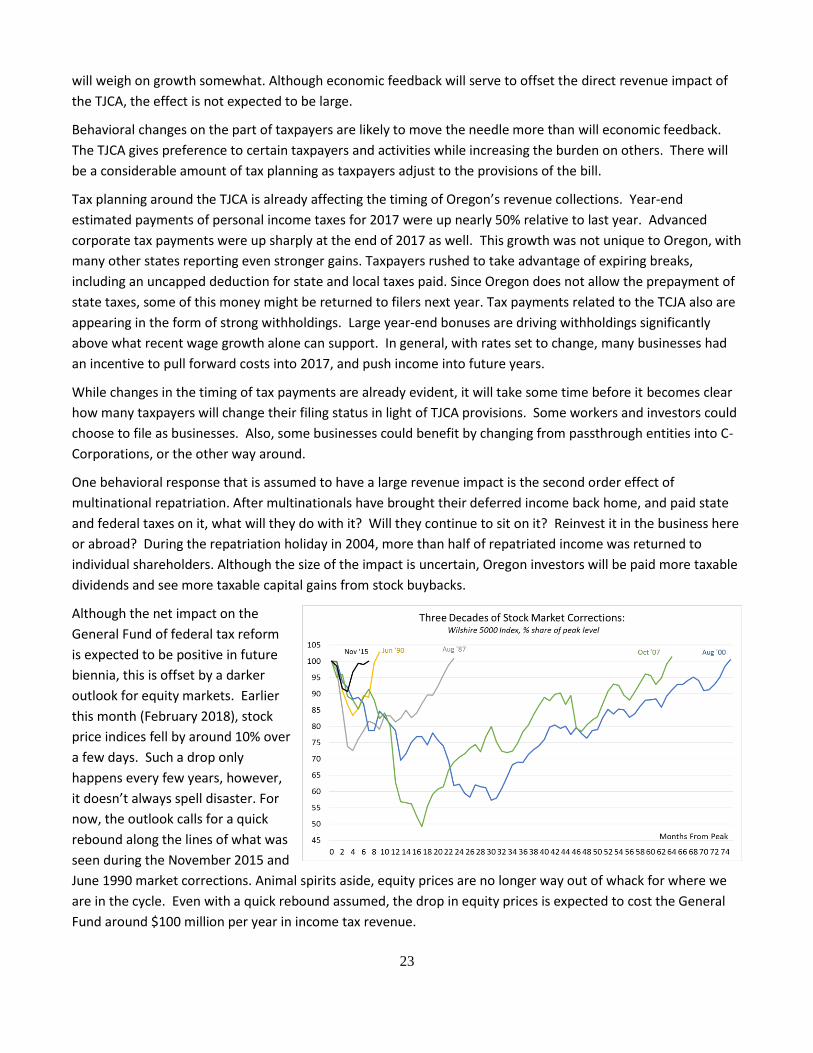
23
will weigh on growth somewhat. Although economic feedback will serve to offset the direct revenue impact of
the TJCA, the effect is not expected to be large.
Behavioral changes on the part of taxpayers are likely to move the needle more than will economic feedback.
The TJCA gives preference to certain taxpayers and activities while increasing the burden on others. There will
be a considerable amount of tax planning as taxpayers adjust to the provisions of the bill.
Tax planning around the TJCA is already affecting the timing of Oregon’s revenue collections. Year-end
estimated payments of personal income taxes for 2017 were up nearly 50% relative to last year. Advanced
corporate tax payments were up sharply at the end of 2017 as well. This growth was not unique to Oregon, with
many other states reporting even stronger gains. Taxpayers rushed to take advantage of expiring breaks,
including an uncapped deduction for state and local taxes paid. Since Oregon does not allow the prepayment of
state taxes, some of this money might be returned to filers next year. Tax payments related to the TCJA also are
appearing in the form of strong withholdings. Large year-end bonuses are driving withholdings significantly
above what recent wage growth alone can support. In general, with rates set to change, many businesses had
an incentive to pull forward costs into 2017, and push income into future years.
While changes in the timing of tax payments are already evident, it will take some time before it becomes clear
how many taxpayers will change their filing status in light of TJCA provisions. Some workers and investors could
choose to file as businesses. Also, some businesses could benefit by changing from passthrough entities into C-
Corporations, or the other way around.
One behavioral response that is assumed to have a large revenue impact is the second order effect of
multinational repatriation. After multinationals have brought their deferred income back home, and paid state
and federal taxes on it, what will they do with it? Will they continue to sit on it? Reinvest it in the business here
or abroad? During the repatriation holiday in 2004, more than half of repatriated income was returned to
individual shareholders. Although the size of the impact is uncertain, Oregon investors will be paid more taxable
dividends and see more taxable capital gains from stock buybacks.
Although the net impact on the
General Fund of federal tax reform
is expected to be positive in future
biennia, this is offset by a darker
outlook for equity markets. Earlier
this month (February 2018), stock
price indices fell by around 10% over
a few days. Such a drop only
happens every few years, however,
it doesn’t always spell disaster. For
now, the outlook calls for a quick
rebound along the lines of what was
seen during the November 2015 and
June 1990 market corrections. Animal spirits aside, equity prices are no longer way out of whack for where we
are in the cycle. Even with a quick rebound assumed, the drop in equity prices is expected to cost the General
Fund around $100 million per year in income tax revenue.
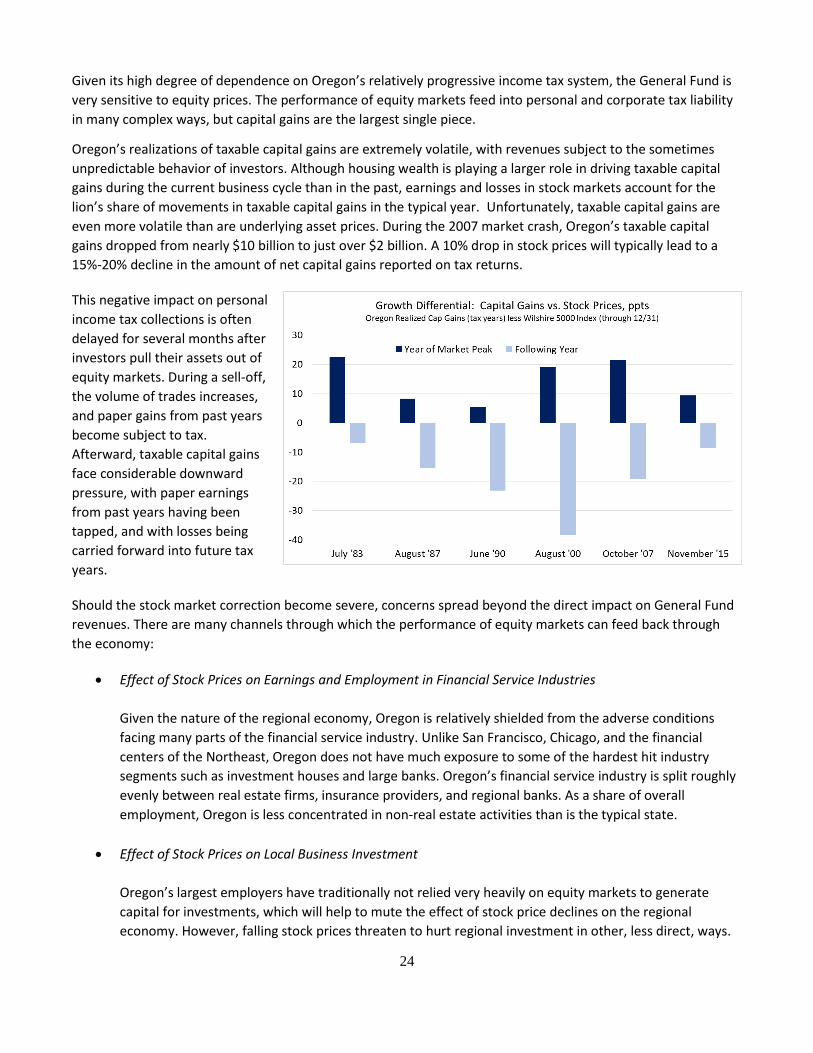
24
Given its high degree of dependence on Oregon’s relatively progressive income tax system, the General Fund is
very sensitive to equity prices. The performance of equity markets feed into personal and corporate tax liability
in many complex ways, but capital gains are the largest single piece.
Oregon’s realizations of taxable capital gains are extremely volatile, with revenues subject to the sometimes
unpredictable behavior of investors. Although housing wealth is playing a larger role in driving taxable capital
gains during the current business cycle than in the past, earnings and losses in stock markets account for the
lion’s share of movements in taxable capital gains in the typical year. Unfortunately, taxable capital gains are
even more volatile than are underlying asset prices. During the 2007 market crash, Oregon’s taxable capital
gains dropped from nearly $10 billion to just over $2 billion. A 10% drop in stock prices will typically lead to a
15%-20% decline in the amount of net capital gains reported on tax returns.
This negative impact on personal
income tax collections is often
delayed for several months after
investors pull their assets out of
equity markets. During a sell-off,
the volume of trades increases,
and paper gains from past years
become subject to tax.
Afterward, taxable capital gains
face considerable downward
pressure, with paper earnings
from past years having been
tapped, and with losses being
carried forward into future tax
years.
Should the stock market correction become severe, concerns spread beyond the direct impact on General Fund
revenues. There are many channels through which the performance of equity markets can feed back through
the economy:
Effect of Stock Prices on Earnings and Employment in Financial Service Industries
Given the nature of the regional economy, Oregon is relatively shielded from the adverse conditions
facing many parts of the financial service industry. Unlike San Francisco, Chicago, and the financial
centers of the Northeast, Oregon does not have much exposure to some of the hardest hit industry
segments such as investment houses and large banks. Oregon’s financial service industry is split roughly
evenly between real estate firms, insurance providers, and regional banks. As a share of overall
employment, Oregon is less concentrated in non-real estate activities than is the typical state.
Effect of Stock Prices on Local Business Investment
Oregon’s largest employers have traditionally not relied very heavily on equity markets to generate
capital for investments, which will help to mute the effect of stock price declines on the regional
economy. However, falling stock prices threaten to hurt regional investment in other, less direct, ways.
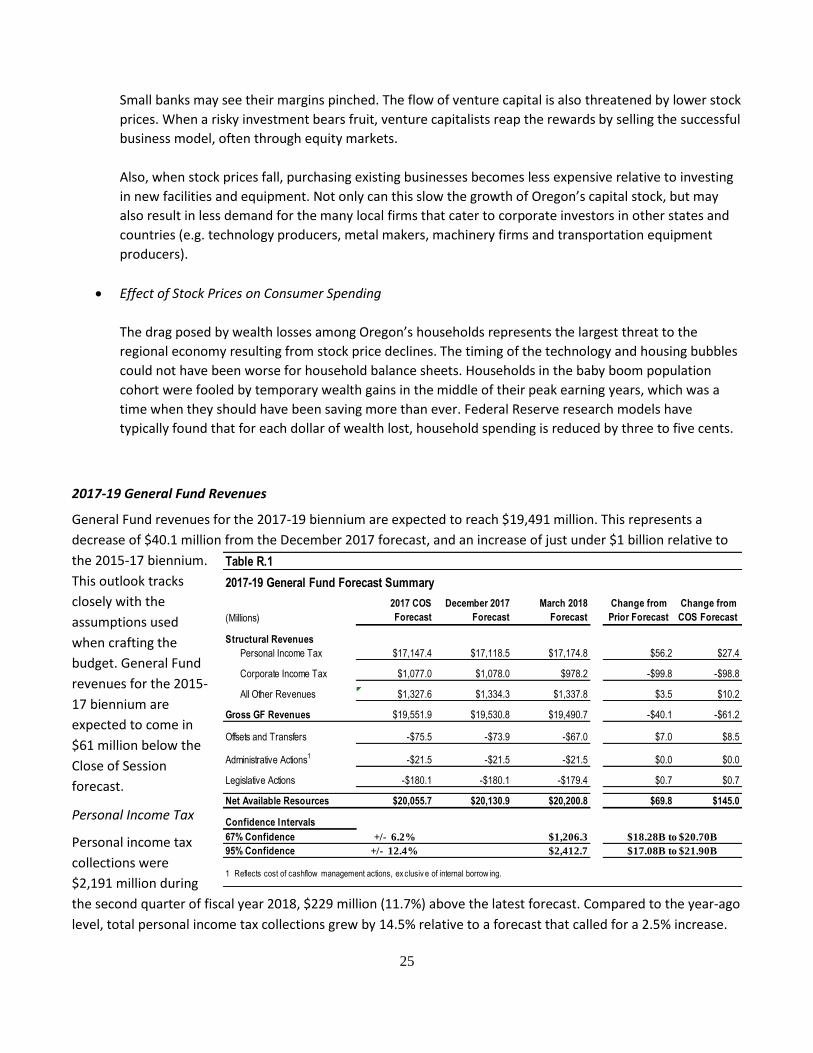
25
Small banks may see their margins pinched. The flow of venture capital is also threatened by lower stock
prices. When a risky investment bears fruit, venture capitalists reap the rewards by selling the successful
business model, often through equity markets.
Also, when stock prices fall, purchasing existing businesses becomes less expensive relative to investing
in new facilities and equipment. Not only can this slow the growth of Oregon’s capital stock, but may
also result in less demand for the many local firms that cater to corporate investors in other states and
countries (e.g. technology producers, metal makers, machinery firms and transportation equipment
producers).
Effect of Stock Prices on Consumer Spending
The drag posed by wealth losses among Oregon’s households represents the largest threat to the
regional economy resulting from stock price declines. The timing of the technology and housing bubbles
could not have been worse for household balance sheets. Households in the baby boom population
cohort were fooled by temporary wealth gains in the middle of their peak earning years, which was a
time when they should have been saving more than ever. Federal Reserve research models have
typically found that for each dollar of wealth lost, household spending is reduced by three to five cents.
2017-19 General Fund Revenues
General Fund revenues for the 2017-19 biennium are expected to reach $19,491 million. This represents a
decrease of $40.1 million from the December 2017 forecast, and an increase of just under $1 billion relative to
the 2015-17 biennium.
This outlook tracks
closely with the
assumptions used
when crafting the
budget. General Fund
revenues for the 2015-
17 biennium are
expected to come in
$61 million below the
Close of Session
forecast.
Personal Income Tax
Personal income tax
collections were
$2,191 million during
the second quarter of fiscal year 2018, $229 million (11.7%) above the latest forecast. Compared to the year-ago
level, total personal income tax collections grew by 14.5% relative to a forecast that called for a 2.5% increase.
(Millions)
2017 COS
Forecast
December 2017
Forecast
March 2018
Forecast
Change from
Prior Forecast
Change from
COS Forecast
Structural Revenues
Personal Income Tax $17,147.4 $17,118.5 $17,174.8 $56.2 $27.4
Corporate Income Tax $1,077.0 $1,078.0 $978.2 -$99.8 -$98.8
All Other Revenues $1,327.6 $1,334.3 $1,337.8 $3.5 $10.2
Gross GF Revenues $19,551.9 $19,530.8 $19,490.7 -$40.1 -$61.2
Offsets and Transfers -$75.5 -$73.9 -$67.0 $7.0 $8.5
Administrative Actions1 -$21.5 -$21.5 -$21.5 $0.0 $0.0
Legislative Actions -$180.1 -$180.1 -$179.4 $0.7 $0.7
Net Available Resources $20,055.7 $20,130.9 $20,200.8 $69.8 $145.0
Confidence Intervals
67% Confidence +/- 6.2% $1,206.3
95% Confidence +/- 12.4% $2,412.7
1 Reflects cost of cashflow management actions, ex clusiv e of internal borrow ing.
2017-19 General Fund Forecast Summary
$18.28B to $20.70B
$17.08B to $21.90B
Table R.1
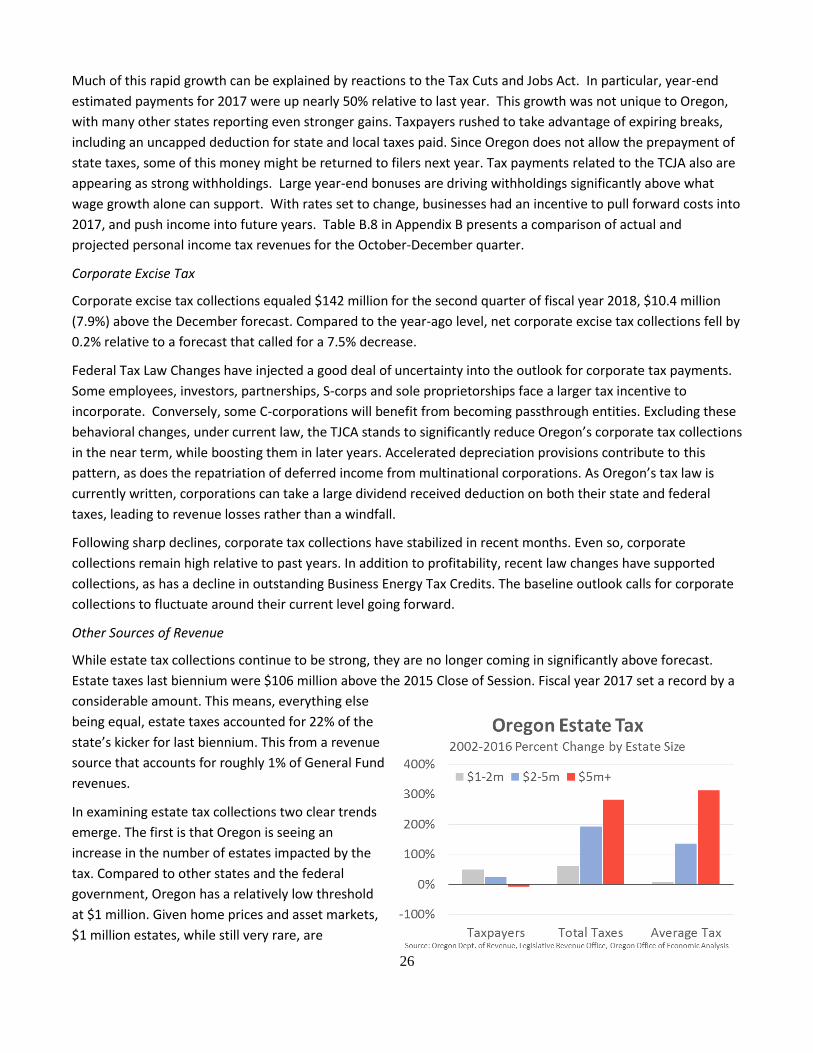
26
Much of this rapid growth can be explained by reactions to the Tax Cuts and Jobs Act. In particular, year-end
estimated payments for 2017 were up nearly 50% relative to last year. This growth was not unique to Oregon,
with many other states reporting even stronger gains. Taxpayers rushed to take advantage of expiring breaks,
including an uncapped deduction for state and local taxes paid. Since Oregon does not allow the prepayment of
state taxes, some of this money might be returned to filers next year. Tax payments related to the TCJA also are
appearing as strong withholdings. Large year-end bonuses are driving withholdings significantly above what
wage growth alone can support. With rates set to change, businesses had an incentive to pull forward costs into
2017, and push income into future years. Table B.8 in Appendix B presents a comparison of actual and
projected personal income tax revenues for the October-December quarter.
Corporate Excise Tax
Corporate excise tax collections equaled $142 million for the second quarter of fiscal year 2018, $10.4 million
(7.9%) above the December forecast. Compared to the year-ago level, net corporate excise tax collections fell by
0.2% relative to a forecast that called for a 7.5% decrease.
Federal Tax Law Changes have injected a good deal of uncertainty into the outlook for corporate tax payments.
Some employees, investors, partnerships, S-corps and sole proprietorships face a larger tax incentive to
incorporate. Conversely, some C-corporations will benefit from becoming passthrough entities. Excluding these
behavioral changes, under current law, the TJCA stands to significantly reduce Oregon’s corporate tax collections
in the near term, while boosting them in later years. Accelerated depreciation provisions contribute to this
pattern, as does the repatriation of deferred income from multinational corporations. As Oregon’s tax law is
currently written, corporations can take a large dividend received deduction on both their state and federal
taxes, leading to revenue losses rather than a windfall.
Following sharp declines, corporate tax collections have stabilized in recent months. Even so, corporate
collections remain high relative to past years. In addition to profitability, recent law changes have supported
collections, as has a decline in outstanding Business Energy Tax Credits. The baseline outlook calls for corporate
collections to fluctuate around their current level going forward.
Other Sources of Revenue
While estate tax collections continue to be strong, they are no longer coming in significantly above forecast.
Estate taxes last biennium were $106 million above the 2015 Close of Session. Fiscal year 2017 set a record by a
considerable amount. This means, everything else
being equal, estate taxes accounted for 22% of the
state’s kicker for last biennium. This from a revenue
source that accounts for roughly 1% of General Fund
revenues.
In examining estate tax collections two clear trends
emerge. The first is that Oregon is seeing an
increase in the number of estates impacted by the
tax. Compared to other states and the federal
government, Oregon has a relatively low threshold
at $1 million. Given home prices and asset markets,
$1 million estates, while still very rare, are
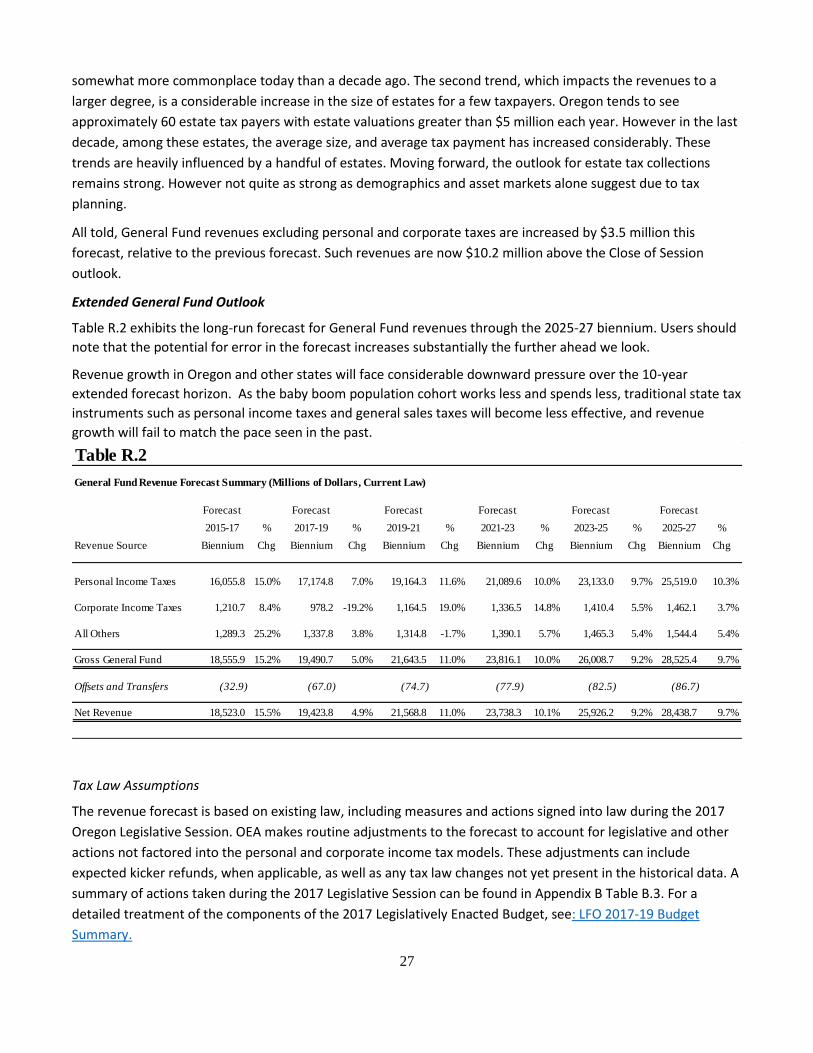
27
somewhat more commonplace today than a decade ago. The second trend, which impacts the revenues to a
larger degree, is a considerable increase in the size of estates for a few taxpayers. Oregon tends to see
approximately 60 estate tax payers with estate valuations greater than $5 million each year. However in the last
decade, among these estates, the average size, and average tax payment has increased considerably. These
trends are heavily influenced by a handful of estates. Moving forward, the outlook for estate tax collections
remains strong. However not quite as strong as demographics and asset markets alone suggest due to tax
planning.
All told, General Fund revenues excluding personal and corporate taxes are increased by $3.5 million this
forecast, relative to the previous forecast. Such revenues are now $10.2 million above the Close of Session
outlook.
Extended General Fund Outlook
Table R.2 exhibits the long-run forecast for General Fund revenues through the 2025-27 biennium. Users should
note that the potential for error in the forecast increases substantially the further ahead we look.
Revenue growth in Oregon and other states will face considerable downward pressure over the 10-year
extended forecast horizon. As the baby boom population cohort works less and spends less, traditional state tax
instruments such as personal income taxes and general sales taxes will become less effective, and revenue
growth will fail to match the pace seen in the past.
Tax Law Assumptions
The revenue forecast is based on existing law, including measures and actions signed into law during the 2017
Oregon Legislative Session. OEA makes routine adjustments to the forecast to account for legislative and other
actions not factored into the personal and corporate income tax models. These adjustments can include
expected kicker refunds, when applicable, as well as any tax law changes not yet present in the historical data. A
summary of actions taken during the 2017 Legislative Session can be found in Appendix B Table B.3. For a
detailed treatment of the components of the 2017 Legislatively Enacted Budget, see: LFO 2017-19 Budget
Summary.
Table R.2
General Fund Revenue Forecast Summary (Millions of Dollars, Current Law)
Forecast Forecast Forecast Forecast Forecast Forecast
2015-17 % 2017-19 % 2019-21 % 2021-23 % 2023-25 % 2025-27 %
Revenue Source Biennium Chg Biennium Chg Biennium Chg Biennium Chg Biennium Chg Biennium Chg
Personal Income Taxes 16,055.8 15.0% 17,174.8 7.0% 19,164.3 11.6% 21,089.6 10.0% 23,133.0 9.7% 25,519.0 10.3%
Corporate Income Taxes 1,210.7 8.4% 978.2 -19.2% 1,164.5 19.0% 1,336.5 14.8% 1,410.4 5.5% 1,462.1 3.7%
All Others 1,289.3 25.2% 1,337.8 3.8% 1,314.8 -1.7% 1,390.1 5.7% 1,465.3 5.4% 1,544.4 5.4%
Gross General Fund 18,555.9 15.2% 19,490.7 5.0% 21,643.5 11.0% 23,816.1 10.0% 26,008.7 9.2% 28,525.4 9.7%
Offsets and Transfers (32.9) (67.0) (74.7) (77.9) (82.5) (86.7)
Net Revenue 18,523.0 15.5% 19,423.8 4.9% 21,568.8 11.0% 23,738.3 10.1% 25,926.2 9.2% 28,438.7 9.7%

28
Although based on current law, many of the tax policies that impact the revenue forecast are not set in stone. In
particular, sunset dates for many large tax credits have been scheduled. As credits are allowed to disappear,
considerable support is lent to the revenue outlook in the outer years of the forecast. To the extent that tax
credits are extended and not allowed to expire when their sunset dates arrive, the outlook for revenue growth
will be reduced. The current forecast relies on estimates taken from the Oregon Department of Revenue’s 2017-
19 Tax Expenditure Report together with more timely updates produced by the Legislative Revenue Office.
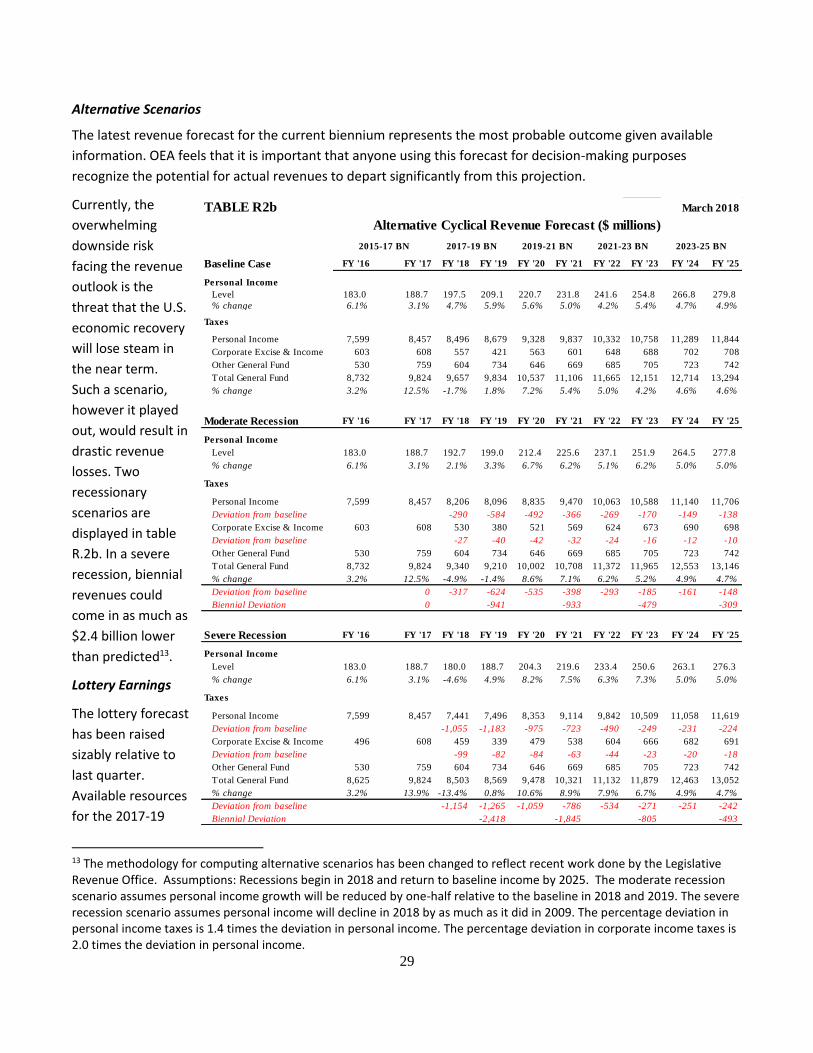
29
Alternative Scenarios
The latest revenue forecast for the current biennium represents the most probable outcome given available
information. OEA feels that it is important that anyone using this forecast for decision-making purposes
recognize the potential for actual revenues to depart significantly from this projection.
Currently, the
overwhelming
downside risk
facing the revenue
outlook is the
threat that the U.S.
economic recovery
will lose steam in
the near term.
Such a scenario,
however it played
out, would result in
drastic revenue
losses. Two
recessionary
scenarios are
displayed in table
R.2b. In a severe
recession, biennial
revenues could
come in as much as
$2.4 billion lower
than predicted13.
Lottery Earnings
The lottery forecast
has been raised
sizably relative to
last quarter.
Available resources
for the 2017-19
13 The methodology for computing alternative scenarios has been changed to reflect recent work done by the Legislative Revenue Office. Assumptions: Recessions begin in 2018 and return to baseline income by 2025. The moderate recession scenario assumes personal income growth will be reduced by one-half relative to the baseline in 2018 and 2019. The severe recession scenario assumes personal income will decline in 2018 by as much as it did in 2009. The percentage deviation in personal income taxes is 1.4 times the deviation in personal income. The percentage deviation in corporate income taxes is 2.0 times the deviation in personal income.
TABLE R2b
Baseline Case FY '16 FY '17 FY '18 FY '19 FY '20 FY '21 FY '22 FY '23 FY '24 FY '25
Personal Income
Level 183.0 188.7 197.5 209.1 220.7 231.8 241.6 254.8 266.8 279.8
% change 6.1% 3.1% 4.7% 5.9% 5.6% 5.0% 4.2% 5.4% 4.7% 4.9%
Taxes
Personal Income 7,599 8,457 8,496 8,679 9,328 9,837 10,332 10,758 11,289 11,844
Corporate Excise & Income 603 608 557 421 563 601 648 688 702 708
Other General Fund 530 759 604 734 646 669 685 705 723 742
Total General Fund 8,732 9,824 9,657 9,834 10,537 11,106 11,665 12,151 12,714 13,294
% change 3.2% 12.5% -1.7% 1.8% 7.2% 5.4% 5.0% 4.2% 4.6% 4.6%
Moderate Recession FY '16 FY '17 FY '18 FY '19 FY '20 FY '21 FY '22 FY '23 FY '24 FY '25
Personal Income
Level 183.0 188.7 192.7 199.0 212.4 225.6 237.1 251.9 264.5 277.8
% change 6.1% 3.1% 2.1% 3.3% 6.7% 6.2% 5.1% 6.2% 5.0% 5.0%
Taxes
Personal Income 7,599 8,457 8,206 8,096 8,835 9,470 10,063 10,588 11,140 11,706
Deviation from baseline -290 -584 -492 -366 -269 -170 -149 -138
Corporate Excise & Income 603 608 530 380 521 569 624 673 690 698
Deviation from baseline -27 -40 -42 -32 -24 -16 -12 -10
Other General Fund 530 759 604 734 646 669 685 705 723 742
Total General Fund 8,732 9,824 9,340 9,210 10,002 10,708 11,372 11,965 12,553 13,146
% change 3.2% 12.5% -4.9% -1.4% 8.6% 7.1% 6.2% 5.2% 4.9% 4.7%
Deviation from baseline 0 -317 -624 -535 -398 -293 -185 -161 -148
Biennial Deviation 0 -941 -933 -479 -309
Severe Recession FY '16 FY '17 FY '18 FY '19 FY '20 FY '21 FY '22 FY '23 FY '24 FY '25
Personal Income
Level 183.0 188.7 180.0 188.7 204.3 219.6 233.4 250.6 263.1 276.3
% change 6.1% 3.1% -4.6% 4.9% 8.2% 7.5% 6.3% 7.3% 5.0% 5.0%
Taxes
Personal Income 7,599 8,457 7,441 7,496 8,353 9,114 9,842 10,509 11,058 11,619
Deviation from baseline -1,055 -1,183 -975 -723 -490 -249 -231 -224
Corporate Excise & Income 496 608 459 339 479 538 604 666 682 691
Deviation from baseline -99 -82 -84 -63 -44 -23 -20 -18
Other General Fund 530 759 604 734 646 669 685 705 723 742
Total General Fund 8,625 9,824 8,503 8,569 9,478 10,321 11,132 11,879 12,463 13,052
% change 3.2% 13.9% -13.4% 0.8% 10.6% 8.9% 7.9% 6.7% 4.9% 4.7%
Deviation from baseline -1,154 -1,265 -1,059 -786 -534 -271 -251 -242
Biennial Deviation -2,418 -1,845 -805 -493
March 2018
Alternative Cyclical Revenue Forecast ($ millions)
2015-17 BN 2017-19 BN 2019-21 BN 2021-23 BN 2023-25 BN
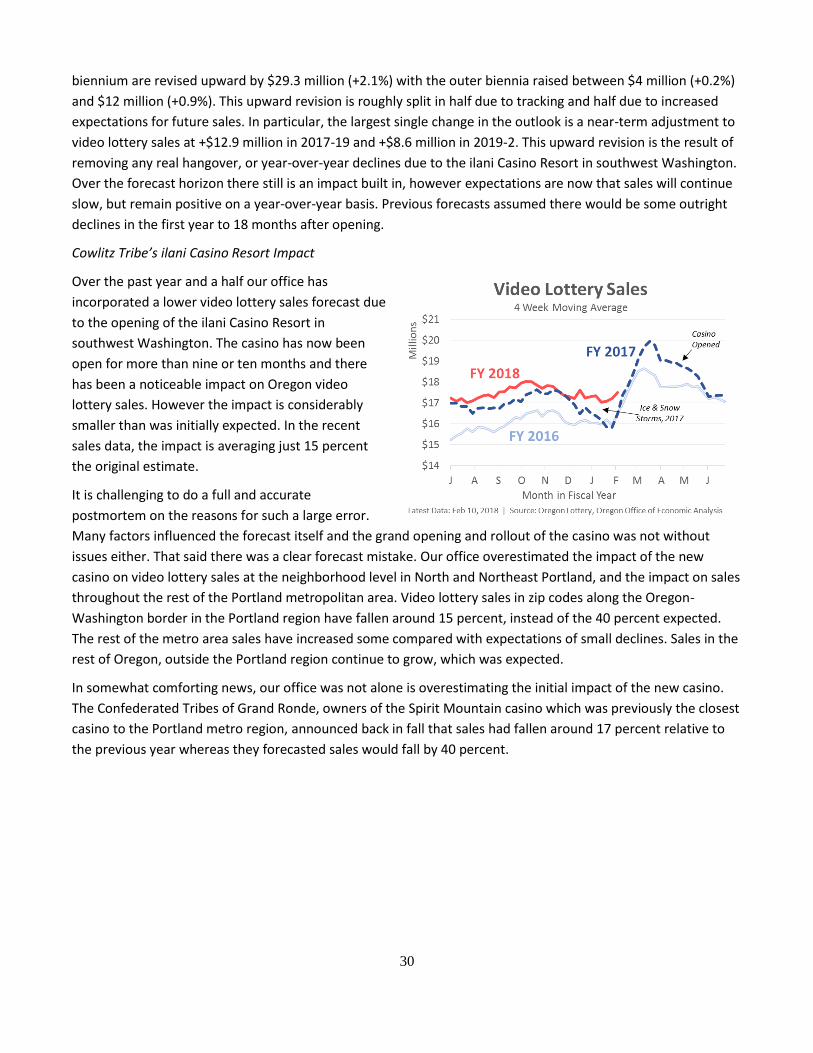
30
biennium are revised upward by $29.3 million (+2.1%) with the outer biennia raised between $4 million (+0.2%)
and $12 million (+0.9%). This upward revision is roughly split in half due to tracking and half due to increased
expectations for future sales. In particular, the largest single change in the outlook is a near-term adjustment to
video lottery sales at +$12.9 million in 2017-19 and +$8.6 million in 2019-2. This upward revision is the result of
removing any real hangover, or year-over-year declines due to the ilani Casino Resort in southwest Washington.
Over the forecast horizon there still is an impact built in, however expectations are now that sales will continue
slow, but remain positive on a year-over-year basis. Previous forecasts assumed there would be some outright
declines in the first year to 18 months after opening.
Cowlitz Tribe’s ilani Casino Resort Impact
Over the past year and a half our office has
incorporated a lower video lottery sales forecast due
to the opening of the ilani Casino Resort in
southwest Washington. The casino has now been
open for more than nine or ten months and there
has been a noticeable impact on Oregon video
lottery sales. However the impact is considerably
smaller than was initially expected. In the recent
sales data, the impact is averaging just 15 percent
the original estimate.
It is challenging to do a full and accurate
postmortem on the reasons for such a large error.
Many factors influenced the forecast itself and the grand opening and rollout of the casino was not without
issues either. That said there was a clear forecast mistake. Our office overestimated the impact of the new
casino on video lottery sales at the neighborhood level in North and Northeast Portland, and the impact on sales
throughout the rest of the Portland metropolitan area. Video lottery sales in zip codes along the Oregon-
Washington border in the Portland region have fallen around 15 percent, instead of the 40 percent expected.
The rest of the metro area sales have increased some compared with expectations of small declines. Sales in the
rest of Oregon, outside the Portland region continue to grow, which was expected.
In somewhat comforting news, our office was not alone is overestimating the initial impact of the new casino.
The Confederated Tribes of Grand Ronde, owners of the Spirit Mountain casino which was previously the closest
casino to the Portland metro region, announced back in fall that sales had fallen around 17 percent relative to
the previous year whereas they forecasted sales would fall by 40 percent.
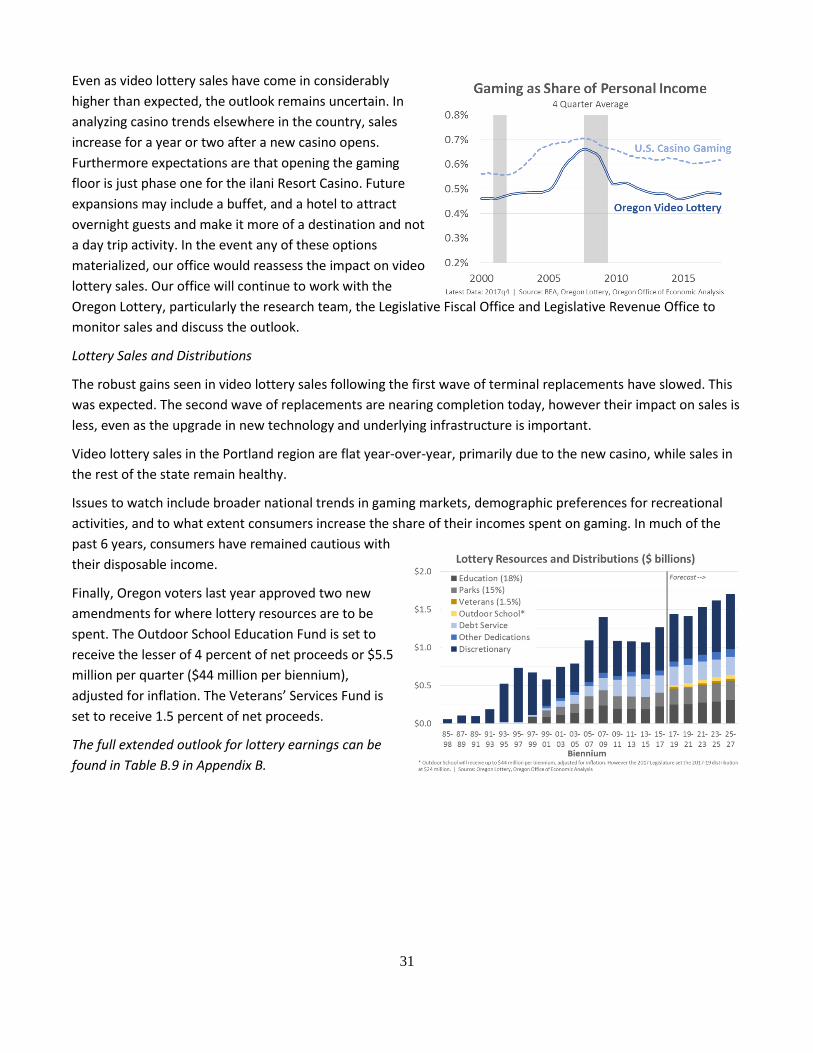
31
Even as video lottery sales have come in considerably
higher than expected, the outlook remains uncertain. In
analyzing casino trends elsewhere in the country, sales
increase for a year or two after a new casino opens.
Furthermore expectations are that opening the gaming
floor is just phase one for the ilani Resort Casino. Future
expansions may include a buffet, and a hotel to attract
overnight guests and make it more of a destination and not
a day trip activity. In the event any of these options
materialized, our office would reassess the impact on video
lottery sales. Our office will continue to work with the
Oregon Lottery, particularly the research team, the Legislative Fiscal Office and Legislative Revenue Office to
monitor sales and discuss the outlook.
Lottery Sales and Distributions
The robust gains seen in video lottery sales following the first wave of terminal replacements have slowed. This
was expected. The second wave of replacements are nearing completion today, however their impact on sales is
less, even as the upgrade in new technology and underlying infrastructure is important.
Video lottery sales in the Portland region are flat year-over-year, primarily due to the new casino, while sales in
the rest of the state remain healthy.
Issues to watch include broader national trends in gaming markets, demographic preferences for recreational
activities, and to what extent consumers increase the share of their incomes spent on gaming. In much of the
past 6 years, consumers have remained cautious with
their disposable income.
Finally, Oregon voters last year approved two new
amendments for where lottery resources are to be
spent. The Outdoor School Education Fund is set to
receive the lesser of 4 percent of net proceeds or $5.5
million per quarter ($44 million per biennium),
adjusted for inflation. The Veterans’ Services Fund is
set to receive 1.5 percent of net proceeds.
The full extended outlook for lottery earnings can be
found in Table B.9 in Appendix B.
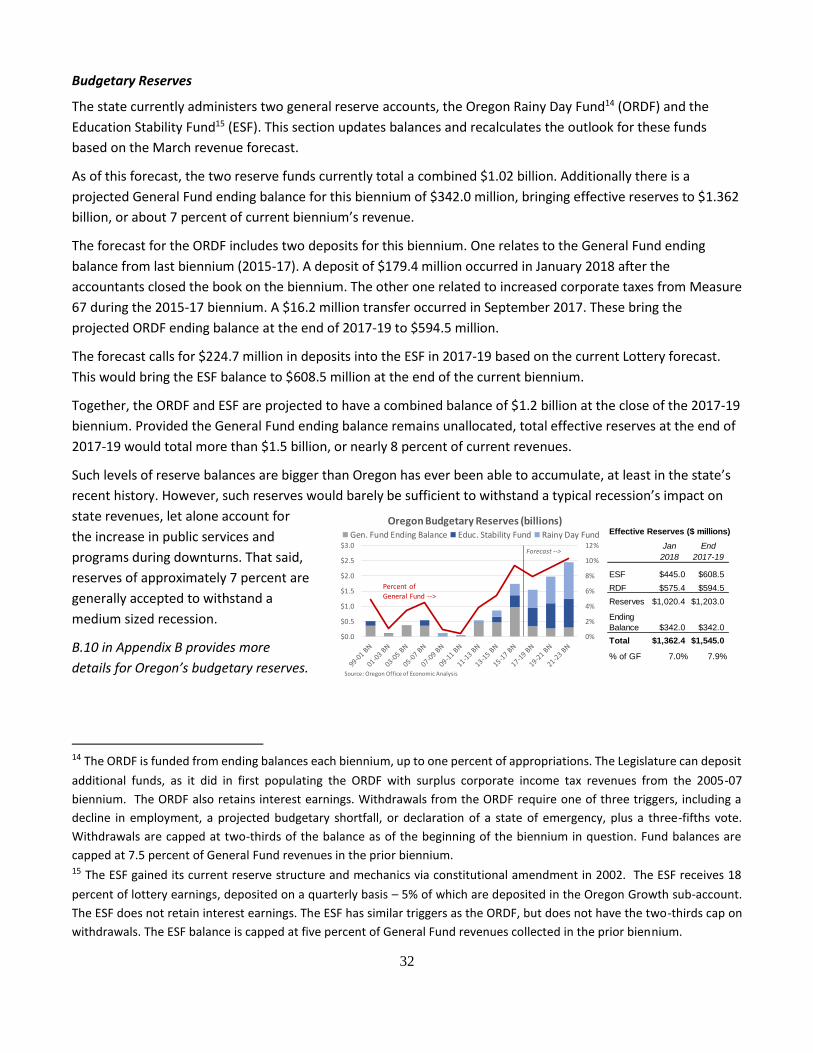
32
Budgetary Reserves
The state currently administers two general reserve accounts, the Oregon Rainy Day Fund14 (ORDF) and the
Education Stability Fund15 (ESF). This section updates balances and recalculates the outlook for these funds
based on the March revenue forecast.
As of this forecast, the two reserve funds currently total a combined $1.02 billion. Additionally there is a
projected General Fund ending balance for this biennium of $342.0 million, bringing effective reserves to $1.362
billion, or about 7 percent of current biennium’s revenue.
The forecast for the ORDF includes two deposits for this biennium. One relates to the General Fund ending
balance from last biennium (2015-17). A deposit of $179.4 million occurred in January 2018 after the
accountants closed the book on the biennium. The other one related to increased corporate taxes from Measure
67 during the 2015-17 biennium. A $16.2 million transfer occurred in September 2017. These bring the
projected ORDF ending balance at the end of 2017-19 to $594.5 million.
The forecast calls for $224.7 million in deposits into the ESF in 2017-19 based on the current Lottery forecast.
This would bring the ESF balance to $608.5 million at the end of the current biennium.
Together, the ORDF and ESF are projected to have a combined balance of $1.2 billion at the close of the 2017-19
biennium. Provided the General Fund ending balance remains unallocated, total effective reserves at the end of
2017-19 would total more than $1.5 billion, or nearly 8 percent of current revenues.
Such levels of reserve balances are bigger than Oregon has ever been able to accumulate, at least in the state’s
recent history. However, such reserves would barely be sufficient to withstand a typical recession’s impact on
state revenues, let alone account for
the increase in public services and
programs during downturns. That said,
reserves of approximately 7 percent are
generally accepted to withstand a
medium sized recession.
B.10 in Appendix B provides more
details for Oregon’s budgetary reserves.
14 The ORDF is funded from ending balances each biennium, up to one percent of appropriations. The Legislature can deposit
additional funds, as it did in first populating the ORDF with surplus corporate income tax revenues from the 2005-07
biennium. The ORDF also retains interest earnings. Withdrawals from the ORDF require one of three triggers, including a
decline in employment, a projected budgetary shortfall, or declaration of a state of emergency, plus a three-fifths vote.
Withdrawals are capped at two-thirds of the balance as of the beginning of the biennium in question. Fund balances are
capped at 7.5 percent of General Fund revenues in the prior biennium. 15 The ESF gained its current reserve structure and mechanics via constitutional amendment in 2002. The ESF receives 18
percent of lottery earnings, deposited on a quarterly basis – 5% of which are deposited in the Oregon Growth sub-account.
The ESF does not retain interest earnings. The ESF has similar triggers as the ORDF, but does not have the two-thirds cap on
withdrawals. The ESF balance is capped at five percent of General Fund revenues collected in the prior biennium.
Effective Reserves ($ millions)
Jan
2018
End
2017-19
ESF $445.0 $608.5
RDF $575.4 $594.5
Reserves $1,020.4 $1,203.0
Ending
Balance $342.0 $342.0
Total $1,362.4 $1,545.0
% of GF 7.0% 7.9%
0%
2%
4%
6%
8%
10%
12%
$0.0
$0.5
$1.0
$1.5
$2.0
$2.5
$3.0
Oregon Budgetary Reserves (billions)Gen. Fund Ending Balance Educ. Stability Fund Rainy Day Fund
Forecast -->
Percent of
General Fund -->
Source: Oregon Office of Economic Analysis
33
Recreational Marijuana Tax Collections
During the most recent legislative session, HB 3470 officially gave our office the responsibilities for forecasting
recreational marijuana taxes. Overall our office’s baseline outlook remains essentially unchanged given it has
tracked well since our very first such forecast back in May 2017. That said, after accounting for sales coming in
slightly above expectations in recent months and updating the program’s administrative costs, the net change to
the forecast for 2017-19 is +$0.6 million. The outer biennia each see a net $0.2 million reduction as the sales
outlook remains unchanged and administrative costs are updated to better reflect ongoing program costs.
Recreational Marijuana Forecast Process
In developing this outlook, our office held another preliminary forecast meeting with stakeholders from state
agencies, local governments and industry professionals. Our office also spoke again with our counterparts in
both Colorado and Washington to better understand what their experiences and to discuss marketplace trends.
Moving forward, our office will continue to work with stakeholders and those who can advise us on industry and
consumer trends, regulatory impacts, issues to watch, and the like.
Currently the outlook for recreational marijuana sales and tax collections remains highly uncertain. While
Oregon has now collected nearly two years’ worth of taxes, there have been substantial changes during this
time that complicate any analysis. Early start sales through medical dispensaries were taxed at a 25 percent of
rate, while sales at OLCC licensed retailers are now taxed at a 17 percent rate, with the local option of adding up
to 3 additional percent. Furthermore, regulatory changes, more stringent product testing requirements, and
Mother Nature all impacted and reduced available supply on the market during this time.
Combined, it is challenging to get a handle on the underlying trends in this newly legalized world. Thankfully,
Oregon is not alone. Both Colorado and Washington are two years ahead of Oregon. Both states have seen
tremendous growth in sales and tax collections, which serves as a guide for where Oregon is likely headed in the
near-term. Over time, as the market matures, future growth will follow trends in the economy and consumer
spending. However the coming few years will see strong growth as the product becomes more widely available,
more socially acceptable, and more black and gray market sales are realized in the legal market.
Almost two years’ worth of tax collections, and one set of quarterly tax returns filed by dispensaries is certainly
more valuable than no data. Our office’s forecasting responsibilities are made considerably easier than what
faced those estimating the potential impact of Measure 91 (2014) which legalized recreational sales. That said,
not quite two years’ worth of data is not enough to build a full-fledged forecasting model, particularly when it is
a brand new legal market. Over time, as we accumulate more data, a longer history of sales, and detailed
breakdowns of consumer purchases and consumer demographics, our office will build an econometric model.
Until then, in consultation with our advisory group, and using Colorado and Washington as a guide, our office is
relying on trends for the short-term outlook.
Recent Market Trends and State Comparisons
So far, Oregon’s first two years of recreational sales closely tracks Colorado’s first two years and outpaces
Washington’s, after controlling for the fact both states have larger populations than Oregon. There are at least
four main reasons for this pattern.
First, Oregon’s marijuana usage rates are higher than those seen in Washington. In fact, in the most recent
survey data from 2015-2016, Oregon saw a large increase in reported usage. As such, Oregon is more likely to
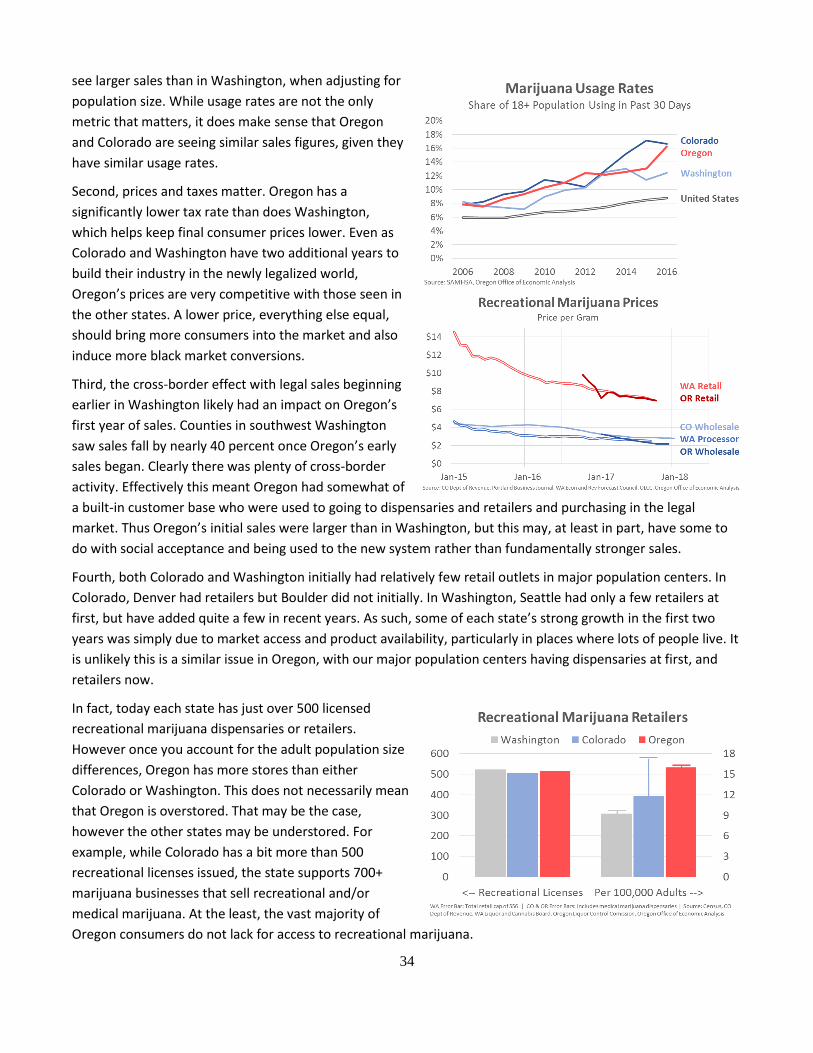
34
see larger sales than in Washington, when adjusting for
population size. While usage rates are not the only
metric that matters, it does make sense that Oregon
and Colorado are seeing similar sales figures, given they
have similar usage rates.
Second, prices and taxes matter. Oregon has a
significantly lower tax rate than does Washington,
which helps keep final consumer prices lower. Even as
Colorado and Washington have two additional years to
build their industry in the newly legalized world,
Oregon’s prices are very competitive with those seen in
the other states. A lower price, everything else equal,
should bring more consumers into the market and also
induce more black market conversions.
Third, the cross-border effect with legal sales beginning
earlier in Washington likely had an impact on Oregon’s
first year of sales. Counties in southwest Washington
saw sales fall by nearly 40 percent once Oregon’s early
sales began. Clearly there was plenty of cross-border
activity. Effectively this meant Oregon had somewhat of
a built-in customer base who were used to going to dispensaries and retailers and purchasing in the legal
market. Thus Oregon’s initial sales were larger than in Washington, but this may, at least in part, have some to
do with social acceptance and being used to the new system rather than fundamentally stronger sales.
Fourth, both Colorado and Washington initially had relatively few retail outlets in major population centers. In
Colorado, Denver had retailers but Boulder did not initially. In Washington, Seattle had only a few retailers at
first, but have added quite a few in recent years. As such, some of each state’s strong growth in the first two
years was simply due to market access and product availability, particularly in places where lots of people live. It
is unlikely this is a similar issue in Oregon, with our major population centers having dispensaries at first, and
retailers now.
In fact, today each state has just over 500 licensed
recreational marijuana dispensaries or retailers.
However once you account for the adult population size
differences, Oregon has more stores than either
Colorado or Washington. This does not necessarily mean
that Oregon is overstored. That may be the case,
however the other states may be understored. For
example, while Colorado has a bit more than 500
recreational licenses issued, the state supports 700+
marijuana businesses that sell recreational and/or
medical marijuana. At the least, the vast majority of
Oregon consumers do not lack for access to recreational marijuana.
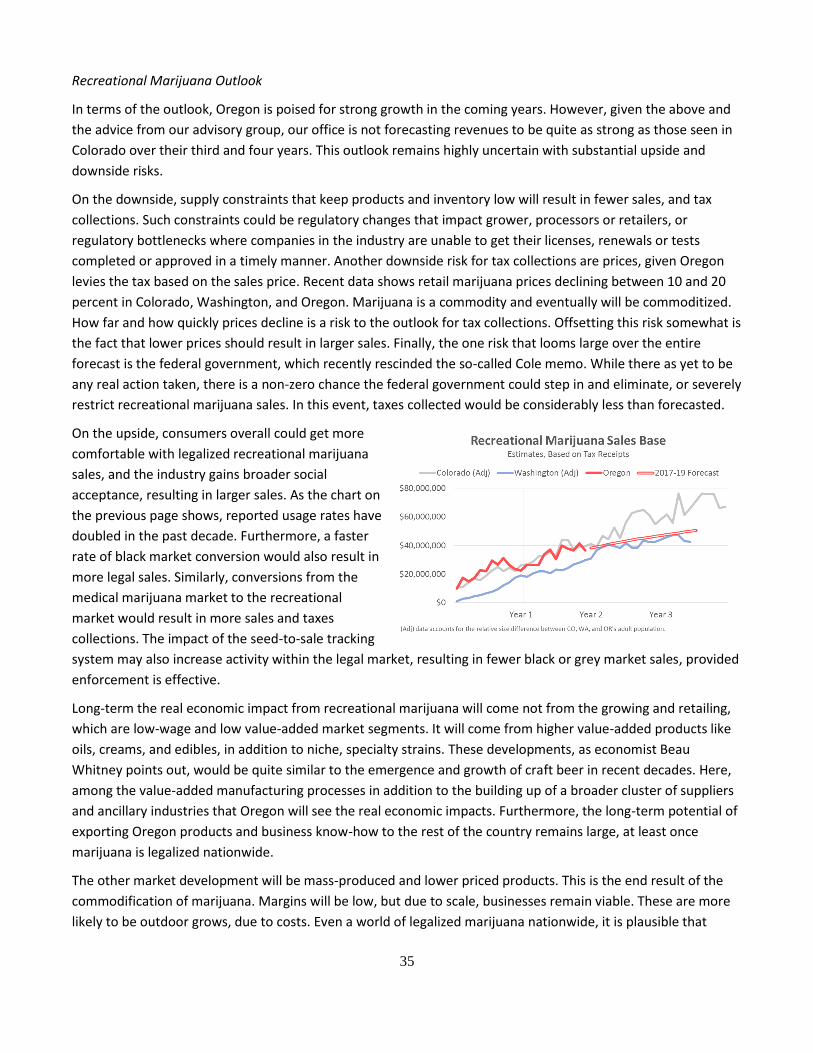
35
Recreational Marijuana Outlook
In terms of the outlook, Oregon is poised for strong growth in the coming years. However, given the above and
the advice from our advisory group, our office is not forecasting revenues to be quite as strong as those seen in
Colorado over their third and four years. This outlook remains highly uncertain with substantial upside and
downside risks.
On the downside, supply constraints that keep products and inventory low will result in fewer sales, and tax
collections. Such constraints could be regulatory changes that impact grower, processors or retailers, or
regulatory bottlenecks where companies in the industry are unable to get their licenses, renewals or tests
completed or approved in a timely manner. Another downside risk for tax collections are prices, given Oregon
levies the tax based on the sales price. Recent data shows retail marijuana prices declining between 10 and 20
percent in Colorado, Washington, and Oregon. Marijuana is a commodity and eventually will be commoditized.
How far and how quickly prices decline is a risk to the outlook for tax collections. Offsetting this risk somewhat is
the fact that lower prices should result in larger sales. Finally, the one risk that looms large over the entire
forecast is the federal government, which recently rescinded the so-called Cole memo. While there as yet to be
any real action taken, there is a non-zero chance the federal government could step in and eliminate, or severely
restrict recreational marijuana sales. In this event, taxes collected would be considerably less than forecasted.
On the upside, consumers overall could get more
comfortable with legalized recreational marijuana
sales, and the industry gains broader social
acceptance, resulting in larger sales. As the chart on
the previous page shows, reported usage rates have
doubled in the past decade. Furthermore, a faster
rate of black market conversion would also result in
more legal sales. Similarly, conversions from the
medical marijuana market to the recreational
market would result in more sales and taxes
collections. The impact of the seed-to-sale tracking
system may also increase activity within the legal market, resulting in fewer black or grey market sales, provided
enforcement is effective.
Long-term the real economic impact from recreational marijuana will come not from the growing and retailing,
which are low-wage and low value-added market segments. It will come from higher value-added products like
oils, creams, and edibles, in addition to niche, specialty strains. These developments, as economist Beau
Whitney points out, would be quite similar to the emergence and growth of craft beer in recent decades. Here,
among the value-added manufacturing processes in addition to the building up of a broader cluster of suppliers
and ancillary industries that Oregon will see the real economic impacts. Furthermore, the long-term potential of
exporting Oregon products and business know-how to the rest of the country remains large, at least once
marijuana is legalized nationwide.
The other market development will be mass-produced and lower priced products. This is the end result of the
commodification of marijuana. Margins will be low, but due to scale, businesses remain viable. These are more
likely to be outdoor grows, due to costs. Even a world of legalized marijuana nationwide, it is plausible that

36
Oregon, along with California, would remain a national leader in this market due to agricultural and growing
conditions in the Emerald Triangle.
See Table B.11 in Appendix B for a full breakdown of distributions for recreational marijuana tax collections. Note
that these distributions are based on current law.
37
POPULATION AND DEMOGRAPHIC OUTLOOK
Population and Demographic Summary
Oregon’s population count on April 1, 2010 was 3,831,074. Oregon gained 409,550 persons between the years
2000 and 2010. The population growth during the decade of 2000 to 2010 was 12.0 percent, down from 20.4
percent growth from the previous decade. Oregon’s rankings in terms of decennial growth rate dropped from
11th between 1990-2000 to 18th between 2000 and 2010. Oregon’s national ranking, including D.C., in
population growth rate was 12th between 2010 and 2016 lagging behind all of the neighboring states, except
California. Slow population growth during the decade preceding the 2010 Census characterized by double
recessions probably cost Oregon one additional seat in the U.S. House of Representatives. Actually, Oregon’s
decennial population growth rate during the most recent decade was the second lowest since 1900. As a result
of economic downturn and sluggish recovery that followed, Oregon’s population increased at a slow pace in the
recent past. However, Oregon’s current population is showing very strong growth as a consequence of state’s
strong economic recovery. Population growth between 2015 and 2016 was 6th fastest in the nation. Based on
the current forecast, Oregon’s population of 4.14 million in 2017 will reach 4.63 million in the year 2026 with an
annual rate of growth of 1.2 percent between 2017 and 2026.
Oregon’s economic condition heavily influences the state’s population growth. Its economy determines the
ability to retain existing work force as well as attract job seekers from national and international labor market.
As Oregon’s total fertility rate remains below the replacement level and number of deaths continue to rise due
to ageing population, long-term growth comes mainly from net in-migration. Working-age adults come to
Oregon as long as we have favorable economic and employment environments. During the 1980s, which include
a major recession and a net loss of population during the early years, net migration contributed to 22 percent of
the population change. On the other extreme, net migration accounted for 76 percent of the population change
during the booming economy of early 1990s. This share of migration to population change declined to 32
percent in 2010, lowest since early 1980s when we actually had negative net migration for several years. As a
sign of slow to modest economic gain, the ratio of net migration-to-population change has already exceeded 80
percent and remain that way throughout the forecast horizon due largely to combination of continued high net
migration and rise in the number of deaths among elderly population associated with increasing number of
elderly population. Although economy and employment situation in Oregon looked stagnant in the recent past,
migration situation was not similar to the early 1980s pattern of negative net migration. Potential Oregon out-
migrants had no better place to go since other states were also in the same boat in terms of economy and
employment. California is the number one state of origin of migrants to Oregon. With improvement in
California’s housing market and Oregon’s growing economy continues, we expect positive impact on Oregon’s
net migration.
Age structure and its change affect employment, state revenue, and expenditure. Demographics are the major
budget drivers, which are modified by policy choices on service coverage and delivery. Growth in many age
groups will show the effects of the baby-boom and their echo generations during the period of 2017-2026. It will
also reflect demographics impacted by the depression era birth cohort combined with diminished migration of
working age population and elderly retirees. After a period of slow growth during the 1990s and early 2000s,
the elderly population (65+) has picked up a faster pace of growth and will surge to the record high levels as the
baby-boom generation continue to enter this age group and attrition of small depression era cohort due to
death. The average annual growth of the elderly population will be 3.4 percent during the 2017-2026 forecast
38
period. However, the youngest elderly (aged 65-74) has been growing at an extremely fast pace in the recent
past and will continue the trend in the near future exceeding 4 percent annual rate of growth due to the direct
impact of the baby-boom generation entering the retirement age and smaller pre-baby boom cohort exiting the
65-74 age group. This fast paced growth rate will taper off to below one percent by the end of the forecast
period as a sign of baby-boom generation’s transition to elderly age group. Reversing several years of slow
growth and shrinking population, the elderly aged 75-84 started to show a positive growth as the effect of
depression era birth-cohort has dissipated. An unprecedented fast pace of growth of population in this age
group has started as the baby-boom generation starts to mature into 75-84 age group. Annual growth rate
during the forecast period is expected to be unusually high 5.7 percent. The oldest elderly (aged 85+) will
continue to grow at a slow but steady rate in the near future due to the combination of cohort change,
continued positive net migration, and improving longevity. The average annual rate of growth for this oldest
elderly over the forecast horizon will be 2.0 percent. An unprecedented growth in oldest elderly will commence
near the end of the forecast horizon.
As the baby-boom generation matures out of oldest working-age cohort combined with slowing net migration,
the once fast-paced growth of population aged 45-64 has gradually tapered off to below zero percent rate of
growth by 2012 and will remain at slow or below zero growth phase for several years. The size of this older
working-age population will remain virtually unchanged at the beginning to the end of the forecast period. The
25-44 age group population is recovering from several years of declining and slow growing trend. The decline
was mainly due to the exiting baby-boom cohort. This age group has seen positive growth starting in the year
2004 and will increase by 1.7 percent annual average rate during the forecast horizon mainly because of the
exiting smaller birth (baby-bust) cohort being replaced by baby-boom echo cohort. The young adult population
(aged 18-24) will remain nearly unchanged over the forecast period. Although the slow or stagnant growth of
college-age population (age 18-24), in general, tend to ease the pressure on public spending on higher
education, college enrollment typically goes up during the time of very competitive job market, high
unemployment, and scarcity of well-paying jobs when even the older people flock back to colleges to better
position themselves in a tough job market. The growth in K-12 population (aged 5-17) will remain very low
which will translate into slow growth in school enrollments. This school-age population has actually declined in
size in recent past years and will grow in the future at well below the overall state average. The growth rate for
children under the age of five has remained below or near zero percent in the recent past due to the sharp
decline in the number of births. This cohort of children will see steady positive growth after 2016. Although the
number of children under the age of five declined in the recent years, the demand for child care services and
pre-Kindergarten program will be additionally determined by the labor force participation and poverty rates of
the parents. Overall, elderly population over age 65 will increase rapidly whereas population groups under age
65 will experience slow growth in the coming years. Hence, based solely on demographics of Oregon, demand
for public services geared towards children and young adults will likely to increase at a slower pace, whereas
demand for elderly care and services will increase rapidly.
Procedure and Assumptions
Population forecasts by age and sex are developed using the cohort-component projection procedure. The
population by single year of age and sex is projected based on the specific assumptions of vital events and
migrations. Oregon’s estimated population of July 1, 2010 based on the most recent decennial census is the
base for the forecast. To explain the cohort-component projection procedure very briefly, the forecasting model
39
"survives" the initial population distribution by age and sex to the next age-sex category in the following year,
and then applies age-sex-specific birth and migration rates to the mid-period population. Further iterations
subject the in-and-out migrants to the same mortality and fertility rates.
Populations by age-sex detail for the years 2000 through 2009, called intercensal estimates, in the following
tables are developed by OEA based on 2000 and 2010 censuses. Post-censal population totals for the years 2010
through 2015 are from the Population Research Center, Portland State University. The numbers of births and
deaths through 2015 are from Oregon's Center for Health Statistics. All other numbers and age-sex detail are
generated by OEA.
Annual numbers of births are determined from the age-specific fertility rates projected based on Oregon's past
trends and past and projected national trends. Oregon's total fertility rate is assumed to remain below the
replacement level of 2.1 children per woman during the forecast period, tracking at slightly lower than the
national rate.
Life Table survival rates are developed for the year 2010. Male and female life expectancies for the 2010-202
period are projected based on the past three decades of trends and national projected life expectancies.
Gradual improvements in life expectancies are expected over the forecast period. At the same time, the
difference between the male and female life expectancies will continue to shrink. The male life expectancy at
births of 77.4 and the female life expectancy of 81.8 in 2010 are projected to improve to 79.0 years for males
and 83.2 years for females by the year 2026.
Estimates and forecasts of the number of net migrations are based on the residuals from the difference between
population change and natural increase (births minus deaths) in a given forecast period. The migration
forecasting model uses Oregon’s employment, unemployment rates, income/wage data from Oregon and
neighboring states, and past trends. Distribution of migrants by age and sex is based on detailed data from the
American Community Survey. The annual net migration between 2017 and 2026 is expected to remain in the
range of 44,500 to 53,400, averaging 47,600 persons annually. Slowdown in Oregon’s economy in the recent
years resulted in smaller net migration and slow population growth. Estimated population growth and net
migration rates in 2010 and 2011 were the lowest in over two decades. Oregon’s population growth has already
rebounded and will continue high rate of growth in the near future. Migration is intrinsically related to economy
and employment situation of the state. Still, high unemployment and job loss in the recent past have impacted
net migration and population growth, but not to the extent in the early 1980s. Main reason for this is the fact
that other states of potential destination for Oregon out-migrants were not faring any better either. Hence the
potential out-migrants had very limited destination choices. The future growth will not look like high growth
period of 1990s. The role of net migration in Oregon’s population growth will get more prominence as the
natural increase will decline considerably due to rapid increase in the number of deaths associated with ageing
population.

40
APPENDIX A: ECONOMIC FORECAST DETAIL
Table A.1 Employment Forecast Tracking …………………………………................................................. 41
Table A.2 Short-term Oregon Economic Summary ………………...................................................... 42
Table A.3 Oregon Economic Forecast Change ………………………………….……………………….…………… 43
Table A.4 Annual Economic Forecast ……………………………………………….……………..………………………. 44
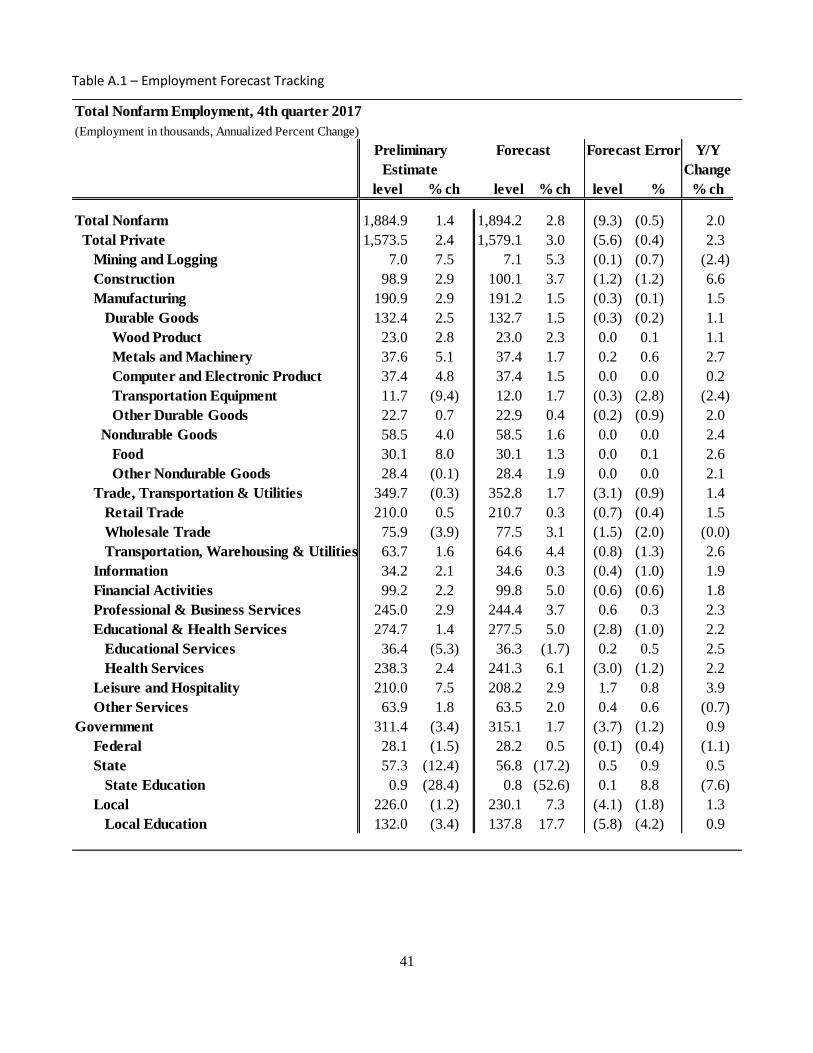
41
Table A.1 – Employment Forecast Tracking
Total Nonfarm Employment, 4th quarter 2017
(Employment in thousands, Annualized Percent Change)
Y/Y
Change
level % ch level % ch level % % ch
Total Nonfarm 1,884.9 1.4 1,894.2 2.8 (9.3) (0.5) 2.0
Total Private 1,573.5 2.4 1,579.1 3.0 (5.6) (0.4) 2.3
Mining and Logging 7.0 7.5 7.1 5.3 (0.1) (0.7) (2.4)
Construction 98.9 2.9 100.1 3.7 (1.2) (1.2) 6.6
Manufacturing 190.9 2.9 191.2 1.5 (0.3) (0.1) 1.5
Durable Goods 132.4 2.5 132.7 1.5 (0.3) (0.2) 1.1
Wood Product 23.0 2.8 23.0 2.3 0.0 0.1 1.1
Metals and Machinery 37.6 5.1 37.4 1.7 0.2 0.6 2.7
Computer and Electronic Product 37.4 4.8 37.4 1.5 0.0 0.0 0.2
Transportation Equipment 11.7 (9.4) 12.0 1.7 (0.3) (2.8) (2.4)
Other Durable Goods 22.7 0.7 22.9 0.4 (0.2) (0.9) 2.0
Nondurable Goods 58.5 4.0 58.5 1.6 0.0 0.0 2.4
Food 30.1 8.0 30.1 1.3 0.0 0.1 2.6
Other Nondurable Goods 28.4 (0.1) 28.4 1.9 0.0 0.0 2.1
Trade, Transportation & Utilities 349.7 (0.3) 352.8 1.7 (3.1) (0.9) 1.4
Retail Trade 210.0 0.5 210.7 0.3 (0.7) (0.4) 1.5
Wholesale Trade 75.9 (3.9) 77.5 3.1 (1.5) (2.0) (0.0)
Transportation, Warehousing & Utilities 63.7 1.6 64.6 4.4 (0.8) (1.3) 2.6
Information 34.2 2.1 34.6 0.3 (0.4) (1.0) 1.9
Financial Activities 99.2 2.2 99.8 5.0 (0.6) (0.6) 1.8
Professional & Business Services 245.0 2.9 244.4 3.7 0.6 0.3 2.3
Educational & Health Services 274.7 1.4 277.5 5.0 (2.8) (1.0) 2.2
Educational Services 36.4 (5.3) 36.3 (1.7) 0.2 0.5 2.5
Health Services 238.3 2.4 241.3 6.1 (3.0) (1.2) 2.2
Leisure and Hospitality 210.0 7.5 208.2 2.9 1.7 0.8 3.9
Other Services 63.9 1.8 63.5 2.0 0.4 0.6 (0.7)
Government 311.4 (3.4) 315.1 1.7 (3.7) (1.2) 0.9
Federal 28.1 (1.5) 28.2 0.5 (0.1) (0.4) (1.1)
State 57.3 (12.4) 56.8 (17.2) 0.5 0.9 0.5
State Education 0.9 (28.4) 0.8 (52.6) 0.1 8.8 (7.6)
Local 226.0 (1.2) 230.1 7.3 (4.1) (1.8) 1.3
Local Education 132.0 (3.4) 137.8 17.7 (5.8) (4.2) 0.9
Estimate
Preliminary Forecast ErrorForecast
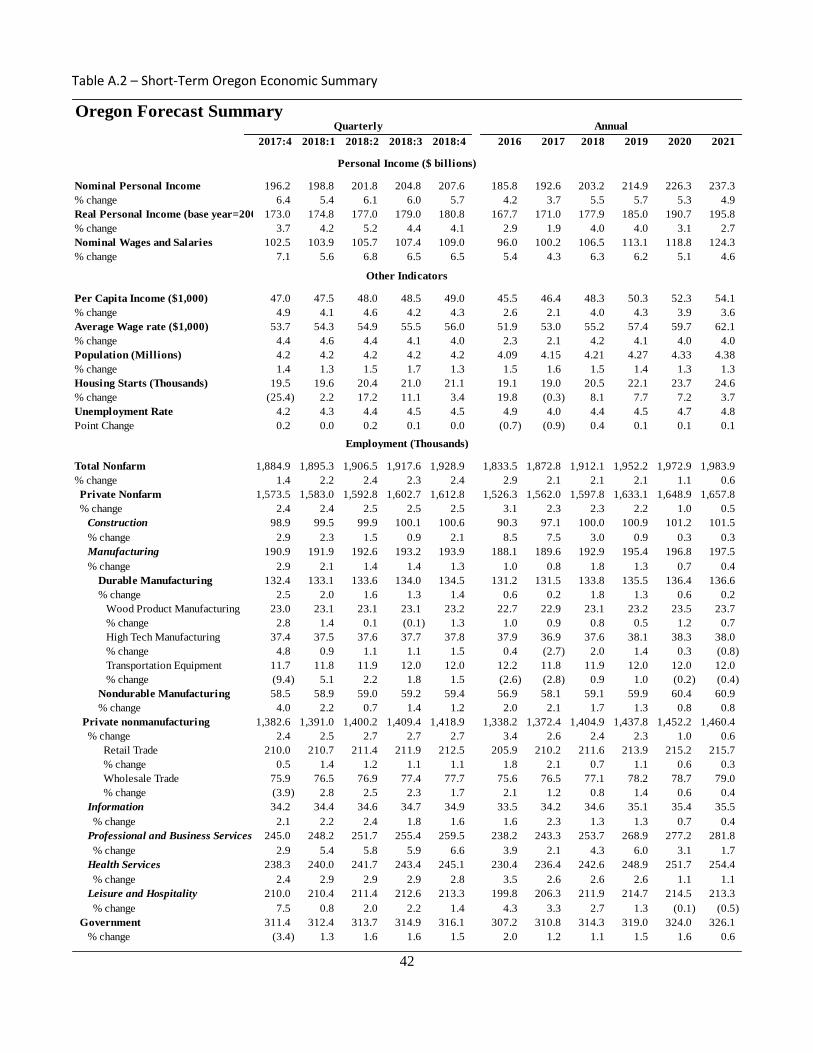
42
Table A.2 – Short-Term Oregon Economic Summary
Oregon Forecast Summary
2017:4 2018:1 2018:2 2018:3 2018:4 2016 2017 2018 2019 2020 2021
Nominal Personal Income 196.2 198.8 201.8 204.8 207.6 185.8 192.6 203.2 214.9 226.3 237.3
% change 6.4 5.4 6.1 6.0 5.7 4.2 3.7 5.5 5.7 5.3 4.9
173.0 174.8 177.0 179.0 180.8 167.7 171.0 177.9 185.0 190.7 195.8
% change 3.7 4.2 5.2 4.4 4.1 2.9 1.9 4.0 4.0 3.1 2.7
Nominal Wages and Salaries 102.5 103.9 105.7 107.4 109.0 96.0 100.2 106.5 113.1 118.8 124.3
% change 7.1 5.6 6.8 6.5 6.5 5.4 4.3 6.3 6.2 5.1 4.6
Per Capita Income ($1,000) 47.0 47.5 48.0 48.5 49.0 45.5 46.4 48.3 50.3 52.3 54.1
% change 4.9 4.1 4.6 4.2 4.3 2.6 2.1 4.0 4.3 3.9 3.6
Average Wage rate ($1,000) 53.7 54.3 54.9 55.5 56.0 51.9 53.0 55.2 57.4 59.7 62.1
% change 4.4 4.6 4.4 4.1 4.0 2.3 2.1 4.2 4.1 4.0 4.0
Population (Millions) 4.2 4.2 4.2 4.2 4.2 4.09 4.15 4.21 4.27 4.33 4.38
% change 1.4 1.3 1.5 1.7 1.3 1.5 1.6 1.5 1.4 1.3 1.3
Housing Starts (Thousands) 19.5 19.6 20.4 21.0 21.1 19.1 19.0 20.5 22.1 23.7 24.6
% change (25.4) 2.2 17.2 11.1 3.4 19.8 (0.3) 8.1 7.7 7.2 3.7
Unemployment Rate 4.2 4.3 4.4 4.5 4.5 4.9 4.0 4.4 4.5 4.7 4.8
Point Change 0.2 0.0 0.2 0.1 0.0 (0.7) (0.9) 0.4 0.1 0.1 0.1
Total Nonfarm 1,884.9 1,895.3 1,906.5 1,917.6 1,928.9 1,833.5 1,872.8 1,912.1 1,952.2 1,972.9 1,983.9
% change 1.4 2.2 2.4 2.3 2.4 2.9 2.1 2.1 2.1 1.1 0.6
Private Nonfarm 1,573.5 1,583.0 1,592.8 1,602.7 1,612.8 1,526.3 1,562.0 1,597.8 1,633.1 1,648.9 1,657.8
% change 2.4 2.4 2.5 2.5 2.5 3.1 2.3 2.3 2.2 1.0 0.5
Construction 98.9 99.5 99.9 100.1 100.6 90.3 97.1 100.0 100.9 101.2 101.5
% change 2.9 2.3 1.5 0.9 2.1 8.5 7.5 3.0 0.9 0.3 0.3
Manufacturing 190.9 191.9 192.6 193.2 193.9 188.1 189.6 192.9 195.4 196.8 197.5
% change 2.9 2.1 1.4 1.4 1.3 1.0 0.8 1.8 1.3 0.7 0.4
Durable Manufacturing 132.4 133.1 133.6 134.0 134.5 131.2 131.5 133.8 135.5 136.4 136.6
% change 2.5 2.0 1.6 1.3 1.4 0.6 0.2 1.8 1.3 0.6 0.2
Wood Product Manufacturing 23.0 23.1 23.1 23.1 23.2 22.7 22.9 23.1 23.2 23.5 23.7
% change 2.8 1.4 0.1 (0.1) 1.3 1.0 0.9 0.8 0.5 1.2 0.7
High Tech Manufacturing 37.4 37.5 37.6 37.7 37.8 37.9 36.9 37.6 38.1 38.3 38.0
% change 4.8 0.9 1.1 1.1 1.5 0.4 (2.7) 2.0 1.4 0.3 (0.8)
Transportation Equipment 11.7 11.8 11.9 12.0 12.0 12.2 11.8 11.9 12.0 12.0 12.0
% change (9.4) 5.1 2.2 1.8 1.5 (2.6) (2.8) 0.9 1.0 (0.2) (0.4)
Nondurable Manufacturing 58.5 58.9 59.0 59.2 59.4 56.9 58.1 59.1 59.9 60.4 60.9
% change 4.0 2.2 0.7 1.4 1.2 2.0 2.1 1.7 1.3 0.8 0.8
Private nonmanufacturing 1,382.6 1,391.0 1,400.2 1,409.4 1,418.9 1,338.2 1,372.4 1,404.9 1,437.8 1,452.2 1,460.4
% change 2.4 2.5 2.7 2.7 2.7 3.4 2.6 2.4 2.3 1.0 0.6
Retail Trade 210.0 210.7 211.4 211.9 212.5 205.9 210.2 211.6 213.9 215.2 215.7
% change 0.5 1.4 1.2 1.1 1.1 1.8 2.1 0.7 1.1 0.6 0.3
Wholesale Trade 75.9 76.5 76.9 77.4 77.7 75.6 76.5 77.1 78.2 78.7 79.0
% change (3.9) 2.8 2.5 2.3 1.7 2.1 1.2 0.8 1.4 0.6 0.4
Information 34.2 34.4 34.6 34.7 34.9 33.5 34.2 34.6 35.1 35.4 35.5
% change 2.1 2.2 2.4 1.8 1.6 1.6 2.3 1.3 1.3 0.7 0.4
Professional and Business Services 245.0 248.2 251.7 255.4 259.5 238.2 243.3 253.7 268.9 277.2 281.8
% change 2.9 5.4 5.8 5.9 6.6 3.9 2.1 4.3 6.0 3.1 1.7
Health Services 238.3 240.0 241.7 243.4 245.1 230.4 236.4 242.6 248.9 251.7 254.4
% change 2.4 2.9 2.9 2.9 2.8 3.5 2.6 2.6 2.6 1.1 1.1
Leisure and Hospitality 210.0 210.4 211.4 212.6 213.3 199.8 206.3 211.9 214.7 214.5 213.3
% change 7.5 0.8 2.0 2.2 1.4 4.3 3.3 2.7 1.3 (0.1) (0.5)
Government 311.4 312.4 313.7 314.9 316.1 307.2 310.8 314.3 319.0 324.0 326.1
% change (3.4) 1.3 1.6 1.6 1.5 2.0 1.2 1.1 1.5 1.6 0.6
Personal Income ($ billions)
Other Indicators
Employment (Thousands)
Annual
Real Personal Income (base year=2005)
Quarterly
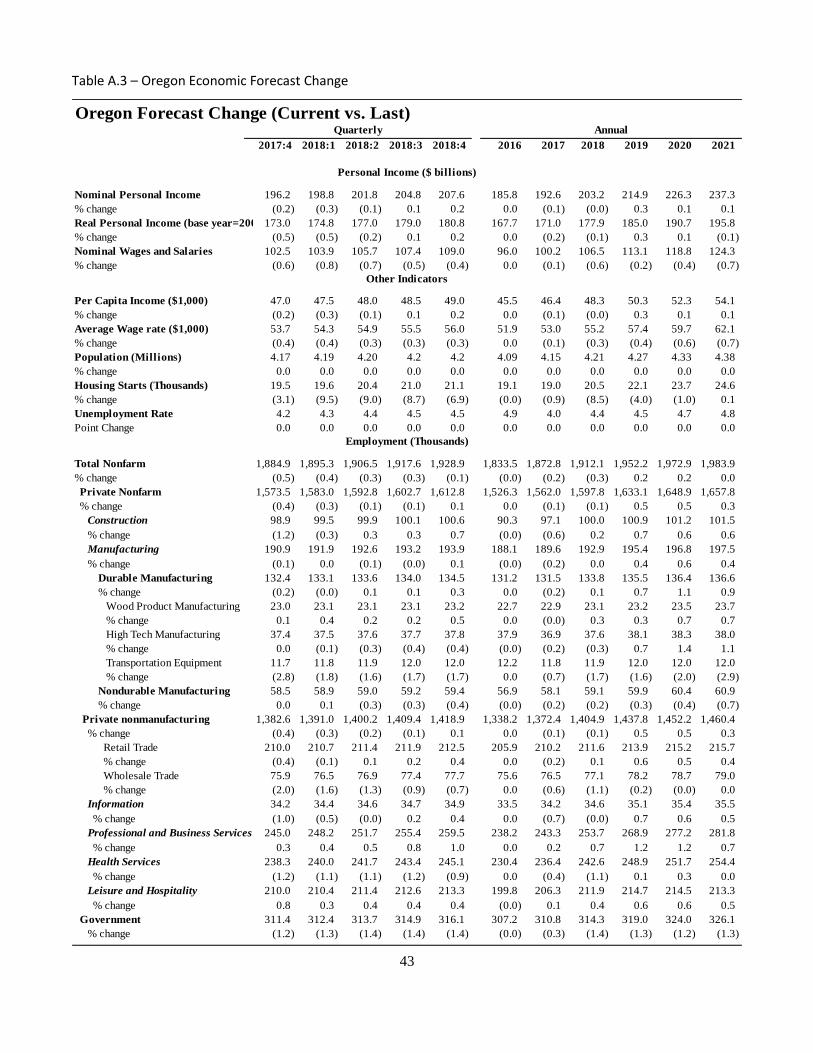
43
Table A.3 – Oregon Economic Forecast Change
Oregon Forecast Change (Current vs. Last)
2017:4 2018:1 2018:2 2018:3 2018:4 2016 2017 2018 2019 2020 2021
Nominal Personal Income 196.2 198.8 201.8 204.8 207.6 185.8 192.6 203.2 214.9 226.3 237.3
% change (0.2) (0.3) (0.1) 0.1 0.2 0.0 (0.1) (0.0) 0.3 0.1 0.1
173.0 174.8 177.0 179.0 180.8 167.7 171.0 177.9 185.0 190.7 195.8
% change (0.5) (0.5) (0.2) 0.1 0.2 0.0 (0.2) (0.1) 0.3 0.1 (0.1)
Nominal Wages and Salaries 102.5 103.9 105.7 107.4 109.0 96.0 100.2 106.5 113.1 118.8 124.3
% change (0.6) (0.8) (0.7) (0.5) (0.4) 0.0 (0.1) (0.6) (0.2) (0.4) (0.7)
Per Capita Income ($1,000) 47.0 47.5 48.0 48.5 49.0 45.5 46.4 48.3 50.3 52.3 54.1
% change (0.2) (0.3) (0.1) 0.1 0.2 0.0 (0.1) (0.0) 0.3 0.1 0.1
Average Wage rate ($1,000) 53.7 54.3 54.9 55.5 56.0 51.9 53.0 55.2 57.4 59.7 62.1
% change (0.4) (0.4) (0.3) (0.3) (0.3) 0.0 (0.1) (0.3) (0.4) (0.6) (0.7)
Population (Millions) 4.17 4.19 4.20 4.2 4.2 4.09 4.15 4.21 4.27 4.33 4.38
% change 0.0 0.0 0.0 0.0 0.0 0.0 0.0 0.0 0.0 0.0 0.0
Housing Starts (Thousands) 19.5 19.6 20.4 21.0 21.1 19.1 19.0 20.5 22.1 23.7 24.6
% change (3.1) (9.5) (9.0) (8.7) (6.9) (0.0) (0.9) (8.5) (4.0) (1.0) 0.1
Unemployment Rate 4.2 4.3 4.4 4.5 4.5 4.9 4.0 4.4 4.5 4.7 4.8
Point Change 0.0 0.0 0.0 0.0 0.0 0.0 0.0 0.0 0.0 0.0 0.0
Total Nonfarm 1,884.9 1,895.3 1,906.5 1,917.6 1,928.9 1,833.5 1,872.8 1,912.1 1,952.2 1,972.9 1,983.9
% change (0.5) (0.4) (0.3) (0.3) (0.1) (0.0) (0.2) (0.3) 0.2 0.2 0.0
Private Nonfarm 1,573.5 1,583.0 1,592.8 1,602.7 1,612.8 1,526.3 1,562.0 1,597.8 1,633.1 1,648.9 1,657.8
% change (0.4) (0.3) (0.1) (0.1) 0.1 0.0 (0.1) (0.1) 0.5 0.5 0.3
Construction 98.9 99.5 99.9 100.1 100.6 90.3 97.1 100.0 100.9 101.2 101.5
% change (1.2) (0.3) 0.3 0.3 0.7 (0.0) (0.6) 0.2 0.7 0.6 0.6
Manufacturing 190.9 191.9 192.6 193.2 193.9 188.1 189.6 192.9 195.4 196.8 197.5
% change (0.1) 0.0 (0.1) (0.0) 0.1 (0.0) (0.2) 0.0 0.4 0.6 0.4
Durable Manufacturing 132.4 133.1 133.6 134.0 134.5 131.2 131.5 133.8 135.5 136.4 136.6
% change (0.2) (0.0) 0.1 0.1 0.3 0.0 (0.2) 0.1 0.7 1.1 0.9
Wood Product Manufacturing 23.0 23.1 23.1 23.1 23.2 22.7 22.9 23.1 23.2 23.5 23.7
% change 0.1 0.4 0.2 0.2 0.5 0.0 (0.0) 0.3 0.3 0.7 0.7
High Tech Manufacturing 37.4 37.5 37.6 37.7 37.8 37.9 36.9 37.6 38.1 38.3 38.0
% change 0.0 (0.1) (0.3) (0.4) (0.4) (0.0) (0.2) (0.3) 0.7 1.4 1.1
Transportation Equipment 11.7 11.8 11.9 12.0 12.0 12.2 11.8 11.9 12.0 12.0 12.0
% change (2.8) (1.8) (1.6) (1.7) (1.7) 0.0 (0.7) (1.7) (1.6) (2.0) (2.9)
Nondurable Manufacturing 58.5 58.9 59.0 59.2 59.4 56.9 58.1 59.1 59.9 60.4 60.9
% change 0.0 0.1 (0.3) (0.3) (0.4) (0.0) (0.2) (0.2) (0.3) (0.4) (0.7)
Private nonmanufacturing 1,382.6 1,391.0 1,400.2 1,409.4 1,418.9 1,338.2 1,372.4 1,404.9 1,437.8 1,452.2 1,460.4
% change (0.4) (0.3) (0.2) (0.1) 0.1 0.0 (0.1) (0.1) 0.5 0.5 0.3
Retail Trade 210.0 210.7 211.4 211.9 212.5 205.9 210.2 211.6 213.9 215.2 215.7
% change (0.4) (0.1) 0.1 0.2 0.4 0.0 (0.2) 0.1 0.6 0.5 0.4
Wholesale Trade 75.9 76.5 76.9 77.4 77.7 75.6 76.5 77.1 78.2 78.7 79.0
% change (2.0) (1.6) (1.3) (0.9) (0.7) 0.0 (0.6) (1.1) (0.2) (0.0) 0.0
Information 34.2 34.4 34.6 34.7 34.9 33.5 34.2 34.6 35.1 35.4 35.5
% change (1.0) (0.5) (0.0) 0.2 0.4 0.0 (0.7) (0.0) 0.7 0.6 0.5
Professional and Business Services 245.0 248.2 251.7 255.4 259.5 238.2 243.3 253.7 268.9 277.2 281.8
% change 0.3 0.4 0.5 0.8 1.0 0.0 0.2 0.7 1.2 1.2 0.7
Health Services 238.3 240.0 241.7 243.4 245.1 230.4 236.4 242.6 248.9 251.7 254.4
% change (1.2) (1.1) (1.1) (1.2) (0.9) 0.0 (0.4) (1.1) 0.1 0.3 0.0
Leisure and Hospitality 210.0 210.4 211.4 212.6 213.3 199.8 206.3 211.9 214.7 214.5 213.3
% change 0.8 0.3 0.4 0.4 0.4 (0.0) 0.1 0.4 0.6 0.6 0.5
Government 311.4 312.4 313.7 314.9 316.1 307.2 310.8 314.3 319.0 324.0 326.1
% change (1.2) (1.3) (1.4) (1.4) (1.4) (0.0) (0.3) (1.4) (1.3) (1.2) (1.3)
Employment (Thousands)
Personal Income ($ billions)
Quarterly Annual
Real Personal Income (base year=2005)
Other Indicators
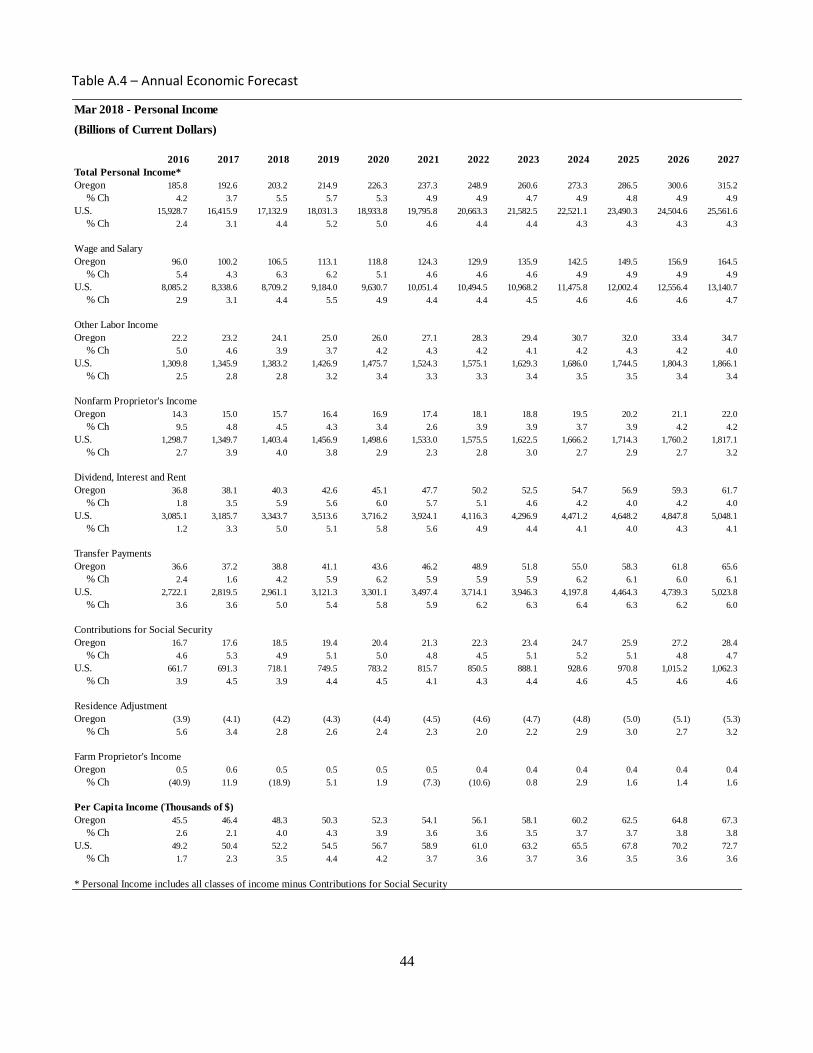
44
Table A.4 – Annual Economic Forecast
Mar 2018 - Personal Income
(Billions of Current Dollars)
2016 2017 2018 2019 2020 2021 2022 2023 2024 2025 2026 2027
Total Personal Income*
Oregon 185.8 192.6 203.2 214.9 226.3 237.3 248.9 260.6 273.3 286.5 300.6 315.2
% Ch 4.2 3.7 5.5 5.7 5.3 4.9 4.9 4.7 4.9 4.8 4.9 4.9
U.S. 15,928.7 16,415.9 17,132.9 18,031.3 18,933.8 19,795.8 20,663.3 21,582.5 22,521.1 23,490.3 24,504.6 25,561.6
% Ch 2.4 3.1 4.4 5.2 5.0 4.6 4.4 4.4 4.3 4.3 4.3 4.3
Wage and Salary
Oregon 96.0 100.2 106.5 113.1 118.8 124.3 129.9 135.9 142.5 149.5 156.9 164.5
% Ch 5.4 4.3 6.3 6.2 5.1 4.6 4.6 4.6 4.9 4.9 4.9 4.9
U.S. 8,085.2 8,338.6 8,709.2 9,184.0 9,630.7 10,051.4 10,494.5 10,968.2 11,475.8 12,002.4 12,556.4 13,140.7
% Ch 2.9 3.1 4.4 5.5 4.9 4.4 4.4 4.5 4.6 4.6 4.6 4.7
Other Labor Income
Oregon 22.2 23.2 24.1 25.0 26.0 27.1 28.3 29.4 30.7 32.0 33.4 34.7
% Ch 5.0 4.6 3.9 3.7 4.2 4.3 4.2 4.1 4.2 4.3 4.2 4.0
U.S. 1,309.8 1,345.9 1,383.2 1,426.9 1,475.7 1,524.3 1,575.1 1,629.3 1,686.0 1,744.5 1,804.3 1,866.1
% Ch 2.5 2.8 2.8 3.2 3.4 3.3 3.3 3.4 3.5 3.5 3.4 3.4
Nonfarm Proprietor's Income
Oregon 14.3 15.0 15.7 16.4 16.9 17.4 18.1 18.8 19.5 20.2 21.1 22.0
% Ch 9.5 4.8 4.5 4.3 3.4 2.6 3.9 3.9 3.7 3.9 4.2 4.2
U.S. 1,298.7 1,349.7 1,403.4 1,456.9 1,498.6 1,533.0 1,575.5 1,622.5 1,666.2 1,714.3 1,760.2 1,817.1
% Ch 2.7 3.9 4.0 3.8 2.9 2.3 2.8 3.0 2.7 2.9 2.7 3.2
Dividend, Interest and Rent
Oregon 36.8 38.1 40.3 42.6 45.1 47.7 50.2 52.5 54.7 56.9 59.3 61.7
% Ch 1.8 3.5 5.9 5.6 6.0 5.7 5.1 4.6 4.2 4.0 4.2 4.0
U.S. 3,085.1 3,185.7 3,343.7 3,513.6 3,716.2 3,924.1 4,116.3 4,296.9 4,471.2 4,648.2 4,847.8 5,048.1
% Ch 1.2 3.3 5.0 5.1 5.8 5.6 4.9 4.4 4.1 4.0 4.3 4.1
Transfer Payments
Oregon 36.6 37.2 38.8 41.1 43.6 46.2 48.9 51.8 55.0 58.3 61.8 65.6
% Ch 2.4 1.6 4.2 5.9 6.2 5.9 5.9 5.9 6.2 6.1 6.0 6.1
U.S. 2,722.1 2,819.5 2,961.1 3,121.3 3,301.1 3,497.4 3,714.1 3,946.3 4,197.8 4,464.3 4,739.3 5,023.8
% Ch 3.6 3.6 5.0 5.4 5.8 5.9 6.2 6.3 6.4 6.3 6.2 6.0
Contributions for Social Security
Oregon 16.7 17.6 18.5 19.4 20.4 21.3 22.3 23.4 24.7 25.9 27.2 28.4
% Ch 4.6 5.3 4.9 5.1 5.0 4.8 4.5 5.1 5.2 5.1 4.8 4.7
U.S. 661.7 691.3 718.1 749.5 783.2 815.7 850.5 888.1 928.6 970.8 1,015.2 1,062.3
% Ch 3.9 4.5 3.9 4.4 4.5 4.1 4.3 4.4 4.6 4.5 4.6 4.6
Residence Adjustment
Oregon (3.9) (4.1) (4.2) (4.3) (4.4) (4.5) (4.6) (4.7) (4.8) (5.0) (5.1) (5.3)
% Ch 5.6 3.4 2.8 2.6 2.4 2.3 2.0 2.2 2.9 3.0 2.7 3.2
Farm Proprietor's Income
Oregon 0.5 0.6 0.5 0.5 0.5 0.5 0.4 0.4 0.4 0.4 0.4 0.4
% Ch (40.9) 11.9 (18.9) 5.1 1.9 (7.3) (10.6) 0.8 2.9 1.6 1.4 1.6
Per Capita Income (Thousands of $)
Oregon 45.5 46.4 48.3 50.3 52.3 54.1 56.1 58.1 60.2 62.5 64.8 67.3
% Ch 2.6 2.1 4.0 4.3 3.9 3.6 3.6 3.5 3.7 3.7 3.8 3.8
U.S. 49.2 50.4 52.2 54.5 56.7 58.9 61.0 63.2 65.5 67.8 70.2 72.7
% Ch 1.7 2.3 3.5 4.4 4.2 3.7 3.6 3.7 3.6 3.5 3.6 3.6
* Personal Income includes all classes of income minus Contributions for Social Security
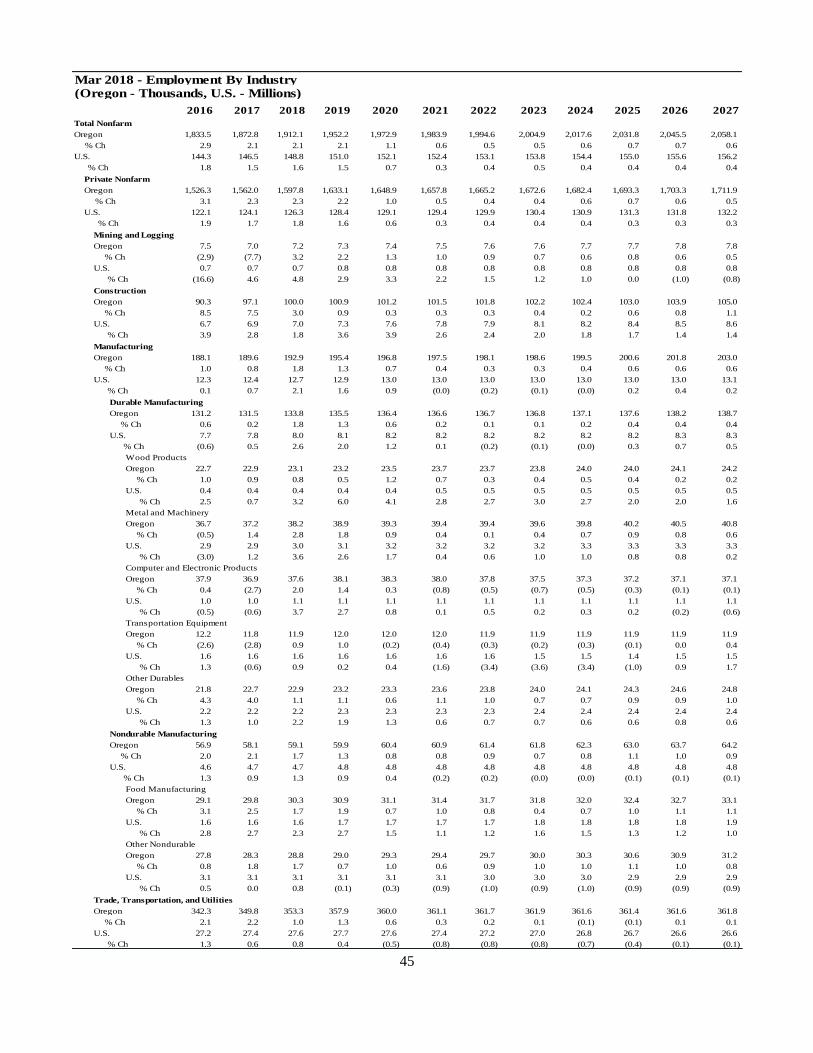
45
Mar 2018 - Employment By Industry(Oregon - Thousands, U.S. - Millions)
2016 2017 2018 2019 2020 2021 2022 2023 2024 2025 2026 2027
Total Nonfarm
Oregon 1,833.5 1,872.8 1,912.1 1,952.2 1,972.9 1,983.9 1,994.6 2,004.9 2,017.6 2,031.8 2,045.5 2,058.1
% Ch 2.9 2.1 2.1 2.1 1.1 0.6 0.5 0.5 0.6 0.7 0.7 0.6
U.S. 144.3 146.5 148.8 151.0 152.1 152.4 153.1 153.8 154.4 155.0 155.6 156.2
% Ch 1.8 1.5 1.6 1.5 0.7 0.3 0.4 0.5 0.4 0.4 0.4 0.4
Private Nonfarm
Oregon 1,526.3 1,562.0 1,597.8 1,633.1 1,648.9 1,657.8 1,665.2 1,672.6 1,682.4 1,693.3 1,703.3 1,711.9
% Ch 3.1 2.3 2.3 2.2 1.0 0.5 0.4 0.4 0.6 0.7 0.6 0.5
U.S. 122.1 124.1 126.3 128.4 129.1 129.4 129.9 130.4 130.9 131.3 131.8 132.2
% Ch 1.9 1.7 1.8 1.6 0.6 0.3 0.4 0.4 0.4 0.3 0.3 0.3
Mining and Logging
Oregon 7.5 7.0 7.2 7.3 7.4 7.5 7.6 7.6 7.7 7.7 7.8 7.8
% Ch (2.9) (7.7) 3.2 2.2 1.3 1.0 0.9 0.7 0.6 0.8 0.6 0.5
U.S. 0.7 0.7 0.7 0.8 0.8 0.8 0.8 0.8 0.8 0.8 0.8 0.8
% Ch (16.6) 4.6 4.8 2.9 3.3 2.2 1.5 1.2 1.0 0.0 (1.0) (0.8)
Construction
Oregon 90.3 97.1 100.0 100.9 101.2 101.5 101.8 102.2 102.4 103.0 103.9 105.0
% Ch 8.5 7.5 3.0 0.9 0.3 0.3 0.3 0.4 0.2 0.6 0.8 1.1
U.S. 6.7 6.9 7.0 7.3 7.6 7.8 7.9 8.1 8.2 8.4 8.5 8.6
% Ch 3.9 2.8 1.8 3.6 3.9 2.6 2.4 2.0 1.8 1.7 1.4 1.4
Manufacturing
Oregon 188.1 189.6 192.9 195.4 196.8 197.5 198.1 198.6 199.5 200.6 201.8 203.0
% Ch 1.0 0.8 1.8 1.3 0.7 0.4 0.3 0.3 0.4 0.6 0.6 0.6
U.S. 12.3 12.4 12.7 12.9 13.0 13.0 13.0 13.0 13.0 13.0 13.0 13.1
% Ch 0.1 0.7 2.1 1.6 0.9 (0.0) (0.2) (0.1) (0.0) 0.2 0.4 0.2
Durable Manufacturing
Oregon 131.2 131.5 133.8 135.5 136.4 136.6 136.7 136.8 137.1 137.6 138.2 138.7
% Ch 0.6 0.2 1.8 1.3 0.6 0.2 0.1 0.1 0.2 0.4 0.4 0.4
U.S. 7.7 7.8 8.0 8.1 8.2 8.2 8.2 8.2 8.2 8.2 8.3 8.3
% Ch (0.6) 0.5 2.6 2.0 1.2 0.1 (0.2) (0.1) (0.0) 0.3 0.7 0.5
Wood Products
Oregon 22.7 22.9 23.1 23.2 23.5 23.7 23.7 23.8 24.0 24.0 24.1 24.2
% Ch 1.0 0.9 0.8 0.5 1.2 0.7 0.3 0.4 0.5 0.4 0.2 0.2
U.S. 0.4 0.4 0.4 0.4 0.4 0.5 0.5 0.5 0.5 0.5 0.5 0.5
% Ch 2.5 0.7 3.2 6.0 4.1 2.8 2.7 3.0 2.7 2.0 2.0 1.6
Metal and Machinery
Oregon 36.7 37.2 38.2 38.9 39.3 39.4 39.4 39.6 39.8 40.2 40.5 40.8
% Ch (0.5) 1.4 2.8 1.8 0.9 0.4 0.1 0.4 0.7 0.9 0.8 0.6
U.S. 2.9 2.9 3.0 3.1 3.2 3.2 3.2 3.2 3.3 3.3 3.3 3.3
% Ch (3.0) 1.2 3.6 2.6 1.7 0.4 0.6 1.0 1.0 0.8 0.8 0.2
Computer and Electronic Products
Oregon 37.9 36.9 37.6 38.1 38.3 38.0 37.8 37.5 37.3 37.2 37.1 37.1
% Ch 0.4 (2.7) 2.0 1.4 0.3 (0.8) (0.5) (0.7) (0.5) (0.3) (0.1) (0.1)
U.S. 1.0 1.0 1.1 1.1 1.1 1.1 1.1 1.1 1.1 1.1 1.1 1.1
% Ch (0.5) (0.6) 3.7 2.7 0.8 0.1 0.5 0.2 0.3 0.2 (0.2) (0.6)
Transportation Equipment
Oregon 12.2 11.8 11.9 12.0 12.0 12.0 11.9 11.9 11.9 11.9 11.9 11.9
% Ch (2.6) (2.8) 0.9 1.0 (0.2) (0.4) (0.3) (0.2) (0.3) (0.1) 0.0 0.4
U.S. 1.6 1.6 1.6 1.6 1.6 1.6 1.6 1.5 1.5 1.4 1.5 1.5
% Ch 1.3 (0.6) 0.9 0.2 0.4 (1.6) (3.4) (3.6) (3.4) (1.0) 0.9 1.7
Other Durables
Oregon 21.8 22.7 22.9 23.2 23.3 23.6 23.8 24.0 24.1 24.3 24.6 24.8
% Ch 4.3 4.0 1.1 1.1 0.6 1.1 1.0 0.7 0.7 0.9 0.9 1.0
U.S. 2.2 2.2 2.2 2.3 2.3 2.3 2.3 2.4 2.4 2.4 2.4 2.4
% Ch 1.3 1.0 2.2 1.9 1.3 0.6 0.7 0.7 0.6 0.6 0.8 0.6
Nondurable Manufacturing
Oregon 56.9 58.1 59.1 59.9 60.4 60.9 61.4 61.8 62.3 63.0 63.7 64.2
% Ch 2.0 2.1 1.7 1.3 0.8 0.8 0.9 0.7 0.8 1.1 1.0 0.9
U.S. 4.6 4.7 4.7 4.8 4.8 4.8 4.8 4.8 4.8 4.8 4.8 4.8
% Ch 1.3 0.9 1.3 0.9 0.4 (0.2) (0.2) (0.0) (0.0) (0.1) (0.1) (0.1)
Food Manufacturing
Oregon 29.1 29.8 30.3 30.9 31.1 31.4 31.7 31.8 32.0 32.4 32.7 33.1
% Ch 3.1 2.5 1.7 1.9 0.7 1.0 0.8 0.4 0.7 1.0 1.1 1.1
U.S. 1.6 1.6 1.6 1.7 1.7 1.7 1.7 1.8 1.8 1.8 1.8 1.9
% Ch 2.8 2.7 2.3 2.7 1.5 1.1 1.2 1.6 1.5 1.3 1.2 1.0
Other Nondurable
Oregon 27.8 28.3 28.8 29.0 29.3 29.4 29.7 30.0 30.3 30.6 30.9 31.2
% Ch 0.8 1.8 1.7 0.7 1.0 0.6 0.9 1.0 1.0 1.1 1.0 0.8
U.S. 3.1 3.1 3.1 3.1 3.1 3.1 3.0 3.0 3.0 2.9 2.9 2.9
% Ch 0.5 0.0 0.8 (0.1) (0.3) (0.9) (1.0) (0.9) (1.0) (0.9) (0.9) (0.9)
Trade, Transportation, and Utilities
Oregon 342.3 349.8 353.3 357.9 360.0 361.1 361.7 361.9 361.6 361.4 361.6 361.8
% Ch 2.1 2.2 1.0 1.3 0.6 0.3 0.2 0.1 (0.1) (0.1) 0.1 0.1
U.S. 27.2 27.4 27.6 27.7 27.6 27.4 27.2 27.0 26.8 26.7 26.6 26.6
% Ch 1.3 0.6 0.8 0.4 (0.5) (0.8) (0.8) (0.8) (0.7) (0.4) (0.1) (0.1)
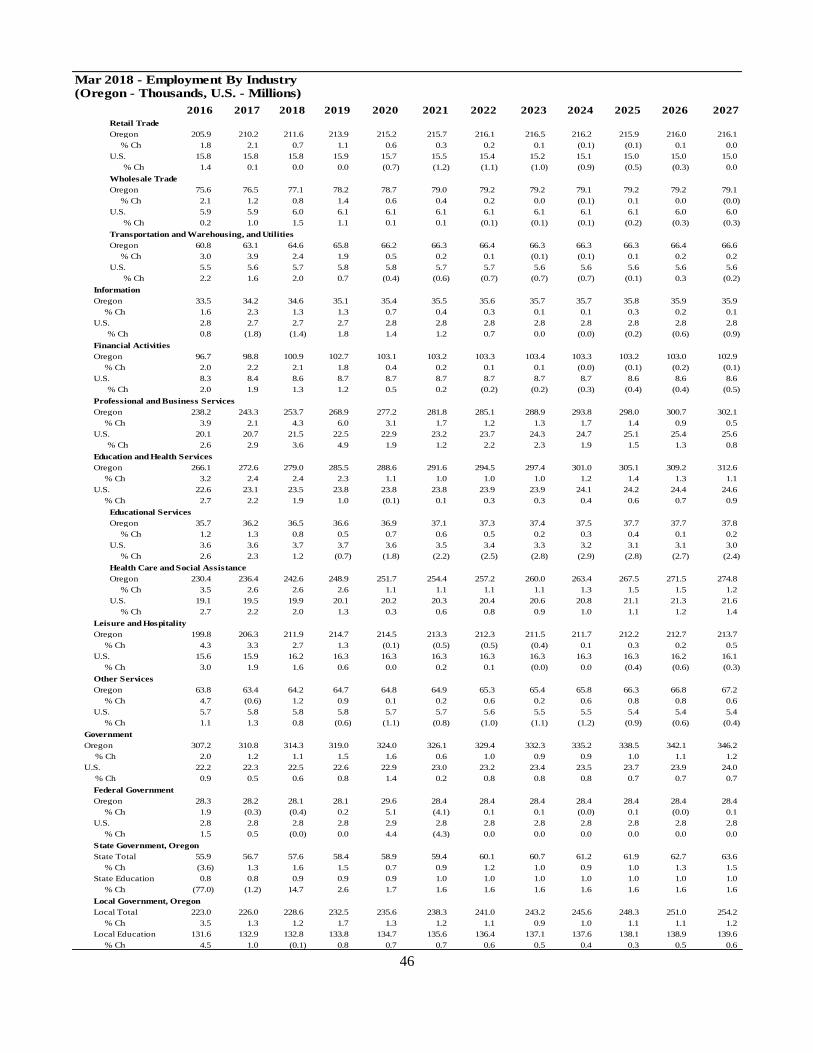
46
Mar 2018 - Employment By Industry(Oregon - Thousands, U.S. - Millions)
2016 2017 2018 2019 2020 2021 2022 2023 2024 2025 2026 2027
Retail Trade
Oregon 205.9 210.2 211.6 213.9 215.2 215.7 216.1 216.5 216.2 215.9 216.0 216.1
% Ch 1.8 2.1 0.7 1.1 0.6 0.3 0.2 0.1 (0.1) (0.1) 0.1 0.0
U.S. 15.8 15.8 15.8 15.9 15.7 15.5 15.4 15.2 15.1 15.0 15.0 15.0
% Ch 1.4 0.1 0.0 0.0 (0.7) (1.2) (1.1) (1.0) (0.9) (0.5) (0.3) 0.0
Wholesale Trade
Oregon 75.6 76.5 77.1 78.2 78.7 79.0 79.2 79.2 79.1 79.2 79.2 79.1
% Ch 2.1 1.2 0.8 1.4 0.6 0.4 0.2 0.0 (0.1) 0.1 0.0 (0.0)
U.S. 5.9 5.9 6.0 6.1 6.1 6.1 6.1 6.1 6.1 6.1 6.0 6.0
% Ch 0.2 1.0 1.5 1.1 0.1 0.1 (0.1) (0.1) (0.1) (0.2) (0.3) (0.3)
Transportation and Warehousing, and Utilities
Oregon 60.8 63.1 64.6 65.8 66.2 66.3 66.4 66.3 66.3 66.3 66.4 66.6
% Ch 3.0 3.9 2.4 1.9 0.5 0.2 0.1 (0.1) (0.1) 0.1 0.2 0.2
U.S. 5.5 5.6 5.7 5.8 5.8 5.7 5.7 5.6 5.6 5.6 5.6 5.6
% Ch 2.2 1.6 2.0 0.7 (0.4) (0.6) (0.7) (0.7) (0.7) (0.1) 0.3 (0.2)
Information
Oregon 33.5 34.2 34.6 35.1 35.4 35.5 35.6 35.7 35.7 35.8 35.9 35.9
% Ch 1.6 2.3 1.3 1.3 0.7 0.4 0.3 0.1 0.1 0.3 0.2 0.1
U.S. 2.8 2.7 2.7 2.7 2.8 2.8 2.8 2.8 2.8 2.8 2.8 2.8
% Ch 0.8 (1.8) (1.4) 1.8 1.4 1.2 0.7 0.0 (0.0) (0.2) (0.6) (0.9)
Financial Activities
Oregon 96.7 98.8 100.9 102.7 103.1 103.2 103.3 103.4 103.3 103.2 103.0 102.9
% Ch 2.0 2.2 2.1 1.8 0.4 0.2 0.1 0.1 (0.0) (0.1) (0.2) (0.1)
U.S. 8.3 8.4 8.6 8.7 8.7 8.7 8.7 8.7 8.7 8.6 8.6 8.6
% Ch 2.0 1.9 1.3 1.2 0.5 0.2 (0.2) (0.2) (0.3) (0.4) (0.4) (0.5)
Professional and Business Services
Oregon 238.2 243.3 253.7 268.9 277.2 281.8 285.1 288.9 293.8 298.0 300.7 302.1
% Ch 3.9 2.1 4.3 6.0 3.1 1.7 1.2 1.3 1.7 1.4 0.9 0.5
U.S. 20.1 20.7 21.5 22.5 22.9 23.2 23.7 24.3 24.7 25.1 25.4 25.6
% Ch 2.6 2.9 3.6 4.9 1.9 1.2 2.2 2.3 1.9 1.5 1.3 0.8
Education and Health Services
Oregon 266.1 272.6 279.0 285.5 288.6 291.6 294.5 297.4 301.0 305.1 309.2 312.6
% Ch 3.2 2.4 2.4 2.3 1.1 1.0 1.0 1.0 1.2 1.4 1.3 1.1
U.S. 22.6 23.1 23.5 23.8 23.8 23.8 23.9 23.9 24.1 24.2 24.4 24.6
% Ch 2.7 2.2 1.9 1.0 (0.1) 0.1 0.3 0.3 0.4 0.6 0.7 0.9
Educational Services
Oregon 35.7 36.2 36.5 36.6 36.9 37.1 37.3 37.4 37.5 37.7 37.7 37.8
% Ch 1.2 1.3 0.8 0.5 0.7 0.6 0.5 0.2 0.3 0.4 0.1 0.2
U.S. 3.6 3.6 3.7 3.7 3.6 3.5 3.4 3.3 3.2 3.1 3.1 3.0
% Ch 2.6 2.3 1.2 (0.7) (1.8) (2.2) (2.5) (2.8) (2.9) (2.8) (2.7) (2.4)
Health Care and Social Assistance
Oregon 230.4 236.4 242.6 248.9 251.7 254.4 257.2 260.0 263.4 267.5 271.5 274.8
% Ch 3.5 2.6 2.6 2.6 1.1 1.1 1.1 1.1 1.3 1.5 1.5 1.2
U.S. 19.1 19.5 19.9 20.1 20.2 20.3 20.4 20.6 20.8 21.1 21.3 21.6
% Ch 2.7 2.2 2.0 1.3 0.3 0.6 0.8 0.9 1.0 1.1 1.2 1.4
Leisure and Hospitality
Oregon 199.8 206.3 211.9 214.7 214.5 213.3 212.3 211.5 211.7 212.2 212.7 213.7
% Ch 4.3 3.3 2.7 1.3 (0.1) (0.5) (0.5) (0.4) 0.1 0.3 0.2 0.5
U.S. 15.6 15.9 16.2 16.3 16.3 16.3 16.3 16.3 16.3 16.3 16.2 16.1
% Ch 3.0 1.9 1.6 0.6 0.0 0.2 0.1 (0.0) 0.0 (0.4) (0.6) (0.3)
Other Services
Oregon 63.8 63.4 64.2 64.7 64.8 64.9 65.3 65.4 65.8 66.3 66.8 67.2
% Ch 4.7 (0.6) 1.2 0.9 0.1 0.2 0.6 0.2 0.6 0.8 0.8 0.6
U.S. 5.7 5.8 5.8 5.8 5.7 5.7 5.6 5.5 5.5 5.4 5.4 5.4
% Ch 1.1 1.3 0.8 (0.6) (1.1) (0.8) (1.0) (1.1) (1.2) (0.9) (0.6) (0.4)
Government
Oregon 307.2 310.8 314.3 319.0 324.0 326.1 329.4 332.3 335.2 338.5 342.1 346.2
% Ch 2.0 1.2 1.1 1.5 1.6 0.6 1.0 0.9 0.9 1.0 1.1 1.2
U.S. 22.2 22.3 22.5 22.6 22.9 23.0 23.2 23.4 23.5 23.7 23.9 24.0
% Ch 0.9 0.5 0.6 0.8 1.4 0.2 0.8 0.8 0.8 0.7 0.7 0.7
Federal Government
Oregon 28.3 28.2 28.1 28.1 29.6 28.4 28.4 28.4 28.4 28.4 28.4 28.4
% Ch 1.9 (0.3) (0.4) 0.2 5.1 (4.1) 0.1 0.1 (0.0) 0.1 (0.0) 0.1
U.S. 2.8 2.8 2.8 2.8 2.9 2.8 2.8 2.8 2.8 2.8 2.8 2.8
% Ch 1.5 0.5 (0.0) 0.0 4.4 (4.3) 0.0 0.0 0.0 0.0 0.0 0.0
State Government, Oregon
State Total 55.9 56.7 57.6 58.4 58.9 59.4 60.1 60.7 61.2 61.9 62.7 63.6
% Ch (3.6) 1.3 1.6 1.5 0.7 0.9 1.2 1.0 0.9 1.0 1.3 1.5
State Education 0.8 0.8 0.9 0.9 0.9 1.0 1.0 1.0 1.0 1.0 1.0 1.0
% Ch (77.0) (1.2) 14.7 2.6 1.7 1.6 1.6 1.6 1.6 1.6 1.6 1.6
Local Government, Oregon
Local Total 223.0 226.0 228.6 232.5 235.6 238.3 241.0 243.2 245.6 248.3 251.0 254.2
% Ch 3.5 1.3 1.2 1.7 1.3 1.2 1.1 0.9 1.0 1.1 1.1 1.2
Local Education 131.6 132.9 132.8 133.8 134.7 135.6 136.4 137.1 137.6 138.1 138.9 139.6
% Ch 4.5 1.0 (0.1) 0.8 0.7 0.7 0.6 0.5 0.4 0.3 0.5 0.6
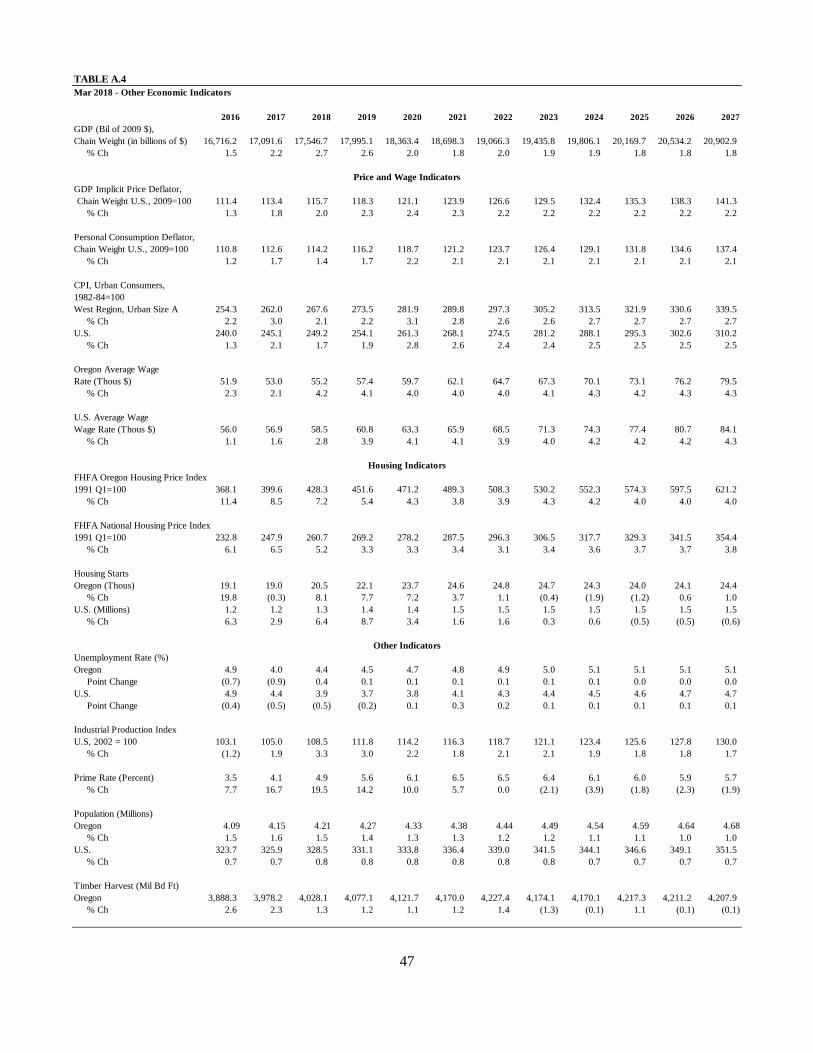
47
TABLE A.4
Mar 2018 - Other Economic Indicators
2016 2017 2018 2019 2020 2021 2022 2023 2024 2025 2026 2027
GDP (Bil of 2009 $),
Chain Weight (in billions of $) 16,716.2 17,091.6 17,546.7 17,995.1 18,363.4 18,698.3 19,066.3 19,435.8 19,806.1 20,169.7 20,534.2 20,902.9
% Ch 1.5 2.2 2.7 2.6 2.0 1.8 2.0 1.9 1.9 1.8 1.8 1.8
Price and Wage Indicators
GDP Implicit Price Deflator,
Chain Weight U.S., 2009=100 111.4 113.4 115.7 118.3 121.1 123.9 126.6 129.5 132.4 135.3 138.3 141.3
% Ch 1.3 1.8 2.0 2.3 2.4 2.3 2.2 2.2 2.2 2.2 2.2 2.2
Personal Consumption Deflator,
Chain Weight U.S., 2009=100 110.8 112.6 114.2 116.2 118.7 121.2 123.7 126.4 129.1 131.8 134.6 137.4
% Ch 1.2 1.7 1.4 1.7 2.2 2.1 2.1 2.1 2.1 2.1 2.1 2.1
CPI, Urban Consumers,
1982-84=100
West Region, Urban Size A 254.3 262.0 267.6 273.5 281.9 289.8 297.3 305.2 313.5 321.9 330.6 339.5
% Ch 2.2 3.0 2.1 2.2 3.1 2.8 2.6 2.6 2.7 2.7 2.7 2.7
U.S. 240.0 245.1 249.2 254.1 261.3 268.1 274.5 281.2 288.1 295.3 302.6 310.2
% Ch 1.3 2.1 1.7 1.9 2.8 2.6 2.4 2.4 2.5 2.5 2.5 2.5
Oregon Average Wage
Rate (Thous $) 51.9 53.0 55.2 57.4 59.7 62.1 64.7 67.3 70.1 73.1 76.2 79.5
% Ch 2.3 2.1 4.2 4.1 4.0 4.0 4.0 4.1 4.3 4.2 4.3 4.3
U.S. Average Wage
Wage Rate (Thous $) 56.0 56.9 58.5 60.8 63.3 65.9 68.5 71.3 74.3 77.4 80.7 84.1
% Ch 1.1 1.6 2.8 3.9 4.1 4.1 3.9 4.0 4.2 4.2 4.2 4.3
Housing Indicators
FHFA Oregon Housing Price Index
1991 Q1=100 368.1 399.6 428.3 451.6 471.2 489.3 508.3 530.2 552.3 574.3 597.5 621.2
% Ch 11.4 8.5 7.2 5.4 4.3 3.8 3.9 4.3 4.2 4.0 4.0 4.0
FHFA National Housing Price Index
1991 Q1=100 232.8 247.9 260.7 269.2 278.2 287.5 296.3 306.5 317.7 329.3 341.5 354.4
% Ch 6.1 6.5 5.2 3.3 3.3 3.4 3.1 3.4 3.6 3.7 3.7 3.8
Housing Starts
Oregon (Thous) 19.1 19.0 20.5 22.1 23.7 24.6 24.8 24.7 24.3 24.0 24.1 24.4
% Ch 19.8 (0.3) 8.1 7.7 7.2 3.7 1.1 (0.4) (1.9) (1.2) 0.6 1.0
U.S. (Millions) 1.2 1.2 1.3 1.4 1.4 1.5 1.5 1.5 1.5 1.5 1.5 1.5
% Ch 6.3 2.9 6.4 8.7 3.4 1.6 1.6 0.3 0.6 (0.5) (0.5) (0.6)
Other Indicators
Unemployment Rate (%)
Oregon 4.9 4.0 4.4 4.5 4.7 4.8 4.9 5.0 5.1 5.1 5.1 5.1
Point Change (0.7) (0.9) 0.4 0.1 0.1 0.1 0.1 0.1 0.1 0.0 0.0 0.0
U.S. 4.9 4.4 3.9 3.7 3.8 4.1 4.3 4.4 4.5 4.6 4.7 4.7
Point Change (0.4) (0.5) (0.5) (0.2) 0.1 0.3 0.2 0.1 0.1 0.1 0.1 0.1
Industrial Production Index
U.S, 2002 = 100 103.1 105.0 108.5 111.8 114.2 116.3 118.7 121.1 123.4 125.6 127.8 130.0
% Ch (1.2) 1.9 3.3 3.0 2.2 1.8 2.1 2.1 1.9 1.8 1.8 1.7
Prime Rate (Percent) 3.5 4.1 4.9 5.6 6.1 6.5 6.5 6.4 6.1 6.0 5.9 5.7
% Ch 7.7 16.7 19.5 14.2 10.0 5.7 0.0 (2.1) (3.9) (1.8) (2.3) (1.9)
Population (Millions)
Oregon 4.09 4.15 4.21 4.27 4.33 4.38 4.44 4.49 4.54 4.59 4.64 4.68
% Ch 1.5 1.6 1.5 1.4 1.3 1.3 1.2 1.2 1.1 1.1 1.0 1.0
U.S. 323.7 325.9 328.5 331.1 333.8 336.4 339.0 341.5 344.1 346.6 349.1 351.5
% Ch 0.7 0.7 0.8 0.8 0.8 0.8 0.8 0.8 0.7 0.7 0.7 0.7
Timber Harvest (Mil Bd Ft)
Oregon 3,888.3 3,978.2 4,028.1 4,077.1 4,121.7 4,170.0 4,227.4 4,174.1 4,170.1 4,217.3 4,211.2 4,207.9
% Ch 2.6 2.3 1.3 1.2 1.1 1.2 1.4 (1.3) (0.1) 1.1 (0.1) (0.1)
48
APPENDIX B: REVENUE FORECAST DETAIL
Table B.1 General Fund Revenue Statement – 2017-19 ……………………………….………………..……..…… 49
Table B.2 General Fund Revenue Forecast by Fiscal Year .…..……………….………..……………….……….… 50
Table B.3 Summary of 2017 Legislative Session Adjustments ……………………………………………………. 51
Table B.4 Oregon Personal Income Tax Revenue Forecast …………………………..….……………….……….. 52
Table B.5 Oregon Corporate Income Tax Revenue Forecast ……………………….….…………………………. 54
Table B.6 Cigarette and Tobacco Tax Distribution ……………………………………….……………………..……… 56
Table B.7 Liquor Apportionment and Revenue Distribution to Local Governments ……………...…… 57
Table B.8 Track Record for the May 2017 Forecast ………………………………………………………………..….. 58
Table B.9 Summary of Lottery Resources …………….………………………………………………………………....... 59
Table B.10 Budgetary Reserve Summary ……………..……………………………………………………………………… 60
Table B.11 Recreational Marijuana Resources and Distributions ………………………………………………… 61
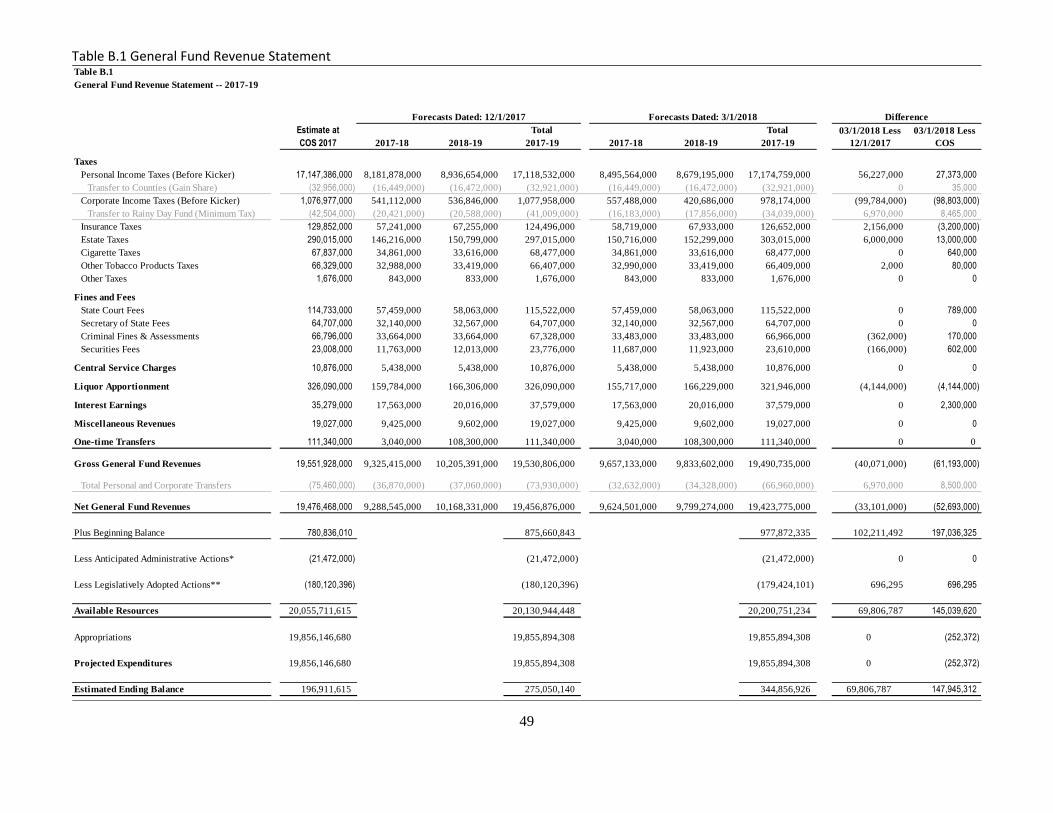
49
Table B.1 General Fund Revenue Statement
Table B.1
General Fund Revenue Statement -- 2017-19
Total Total
2017-18 2018-19 2017-19 2017-18 2018-19 2017-19
Taxes
Personal Income Taxes (Before Kicker) 17,147,386,000 8,181,878,000 8,936,654,000 17,118,532,000 8,495,564,000 8,679,195,000 17,174,759,000 56,227,000 27,373,000
Transfer to Counties (Gain Share) (32,956,000) (16,449,000) (16,472,000) (32,921,000) (16,449,000) (16,472,000) (32,921,000) 0 35,000
Corporate Income Taxes (Before Kicker) 1,076,977,000 541,112,000 536,846,000 1,077,958,000 557,488,000 420,686,000 978,174,000 (99,784,000) (98,803,000)
Transfer to Rainy Day Fund (Minimum Tax) (42,504,000) (20,421,000) (20,588,000) (41,009,000) (16,183,000) (17,856,000) (34,039,000) 6,970,000 8,465,000
Insurance Taxes 129,852,000 57,241,000 67,255,000 124,496,000 58,719,000 67,933,000 126,652,000 2,156,000 (3,200,000)
Estate Taxes 290,015,000 146,216,000 150,799,000 297,015,000 150,716,000 152,299,000 303,015,000 6,000,000 13,000,000
Cigarette Taxes 67,837,000 34,861,000 33,616,000 68,477,000 34,861,000 33,616,000 68,477,000 0 640,000
Other Tobacco Products Taxes 66,329,000 32,988,000 33,419,000 66,407,000 32,990,000 33,419,000 66,409,000 2,000 80,000
Other Taxes 1,676,000 843,000 833,000 1,676,000 843,000 833,000 1,676,000 0 0
Fines and Fees
State Court Fees 114,733,000 57,459,000 58,063,000 115,522,000 57,459,000 58,063,000 115,522,000 0 789,000
Secretary of State Fees 64,707,000 32,140,000 32,567,000 64,707,000 32,140,000 32,567,000 64,707,000 0 0
Criminal Fines & Assessments 66,796,000 33,664,000 33,664,000 67,328,000 33,483,000 33,483,000 66,966,000 (362,000) 170,000
Securities Fees 23,008,000 11,763,000 12,013,000 23,776,000 11,687,000 11,923,000 23,610,000 (166,000) 602,000
Central Service Charges 10,876,000 5,438,000 5,438,000 10,876,000 5,438,000 5,438,000 10,876,000 0 0
Liquor Apportionment 326,090,000 159,784,000 166,306,000 326,090,000 155,717,000 166,229,000 321,946,000 (4,144,000) (4,144,000)
Interest Earnings 35,279,000 17,563,000 20,016,000 37,579,000 17,563,000 20,016,000 37,579,000 0 2,300,000
Miscellaneous Revenues 19,027,000 9,425,000 9,602,000 19,027,000 9,425,000 9,602,000 19,027,000 0 0
One-time Transfers 111,340,000 3,040,000 108,300,000 111,340,000 3,040,000 108,300,000 111,340,000 0 0
Gross General Fund Revenues 19,551,928,000 9,325,415,000 10,205,391,000 19,530,806,000 9,657,133,000 9,833,602,000 19,490,735,000 (40,071,000) (61,193,000)
Total Personal and Corporate Transfers (75,460,000) (36,870,000) (37,060,000) (73,930,000) (32,632,000) (34,328,000) (66,960,000) 6,970,000 8,500,000
Net General Fund Revenues 19,476,468,000 9,288,545,000 10,168,331,000 19,456,876,000 9,624,501,000 9,799,274,000 19,423,775,000 (33,101,000) (52,693,000)
Plus Beginning Balance 780,836,010 875,660,843 977,872,335 102,211,492 197,036,325
Less Anticipated Administrative Actions* (21,472,000) (21,472,000) (21,472,000) 0 0
Less Legislatively Adopted Actions** (180,120,396) (180,120,396) (179,424,101) 696,295 696,295
Available Resources 20,055,711,615 20,130,944,448 20,200,751,234 69,806,787 145,039,620
Appropriations 19,856,146,680 19,855,894,308 19,855,894,308 0 (252,372)
Projected Expenditures 19,856,146,680 19,855,894,308 19,855,894,308 0 (252,372)
Estimated Ending Balance 196,911,615 275,050,140 344,856,926 69,806,787 147,945,312
Estimate at
COS 2017
Forecasts Dated: 12/1/2017 Forecasts Dated: 3/1/2018 Difference
03/1/2018 Less
12/1/2017
03/1/2018 Less
COS
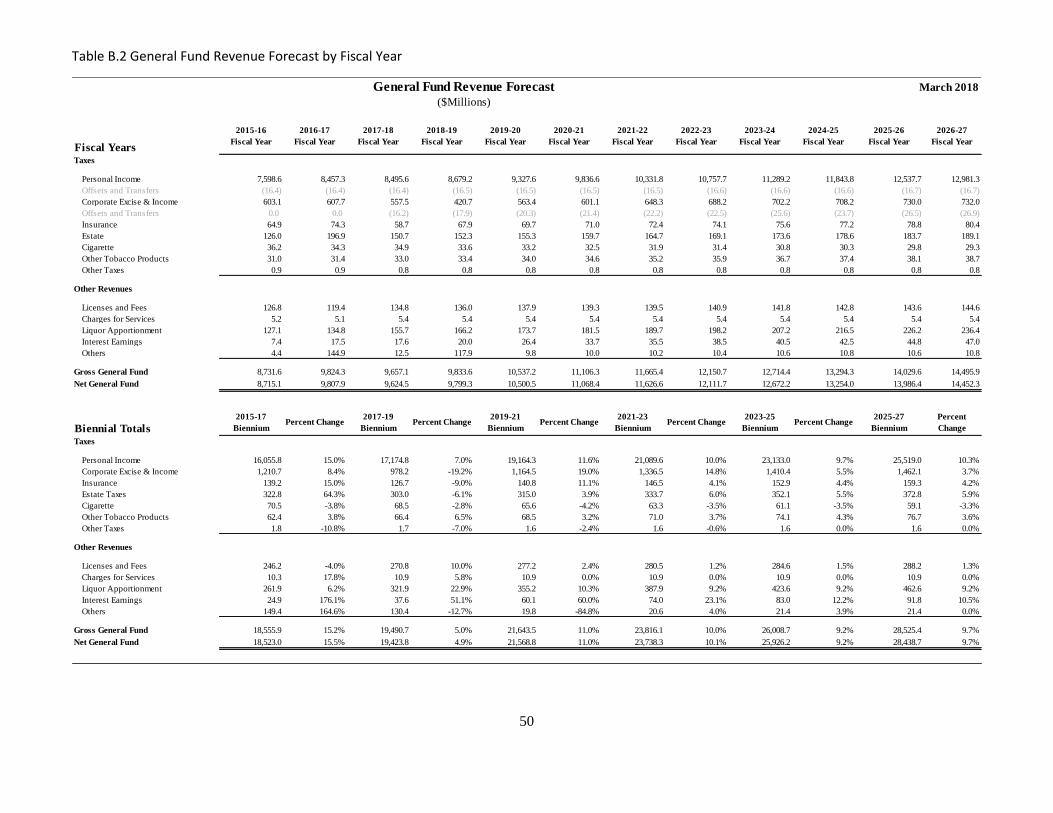
50
Table B.2 General Fund Revenue Forecast by Fiscal Year
Fiscal Years
2015-16
Fiscal Year
2016-17
Fiscal Year
2017-18
Fiscal Year
2018-19
Fiscal Year
2019-20
Fiscal Year
2020-21
Fiscal Year
2021-22
Fiscal Year
2022-23
Fiscal Year
2023-24
Fiscal Year
2024-25
Fiscal Year
2025-26
Fiscal Year
2026-27
Fiscal Year
Taxes
Personal Income 7,598.6 8,457.3 8,495.6 8,679.2 9,327.6 9,836.6 10,331.8 10,757.7 11,289.2 11,843.8 12,537.7 12,981.3
Offsets and Transfers (16.4) (16.4) (16.4) (16.5) (16.5) (16.5) (16.5) (16.6) (16.6) (16.6) (16.7) (16.7)
Corporate Excise & Income 603.1 607.7 557.5 420.7 563.4 601.1 648.3 688.2 702.2 708.2 730.0 732.0
Offsets and Transfers 0.0 0.0 (16.2) (17.9) (20.3) (21.4) (22.2) (22.5) (25.6) (23.7) (26.5) (26.9)
Insurance 64.9 74.3 58.7 67.9 69.7 71.0 72.4 74.1 75.6 77.2 78.8 80.4
Estate 126.0 196.9 150.7 152.3 155.3 159.7 164.7 169.1 173.6 178.6 183.7 189.1
Cigarette 36.2 34.3 34.9 33.6 33.2 32.5 31.9 31.4 30.8 30.3 29.8 29.3
Other Tobacco Products 31.0 31.4 33.0 33.4 34.0 34.6 35.2 35.9 36.7 37.4 38.1 38.7
Other Taxes 0.9 0.9 0.8 0.8 0.8 0.8 0.8 0.8 0.8 0.8 0.8 0.8
Other Revenues
Licenses and Fees 126.8 119.4 134.8 136.0 137.9 139.3 139.5 140.9 141.8 142.8 143.6 144.6
Charges for Services 5.2 5.1 5.4 5.4 5.4 5.4 5.4 5.4 5.4 5.4 5.4 5.4
Liquor Apportionment 127.1 134.8 155.7 166.2 173.7 181.5 189.7 198.2 207.2 216.5 226.2 236.4
Interest Earnings 7.4 17.5 17.6 20.0 26.4 33.7 35.5 38.5 40.5 42.5 44.8 47.0
Others 4.4 144.9 12.5 117.9 9.8 10.0 10.2 10.4 10.6 10.8 10.6 10.8
Gross General Fund 8,731.6 9,824.3 9,657.1 9,833.6 10,537.2 11,106.3 11,665.4 12,150.7 12,714.4 13,294.3 14,029.6 14,495.9
Net General Fund 8,715.1 9,807.9 9,624.5 9,799.3 10,500.5 11,068.4 11,626.6 12,111.7 12,672.2 13,254.0 13,986.4 14,452.3
Biennial Totals
2015-17
BienniumPercent Change
2017-19
BienniumPercent Change
2019-21
BienniumPercent Change
2021-23
BienniumPercent Change
2023-25
BienniumPercent Change
2025-27
Biennium
Percent
Change
Taxes
Personal Income 16,055.8 15.0% 17,174.8 7.0% 19,164.3 11.6% 21,089.6 10.0% 23,133.0 9.7% 25,519.0 10.3%
Corporate Excise & Income 1,210.7 8.4% 978.2 -19.2% 1,164.5 19.0% 1,336.5 14.8% 1,410.4 5.5% 1,462.1 3.7%
Insurance 139.2 15.0% 126.7 -9.0% 140.8 11.1% 146.5 4.1% 152.9 4.4% 159.3 4.2%
Estate Taxes 322.8 64.3% 303.0 -6.1% 315.0 3.9% 333.7 6.0% 352.1 5.5% 372.8 5.9%
Cigarette 70.5 -3.8% 68.5 -2.8% 65.6 -4.2% 63.3 -3.5% 61.1 -3.5% 59.1 -3.3%
Other Tobacco Products 62.4 3.8% 66.4 6.5% 68.5 3.2% 71.0 3.7% 74.1 4.3% 76.7 3.6%
Other Taxes 1.8 -10.8% 1.7 -7.0% 1.6 -2.4% 1.6 -0.6% 1.6 0.0% 1.6 0.0%
Other Revenues
Licenses and Fees 246.2 -4.0% 270.8 10.0% 277.2 2.4% 280.5 1.2% 284.6 1.5% 288.2 1.3%
Charges for Services 10.3 17.8% 10.9 5.8% 10.9 0.0% 10.9 0.0% 10.9 0.0% 10.9 0.0%
Liquor Apportionment 261.9 6.2% 321.9 22.9% 355.2 10.3% 387.9 9.2% 423.6 9.2% 462.6 9.2%
Interest Earnings 24.9 176.1% 37.6 51.1% 60.1 60.0% 74.0 23.1% 83.0 12.2% 91.8 10.5%
Others 149.4 164.6% 130.4 -12.7% 19.8 -84.8% 20.6 4.0% 21.4 3.9% 21.4 0.0%
Gross General Fund 18,555.9 15.2% 19,490.7 5.0% 21,643.5 11.0% 23,816.1 10.0% 26,008.7 9.2% 28,525.4 9.7%
Net General Fund 18,523.0 15.5% 19,423.8 4.9% 21,568.8 11.0% 23,738.3 10.1% 25,926.2 9.2% 28,438.7 9.7%
General Fund Revenue Forecast($Millions)
March 2018
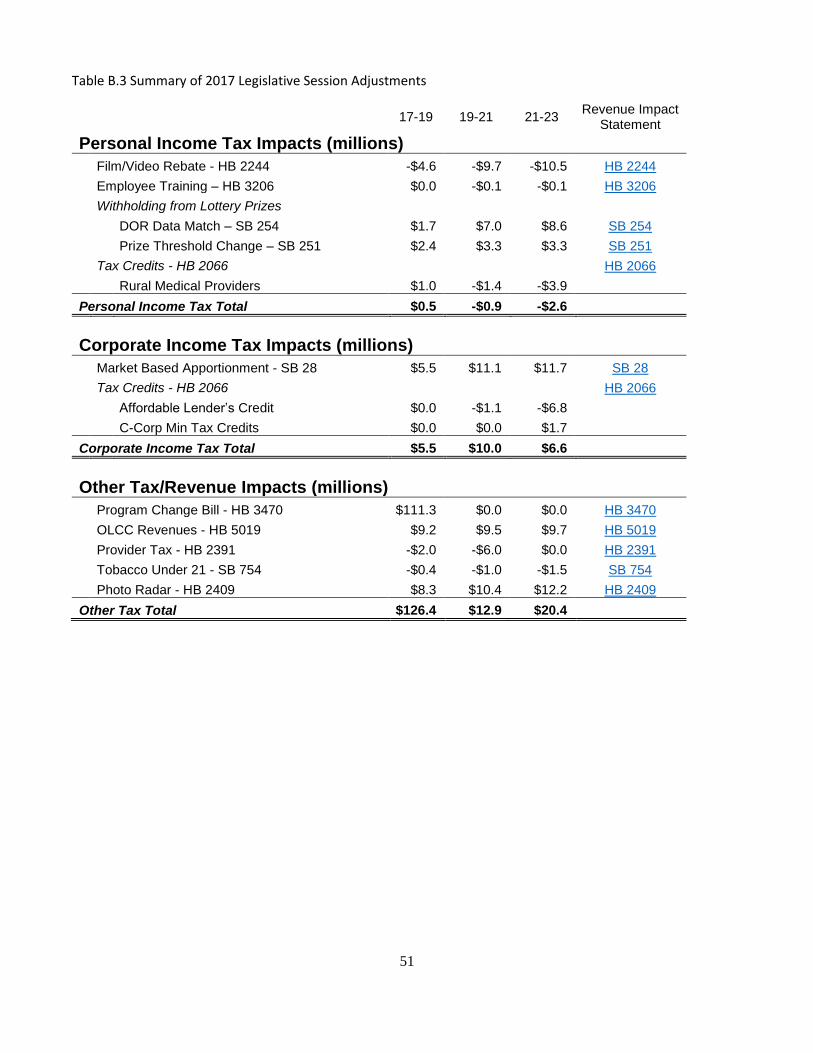
51
Table B.3 Summary of 2017 Legislative Session Adjustments
17-19 19-21 21-23
Revenue Impact Statement
Personal Income Tax Impacts (millions)
Film/Video Rebate - HB 2244 -$4.6 -$9.7 -$10.5 HB 2244
Employee Training – HB 3206 $0.0 -$0.1 -$0.1 HB 3206
Withholding from Lottery Prizes
DOR Data Match – SB 254 $1.7 $7.0 $8.6 SB 254
Prize Threshold Change – SB 251 $2.4 $3.3 $3.3 SB 251
Tax Credits - HB 2066 HB 2066
Rural Medical Providers $1.0 -$1.4 -$3.9
Personal Income Tax Total $0.5 -$0.9 -$2.6
Corporate Income Tax Impacts (millions)
Market Based Apportionment - SB 28 $5.5 $11.1 $11.7 SB 28
Tax Credits - HB 2066 HB 2066
Affordable Lender’s Credit $0.0 -$1.1 -$6.8
C-Corp Min Tax Credits $0.0 $0.0 $1.7
Corporate Income Tax Total $5.5 $10.0 $6.6
Other Tax/Revenue Impacts (millions)
Program Change Bill - HB 3470 $111.3 $0.0 $0.0 HB 3470
OLCC Revenues - HB 5019 $9.2 $9.5 $9.7 HB 5019
Provider Tax - HB 2391 -$2.0 -$6.0 $0.0 HB 2391
Tobacco Under 21 - SB 754 -$0.4 -$1.0 -$1.5 SB 754
Photo Radar - HB 2409 $8.3 $10.4 $12.2 HB 2409
Other Tax Total $126.4 $12.9 $20.4
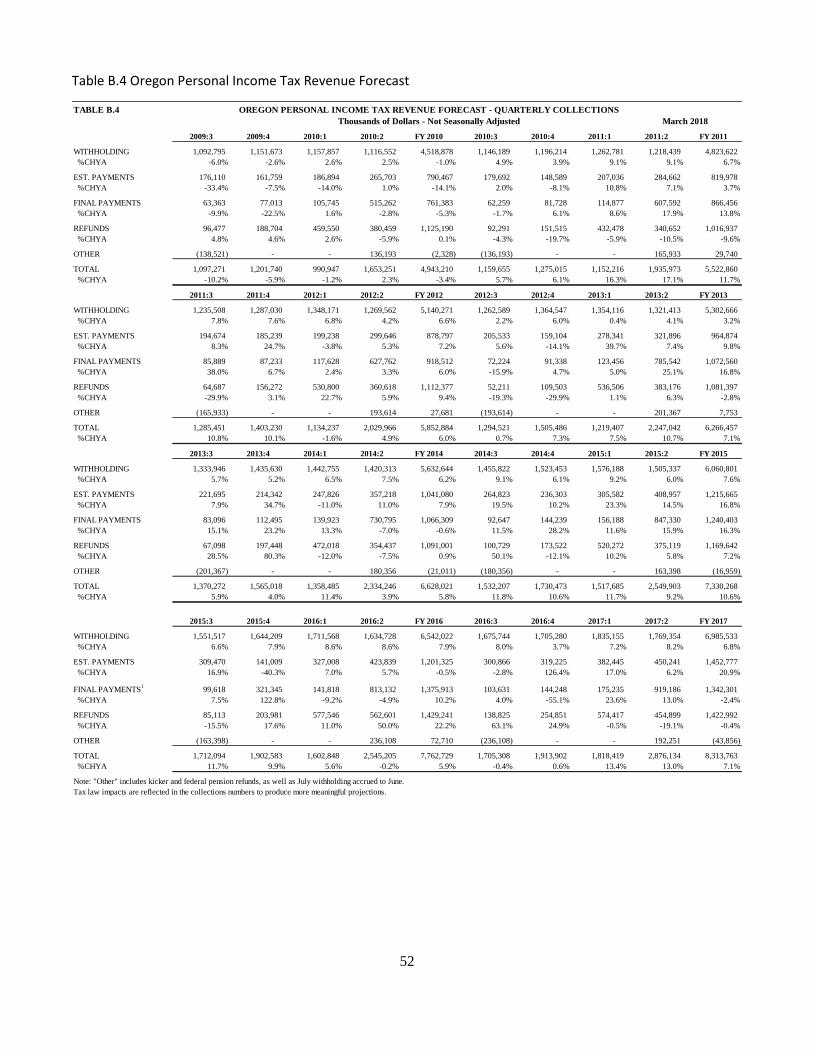
52
Table B.4 Oregon Personal Income Tax Revenue Forecast
TABLE B.4
2009:3 2009:4 2010:1 2010:2 FY 2010 2010:3 2010:4 2011:1 2011:2 FY 2011
WITHHOLDING 1,092,795 1,151,673 1,157,857 1,116,552 4,518,878 1,146,189 1,196,214 1,262,781 1,218,439 4,823,622
%CHYA -6.0% -2.6% 2.6% 2.5% -1.0% 4.9% 3.9% 9.1% 9.1% 6.7%
EST. PAYMENTS 176,110 161,759 186,894 265,703 790,467 179,692 148,589 207,036 284,662 819,978
%CHYA -33.4% -7.5% -14.0% 1.0% -14.1% 2.0% -8.1% 10.8% 7.1% 3.7%
FINAL PAYMENTS 63,363 77,013 105,745 515,262 761,383 62,259 81,728 114,877 607,592 866,456
%CHYA -9.9% -22.5% 1.6% -2.8% -5.3% -1.7% 6.1% 8.6% 17.9% 13.8%
REFUNDS 96,477 188,704 459,550 380,459 1,125,190 92,291 151,515 432,478 340,652 1,016,937
%CHYA 4.8% 4.6% 2.6% -5.9% 0.1% -4.3% -19.7% -5.9% -10.5% -9.6%
OTHER (138,521) - - 136,193 (2,328) (136,193) - - 165,933 29,740
TOTAL 1,097,271 1,201,740 990,947 1,653,251 4,943,210 1,159,655 1,275,015 1,152,216 1,935,973 5,522,860
%CHYA -10.2% -5.9% -1.2% 2.3% -3.4% 5.7% 6.1% 16.3% 17.1% 11.7%
2011:3 2011:4 2012:1 2012:2 FY 2012 2012:3 2012:4 2013:1 2013:2 FY 2013
WITHHOLDING 1,235,508 1,287,030 1,348,171 1,269,562 5,140,271 1,262,589 1,364,547 1,354,116 1,321,413 5,302,666
%CHYA 7.8% 7.6% 6.8% 4.2% 6.6% 2.2% 6.0% 0.4% 4.1% 3.2%
EST. PAYMENTS 194,674 185,239 199,238 299,646 878,797 205,533 159,104 278,341 321,896 964,874
%CHYA 8.3% 24.7% -3.8% 5.3% 7.2% 5.6% -14.1% 39.7% 7.4% 9.8%
FINAL PAYMENTS 85,889 87,233 117,628 627,762 918,512 72,224 91,338 123,456 785,542 1,072,560
%CHYA 38.0% 6.7% 2.4% 3.3% 6.0% -15.9% 4.7% 5.0% 25.1% 16.8%
REFUNDS 64,687 156,272 530,800 360,618 1,112,377 52,211 109,503 536,506 383,176 1,081,397
%CHYA -29.9% 3.1% 22.7% 5.9% 9.4% -19.3% -29.9% 1.1% 6.3% -2.8%
OTHER (165,933) - - 193,614 27,681 (193,614) - - 201,367 7,753
TOTAL 1,285,451 1,403,230 1,134,237 2,029,966 5,852,884 1,294,521 1,505,486 1,219,407 2,247,042 6,266,457
%CHYA 10.8% 10.1% -1.6% 4.9% 6.0% 0.7% 7.3% 7.5% 10.7% 7.1%
2013:3 2013:4 2014:1 2014:2 FY 2014 2014:3 2014:4 2015:1 2015:2 FY 2015
WITHHOLDING 1,333,946 1,435,630 1,442,755 1,420,313 5,632,644 1,455,822 1,523,453 1,576,188 1,505,337 6,060,801
%CHYA 5.7% 5.2% 6.5% 7.5% 6.2% 9.1% 6.1% 9.2% 6.0% 7.6%
EST. PAYMENTS 221,695 214,342 247,826 357,218 1,041,080 264,823 236,303 305,582 408,957 1,215,665
%CHYA 7.9% 34.7% -11.0% 11.0% 7.9% 19.5% 10.2% 23.3% 14.5% 16.8%
FINAL PAYMENTS 83,096 112,495 139,923 730,795 1,066,309 92,647 144,239 156,188 847,330 1,240,403
%CHYA 15.1% 23.2% 13.3% -7.0% -0.6% 11.5% 28.2% 11.6% 15.9% 16.3%
REFUNDS 67,098 197,448 472,018 354,437 1,091,001 100,729 173,522 520,272 375,119 1,169,642
%CHYA 28.5% 80.3% -12.0% -7.5% 0.9% 50.1% -12.1% 10.2% 5.8% 7.2%
OTHER (201,367) - - 180,356 (21,011) (180,356) - - 163,398 (16,959)
TOTAL 1,370,272 1,565,018 1,358,485 2,334,246 6,628,021 1,532,207 1,730,473 1,517,685 2,549,903 7,330,268
%CHYA 5.9% 4.0% 11.4% 3.9% 5.8% 11.8% 10.6% 11.7% 9.2% 10.6%
2015:3 2015:4 2016:1 2016:2 FY 2016 2016:3 2016:4 2017:1 2017:2 FY 2017
WITHHOLDING 1,551,517 1,644,209 1,711,568 1,634,728 6,542,022 1,675,744 1,705,280 1,835,155 1,769,354 6,985,533
%CHYA 6.6% 7.9% 8.6% 8.6% 7.9% 8.0% 3.7% 7.2% 8.2% 6.8%
EST. PAYMENTS 309,470 141,009 327,008 423,839 1,201,325 300,866 319,225 382,445 450,241 1,452,777
%CHYA 16.9% -40.3% 7.0% 5.7% -0.5% -2.8% 126.4% 17.0% 6.2% 20.9%
FINAL PAYMENTS1
99,618 321,345 141,818 813,132 1,375,913 103,631 144,248 175,235 919,186 1,342,301
%CHYA 7.5% 122.8% -9.2% -4.9% 10.2% 4.0% -55.1% 23.6% 13.0% -2.4%
REFUNDS 85,113 203,981 577,546 562,601 1,429,241 138,825 254,851 574,417 454,899 1,422,992
%CHYA -15.5% 17.6% 11.0% 50.0% 22.2% 63.1% 24.9% -0.5% -19.1% -0.4%
OTHER (163,398) - - 236,108 72,710 (236,108) - - 192,251 (43,856)
TOTAL 1,712,094 1,902,583 1,602,848 2,545,205 7,762,729 1,705,308 1,913,902 1,818,419 2,876,134 8,313,763
%CHYA 11.7% 9.9% 5.6% -0.2% 5.9% -0.4% 0.6% 13.4% 13.0% 7.1%
March 2018
OREGON PERSONAL INCOME TAX REVENUE FORECAST - QUARTERLY COLLECTIONS
Thousands of Dollars - Not Seasonally Adjusted
Note: "Other" includes kicker and federal pension refunds, as well as July withholding accrued to June.
Tax law impacts are reflected in the collections numbers to produce more meaningful projections.
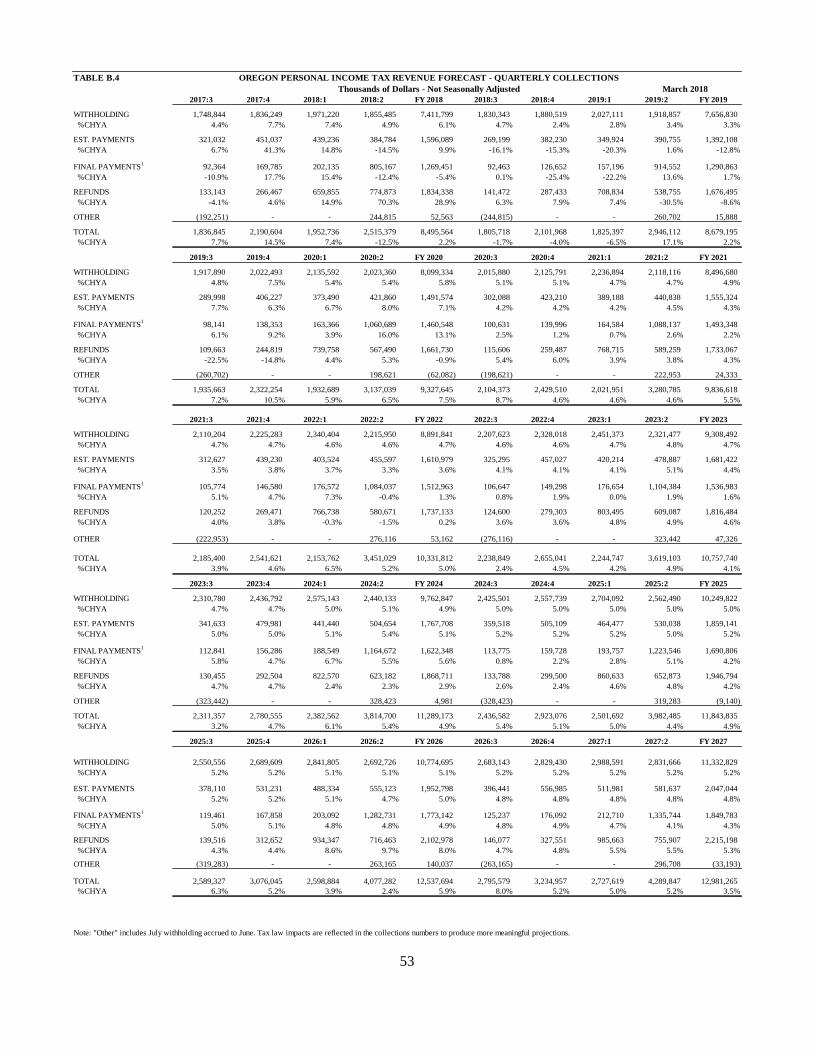
53
TABLE B.4
2017:3 2017:4 2018:1 2018:2 FY 2018 2018:3 2018:4 2019:1 2019:2 FY 2019
WITHHOLDING 1,748,844 1,836,249 1,971,220 1,855,485 7,411,799 1,830,343 1,880,519 2,027,111 1,918,857 7,656,830
%CHYA 4.4% 7.7% 7.4% 4.9% 6.1% 4.7% 2.4% 2.8% 3.4% 3.3%
EST. PAYMENTS 321,032 451,037 439,236 384,784 1,596,089 269,199 382,230 349,924 390,755 1,392,108
%CHYA 6.7% 41.3% 14.8% -14.5% 9.9% -16.1% -15.3% -20.3% 1.6% -12.8%
FINAL PAYMENTS1
92,364 169,785 202,135 805,167 1,269,451 92,463 126,652 157,196 914,552 1,290,863
%CHYA -10.9% 17.7% 15.4% -12.4% -5.4% 0.1% -25.4% -22.2% 13.6% 1.7%
REFUNDS 133,143 266,467 659,855 774,873 1,834,338 141,472 287,433 708,834 538,755 1,676,495
%CHYA -4.1% 4.6% 14.9% 70.3% 28.9% 6.3% 7.9% 7.4% -30.5% -8.6%
OTHER (192,251) - - 244,815 52,563 (244,815) - - 260,702 15,888
TOTAL 1,836,845 2,190,604 1,952,736 2,515,379 8,495,564 1,805,718 2,101,968 1,825,397 2,946,112 8,679,195
%CHYA 7.7% 14.5% 7.4% -12.5% 2.2% -1.7% -4.0% -6.5% 17.1% 2.2%
2019:3 2019:4 2020:1 2020:2 FY 2020 2020:3 2020:4 2021:1 2021:2 FY 2021
WITHHOLDING 1,917,890 2,022,493 2,135,592 2,023,360 8,099,334 2,015,880 2,125,791 2,236,894 2,118,116 8,496,680
%CHYA 4.8% 7.5% 5.4% 5.4% 5.8% 5.1% 5.1% 4.7% 4.7% 4.9%
EST. PAYMENTS 289,998 406,227 373,490 421,860 1,491,574 302,088 423,210 389,188 440,838 1,555,324
%CHYA 7.7% 6.3% 6.7% 8.0% 7.1% 4.2% 4.2% 4.2% 4.5% 4.3%
FINAL PAYMENTS1
98,141 138,353 163,366 1,060,689 1,460,548 100,631 139,996 164,584 1,088,137 1,493,348
%CHYA 6.1% 9.2% 3.9% 16.0% 13.1% 2.5% 1.2% 0.7% 2.6% 2.2%
REFUNDS 109,663 244,819 739,758 567,490 1,661,730 115,606 259,487 768,715 589,259 1,733,067
%CHYA -22.5% -14.8% 4.4% 5.3% -0.9% 5.4% 6.0% 3.9% 3.8% 4.3%
OTHER (260,702) - - 198,621 (62,082) (198,621) - - 222,953 24,333
TOTAL 1,935,663 2,322,254 1,932,689 3,137,039 9,327,645 2,104,373 2,429,510 2,021,951 3,280,785 9,836,618
%CHYA 7.2% 10.5% 5.9% 6.5% 7.5% 8.7% 4.6% 4.6% 4.6% 5.5%
2021:3 2021:4 2022:1 2022:2 FY 2022 2022:3 2022:4 2023:1 2023:2 FY 2023
WITHHOLDING 2,110,204 2,225,283 2,340,404 2,215,950 8,891,841 2,207,623 2,328,018 2,451,373 2,321,477 9,308,492
%CHYA 4.7% 4.7% 4.6% 4.6% 4.7% 4.6% 4.6% 4.7% 4.8% 4.7%
EST. PAYMENTS 312,627 439,230 403,524 455,597 1,610,979 325,295 457,027 420,214 478,887 1,681,422
%CHYA 3.5% 3.8% 3.7% 3.3% 3.6% 4.1% 4.1% 4.1% 5.1% 4.4%
FINAL PAYMENTS1
105,774 146,580 176,572 1,084,037 1,512,963 106,647 149,298 176,654 1,104,384 1,536,983
%CHYA 5.1% 4.7% 7.3% -0.4% 1.3% 0.8% 1.9% 0.0% 1.9% 1.6%
REFUNDS 120,252 269,471 766,738 580,671 1,737,133 124,600 279,303 803,495 609,087 1,816,484
%CHYA 4.0% 3.8% -0.3% -1.5% 0.2% 3.6% 3.6% 4.8% 4.9% 4.6%
OTHER (222,953) - - 276,116 53,162 (276,116) - - 323,442 47,326
TOTAL 2,185,400 2,541,621 2,153,762 3,451,029 10,331,812 2,238,849 2,655,041 2,244,747 3,619,103 10,757,740
%CHYA 3.9% 4.6% 6.5% 5.2% 5.0% 2.4% 4.5% 4.2% 4.9% 4.1%
2023:3 2023:4 2024:1 2024:2 FY 2024 2024:3 2024:4 2025:1 2025:2 FY 2025
WITHHOLDING 2,310,780 2,436,792 2,575,143 2,440,133 9,762,847 2,425,501 2,557,739 2,704,092 2,562,490 10,249,822
%CHYA 4.7% 4.7% 5.0% 5.1% 4.9% 5.0% 5.0% 5.0% 5.0% 5.0%
EST. PAYMENTS 341,633 479,981 441,440 504,654 1,767,708 359,518 505,109 464,477 530,038 1,859,141
%CHYA 5.0% 5.0% 5.1% 5.4% 5.1% 5.2% 5.2% 5.2% 5.0% 5.2%
FINAL PAYMENTS1
112,841 156,286 188,549 1,164,672 1,622,348 113,775 159,728 193,757 1,223,546 1,690,806
%CHYA 5.8% 4.7% 6.7% 5.5% 5.6% 0.8% 2.2% 2.8% 5.1% 4.2%
REFUNDS 130,455 292,504 822,570 623,182 1,868,711 133,788 299,500 860,633 652,873 1,946,794
%CHYA 4.7% 4.7% 2.4% 2.3% 2.9% 2.6% 2.4% 4.6% 4.8% 4.2%
OTHER (323,442) - - 328,423 4,981 (328,423) - - 319,283 (9,140)
TOTAL 2,311,357 2,780,555 2,382,562 3,814,700 11,289,173 2,436,582 2,923,076 2,501,692 3,982,485 11,843,835
%CHYA 3.2% 4.7% 6.1% 5.4% 4.9% 5.4% 5.1% 5.0% 4.4% 4.9%
2025:3 2025:4 2026:1 2026:2 FY 2026 2026:3 2026:4 2027:1 2027:2 FY 2027
WITHHOLDING 2,550,556 2,689,609 2,841,805 2,692,726 10,774,695 2,683,143 2,829,430 2,988,591 2,831,666 11,332,829
%CHYA 5.2% 5.2% 5.1% 5.1% 5.1% 5.2% 5.2% 5.2% 5.2% 5.2%
EST. PAYMENTS 378,110 531,231 488,334 555,123 1,952,798 396,441 556,985 511,981 581,637 2,047,044
%CHYA 5.2% 5.2% 5.1% 4.7% 5.0% 4.8% 4.8% 4.8% 4.8% 4.8%
FINAL PAYMENTS1
119,461 167,858 203,092 1,282,731 1,773,142 125,237 176,092 212,710 1,335,744 1,849,783
%CHYA 5.0% 5.1% 4.8% 4.8% 4.9% 4.8% 4.9% 4.7% 4.1% 4.3%
REFUNDS 139,516 312,652 934,347 716,463 2,102,978 146,077 327,551 985,663 755,907 2,215,198
%CHYA 4.3% 4.4% 8.6% 9.7% 8.0% 4.7% 4.8% 5.5% 5.5% 5.3%
OTHER (319,283) - - 263,165 140,037 (263,165) - - 296,708 (33,193)
TOTAL 2,589,327 3,076,045 2,598,884 4,077,282 12,537,694 2,795,579 3,234,957 2,727,619 4,289,847 12,981,265
%CHYA 6.3% 5.2% 3.9% 2.4% 5.9% 8.0% 5.2% 5.0% 5.2% 3.5%
Note: "Other" includes July withholding accrued to June. Tax law impacts are reflected in the collections numbers to produce more meaningful projections.
March 2018
OREGON PERSONAL INCOME TAX REVENUE FORECAST - QUARTERLY COLLECTIONS
Thousands of Dollars - Not Seasonally Adjusted
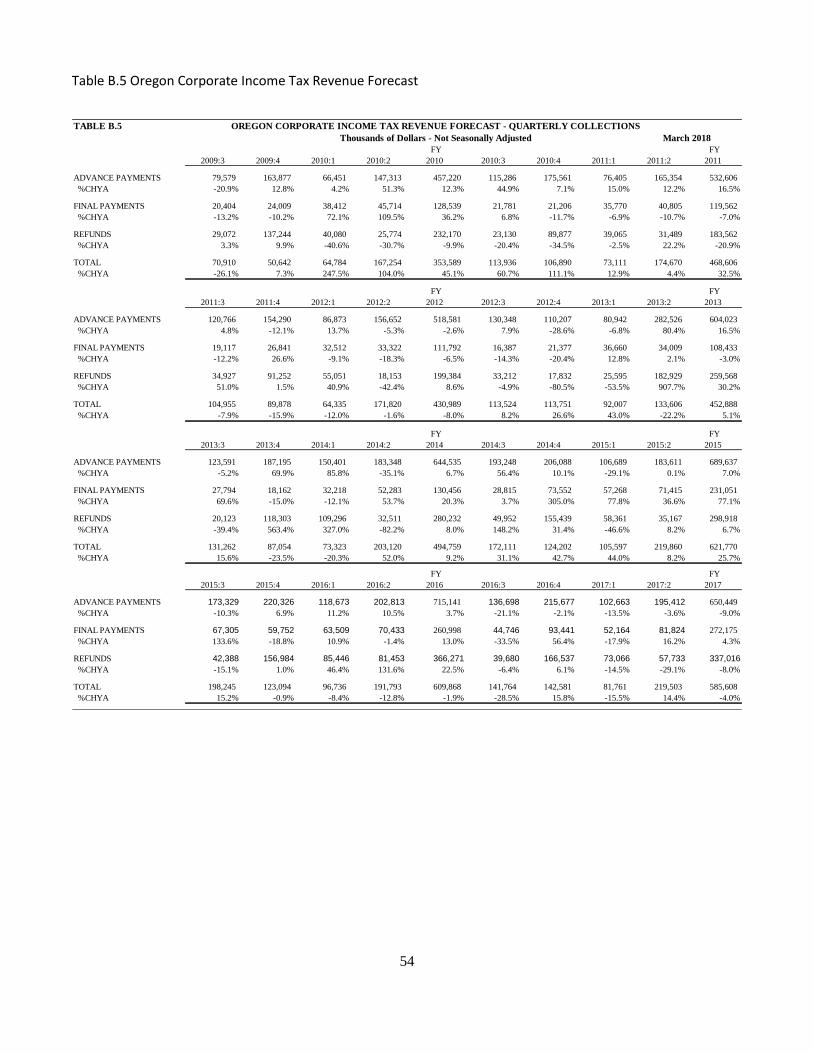
54
Table B.5 Oregon Corporate Income Tax Revenue Forecast
TABLE B.5
FY FY
2009:3 2009:4 2010:1 2010:2 2010 2010:3 2010:4 2011:1 2011:2 2011
ADVANCE PAYMENTS 79,579 163,877 66,451 147,313 457,220 115,286 175,561 76,405 165,354 532,606
%CHYA -20.9% 12.8% 4.2% 51.3% 12.3% 44.9% 7.1% 15.0% 12.2% 16.5%
FINAL PAYMENTS 20,404 24,009 38,412 45,714 128,539 21,781 21,206 35,770 40,805 119,562
%CHYA -13.2% -10.2% 72.1% 109.5% 36.2% 6.8% -11.7% -6.9% -10.7% -7.0%
REFUNDS 29,072 137,244 40,080 25,774 232,170 23,130 89,877 39,065 31,489 183,562
%CHYA 3.3% 9.9% -40.6% -30.7% -9.9% -20.4% -34.5% -2.5% 22.2% -20.9%
TOTAL 70,910 50,642 64,784 167,254 353,589 113,936 106,890 73,111 174,670 468,606
%CHYA -26.1% 7.3% 247.5% 104.0% 45.1% 60.7% 111.1% 12.9% 4.4% 32.5%
FY FY
2011:3 2011:4 2012:1 2012:2 2012 2012:3 2012:4 2013:1 2013:2 2013
ADVANCE PAYMENTS 120,766 154,290 86,873 156,652 518,581 130,348 110,207 80,942 282,526 604,023
%CHYA 4.8% -12.1% 13.7% -5.3% -2.6% 7.9% -28.6% -6.8% 80.4% 16.5%
FINAL PAYMENTS 19,117 26,841 32,512 33,322 111,792 16,387 21,377 36,660 34,009 108,433
%CHYA -12.2% 26.6% -9.1% -18.3% -6.5% -14.3% -20.4% 12.8% 2.1% -3.0%
REFUNDS 34,927 91,252 55,051 18,153 199,384 33,212 17,832 25,595 182,929 259,568
%CHYA 51.0% 1.5% 40.9% -42.4% 8.6% -4.9% -80.5% -53.5% 907.7% 30.2%
TOTAL 104,955 89,878 64,335 171,820 430,989 113,524 113,751 92,007 133,606 452,888
%CHYA -7.9% -15.9% -12.0% -1.6% -8.0% 8.2% 26.6% 43.0% -22.2% 5.1%
FY FY
2013:3 2013:4 2014:1 2014:2 2014 2014:3 2014:4 2015:1 2015:2 2015
ADVANCE PAYMENTS 123,591 187,195 150,401 183,348 644,535 193,248 206,088 106,689 183,611 689,637
%CHYA -5.2% 69.9% 85.8% -35.1% 6.7% 56.4% 10.1% -29.1% 0.1% 7.0%
FINAL PAYMENTS 27,794 18,162 32,218 52,283 130,456 28,815 73,552 57,268 71,415 231,051
%CHYA 69.6% -15.0% -12.1% 53.7% 20.3% 3.7% 305.0% 77.8% 36.6% 77.1%
REFUNDS 20,123 118,303 109,296 32,511 280,232 49,952 155,439 58,361 35,167 298,918
%CHYA -39.4% 563.4% 327.0% -82.2% 8.0% 148.2% 31.4% -46.6% 8.2% 6.7%
TOTAL 131,262 87,054 73,323 203,120 494,759 172,111 124,202 105,597 219,860 621,770
%CHYA 15.6% -23.5% -20.3% 52.0% 9.2% 31.1% 42.7% 44.0% 8.2% 25.7%
FY FY
2015:3 2015:4 2016:1 2016:2 2016 2016:3 2016:4 2017:1 2017:2 2017
ADVANCE PAYMENTS 173,329 220,326 118,673 202,813 715,141 136,698 215,677 102,663 195,412 650,449
%CHYA -10.3% 6.9% 11.2% 10.5% 3.7% -21.1% -2.1% -13.5% -3.6% -9.0%
FINAL PAYMENTS 67,305 59,752 63,509 70,433 260,998 44,746 93,441 52,164 81,824 272,175
%CHYA 133.6% -18.8% 10.9% -1.4% 13.0% -33.5% 56.4% -17.9% 16.2% 4.3%
REFUNDS 42,388 156,984 85,446 81,453 366,271 39,680 166,537 73,066 57,733 337,016
%CHYA -15.1% 1.0% 46.4% 131.6% 22.5% -6.4% 6.1% -14.5% -29.1% -8.0%
TOTAL 198,245 123,094 96,736 191,793 609,868 141,764 142,581 81,761 219,503 585,608
%CHYA 15.2% -0.9% -8.4% -12.8% -1.9% -28.5% 15.8% -15.5% 14.4% -4.0%
OREGON CORPORATE INCOME TAX REVENUE FORECAST - QUARTERLY COLLECTIONS
Thousands of Dollars - Not Seasonally Adjusted March 2018 UPDATEDUpdated MMM 3/15/2018
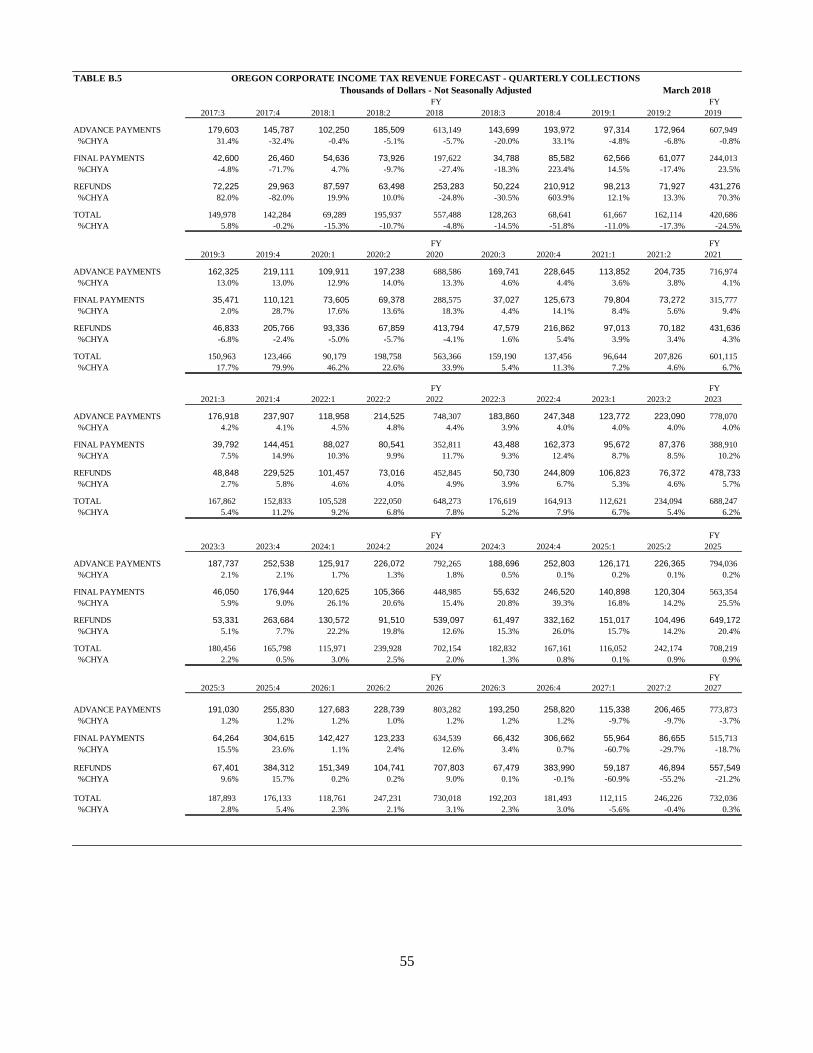
55
TABLE B.5
FY FY
2017:3 2017:4 2018:1 2018:2 2018 2018:3 2018:4 2019:1 2019:2 2019
ADVANCE PAYMENTS 179,603 145,787 102,250 185,509 613,149 143,699 193,972 97,314 172,964 607,949
%CHYA 31.4% -32.4% -0.4% -5.1% -5.7% -20.0% 33.1% -4.8% -6.8% -0.8%
FINAL PAYMENTS 42,600 26,460 54,636 73,926 197,622 34,788 85,582 62,566 61,077 244,013
%CHYA -4.8% -71.7% 4.7% -9.7% -27.4% -18.3% 223.4% 14.5% -17.4% 23.5%
REFUNDS 72,225 29,963 87,597 63,498 253,283 50,224 210,912 98,213 71,927 431,276
%CHYA 82.0% -82.0% 19.9% 10.0% -24.8% -30.5% 603.9% 12.1% 13.3% 70.3%
TOTAL 149,978 142,284 69,289 195,937 557,488 128,263 68,641 61,667 162,114 420,686
%CHYA 5.8% -0.2% -15.3% -10.7% -4.8% -14.5% -51.8% -11.0% -17.3% -24.5%
FY FY
2019:3 2019:4 2020:1 2020:2 2020 2020:3 2020:4 2021:1 2021:2 2021
ADVANCE PAYMENTS 162,325 219,111 109,911 197,238 688,586 169,741 228,645 113,852 204,735 716,974
%CHYA 13.0% 13.0% 12.9% 14.0% 13.3% 4.6% 4.4% 3.6% 3.8% 4.1%
FINAL PAYMENTS 35,471 110,121 73,605 69,378 288,575 37,027 125,673 79,804 73,272 315,777
%CHYA 2.0% 28.7% 17.6% 13.6% 18.3% 4.4% 14.1% 8.4% 5.6% 9.4%
REFUNDS 46,833 205,766 93,336 67,859 413,794 47,579 216,862 97,013 70,182 431,636
%CHYA -6.8% -2.4% -5.0% -5.7% -4.1% 1.6% 5.4% 3.9% 3.4% 4.3%
TOTAL 150,963 123,466 90,179 198,758 563,366 159,190 137,456 96,644 207,826 601,115
%CHYA 17.7% 79.9% 46.2% 22.6% 33.9% 5.4% 11.3% 7.2% 4.6% 6.7%
FY FY
2021:3 2021:4 2022:1 2022:2 2022 2022:3 2022:4 2023:1 2023:2 2023
ADVANCE PAYMENTS 176,918 237,907 118,958 214,525 748,307 183,860 247,348 123,772 223,090 778,070
%CHYA 4.2% 4.1% 4.5% 4.8% 4.4% 3.9% 4.0% 4.0% 4.0% 4.0%
FINAL PAYMENTS 39,792 144,451 88,027 80,541 352,811 43,488 162,373 95,672 87,376 388,910
%CHYA 7.5% 14.9% 10.3% 9.9% 11.7% 9.3% 12.4% 8.7% 8.5% 10.2%
REFUNDS 48,848 229,525 101,457 73,016 452,845 50,730 244,809 106,823 76,372 478,733
%CHYA 2.7% 5.8% 4.6% 4.0% 4.9% 3.9% 6.7% 5.3% 4.6% 5.7%
TOTAL 167,862 152,833 105,528 222,050 648,273 176,619 164,913 112,621 234,094 688,247
%CHYA 5.4% 11.2% 9.2% 6.8% 7.8% 5.2% 7.9% 6.7% 5.4% 6.2%
FY FY
2023:3 2023:4 2024:1 2024:2 2024 2024:3 2024:4 2025:1 2025:2 2025
ADVANCE PAYMENTS 187,737 252,538 125,917 226,072 792,265 188,696 252,803 126,171 226,365 794,036
%CHYA 2.1% 2.1% 1.7% 1.3% 1.8% 0.5% 0.1% 0.2% 0.1% 0.2%
FINAL PAYMENTS 46,050 176,944 120,625 105,366 448,985 55,632 246,520 140,898 120,304 563,354
%CHYA 5.9% 9.0% 26.1% 20.6% 15.4% 20.8% 39.3% 16.8% 14.2% 25.5%
REFUNDS 53,331 263,684 130,572 91,510 539,097 61,497 332,162 151,017 104,496 649,172
%CHYA 5.1% 7.7% 22.2% 19.8% 12.6% 15.3% 26.0% 15.7% 14.2% 20.4%
TOTAL 180,456 165,798 115,971 239,928 702,154 182,832 167,161 116,052 242,174 708,219
%CHYA 2.2% 0.5% 3.0% 2.5% 2.0% 1.3% 0.8% 0.1% 0.9% 0.9%
FY FY
2025:3 2025:4 2026:1 2026:2 2026 2026:3 2026:4 2027:1 2027:2 2027
ADVANCE PAYMENTS 191,030 255,830 127,683 228,739 803,282 193,250 258,820 115,338 206,465 773,873
%CHYA 1.2% 1.2% 1.2% 1.0% 1.2% 1.2% 1.2% -9.7% -9.7% -3.7%
FINAL PAYMENTS 64,264 304,615 142,427 123,233 634,539 66,432 306,662 55,964 86,655 515,713
%CHYA 15.5% 23.6% 1.1% 2.4% 12.6% 3.4% 0.7% -60.7% -29.7% -18.7%
REFUNDS 67,401 384,312 151,349 104,741 707,803 67,479 383,990 59,187 46,894 557,549
%CHYA 9.6% 15.7% 0.2% 0.2% 9.0% 0.1% -0.1% -60.9% -55.2% -21.2%
TOTAL 187,893 176,133 118,761 247,231 730,018 192,203 181,493 112,115 246,226 732,036
%CHYA 2.8% 5.4% 2.3% 2.1% 3.1% 2.3% 3.0% -5.6% -0.4% 0.3%
March 2018
OREGON CORPORATE INCOME TAX REVENUE FORECAST - QUARTERLY COLLECTIONS
Thousands of Dollars - Not Seasonally Adjusted
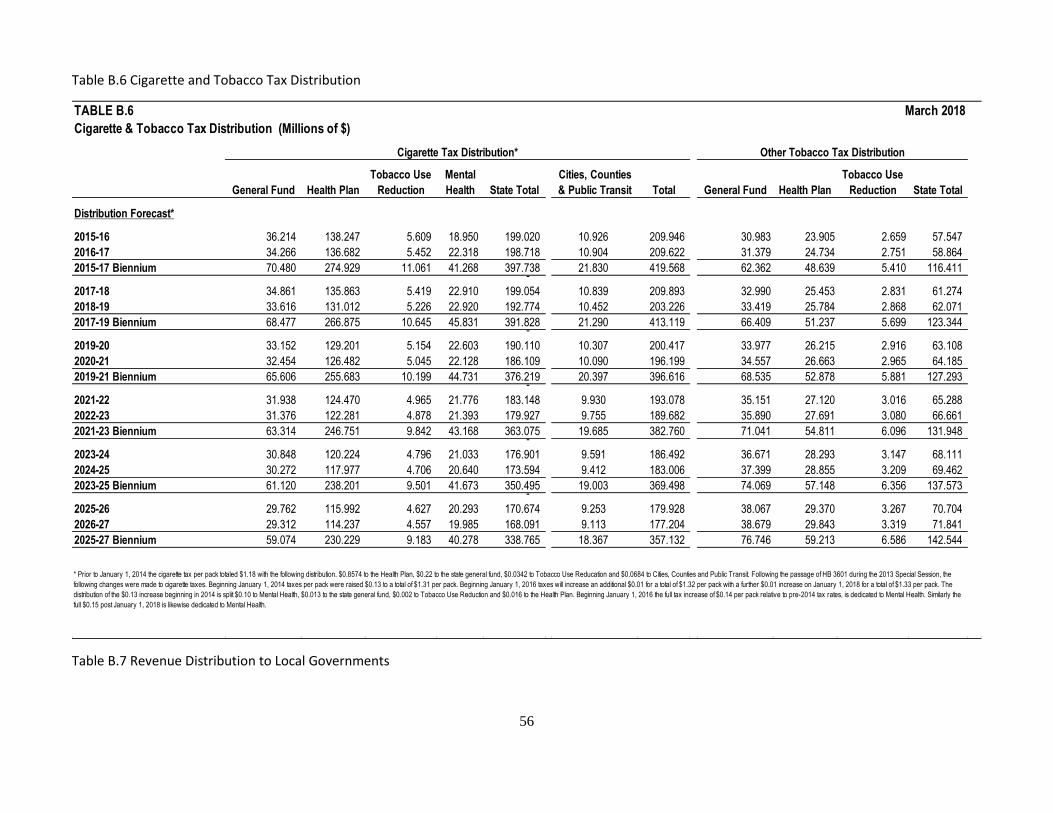
56
Table B.6 Cigarette and Tobacco Tax Distribution
Table B.7 Revenue Distribution to Local Governments
TABLE B.6
Cigarette & Tobacco Tax Distribution (Millions of $)
Tobacco Use Mental Cities, Counties Tobacco Use
General Fund Health Plan Reduction Health State Total & Public Transit Total General Fund Health Plan Reduction State Total
Distribution Forecast*
2015-16 36.214 138.247 5.609 18.950 199.020 10.926 209.946 30.983 23.905 2.659 57.547
2016-17 34.266 136.682 5.452 22.318 198.718 10.904 209.622 31.379 24.734 2.751 58.864
2015-17 Biennium 70.480 274.929 11.061 41.268 397.738 21.830 419.568 62.362 48.639 5.410 116.411 -
2017-18 34.861 135.863 5.419 22.910 199.054 10.839 209.893 32.990 25.453 2.831 61.274
2018-19 33.616 131.012 5.226 22.920 192.774 10.452 203.226 33.419 25.784 2.868 62.071
2017-19 Biennium 68.477 266.875 10.645 45.831 391.828 21.290 413.119 66.409 51.237 5.699 123.344 -
2019-20 33.152 129.201 5.154 22.603 190.110 10.307 200.417 33.977 26.215 2.916 63.108
2020-21 32.454 126.482 5.045 22.128 186.109 10.090 196.199 34.557 26.663 2.965 64.185
2019-21 Biennium 65.606 255.683 10.199 44.731 376.219 20.397 396.616 68.535 52.878 5.881 127.293 -
2021-22 31.938 124.470 4.965 21.776 183.148 9.930 193.078 35.151 27.120 3.016 65.288
2022-23 31.376 122.281 4.878 21.393 179.927 9.755 189.682 35.890 27.691 3.080 66.661
2021-23 Biennium 63.314 246.751 9.842 43.168 363.075 19.685 382.760 71.041 54.811 6.096 131.948 -
2023-24 30.848 120.224 4.796 21.033 176.901 9.591 186.492 36.671 28.293 3.147 68.111
2024-25 30.272 117.977 4.706 20.640 173.594 9.412 183.006 37.399 28.855 3.209 69.462
2023-25 Biennium 61.120 238.201 9.501 41.673 350.495 19.003 369.498 74.069 57.148 6.356 137.573 -
2025-26 29.762 115.992 4.627 20.293 170.674 9.253 179.928 38.067 29.370 3.267 70.704
2026-27 29.312 114.237 4.557 19.985 168.091 9.113 177.204 38.679 29.843 3.319 71.841
2025-27 Biennium 59.074 230.229 9.183 40.278 338.765 18.367 357.132 76.746 59.213 6.586 142.544
March 2018
Cigarette Tax Distribution* Other Tobacco Tax Distribution
* Prior to January 1, 2014 the cigarette tax per pack totaled $1.18 with the following distribution. $0.8574 to the Health Plan, $0.22 to the state general fund, $0.0342 to Tobacco Use Reducation and $0.0684 to Cities, Counties and Public Transit. Following the passage of HB 3601 during the 2013 Special Session, the
following changes were made to cigarette taxes. Beginning January 1, 2014 taxes per pack were raised $0.13 to a total of $1.31 per pack. Beginning January 1, 2016 taxes will increase an additional $0.01 for a total of $1.32 per pack with a further $0.01 increase on January 1, 2018 for a total of $1.33 per pack. The
distribution of the $0.13 increase beginning in 2014 is split $0.10 to Mental Health, $0.013 to the state general fund, $0.002 to Tobacco Use Reduction and $0.016 to the Health Plan. Beginning January 1, 2016 the full tax increase of $0.14 per pack relative to pre-2014 tax rates, is dedicated to Mental Health. Similarly the
full $0.15 post January 1, 2018 is likewise dedicated to Mental Health.
Updated JWL2/12/20189:20 am
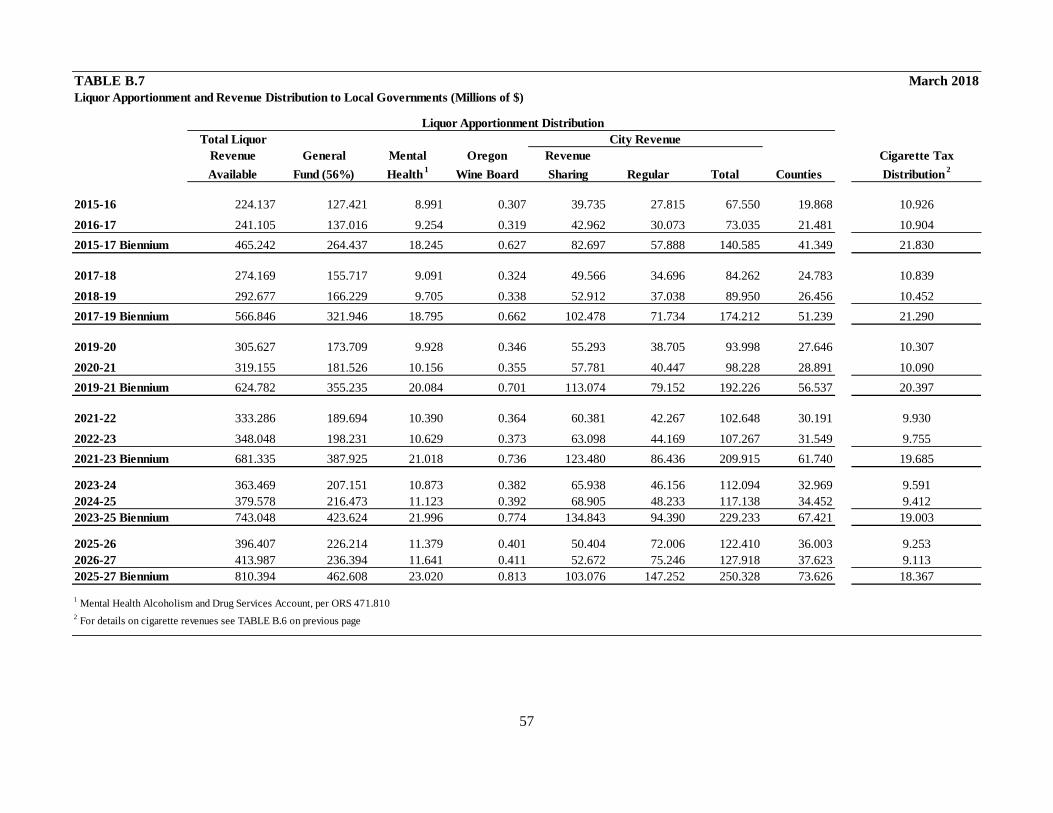
57
TABLE B.7
Liquor Apportionment and Revenue Distribution to Local Governments (Millions of $)
Total Liquor
Revenue General Mental Oregon Revenue Cigarette Tax
Available Fund (56%) Health 1
Wine Board Sharing Regular Total Counties Distribution 2
2015-16 224.137 127.421 8.991 0.307 39.735 27.815 67.550 19.868 10.926
2016-17 241.105 137.016 9.254 0.319 42.962 30.073 73.035 21.481 10.904
2015-17 Biennium 465.242 264.437 18.245 0.627 82.697 57.888 140.585 41.349 21.830
2017-18 274.169 155.717 9.091 0.324 49.566 34.696 84.262 24.783 10.839
2018-19 292.677 166.229 9.705 0.338 52.912 37.038 89.950 26.456 10.452
2017-19 Biennium 566.846 321.946 18.795 0.662 102.478 71.734 174.212 51.239 21.290
2019-20 305.627 173.709 9.928 0.346 55.293 38.705 93.998 27.646 10.307
2020-21 319.155 181.526 10.156 0.355 57.781 40.447 98.228 28.891 10.090
2019-21 Biennium 624.782 355.235 20.084 0.701 113.074 79.152 192.226 56.537 20.397
2021-22 333.286 189.694 10.390 0.364 60.381 42.267 102.648 30.191 9.930
2022-23 348.048 198.231 10.629 0.373 63.098 44.169 107.267 31.549 9.755
2021-23 Biennium 681.335 387.925 21.018 0.736 123.480 86.436 209.915 61.740 19.685
2023-24 363.469 207.151 10.873 0.382 65.938 46.156 112.094 32.969 9.591
2024-25 379.578 216.473 11.123 0.392 68.905 48.233 117.138 34.452 9.412
2023-25 Biennium 743.048 423.624 21.996 0.774 134.843 94.390 229.233 67.421 19.003
2025-26 396.407 226.214 11.379 0.401 50.404 72.006 122.410 36.003 9.253
2026-27 413.987 236.394 11.641 0.411 52.672 75.246 127.918 37.623 9.113
2025-27 Biennium 810.394 462.608 23.020 0.813 103.076 147.252 250.328 73.626 18.367
1 Mental Health Alcoholism and Drug Services Account, per ORS 471.810
2 For details on cigarette revenues see TABLE B.6 on previous page
March 2018
Liquor Apportionment Distribution
City Revenue
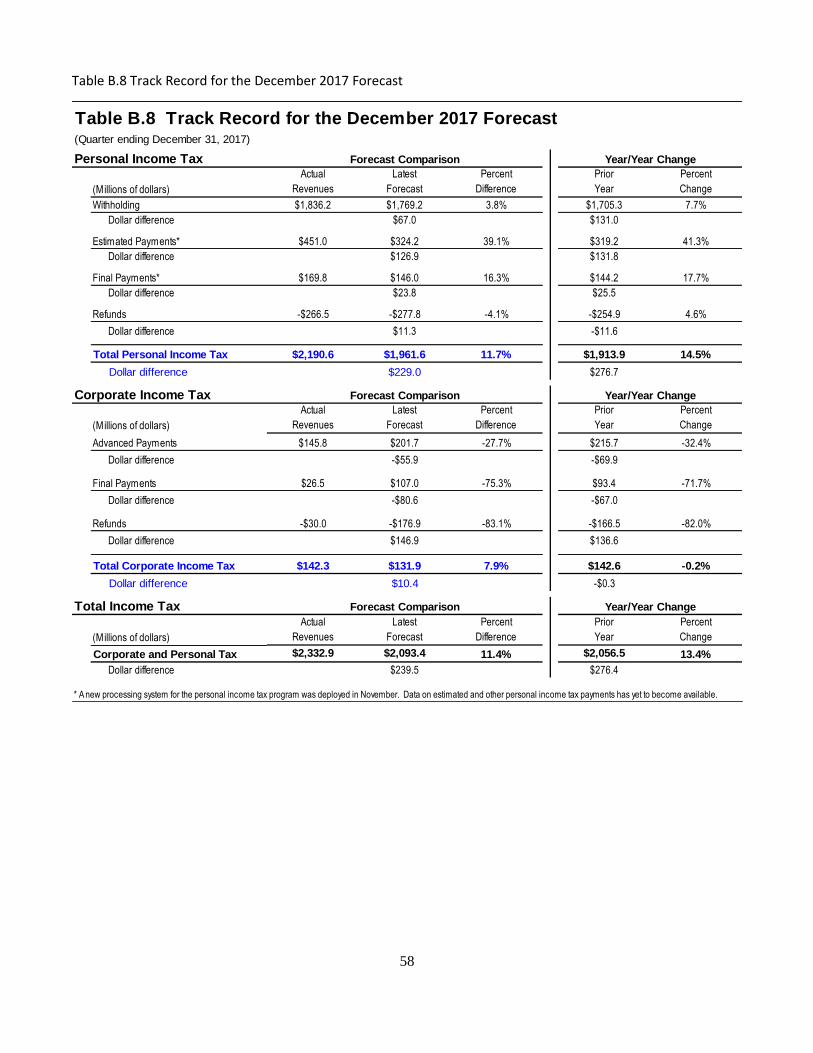
58
Table B.8 Track Record for the December 2017 Forecast
(Millions of dollars)
Actual
Revenues
Latest
Forecast
Percent
Difference
Prior
Year
Percent
Change
Withholding $1,836.2 $1,769.2 3.8% $1,705.3 7.7%
Dollar difference $67.0 $131.0
Estimated Payments* $451.0 $324.2 39.1% $319.2 41.3%
Dollar difference $126.9 $131.8
Final Payments* $169.8 $146.0 16.3% $144.2 17.7%
Dollar difference $23.8 $25.5
Refunds -$266.5 -$277.8 -4.1% -$254.9 4.6%
Dollar difference $11.3 -$11.6
Total Personal Income Tax $2,190.6 $1,961.6 11.7% $1,913.9 14.5%
Dollar difference $229.0 $276.7
(Millions of dollars)
Actual
Revenues
Latest
Forecast
Percent
Difference
Prior
Year
Percent
Change
Advanced Payments $145.8 $201.7 -27.7% $215.7 -32.4%
Dollar difference -$55.9 -$69.9
Final Payments $26.5 $107.0 -75.3% $93.4 -71.7%
Dollar difference -$80.6 -$67.0
Refunds -$30.0 -$176.9 -83.1% -$166.5 -82.0%
Dollar difference $146.9 $136.6
Total Corporate Income Tax $142.3 $131.9 7.9% $142.6 -0.2%
Dollar difference $10.4 -$0.3
(Millions of dollars)
Actual
Revenues
Latest
Forecast
Percent
Difference
Prior
Year
Percent
Change
Corporate and Personal Tax $2,332.9 $2,093.4 11.4% $2,056.5 13.4%
Dollar difference $239.5 $276.4
* A new processing system for the personal income tax program was deployed in November. Data on estimated and other personal income tax payments has yet to become available.
Corporate Income Tax Forecast Comparison
Table B.8 Track Record for the December 2017 Forecast(Quarter ending December 31, 2017)
Total Income Tax Forecast Comparison Year/Year Change
Forecast Comparison Year/Year Change
Year/Year Change
Personal Income Tax
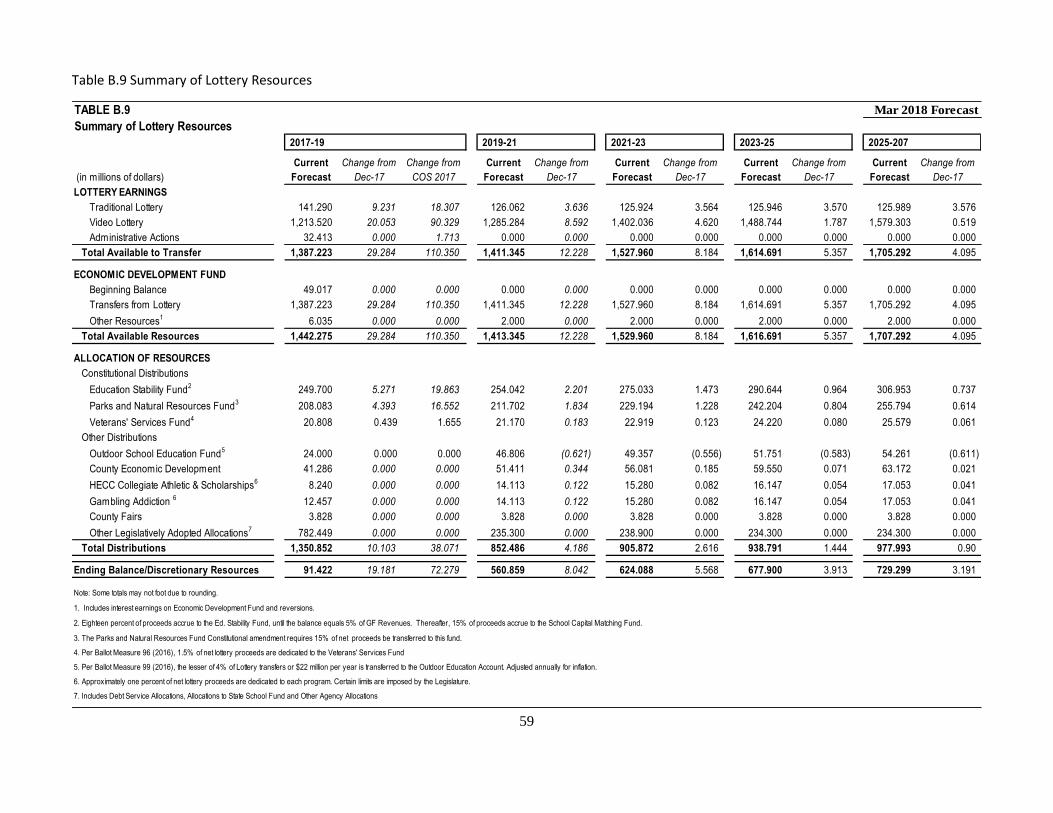
59
Table B.9 Summary of Lottery Resources
TABLE B.9 Mar 2018 Forecast
Summary of Lottery Resources
2017-19 2019-21 2021-23 2023-25 2025-207
(in millions of dollars)
Current
Forecast
Change from
Dec-17
Change from
COS 2017
Current
Forecast
Change from
Dec-17
Current
Forecast
Change from
Dec-17
Current
Forecast
Change from
Dec-17
Current
Forecast
Change from
Dec-17
LOTTERY EARNINGS
Traditional Lottery 141.290 9.231 18.307 126.062 3.636 125.924 3.564 125.946 3.570 125.989 3.576
Video Lottery 1,213.520 20.053 90.329 1,285.284 8.592 1,402.036 4.620 1,488.744 1.787 1,579.303 0.519
Administrative Actions 32.413 0.000 1.713 0.000 0.000 0.000 0.000 0.000 0.000 0.000 0.000
Total Available to Transfer 1,387.223 29.284 110.350 1,411.345 12.228 1,527.960 8.184 1,614.691 5.357 1,705.292 4.095
ECONOMIC DEVELOPMENT FUND
Beginning Balance 49.017 0.000 0.000 0.000 0.000 0.000 0.000 0.000 0.000 0.000 0.000
Transfers from Lottery 1,387.223 29.284 110.350 1,411.345 12.228 1,527.960 8.184 1,614.691 5.357 1,705.292 4.095
Other Resources1
6.035 0.000 0.000 2.000 0.000 2.000 0.000 2.000 0.000 2.000 0.000
Total Available Resources 1,442.275 29.284 110.350 1,413.345 12.228 1,529.960 8.184 1,616.691 5.357 1,707.292 4.095
ALLOCATION OF RESOURCES
Constitutional Distributions
Education Stability Fund2
249.700 5.271 19.863 254.042 2.201 275.033 1.473 290.644 0.964 306.953 0.737
Parks and Natural Resources Fund3
208.083 4.393 16.552 211.702 1.834 229.194 1.228 242.204 0.804 255.794 0.614
Veterans' Services Fund4
20.808 0.439 1.655 21.170 0.183 22.919 0.123 24.220 0.080 25.579 0.061
Other Distributions
Outdoor School Education Fund5
24.000 0.000 0.000 46.806 (0.621) 49.357 (0.556) 51.751 (0.583) 54.261 (0.611)
County Economic Development 41.286 0.000 0.000 51.411 0.344 56.081 0.185 59.550 0.071 63.172 0.021
HECC Collegiate Athletic & Scholarships6
8.240 0.000 0.000 14.113 0.122 15.280 0.082 16.147 0.054 17.053 0.041
Gambling Addiction 6
12.457 0.000 0.000 14.113 0.122 15.280 0.082 16.147 0.054 17.053 0.041
County Fairs 3.828 0.000 0.000 3.828 0.000 3.828 0.000 3.828 0.000 3.828 0.000
Other Legislatively Adopted Allocations7
782.449 0.000 0.000 235.300 0.000 238.900 0.000 234.300 0.000 234.300 0.000
Total Distributions 1,350.852 10.103 38.071 852.486 4.186 905.872 2.616 938.791 1.444 977.993 0.90
Ending Balance/Discretionary Resources 91.422 19.181 72.279 560.859 8.042 624.088 5.568 677.900 3.913 729.299 3.191
Note: Some totals may not foot due to rounding.
1. Includes interest earnings on Economic Development Fund and reversions.
2. Eighteen percent of proceeds accrue to the Ed. Stability Fund, until the balance equals 5% of GF Revenues. Thereafter, 15% of proceeds accrue to the School Capital Matching Fund.
3. The Parks and Natural Resources Fund Constitutional amendment requires 15% of net proceeds be transferred to this fund.
4. Per Ballot Measure 96 (2016), 1.5% of net lottery proceeds are dedicated to the Veterans' Services Fund
5. Per Ballot Measure 99 (2016), the lesser of 4% of Lottery transfers or $22 million per year is transferred to the Outdoor Education Account. Adjusted annually for inflation.
6. Approximately one percent of net lottery proceeds are dedicated to each program. Certain limits are imposed by the Legislature.
7. Includes Debt Service Allocations, Allocations to State School Fund and Other Agency Allocations
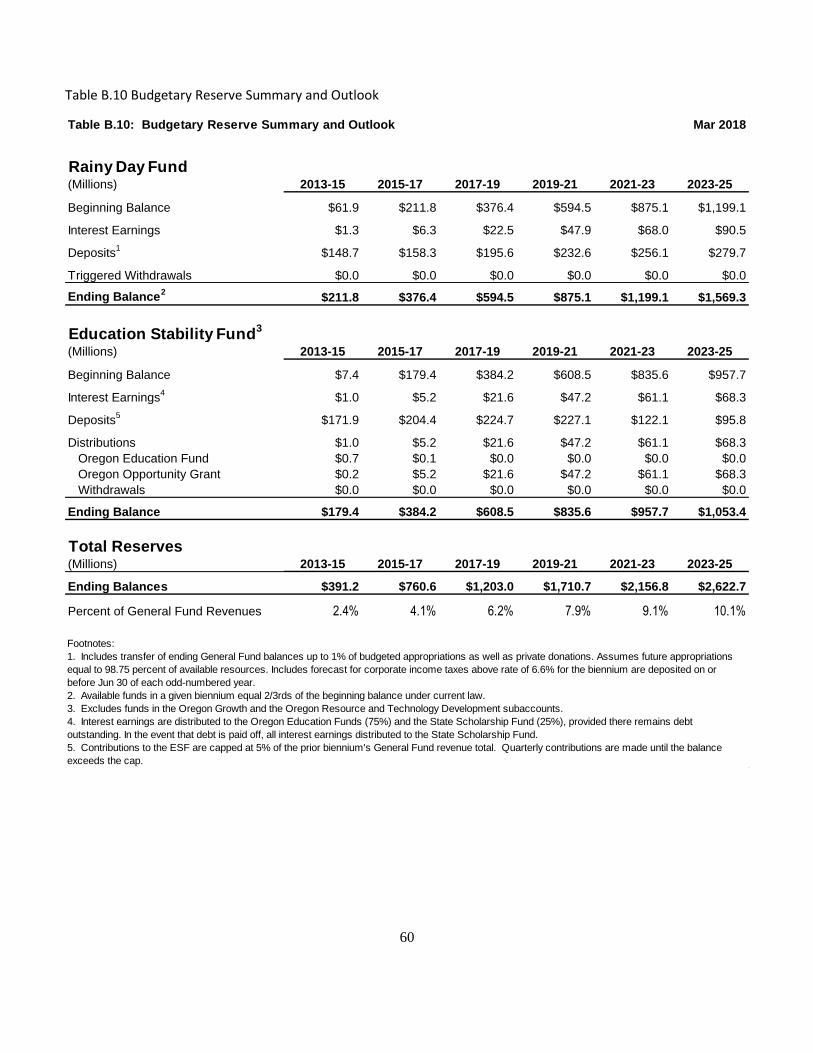
60
Table B.10 Budgetary Reserve Summary and Outlook
Table B.10: Budgetary Reserve Summary and Outlook Mar 2018
Rainy Day Fund(Millions) 2013-15 2015-17 2017-19 2019-21 2021-23 2023-25
Beginning Balance $61.9 $211.8 $376.4 $594.5 $875.1 $1,199.1
Interest Earnings $1.3 $6.3 $22.5 $47.9 $68.0 $90.5
Deposits1
$148.7 $158.3 $195.6 $232.6 $256.1 $279.7
Triggered Withdrawals $0.0 $0.0 $0.0 $0.0 $0.0 $0.0
Ending Balance2
$211.8 $376.4 $594.5 $875.1 $1,199.1 $1,569.3
Education Stability Fund3
(Millions) 2013-15 2015-17 2017-19 2019-21 2021-23 2023-25
Beginning Balance $7.4 $179.4 $384.2 $608.5 $835.6 $957.7
Interest Earnings4
$1.0 $5.2 $21.6 $47.2 $61.1 $68.3
Deposits5
$171.9 $204.4 $224.7 $227.1 $122.1 $95.8
Distributions $1.0 $5.2 $21.6 $47.2 $61.1 $68.3
Oregon Education Fund $0.7 $0.1 $0.0 $0.0 $0.0 $0.0
Oregon Opportunity Grant $0.2 $5.2 $21.6 $47.2 $61.1 $68.3
Withdrawals $0.0 $0.0 $0.0 $0.0 $0.0 $0.0
Ending Balance $179.4 $384.2 $608.5 $835.6 $957.7 $1,053.4
Total Reserves(Millions) 2013-15 2015-17 2017-19 2019-21 2021-23 2023-25
Ending Balances $391.2 $760.6 $1,203.0 $1,710.7 $2,156.8 $2,622.7
Percent of General Fund Revenues 2.4% 4.1% 6.2% 7.9% 9.1% 10.1%
Footnotes:
1. Includes transfer of ending General Fund balances up to 1% of budgeted appropriations as well as private donations. Assumes future appropriations
equal to 98.75 percent of available resources. Includes forecast for corporate income taxes above rate of 6.6% for the biennium are deposited on or
before Jun 30 of each odd-numbered year.
2. Available funds in a given biennium equal 2/3rds of the beginning balance under current law.
3. Excludes funds in the Oregon Growth and the Oregon Resource and Technology Development subaccounts.
4. Interest earnings are distributed to the Oregon Education Funds (75%) and the State Scholarship Fund (25%), provided there remains debt
outstanding. In the event that debt is paid off, all interest earnings distributed to the State Scholarship Fund.
5. Contributions to the ESF are capped at 5% of the prior biennium's General Fund revenue total. Quarterly contributions are made until the balance
exceeds the cap.
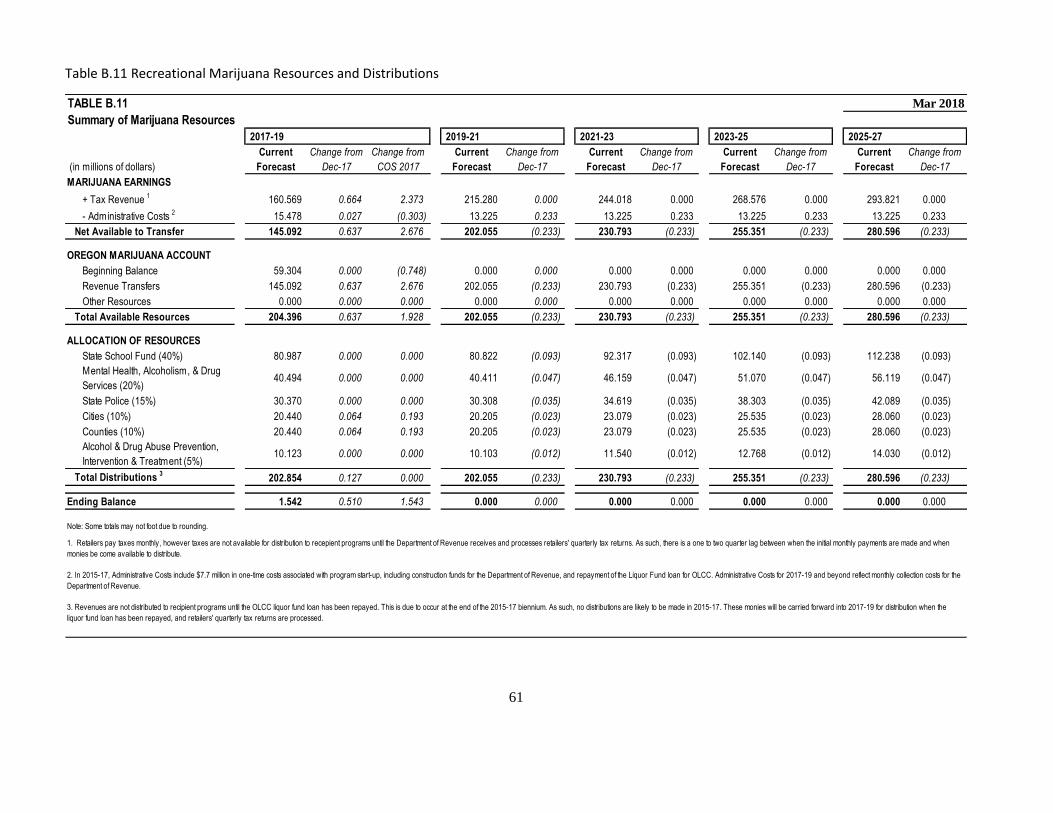
61
Table B.11 Recreational Marijuana Resources and Distributions
TABLE B.11
Summary of Marijuana Resources
2017-19 2019-21 2021-23 2023-25 2025-27
(in millions of dollars)
Current
Forecast
Change from
Dec-17
Change from
COS 2017
Current
Forecast
Change from
Dec-17
Current
Forecast
Change from
Dec-17
Current
Forecast
Change from
Dec-17
Current
Forecast
Change from
Dec-17
MARIJUANA EARNINGS
+ Tax Revenue 1
160.569 0.664 2.373 215.280 0.000 244.018 0.000 268.576 0.000 293.821 0.000
- Administrative Costs 2
15.478 0.027 (0.303) 13.225 0.233 13.225 0.233 13.225 0.233 13.225 0.233
Net Available to Transfer 145.092 0.637 2.676 202.055 (0.233) 230.793 (0.233) 255.351 (0.233) 280.596 (0.233)
OREGON MARIJUANA ACCOUNT
Beginning Balance 59.304 0.000 (0.748) 0.000 0.000 0.000 0.000 0.000 0.000 0.000 0.000
Revenue Transfers 145.092 0.637 2.676 202.055 (0.233) 230.793 (0.233) 255.351 (0.233) 280.596 (0.233)
Other Resources 0.000 0.000 0.000 0.000 0.000 0.000 0.000 0.000 0.000 0.000 0.000
Total Available Resources 204.396 0.637 1.928 202.055 (0.233) 230.793 (0.233) 255.351 (0.233) 280.596 (0.233)
ALLOCATION OF RESOURCES
State School Fund (40%) 80.987 0.000 0.000 80.822 (0.093) 92.317 (0.093) 102.140 (0.093) 112.238 (0.093)
Mental Health, Alcoholism, & Drug
Services (20%)40.494 0.000 0.000 40.411 (0.047) 46.159 (0.047) 51.070 (0.047) 56.119 (0.047)
State Police (15%) 30.370 0.000 0.000 30.308 (0.035) 34.619 (0.035) 38.303 (0.035) 42.089 (0.035)
Cities (10%) 20.440 0.064 0.193 20.205 (0.023) 23.079 (0.023) 25.535 (0.023) 28.060 (0.023)
Counties (10%) 20.440 0.064 0.193 20.205 (0.023) 23.079 (0.023) 25.535 (0.023) 28.060 (0.023)
Alcohol & Drug Abuse Prevention,
Intervention & Treatment (5%)10.123 0.000 0.000 10.103 (0.012) 11.540 (0.012) 12.768 (0.012) 14.030 (0.012)
Total Distributions 3
202.854 0.127 0.000 202.055 (0.233) 230.793 (0.233) 255.351 (0.233) 280.596 (0.233)
Ending Balance 1.542 0.510 1.543 0.000 0.000 0.000 0.000 0.000 0.000 0.000 0.000
Note: Some totals may not foot due to rounding.
Mar 2018
1. Retailers pay taxes monthly, however taxes are not available for distribution to recepient programs until the Department of Revenue receives and processes retailers' quarterly tax returns. As such, there is a one to two quarter lag between when the initial monthly payments are made and when
monies be come available to distribute.
2. In 2015-17, Administrative Costs include $7.7 million in one-time costs associated with program start-up, including construction funds for the Department of Revenue, and repayment of the Liquor Fund loan for OLCC. Administrative Costs for 2017-19 and beyond reflect monthly collection costs for the
Department of Revenue.
3. Revenues are not distributed to recipient programs until the OLCC liquor fund loan has been repayed. This is due to occur at the end of the 2015-17 biennium. As such, no distributions are likely to be made in 2015-17. These monies will be carried forward into 2017-19 for distribution when the
liquor fund loan has been repayed, and retailers' quarterly tax returns are processed.
62
APPENDIX C: POPULATION FORECASTS BY AGE AND SEX
Table C.1 Population Forecasts: Component of Change 1990-2026 ………………………….………………... 63
Table C.2 Population Forecasts by Age and Sex: 2000-2026 ………………………………………………..……….. 64
Table C.3 Population of Oregon: 1980-2026 …………………………………………………………………………………. 65
Table C.4 Children: Ages 0-4 ……………………………………………………………………………………………………..…. 65
Table C.5 School Age Population: Ages 5-17 ……………………………………………………………………………..…. 65
Table C.6 Young Adult Population: Ages 18-24 ……………………………………………………….……………….….. 65
Table C.7 Criminally At Risk Population: Males Ages 15-39 …………………………………………….……………. 66
Table C.8 Prime Wage Earners: Ages 25-44 ………………………………………………………………………………….. 66
Table C.9 Older Wage Earners: Ages 45-64 ………………………………………………………………………………….. 66
Table C.10 Elderly Population by Age Group ………………………………………………………………………………… 66
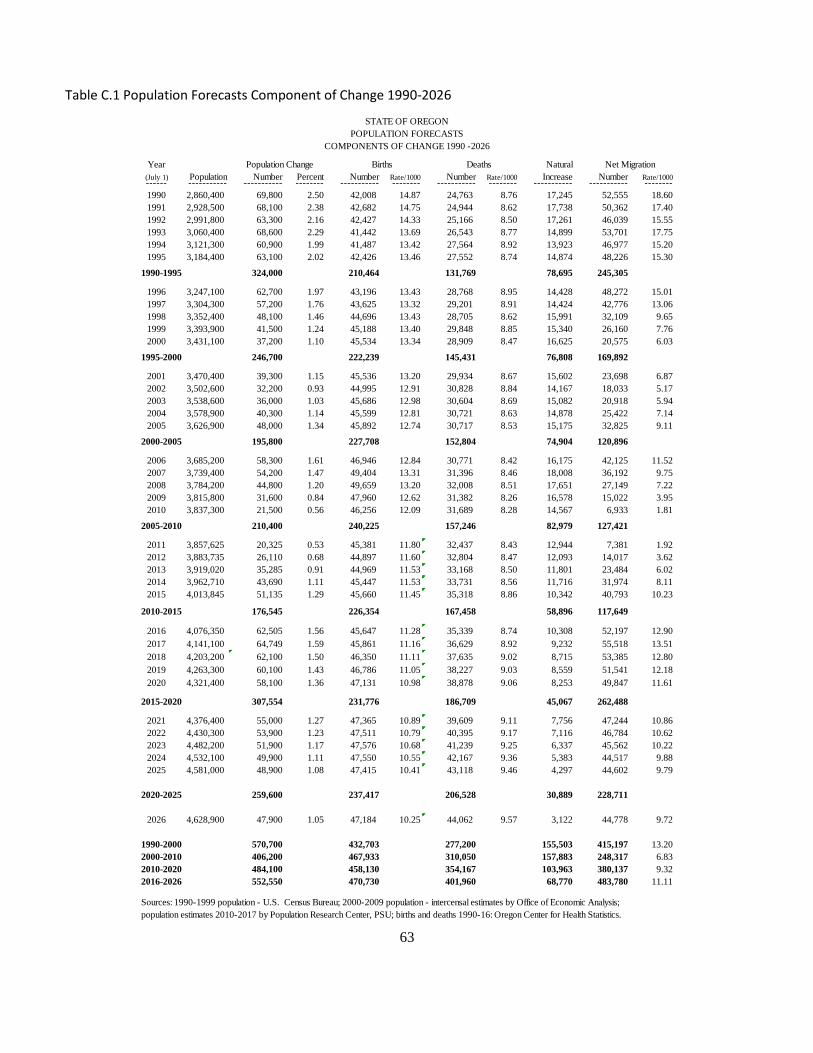
63
Table C.1 Population Forecasts Component of Change 1990-2026
STATE OF OREGON
POPULATION FORECASTS
COMPONENTS OF CHANGE 1990 -2026
Year Population Change Births Deaths Natural Net Migration
(July 1) Population Number Percent Number Rate/1000 Number Rate/1000 Increase Number Rate/1000------ ----------- ----------- -------- ----------- -------- ----------- -------- ----------- ----------- --------
1990 2,860,400 69,800 2.50 42,008 14.87 24,763 8.76 17,245 52,555 18.60
1991 2,928,500 68,100 2.38 42,682 14.75 24,944 8.62 17,738 50,362 17.40
1992 2,991,800 63,300 2.16 42,427 14.33 25,166 8.50 17,261 46,039 15.55
1993 3,060,400 68,600 2.29 41,442 13.69 26,543 8.77 14,899 53,701 17.75
1994 3,121,300 60,900 1.99 41,487 13.42 27,564 8.92 13,923 46,977 15.20
1995 3,184,400 63,100 2.02 42,426 13.46 27,552 8.74 14,874 48,226 15.30
1990-1995 324,000 210,464 131,769 78,695 245,305
1996 3,247,100 62,700 1.97 43,196 13.43 28,768 8.95 14,428 48,272 15.01
1997 3,304,300 57,200 1.76 43,625 13.32 29,201 8.91 14,424 42,776 13.06
1998 3,352,400 48,100 1.46 44,696 13.43 28,705 8.62 15,991 32,109 9.65
1999 3,393,900 41,500 1.24 45,188 13.40 29,848 8.85 15,340 26,160 7.76
2000 3,431,100 37,200 1.10 45,534 13.34 28,909 8.47 16,625 20,575 6.03
1995-2000 246,700 222,239 145,431 76,808 169,892
2001 3,470,400 39,300 1.15 45,536 13.20 29,934 8.67 15,602 23,698 6.87
2002 3,502,600 32,200 0.93 44,995 12.91 30,828 8.84 14,167 18,033 5.17
2003 3,538,600 36,000 1.03 45,686 12.98 30,604 8.69 15,082 20,918 5.94
2004 3,578,900 40,300 1.14 45,599 12.81 30,721 8.63 14,878 25,422 7.14
2005 3,626,900 48,000 1.34 45,892 12.74 30,717 8.53 15,175 32,825 9.11
2000-2005 195,800 227,708 152,804 74,904 120,896
2006 3,685,200 58,300 1.61 46,946 12.84 30,771 8.42 16,175 42,125 11.52
2007 3,739,400 54,200 1.47 49,404 13.31 31,396 8.46 18,008 36,192 9.75
2008 3,784,200 44,800 1.20 49,659 13.20 32,008 8.51 17,651 27,149 7.22
2009 3,815,800 31,600 0.84 47,960 12.62 31,382 8.26 16,578 15,022 3.95
2010 3,837,300 21,500 0.56 46,256 12.09 31,689 8.28 14,567 6,933 1.81
2005-2010 210,400 240,225 157,246 82,979 127,421
2011 3,857,625 20,325 0.53 45,381 11.80 32,437 8.43 12,944 7,381 1.92
2012 3,883,735 26,110 0.68 44,897 11.60 32,804 8.47 12,093 14,017 3.62
2013 3,919,020 35,285 0.91 44,969 11.53 33,168 8.50 11,801 23,484 6.02
2014 3,962,710 43,690 1.11 45,447 11.53 33,731 8.56 11,716 31,974 8.11
2015 4,013,845 51,135 1.29 45,660 11.45 35,318 8.86 10,342 40,793 10.23
2010-2015 176,545 226,354 167,458 58,896 117,649
2016 4,076,350 62,505 1.56 45,647 11.28 35,339 8.74 10,308 52,197 12.90
2017 4,141,100 64,749 1.59 45,861 11.16 36,629 8.92 9,232 55,518 13.51
2018 4,203,200 62,100 1.50 46,350 11.11 37,635 9.02 8,715 53,385 12.80
2019 4,263,300 60,100 1.43 46,786 11.05 38,227 9.03 8,559 51,541 12.18
2020 4,321,400 58,100 1.36 47,131 10.98 38,878 9.06 8,253 49,847 11.61
2015-2020 307,554 231,776 186,709 45,067 262,488
2021 4,376,400 55,000 1.27 47,365 10.89 39,609 9.11 7,756 47,244 10.86
2022 4,430,300 53,900 1.23 47,511 10.79 40,395 9.17 7,116 46,784 10.62
2023 4,482,200 51,900 1.17 47,576 10.68 41,239 9.25 6,337 45,562 10.22
2024 4,532,100 49,900 1.11 47,550 10.55 42,167 9.36 5,383 44,517 9.88
2025 4,581,000 48,900 1.08 47,415 10.41 43,118 9.46 4,297 44,602 9.79
2020-2025 259,600 237,417 206,528 30,889 228,711
2026 4,628,900 47,900 1.05 47,184 10.25 44,062 9.57 3,122 44,778 9.72
1990-2000 570,700 432,703 277,200 155,503 415,197 13.20
2000-2010 406,200 467,933 310,050 157,883 248,317 6.83
2010-2020 484,100 458,130 354,167 103,963 380,137 9.32
2016-2026 552,550 470,730 401,960 68,770 483,780 11.11
Sources: 1990-1999 population - U.S. Census Bureau; 2000-2009 population - intercensal estimates by Office of Economic Analysis;
population estimates 2010-2017 by Population Research Center, PSU; births and deaths 1990-16: Oregon Center for Health Statistics.
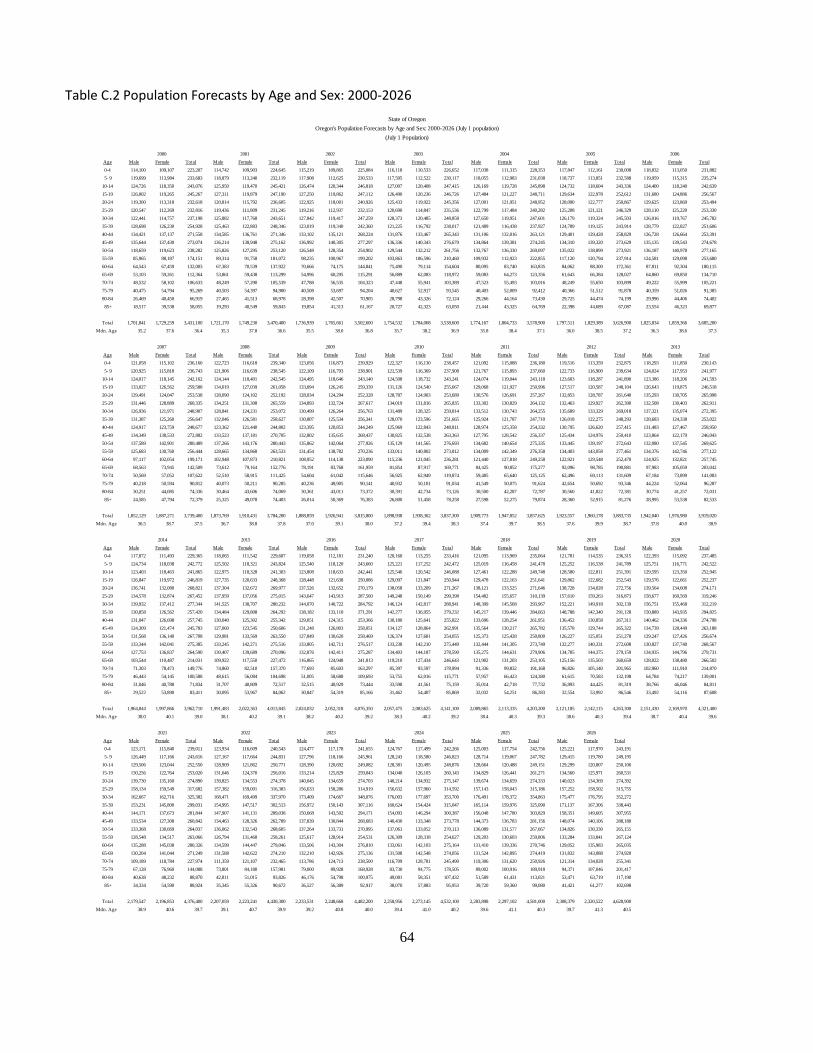
64
Table C.2 Population Forecasts by Age and Sex: 2000-2026
2000 2001 2002 2003 2004 2005 2006
Age Male Female Total Male Female Total Male Female Total Male Female Total Male Female Total Male Female Total Male Female Total
0-4 114,100 109,107 223,207 114,742 109,903 224,645 115,219 109,865 225,084 116,118 110,533 226,652 117,038 111,315 228,353 117,847 112,161 230,008 118,832 113,050 231,882
5- 9 119,699 113,984 233,683 118,879 113,240 232,119 117,908 112,625 230,533 117,595 112,522 230,117 118,055 112,983 231,038 118,737 113,851 232,588 119,959 115,315 235,274
10-14 124,726 118,350 243,076 125,950 119,470 245,421 126,474 120,344 246,818 127,007 120,408 247,415 126,169 119,728 245,898 124,732 118,604 243,336 124,400 118,240 242,639
15-19 126,002 119,265 245,267 127,311 119,879 247,190 127,250 119,862 247,112 126,490 120,236 246,726 127,484 121,227 248,711 129,634 122,978 252,612 131,680 124,886 256,567
20-24 119,300 113,318 232,618 120,814 115,792 236,605 122,925 118,001 240,926 125,433 119,922 245,356 127,001 121,951 248,952 128,090 122,777 250,867 129,625 123,869 253,494
25-29 120,547 112,269 232,816 119,436 111,809 231,245 119,216 112,937 232,153 120,690 114,847 235,536 122,799 117,484 240,282 125,208 121,121 246,329 128,110 125,220 253,330
30-34 122,441 114,757 237,198 125,882 117,768 243,651 127,842 119,417 247,259 128,373 120,485 248,858 127,650 119,951 247,601 126,179 119,324 245,503 126,016 119,767 245,782
35-39 128,698 126,230 254,928 125,463 122,883 248,346 123,019 119,340 242,360 121,225 116,792 238,017 121,489 116,438 237,927 124,789 119,125 243,914 128,779 122,827 251,606
40-44 134,421 137,137 271,558 134,585 136,761 271,346 133,102 135,121 268,224 131,876 133,467 265,343 131,106 132,016 263,121 129,401 129,428 258,829 126,728 126,664 253,391
45-49 135,644 137,430 273,074 136,214 138,948 275,162 136,992 140,305 277,297 136,336 140,343 276,679 134,864 139,381 274,245 134,310 139,320 273,629 135,135 139,543 274,678
50-54 118,659 119,623 238,282 125,826 127,295 253,120 126,548 128,354 254,902 129,544 132,212 261,756 132,767 136,330 269,097 135,022 138,899 273,921 136,187 140,978 277,165
55-59 85,965 88,187 174,151 89,314 91,758 181,072 98,235 100,967 199,202 103,863 106,596 210,460 109,932 112,923 222,855 117,120 120,794 237,914 124,581 129,098 253,680
60-64 64,543 67,459 132,003 67,383 70,539 137,922 70,666 74,175 144,841 75,490 79,114 154,604 80,095 83,740 163,835 84,062 88,300 172,361 87,811 92,304 180,115
65-69 53,103 59,261 112,364 53,861 59,438 113,299 54,996 60,295 115,291 56,889 62,083 118,972 59,083 64,273 123,356 61,643 66,384 128,027 64,860 69,850 134,710
70-74 48,532 58,102 106,633 48,249 57,290 105,539 47,788 56,535 104,323 47,448 55,941 103,389 47,523 55,493 103,016 48,249 55,650 103,899 49,222 55,999 105,221
75-79 40,475 54,794 95,269 40,503 54,397 94,900 40,508 53,697 94,204 40,627 52,917 93,545 40,403 52,009 92,412 40,366 51,512 91,878 40,359 51,026 91,385
80-84 26,469 40,450 66,919 27,465 41,513 68,978 28,398 42,507 70,905 28,798 43,326 72,124 29,266 44,164 73,430 29,725 44,474 74,199 29,996 44,406 74,402
85+ 18,517 39,538 58,055 19,293 40,549 59,843 19,854 41,313 61,167 20,727 42,323 63,050 21,444 43,325 64,769 22,398 44,689 67,087 23,554 46,323 69,877
Total 1,701,841 1,729,259 3,431,100 1,721,170 1,749,230 3,470,400 1,736,939 1,765,661 3,502,600 1,754,532 1,784,068 3,538,600 1,774,167 1,804,733 3,578,900 1,797,511 1,829,389 3,626,900 1,825,834 1,859,366 3,685,200
Mdn. Age 35.2 37.6 36.4 35.3 37.8 36.6 35.5 38.0 36.8 35.7 38.2 36.9 35.8 38.4 37.1 36.0 38.5 37.2 36.3 38.6 37.3
2007 2008 2009 2010 2011 2012 2013
Age Male Female Total Male Female Total Male Female Total Male Female Total Male Female Total Male Female Total Male Female Total
0-4 121,058 115,102 236,160 122,723 116,618 239,340 123,056 116,873 239,929 122,327 116,130 238,457 121,092 115,088 236,180 119,516 113,359 232,875 118,293 111,850 230,143
5- 9 120,925 115,818 236,743 121,906 116,639 238,545 122,109 116,793 238,901 121,539 116,369 237,908 121,767 115,893 237,660 122,733 116,900 239,634 124,024 117,953 241,977
10-14 124,017 118,145 242,162 124,144 118,401 242,545 124,495 118,646 243,140 124,508 118,732 243,241 124,074 119,044 243,118 123,603 118,287 241,890 123,386 118,206 241,593
15-19 133,027 126,562 259,588 134,019 127,039 261,058 133,094 126,245 259,339 131,126 124,540 255,667 129,068 121,927 250,996 127,517 120,587 248,104 126,643 119,875 246,518
20-24 129,491 124,047 253,538 128,090 124,102 252,192 128,034 124,294 252,328 128,787 124,903 253,689 130,576 126,691 257,267 132,853 128,787 261,640 135,293 130,705 265,998
25-29 131,446 128,889 260,335 134,251 131,308 265,559 134,893 132,724 267,617 134,019 131,816 265,835 133,302 130,829 264,132 132,463 129,927 262,390 132,508 130,403 262,911
30-34 126,936 121,971 248,907 128,841 124,231 253,072 130,499 126,264 256,763 131,489 128,325 259,814 133,512 130,743 264,255 135,689 133,329 269,018 137,321 135,074 272,395
35-39 131,387 125,260 256,647 132,046 126,581 258,627 130,807 125,534 256,341 128,070 123,596 251,665 125,924 121,787 247,710 126,018 122,275 248,293 128,683 124,338 253,022
40-44 124,917 123,759 248,677 123,362 121,440 244,802 123,395 120,853 244,249 125,969 122,843 248,811 128,974 125,358 254,332 130,795 126,620 257,415 131,483 127,467 258,950
45-49 134,349 138,533 272,882 133,523 137,181 270,705 132,802 135,635 268,437 130,825 132,538 263,363 127,795 128,542 256,337 125,434 124,976 250,410 123,864 122,179 246,043
50-54 137,589 142,901 280,489 137,266 143,176 280,443 135,862 142,064 277,926 135,129 141,565 276,693 134,682 140,654 275,335 133,445 139,197 272,643 132,080 137,545 269,625
55-59 125,683 130,760 256,444 128,665 134,868 263,533 131,454 138,782 270,236 133,011 140,802 273,812 134,009 142,349 276,358 134,403 143,058 277,461 134,376 142,746 277,122
60-64 97,117 102,054 199,171 102,948 107,873 210,821 108,952 114,138 223,090 115,236 121,045 236,281 121,440 127,818 249,258 122,921 129,548 252,470 124,925 132,821 257,745
65-69 68,563 73,945 142,509 73,612 79,164 152,776 78,191 83,768 161,959 81,854 87,917 169,771 84,425 90,852 175,277 92,096 98,785 190,881 97,983 105,059 203,042
70-74 50,569 57,052 107,622 52,510 58,915 111,425 54,604 61,042 115,646 56,925 62,949 119,874 59,485 65,640 125,125 62,496 69,113 131,609 67,184 73,899 141,083
75-79 40,218 50,594 90,812 40,073 50,211 90,285 40,236 49,905 90,141 40,932 50,101 91,034 41,549 50,075 91,624 42,654 50,692 93,346 44,224 52,064 96,287
80-84 30,251 44,085 74,336 30,464 43,606 74,069 30,361 43,011 73,372 30,391 42,734 73,126 30,500 42,287 72,787 30,560 41,822 72,381 30,774 41,257 72,031
85+ 24,585 47,794 72,379 25,325 49,078 74,403 26,014 50,369 76,383 26,800 51,458 78,258 27,598 52,275 79,874 28,360 52,915 81,276 28,995 53,538 82,533
Total 1,852,129 1,887,271 3,739,400 1,873,769 1,910,431 3,784,200 1,888,859 1,926,941 3,815,800 1,898,938 1,938,362 3,837,300 1,909,773 1,947,852 3,857,625 1,923,557 1,960,178 3,883,735 1,942,040 1,976,980 3,919,020
Mdn. Age 36.5 38.7 37.5 36.7 38.8 37.8 37.0 39.1 38.0 37.2 39.4 38.3 37.4 39.7 38.5 37.6 39.9 38.7 37.8 40.0 38.9
2014 2015 2016 2017 2018 2019 2020
Age Male Female Total Male Female Total Male Female Total Male Female Total Male Female Total Male Female Total Male Female Total
0-4 117,872 111,493 229,365 118,065 111,542 229,607 119,058 112,181 231,240 120,160 113,255 233,416 121,095 113,969 235,064 121,781 114,535 236,315 122,393 115,092 237,485
5- 9 124,734 118,038 242,772 125,502 118,321 243,824 125,540 118,120 243,660 125,221 117,252 242,472 125,019 116,458 241,478 125,252 116,538 241,789 125,751 116,771 242,522
10-14 123,403 118,463 241,865 122,975 118,328 241,303 123,808 118,633 242,441 125,546 120,542 246,088 127,461 122,288 249,748 128,580 122,811 251,391 129,595 123,350 252,945
15-19 126,847 119,972 246,819 127,735 120,633 248,368 128,448 121,638 250,086 129,097 121,847 250,944 129,478 122,163 251,641 129,862 122,682 252,543 129,576 122,661 252,237
20-24 136,741 132,080 268,821 137,304 132,672 269,977 137,526 132,652 270,179 138,058 133,209 271,267 138,121 133,525 271,646 138,728 134,028 272,756 139,564 134,608 274,171
25-29 134,578 132,874 267,452 137,959 137,056 275,015 143,647 143,913 287,560 149,248 150,149 299,398 154,482 155,657 310,139 157,610 159,263 316,873 158,677 160,569 319,246
30-34 139,932 137,412 277,344 141,525 138,707 280,232 144,070 140,722 284,792 146,124 142,817 288,941 148,399 145,568 293,967 152,221 149,918 302,139 156,751 155,468 312,219
35-39 130,858 126,562 257,420 134,484 129,808 264,292 138,182 133,110 271,291 142,277 136,955 279,232 145,217 139,446 284,663 148,788 142,340 291,128 150,889 143,935 294,825
40-44 131,047 126,698 257,745 130,040 125,302 255,342 129,051 124,315 253,366 130,180 125,641 255,822 133,696 128,254 261,951 136,452 130,858 267,311 140,462 134,336 274,798
45-49 124,309 121,474 245,783 127,060 123,545 250,606 131,248 126,803 258,051 134,127 128,864 262,991 135,564 130,217 265,782 135,578 129,744 265,322 134,739 128,449 263,188
50-54 131,568 136,140 267,708 129,981 133,569 263,550 127,849 130,620 258,469 126,374 127,681 254,055 125,373 125,428 250,800 126,227 125,051 251,278 129,247 127,426 256,674
55-59 133,344 142,041 275,385 133,245 142,271 275,516 133,805 142,711 276,517 133,238 142,210 275,449 132,444 141,305 273,749 132,277 140,331 272,608 130,827 137,740 268,567
60-64 127,753 136,837 264,590 130,407 139,689 270,096 132,876 142,411 275,287 134,403 144,187 278,590 135,275 144,631 279,906 134,785 144,375 279,159 134,935 144,796 279,731
65-69 103,544 110,487 214,031 109,922 117,550 227,472 116,865 124,948 241,813 119,210 127,434 246,643 121,902 131,203 253,105 125,156 135,503 260,659 128,022 138,480 266,502
70-74 71,303 78,473 149,776 74,860 82,510 157,370 77,693 85,603 163,297 85,397 93,597 178,994 91,336 99,832 191,168 96,826 105,140 201,965 102,960 111,910 214,870
75-79 46,443 54,145 100,588 48,615 56,084 104,698 51,005 58,688 109,693 53,755 62,016 115,771 57,957 66,423 124,380 61,615 70,583 132,198 64,784 74,217 139,001
80-84 31,046 40,788 71,834 31,707 40,809 72,517 32,515 40,929 73,444 33,598 41,561 75,159 35,014 42,718 77,732 36,893 44,425 81,319 38,766 46,046 84,811
85+ 29,522 53,890 83,411 30,095 53,967 84,062 30,847 54,319 85,166 31,462 54,407 85,869 32,032 54,251 86,283 32,554 53,992 86,546 33,492 54,116 87,608
Total 1,964,844 1,997,866 3,962,710 1,991,483 2,022,363 4,013,845 2,024,032 2,052,318 4,076,350 2,057,475 2,083,625 4,141,100 2,089,865 2,113,335 4,203,200 2,121,185 2,142,115 4,263,300 2,151,430 2,169,970 4,321,400
Mdn. Age 38.0 40.1 39.0 38.1 40.2 39.1 38.2 40.2 39.2 38.3 40.2 39.2 38.4 40.3 39.3 38.6 40.3 39.4 38.7 40.4 39.6
2021 2022 2023 2024 2025 2026
Age Male Female Total Male Female Total Male Female Total Male Female Total Male Female Total Male Female Total
0-4 123,171 115,840 239,011 123,934 116,609 240,543 124,477 117,178 241,655 124,767 117,499 242,266 125,003 117,754 242,756 125,221 117,970 243,191
5- 9 126,449 117,166 243,616 127,167 117,664 244,831 127,796 118,166 245,961 128,243 118,580 246,823 128,714 119,067 247,782 129,415 119,780 249,195
10-14 129,506 123,044 252,550 128,909 121,862 250,771 128,390 120,692 249,082 128,381 120,495 248,876 128,664 120,488 249,151 129,299 120,807 250,106
15-19 130,256 122,764 253,020 131,646 124,370 256,016 133,214 125,829 259,043 134,040 126,103 260,143 134,829 126,441 261,271 134,560 125,971 260,531
20-24 139,730 135,160 274,890 139,825 134,553 274,378 140,045 134,659 274,703 140,214 134,932 275,147 139,674 134,659 274,333 140,023 134,369 274,392
25-29 158,134 159,549 317,682 157,382 159,001 316,383 156,633 158,286 314,919 156,632 157,960 314,592 157,143 158,043 315,186 157,252 158,502 315,755
30-34 162,667 162,716 325,382 168,471 169,499 337,970 173,409 174,667 348,076 176,003 177,697 353,700 176,491 178,372 354,863 175,477 176,795 352,272
35-39 153,231 145,800 299,031 154,995 147,517 302,513 156,972 150,143 307,116 160,624 154,424 315,047 165,114 159,976 325,090 171,137 167,306 338,443
40-44 144,171 137,673 281,844 147,907 141,131 289,038 150,668 143,502 294,171 154,093 146,294 300,387 156,048 147,780 303,829 158,351 149,605 307,955
45-49 133,534 127,308 260,842 134,463 128,326 262,789 137,839 130,844 268,683 140,430 133,348 273,778 144,373 136,783 281,156 148,074 140,106 288,180
50-54 133,368 130,669 264,037 136,062 132,543 268,605 137,264 133,731 270,995 137,061 133,052 270,113 136,089 131,577 267,667 134,826 130,330 265,155
55-59 128,548 134,517 263,066 126,794 131,468 258,261 125,617 128,914 254,531 126,309 128,318 254,627 129,203 130,603 259,806 133,284 133,841 267,124
60-64 135,288 145,038 280,326 134,599 144,447 279,046 133,506 143,304 276,810 133,061 142,103 275,164 131,410 139,336 270,746 129,052 135,983 265,035
65-69 130,204 141,044 271,249 131,588 142,622 274,210 132,210 142,926 275,136 131,508 142,548 274,056 131,524 142,895 274,419 131,832 143,088 274,920
70-74 109,189 118,784 227,974 111,359 121,107 232,465 113,786 124,713 238,500 116,709 128,781 245,490 119,306 131,620 250,926 121,314 134,028 255,341
75-79 67,128 76,960 144,088 73,801 84,180 157,981 79,000 89,928 168,928 83,730 94,775 178,505 89,002 100,916 189,918 94,371 107,046 201,417
80-84 40,638 48,232 88,870 42,811 51,015 93,826 46,176 54,798 100,975 49,081 58,351 107,432 51,589 61,431 113,021 53,471 63,719 117,190
85+ 34,334 54,590 88,924 35,345 55,326 90,672 36,527 56,389 92,917 38,070 57,883 95,953 39,720 59,360 99,080 41,421 61,277 102,698
Total 2,179,547 2,196,853 4,376,400 2,207,059 2,223,241 4,430,300 2,233,531 2,248,668 4,482,200 2,258,956 2,273,145 4,532,100 2,283,898 2,297,102 4,581,000 2,308,379 2,320,522 4,628,900
Mdn. Age 38.9 40.6 39.7 39.1 40.7 39.9 39.2 40.8 40.0 39.4 41.0 40.2 39.6 41.1 40.3 39.7 41.3 40.5
State of Oregon
Oregon's Population Forecasts by Age and Sex: 2000-2026 (July 1 population)
(July 1 Population)
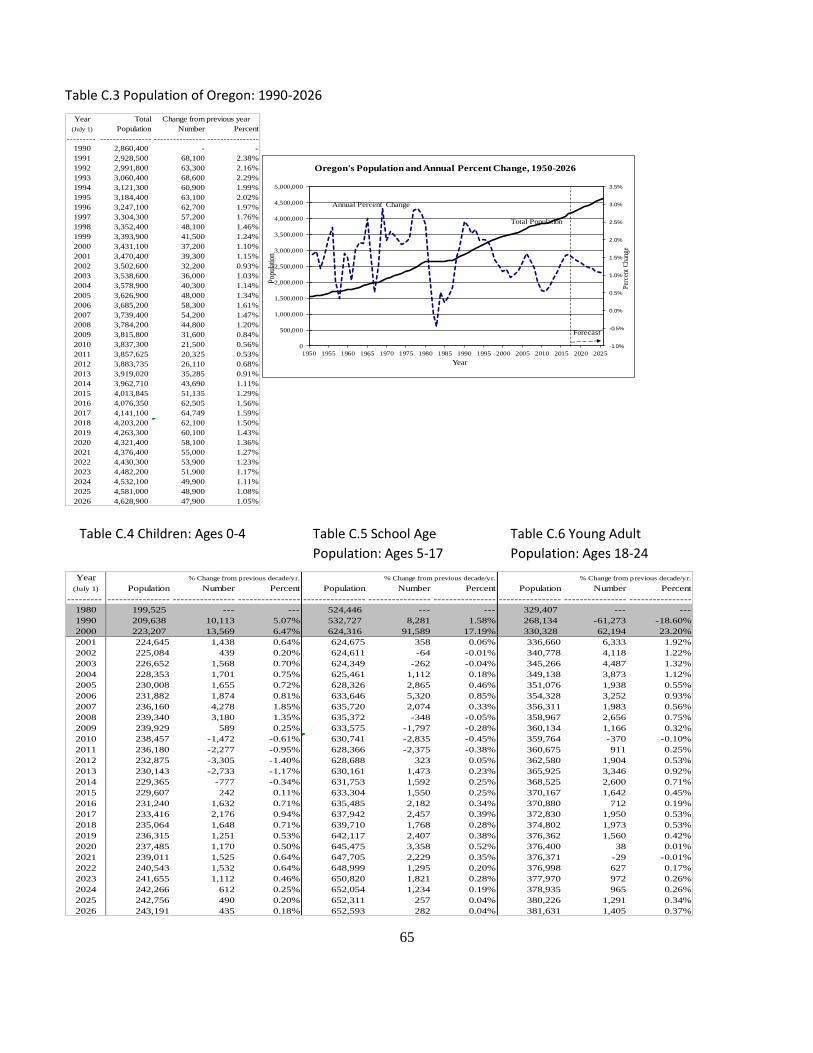
65
Table C.3 Population of Oregon: 1990-2026
Table C.4 Children: Ages 0-4 Table C.5 School Age
Population: Ages 5-17
Table C.6 Young Adult
Population: Ages 18-24
Year Total
(July 1) Population Number Percent
--------- ---------------- ---------------- ----------------
1990 2,860,400 - -
1991 2,928,500 68,100 2.38%
1992 2,991,800 63,300 2.16%
1993 3,060,400 68,600 2.29%
1994 3,121,300 60,900 1.99%
1995 3,184,400 63,100 2.02%
1996 3,247,100 62,700 1.97%
1997 3,304,300 57,200 1.76%
1998 3,352,400 48,100 1.46%
1999 3,393,900 41,500 1.24%
2000 3,431,100 37,200 1.10%
2001 3,470,400 39,300 1.15%
2002 3,502,600 32,200 0.93%
2003 3,538,600 36,000 1.03%
2004 3,578,900 40,300 1.14%
2005 3,626,900 48,000 1.34%
2006 3,685,200 58,300 1.61%
2007 3,739,400 54,200 1.47%
2008 3,784,200 44,800 1.20%
2009 3,815,800 31,600 0.84%
2010 3,837,300 21,500 0.56%
2011 3,857,625 20,325 0.53%
2012 3,883,735 26,110 0.68%
2013 3,919,020 35,285 0.91%
2014 3,962,710 43,690 1.11%
2015 4,013,845 51,135 1.29%
2016 4,076,350 62,505 1.56%
2017 4,141,100 64,749 1.59%
2018 4,203,200 62,100 1.50%
2019 4,263,300 60,100 1.43%
2020 4,321,400 58,100 1.36%
2021 4,376,400 55,000 1.27%
2022 4,430,300 53,900 1.23%
2023 4,482,200 51,900 1.17%
2024 4,532,100 49,900 1.11%
2025 4,581,000 48,900 1.08%
2026 4,628,900 47,900 1.05%
Change from previous year
-1.0%
-0.5%
0.0%
0.5%
1.0%
1.5%
2.0%
2.5%
3.0%
3.5%
0
500,000
1,000,000
1,500,000
2,000,000
2,500,000
3,000,000
3,500,000
4,000,000
4,500,000
5,000,000
1950 1955 1960 1965 1970 1975 1980 1985 1990 1995 2000 2005 2010 2015 2020 2025
Per
cent
Cha
nge
Pop
ulat
ion
Year
Oregon's Population and Annual Percent Change, 1950-2026
Forecast
Annual Percent Change
Total Population
Year
(July 1) Population Number Percent Population Number Percent Population Number Percent
--------- ---------------- ---------------- ---------------- ---------------- ---------------- ---------------- ---------------- ---------------- ----------------
1980 199,525 --- --- 524,446 --- --- 329,407 --- ---
1990 209,638 10,113 5.07% 532,727 8,281 1.58% 268,134 -61,273 -18.60%
2000 223,207 13,569 6.47% 624,316 91,589 17.19% 330,328 62,194 23.20%
2001 224,645 1,438 0.64% 624,675 358 0.06% 336,660 6,333 1.92%
2002 225,084 439 0.20% 624,611 -64 -0.01% 340,778 4,118 1.22%
2003 226,652 1,568 0.70% 624,349 -262 -0.04% 345,266 4,487 1.32%
2004 228,353 1,701 0.75% 625,461 1,112 0.18% 349,138 3,873 1.12%
2005 230,008 1,655 0.72% 628,326 2,865 0.46% 351,076 1,938 0.55%
2006 231,882 1,874 0.81% 633,646 5,320 0.85% 354,328 3,252 0.93%
2007 236,160 4,278 1.85% 635,720 2,074 0.33% 356,311 1,983 0.56%
2008 239,340 3,180 1.35% 635,372 -348 -0.05% 358,967 2,656 0.75%
2009 239,929 589 0.25% 633,575 -1,797 -0.28% 360,134 1,166 0.32%
2010 238,457 -1,472 -0.61% 630,741 -2,835 -0.45% 359,764 -370 -0.10%
2011 236,180 -2,277 -0.95% 628,366 -2,375 -0.38% 360,675 911 0.25%
2012 232,875 -3,305 -1.40% 628,688 323 0.05% 362,580 1,904 0.53%
2013 230,143 -2,733 -1.17% 630,161 1,473 0.23% 365,925 3,346 0.92%
2014 229,365 -777 -0.34% 631,753 1,592 0.25% 368,525 2,600 0.71%
2015 229,607 242 0.11% 633,304 1,550 0.25% 370,167 1,642 0.45%
2016 231,240 1,632 0.71% 635,485 2,182 0.34% 370,880 712 0.19%
2017 233,416 2,176 0.94% 637,942 2,457 0.39% 372,830 1,950 0.53%
2018 235,064 1,648 0.71% 639,710 1,768 0.28% 374,802 1,973 0.53%
2019 236,315 1,251 0.53% 642,117 2,407 0.38% 376,362 1,560 0.42%
2020 237,485 1,170 0.50% 645,475 3,358 0.52% 376,400 38 0.01%
2021 239,011 1,525 0.64% 647,705 2,229 0.35% 376,371 -29 -0.01%
2022 240,543 1,532 0.64% 648,999 1,295 0.20% 376,998 627 0.17%
2023 241,655 1,112 0.46% 650,820 1,821 0.28% 377,970 972 0.26%
2024 242,266 612 0.25% 652,054 1,234 0.19% 378,935 965 0.26%
2025 242,756 490 0.20% 652,311 257 0.04% 380,226 1,291 0.34%
2026 243,191 435 0.18% 652,593 282 0.04% 381,631 1,405 0.37%
% Change from previous decade/yr.% Change from previous decade/yr.% Change from previous decade/yr.
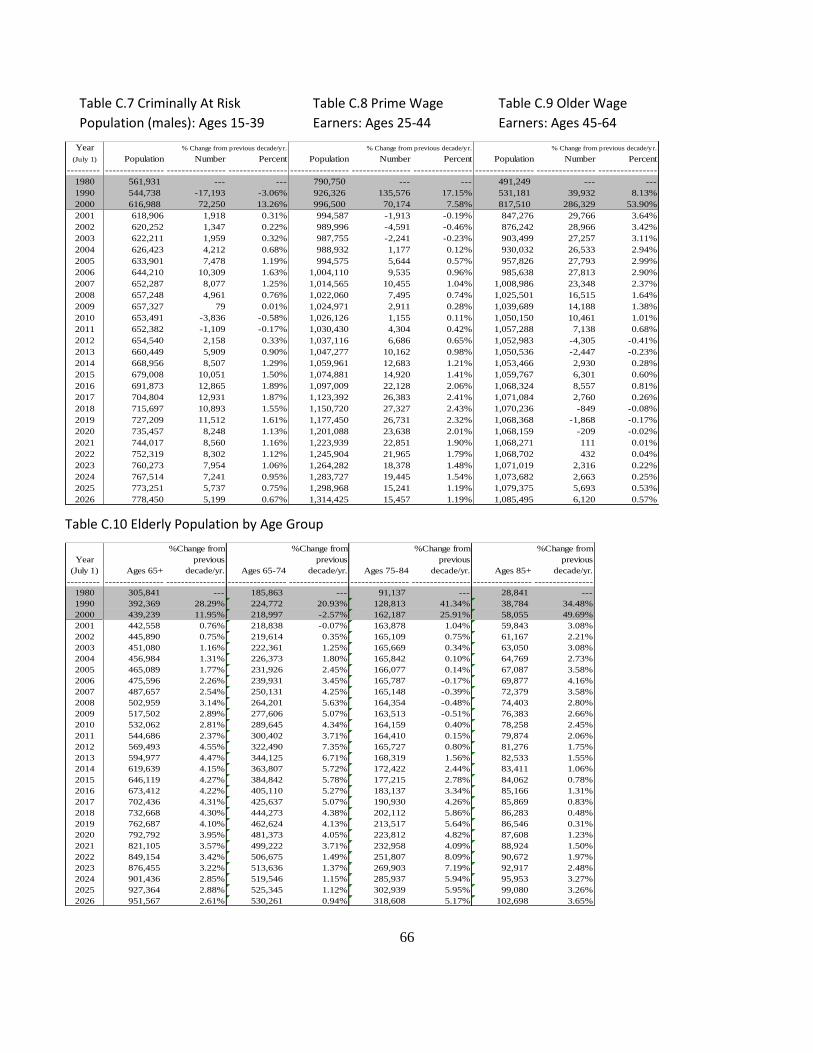
66
Table C.7 Criminally At Risk
Population (males): Ages 15-39
Table C.8 Prime Wage
Earners: Ages 25-44
Table C.9 Older Wage
Earners: Ages 45-64
Table C.10 Elderly Population by Age Group
Year
(July 1) Population Number Percent Population Number Percent Population Number Percent
--------- ---------------- ---------------- ---------------- ---------------- ---------------- ---------------- ---------------- ---------------- ----------------
1980 561,931 --- --- 790,750 --- --- 491,249 --- ---
1990 544,738 -17,193 -3.06% 926,326 135,576 17.15% 531,181 39,932 8.13%
2000 616,988 72,250 13.26% 996,500 70,174 7.58% 817,510 286,329 53.90%
2001 618,906 1,918 0.31% 994,587 -1,913 -0.19% 847,276 29,766 3.64%
2002 620,252 1,347 0.22% 989,996 -4,591 -0.46% 876,242 28,966 3.42%
2003 622,211 1,959 0.32% 987,755 -2,241 -0.23% 903,499 27,257 3.11%
2004 626,423 4,212 0.68% 988,932 1,177 0.12% 930,032 26,533 2.94%
2005 633,901 7,478 1.19% 994,575 5,644 0.57% 957,826 27,793 2.99%
2006 644,210 10,309 1.63% 1,004,110 9,535 0.96% 985,638 27,813 2.90%
2007 652,287 8,077 1.25% 1,014,565 10,455 1.04% 1,008,986 23,348 2.37%
2008 657,248 4,961 0.76% 1,022,060 7,495 0.74% 1,025,501 16,515 1.64%
2009 657,327 79 0.01% 1,024,971 2,911 0.28% 1,039,689 14,188 1.38%
2010 653,491 -3,836 -0.58% 1,026,126 1,155 0.11% 1,050,150 10,461 1.01%
2011 652,382 -1,109 -0.17% 1,030,430 4,304 0.42% 1,057,288 7,138 0.68%
2012 654,540 2,158 0.33% 1,037,116 6,686 0.65% 1,052,983 -4,305 -0.41%
2013 660,449 5,909 0.90% 1,047,277 10,162 0.98% 1,050,536 -2,447 -0.23%
2014 668,956 8,507 1.29% 1,059,961 12,683 1.21% 1,053,466 2,930 0.28%
2015 679,008 10,051 1.50% 1,074,881 14,920 1.41% 1,059,767 6,301 0.60%
2016 691,873 12,865 1.89% 1,097,009 22,128 2.06% 1,068,324 8,557 0.81%
2017 704,804 12,931 1.87% 1,123,392 26,383 2.41% 1,071,084 2,760 0.26%
2018 715,697 10,893 1.55% 1,150,720 27,327 2.43% 1,070,236 -849 -0.08%
2019 727,209 11,512 1.61% 1,177,450 26,731 2.32% 1,068,368 -1,868 -0.17%
2020 735,457 8,248 1.13% 1,201,088 23,638 2.01% 1,068,159 -209 -0.02%
2021 744,017 8,560 1.16% 1,223,939 22,851 1.90% 1,068,271 111 0.01%
2022 752,319 8,302 1.12% 1,245,904 21,965 1.79% 1,068,702 432 0.04%
2023 760,273 7,954 1.06% 1,264,282 18,378 1.48% 1,071,019 2,316 0.22%
2024 767,514 7,241 0.95% 1,283,727 19,445 1.54% 1,073,682 2,663 0.25%
2025 773,251 5,737 0.75% 1,298,968 15,241 1.19% 1,079,375 5,693 0.53%
2026 778,450 5,199 0.67% 1,314,425 15,457 1.19% 1,085,495 6,120 0.57%
% Change from previous decade/yr. % Change from previous decade/yr. % Change from previous decade/yr.
Year
(July 1) Ages 65+
%Change from
previous
decade/yr. Ages 65-74
%Change from
previous
decade/yr. Ages 75-84
%Change from
previous
decade/yr. Ages 85+
%Change from
previous
decade/yr.
--------- ---------------- ---------------- ---------------- ---------------- ---------------- ---------------- ---------------- ----------------
1980 305,841 --- 185,863 --- 91,137 --- 28,841 ---
1990 392,369 28.29% 224,772 20.93% 128,813 41.34% 38,784 34.48%
2000 439,239 11.95% 218,997 -2.57% 162,187 25.91% 58,055 49.69%
2001 442,558 0.76% 218,838 -0.07% 163,878 1.04% 59,843 3.08%
2002 445,890 0.75% 219,614 0.35% 165,109 0.75% 61,167 2.21%
2003 451,080 1.16% 222,361 1.25% 165,669 0.34% 63,050 3.08%
2004 456,984 1.31% 226,373 1.80% 165,842 0.10% 64,769 2.73%
2005 465,089 1.77% 231,926 2.45% 166,077 0.14% 67,087 3.58%
2006 475,596 2.26% 239,931 3.45% 165,787 -0.17% 69,877 4.16%
2007 487,657 2.54% 250,131 4.25% 165,148 -0.39% 72,379 3.58%
2008 502,959 3.14% 264,201 5.63% 164,354 -0.48% 74,403 2.80%
2009 517,502 2.89% 277,606 5.07% 163,513 -0.51% 76,383 2.66%
2010 532,062 2.81% 289,645 4.34% 164,159 0.40% 78,258 2.45%
2011 544,686 2.37% 300,402 3.71% 164,410 0.15% 79,874 2.06%
2012 569,493 4.55% 322,490 7.35% 165,727 0.80% 81,276 1.75%
2013 594,977 4.47% 344,125 6.71% 168,319 1.56% 82,533 1.55%
2014 619,639 4.15% 363,807 5.72% 172,422 2.44% 83,411 1.06%
2015 646,119 4.27% 384,842 5.78% 177,215 2.78% 84,062 0.78%
2016 673,412 4.22% 405,110 5.27% 183,137 3.34% 85,166 1.31%
2017 702,436 4.31% 425,637 5.07% 190,930 4.26% 85,869 0.83%
2018 732,668 4.30% 444,273 4.38% 202,112 5.86% 86,283 0.48%
2019 762,687 4.10% 462,624 4.13% 213,517 5.64% 86,546 0.31%
2020 792,792 3.95% 481,373 4.05% 223,812 4.82% 87,608 1.23%
2021 821,105 3.57% 499,222 3.71% 232,958 4.09% 88,924 1.50%
2022 849,154 3.42% 506,675 1.49% 251,807 8.09% 90,672 1.97%
2023 876,455 3.22% 513,636 1.37% 269,903 7.19% 92,917 2.48%
2024 901,436 2.85% 519,546 1.15% 285,937 5.94% 95,953 3.27%
2025 927,364 2.88% 525,345 1.12% 302,939 5.95% 99,080 3.26%
2026 951,567 2.61% 530,261 0.94% 318,608 5.17% 102,698 3.65%