Ore mineralogy and geochemistry of the Mandoos Volcanic...
103
2017 UNIVERSIDADE DE LISBOA FACULDADE DE CIÊNCIAS DEPARTAMENTO DE GEOLOGIA Ore mineralogy and geochemistry of the Mandoos Volcanic Massive Sulphide (VMS) deposit, Sumail Ophiolite, Oman Bruno Barros Moreira Mestrado em Geologia Económica Especialização em Prospeção Mineral Relatório de Estágio orientado pelos Professores Doutores António Mateus e Bernhard Pracejus
-
Upload
phungquynh -
Category
Documents
-
view
218 -
download
0
Transcript of Ore mineralogy and geochemistry of the Mandoos Volcanic...

2017
UNIVERSIDADE DE LISBOA
FACULDADE DE CIÊNCIAS
DEPARTAMENTO DE GEOLOGIA
Ore mineralogy and geochemistry of the Mandoos Volcanic Massive Sulphide (VMS) deposit,
Sumail Ophiolite, Oman
Bruno Barros Moreira
Mestrado em Geologia Económica
Especialização em Prospeção Mineral
Relatório de Estágio orientado pelos Professores Doutores
António Mateus e Bernhard Pracejus


I
Table of Contents
Acknowledgments .......................................................................................................................III
Resumo ........................................................................................................................................V
Abstract ................................................................................................................................... XIII
Acronyms and Abbreviations...................................................................................................... XV
List of Figures .......................................................................................................................... XIII
1. Introduction and Objectives.....................................................................................................1
2. Geological Setting ..................................................................................................................3
2.1 Regional Setting..............................................................................................................3
2.1.1 Emplacement Models and Geodynamic Implications ..................................................4
2.1.2 The Sumail Ophiolite ...............................................................................................6
2.1.3 Volcano-stratigraphic Sequence ................................................................................7
2.2 VMS Deposits ................................................................................................................8
2.2.1 Ophiolite-Hosted Volcanogenic Massive Sulphide Deposits ..................................... 10
2.2.2 VMS Deposits in Oman.......................................................................................... 11
2.2.3 The Mandoos Deposit ............................................................................................ 12
3. Methodology ........................................................................................................................ 15
3.1 Sampling ...................................................................................................................... 15
3.2 Sample Preparation ....................................................................................................... 17
3.2.1 Thin and Polished Sections Preparation ................................................................... 17
3.2.2 Powders for Whole-rock Multi-element Analysis ..................................................... 17
3.3 Analytical Procedures and Conditions ............................................................................ 18
3.3.1 XRD ..................................................................................................................... 18
3.3.2 Portable EDXRF.................................................................................................... 18
3.3.3 Whole Rock WDXRF ............................................................................................ 18
3.3.4 Whole Rock ICP-MS ............................................................................................. 18
3.3.5 Electron Probe Micro Analysis ............................................................................... 19
4. Model for the Mandoos 1 Deposit .......................................................................................... 21
4.1 The Tridimensional Modelling of Mandoos 1 Deposit ..................................................... 21
4.1 Grades and Tonnage ...................................................................................................... 22
5. Petrography.......................................................................................................................... 27
5.1 Sulphide Ores ............................................................................................................... 27
5.2 Silicified Mineralised Basalt .......................................................................................... 32
5.3 Metalliferous Sediments ................................................................................................ 34
5.4 Jaspers.......................................................................................................................... 37

II
6. Mineral Chemistry ................................................................................................................ 39
6.1 Iron Sulphide Phases ..................................................................................................... 39
6.2 Cu Sulphide Phases ....................................................................................................... 43
6.3 Sphalerite ..................................................................................................................... 46
6.4 Galena.......................................................................................................................... 48
7. Whole-Rock Chemistry......................................................................................................... 49
7.1 Major Elements............................................................................................................. 49
7.2 Minor and Trace Elements ............................................................................................. 52
7.3 REE ............................................................................................................................. 54
7.4 Spider Diagrams ........................................................................................................... 58
7.5 Immobile Elements ....................................................................................................... 61
8. Discussion............................................................................................................................ 65
9. Conclusions ......................................................................................................................... 69
References................................................................................................................................... 71
Appendix .................................................................................................................................. XV

III
Acknowledgments
First and foremost, I would like to thank my supervisors Prof. Dr. António Mateus and Prof. Dr.
Bernhard Pracejus, for the countless discussions and proofreading of many manuscripts.
Further thanks go to Prof. Dr. Ana Jesus, as a non-official supervisor, for introducing me to Oman and
giving me the opportunity to be part of this project, and also Filipa Luz for all her help and friendship
during the last years.
I give special thanks to FCUL and all my professors for the teaching throughout all these years, and Dr.
Pedro Rodrigues for his help in EPMA data acquisition. I gratefully thank GUtech, especially Dr.
Michaela Bernecker for receiving me and make me part of a wonderful team, also Dr. Wilfried Bauer
for his help with the modelling software and Mohamed Al Salmi and his amazing team that did their
best to provide me the best conditions to do this work. I further thank Dr. Mathieu Bennoit (Toulouse
University) and Prof. Fernando Rocha and Maria Cristina Sequeira (Aveiro University) for the
acquisition of imperative data needed to accomplish this work. Many thanks go to Cyntia Mourão
(Lisbon University) and all the lab technicians in SQU for their help in the sample preparation process
and also a special mention to Dr. Carlos Inverno, Prof. Dr. Jorge Figueiras and Prof. Dr. Raul Jorge for
their reviews and contributions to improve this work.
Further thanks go to my GE€CO colleagues, namely André Cravinho, Filipe Ribeiro, Frederico Martins,
Hugo Esteves, Ivo Martins, José Roseiro, José Velez, Marcelo Silva, Miguel Santos and Rita Ferraz, for
all the time spent discussing geological and non-geological topics. Extra thanks go to André Cravinho,
Eduardo Soares and Theresa Boehm for all the good time spent in Oman and all their help during the
elaboration of this report, this also extends to all AGEO interns, AGEO students and all the friends I
made in GUtech.
I would like to thank all my friends for sharing their time, especially to Buceto™ members and I honestly
thank everyone who feels addressed by this acknowledgment. I deeply acknowledge the great support
and love of my family, my brother Filipe, sister Rafaella and nephew Salvador, a special mention to my
mom and grandparents for all their support and strength to carry on.


V
Resumo
O Sultanado de Omã situa-se na península arábica e desde sempre despertou grande interesse geológico
por nele aflorar a maior e mais bem preservada secção de manto superior, crosta oceânica e sedimentos
pelágicos, conhecida como ofiolito de Sumail. A obducção deste ofiolito sobre a plataforma arábica
ocorreu durante o Cretácico Superior, relacionando-se com o fecho do oceano Tétis. A sequência
obductada pode atingir os 20 km de espessura e ocupa toda a região nordeste do Sultanado (Montanhas
de Omã), formando uma faixa de direção NE-SE com ca. de 550 km de comprimento e 150 km de
largura. Da base para o topo esta sequência compreende harzburgitos tectonizados (manto superior),
uma porção gabroica com texturas variadas cortada por dioritos e trondjemitos, e um complexo de diques
que alimenta a sequência extrusiva (lavas em almofada) superior. Esta última pode ser subdividida,
dependendo dos autores, até um máximo de 5 unidades principais. Geotimes é a unidade basal desta
sequência extrusiva, repousando diretamente sobre o complexo de dique em dique. Sobre esta assenta a
unidade Lasail que, de acordo com Kusano et al. (2012), desenvolve interdigitações com a Geotimes
sugerindo a possibilidade de corresponder a uma mera subunidade da última. A unidade Alley repousa
sobre as duas últimas e partilha uma relação espacial com a unidade Boninítica.
Os depósitos de sulfuretos maciços vulcanogénicos localizam-se maioritariamente na região norte de
Omã, entre as sequências lávicas, sobretudo na transição Geotimes-Lasail. Barrie e Hannington (1999)
descrevem estes depósitos como sendo do tipo máfico devido à natureza das rochas encaixantes típicas
nestes sistemas ofiolíticos. Os minérios são ricos em Cu e pobres em Pb quando comparados com outros
depósitos do tipo VMS (Volcanogenic Massive Sulphide). As primeiras evidências de mineração destes
depósitos remontam à Idade do Bronze, tendo incidido sobretudo nos domínios de enriquecimento
secundário (supergénico) de cobre. As minas de Lasail, Bayda e Aarja, no distrito de Sohar, representam
as primeiras explorações de minério, rico em calcopirite, conhecidas no país.
O depósito de Mandoos 1 localiza-se no norte de Omã, no distrito de Sohar, e foi descoberto em 2009
após campanha de prospeção geofísica (VTEM). Trata-se de um depósito oculto, coberto por gravilhas
não consolidadas, possivelmente hospedado na unidade vulcânica Alley. A modelação tridimensional
do depósito com o software MICROMINE revela um corpo mineralizado com 550 m de comprimento
e largura máxima de 370 m, alongado segundo NW-SE e inclinado para SE; a sua espessura varia entre
1 e 90 m. O cálculo do volume da lentícula de minério aponta para um valor global de 1.8 milhões m3
que, assumindo uma densidade média de 4.44 g/cm3, resulta numa tonelagem de minério de
aproximadamente 8 Mt com 1.72 wt% Cu. A modelação espacial da distribuição dos valores de
concentração de Cu e Zn no depósito não colocou em evidência qualquer tipo de zonamento
composicional relevante.
Em Mandoos, duas campanhas distintas de amostragem foram efetuadas: uma amostragem pontual
levada a cabo pela Dra. Ana Jesus em 2015, ao longo da frente de exploração Este; e uma amostragem
em sondagens cedidas pela Mawarid à Universidade GUtech. Destas amostragens resultou uma coleção
de 42 amostras, 27 das quais referentes a minérios sulfuretados, 6 representando jaspes mineralizados,
5 documentando sedimentos metalíferos e 4 basaltos mineralizados. Todas estas amostras foram alvo
de caracterização petrográfica e geoquímica detalhada com o intuito de contribuir com informações úteis
à compreensão do depósito de Mandoos e ao estabelecimento de um modelo metalogenético coerente.
Os minérios associados a depósitos do tipo máfico são geralmente dominados por pirite, apresentando
quantidades subordinadas de calcopirite e esfalerite. Tal é observado nos minérios texturalmente e
mineralogicamente monótonos de Mandoos 1, os quais incluem ainda brechas cimentadas por sílica e

VI
alguns filossilicatos. Os sulfuretos de ferro predominam (principalmente pirite), ocorrendo ainda
calcopirite, esfalerite, algumas fases mais ricas em cobre e, raramente, galena. Por sua vez, as fases
minerais constituintes da ganga correspondem maioritariamente a quartzo, filossilicatos e laumontite.
Os minérios são relativamente pouco retrabalhados termicamente, permitindo a preservação de um
grande número de arranjos espaciais primários, sendo bastante comum a presença de texturas
framboidais e colomórficas, para além de icnofósseis tipo polychetae piritizados. A origem biogénica
de texturas framboidais foi rejeitada, tendo esta sido esta atribuída à propriedade ferromagnética da
greigite, precursor da pirite em texturas framboidais. As fases mais ricas em Cu (bornite, covelite e
spionkopite) são correlacionáveis com os estádios mais tardios de mineralização, evidenciando um
evento mais oxidante. Esta lentícula mineralizada é alimentada por um stockwork caracterizado por
basaltos silicificados com disseminações de pirite e alguns veios preenchidos por pirite e calcopirite,
não sendo evidente o desenvolvimento de uma rede anastomosada de veios mineralizados.
Texturas primárias de marcassite (colomórfica) e crescimentos de wurtzite em espaço aberto (e em
contexto proximal de black-smoker) são observadas em algumas das amostras estudadas. Contudo, a
coexistência de duas fases de ferro (pirite e marcassite) e de zinco (esfalerite e wurtzite) foi atribuída às
variações físico-químicas abruptas que se podem fazer sentir, em poucos centímetros, nestes sistemas.
Estas duas fases (marcassite e wurtzite) cristalizam preferencialmente em equilíbrio com soluções
hidrotermais ácidas, sendo a mistura destas soluções com a água do mar responsável pelo aumento de
pH que, por sua vez, conduz ao desenvolvimento das fases mais estáveis nessas condições (pirite e
esfalerite)
Relativamente aos sedimentos metalíferos (umbers e ochres), estes evidenciam texturas sedimentares
com alternâncias de bandas mais ricas ou empobrecidas em óxidos e hidróxidos de ferro.
Adicionalmente, observam-se também pseudomorfoses de sulfuretos, completamente oxidados. Por sua
vez os jaspes mineralizados apresentam abundantes disseminações de sulfuretos, sendo ainda cortados
por veios selados por pirite e calcopirite. A formação dos jaspes foi interpretada como síncrona do
evento evolutivo mais oxidante, responsável pela formação das fases mais ricas em Cu, enquanto a
génese dos sedimentos metalíferos foi atribuída a eventos tardios de oxidação da lentícula mineralizada
no fundo oceânico e/ou à precipitação de metais libertados para a coluna de água em contexto exalativo
e ambiente oxidante.
Os dados de natureza geoquímica, mais precisamente a análise dos padrões de concentração normalizada
de terras raras, sugere que a deposição dos minérios sulfuretados terá sido governada por misturas de
água do mar e fluido hidrotermal, tal como nos jaspes, embora com proporções distintas. Os padrões
obtidos para os sedimentos metalíferos (umbers e ochres) sugerem adsorção significativa de terras raras
disponíveis na água do mar pelos filossilicatos constituintes dos sedimentos. As terras raras contidas nos
minérios sulfuretados e nos jaspes deverão resultar da lixiviação dos basaltos a muro da mineralização,
aquando da alteração hidrotermal. Os enriquecimentos em terras raras evidenciados pelas amostras de
minério e jaspes podem ser alcançados com uma mistura de água do mar:basalto entre 0.85:0.15 e
0.99:0.01 para basaltos pouco alterados e entre 0.50:0.50 e 0.95:0.05 no caso de basaltos alterados. A
modelação das magnitudes características dos fluidos hidrotermais de análogos modernos (TAG e EPR)
podem ser simuladas com proporções entre 0.999:0.001 e 0.9999:0.0001, contudo a anomalia positiva
em Eu e fracionação positiva em terras raras leves e pesadas típicas nestes fluidos não são
completamente reproduzidas. Os enriquecimentos relativos em Cd, W, Sn, Te e In revelados por alguns
minérios sulfuretados indicam a possibilidade do fluido hidrotermal mineralizante incluir uma
contribuição magmática (episódica? e muito diluída), a qual pode ainda justificar outras diferenças
composicionais observadas.

VII
Palavras-chave: Ofiolito de Sumail, Omã, sulfuretos maciços, mineralogia dos minérios, geoquímica de
rocha total.


XIII
Abstract
The modelling of the Mandoos 1 massive sulphide deposit revealed an orebody of ca. 8 million tonnes
with an average grade of 1.72 wt% Cu. The spatial distribution of Cu and Zn concentrations suggests
that the ores are relatively homogenous in composition and were not significantly affected by metal
zoning refinement processes. The massive sulphide lens is mainly composed of iron sulphide rich (pyrite
± marcasite) breccias, cemented by silica ± phyllosilicates ± laumontite, having chalcopyrite (commonly
altered to Cu-rich phases) and sphalerite as accessory minerals. The ores preserve large number of
primary textures (colloform and framboidal) and also tubeworms (polychetae). The observed large
amount of trace elements in the majority of mineral phases are consistent with the poor thermal
reworking of the ores, also compatible with the monotonous and low diverse mineral assemblage. This
Cu-rich VMS deposit is characterised by secondary Cu enrichment, developed during an oxidising
event, which might also be synchronous of jaspers formation. When these sulphide ores were not
covered, a seafloor weathering produced sequences of umbers and ochres with variable thickness, where
massive sulphide breccias are oxidised and impregnated with silica in a more cold and oxidising
environment, although these can also be formed by direct precipitation of metals within the water
column, derived from exhalative discharges and deposited in such conditions. The REE normalised
patterns of sulphide ores are consistent with a mixture of seawater and vent fluids (derived from basalt
leaching – SW:B). The relative REE enrichments displayed by the ore samples can be simulated by a
ratio of seawater (SW) and basalt (B) scattered between 0.85:0.15 and 0.99:0.01 for less altered basalts,
while for altered basalts (B’) the values range from 0.50:0.50 to 0.95:0.05. The same is observed in
sulphide-mineralised jaspers, while the REE in umbers and ochres derives entirely from seawater.
Present-day vent-fluids REE magnitudes (TAG an EPR) are simulated with SW:B and SW:B’
interactions between 0.999:0.001 and 0.9999:0.0001. Nevertheless the pattern displayed by modern vent
fluids, characterised by an evident Eu positive anomaly and positive LREE and HREE fractionation, is
not completely reproduced by the performed simulation. Evidence of magmatic contributions to the
hydrothermal mineralising fluid is supported by overall enrichments in Cd, W, Sn, Te and In; these contributions may also explain some other observed compositional differences.
Key-words: Sumail Ophiolite, Oman, massive sulphide, ore mineralogy, whole rock geochemistry.


XV
Acronyms and Abbreviations
Geochemica l Features
Rare Earth Elements REE Suprasubduction Zone SSZ
Light Rare Earth Elements LREE Moho Transition Zone MTZ
Heavy Rare Earth Elements HREE Depleted Mantle Source DMM
High Field Strenght Elements HSFE C1 Chondri te C1
Large Ion Li tophile Elements LILE Primitive Mantle PM
Mid-Ocean Ridge Basalts MORB Back-arc basins basalts BABB
Normal Mid Ocean Ridge Basalts N-MORB Forearc Basin FAB
Enriched Mid Ocean Ridge Basalts E-MORB Is land Arc Tholeiites IAT
Minera ls
pyri te Py zeol ite (group) Zeo
chalcopyrite Ccp chlorite Chl
sphalerite Sp quartz Qz
marcasite Mrc hematite Hem
wurtzi te Wur carbonates Cb
bornite Bn
ga lena Gn
laumontite Lmt
Geology- various
atoms per unit formula apuf North East NE
parts per million ppm South West SW
weight percent wt% Volcanic Associated Massive Sulphide VAMS
Whole-rock WR Volcanic Hosted Massive Sulphide VHMS
X-ray fluorescence XRF Vulcanogenic Massive Sulphide VMS
Wavelenght dispersive X-ray fluorescence WDXRF Iberian Pyri te Belt IPB
Inductively Coupled Plasma Mass Spectrometry ICP-MS Massive Sulphide MS
Polarized light PL Versatile Time-Domain Electromagnetic VTEM
Reflected light RL Mandoos MD
Plane polarized light PPL Back Scatter Electrons BSE
Crossed polarized l ight XPL Seawater SW
Mi l lion Tonnes Mt Basalt B
Mi l lion years M.y. Al tered Basalt B'
Below Detection Limit BDL East Pacific Rise EPR
Trans Atlantic Geotransverse TAG
Insti tutional
Faculty of Sciences, University of Lisbon FCUL Sultan Qaboos University SQU
Centre National de la Recherche Scientifique CNRS German University of Technology, Oman GUTech
Others
exempli graia/example e.g. sensu strictu/strict sense s.s.
sensu lato/broad sense s.l. Id est/This is i.e.


XIII
List of Figures
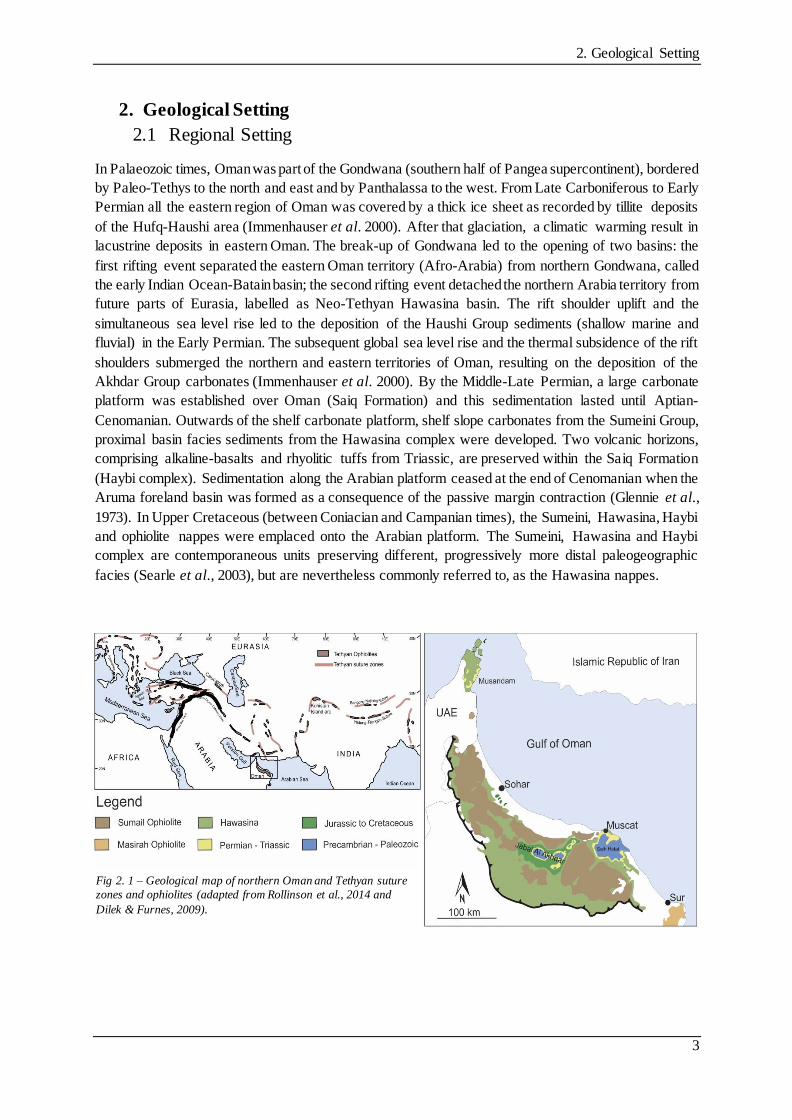
Fig 2. 1 – Geological map of northern Oman and Tethyan suture zones and ophiolites (adapted from
Rollinson et al., 2014 and Dilek & Furnes, 2009). ............................................................................3
Fig 2. 2 – Emplacement model where the mid-ocean ridge is the starting point for the ophiolite obduction
(in Searle & Cox, 1999)..................................................................................................................4
Fig 2. 3 – Model for the ophiolite obduction in the northern Oman showing; A – structural position of
Sumeini, Hawasina and Haybi complexes before the emplacement; B – formation of the metamorphic
sole (in Searle & Cox, 1999). ..........................................................................................................5
Fig 2. 4 – Subduction-zone emplacement model showing the internal structure of the ophiolite (in Searl
& Cox, 1999). ................................................................................................................................6
Fig 2. 5 – Schematic representation of the volcano-stratighaphic sequence of the northern Oman
illustrating also the position of some VMS deposits (adapted from Gilgen et al., 2014). ......................8
Fig 2. 6 – Simplified geological map displaying the location of a large number of deposits within the
volcanic units represented as in figure 2.1. ..................................................................................... 11
Fig 2. 7 – Location of Mandoos 1 open pit (ArcGIS). ..................................................................... 12
Fig 2. 8 – Cross-section of the ore body showing the relative position of the stockwork and the gossan
cover (Mawarid Mining, 2014). .................................................................................................... 13
Fig 3. 1 – First sampling survey along the open pit east wall, illustrating the location of the 4 sampled
profiles and some other collected samples...................................................................................... 15
Fig 3. 2 – Drill holes location at Mandoos 1; the red mark represents the drill holes sampled in this work
(second survey); information from drill holes marked with the reference was used in the modelling
exercise. Black line represents NW-SE cross section. shown in Fig 4.4, 4.5 and 4.6. ........................ 16
Fig 4. 1 - Pit design with implanted drill cores and the orebody extension. ....................................... 21
Fig 4. 2 – North sector fracture network and massive sulphide lens E-W cross-section showing the fault-
related displacements consistent with a hemi-graben morphology. .................................................. 22
Fig 4. 3 – LEFT - MICROMINE implicit modelling for Cu distribution by cut-off grade; (A) 2.44 wt%,
(B) 0.88 wt%, (C) 0.5 wt% and (D) 0.3 wt% (mine cut-off grade. RIGHT - MICROMINE implicit
modelling for Zn distribution by cut-off grade; (A) 0.44 wt%, (B) 0.15 wt%, (C) 0.09 wt% and (D) 0.01
wt%. ........................................................................................................................................... 23
Fig 5. 1 - Hand Samples : A – MD-NP-1 – Zn-rich ore, sphalerite and chalcopyrite rich ore with late
laumontite infillings; B – MD-P3-4-1 – massive sulphide breccia mainly composed of pyrite clasts
cemented by carbonates; C – MD-P2-3-2 – massive sulphide breccia cemented by silica and
phyllosilicates, characterised by preserved primary textures, including pyritised tubeworms; D -
MD178-128.80 – massive sulphide breccia cemented by silica and crosscut by large sphalerite rich vein;
E, F, G, H – samples of massive sulphide breccias displaying a silica rich cement. The graphic scale
bar is 2 cm. .................................................................................................................................. 28
Fig 5. 2 – Microphotography - 1 - Tubeworm preserved in the second generation of Py and Ccp
intergrowths – RL – PPL; 2 – Pyritised tubeworms (various sections) in a cement enriched in silica and
phyllosilicates – BSE; 3 – Massive sulphide breccia texture displaying Py, Ccp and Sp clasts – RL –
PPL; 4 – Colloform Py intergrowth with silica displaying some hydraulic brecciation – RL – PPL; 5 –
Py breccia showing recrystallised clasts and clasts displaying primary textures (colloform) – RL – PPL;
6 – Colloform Py preserved in recrystallised mass – RL – PPL; 7 – Colloform marcasite being replaced

XIV
by Ccp – RL – PPL; 8 – Py displaying growth zonation marked by Sp inclusions. The graphic scale bar
is 400 μm in RL and TL microphotography and 200 μm in BSE images. ......................................... 30
Fig 5. 3 – Microphotography - 1 - Mrc growing around framboidal Py – RL – PPL; 2 – Coarse grain
euhedral Mrc intergrowth with silica – RL – PPL; 3 – Framboidal Py clast being replaced by Ccp, Cu-
rich phases oxidising Ccp – RL – PPL; 4 – Prismatic Wur infilled with Lmt – RL – PPL; 5 – Sp
displaying crystallographically oriented Ccp inclusions and infilled together with Lmt – RL – PPL; 6 –
Sp and Ccp intergrowths – RL – PPL; 7 – Clast showing “shattered” texture due to Ccp and Cu-rich
phases alteration – BSE; 8 – Wur (prismatic sections) with Ccp inclusions in Py clasts – RL – The
graphic scale bar is 400 μm in RL and TL microphotography and 200 μm in BSE images ................ 31
Fig 5. 4 – Hand Samples - MD430-131.00 (A) and MD430-127.70 (B) – Silicified basalt displaying
sulphide disseminations and sulphide veins. Microphotography – 1 – Euhedral Py disseminations in
the basalt – RL – PPL; 2 - Euhedral Py disseminations in the basalt – RL – XPL; 3 – Py, Ccp and Qz
present in veins – RL – PPL; 4 – Breccia texture present in vuggs – RL – PPL; 5 - Breccia texture in
rock vugs – RL – XPL. The graphic scale bar is 400 μm in RL and TL microphotography and 2 cm in
hand samples. .............................................................................................................................. 32
Fig 5. 5 – Hand Samples – A – MD-P2-2B – Ochre; B – Umber; C – MD174-62.15 - Oxidised massive
sulphides; D – Massive sulphide mineralised jasper; E - MD178-134.20 – Ochre displaying sulphide
layers close to the contact with the massive sulphide lens; F – MD-P2-2A - Layered ochre. The graphic
scale bar is 2 cm........................................................................................................................... 34
Fig 5. 6 – Microphotography – 1 – Carbonate veins crosscutting the sample parallel to the layering –
TL – XPL: 2 – Fe-oxide clusters sub-perpendicular to the layering – TL – XPL; 3 – Sulphide clast
replaced by Fe-oxides and hydroxides and infilled by malachite? – RL – XPL; 4 – Preserved sulphides
in the clast core – RL – PPL; 5 – Pseudomorphs after py in Fe-hydroxide matrix – RL – XPL; 6 - Fe-
oxides pseudomorphs after py– RL – PPL; 7 – Sulphides in carbonate vein – TL – PPL; 8 – Oxidised
colloform texture – RL – XPL. The graphic scale bar is 400 μm in RL and TL microphotography. .... 36
Fig 5. 7 – Microphotography – 1 – Fine-grained anhedral aggregates and euhedral Py disseminations
in jasper – RL – PPL; 2 – Py grain with jasper inclusions, displaying a leached rim – RL – XPL; 3 – Py
breccia zone in contact with jasper having disseminated Py – RL – PPL; 4 - Py breccia zone in contact
with jasper including Py disseminations (as in microphoto 3) – RL – XPL; 5 - Sulphides associated with
mineralised veins – RL – PPL; 6 - Sulphides associated with mineralised veins (as in microphoto 5) –
RL – XPL; 7 – Disseminations in jasper, Ccp being altered by Cu-rich phases – RL – PPL; 8 -
Disseminations in jasper, Ccp being altered by Cu-rich phases (as in microphoto 7) – RL – XPL. The
graphic scale bar is 400 μm in RL and TL microphotography.......................................................... 38
Fig 6. 1 - Box and whiskers plot for the multi-element concentration distributions displayed by 310
analyses of pyrite (concentration values in wt%). Note the relative importance of Cu, Zn and Pb as minor
elements. Traces of some other elements are noteworthy, namely As, In, Se and Co (and Au?). ........ 39
Fig 6. 2 - Box and whiskers plot for the multi-element concentration distributions displayed by 111
analyses of marcasite (concentration values in wt%). Note the relative importance of Cu, Zn and Pb as
minor elements (like pyrite). Traces of Mn and Co also with statistical meaning. ............................. 40
Fig 6. 3 - Ternary (S+As)–(Cu+In)–(Zn+Cd+Co)–Fe diagrams putting in evidence compositional
deviations towards Cu and Zn enrichments. ................................................................................... 41
Fig 6. 4 - Bivariate diagram for textural discriminated pyrite analyses. ............................................ 41
Fig 6. 5 - Bivariate diagram for textural discriminated marcasite analyses........................................ 42
Fig 6. 6 – Pyrite colloform clast displaying the analysed profile. The graphic shows the Cu variations
registered during the formation of that primary texture. .................................................................. 42
XV
Fig 6. 7 - Box and whiskers plot for the multi-element concentration distributions displayed by 262
analyses of chalcopyrite (concentration values in wt%). Note the relative importance of Zn and Pb as
trace elements. ............................................................................................................................. 43
Fig 6. 8 - Box and whiskers plot for the multi-element concentration distributions (values in wt%)
displayed by 13 analyses of bornite being Zn and Pb the most significant trace elements. ................. 44
Fig 6. 9 - Box and whiskers plot for the multi-element concentration distributions (values in wt%)
displayed by 64 analyses of Cu-rich phases showing minor/trace amounts of Zn, traces of some other
elements are noteworthy, namely Pb, Ag, Mo and Te. .................................................................... 45
Fig 6. 10 - Ternary diagram showing oxidation trend in Cu phases. ................................................. 45
Fig 6. 11 - Box and whiskers plot for the multi-element concentration distributions displayed by 181
analyses of sphalerite (values in wt%). Minor/trace amounts of Cu and Cd are significant, traces of some
other elements are noteworthy, namely Pb, Mo and W, between others............................................ 46
Fig 6. 12 - Ternary (S+As)–Fe–Cu– (Zn+Cd+Co) diagrams putting in evidence compositional
dislocations towards Fe and Cu in sphalerites................................................................................. 47
Fig 6. 13 - Bivariate diagram for textural discriminated sphalerite analysis. ..................................... 47
Fig 6. 14 - Box and whiskers plot for the multi-element concentration distributions displayed by 5
analyses of galena (concentration values in wt%). Note the relative importance of Zn, Cu, Sb and Fe as
minor/trace elements. ................................................................................................................... 48
Fig 7. 1 – Major elements distribution in sulphide ores. .................................................................. 50
Fig 7. 2 – Major elements distributions in: A – umber and ochres; B – mineralised (sulphide-rich and
Mn-rich) jaspers........................................................................................................................... 51
Fig 7. 3 - Box and whiskers plot for the multi-element concentration distributions displayed by massive
sulphides (concentration values in ppm). ....................................................................................... 52
Fig 7. 4 - Box and whiskers plot for the multi-element concentration distributions displayed by
metalliferous sediments; ............................................................................................................... 53
Fig 7. 5 - Box and whiskers plot for the multi-element concentration distributions displayed by jaspers
(concentration values in ppm). ...................................................................................................... 53
Fig 7. 6 – REE patterns for: A – sulphide ores; B – umber and ochres; C – mineralised jaspers; D – all
the analysed samples together with representative REE normalised compositions of seawater (Li et al.,
2004) and vent fluids (EPR (German et al., 1999) and TAG (Mills & Elderfield 1995)). ................... 55
Fig 7. 7 – Comparison of metalliferous sediments REE normalised patterns: on top – Mandoos (black)
and Troodos (dark grey); bottom – Mandoos (black) and EPR (light grey). ...................................... 57
Fig 7. 8 - Normalised concentration patterns for Mandoos samples: A – all the analysed samples; B –
sulphide ores; C – umber & ochres. Normalization values according to Palme & O'Neill (2004). ...... 59
Fig 7. 9 – Y vs Zr and Y vs Nb plots showing the immobility of these elements. .............................. 61
Fig 7. 10 – Y/Zr vs La/Zr plot showing two different sources for the studied samples. ...................... 61
Fig 7. 11 – Normalised (Y) concentration patterns for Mandoos samples: A – all the analysed samples;
B – sulphide ores; C – umber & ochres.......................................................................................... 63


Ore mineralogy and geochemistry of the Mandoos Volcanic Massive Sulphide (VMS) deposit, Sumail Ophiolite, Oman
1
1. Introduction and Objectives
Oman, located in the southeastern coast of the Arabian Peninsula is bordered by the United Arab
Emirates (northwest), Saudi Arabia (West) and Yemen (southwest). The geological relevance of the
country comes mostly because of the largest and also the best preserved slab of upper mantle, oceanic
crust and pelagic sediments in the world known as the Sumail ophiolite. A series of nappes were also
emplaced along with the ophiolite; those thrust sheets comprise, from the bottom to the top, the Sumeini,
Hawasina, and Haybi nappes, that were emplaced onto the Arabian continental margin between
Coniacian and Campanian, during Neo-Tethys closure (Immenhauser et al. 2000).
According to Barrie and Hannington (1999), the volcanogenic massive sulphide deposits (VMS) hosted
in ophiolitic sequences are classified as “mafic type” due to the predominance of mafic rocks. Deposits
of this type are normally fewer in number, smaller in size, Cu-rich and Pb-poor when compared with
other types of massive sulphide ores. In Oman, VMS deposits are mostly found in the northern part of
the Sumail ophiolite, where the volcanic lava sequences are best exposed, and its exploitation goes back
to the Bronze Age.
The Mandoos deposit was discovered in 2009 when the Mawarid Mining conducted a Versatile Time-
domain Electro-Magnetic (VTEM) survey over an extension of wadi gravels in the north of Oman. Four
first-order anomalies were identified in the region and the presence of massive sulphides was confirmed
during a subsequent drilling survey. The Mandoos 1, Mandoos 2 and Mandoos 3 anomalies host massive
sulphides but only the first includes Cu-mineralisation and tonnage economically viable for exploitation.
The last anomaly (Mandoos 4) did not revealed the presence of orebodies of any kind (Mawarid Mining,
2014).
The Mandoos 1 deposit is located in the Sohar region and is hosted in massive basaltic lavas possibly
related to the Alley volcanic unit. The mining operations started in October 2011 with extraction by
open pit and lasted till early-2015, when all activities were abandoned due to economic issues.
Underground exploration did not start due to problems with the local community. Engineers assessed a
total mineral resource of 8 million tonnes of massive sulphides, with 5 million tonnes in reserves at 1.8%
Cu (Mawarid Mining, 2014).
Samples for this study were obtained from in situ sampling and drill-cores picking from the assortment
offered by the Company to the German University of Technology in Oman (GUtech). The main
objective of this work consists on the mineralogical and geochemical characterisation of the Mandoos
massive sulphide ores, by means of: (1) detailed re-logging of the drill-cores at GUtech; (2) petrography
and detailed mineralogical studies with an Electron Probe Micro Analyser (EPMA); (3) whole rock
multi-element geochemistry of a set of pre-selected samples from 2 different sampling surveys. All the
petrography and analytical work was focused on massive sulphide samples (breccias), metalliferous
sediments (umbers and ochres) and jaspers (mineralised). The numerical analysis and modelling of data
mining assay for a large number of drill cores provided by Mawarid Mining further allowed assessing
the vertical/lateral metal zonation in the orebody. The data and information collected represent a
significant contribution to the establishment of a comprehensive metallogenetic model for the Mandoos
VMS deposit.

2. Geological Setting
3
2. Geological Setting
2.1 Regional Setting
In Palaeozoic times, Oman was part of the Gondwana (southern half of Pangea supercontinent), bordered
by Paleo-Tethys to the north and east and by Panthalassa to the west. From Late Carboniferous to Early
Permian all the eastern region of Oman was covered by a thick ice sheet as recorded by tillite deposits
of the Hufq-Haushi area (Immenhauser et al. 2000). After that glaciation, a climatic warming result in
lacustrine deposits in eastern Oman. The break-up of Gondwana led to the opening of two basins: the
first rifting event separated the eastern Oman territory (Afro-Arabia) from northern Gondwana, called
the early Indian Ocean-Batain basin; the second rifting event detached the northern Arabia territory from
future parts of Eurasia, labelled as Neo-Tethyan Hawasina basin. The rift shoulder uplift and the
simultaneous sea level rise led to the deposition of the Haushi Group sediments (shallow marine and
fluvial) in the Early Permian. The subsequent global sea level rise and the thermal subsidence of the rift
shoulders submerged the northern and eastern territories of Oman, resulting on the deposition of the
Akhdar Group carbonates (Immenhauser et al. 2000). By the Middle-Late Permian, a large carbonate
platform was established over Oman (Saiq Formation) and this sedimentation lasted until Aptian-
Cenomanian. Outwards of the shelf carbonate platform, shelf slope carbonates from the Sumeini Group,
proximal basin facies sediments from the Hawasina complex were developed. Two volcanic horizons,
comprising alkaline-basalts and rhyolitic tuffs from Triassic, are preserved within the Saiq Formation
(Haybi complex). Sedimentation along the Arabian platform ceased at the end of Cenomanian when the
Aruma foreland basin was formed as a consequence of the passive margin contraction (Glennie et al.,
1973). In Upper Cretaceous (between Coniacian and Campanian times), the Sumeini, Hawasina, Haybi
and ophiolite nappes were emplaced onto the Arabian platform. The Sumeini, Hawasina and Haybi
complex are contemporaneous units preserving different, progressively more distal paleogeographic
facies (Searle et al., 2003), but are nevertheless commonly referred to, as the Hawasina nappes.
Fig 2. 1 – Geological map of northern Oman and Tethyan suture
zones and ophiolites (adapted from Rollinson et al., 2014 and
Dilek & Furnes, 2009).

Ore mineralogy and geochemistry of the Mandoos Volcanic Massive Sulphide (VMS) deposit, Sumail Ophiolite, Oman
4
2.1.1 Emplacement Models and Geodynamic Implications
The tectonic setting of the Sumail ophiolite is still open to discussion. According to various authors, the
ophiolite was originated in a typical mid-ocean ridge environment while others propose a supra-
subduction zone for its origin. The mid-ocean ridge model implies an obduction starting at the ridge;
therefore, similar ages would be expected for the ophiolite units and the subduction zone footwall
(metamorphic sole and Haybi complex), which is not the case (Searle & Cox, 1999). The Haybi complex
is older than the ophiolite unit and records an oceanic-derived volcanism such as the Triassic alkaline
(ankaramites, nephelinites) and tholeiitic basalts (Searle & Cox, 1999), as well as the Late Permian and
Late Triassic limestone blocks and Cretaceous melanges. The amphibolites forming the metamorphic
sole are compositionally distinct of the ophiolite volcanic rocks and the Haybi complex alkaline basalts
display geochemical trends similar to those of the Haybi tholeiitic volcanic rocks (Triassic or Jurassic).
Therefore, the ophiolite obduction could not have started at the mid-ocean ridge (Searle et al., 1999);
this is further reinforced by the similar dating of plagiogranites and metamorphic sole (Hacker, 1994),
placing the subduction of Haybi complex basalts beneath the ophiolite at the same time of the ophiolite
was developed during the Cenomanian-Tourian (Searle & Cox, 1999).
The plausible setting where older and colder material could be in contact with hot-forming ophiolite
rocks would be a transform-fault zone; however, clear evidence for that structural array is missing at
Oman (MacLeod & Rothery, 1992). Searle & Cox (1999) reject both previous models for the tectonic
setting that formed the Sumail ophiolite, which must have started above a northeast-dipping zone, away
from the continental margin. The emplacement of the Sumail ophiolite began along with the Sumail
thrust in a trench where older, colder ocean floor rocks (Haybi complex) were being subducted to the
NE beneath the Sumail ophiolite, at the same time or right after the Sumail crustal sequence formation.
Between 97-75 Ma the ophiolite was formed at a spreading centre above a northeast-dipping zone. The
subduction of Haybi volcanic rocks reached 12-14 km below the Moho and their metamorphic
recrystallisation achieved the upper amphibolitic facies conditions in a time span between 95-93 Ma
(Searle & Cox, 1999). Those amphibolites formed the metamorphic sole and were welded to the base of
the mantle sequence of the ophiolite. During burial processes, greenschist facies metamorphism affected
the Haybi volcanic rocks, manganiferous cherts, exotic limestones, and shales, and they were welded
onto the base of the amphibolites. All this sequence, ophiolite and metamorphic sole, was then emplaced
onto the Arabian platform, reaching a distance of 350-400 km in a southwest direction (Searle & Cox,
1999).
Fig 2. 2 – Emplacement model where
the mid-ocean ridge is the starting
point for the ophiolite obduction (in
Searle & Cox, 1999)

2. Geological Setting
5
Fig 2. 3 – Model for the ophiolite obduction in the northern Oman showing; A – structural position of Sumeini, Hawasina and
Haybi complexes before the emplacement; B – formation of the metamorphic sole (in Searle & Cox, 1999).
Paleo-depths of metamorphism were estimated from high-pressure metamorphic rocks presently located
in the southeastern sector of the ophiolite. All the continental margin of the Oman Mountains was
subducted to lower levels, in opposition to the central sector where no high-pressure metamorphic rocks
are known. The deepest metamorphism is recorded by the As Sifah eclogites (garnet + clinopyroxene +
glaucophane + phengite–bearing metabasalts and garnet + chloritoid–bearing metapelites) that were
subducted to depths around 90 km. The eclogites occur within the Permian carbonated Saiq formation
and evolved along a clockwise P-T path culminating at 20–23 ± 2.5 kbar and 540 ± 75 °C, suggesting
that the continental crust was subducted underneath the ophiolite. Medium-pressure rocks are known in
the northern part of the ophiolite from crossite- and glaucophane-bearing metabasalts in the north of
Oman and high-pressure garnet amphibolites in the United Arab Emirates; however, in Bani Hamid
area, the granulite facies point to P-T conditions of metamorphism of 6–9 kbar and 850 °C. In opposition
to the Haybi complex that formed the majority of the metamorphic sole, the protoliths of granulites were
quartzites and carbonates from the continental margin (Searle & Cox, 1999).

Ore mineralogy and geochemistry of the Mandoos Volcanic Massive Sulphide (VMS) deposit, Sumail Ophiolite, Oman
6
2.1.2 The Sumail Ophiolite
The Sumail ophiolite, also referred as Semail or Samail in the literature, has been recognised as the best
preserved and largest slab of upper mantle, oceanic crust and pelagic sediments accessible on land. It
was emplaced from NE to SW onto the Arabian passive continental margin, during late Cretaceous times
due to the closure of the Tethys Ocean. With approximately 550 km long and 150 km wide (Searle et
al., 1999) the ophiolite belt comprises a complete section of the upper crust peridotites (8 – 12 km) and
oceanic crust (4 – 7 km) (Lippard et al., 1986), exposing a slice of oceanic lithosphere up to 20 km thick.
The typical oceanic lithosphere is entirely exposed in the Sumail ophiolite and its emplacement onto the
Arabian platform did not result in significant structural dismembering; i.e., despite of regional doming
and local thrusting, primary lithostratigraphic relationships are fairly preserved. It is believed that the
oceanic nappe, along with several structurally underlying nappes, was emplaced in its present position
(Glennie et al., 1973).
The mantle sequence of the Sumail ophiolite is mainly composed of tectonised harzburgite, originated
by partial melting of fertile primary spinel lherzolite (Searle et al., 1999). Below the Moho, high
temperature mineral lineations formed due to the plastic flow during mantle upwelling and diverging
away from the ridge. Mineral fabrics originated during the ophiolite emplacement overprint these early
mantle fabrics along the base, as evident in a strongly banded harzburgite-lherzolite-dunite basal unit.
The appearance of plagioclase marks the petrological Moho, where dunite pods with small chromite-
rich lenses occur (Searle & Cox, 1999).
The oceanic crustal section of the ophiolite is composed of cumulate gabbros overlain by isotropic
gabbros which are intruded by diorites and trondhjemites; some discordant wehrlites can intrude higher
levels of the crustal sequence. A sheeted dyke complex outlines the main pathways that fed the extrusive
pillow lavas (Searle & Cox, 1999). Up to 2 km of lavas form the upper sequence of the ophiolite,
outcropping mostly in northern part of Oman. The volcanic sequence can be subdivided into different
units depending on the authors, resulting in a maximum of five major units (Alabaster et al, 1982; Gilgen
et al., 2014), as addressed below.
Fig 2. 4 – Subduction-zone emplacement model showing the internal structure of the ophiolite (in Searl & Cox, 1999).

2. Geological Setting
7
2.1.3 Volcano-stratigraphic Sequence
As aforementioned, the upper section of the ophiolite nappe is composed of up to 2 km of pillow lavas
covered by up to 30 m of pelagic sediments containing microfossils of Cenomanian to Turonian age
(Gilgen et al., 2014). U-Pb zircon ages of trondhjemites from many different levels along the ophiolite
section fall in the time window from 97.3 to 94.4 Ma (Rollinson, 2009). Those ages, considered together
with micropaleontology data gathered from pelagic sediments interbedded in the lavas, allow inferring
that the seafloor volcanism was active during ca. 10 m.y. (from ca. 98.9 to 89 Ma). According to Searle
and Malpas (1982), it took 3 to 7 m.y. from the volcanism cessation until the ophiolite obduction; other
authors assume that the time span was even shorter, from 1 to 2 m.y. The Sumail ophiolite lavas form a
defined set of volcano-stratigraphic units presumably derived from overlapping volcanic centres at
spreading axes and, thereafter, at off-axis locations (Gilgen et al., 2014). Five lava units were
distinguished by Alabaster et al. (1982) according to field, petrological and geochemical characteristics;
these are labelled as Geotimes, Lasail, Alley, Clinopyroxene-phyric, and Salahi.
Geotimes is the lowermost unit of the extrusive volcanism; it lays directly on top of the sheeted dyke
complex and can vary between 0.75 and 1.5km in thickness (Alabaster et al., 1982; Lippard et al., 1986).
These lavas can be recognised in the field considering: (i) the common occurrence of tubular pillows
instead of massive flows; (ii) the scarcity of amygdule and variole-rich textures; and (iii) the typical
reddish-brown colour due to the widespread, fine-grained hematite dissemination and hematite-rich
inter-pillow hyaloclastites. They are slightly depleted in incompatible trace elements when compared to
N-MORB basalts, along with negative anomalies of Nb and Ta (Godard et al., 2003)
The Lasail unit overlies, at least locally, Geotimes. According to Alabaster and Pearce (1985), the Lasail
unit is restricted to some areas, being interpreted as a product of off-axis volcanism. However, following
Kusano et al. (2012), the Lasail unit is inter-fingered with Geotimes and can be simply envisaged as a
subunit of the latter. It consists of grey to pale green basaltic to andesitic pillow lavas that can vary from
0 to 0.75 km thick (Lippard et al., 1986); the typical green colour is due to the relative abundance of
epidote and chlorite. Geochemically, the Lasail lavas are depleted in both light rare earth elements
(LREE) and incompatible elements when compared to N-MORB basalts (Godard et al., 2003).
The Alley unit lies on top of both Geotimes and Lasail, and comprises grey and brown pillowed and
massive flows, as well as basalt breccias; this unit can vary from 0.75 to 2 km in thickness. The 2 to 3
meters of pillows are characterised by abundant amygdule filled with zeolites and celadonite, besides
glomerophyric clusters of clinopyroxene (Alabaster et al., 1982; Lippard et al., 1986). The Alley and
Lasail lavas share a similar normalised pattern for rare earth element (REE), although the concentration
in LREE is slightly lower in Alley lavas. These two units can be also differentiated on the basis of Zr
and Cr contents (Lippard et al., 1986).

Ore mineralogy and geochemistry of the Mandoos Volcanic Massive Sulphide (VMS) deposit, Sumail Ophiolite, Oman
8
Fig 2. 5 – Schematic representation of the volcano-stratighaphic sequence of the northern Oman
illustrating also the position of some VMS deposits (adapted from Gilgen et al., 2014).
Overlying these three volcanic units, some small-volume basaltic flows with abundant clinopyroxene
phenocrysts are found, belonging to the Clinopyroxene-phyric unit; these lavas area characterised by
lower Zr and Ti contents but higher Cr grades (Alabaster et al., 1982; Lippard et al., 1986). The Salahi
unit consists of alkaline to transitional within-plate lavas (Alabaster et al., 1982). These two latter units
are restricted to specific areas and they are not found anywhere else besides the outcrops reported in
Alabaster et al. (1982); both units are not associated with any sulphide mineralization (Gilgen et al.,
2014). Some boninitic outcrops show a spatial relationship with Alley lavas. Those lavas have regional
meaning but it is not clear if all the occurrences are limited to just one stratigraphic unit; they usually
occur as vesicular pillows and sheet flows, reaching several meters in thickness, with
(micro)phenocrysts of orthopyroxene, clinopyroxene, olivine, and chrome-spinel (Gilgen et al., 2014).
Some boninitic dykes found in the Shinas mine are younger than the Alley lavas, suggesting that their
development and emplacement took place, at least in some areas, after the Alley unit.
2.2 VMS Deposits
Volcanogenic Massive Sulphide (VMS) deposits precipitate from hydrothermal fluids and form
stratiform accumulations of sulphides at sea floor level. Commonly associated with volcanic rocks, this
type of deposits represent an important source of Cu, Zn, Pb, Au, and Ag along with Co, Sn, Ba, S, Se,
Mn, Cd, In, Bi, Te, Ga, and Ge as co- or by-products. The study of active, metal-precipitating
hydrothermal vents on the sea floor has been the key factor to understand the land-based VMS deposits
formation (Barrie and Hannington, 1999).

2. Geological Setting
9
A five-fold classification is commonly used to describe most of ancient and active VMS deposits. This
classification is mainly based on the composition of the host rocks, assuming that the metals in sulphide
ores derive mostly from leaching and scavenging of a footwall substrate. The main five types of host
rocks composition where the classification is rooted are: mafic, bimodal-mafic, mafic-siliciclastic,
bimodal-felsic, and bimodal-siliciclastic (Barrie and Hannington, 1999).
The “mafic type” is defined by the larger predominance of mafic rocks on the hosting stratigraphic
sequence given the rare or even absence of felsic rocks, although minor siliciclastic or ultramafic rocks
can be present. Ophiolites are one of the settings classified as mafic and most of the examples from this
type are exclusively Phanerozoic in age. Ocean ridges, advanced back-arc rifts and supra-subduction
spreading zones are the common settings where modern analogues of this type are found. The basaltic
host rock is predominantly tholeiitic, with some local boninitic occurrences. Mafic VMS deposits are
normally fewer in number, smaller, Cu-rich and Pb-poor in comparison with the other massive sulphide
deposit types (Barrie and Hannington, 1999).
The “bimodal-mafic” type is characterised by having more than 50% of mafic rocks and a low
percentage (> 3%) of felsic ones in the hosting sequence; the mafic/felsic ratio is 3:1 or greater, but
felsic volcanic rocks are usually the nearest host rocks. The composition of the volcanic host rocks
points to primitive volcanic arcs or rifted primitive volcanic arc settings. Mafic rocks are usually basaltic
and tholeiitic (can be transitional to calc-alkaline), while felsic rocks have a rhyolitic composition or
transitional with calc-alkaline rhyolites. Noranda (Quebec) and Kidd Creek (Ontario) are the two main
examples of this “bimodal-mafic” type, although Kidd Creek is atypical due to its ultramafic footwall.
The “mafic-siliciclastic” VMS type has identical proportions of mafic or intrusive rocks and siliciclastic
(turbidites); in this VMS type, felsic rocks occur in small amounts or may even be absent from the
hosting sequence. The Besshi deposit in Japan is one land-based example of this VMS type, similar to
the VMS occurrences in the rifted continental margin in the Gulf of California, the Middle Valley rift,
or in the Escanaba trough at the northeast Pacific Ocean, or in the Atlantis II deeps of the Red Sea.
The “bimodal-felsic” VMS type is characterised by a higher content of felsic volcanic rocks (>50 %) in
comparison with siliciclastic rocks (<15 %) in the volcano-stratigraphic hosting sequence; mafic rocks
usually complete the hosting sequence. Like in “bimodal-mafic” VMS deposits, deposits hosted in
“bimodal-felsic” sequences share the same age distribution, but are more abundant in Phanerozoic times,
usually related to more compositionally mature volcanic arcs, or rifted volcanic arc settings than the
“bimodal-mafic” VMS types. High-silica rhyolite compositions are common in the felsic host rocks with
calc-alkaline to transitional affinities, while the mafic rocks comprise calc-alkaline or transitional
tholeiitic to calc-alkaline rocks. This VMS type contains, in average, higher contents of Zn and Ag in
comparison with all the other VMS types (Barrie and Hannington, 1999).
The last type of VMS deposit is the “bimodal-siliciclastic” which has equivalent proportions of volcanic
rocks (usually felsic rocks are much more abundant than mafic) and siliciclastic rocks. These deposits
are usually found in belts of Phanerozoic age (like the Iberian Pyrite Belt, Portugal and Spain). Some
authors refer that the felsic volcanic hosting rocks are generally calc-alkaline; however, this
compositional feature is usually due to crustal assimilation and that is consistent with continental arc or
rifted continental arc settings. Tholeiitic basalts are the common mafic rocks in this type of VMS deposit,
however there are exceptions like in the Iberian Pyrite Belt where alkaline basalts are found in higher
levels of the stratigraphic sequence. The “bimodal-siliciclastic” VMS deposits have the lowest contents
in Cu and the highest in Pb, but are the largest in size in comparison with all the remaining VMS types
(Barrie and Hannington, 1999).

Ore mineralogy and geochemistry of the Mandoos Volcanic Massive Sulphide (VMS) deposit, Sumail Ophiolite, Oman
10
2.2.1 Ophiolite-Hosted Volcanogenic Massive Sulphide Deposits
Ophiolite-hosted VMS deposits are “mafic type” deposits, also commonly referred as Cyprus type,
normally displaying a shape similar to those modern analogues found in massive sulphide mounds. They
often display an elongated shape instead of equidimensional, reflecting the strong structural control set
by fault zones in hydrothermal-mineralising venting. The footwall contact has usually a concave shape,
while the hanging wall is flat, outlining a long-term exposure on the seafloor that tends to flatten the
upper surface of the massive sulphide deposit. The massive sulphide lens formed along half grabens or
adjoining listric fault zones are usually thicker in one flank and thinner towards their width. The lens
comprises breccia and pyrite sands, covered by Fe-rich oxidized sediments (ochres) (Galley & Koski,
1997).
The root of most of massive sulphide deposits goes tens of meters below the paleo seafloor where a
discrete stockwork cuts the basaltic host rock and promotes the long-lived flow of hydrothermal(-
mineralising) fluids responsible for the observed alteration halo (chlorite-quartz-pyrite). The sulphide
stockwork is composed of small and irregular, anastomosed veins/veinlets in a chlorite-quartz
groundmass (lower part) but, below the massive sulphide lens, the veins increase in size giving rise to
in situ breccias. Recurrent rejuvenation of permeability, due to cyclic build-up of fluid pressure,
promotes the development of spaces than can be filled with sulphides, forming small massive sulphide
lenses. In the upper stockwork, basalts are silicified whereas at the base of some ore lenses sulphide-
quartz breccias may develop (Galley & Koski, 1999).
There is a gradual contact (several meters) between the stratiform massive sulphide lens and the top of
the stockwork, where the veins coalesce to form the massive sulphide lens leaving altered basalt
fragments isolated and almost indistinct towards the core of the lens. Those orebodies are normally
massive, made up of fine-grained granoblastic to idiomorphic pyrite, with abundant vuggy cavities lined
by idiomorphic pyrite. Veins of colloform to sandy sulphides cut the massive sulphide that appears more
brecciated upwards. The blocks (cemented by “sandy” sulphide) are normally colloform banded
sulphide; however, some blocks of chalcopyrite aggregates are present in a matrix of pyrite and quartz.
These blocks might correspond to fragments of high temperature sulphide chimneys; some worm
burrows (tube-worms) were identified indicating that some of the breccias might correspond to sulphide
chimneys. The sulphide lenses become less consolidated towards the top and are commonly covered by
layered Fe oxides sediments (ochres) composed of goethite, natro-jarosite, jarosite, hematite, maghemite
and magnetite; these sediments may include some interlayered graded beds of “detrital” sulphide and
tend to be confined to direct contact with the massive sulphide lenses whereas jaspers (commonly
radiolarian-bearing) are not so restrict. The jaspers are thought to be formed from pelagic and
hydrothermal chemical-sediments while ochres from in situ weathering of the underlying sulphide,
although some authors suggest that this type of Fe-oxide deposits are formed from subaerial weathering
(Galley & Koski, 1999).
Pyrite is the main sulphide mineral in this type of ores, being chalcopyrite and sphalerite the second
most abundant sulphide minerals. These deposits can also include marcasite, cubanite, covellite, bornite,
digenite, chalcocite, galena, pyrrhotite, idaite, bravoite, carollite, and mackinawite, with minor amounts
of magnetite and hematite. The most common gangue components are quartz and gypsum. Referring to
the ochre caps, these include goethite, jarosite, amorphous oxides, hematite and rare native gold. The
veining system of the stockwork consists mainly of pyrite and quartz-pyrite, being the pyrite present in
disseminations throughout the chloritized and silicified host lavas; it is in these silicified zones that the
chalcopyrite veins are mostly concentrated. Pyrite in pyrite veins are commonly fine-grained
granoblastic to idiomorphic (with small amounts of chalcopyrite and sphalerite forming inclusions and
fracture infillings) while in quartz-pyrite veins, the sulphide is usually corroded and replaced by quartz

2. Geological Setting
11
and/or chalcedonic silica, being the latter more common at the top of the stockwork. In general, the
mineral assemblage forming the base of the lens is pyrite-silica breccia, where pyrite and chalcopyrite
are surrounded and partially replaced by silica. On top, a massive pyrite facies of fine-grained
(idiomorphic to subhedral) pyrite; this pyrite is commonly zoned, with inclusions of pyrrhotite,
chalcopyrite, magnetite, cubanite and Fe-rich sphalerite (Galley & Koski, 1999). Colloform banded
veins commonly cut the base of the massive pyrite, although these colloform textures are more abundant
in the breccia zone. The colloform veins and rims are composed of interlayered pyrite, marcasite,
chalcopyrite, sphalerite, and quartz, where chalcopyrite veining increases towards the top of the lens.
Covellite, chalcocite and digenite are secondary copper minerals and are mostly present below the Fe
oxide ochre cap, although they can be found in the entire orebody replacing chalcopyrite (Galley &
Koski, 1999).
2.2.2 VMS Deposits in Oman
Volcanogenic massive sulphide deposits are mostly found in the northern part of the Oman Mountains ,
within the volcanic lavas sequence. Early evidence of mining is from the Bronze Age and Islam rise,
mostly focused on secondary copper minerals found below strongly oxidised (superficial) caps (Lippard
et al., 1986). Lasail, Bayda and Aarja in the Sohar district were the first mines where primary
chalcopyrite-bearing massive sulphides were exploited between 1983 and 1993; Lasail was the largest
deposit, producing 9.2 Mt of ore at 1.42 wt% copper. From 1994 to 2005, the iron-hats of Yanqul were
mined for gold, but since 2000 many important discoveries have been made, and Hatta, Shinas, Safwa
and Mandoos were mined by Mawarid Mining L.L.C.
Fig 2. 6 – Simplified geological map displaying the location of a large number of deposits within the volcanic units
represented as in figure 2.1.
The 50 Mt total tonnage of the Sumail deposits are not comparable with other VMS districts around the
world (Franklin et al., 2005) but is in the same range indicated for the Troodos ophiolite VMS deposits.
Ore mineralogy and geochemistry of the Mandoos Volcanic Massive Sulphide (VMS) deposit, Sumail Ophiolite, Oman
12
The Geotimes/Lasail contact and to a lesser extent the Geotimes/Alley contact were thought to be the
main ore horizons, corresponding to the paleo-seafloor where the sulphide mounds were formed;
however, some of the later discoveries do not fit this simplified model of occurrence (Gilgen et al, 2014).
2.2.3 The Mandoos Deposit
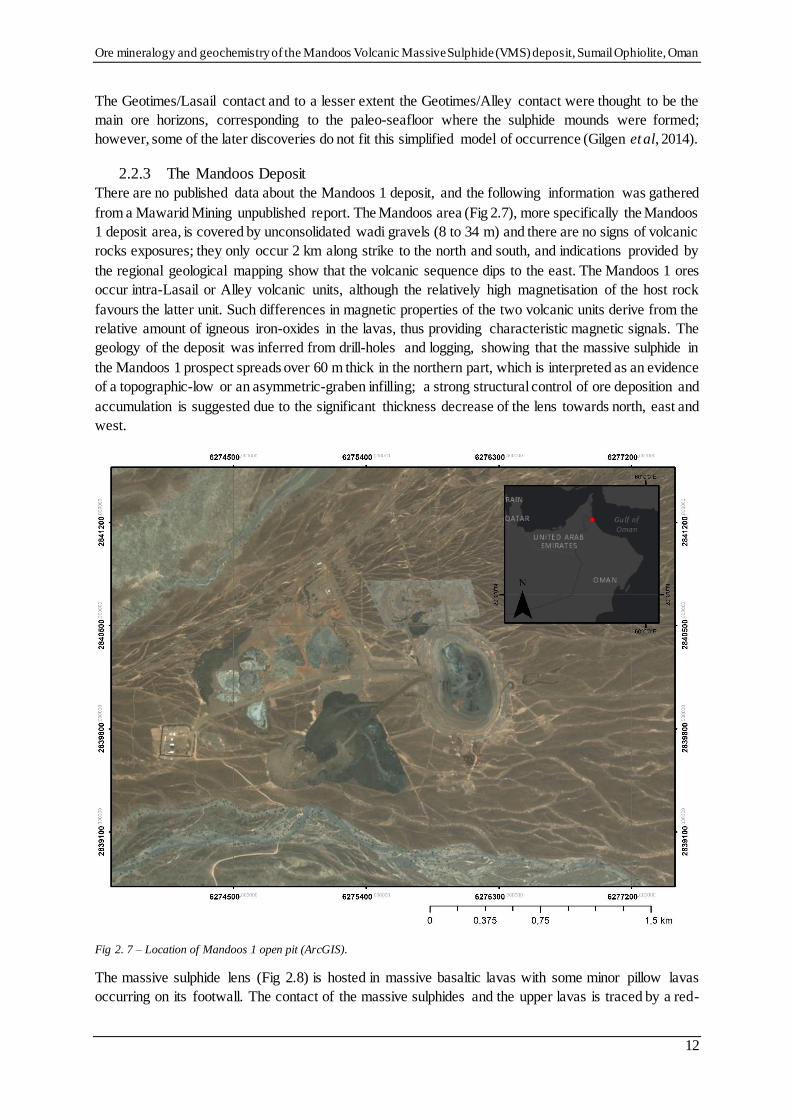
There are no published data about the Mandoos 1 deposit, and the following information was gathered
from a Mawarid Mining unpublished report. The Mandoos area (Fig 2.7), more specifically the Mandoos
1 deposit area, is covered by unconsolidated wadi gravels (8 to 34 m) and there are no signs of volcanic
rocks exposures; they only occur 2 km along strike to the north and south, and indications provided by
the regional geological mapping show that the volcanic sequence dips to the east. The Mandoos 1 ores
occur intra-Lasail or Alley volcanic units, although the relatively high magnetisation of the host rock
favours the latter unit. Such differences in magnetic properties of the two volcanic units derive from the
relative amount of igneous iron-oxides in the lavas, thus providing characteristic magnetic signals. The
geology of the deposit was inferred from drill-holes and logging, showing that the massive sulphide in
the Mandoos 1 prospect spreads over 60 m thick in the northern part, which is interpreted as an evidence
of a topographic-low or an asymmetric-graben infilling; a strong structural control of ore deposition and
accumulation is suggested due to the significant thickness decrease of the lens towards north, east and
west.
Fig 2. 7 – Location of Mandoos 1 open pit (ArcGIS).
The massive sulphide lens (Fig 2.8) is hosted in massive basaltic lavas with some minor pillow lavas
occurring on its footwall. The contact of the massive sulphides and the upper lavas is traced by a red-

2. Geological Setting
13
brown umber layer. A gossanous zone is also present where the lens was exposed to weathering, mostly
in the transition from the mineralised volcanic rock and the unconsolidated wadi gravels.
As in most of the ophiolite-hosted deposits, pyrite is the dominant sulphide in Mandoos 1 deposit, with
minor chalcopyrite and sphalerite. Chalcopyrite normally concentrates in the upper levels of the massive
sulphide lens, and the higher copper grades together with some anomalous contents of Au, Ag and Zn
outline the transition zone towards the iron-hat cover, strongly suggesting the progression of late
(supergene?) enrichment processes. In the footwall of the lens there is a clay-silica-pyrite alteration
zone, which appears to be more extensive towards the north and west and thin towards the south. The
ore in this deposit can be subdivided in three types: (i) the massive sulphide zone that comprises more
than 90% pyrite and late-formed chalcopyrite; (ii) the silica massive sulphide zone that occurs only in
short (and discontinuous) intersections; and (iii) the stockwork hosted in a silica-clay altered basalt
placed below the central part of the lens and showing a pyrite-quartz-jasper association, usually poor in
copper.
Many different diachronic alteration events are recorded. Hematite-rich alteration is preserved in basalts
showing also evidence of carbonate alteration as veinlet infillings preceding the main mineralising event.
As referred before, the transition zone between the massive sulphide lens and the gossan cover is where
the higher grades of copper are found; that enrichment is mostly due to the alteration of chalcopyrite to
chalcocite, bornite and covellite. Synchronous with the massive sulphide formation a chlorite (+quartz)
alteration occurs and is best seen along the “chilled margins” in pillow lavas.
Fig 2. 8 – Cross-section of the ore body showing the relative position of the stockwork and the gossan cover (Mawarid
Mining, 2014).


3. Methodologies
15
3. Methodology
3.1 Sampling
The sampling survey comprised two different phases. The first one took place throughout the east-wall
of the Mandoos Mine open pit, granted to the Mawarid Mining Company; the second phase involved
six drill-cores provided by the same company, after their previous re-logging.
The sample labelling distinguishes the survey phase. Samples from the open pit were labelled with MD,
initials for Mandoos, followed by the profile reference (P1, P2, P3 and P4) and sample number. Labels
of drill-core samples comprise the original reference given to drill holes and the depth where the sample
was collected, besides the MD initials.
The first sampling phase was performed by Dr. Ana Jesus in May 2015 and includes samples from the
massive sulphide orebody and metalliferous sediments. This discrete sampling programme along the
east-wall of the open pit (from the central part of the deposit towards south) allowed collecting 24
specimens (Appendix I).
Fig 3. 1 – First sampling survey along the open pit east wall, illustrating the location of the 4 sampled profiles and some
other collected samples.

Ore mineralogy and geochemistry of the Mandoos Volcanic Massive Sulphide (VMS) deposit, Sumail Ophiolite, Oman
16
The second phase of the sampling survey was performed in March, 2016. The selected six drill holes
are not restricted to the ore body exposed in open pit, and embrace outskirt domains of the mineralised
area as illustrated in Figure 3.2. According to the available data, cores from drill hole MD174 should
represent the north-western part of the ore body, while those from MD150 and MD178 should
characterise its central domain; samples from MD429, MD430 and MD431 drill holes represent the
south-estern part of the deposit, outside the open pit. The sampling programme was targeted to
intersected segments of the ore lens, embracing cores of massive sulphide segments, mineralised jaspers
and metalliferous sediments (umbers and ochres). Due to the poor core preservation, the spatial
representativeness of sampling might be compromised in certain parts of the section; indeed, the
majority of ore segments in drill holes display evidence of significant crumbling and/or variable
mingling, or show effects of strong weathering, being covered by sulphate crusts of irregular thickness.
The best approach was to collect all the well-preserved and less-altered specimens throughout the six
drill cores, totalling 18 samples and resulting in a combined collection of 42 samples: 27 of massive
sulphides, 6 of mineralised jaspers, 5 of metalliferous sediments and 4 of a mineralised silicified basalt.
Fig 3. 2 – Drill holes location at Mandoos 1; the red mark represents the drill holes sampled in this work (second survey);
information from drill holes marked with the reference was used in the modelling exercise. Black line represents NW-SE
cross section. shown in Fig 4.4, 4.5 and 4.6.

3. Methodologies
17
3.2 Sample Preparation
Sample preparation took place between May and September, 2016, using the facilities available at the
Sultan Qaboos University (SQU) and the Faculty of Sciences of the University of Lisbon (FCUL). The
first steps of sample preparation were made in SQU due to the impossibility to export rock samples out
of Oman.
3.2.1 Thin and Polished Sections Preparation
A large number of polished thin sections and mounts were made, according the usual procedures, as
follows:
a) The samples were cut with a diamond saw considering the surface chosen for further
petrographic analysis; the slabs should get the size to fit the glass for thin sections, or to fit the
mounts cup.
b) Mount samples were placed into cups, further filled with epoxy resin and then placed into a
vacuum chamber hoven for resin settling.
c) To prepare thin sections, the slabs were glued onto unpolished glasses; slab surfaces were
previously flattened in an automatic plate using 600 mesh silicon carbide powder. After being
glued, the samples rested in a heated press for resin settling.
d) All the thin section samples were trimmed with a diamond precision saw, and only about 0.5mm
thick of rock was left glued on the glass.
e) The lapping is one of the critical steps to get good results before polishing, and this process
differs for thin sections or mounts. For thin sections the mechanism is completely automatic but
the good results will depend on the good calibration of the machine. The samples were placed
on a jig and the lapping was done in a plate using 600 mesh silicon carbide powder until the
thickness of a bit more than 30 μm was reached. The lapping of the mounts was completely
handmade, involving a sequence of steps to decrease the grid size and to get the best surface to
polish. It started with a 220 mesh diamond plate followed by the 600 mesh diamond plate. After
the diamond plate the samples were lapped on a glass surface using silicon carbide powder,
starting with 800, then 1000 and finally 1200 mesh.
f) The other critical step is the polishing; it was done automatically but, like the lapping, a precise
calibration was critical for good results. Both sample types, thin sections and mounts, were
polished using the same method. They were polished using a cloth plate impregnated with
diamond paste and lubricant. A series of different grain size diamond paste were used, starting with 14 μm (only for thin sections), 6 μm, 3 μm and finishing with 1 μm.
3.2.2 Powders for Whole-rock Multi-element Analysis
All the samples selected for whole-rock geochemistry were identically processed following the common
approach; i.e.:
a) The samples were cut in thin slabs using a diamond saw.
b) The surfaces of all slabs were smoothed with emery to remove traces of ink, weathering and
contamination from the saw blade.
c) The size reduction of slabs was made by hammering the samples wrapped in white paper, to
avoid contact with the hammer and the metal base.
d) When necessary, a Cr-hardened steel roll mill was used for size reduction of samples; this step
was only used when hammering was not enough to reduce the sample to the desired size.
e) Powdering of all samples using an agate ring mill anytime the sample weight was between 100
and 120 gr; when that weight of sample was not achieved, a smaller agate ball mill was used instead.

Ore mineralogy and geochemistry of the Mandoos Volcanic Massive Sulphide (VMS) deposit, Sumail Ophiolite, Oman
18
The rock powders obtained through this process were also used to produce pressed-powder pellets for
XRF.
3.3 Analytical Procedures and Conditions
3.3.1 XRD
XRD analyses were performed in some samples to complement petrography whenever microscopy did
not allow to clearly identify some mineral phases. The samples (a fine powder) were prepared at SQU
facilities and placed on a spinning single-crystal silicon sample holder. The XRD record, measured at a
step size of 0.0167° (2ϑ), was acquired with a X' Pert PRO X-ray Diffraction machine from Panalytical
that used a Cu-Kα radiation (1.54060 Å) and was set to 40 mA and 45 kV. The data was further assessed
with the “High Score Plus” software.
3.3.2 Portable EDXRF
During re-logging and sampling, a portable XRF was used at SQU facilities, as an auxiliary tool during
macroscopic sample characterisation. A Niton XL3t 950 Handheld XRF Analyzer (Thermo Scientific),
calibrated with laboratory test standards and equipped with a SDD GOLDD+ detector and a Ag anode
X-ray tube (excitation voltage 50 kV, 200 mA, 2 Watt), was used in such approach. The instrument self-
calibrates on an internal standard whenever the machine is switched on. No sample preparation is
required since the beam is shot directly onto the sample area to be analysed.
3.3.3 Whole Rock WDXRF
One alternative to get WDXRF data consists of prepare in advance powdered samples with a flat surface.
The preparation of pressed-powder pellets involved the following steps:
a) One pellet requires 12 g of rock powder, being that the average weight measured for all samples. b) In a mortar, the sample was mixed with a mixture of acetone and elvacite (polymer), carefully
mixed until reaching total homogenisation. c) The sample holder was placed in a press, and the sample placed in the holder with a tube and a
cylinder to slightly press it. d) A perfect flat lid is placed onto the sample and pressure is slowly applied, allowing time for the
volatiles to escape and the polymer to settle. This procedure is done twice after carefully rotating the sample holder for another position.
All measurements were carried at the Aveiro University facilities using an Axios equipment from Panalytical with a rhodium ampoule. The analytical error for major elements is 2% of the measured
value, while minor and trace elements detection limits are available in Appendix II.
3.3.4 Whole Rock ICP-MS
The acquisition of minor and trace elements took place at the Géosciences Environnement Toulouse
laboratory (Observatoire Midi-Pyrénées), Université of Toulouse III, via HR-ICP-MS ELEMENT XR
and using the procedure described by Barrat et al. (2007). A HF-HClO4 digestion (Yokoyama et al.,
1999) with Tm addition (Barrat et al., 1996) was used to prepare the samples. After the acid digestion,
the samples were diluted and analysed to obtain all minor and trace element concentrations. Analytical
blanks were subtracted to BHVO2 and samples cps; so, if the blank is higher than the signal, the
calculated concentration is negative and cancelled. Instrumental detection limits, analytical and total
procedural blanks can be consulted in Appendix III.

3. Methodologies
19
3.3.5 Electron Probe Micro Analysis
All mineral chemistry analyses were produced on polished mounts covered by a thin carbon coating (20
nm) at FCUL facilities. The instrument used in this stage was a JEOL-JXA 8200 Micro Probe, equipped
with four wavelength-dispersive spectrometers (WDS), six analysing crystals (LIF, LIFH, PET, PETH,
TAP and LDED2) and secondary and retro-diffused electron detectors coupled to an energy-dispersive
spectrometer (EDS). The measurements were performed with a 5 µm diameter beam, a 25 nA current
and an accelerating voltage of 15 kV. In routine, the acquisition time for peaks was 20 s and 5 s for
background radiation. The standards used and the detection limits for all measured elements are listed
in Appendix IV and Appendix V, respectively.


4. Model for the Mandoos 1 Deposit
21
4. Model for the Mandoos 1 Deposit
4.1 The Tridimensional Modelling of Mandoos 1 Deposit
The 3D model of the Mandoos 1 deposit was built using the data provided by Mawarid Mining and the
MICROMINE software. The starting database includes data from 33 drill-holes (see figure 3.2): 29
along the pit zone, one located 1 km north from the pit, and the last three placed 250 m SE from the pit
(the last drill-holes were performed during one of the latest exploration surveys done by the company).
The 29 drill-holes are distributed in a regular 50 m x 50 m square grid.
The data were organised in collar, survey, assay and lithology. Collar data includes geographical
coordinates, altitude and drill-hole length (DHL), besides the bore-hole ID (BHID). Survey data includes
depth, azimuth and dip values. Assay data comprise concentration values of Cu, Zn and Fe in weight
percentage (wt%) and Au and Ag in parts per million (ppm) linked to a particular depth. The lithology
data includes the depth where a given lithology intersected by drill-hole starts and ends, and the
lithological information. The Mawarid Mining also provided STRING files containing the pit design
and sections of the ore-body.
This complete database is essential to build the 3D model, and its organisation is a key factor to easily
insert the data on MICROMINE. Collar and survey data will allow placing the drill-holes, while assay
and lithology data will let assigning grades and lithology along them. The STRING file for the pit design
was used to model the shape of the pit and site; a digital landscape model (DTM) was created from the
pit design file in addition with a geo-referenced image of the site extracted from Google Earth. In
addition, the STRING file with the sections of the ore-body allowed to locating the orebody using not
only the information gathered from the 33 drill-holes, but also from all the drills done by the company
in the Mandoos 1 deposit.
Fig 4. 1 - Pit design with implanted drill cores and the orebody extension.

Ore mineralogy and geochemistry of the Mandoos Volcanic Massive Sulphide (VMS) deposit, Sumail Ophiolite, Oman
22
Figure 4.1 illustrates the N-S aligned pit, with 620 m length and 390 m width; its depth increases towards
south where it reaches 160 m, 60 m more than the deepest part of the north sector. The massive sulphide
body has 550 m long and up to 370 wide; the average width is around 200 m. The massive sulphide lens
varies in thickness from less than 1 m to a maximum of 90 m recorded in the northern sector of the
deposit. The lens shows also a general NW-SE elongation dipping moderately towards SE.
4.1 Grades and Tonnage
Using the implicit modelling tool from MICROMINE, which uses simple kriging as the interpolation
method, it was possible to model the Cu and Zn grades in the orebody. The buffer used in the
interpolation was 75 m, i.e.1.5 x the spacing between drills (50 m). Also, a colour code was given to the
elements, red was used for Cu while blue was assigned to Zn. A colour grading, from light to dark
colours, represents lower and higher grades. The limits used to define the cut-off grade for the colour
coding were the minimum, first quartile, median and third quartile; however all analyses below the mine
cut-off grade (0.3 wt% Cu) were previously excluded.
Fig 4.3 displays Cu and Zn grades distribution along the deposit, respectively; image (A) in both figures
represents the higher grades with a cut-off defined by the third quartile of the concentration distributions,
i.e. 2.44 wt% for Cu and 0.44 wt% for Zn. It is worth noting that the south sector is the most enriched
in these elements, more precisely in section 2732850mN (drill-hole MD150 – Fig 3.2) where the two
elements are largely overlapped, suggesting the lacking of significant metal zonation. The central sector
of the deposit also shows Cu- and Zn-enriched zones (Section 2733000mN – Fig 3.2), but in this case
an evident separation exists: a Cu-rich zone (MD071) to the east and a Zn-rich zone to the west
(MD020). Along the two drill-holes that crosscut these two distinct zones there is no firm evidence for
metal zonation, as can be seen in the sections in Appendix VI. The same can also be inferred from the
NW-SE cross section along the lens alignment (see Fig 3.2), Fig 4.4 and Fig 4.5 show the Cu and Zn
variations, respectively, along the ore body. As can be seen, the overlapping of Cu-rich and Zn-rich
zones is recorded all over the entire lens. It is also clear that the north sector of the deposit is where the
highest thickness of the ore-body is observed (Fig 4.6); however, this thick accumulation of sulphides
do not display the highest grades. Due to the ore lens morphology and some evidence for NW-SE (to
N-S?) fault zones, this thicker domain of the ore-body is interpreted as a hemi-graben filled with massive
sulphides (Fig. 4.2).
Fig 4. 2 – North sector fracture network and massive sulphide lens E-W cross-section showing the fault-related
displacements consistent with a hemi-graben morphology.
40m

4. Model for the Mandoos 1 Deposit
23
Fig
4.
3 – L
EF
T -
MIC
RO
MIN
E im
plici
t m
odel
ling f
or
Cu d
istr
ibuti
on b
y cu
t-off g
rade;
(A
) 2.4
4 w
t%, (B
) 0.8
8 w
t%, (C
) 0.5
wt%
and (
D)
0.3
wt%
(m
ine
cut-
off g
rade.
RIG
HT
-
MIC
RO
MIN
E im
plici
t m
odel
ling f
or
Zn d
istr
ibution b
y cu
t-off g
rade;
(A
) 0.4
4 w
t%, (B
) 0.1
5 w
t%, (C
) 0.0
9 w
t% a
nd (
D)
0.0
1 w
t%.
B D
A
B
D
C
A
C

Ore mineralogy and geochemistry of the Mandoos Volcanic Massive Sulphide (VMS) deposit, Sumail Ophiolite, Oman
24
Fig
4. 4 -
Cu g
rades
dis
trib
ution a
long N
W-S
E s
ection
(se
e F
ig.
3.2
)..
Fig
4. 5 -
Zn g
rades
dis
trib
ution a
long N
W-S
E s
ection
(se
e F
ig.
3.2
).
0.3
0 w
t%
0.5
0 w
t%
0.8
8 w
t%
2.4
4 w
t%
Cla
s
0.0
1 w
t%
0.0
9 w
t%
0.1
5 w
t%
0.4
4 w
t%
Cla
s
Zn

4. Model for the Mandoos 1 Deposit
25
The Mawarid’s engineers assessed in Mandoos 1 a total resource of about 8 Mt of Cu-rich massive
sulphide ore (mine cut-off grade = 0.3 wt% Cu), including ca. 5 Mt in reserves with 1.8 wt% Cu
(Mawarid Mining, 2014; Rob Willis, pers. com. to Ana Jesus, February, 2015). The orebody (Fig 4.6)
volume calculation revealed a total value of 1.8 M m3. Assuming a typical composition of about 80%
pyrite, 12% quartz, 5% chalcopyrite and 2% of sphalerite, and knowing that the respective densities are
4.8 g/cm3, 2.65 g/cm3, 4.1 g/cm3 and 3.9 g/cm3, the massive sulphide lens comes out with an average
density of 4.44 g/cm3 and total tonnage of 7.99 Mt. The average grade of 1.8 wt% Cu reported by the
company is also obtained by a simple mean calculation of all Cu values above the mine cut-off grade;
however when weighted, the average grade drops to 1.72 wt% Cu.
Fig 4. 6 - NW-SE section of the Mandoos massive sulphide lens.


5. Petrography
27
5. Petrography The present section of the work summarises the main mineralogical and textural features displayed by
sulphide ores (including mineralised basalts), metalliferous sediments (umber and ochres) and jaspers
(massive sulphide mineralised jaspers and manganese jasper) at microscale, using reflected and
transmitted light microscopy. Complementary EPMA information and additional macroscopic (hand
sample) evidence will also be locally included.
5.1 Sulphide Ores
Samples of massive sulphides s.s. are not common in this deposit. Actually, throughout all the sampling
survey there was no evidence of real massive sulphides; the ores normally occur as heterometric breccias
(Fig. 5.1). Texturally, these breccias are quite regular, with the exception of some cases comprising
fragments that display wider textural diversity. The presence of pyritised (transversal and longitudina l)
cross-sections of tubeworms (polychetae) is worth noting (Fig. 5.2 – 1, 2), placing the examined samples
in the black-smokers environment (MD-P2-3-2). A large number of samples consist of poorly calibrated
breccias mainly composed of pyrite clasts (Fig. 5.1). Their formation is possibly a result of successive
mass-wasting events occurring at the sea-mounds. The clasts can vary from small, single, fractured,
(sub)euhedral grains to large fragments of massive aggregates. These can differ in composition or in
texture, pyrite being the most common example.
Samples from “massive sulphide ores” show a monotonous mineral assemblage, comprising a small
number of different mineral phases. They are mainly composed of recrystallised pyrite, having
chalcopyrite, marcasite and sphalerite as common accessory minerals; Cu-rich phases are also present
in some samples and quartz, laumontite and phyllosilicates are the usual gangue-forming phases.
Primary textures are common among the clasts: round to long colloform clasts (Fig. 5.2 - 4, 5, 6, 7) and
framboidal masses (Fig. 5.3 – 3) are seen throughout the breccias, usually associated with chalcopyrite ,
occurring as replacements of former pyrite grains. Often recrystallised, the cores of pyrite aggregates
also preserve primary textures such as framboidal and colloform; wherever these clasts do not show
preserved primary textures, it becomes difficult to distinguish between the recrystallised and a second
generation of pyrite. All these structures appear to be replaced or filled by chalcopyrite ± bornite ± Cu-
rich phases; usually, the alteration starts at the crystal borders and creates a Cu-rich ramification
structure that sometimes partly obliterates all the primary texture (Fig. 5.3 – 7). Clasts, presumably
related to hydraulic brecciation, are also frequent and these can vary in size, but normally are coarse-
sized clasts composed mostly of recrystallised pyrite, crisscrossed by a network of late quartz-veins
showing a jigsaw fit texture, being the surroundings of the veins more recrystallised.
Pyrite clasts (varying from euhedral crystals to large masses) are typical, but marcasite, chalcopyrite and
sphalerite clasts can also be seen. Pyrite shows distinct occurrence modes, being the most common as
euhedral recrystallised masses where a growth zonation (or banding) is evident, usually decorated by
small inclusions of sphalerite (Fig. 5.2 – 8) and rarely by chalcopyrite inclusions. The growth zonation
is often traced by alternation between well-recrystallised pyrite and porous pyrite. In some samples,
euhedral pyrite displays vuggy arrangements. Marcasite can be seen more rarely as coarse euhedral grain
masses (Fig. 5.3 – 2), displaying colloform textures and more often as masses (usually surrounded by
pyrite) partly replaced by chalcopyrite. Chalcopyrite occurs as large masses, being replaced by bornite
and other Cu-rich phases, and as clear masses/crystals with sphalerite inclusions.
Some samples show a platy chalcopyrite in quartz and phyllosilicates veins and it can also be observed
in crack-infillings affecting pyrite. Usually the cement of these breccias comprise quartz and

Ore mineralogy and geochemistry of the Mandoos Volcanic Massive Sulphide (VMS) deposit, Sumail Ophiolite, Oman
28
phyllossilicates, or a mixture of quartz and small pyrite grains (“pyrite sands”); nevertheless laumontite
also occurs, often as an accessory phase in the cement and as part of the mineral infillings of open spaces
in large masses of pyrite and chalcopyrite.
The sample MD-P3-4-1 is an exception, displaying a carbonate cement. Similarly, the sample MD-NP-
1 is characterised by a particular texture, where large sphalerite masses containing numerous oriented
chalcopyrite (triangular) inclusions can be interpreted as a primary texture (Fig. 5.3 - 5), by analogy to
what is commonly displayed by black-smokers. The sphalerite masses are inter-grown/filled with
laumontite and is locally replaced by bornite, as happens with co-existent chalcopyrite. The Zn-rich
zone contacts with a Cu-rich zone, where some sphalerite can be seen replaced by chalcopyrite (?). In
these samples, some of the chalcopyrite masses are also inter-grown with laumontite; these late infillings
also contain pyrite, marcasite and fine-grained sphalerite. The MD-NP-1 sample also includes skeletal
wurtzite (paramorphic sphalerite) infilled/altered by iron sulphides taking advantage of the space
between crystals. Platy crystals of wurtzite forming well-developed elongated prismatic aggregates
crystallised in open spaces (infilled with laumontite) can also be locally observed (Fig. 5.3 – 4).
Fig 5. 1 - Hand Samples: A – MD-NP-1 – Zn-rich ore, sphalerite and chalcopyrite rich ore with late laumontite infillings; B
– MD-P3-4-1 – massive sulphide breccia mainly composed of pyrite clasts cemented by carbonates; C – MD-P2-3-2 – massive
sulphide breccia cemented by silica and phyllosilicates, characterised by preserved primary textures, including pyritised
tubeworms; D - MD178-128.80 – massive sulphide breccia cemented by silica and crosscut by large sphalerite rich vein; E,
F, G, H – samples of massive sulphide breccias displaying a silica rich cement. The graphic scale bar is 2 cm.

5. Petrography
29
B C
D
HGF
E
A

Ore mineralogy and geochemistry of the Mandoos Volcanic Massive Sulphide (VMS) deposit, Sumail Ophiolite, Oman
30
Fig 5. 2 – Microphotography - 1 - Tubeworm preserved in the second generation of Py and Ccp intergrowths – RL – PPL; 2
– Pyritised tubeworms (various sections) in a cement enriched in silica and phyllosilicates – BSE; 3 – Massive sulphide breccia
texture displaying Py, Ccp and Sp clasts – RL – PPL; 4 – Colloform Py intergrowth with silica displaying some hydraulic
brecciation – RL – PPL; 5 – Py breccia showing recrystallised clasts and clasts displaying primary textures (colloform) – RL
– PPL; 6 – Colloform Py preserved in recrystallised mass – RL – PPL; 7 – Colloform marcasite being replaced by Ccp – RL – PPL; 8 – Py displaying growth zonation marked by Sp inclusions. The graphic scale bar is 400 μm in RL and TL
microphotography and 200 μm in BSE images.

5. Petrography
31
Fig 5. 3 – Microphotography - 1 - Mrc growing around framboidal Py – RL – PPL; 2 – Coarse grain euhedral Mrc intergrowth
with silica – RL – PPL; 3 – Framboidal Py clast being replaced by Ccp, Cu-rich phases oxidising Ccp – RL – PPL; 4 –
Prismatic Wur infilled with Lmt – RL – PPL; 5 – Sp displaying crystallographically oriented Ccp inclusions and infilled
together with Lmt – RL – PPL; 6 – Sp and Ccp intergrowths – RL – PPL; 7 – Clast showing “shattered” texture due to Ccp
and Cu-rich phases alteration – BSE; 8 – Wur (prismatic sections) with Ccp inclusions in Py clasts – RL – The graphic scale
bar is 400 μm in RL and TL microphotography and 200 μm in BSE images
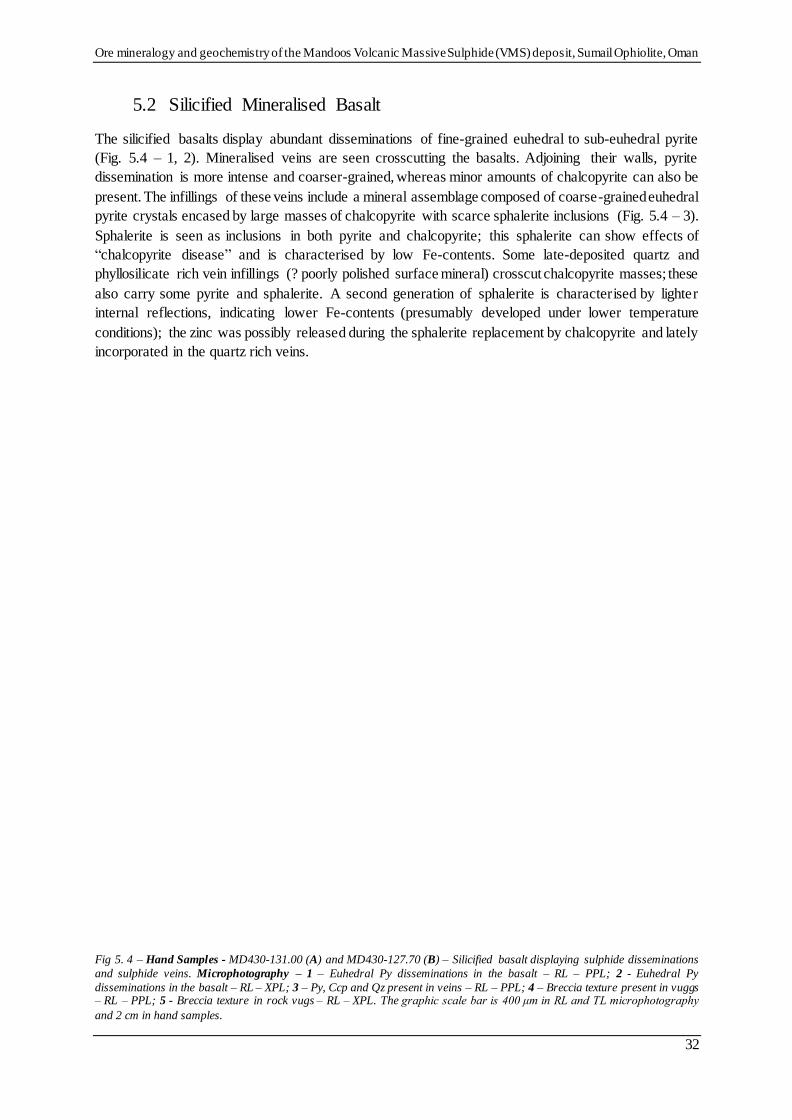
Ore mineralogy and geochemistry of the Mandoos Volcanic Massive Sulphide (VMS) deposit, Sumail Ophiolite, Oman
32
5.2 Silicified Mineralised Basalt
The silicified basalts display abundant disseminations of fine-grained euhedral to sub-euhedral pyrite
(Fig. 5.4 – 1, 2). Mineralised veins are seen crosscutting the basalts. Adjoining their walls, pyrite
dissemination is more intense and coarser-grained, whereas minor amounts of chalcopyrite can also be
present. The infillings of these veins include a mineral assemblage composed of coarse-grained euhedral
pyrite crystals encased by large masses of chalcopyrite with scarce sphalerite inclusions (Fig. 5.4 – 3).
Sphalerite is seen as inclusions in both pyrite and chalcopyrite; this sphalerite can show effects of
“chalcopyrite disease” and is characterised by low Fe-contents. Some late-deposited quartz and
phyllosilicate rich vein infillings (? poorly polished surface mineral) crosscut chalcopyrite masses; these
also carry some pyrite and sphalerite. A second generation of sphalerite is characterised by lighter
internal reflections, indicating lower Fe-contents (presumably developed under lower temperature
conditions); the zinc was possibly released during the sphalerite replacement by chalcopyrite and lately
incorporated in the quartz rich veins.
Fig 5. 4 – Hand Samples - MD430-131.00 (A) and MD430-127.70 (B) – Silicified basalt displaying sulphide disseminations
and sulphide veins. Microphotography – 1 – Euhedral Py disseminations in the basalt – RL – PPL; 2 - Euhedral Py
disseminations in the basalt – RL – XPL; 3 – Py, Ccp and Qz present in veins – RL – PPL; 4 – Breccia texture present in vuggs – RL – PPL; 5 - Breccia texture in rock vugs – RL – XPL. The graphic scale bar is 400 μm in RL and TL microphotography
and 2 cm in hand samples.

5. Petrography
33
A
1.E-061.E+02
B

Ore mineralogy and geochemistry of the Mandoos Volcanic Massive Sulphide (VMS) deposit, Sumail Ophiolite, Oman
34
5.3 Metalliferous Sediments
Three texturally different types of metalliferous sediments were examined. The first one shows a clear
sedimentary texture composed of a rhythmic fine-grained banding of Fe-oxide poor to Fe-oxide enriched
sediments (Fig. 5.5 F), the latter being more abundant and thicker. In these layers, the Fe-oxide grains
tend to develop clusters with ellipsoidal shapes (Fig. 5.6 – 2) whose minor axes are sub-perpendicular
to the layering (indicating some compression, conceivably related to sedimentation and diagenesis
processes). The sample also displays two different types of carbonate veins, one perpendicular to the
layering, with no evidence of mineralization, and a later set of veins showing comb-texture (Fig. 5.6 –
1) with accessory amounts of sulphides (chalcopyrite and Cu-rich phases? in Fig. 5.6 - 7). There is no
other evidence of sulphide minerals or clasts. Sample (MD178-134.20) also shows a sedimentary
texture, but in this case the alternation of layers is between Fe-oxide rich (jasper like) and sulphide-rich
sediments (Fig. 5.5 E), the latter mainly composed of pyrite and chalcopyrite but also containing small
amounts of sphalerite and covellite.
Pyrite occurs in different textural arrangements, mostly forming fine-grained masses (resulting in a
“dirty-looking” polished surface), but it can occur as well as sub-euhedral grains of variable size
(resulting in a “clean” polished surface). The massive pyrite borders sometimes show some
recrystallisation (?) and these massive aggregates may preserve some colloform textures. As previously
referred, ochre sediments may include some interlayered graded beds of “detrital” sulphides and tend to
be confined to the contact with the massive sulphide lenses, as observed in this sample. A clear contact
between massive sulphides and the layered Fe-rich sediment with sulphide rich intercalations also shows
a sphalerite infilling (vein/space??); it is characterised by very fine intergrowths of sub-euhedral
sphalerite grains, quartz(?) and some covellite. The third type (MD174-62.15) shows a completely
different texture: a coarse-grained breccia impregnated and cemented by Fe-oxides and criptocrystalline
silica (Fig. 5.5 C); the clasts are also replaced by Fe-(hydr)oxides and hydroxides, mostly hematite and
goethite. The observed texture is easily correlated with the massive sulphide breccias, where euhedral
altered pyrite clasts (Fig. 5.6 – 6, 7), along with colloform (Fig. 5.6 – 8) and framboidal pyrite clasts,
can still be recognized as pseudomorphs. Some sulphides are still preserved in few mineral cores,
namely chalcopyrite being replaced by bornite and other Cu rich phases (Fig. 5.6 – 3, 4).
Fig 5. 5 – Hand Samples – A – MD-P2-2B – Ochre; B – Umber; C – MD174-62.15 - Oxidised massive sulphides; D – Massive
sulphide mineralised jasper; E - MD178-134.20 – Ochre displaying sulphide layers close to the contact with the massive
sulphide lens; F – MD-P2-2A - Layered ochre. The graphic scale bar is 2 cm.

5. Petrography
35
A
1.E-061.E+02
F
1.E-061.E+02
E
1.E-061.E+02
D
1.E-061.E+02
C
B
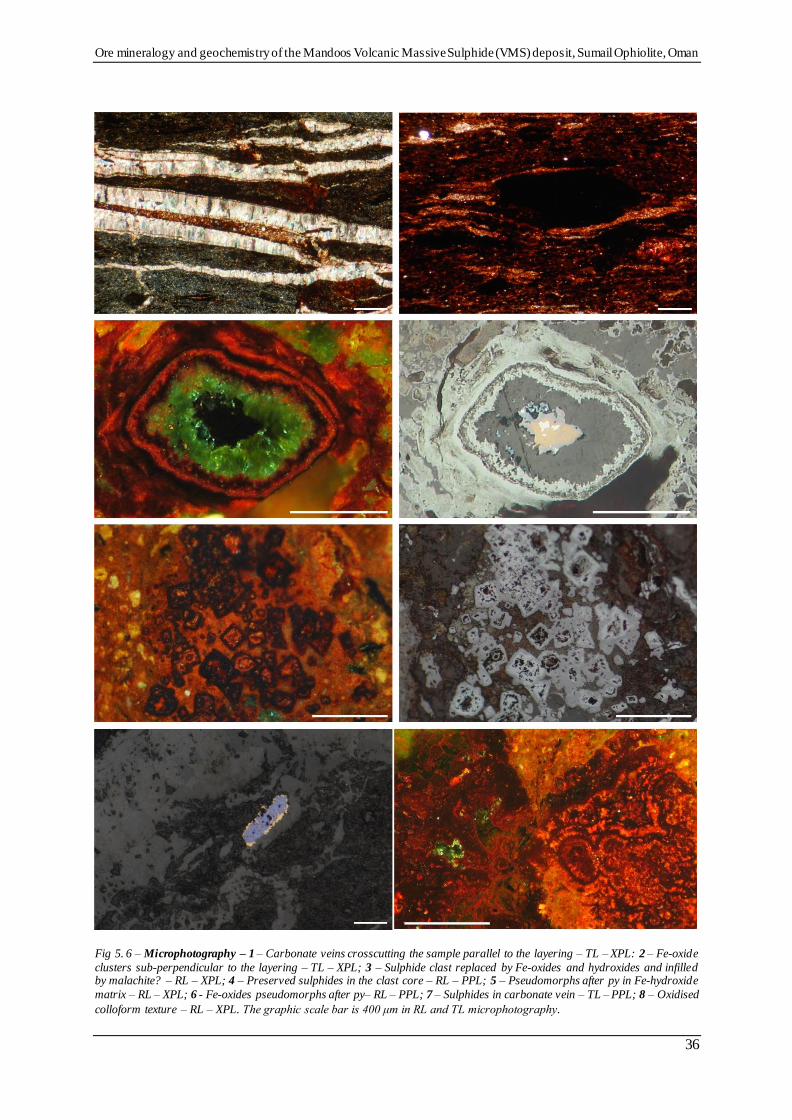
Ore mineralogy and geochemistry of the Mandoos Volcanic Massive Sulphide (VMS) deposit, Sumail Ophiolite, Oman
36
Fig 5. 6 – Microphotography – 1 – Carbonate veins crosscutting the sample parallel to the layering – TL – XPL: 2 – Fe-oxide
clusters sub-perpendicular to the layering – TL – XPL; 3 – Sulphide clast replaced by Fe-oxides and hydroxides and infilled by malachite? – RL – XPL; 4 – Preserved sulphides in the clast core – RL – PPL; 5 – Pseudomorphs after py in Fe-hydroxide
matrix – RL – XPL; 6 - Fe-oxides pseudomorphs after py– RL – PPL; 7 – Sulphides in carbonate vein – TL – PPL; 8 – Oxidised
colloform texture – RL – XPL. The graphic scale bar is 400 μm in RL and TL microphotography.

5. Petrography
37
5.4 Jaspers
The examined jaspers are always mineralised, as disseminations or vein infillings, particularly when in direct contact with massive sulphides. Disseminations of pyrite are common, developing aggregates of small anhedral grains and, most often, aggregates of euhedral crystals of variable size, possibly representing recrystallised grains (Fig. 5.7 – 1). An intermediate stage between these two occurrence modes is possibly represented by larger anhedral pyrite aggregates. Scarce chalcopyrite intergrowths with sphalerite displaying effects of “chalcopyrite disease” (secondary exsolution) are also disseminated but mostly associated with the anhedral pyrite aggregates. This chalcopyrite is locally replaced by bornite and covellite, suggesting a less reducing environment. Both euhedral pyrite and the aggregates have sphalerite inclusions. Two different sphalerite inclusions can be seen: clear sphalerite (more
common) and sphalerite with chalcopyrite segregations.
It is also noticeable a grain size increase towards the massive sulphide veins; also, the grains become more euhedral. The veins show a Fe-leached rim and are composed of large euhedral to sub-euhedral crystals of pyrite encased in large masses of chalcopyrite, accompanied by quartz (Fig. 5.7 – 5, 6). Some pyrite grains show more “clean” and flat edges, contrasting with the core domains, which are more irregular, indicating the progression of recrystallisation processes. Chalcopyrite is usually seen filling cracks on the pyrite whereas there is evidence for scarce chalcopyrite inclusion in pyrite, mostly adjoining chalcopyrite masses. Besides the Fe-leached rims observed in the veins, other leached zones, with no evidence of iron oxides are also seen throughout the samples. These are characterised by larger pyrite crystals (Fig. 5.7 – 2) and anhedral aggregates with a breccia texture; some sphalerite and chalcopyrite is also observed in this zone. The jasper impregnation by sulphides is possible due to increasing porosity during leaching, leading also to the formation of veins and some collapse breccias
(Fig. 5.7 – 3, 4), later silicified when the system temperature cools down.
One sample (MD-NP-3) shows a completely different mineralogy, being composed of cryptocrystalline silica inter-grown with manganese oxides; the sample also shows large euhedral pyrolusite crystals (diamond shape) and late veins possibly sealed by romanechite (according to its optical properties). In the hand specimen it is evident the presence of jasper clasts within the manganese ore.

Ore mineralogy and geochemistry of the Mandoos Volcanic Massive Sulphide (VMS) deposit, Sumail Ophiolite, Oman
38
Fig 5. 7 – Microphotography – 1 – Fine-grained anhedral aggregates and euhedral Py disseminations in jasper – RL – PPL;
2 – Py grain with jasper inclusions, displaying a leached rim – RL – XPL; 3 – Py breccia zone in contact with jasper having
disseminated Py – RL – PPL; 4 - Py breccia zone in contact with jasper including Py disseminations (as in microphoto 3) – RL
– XPL; 5 - Sulphides associated with mineralised veins – RL – PPL; 6 - Sulphides associated with mineralised veins (as in microphoto 5) – RL – XPL; 7 – Disseminations in jasper, Ccp being altered by Cu-rich phases – RL – PPL; 8 - Disseminations
in jasper, Ccp being altered by Cu-rich phases (as in microphoto 7) – RL – XPL. The graphic scale bar is 400 μm in RL and
TL microphotography.

6. Mineral Chemistry
39
6. Mineral Chemistry
Sulphide phases forming the massive ores of Mandoos were the main focus of the work carried out using
EPMA. Therefore, a comprehensive survey was prepared, covering different sulphides and textural
arrangements, and resulting in 946 quantitative analyses distributed over 15 polished mounts previously
examined under the reflected light microscope. The analytical dataset obtained include 310 analyses of
pyrite, 262 of chalcopyrite, 181 of sphalerite, 111 of marcasite, 64 of various Cu-rich phases, 13 of
bornite and 5 of galena (Appendix VII for detection limits and Appendix VIII for analyses).
6.1 Iron Sulphide Phases
Iron sulphides are by far the most abundant phases in the studied ore samples. Pyrite prevails and its
composition is close to ideal FeS2, with median composition of Fe0.999S2 and iron content scattered in
the 0.948-1.017 interval. Various elements are present in minor and trace amounts; the most significant
are Cu, Zn and Pb, displaying highly asymmetric distributions typified by median values of 210 ppm,
315 ppm, 180 ppm and contents up to 89780 ppm, 27890 ppm and 7070 ppm, respectively (Fig. 6.1).
Also worth mentioning is the presence of non-negligible amounts of As, In, Se and Co, characterised by
median values of 70 ppm, 70 ppm, 90 ppm and 200 ppm respectively.
Fig 6. 1 - Box and whiskers plot for the multi-element concentration distributions displayed by 310 analyses of pyrite
(concentration values in wt%). Note the relative importance of Cu, Zn and Pb as minor elements. Traces of some other elements
are noteworthy, namely As, In, Se and Co (and Au?).

Ore mineralogy and geochemistry of the Mandoos Volcanic Massive Sulphide (VMS) deposit, Sumail Ophiolite, Oman
40
Marcasite composition is also close to ideal, with Fe0.949-1.017 and median composition of Fe0.997S2. It
displays minor/trace amounts of Cu, Zn and Pb (like pyrite), which may reach 3820 ppm, 9800 ppm and
3850 ppm, respectively (Fig. 6.2); the median values of the concentration distributions for these
elements are BDL or quite close to that value (highlighting the strong distribution asymmetry), being
the third quartile equal to 1020 ppm, 320 ppm and 200 ppm respectively. In addition, traces of Mn and
Co are statistically meaningful, displaying median values of 70 ppm and 200 ppm, respectively. The last
two elements are possibly accompanied by W, Te, In and Au, for which the calculated medians are BDL
(third quartile = 428 ppm), 20 ppm, 60 ppm and 50 ppm.
Fig 6. 2 - Box and whiskers plot for the multi-element concentration distributions displayed by 111 analyses of marcasite
(concentration values in wt%). Note the relative importance of Cu, Zn and Pb as minor elements (like pyrite). Traces of Mn
and Co also with statistical meaning.
When plotted in a ternary diagram (Fig. 6.3), both pyrite and marcasite show similar behaviour ,
notwithstanding the larger deviation displayed by pyrite analyses. The (S+As)–Fe–(Cu+In) diagram
shows, as expected, a strong overlapping of the majority of samples in the FeS2 end-member field but
with a clear trend of Cu enrichment, in this case towards the chalcopyrite composition. The same trend
is shown in the (S+As)–(Zn+Cd+Co)–(Cu+In) diagram, but it also points out an enrichment, although
less significant, in Zn revealed by the compositional departure towards the sphalerite composition.
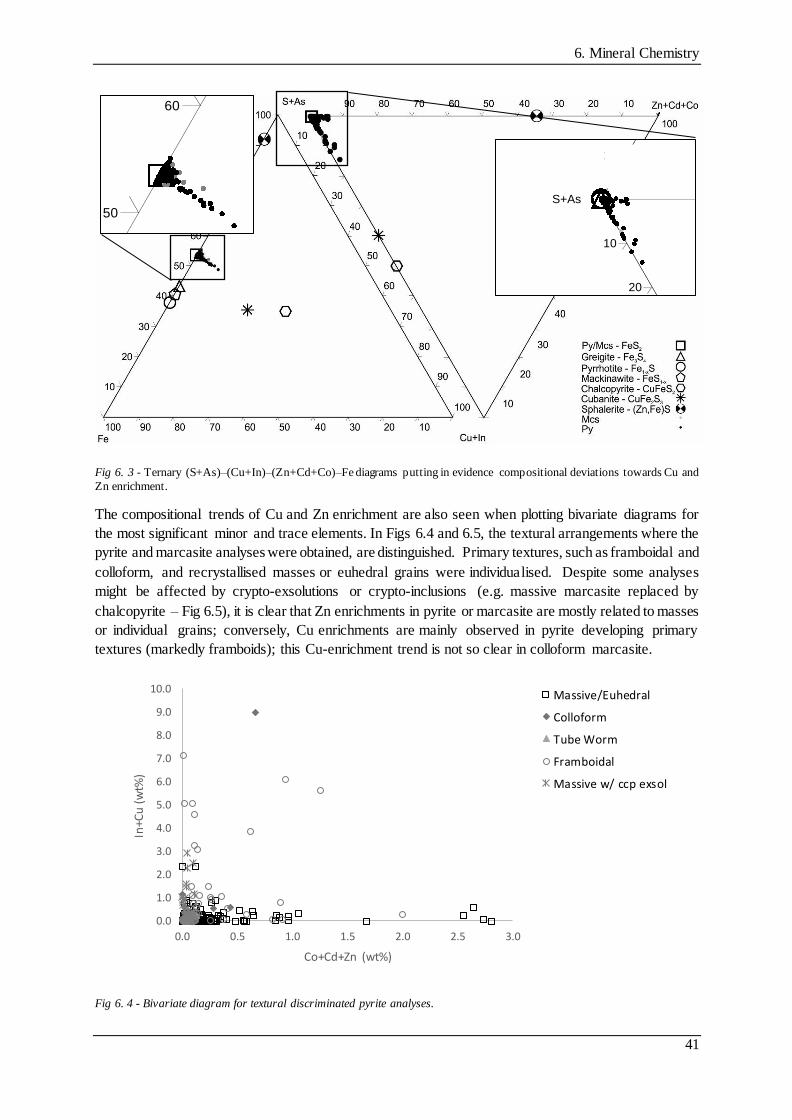
6. Mineral Chemistry
41
Fig 6. 3 - Ternary (S+As)–(Cu+In)–(Zn+Cd+Co)–Fe diagrams putting in evidence compositional deviations towards Cu and
Zn enrichment.
The compositional trends of Cu and Zn enrichment are also seen when plotting bivariate diagrams for
the most significant minor and trace elements. In Figs 6.4 and 6.5, the textural arrangements where the
pyrite and marcasite analyses were obtained, are distinguished. Primary textures, such as framboidal and
colloform, and recrystallised masses or euhedral grains were individualised. Despite some analyses
might be affected by crypto-exsolutions or crypto-inclusions (e.g. massive marcasite replaced by
chalcopyrite – Fig 6.5), it is clear that Zn enrichments in pyrite or marcasite are mostly related to masses
or individual grains; conversely, Cu enrichments are mainly observed in pyrite developing primary
textures (markedly framboids); this Cu-enrichment trend is not so clear in colloform marcasite.
Fig 6. 4 - Bivariate diagram for textural discriminated pyrite analyses.
0.0
1.0
2.0
3.0
4.0
5.0
6.0
7.0
8.0
9.0
10.0
0.0 0.5 1.0 1.5 2.0 2.5 3.0
In+C
u (
wt%
)
Co+Cd+Zn (wt%)
Massive/Euhedral
Colloform
Tube Worm
Framboidal
Massive w/ ccp exsol
10
10
20
S+As
60
50

Ore mineralogy and geochemistry of the Mandoos Volcanic Massive Sulphide (VMS) deposit, Sumail Ophiolite, Oman
42
Fig 6. 5 - Bivariate diagram for textural discriminated marcasite analyses.
Some colloform structures revealed rhythmic alternation between pyrite and a Cu-rich phase, probably
bornite. Fig 6.6 shows the EPMA image displaying an analysed profile, while the graphic puts in
evidence the Cu, and Fe variations along the same profile. The Cu variation is evident, and such
variations provide information on physical and chemical conditions during precipitation, allowing the
identification of cyclic changes in the fluid chemistry.
0.0
0.5
1.0
1.5
2.0
2.5
3.0
3.5
4.0
4.5
0.0 0.2 0.4 0.6 0.8 1.0 1.2
Cu
(w
t%)
Zn (wt%)
Massive/Euhedral
Colloform
Rim in Py
Coarse Euhedral
Massive replaced ccp
0
5
10
15
20
25
30
35
40
45
50
1 2 3 4 5 6 7 8 9 10 11 12 13 14 15
wt%
Cu Fe
Fig 6. 6 – Pyrite colloform clast displaying the analysed profile. The graphic shows the Cu variations registered during
the formation of that primary texture.

6. Mineral Chemistry
43
6.2 Cu Sulphide Phases
From all the Cu phases, chalcopyrite is the most abundant in the examined ore samples. Its composition
is close to FeCuS2, with Fe0.901-1.148 and Cu0.903-1.125; the estimated median composition for chalcopyrite
in Mandoos 1 is Fe0.966Cu0.991S2.
Fig 6. 7 - Box and whiskers plot for the multi-element concentration distributions displayed by 262 analyses of chalcopyrite
(concentration values in wt%). Note the relative importance of Zn and Pb as trace elements.
The Fig.6.7 shows the distribution for all elements in the analysed chalcopyrite grains/masses. Clearly,
the most relevant are the: (i) minor amounts of Zn, with median value of 920 ppm and maximum amount
of 50290 ppm; and (ii) traces of Pb, Mo, In, Se and Co, displaying median values of 335 ppm, 335 ppm,
60 ppm, 90 ppm and 100 ppm respectively. The incorporation of a variety of elements by chalcopyrite,
and the existence of a great number of outliers, suggest that no compositional refinement is observed in
this mineral phase, also indicating that the development of chalcopyrite could be interpreted as a
decaying product of a previous Cu-rich phase and in “transition” to other phases.
Bornite (Cu5FeS4) is also present, mostly replacing chalcopyrite. Its iron contents are less variable than
those of copper (Fe0.988-1.065 and Cu4.710-4.946) and a median composition of Fe1.005Cu4.849S4 can be
calculated on the basis of analyses compatible with the bornite stoichiometry. As in chalcopyrite, Zn
and Pb are the most significant trace elements, with amounts ranging from 150 to 9060 ppm and up to
1420 ppm, and median values of 1900 ppm and 880 ppm, respectively. The measured contents of Ag,
Mo and In are also non-negligible, reaching up to 520 ppm, 550 ppm and 790 ppm, with median values
of 150 ppm, 260 ppm and 130 ppm respectively (Fig 6.8).

Ore mineralogy and geochemistry of the Mandoos Volcanic Massive Sulphide (VMS) deposit, Sumail Ophiolite, Oman
44
Many other Cu-rich phases were analysed, optically undistinguishable under the current petrography.
These were characterised and processed as a group of Cu-rich sulphides, separately from chalcopyrite
and bornite. Variable in composition, these Cu-rich phases display copper contents from 22.359 to
72.772 wt% (median = 53.250 wt%), and iron concentrations from 1.253 to 34.715 wt% (median =
13.703 wt%); they also show significant amounts of Zn, up to 25 wt% (including an extreme outlier),
characterised by a median value of 4220 ppm. As can be seen in Fig 6.9, significant trace amounts of
Pb, Ag, Mo and Te were measured, displaying median values of 565 ppm, 215 ppm, 335 ppm and 435
ppm, respectively, and maximum concentrations up to 2930 ppm, 1330 ppm, 770 ppm and 73480 ppm,
following the very same order.
Fig 6. 8 - Box and whiskers plot for the multi-element concentration distributions (values in wt%) displayed by 13 analyses of
bornite being Zn and Pb the most significant trace elements.
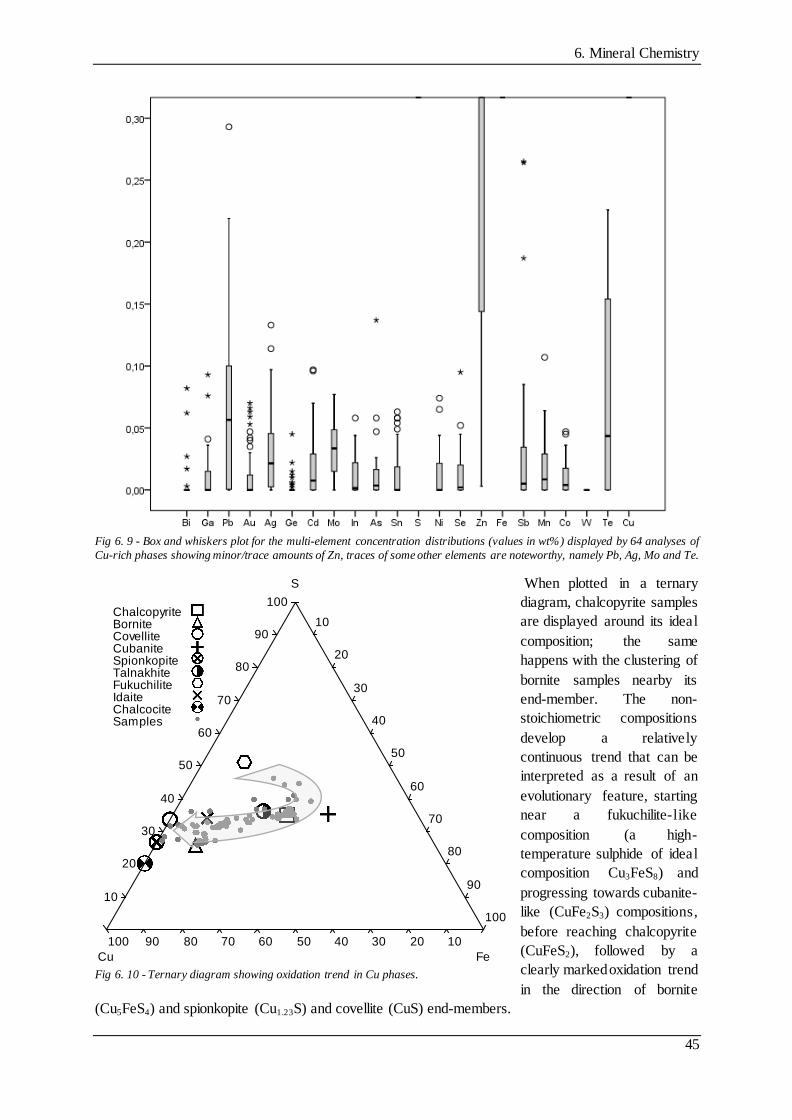
6. Mineral Chemistry
45
Fig 6. 9 - Box and whiskers plot for the multi-element concentration distributions (values in wt%) displayed by 64 analyses of
Cu-rich phases showing minor/trace amounts of Zn, traces of some other elements are noteworthy, namely Pb, Ag, Mo and Te.
When plotted in a ternary
diagram, chalcopyrite samples
are displayed around its ideal
composition; the same
happens with the clustering of
bornite samples nearby its
end-member. The non-
stoichiometric compositions
develop a relatively
continuous trend that can be
interpreted as a result of an
evolutionary feature, starting
near a fukuchilite-like
composition (a high-
temperature sulphide of ideal
composition Cu3FeS8) and
progressing towards cubanite-
like (CuFe2S3) compositions,
before reaching chalcopyrite
(CuFeS2), followed by a
clearly marked oxidation trend
in the direction of bornite
(Cu5FeS4) and spionkopite (Cu1.23S) and covellite (CuS) end-members.
100
90
80
70
60
50
40
30
20
10
100
90
80
70
60
50
40
30
20
10
100 90 80 70 60 50 40 30 20 10
S
Cu Fe
ChalcopyriteBorniteCovelliteCubaniteSpionkopiteTalnakhiteFukuchiliteIdaiteChalcociteSamples
Fig 6. 10 - Ternary diagram showing oxidation trend in Cu phases.

Ore mineralogy and geochemistry of the Mandoos Volcanic Massive Sulphide (VMS) deposit, Sumail Ophiolite, Oman
46
6.3 Sphalerite
Sphalerite [(Zn,Fe)S] is also common as an accessory mineral phase in the Mandoos 1 sulphide ores. Its
calculated median composition is Zn0.952Fe0.021S and the distribution of zinc and iron ion contents
confined to the following intervals: Zn0.576-0.999 and Fe0.002-0.210. Besides Fe, minor/trace amounts of Cu
and Cd are meaningful, rising up to grades of 9.861 wt% and 0.673 wt%, respectively; concentration
distributions of these elements are, however, asymmetrical, presenting medians of 2610 ppm and 2020
ppm. Also asymmetrical are the distributions of some meaningful trace amounts, such as Pb, As, Se,
Mn, Co, W and Te. These elements show maximum values up to 4960 ppm, 1770 ppm, 1020 ppm,
41300 ppm, 1010 ppm, 2930 ppm and 1430, and their median contents are of 120 ppm, BDL, 50 ppm,
110 ppm, 30 ppm, BDL and BDL respectively. The elements showing median values below detection
limit are characterised by third quartile values of 140 ppm, 520 ppm and 145 ppm respectively. Mo also
has significant trace amounts, but in opposition, it displays a quasi-normal distribution with median of
560 ppm and amounts up to 1250 ppm (Fig 6.11).
Fig 6. 11 - Box and whiskers plot for the multi-element concentration distributions displayed by 181 analyses of sphalerite (values in wt%). Minor/trace amounts of Cu and Cd are significant, traces of some other elements are noteworthy, namely Pb,
Mo and W, between others.
Fig 6.12 shows a Fe versus Cd bivariant plot of all samples, distinguishing the textural arrangements
where the chemical analyses for sphalerite were gathered. It is observed that sphalerites in Mandoos 1
are relatively poor in Fe, and those samples displaying “chalcopyrite disease” features are characterised
by higher amounts of Cd. Chemical analyses of wurtzite (distinguished from sphalerite under optical
microscopy, mostly due to its typical platy habit), sphalerite in masses showing triangular chalcopyrite
intergrowths (“vent” texture), and sphalerite with fibrous texture or occurring in veins/fractures share
similar compositional characteristics in this plot, i.e. low contents of Fe and Cd (Fe < 1.5 wt%; Cd < 0.4

6. Mineral Chemistry
47
wt%). Sphalerite forming massive/grain textural arrangements display two different trends, one towards
Cd enrichment (with low contents of Fe) and another towards Fe enrichments, showing low amounts of
Cd. The largest variation in Fe contents is recorded by sphalerite inclusions in pyrite, conceivably due
to the “contamination” of the host mineral.
Fig 6. 13 - Bivariate diagram for textural discriminated sphalerite analysis.
0.0
0.1
0.2
0.3
0.4
0.5
0.6
0.7
0.8
0.0 2.0 4.0 6.0 8.0 10.0 12.0 14.0 16.0
Cd
(w
t%)
Fe (wt%)
Wurtzite
Mass w/ ccp intergrowth
Massive/Grain
Inclusion
"Fibrous"
In Vein/Fracture
Massive w/ ccp disease
40 30
20
10
100
90
80
Fig 6. 12 - Ternary (S+As)–Fe–Cu– (Zn+Cd+Co) diagrams putting in evidence compositional dislocations towards Fe
and Cu in sphalerites.

Ore mineralogy and geochemistry of the Mandoos Volcanic Massive Sulphide (VMS) deposit, Sumail Ophiolite, Oman
48
In the S+As – Fe – Cu – Zn+Cd+Co diagram it is observed that wurtzite, massive sphalerite with
chalcopyrite intergrowth, veins and fibrous chalcopyrite are all plotted close to the S+As – Zn+Cd+Co
axis, overlaying the sphalerite ideal composition and showing no significant variations towards Fe
enrichments. The same happens when Cu is added; thus, all samples are clustered in the Zn – Cd – Co
vertex. However, a distinct trend towards a minor Fe enrichment is observed in sphalerite samples
displaying “chalcopyrite disease” features, forming massive aggregates and developing inclusions in
pyrite, being the first sphalerite type less Fe-enriched than the last two cases. These three different
textural arrangements also display a slight enrichment in Cu along with some sphalerite in veins.
6.4 Galena
Galena (PbS) is the less represented sulphide in all the studied samples. Indeed, tiny grains of galena
are present in some samples, but their reduced dimension does not always allow the achievement of
acceptable quantitative chemical analyses. The available data point to Pb contents varying from 0.976
and 1.005 atoms per formula unit, and a median composition of Pb0.976S. Although irregular, minor
amounts of Zn, Cu, Sb and Fe are present (Fig 6.14). These can go up to 20550 ppm, 5030 ppm, 2700
ppm and 3410 ppm, and display median amounts of 10770 ppm, 3810 ppm, 1130 ppm and 1170 ppm,
respectively. The most significant trace amounts recorded are Sn, Se and Co; they are characterised by
median values of 110 ppm, 100 ppm and 100 ppm and amounts that can reach 410 ppm, 690 ppm and
380 ppm, respectively.
Fig 6. 14 - Box and whiskers plot for the multi-element concentration distributions displayed by 5 analyses of galena
(concentration values in wt%). Note the relative importance of Zn, Cu, Sb and Fe as minor/trace elements.

7. Whole Rock Chemistry
49
7. Whole-Rock Chemistry
From the 42 samples collected during the sampling survey, 18 were chosen for minor and trace element
analysis via ICP-MS in the Géosciences Environnement Toulouse laboratory (Observatoire Midi-
Pyrénées), Université of Toulouse III. The same samples were also analysed via XRF for major elements
at the University of Aveiro facilities. The analysed set comprises samples from different types of
massive sulphides (10), metalliferous sediments (6) and mineralised (sulphide-rich or Mn-rich) jaspers
(2) (Appendix IX). Due to the limited number of samples, the correlation matrixes meanwhile calculated
were not as discriminative as expected, although a simple descriptive statistical study for the minor and
trace elements distributions was performed, and for major elements as well.
7.1 Major Elements
The major elements measured with XRF have concentration values consistent with the observations
done during re-logging and petrography. Indeed, samples of the Mandoos massive sulphides are Fe-rich
and Cu-Zn-poor ores, and their correspondent grades are scattered in the intervals 3.96-24.73 wt%
(median = 18.99 wt% Fe), 0.12-2.45 wt% (median = 0.51 wt% Cu) and 0.01-29.12 wt% (median = 0.048
wt% Zn) respectively, as can be seen in Fig 7.4. Silica contents are significant in these ores, rising up to
13.87 wt% and having a median value of 11.02 wt% SiO2. These samples also contain Al and Ca, whose
oxides display median concentration values of 0.097 wt% Al2O3and 0.024 wt% CaO and maximum
contents of 5.46 wt% and 16.35 wt% respectively, following extremely asymmetric distributions.
Sample MD-NP-1, a chalcopyrite- and sphalerite-rich ore sample, presents the highest Cu and Zn
contents coupled with significant grades of SiO2, Al2O3 and CaO mostly due to the presence of quartz
and laumontite (CaAl2Si4O12 · 4H2O). As reported before, the ore samples are mostly breccias whose
cement is enriched in SiO2, and this fact explains the high-silica content displayed by most of the
samples, excluding the specimens MD-P1-1-1 and MD-P3-4-1 which represent a massive pyrite
accumulation and a breccia cemented by carbonates (thus displaying the highest content in CaO),
respectively.

Ore mineralogy and geochemistry of the Mandoos Volcanic Massive Sulphide (VMS) deposit, Sumail Ophiolite, Oman
50
Fig 7. 1 – Major elements distribution in sulphide ores.
Umbers (Fe- and Mn-rich sediments) and ochres (Fe-rich sediments) (Fleet & Robertson, 1980) are the
two metalliferous sediment types analysed in this section. As shown in Fig 7.2 (a), the Fe and Mn
contents are discriminative enough to separate both rock types (umbers and ochres). These contents have
their values scattered between 26.52-54.73 wt% Fe and 0.2-1.78 wt% Mn respectively. Besides the
expected high-silica content, these samples also show CaO concentrations between 1.02 wt% and 12.61
wt% (median = 6.05 wt%). According to these results we may infer a set of 5 ochres and 1 umber
(sample MD-178-110.5, with 1.78 wt% Mn). It is also possible to correlate the CaO contents with the
presence of late carbonate veins, quite evident in sample MD-P2-2A, which is characterised by the
highest contents of this oxide. Noteworthy is the Cu extreme outlier (maximum = 3.73 wt%) displayed
by the sample MD-178-134.20, corresponding to a mineralised (massive sulphide) mineralised ochre.
Two different jasper samples were analysed, a mineralised sulphide-rich jasper (MD-150-114.10) and a
manganese ore with jasper clasts (MD-NP-3); Fig 7.2 (b) shows clearly the discrepant composition of
the two mineralised jasper samples, mostly in SiO2 and MnO. These element oxides have minimum
values of 10.45 wt% and 0.01 wt% and maximum of 30.05 wt% and 47.19 wt% respectively, being the
latter value representative of the manganese ore (mainly pyrolusite – Appendix X). Also, the presence
of minor amounts of Ba in the Mn-rich jasper sample is conceivably due to the presence of romanechite
((Ba,H2O)2(Mn)5O10) in the manganese ore.

7. Whole Rock Chemistry
51
Fig 7. 2 – Major elements distributions in: A – umber and ochres; B – mineralised (sulphide-rich and Mn-rich) jaspers.

Ore mineralogy and geochemistry of the Mandoos Volcanic Massive Sulphide (VMS) deposit, Sumail Ophiolite, Oman
52
7.2 Minor and Trace Elements
As shown in Fig 7.3, minor amounts of V, Mn, Co, As and Pb can be found in massive sulphide samples,
which display contents up to 67.15 ppm, 1887 ppm, 422.58 ppm, 1024 ppm and 219.97 ppm,
respectively; for these elements, the median concentration values are of 43.74 ppm, 140.56 ppm, 37.78
ppm, 292.90 ppm, 53.27 ppm, by the same order. Also traces of Mo, Sn, Sb and Te are found in ore
samples whose distributions are characterised by median values of 8.08 ppm, 6.07 ppm, 6.35 ppm and
12.46 ppm, respectively.
Fig 7. 3 - Box and whiskers plot for the multi-element concentration distributions displayed by massive sulphides (concentration
values in ppm).
The same set of minor elements is also found in metalliferous sediments, with the exception of Co and
Pb, just with trace amounts. Other relevant elements found in metalliferous sediments and measured as
traces are Cr, Ni and Sr (Fig 7.4); their correspondent grades are scattered within the 15.64-95.17 ppm,
35.1-185.4 ppm and 36.21-117.13 ppm intervals, respectively.
Despite having a restrict number of samples, whole-rock analyses of mineralised jaspers show strong
consistency with the previous samples, displaying minor amounts of V, Co, Ni, As, Sr, Mo and Ba and
some traces of Ga, Te and Pb (Fig 7.5). The median values of 217 ppm, 67.61 ppm, 88.8 ppm, 287.62
ppm, 224.86 ppm, 165.55 ppm and 372 ppm typify the concentration distributions of the aforementioned
minor elements.
To date there were no data available for minor and trace elements in samples representing the Sumail
ophiolite massive sulphides, being this exploratory work a further step in the characterisation of these
ores.

7. Whole Rock Chemistry
53
Fig 7. 4 - Box and whiskers plot for the multi-element concentration distributions displayed by metalliferous sediments;
Fig 7. 5 - Box and whiskers plot for the multi-element concentration distributions displayed by jaspers (concentration values
in ppm).

Ore mineralogy and geochemistry of the Mandoos Volcanic Massive Sulphide (VMS) deposit, Sumail Ophiolite, Oman
54
7.3 REE
The measured REE contents were normalised to C1 Chondrite (Palme & Jones, 2004) allowing direct
comparison of patterns displayed by each set of samples (sulphide ores, metalliferous sediments and
jaspers). In this approach, the relative enrichment and depletion of Eu and Ce were evaluated according
to the Eu/Eu* and Ce/Ce* ratios defined as (McLennan, 1989): 𝐸𝑢⁄𝐸𝑢* = 𝐸𝑢𝑁⁄(𝑆𝑚𝑁 ∙ 𝐺𝑑𝑁)0,5 and 𝐶𝑒⁄𝐶𝑒∗
= 5𝐶𝑒𝑁⁄(4𝐿𝑎𝑁 + 𝑆𝑚𝑁).
All the samples representing sulphide ores (Fig 7.6A) are depleted in REE, as expected; their normalised
patterns are regular, revealing a feeble, almost imperceptible, enrichment in HREE, along with a positive
anomaly in Eu (Eu*= 1.15 to 1.84) and a slight negative anomaly in Ce (Ce*= 0.41 to 0.91). The sample
MD-P3-4-1 represents a massive sulphide breccia cemented by carbonates and is the most REE enriched
(≈1 to 2× C1) specimen of the entire set. This is possibly related to the incorporation of REE in
carbonates. As seen in Fig 7.6, the REE normalised pattern characterising the sulphide ores can be
explained by a mixture of vent fluids and seawater; with this simple mixture it is possible to obtain a
slight enrichment in HREE and a Ce negative anomaly (inherited characteristic from the seawater)
together with a Eu positive anomaly (the most distinctive feature of vent fluids).
Metalliferous sediments (Fig 7.6B) are the most REE-enriched samples, displaying a wide range of
values. The REE normalised patterns are characterised by LREE relative enrichments along with slight
HREE depletions. An evident negative anomaly in Ce (Ce*= 0.15 to 0.18) is shown in all samples,
together with a feeble negative anomaly in Eu (Eu*= 0.73 to 0.82). When compared with the seawater
pattern (Fig 7.6D) it is clear that their pattern indicates a REE scavenging of the ocean by adsorption in
phyllosilicates forming the sediments.
Both jasper samples share similarities in the pattern shape, revealing relative enrichments in LREE and
faint enrichments in HREE. Sample MD-NP-3 displays a weak positive anomaly in Ce (Ce*=1.19) and
an evident negative anomaly in Eu (Eu*= 0.07), while sample MD-150-114.10 shows a negative
anomaly in Ce (Ce*= 0.34) and a positive one in Eu (Eu*= 1.56). The mineralised sulphide-rich jasper
displays a pattern alike of that showed by the sulphide ore sample MD-P3-4-1; like in sulphide ore
samples, these REE normalised patterns suggest the development of mixtures of seawater and vent fluids
but the former component (seawater) is now more important. The Mn-rich mineralised jasper shows a
distinct REE normalised pattern, conceivably due to the geochemical behaviour of Ce (Ce3+ is soluble
under reducing conditions, precipitating as Ce4+ in oxidizing conditions); The sample is mainly
composed of pyrolusite (Mn4+O2), identified via XRD (Appendix X), so most of the Ce might be
incorporated in the Mn4+ position.

7. Whole Rock Chemistry
55
Fig 7. 6 – REE patterns for: A – sulphide ores; B – umber and ochres; C – mineralised jaspers; D – all the analysed samples together with representative REE normalised compositions of seawater (Li et al., 2004) and vent fluids (EPR (German et al., 1999) and TAG (Mills & Elderfield
1995)).
1.E-02
1.E-01
1.E+00
1.E+01
La Ce Pr Nd Sm Eu Gd Tb Dy Ho Er Yb Lu
Sam
ple
/C1
MD-NP-1 MD-P1-1-1 MD-174-79.00 MD-P3-4-1 MD-178-128.80
MD-429-109.10 MD-431-107.00 MD-431-108.00 MD-431-109.70 MD-431-110.5
1.E+00
1.E+01
1.E+02
1.E+03
La Ce Pr Nd Sm Eu Gd Tb Dy Ho Er Yb Lu
Sam
ple
/C1
MD-178-110.5 MD-P2-2A MD-P2-2B MD-429-104.00 MD-174-62.15 MD-178-134.20
1.E-06
1.E-05
1.E-04
1.E-03
1.E-02
1.E-01
1.E+00
1.E+01
1.E+02
1.E+03
La Ce Pr Nd Sm Eu Gd Tb Dy Ho Er Yb Lu
Sam
ple
/C1
Massive Sulphides Umber & Ochres Jaspers Vent Fluid EPR Seawater Vent Fluid TAG
1.E-01
1.E+00
1.E+01
La Ce Pr Nd Sm Eu Gd Tb Dy Ho Er Yb Lu
Sam
ple
/C1
MD-150-114.10 MD-NP-3
A B
D C


7. Whole Rock Chemistry
57
REE contents of metalliferous sediments from Troodos (Robertson & Fleet, 1976) and modern
analogues from East Pacific Rise (Barret, 1988) were taken from literature for comparison purposes
with the REE patterns obtained for Mandoos samples. All these sediments display a similar pattern
despite of differences in relative abundances (denoting variable enrichment levels). The metalliferous
sediments from Mandoos occupy an intermediate position between samples from Troodos, which are
the most enriched in all REE elements, and from modern analogue settings (the lesser REE-enriched).
Fig 7. 7 – Comparison of metalliferous sediments REE normalised patterns: on top – Mandoos (black) and Troodos (dark
grey); bottom – Mandoos (black) and EPR (light grey).
1.E+00
1.E+01
1.E+02
1.E+03
1.E+04
La Ce Pr Nd Sm Eu Gd Tb Dy Ho Er Yb Lu
1.E-01
1.E+00
1.E+01
1.E+02
1.E+03
Sam
ple
/C1

Ore mineralogy and geochemistry of the Mandoos Volcanic Massive Sulphide (VMS) deposit, Sumail Ophiolite, Oman
58
7.4 Spider Diagrams
Primitive mantle (PM) normalised (Palme & O´Neill, 2004) spider diagrams, using a set of elements
organised by their atomic number, were used to characterise the Mandoos sulphide ores, metalliferous
sediments and jaspers. The samples show common positive anomalies in Cu, As, Mo, In, Sb, Te, W and
Pb, along with evident negative anomalies in Cr and Ni; Rb, Sr, Y, Zr, Nb and Th also show negative
anomalies, but not so clearly.
Despite the positive anomalies in V and Co, the sulphide ores are still depleted, relatively to primitive
mantle, in transition metals with the exception of Cu, Zn and As. Cu displays enrichment ≈340x PM,
while As ≈4000 to ≈15000x PM, and Zn up to 10x PM (excluding sample MD-NP-1 which displays an
Zn enrichment above 5000x PM). Depletion in Rb, Sr, Y, Zr, and Nb, as well as in REE and Th, are
well marked. However, Mo, Cd, In, Sb, Te and Pb display an evident enrichment in all the sulphide ore
samples. The Zn-rich sample (MD-NP-1) displays, as expected, a Cd enrichment above 60000x PM.
The sulphide ore samples are also characterised by amounts of Mo between 50 and 2300x PM, Sb can
vary from ≈300 to ≈5000x PM and Te between 40 and 3000x PM; the Pb positive anomaly denotes
enrichment above 180x PM, never exceeding 1190x PM.
Metalliferous sediments are enriched in all the measured elements with exception of Sc, Ti, Cr, Co and
Ni. Well-defined positive anomalies in P, V, Cu, As, Mo, Sb, W, Pb and U are observed in all samples;
P displays enrichments from ≈40 to ≈70x PM, while As (the most enriched element) is characterised by
values ranging from ≈980x PM to ≈5600x PM. W and Pb also display high levels of enrichment in these
sediments; W varies from ≈45x to ≈180X PM, while Pb enrichments can reach amounts ≈1500x above
the primitive mantle. The measured Mo, In, Sb and Te concentration are also significant in some
samples, reaching maximums of 313x, 266x, 821x and 689x PM, respectively.
Jasper samples (MD150-114.10), represented by a mineralised sulphide-rich jasper and a manganese
ore with jasper clasts (MD-NP-3), are relatively enriched in As, Mo, Cd, Sb, W and U when compared
to the primitive mantle. The As values range between 1230x and 7230x PM; Cd contents may reach up
to 5270x PM; and Sb concentrations remain below ≈1000x PM. In these samples, the U contents vary
between 54x and 243x PM. Also noteworthy, are the enrichments in Ba (≈108x PM) and W (≈141x PM)
in the MD-NP-3 sample, as well as in Cu (≈535x PM) and Pb (≈142x PM) in sample MD150-114.10.
Overall enrichments in Cd, In, Te, W, and Sn (observed in the minor and trace elements chapter)
represents conceivable signals of magmatic inputs to the hydrothermal-mineralising fluids involved in
sulphide deposition.

7. Whole Rock Chemistry
59
Fig 7. 8 - Normalised concentration patterns for Mandoos samples: A – all the analysed samples; B – sulphide ores; C – umber & ochres. Normalization values according to Palme & O'Neill (2004).
1.E-04
1.E-03
1.E-02
1.E-01
1.E+00
1.E+01
1.E+02
1.E+03
1.E+04
1.E+05
P K Sc Ti V Cr Co Ni Cu Zn As Rb Sr Y Zr Nb Mo Cd In Sb Te Cs Ba La Ce Nd Sm Gd Tb Yb Lu Hf Ta W Pb Bi Th U
Sam
ple
/PM
Massive Sulphides Umber & Ochres Jaspers
1.E-04
1.E-03
1.E-02
1.E-01
1.E+00
1.E+01
1.E+02
1.E+03
1.E+04
1.E+05
P K Sc Ti V Cr
Co Ni
Cu Zn As
Rb Sr Y Zr Nb
Mo
Cd In Sb
Te Cs Ba La Ce Nd
Sm Gd
Tb
Yb Lu Hf
Ta W Pb Bi
Th U
Ro
ck/P
M
MD-NP-1 MD-P1-1-1 MD-174-79.00 MD-P3-4-1 MD-178-128.80
MD-429-109.10 MD-431-107.00 MD-431-108.00 MD-431-109.70 MD-431-110.5
1.E-03
1.E-02
1.E-01
1.E+00
1.E+01
1.E+02
1.E+03
1.E+04
P K Sc Ti V Cr Co Ni
Cu Zn As
Rb Sr Y Zr Nb
Mo
Cd In Sb Te Cs Ba La Ce Nd
Sm Gd
Tb Yb Lu Hf
Ta W Pb Bi
Th U
Ro
ck/P
M
MD-178-110.5 MD-P2-2A MD-P2-2B MD-429-104.00 MD-174-62.15 MD-178-134.20
A
C B

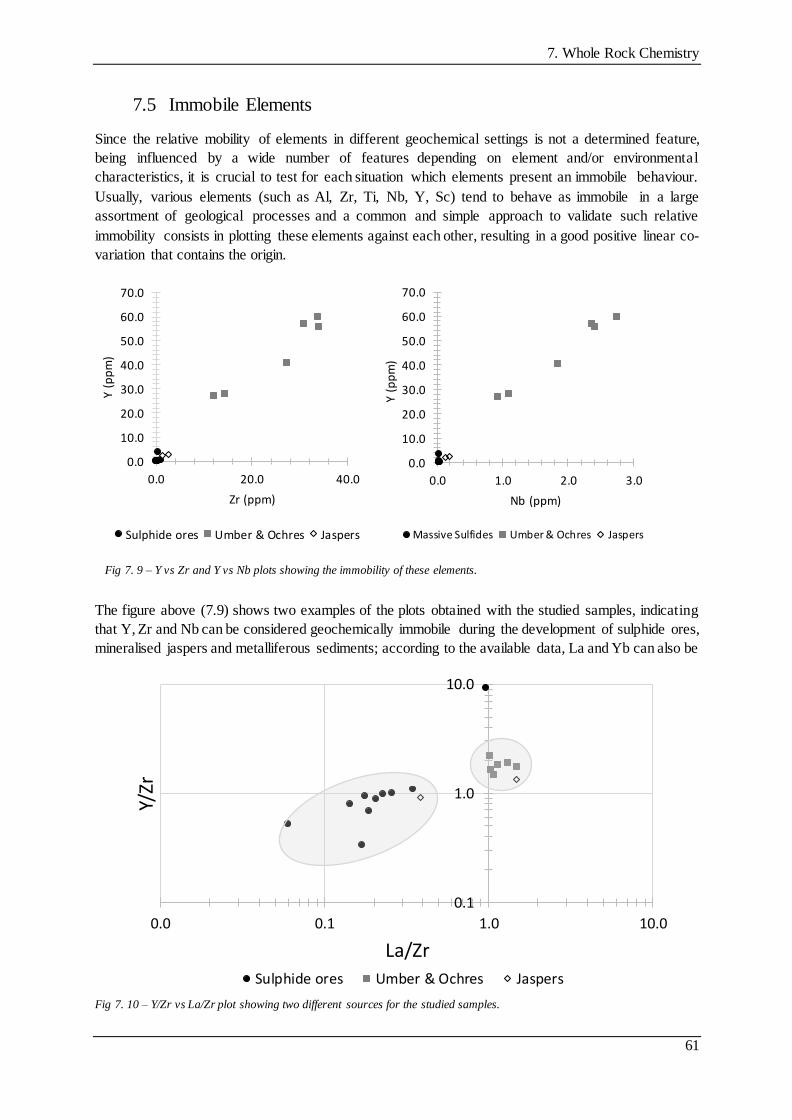
7. Whole Rock Chemistry
61
7.5 Immobile Elements
Since the relative mobility of elements in different geochemical settings is not a determined feature,
being influenced by a wide number of features depending on element and/or environmental
characteristics, it is crucial to test for each situation which elements present an immobile behaviour.
Usually, various elements (such as Al, Zr, Ti, Nb, Y, Sc) tend to behave as immobile in a large
assortment of geological processes and a common and simple approach to validate such relative
immobility consists in plotting these elements against each other, resulting in a good positive linear co-
variation that contains the origin.
The figure above (7.9) shows two examples of the plots obtained with the studied samples, indicating
that Y, Zr and Nb can be considered geochemically immobile during the development of sulphide ores,
mineralised jaspers and metalliferous sediments; according to the available data, La and Yb can also be
0.0
10.0
20.0
30.0
40.0
50.0
60.0
70.0
0.0 20.0 40.0
Y (p
pm
)
Zr (ppm)
Sulphide ores Umber & Ochres Jaspers
0.0
10.0
20.0
30.0
40.0
50.0
60.0
70.0
0.0 1.0 2.0 3.0
Y (p
pm
)
Nb (ppm)
Massive Sulfides Umber & Ochres Jaspers
0.1
1.0
10.0
0.0 0.1 1.0 10.0
Y/Zr
La/Zr
Sulphide ores Umber & Ochres Jaspers
Fig 7. 9 – Y vs Zr and Y vs Nb plots showing the immobility of these elements.
Fig 7. 10 – Y/Zr vs La/Zr plot showing two different sources for the studied samples.

Ore mineralogy and geochemistry of the Mandoos Volcanic Massive Sulphide (VMS) deposit, Sumail Ophiolite, Oman
62
classified as immobile. Using now the ratios between immobile elements, one may put in evidence the
distinct sources (protoliths) related to the sulphide ores and hydrothermal sediments (Fig 7.10).
The plot La/Zr versus Y/Zr shown in Fig 7.10 is an example of that discrimination: a wide cluster that
comprises the massive sulphide samples and a more constricted cluster involving all the metalliferous
sediments (umber & ochres). Noteworthy is the presence of the jasper samples in both clusters, which
is entirely consistent with the mineralogical characteristics of the analysed samples: sample MD-NP-3
(manganese ore) shares more affinities with metalliferous sediments; sample MD150-114.10, a
sulphide-rich mineralised jasper is compositionally influenced by the mechanims related to the sulphide
ore development. The deviation displayed by sample MD-P3-4-1 is ascribed to the relative abundance
of late-formed carbonates in the sulphide breccia.
Normalising all the values to an immobile element will reduce the dilution factor, allowing to directly
compare samples. For this exercise, Y was the immobile element chosen. Fig 7.11 compares all samples
from the three different rock types collected during sampling: sulphide ores, umber and ochres and
jaspers. A general inspection shows that all the samples display similar patterns; however: sulphide ores
are the most chemically enriched; metalliferous sediments are the less chemically enriched; and jaspers
occupy an intermediate position between those two “end-members”.
A closer look into individual groups allow to better evaluate the enrichment factors; sulphide ores are
mainly enriched in SiO2, Fe2O3, S, As, Sr, Mo, Ta and Tl. Sample MD-P3-4-1 displays a slightly
different pattern, also with the particularity of being the less-enriched sample amongst all sulphide ores,
as expected (mineralised breccia cemented by carbonates). Samples MD-NP-1 and MD-178-128.80
show evident enrichment in Zn and Cd not registered in other samples, which is compatible with the
observed significant amounts of sphalerite. Noteworthy is also the enrichment in Te in many samples.
Metalliferous sediments (Fig 7.11C) show enrichment in SiO2, Fe2O3, CaO, As, Sr, Ba and U. Major
variations amongst these samples are in Cu, Cd, Te and Ta, whose enrichment factors can vary from
tens to 1000x between them.
Jaspers present two different patterns but with common enrichments in SiO2, Fe2O3, S, As, Mo and U.
The MnO, Ba and Sr enrichments in sample MD-NP-3 are significantly higher (1000x and 100x,
respectively) than those recorded by the sulphide-rich mineralised jasper.

7. Whole Rock Chemistry
63
Fig 7. 11 – Normalised (Y) concentration patterns for Mandoos samples: A – all the analysed samples; B – sulphide ores; C – umber & ochres.
1.00E-04
1.00E-03
1.00E-02
1.00E-01
1.00E+00
1.00E+01
1.00E+02
1.00E+03
1.00E+04
1.00E+05
1.00E+06
1.00E+07Sa
mp
le/Y
Sulphides Ores Umber & Ochres Jaspers
1.00E-03
1.00E-02
1.00E-01
1.00E+00
1.00E+01
1.00E+02
1.00E+03
1.00E+04
1.00E+05
1.00E+06
1.00E+07
SiO
2*
Al2
O3*
Fe2
O3*
MgO
*
Mn
O*
CaO
*
Na2
O*
K2O
* S*
Cu
*
Zn*
Pb
*
V*
Cr*
Co*
Ni*
Ga*
Ge*
As*
Se*
Rb* Sr
*
Zr*
Nb*
Mo
*
Ag*
Cd
*
In*
Sn*
Sb*
Te*
Cs*
Ba*
Ta*
W *
Tl*
Bi* U*
Sam
ple
/Y
MD-NP-1 MD-P1-1-1 MD-174-79.00 MD-P3-4-1 MD-178-128.80
MD-429-109.10 MD-431-107.00 MD-431-108.00 MD-431-109.70 MD-431-110.5
1.00E-04
1.00E-03
1.00E-02
1.00E-01
1.00E+00
1.00E+01
1.00E+02
1.00E+03
1.00E+04
1.00E+05
SiO
2*
Al2
O3
*
Fe2
O3*
MgO
*
Mn
O*
CaO
*
Na2
O*
K2O
* S*
Cu*
Zn*
Pb*
V*
Cr*
Co*
Ni*
Ga*
Ge*
As*
Se*
Rb
*
Sr*
Zr*
Nb
*
Mo
*
Ag*
Cd*
In*
Sn
*
Sb
*
Te*
Cs*
Ba*
Ta*
W *
Tl*
Bi* U*
Sam
ple
/Y
MD-178-110.5 MD-P2-2A MD-P2-2B MD-429-104.00 MD-174-62.15 MD-178-134.20
A
C B

64

8. Discussion
65
8. Discussion
Mafic type deposits are described as Cu-rich and Pb-poor when compared to other VMS deposits (Barrie
& Hannington, 1999). The geometric mean of metals concentration in sulphide ores from different VMS
deposits in distinct host-rock settings are reported in Hannington (2014). Fig 8.1 exhibits the distribution
of these geometric mean concentrations in a Cu-Pb-Zn diagram, showing that the majority of VMS
deposits are plotted in the Zn-Pb-Cu field, while the mafic-type deposits are distributed within the Cu-
Zn-rich field. The studied VMS samples from Mandoos 1 deposit were also included in this diagram,
represented by the median values of the available concentration metal distributions (marked as
Mandoos). Mandoos 1 is plotted in the Cu-type field, being relatively enriched in Cu when compared to
other mafic-type deposits. The 8 Mt orebody displays an average grade of 1.72 wt% Cu, which showed
to be slightly below the assessed value, although this might be explained by the incomplete database
provided by the company, which only made available the survey for 33 drill holes. Petrography and
mineral chemistry did not present evidence for zone refining, and the modelling of Cu and Zn grades
also did not also document a metal zoning in the deposit. Nonetheless, it can be shown that (at least)
part of the observed Cu enrichment comes from secondary Cu-rich phases developed in the course of a
more oxidising (late) evolving event. As previously stated, the presence of numerous primary textures
in sulphide ores and clasts suggest that refining processes were not important during the development
of Mandoos 1 ores, placing them in a black-smoker type environment (some of the studied samples
conceivably represent products of the crumbling of hydrothermal chimneys). The large amount of
primary textures (framboidal and colloform) preserved in the studied samples allows also to reconsider
the topic regarding the biogenic origin of pyrite in such systems. Framboids are known to be spherical
to sub-spherical aggregates, composed by microcrystals of equigranular pyrite with a dense (cubic-
)packing arrangement; nevertheless, irregular aggregates (loose packing) are also common (Wilken &
Barnes, 1997). Many authors suggested that these forms corresponded to pyritized bacterial colonies ;
however the nucleation of pyrite framboidal microcrystals can also be a result of the ferromagnetic
properties of greigite (Fe3S4), the precursor in this type of structure. Some experimental studies
A
B
A
B
A
C
B
A
A
D
B
A
100
90
80
70
60
50
40
30
20
10
100
90
80
70
60
50
40
30
20
10
100 90 80 70 60 50 40 30 20 10
Cu
Pb Zn
Cu-type
Cu-Zn
Zn-Cu
Zn-Pb-CuZn-Pb-type
MandoosMaficBimodal maficMafic-peliticBimodal felsicFelsic-siliciclasticSamples
Fig 8. 1 - Cu-Pb-Zn diagram displaying metal concentrations for different VMS
deposits according to their host-rock.
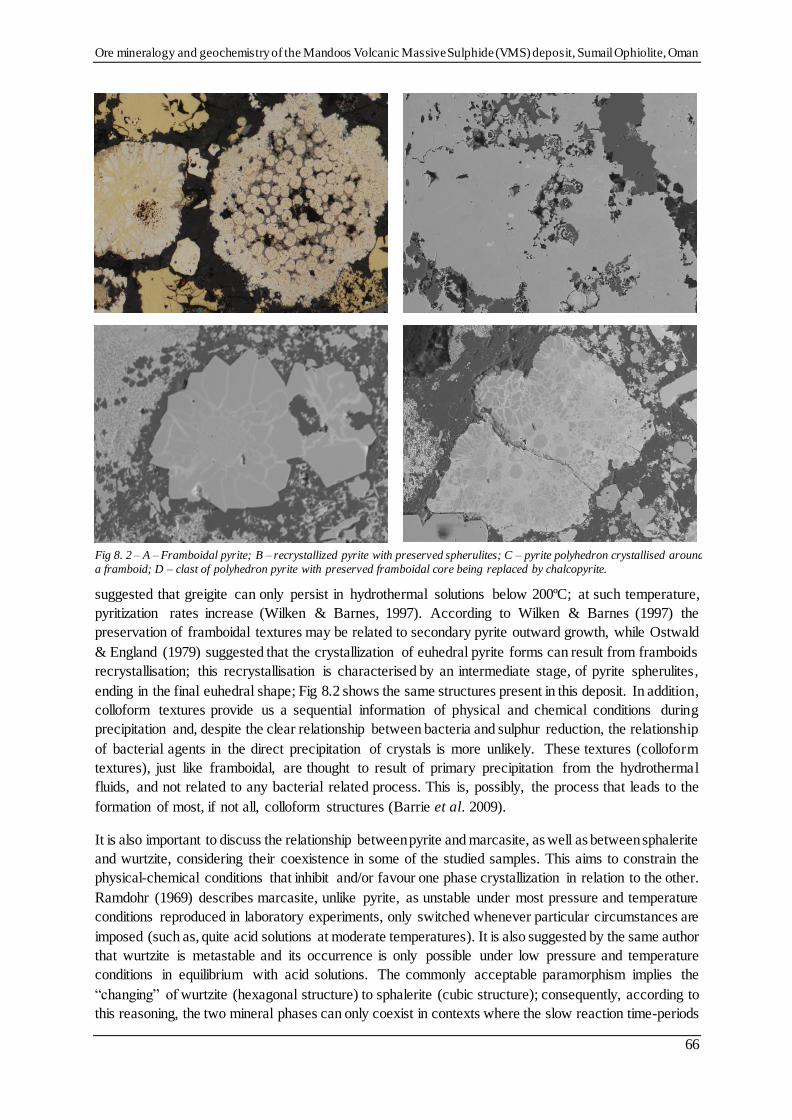
Ore mineralogy and geochemistry of the Mandoos Volcanic Massive Sulphide (VMS) deposit, Sumail Ophiolite, Oman
66
suggested that greigite can only persist in hydrothermal solutions below 200ºC; at such temperature,
pyritization rates increase (Wilken & Barnes, 1997). According to Wilken & Barnes (1997) the
preservation of framboidal textures may be related to secondary pyrite outward growth, while Ostwald
& England (1979) suggested that the crystallization of euhedral pyrite forms can result from framboids
recrystallisation; this recrystallisation is characterised by an intermediate stage, of pyrite spherulites,
ending in the final euhedral shape; Fig 8.2 shows the same structures present in this deposit. In addition,
colloform textures provide us a sequential information of physical and chemical conditions during
precipitation and, despite the clear relationship between bacteria and sulphur reduction, the relationship
of bacterial agents in the direct precipitation of crystals is more unlikely. These textures (colloform
textures), just like framboidal, are thought to result of primary precipitation from the hydrothermal
fluids, and not related to any bacterial related process. This is, possibly, the process that leads to the
formation of most, if not all, colloform structures (Barrie et al. 2009).
It is also important to discuss the relationship between pyrite and marcasite, as well as between sphalerite
and wurtzite, considering their coexistence in some of the studied samples. This aims to constrain the
physical-chemical conditions that inhibit and/or favour one phase crystallization in relation to the other.
Ramdohr (1969) describes marcasite, unlike pyrite, as unstable under most pressure and temperature
conditions reproduced in laboratory experiments, only switched whenever particular circumstances are
imposed (such as, quite acid solutions at moderate temperatures). It is also suggested by the same author
that wurtzite is metastable and its occurrence is only possible under low pressure and temperature
conditions in equilibrium with acid solutions. The commonly acceptable paramorphism implies the
“changing” of wurtzite (hexagonal structure) to sphalerite (cubic structure); consequently, according to
this reasoning, the two mineral phases can only coexist in contexts where the slow reaction time-periods
Fig 8. 2 – A – Framboidal pyrite; B – recrystallized pyrite with preserved spherulites; C – pyrite polyhedron crystallised around
a framboid; D – clast of polyhedron pyrite with preserved framboidal core being replaced by chalcopyrite.

8. Discussion
67
of the phase transformation are favoured. In sea mounds, dramatic variations in temperature and pH can
be recorded within short distances (millimetres to centimetres) due to the interaction of hydrothermal
vent fluids with cold sea water. Both minerals crystallise from acidic solutions; the mixture of such
solution with sea water would result in a pH increase. This allows to explain the common presence of
marcasite encased in pyrite crystals, where the abrupt variations in the chemical conditions promote the
crystallisation of the most stable phase. The same process can be used to explain the presence of
paramorphic sphalerite after wurtzite.
The Mandoos 1 stockwork is characterised by silicified basalts, where the silica is leached out from the
basalt due to high temperatures, increasing porosity and resulting in sulphide dissemination. The
continuous leaching can also be responsible for small/local collapses and creation of breccia zones. With
the system cooling, the stockwork silicification becomes stronger due to the remaining silica advected
from the deeper domains of the hydrothermal system. Strong silicification zones are seen associated
with larger euhedral pyrite clusters formed in vuggs and also large anhedral pyrite clasts, showing
breccia texture, possibly corresponding to local collapse zones.
As previously stated, the Mandoos sulphide ores are quite monotonous in composition and mainly
formed by iron sulphides, although the presence of accessory Cu- and Zn-rich phases is common. A
general paragenetic sequence resulted from petrography is illustrated in Fig 8.3. However, as seen
before, in these kind of geological environment, significant chemical variations can took place in short-
range space and such variations, combined with intense crumbling and mass-waste movements, may
lead to different textural interpretations depending on the sampled area of the massive sulphide orebody.
Fig 8. 3 – Schematic representation of the paragenetic sequence proposed for Mandoos 1 deposit.
The oxidation event is possibly synchronous of jaspers formation and the periodic leaching/silicification
events would be responsible for the same hydrothermal imprint in jaspers and silicified (footwall)
basalts. The sulphide dissemination in jaspers is possible due to an increasing of porosity during
leaching, leading also to the formation of veins and some collapse breccias, later silicified when the
system was subjected to cooling. The presence of the leached rims in the pyrite crystals indicate the
circulation of late Fe-poor fluids, evidenced by the leaching of iron from the jaspers.
When massive sulphides are not covered, sea floor weathering can produce umbers and ochres, where
massive sulphide breccias are oxidised and impregnated with silica in a colder and more oxidising
environment. Nevertheless, these can also be formed by direct precipitation of metals within the water
column, partly derived from the exhalative discharge, and further deposited in oxidising conditions
along with the siliciclastic sediments (largely dominated by phyllosilicates).

Ore mineralogy and geochemistry of the Mandoos Volcanic Massive Sulphide (VMS) deposit, Sumail Ophiolite, Oman
68
Whole rock chemistry, more precisely the REE normalised pattern analysis, suggests that sulphide ores
deposition is strongly influenced by a mixture of vent fluids and seawater, while the composition of
umber and ochres is mainly determined by processes of seawater scavenging followed by phyllosilicate
adsorption mechanisms (Fig 8.4). A mixture of seawater and vent fluids should also be involved in the
formation of mineralised jaspers, but in this case the seawater weight in the mixture proportion is
considerably higher. With the exception of umber and ochres, whose REE contents appear to derive
exclusively from seawater, the REE abundances in sulphide ores and jaspers are conceivably related to
the leaching and scavenging of footwall basalts synchronous of their hydrothermal alteration. It is known
that footwall volcanic rocks are leached by infiltrated seawater, circulating along fractures, producing a
variably modified seawater which is further released in hydrothermal chimneys, as vent fluid. Assuming
that REE concentrations are in equilibrium with the vent fluid (i.e. that no significant fractionation took
place after the massive sulphide ore and jaspers deposition) a simple simulation can be performed in
order to predict the ratio of seawater (SW) and basalt involved in such process. Regarding to footwall
less altered basalts (B), a SW:B mixing proportion scattered between 0.85:0.15 and 0.99:0.01 is needed
to simulate the REE enrichment displayed by the studied samples. If the more altered footwall basalts
(B’) are used, the requested SW:B’ proportion mixtures range between 0.50:0.50 and 0.95:0.05 because
B’ are significantly more depleted in REE than B. It is also noteworthy that SW:B and SW:B’
interactions simulate roughly the measured vent fluids in modern analogues magnitudes (TAG an EPR)
with mixing proportions between 0.999:0.001 and 0.9999:0.0001. Nevertheless, the pattern displayed
by these vent fluids, characterised by an evident Eu positive anomaly and positive LREE and HREE
fractionation, are not completely reproduced in this numerical simulation. This is related to the simplistic
modelling and rough approach to the problem, which does not consider other geochemical factors that
may control the vent fluid composition; as previously shown, there is evidence for a magmatic
contribution to the hydrothermal fluid responsible for the mineralisation, and this may be one cause for
the recorded differences.
Fig 8. 4 – Vent fluid REE binary simulation using seawater and basalt compositions.
1.E-06
1.E-05
1.E-04
1.E-03
1.E-02
1.E-01
1.E+00
1.E+01
1.E+02
La Ce Pr Nd Sm Eu Gd Tb Dy Ho Er Yb Lu
Sam
ple
/C1
Vent Fluid EPR Seawater Vent Fluid TAG FW less al tered basalt (B)
Fw altered basalt (B') SW:B (0.99:0.01) Sw:B ' (0.9999:0.0001)

9. Conclusions
69
9. Conclusions
The metal contents of drill-core and open-pit samples place the Mandoos deposit in the Cu-rich VMS
field, near the typical Mafic-type VMS deposits. Additionally, the 3D modelling performed with
MICROMINE estimates on ca. 8 Mt of ore with 1.72 wt% in Cu. The lack of evident chemical zonation
of the orebody, as indicated by the 3D modelling results, suggests also that metal zoning refinement
processes were not significant all through the evolving stages recorded by the ore-forming system at
Mandoos.
The massive ores are mainly composed of sulphide-rich breccias cemented by silica and/or zeolites,
with minor phyllosilicates. These breccias are polymictic, comprising clasts widely varied in size,
textural arrangements and mineral composition. They are possibly part of the talus found in many
hydrothermal field vents in present-day analogues, where the (cyclic) crumbling of hydrothermal
chimneys produce debris later cemented by siliceous fluids. This mineralisation type is characterised by
a monotonous and simple mineral assemblage mainly composed of pyrite and marcasite with minor
amounts of chalcopyrite, sphalerite and other Cu-rich phases.
The ubiquitous presence of primary textures, ranging from framboidal and colloform pyrite and
marcasite, to the preservation of pyritised tubeworm burrows also place the studied samples in a black-
smoker type vent. In these environments, the presence of framboidal pyrite crystal is interpreted as
consequence of the magnetic properties of greigite, the precursor of pyrite. Additionally, the presence
of marcasite and sphalerite (after pyrite and wurtzite, respectively) can be explained as a result of abrupt
pH (and T?) modifications experienced by the hydrothermal fluids, especially when mixture with sea-
water occurs in (sub)superficial conditions.
The formation of jaspers is considered to be a result of the temperature collapse of the hydrothermal
system, correlative of the late oxidisation evolving stage, where Cu-rich mineral phases are formed
(from chalcopyrite). Consequently, during the following bleaching of these silica and Fe-rich exhalative
rocks, sulphide mineralization also occurs, from the scavenging of iron from the jaspers.
When the massive sulphides are exposed to the oxidising cold sea-water, oxidation phenomena occur,
producing metalliferous sediments. These are easily distinguishable by their REE pattern and metal
contents, which indicate that they derive, mostly, from sea-water fluids. Furthermore, the REE patterns
for the massive sulphide breccias and mineralised jaspers are compatible with the mixture of vent fluid
and sea-water. Vent fluid simulations were performed and established mixtures of SW:B and SW:B’
scattered between 0.85:0.15 and 0.99:0.01, and 0.50:0.50 and 0.95:0.05, respectively, in order to reach
ores and jaspers REE enrichment magnitudes. Modern day analogues vent fluid REE enrichments are
predicted with mixtures of seawater and basalt ranging between 0.999:0.001 and 0.9999:0.0001,
although, the typical pattern is not reproduced due to a magmatic contribution to the hydrothermal fluid
which geochemical properties are not contemplated in the simulation.


Ore mineralogy and geochemistry of the Mandoos Volcanic Massive Sulphide (VMS) deposit, Sumail Ophiolite, Oman
71
References
ALABASTER, T., PEARCE, J.A. & MALPAS, J., 1982, The Volcanic Stratigraphy and Petrogenesis of the Oman
Ophiolite Complex. Contributions to Mineralogy and Petrology , 81, 168-183.
ALABASTER, T., & PEARCE, J.A., 1985, The interrelationship between magmatic and ore-forming hydrothermal
processes in the Oman ophiolite. Economic Geology, 80, 1–16.
BARRAT , J. A., KELLER, F., AMOSSÉ, J., TAYLOR, R. N., NESBITT , R. W. & HIRATA, T., 1996, Determination of rare
earth elements in sixteen silicate reference samples by ICP-MS after Tm addition and ion exchange separation.
Geostandards Newsletter, 20(1), 133-139.
BARRAT , J. A., YAMAGUCHI, A., GREENWOOD, R. C., BOHN, M., COTTEN, J., BENOIT , M. & FRANCHI, I. A., 2007,
The Stannern trend eucrites: Contamination of main group eucritic magmas by crustal partial melts. Geochimica
et Cosmochimica Acta, 71(16), 4108-4124.
BARRETT , T. J., JARVIS, I., LONGSTAFFE, F. J., & FARQUHAR, R., 1988, Geochemical aspects of hydrothermal
sediments in the eastern Pacific Ocean; an update. The Canadian Mineralogist, 26(3), 841-858.
BARRIE, C.T., HANNINGTION, M.D., 1999, Classification of Volcanic-Associated Massive Sulphide Deposits
Based on Host-Rock Composition. Chapter 1 in Barrie, C.T., and Hannington, M.D., (eds) Volcanic-Associated
Massive Sulphide Deposits: Processes and Examples in Modern and Ancient Settings. Reviews in Economic
Geology, 8, 1-12.
BARRIE, C. D., BOYCE, A. J., BOYLE, A. P., WILLIAMS, P. J., BLAKE, K., OGAWARA, T., & PRIOR, D. J., 2009,
Growth controls in colloform pyrite. American Mineralogist, 94(4), 415-429.
DILEK, Y., FURNES, H., 2009, Structure and Geochemistry of the Tethyan ophiolites and their Petrogenesis in
subduction rollback systems. Lithos, 113, 1-20
FLEET , A.J., & ROBERTSON, A.H.F., 1980, Ocean-ridge metalliferous and pelagic sediments of the Semail Nappe,
Oman. Journal of the Geological Society, 137, 403-422
FRANKLIN, J.M., GIBSON, H.L., JONASSON, I.R., GALLEY, A.G., 2005, Volcanogenic Massive Sulphides. Economic
Geology 99th Anniversary Volume, 523-560.
GALLEY, A.G., KOSKI, R.A., 1999, Setting and Characteristics of Ophiolite-Hosted Volcanogenic Massive
Sulphide Deposits . CHAPTER 10 IN BARRIE, C.T., & HANNINGTON, M.D., (EDS), Volcanic-Associated Massive
Sulphide Deposits: Processes and Examples in Modern and Ancient Settings. Reviews in Economic Geology, 8,
253-280.
GERMAN, C. R., HERGT , J., PALMER, M. R., & EDMOND, J. M., 1999, Geochemistry of a hydrothermal sediment
core from the OBS vent-field, 21 N East Pacific Rise. Chemical Geology, 155(1), 65-75.
GILGEN, S.A., DIAMOND, L.W., MERCOLLI, I., AL-TOBI, K., MAIDMENT, D.W., CLOSE, R., AL-TOWAYA, A., 2014,
Volcanostratigraphic Controls on the Occurrence of Massive Sulphide Deposits in the Sumail Ophiolite, Oman.
Economic Geology, 109, 1585-1610.
GLENNIE, K. W., BOEUF, M. G. A., CLARKE, M. H., MOODY-STUART, M., PILAAR, W. F. H., & REINHARDT , B. M.,
1973, Late Cretaceous nappes in Oman Mountains and their geologic evolution. AAPG Bulletin, 57(1), 5-27.
GODARD, M., DAUTRIA, J.-M., & PERRIN, M., 2003, Geochemical variability of the Oman Ophiolite lavas;
relationship with spatial distribution and paleomagnetic directions. Geochemistry, Geophysics, Geosystems, 4(6),
1-15.
HANNINGTON, M.D., 2014, Volcanogenic Massive Sulphide Deposits . IN HEINRICH D., HOLLAND, H.D. AND
TUREKIAN, K.K. (EDS), Treatise on Geochemistry (2nd Edition) , 13, 463-488.
IMMENHAUSER, A., SCHREURS, G., GNOS, E., OTERDOOM, H. W., & HARTMANN, B., 2000, Late Palaeozoic to
Neogene geodynamic evolution of the northeastern Oman margin. Geological Magazine, 137(1), 1-18.
KUSANO, Y., ADACHI, Y., MIYASHITA, S., UMINO, S., 2012, Lava accretion system around mid-ocean ridges:
Volcanic stratigraphy in the Wadi Fizh area, northern Oman ophiolite. Geochemistry, Geophysics, Geosystems,
13.
LI –H, SCHOONMAKER J.E., 2003, Chemical Composition and Mineralogy of Marine Sediments. In: Elsevier’s
Treatise on Geochemistry, Vol 7: Sediments, diagenesis, and sedimentary rocks. FT Mackenzie (Ed.) : 41-35.
Ore mineralogy and geochemistry of the Mandoos Volcanic Massive Sulphide (VMS) deposit, Sumail Ophiolite, Oman
72
LIPPARD, S.J., SHELTON, A.W., & GASS, I.G., 1986, The ophiolite of northern Oman. Blackwell Scientific
Publications Ltd, 165 p.
MACLEOD, C. J., & ROTHERY, D. A., 1992, Ridge axial segmentation in the Oman ophiolite: evidence from along-
strike variations in the sheeted dyke complex. Geological Society, London, Special Publications, 60(1), 39-63.
MAWARID MINING, 2014, Information Guide – Regional and Local Geology of Mandoos. Mawarid Mining,
Unpublished memorandum, 12p.
MILLS, R. A., & ELDERFIELD, H., 1995, Rare earth element geochemistry of hydrothermal deposits from the active
TAG Mound, 26 N Mid-Atlantic Ridge. Geochimica et Cosmochimica Acta , 59(17), 3511-3524.
OSTWALD, J., & ENGLAND, B. M., 1979, The relationship between euhedral and framboidal pyrite in base-metal
sulphide ores. Mineral. Mag, 43, 297-300.
PALME, H. & JONES, A., 2004, Solar system abundances of the Elements. In: Treatise on Geochemistry, Volume 1
(H.D. Holland & K.K. Turekian, eds.), Elsevier, Amsterdam, 41-61.
PALME, H. & O’NEILL, H. ST . C., 2004, Cosmochemical Estimates of Mantle Composition. In: Treatise on
Geochemistry, Volume 2 (R.W. Calson, eds.), Elsevier, Amsterdam, 1-38.
RAMDOHR, P., 1969, The ore minerals and their intergrowths. Elsevier.
ROBERTSON, A. H. F., & FLEET , A. J., 1976, The origins of rare earths in metalliferous sediments of the Troodos
Massif. Cyprus. Earth and Planetary Science Letters, 28(3), 385-394.
ROLLINSON, H., 2009, New models for the genesis of plagiogranites in the Oman ophiolite . Lithos, 112(3), 603-
614.
ROLLINSON, H.R., SEARLE, M.P., ABBASI, I.A., AL-LAZKI, A.I., AL KINDI, M.H., 2014, Tectonic evolution of the
Oman Mountains: an introduction, In ROLLISON, H.R., SEARLE, M.P., ABBASI, I.A., AL-LAZKI, A. & AL KINDY
(eds) Tectonic Evolution of the Oman Mountains. Geological Society, 392, 1-7.
SEARLE, M. P., & MALPAS, J., 1982, Petrochemistry and origin of sub-ophiolitic metamorphic and related rocks in
the Oman Mountains . Journal of the Geological Society, 139(3), 235-248.
SEARLE, M.P., & COX, J., 1999, Tectonic setting, origin, and obduction of the Oman ophiolite. Geological Society
of America Bulletin, 111, 104–122.
WILKIN, R. T., & BARNES, H. L., 1997, Formation processes of framboidal pyrite. Geochimica et Cosmochimica
Acta, 61(2), 323-339.
YOKOYAMA, T., MAKISHIMA, A. & NAKAMURA, E., 1999, Evaluation of the coprecipitation of incompatible trace
elements with fluoride during silicate rock dissolution by acid digestion. Chemical Geology, 157(3), 175-187.

Ore mineralogy and geochemistry of the Mandoos Volcanic Massive Sulphide (VMS) deposit, Sumail Ophiolite, Oman
XV
Appendix I – List of Samples
REF MountsThin
Section
Powder
WRREF Mounts
Thin
Section
Powder
WR
MD-P1-1-1 1 MD150-112.70 1
MD-P1-1-2 1 MD150-114.10 1 1
MD-P1-2-3 1 MD174-62.15 1 1
MD-P1-2-4 1 MD174-79.00 1 1
MD-P1-3-1 1 MD178-110.50 1 1
MD-P1-3-5 1 MD178-128.80 1 1
MD-P1-5-1 1 MD178-134.20 1 1 1
MD-P1-5-5 1 MD429-103.90 1
MD-P1-6-3 1 MD429-104.00 1
MD-P2-1-3 2 MD429-109.10 1 1
MD-P2-1-6 2 MD430-127.70 1
MD-P2-2A 1 1 MD430-129.00 1 1
MD-P2-2B 1 MD430-131.00 1
MD-P2-3-2 2 MD430-132.70 1
MD-P2-6-3 1 MD431-107.00 1 1
MD-P3-2-1 1 MD431-108.00 2 1
MD-P3-4-1 1 1 MD431-109.70 1 1
MD-P3-5-2 1 1 MD431-110.50 1 1
MD-P3-6-1 2
MD-P3-6-2 1
MD-P3-6-3 1
MD-NP-1 3 1
MD-NP-2 1
MD-NP-3 1 1
List of Samples

Ore mineralogy and geochemistry of the Mandoos Volcanic Massive Sulphide (VMS) deposit, Sumail Ophiolite, Oman
XVI
Appendix II – XRF detection Limits
Ba 6.9 Br 0.78
Cu 2.84 Nb 0.84
Zn 1.28 Mo 0.78
As 4.06 Ag 4.98
Pb 1.72 Sb 4.18
Sn 3.02 I 6.6
W 3.7 Hf 4.06
Bi 1.54 Tl 2.14
Cr 1.96 Th 2.52
Rb 0.64 U 1.22
Sr 0.72 La 10.08
Ta 3.86 Y 0.86
Cs 4.78 Nd 5.98
V 2.78 Sm 6.42
Cd 3.88 Yb 5.54
Co 4.54 Ce 10.9
Ni 2 Sc 3
Ga 0.94 Te 6.28
Ge 1.04 Zr 0.8
Se 0.84
XRF Detection Limits (ppm)

Ore mineralogy and geochemistry of the Mandoos Volcanic Massive Sulphide (VMS) deposit, Sumail Ophiolite, Oman
XVII
Appendix III – ICP-MS Instrumental detection limits, analytical and total proce dural blanks
pg.g -1 ng.g -1 ng.g -1
Li nd 20.6 48.6
Sc nd 1.05 1.24
Ti 0.969 630 642
V 0.278 19.6 20.2
Cr 1.56 1249 1252
Mn 2.90 76.0 82.0
Co 0.113 17.5 18.0
Ni 22.2 199 214
Cu 2.02 17.7 18.7
Zn 74.5 281 301
Ga 0.216 1.06 1.11
Rb 0.433 3.89 6.28
Sr 5.32 4.28 7.41
Y nd 0.093 0.171
Zr 1.38 4.61 5.38
Nb 1.71 1.83 2.37
Cs 0.100 1.13 1.28
Ba 20.1 7.84 8.35
La 0.121 0.115 0.307
Ce 0.151 0.289 0.606
Pr 0.040 0.022 0.070
Nd 0.084 0.077 0.100
Sm 0.078 0.061 0.065
Eu 0.065 0.081 0.090
Gd 0.259 0.123 0.134
Tb nd 0.018 0.047
Dy 0.079 0.041 0.045
Ho 0.025 0.008 0.018
Er 0.033 0.070 0.073
Yb 0.051 0.022 0.029
Lu 0.013 0.014 0.021
Hf 1.21 0.225 0.240
Ta 0.701 0.313 0.413
Pb 0.245 7.05 7.97
Th 0.247 0.035 0.073
U 0.036 0.064 0.076
Instrumental
detection limit
Analytical
procedural blank
Total procedural
blank

Ore mineralogy and geochemistry of the Mandoos Volcanic Massive Sulphide (VMS) deposit, Sumail Ophiolite, Oman
XVIII
Appendix IV- EPMA Analytical Conditions
Element X-Ray Crystal Standard
Bi Ma PETJ Bismuth Selenide
Ga La TAP Metal l ic Ga
Pb Ma PETJ Galena
Au Ma PETH Au
Ag La PETJ Ag
Ge La TAP Metal l ic Ge
Cd La PETJ Cd
Mo La PETH Molybdenite
In La PETJ Metal l ic In
As La TAP Gal ium Arsenide
Sn La PETJ Metal l ic Sn
S Ka PETH Pyri te
Ni Ka LIF Pentlandite
Se La TAP Bismuth Selenide
Zn Ka LIF Sphaleri te
Fe Ka LIFH Pyri te
Sb La PETJ Stibnite
Mn Ka PETJ Bustamite
Co Ka LIFH Skutterudite
Cu Ka LIFH Cupri te
EPMA Analytical Conditions
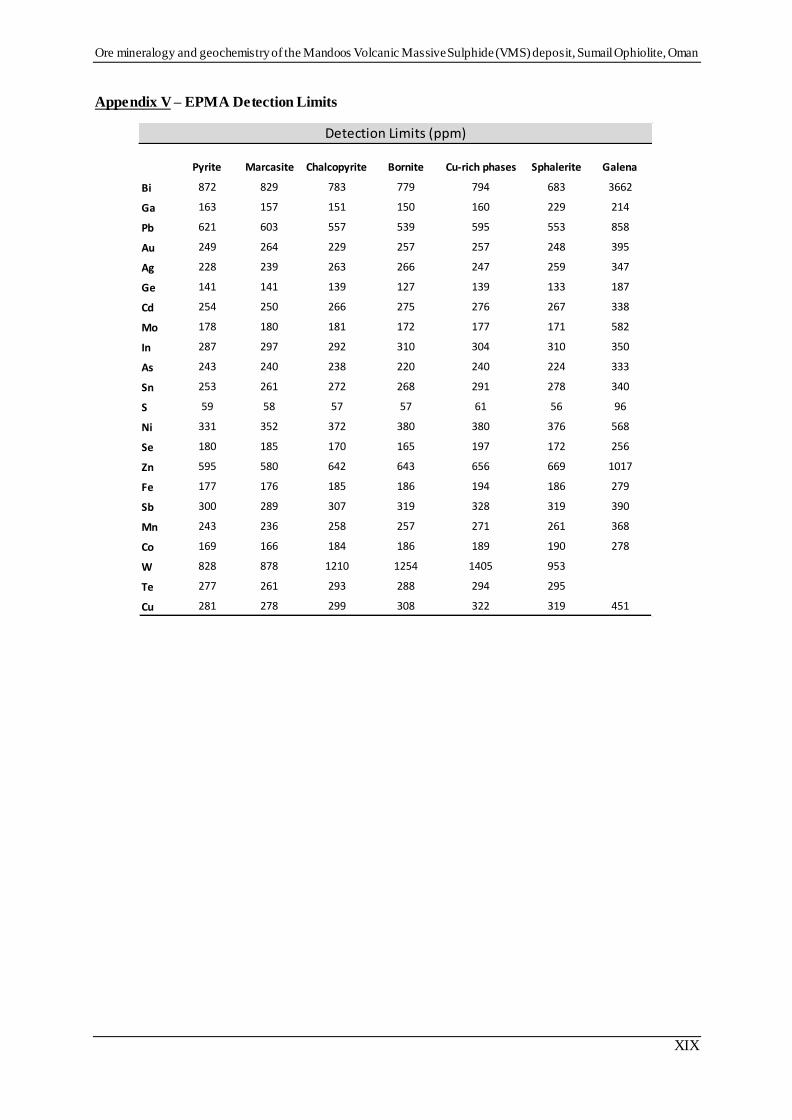
Ore mineralogy and geochemistry of the Mandoos Volcanic Massive Sulphide (VMS) deposit, Sumail Ophiolite, Oman
XIX
Appendix V – EPMA Detection Limits
Pyrite Marcasite Chalcopyrite Bornite Cu-rich phases Sphalerite Galena
Bi 872 829 783 779 794 683 3662
Ga 163 157 151 150 160 229 214
Pb 621 603 557 539 595 553 858
Au 249 264 229 257 257 248 395
Ag 228 239 263 266 247 259 347
Ge 141 141 139 127 139 133 187
Cd 254 250 266 275 276 267 338
Mo 178 180 181 172 177 171 582
In 287 297 292 310 304 310 350
As 243 240 238 220 240 224 333
Sn 253 261 272 268 291 278 340
S 59 58 57 57 61 56 96
Ni 331 352 372 380 380 376 568
Se 180 185 170 165 197 172 256
Zn 595 580 642 643 656 669 1017
Fe 177 176 185 186 194 186 279
Sb 300 289 307 319 328 319 390
Mn 243 236 258 257 271 261 368
Co 169 166 184 186 189 190 278
W 828 878 1210 1254 1405 953
Te 277 261 293 288 294 295
Cu 281 278 299 308 322 319 451
Detection Limits (ppm)
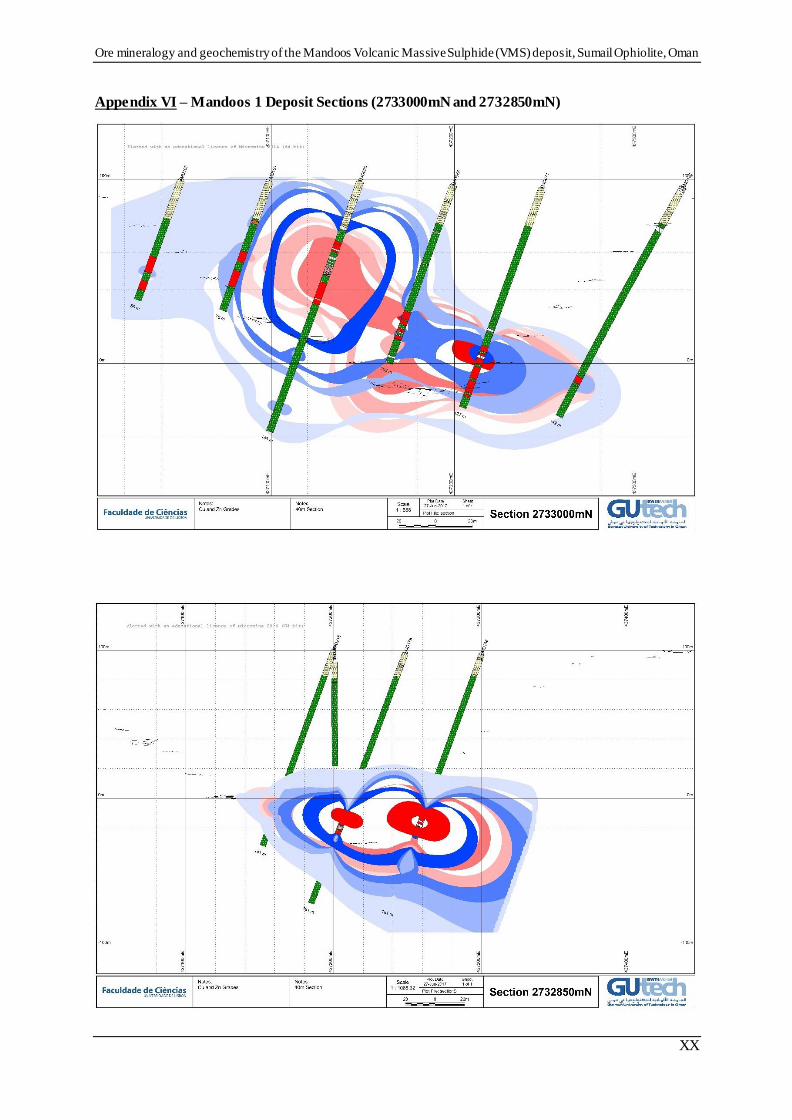
Ore mineralogy and geochemistry of the Mandoos Volcanic Massive Sulphide (VMS) deposit, Sumail Ophiolite, Oman
XX
Appendix VI – Mandoos 1 Deposit Sections (2733000mN and 2732850mN)

Ore mineralogy and geochemistry of the Mandoos Volcanic Massive Sulphide (VMS) deposit, Sumail Ophiolite, Oman
XXI
Appendix VII – EPMA Analyses Statistics
Median Min Max Mean Std-Dev Median Min Max Mean Std-Dev Median Min Max Mean Std-Dev Median Min Max Mean Std-Dev Median Min Max Mean Std-Dev Median Min Max Mean Std-Dev Median Min Max Mean Std-Dev
Bi 0.000 0.000 0.018 0.000 0.001 0.000 0.000 0.015 0.000 0.001 0.000 0.000 0.055 0.001 0.006 0.000 0.000 0.000 0.000 0.000 0.000 0.000 0.346 0.008 0.045 0.000 0.000 0.068 0.003 0.011 0.000 0.000 0.000 0.000 0.000
Ga 0.000 0.000 0.071 0.004 0.010 0.000 0.000 0.045 0.004 0.009 0.000 0.000 0.087 0.007 0.015 0.007 0.000 0.025 0.008 0.008 0.000 0.000 0.093 0.010 0.018 0.000 0.000 0.000 0.000 0.000 0.006 0.000 0.016 0.006 0.007
Pb 0.018 0.000 0.707 0.046 0.084 0.020 0.000 0.385 0.042 0.059 0.034 0.000 0.265 0.048 0.050 0.088 0.000 0.142 0.077 0.055 0.057 0.000 0.293 0.065 0.065 0.011 0.000 0.496 0.039 0.060 86.393 85.682 87.254 86.308 0.653
Au 0.005 0.000 0.069 0.012 0.016 0.005 0.000 0.096 0.013 0.018 0.000 0.000 0.072 0.012 0.017 0.000 0.000 0.036 0.004 0.011 0.000 0.000 0.070 0.010 0.019 0.000 0.000 0.073 0.010 0.016 0.000 0.000 0.000 0.000 0.000
Ag 0.000 0.000 0.452 0.012 0.033 0.000 0.000 0.061 0.010 0.016 0.000 0.000 0.067 0.011 0.015 0.015 0.000 0.052 0.019 0.020 0.022 0.000 0.133 0.029 0.030 0.000 0.000 0.076 0.010 0.015 0.000 0.000 0.006 0.001 0.003
Ge 0.000 0.000 0.037 0.002 0.006 0.000 0.000 0.022 0.002 0.004 0.000 0.000 0.055 0.004 0.009 0.000 0.000 0.009 0.001 0.003 0.000 0.000 0.045 0.002 0.007 0.000 0.000 0.148 0.008 0.019 0.000 0.000 0.037 0.010 0.016
Cd 0.000 0.000 0.076 0.007 0.013 0.000 0.000 0.056 0.007 0.012 0.000 0.000 0.072 0.009 0.015 0.000 0.000 0.043 0.006 0.012 0.008 0.000 0.097 0.017 0.023 0.203 0.000 0.673 0.237 0.163 0.000 0.000 0.000 0.000 0.000
Mo 0.000 0.000 0.082 0.008 0.014 0.000 0.000 0.059 0.008 0.014 0.034 0.000 0.109 0.036 0.023 0.026 0.000 0.055 0.026 0.018 0.034 0.000 0.077 0.032 0.022 0.056 0.000 0.125 0.056 0.025 0.000 0.000 0.000 0.000 0.000
In 0.007 0.000 0.097 0.016 0.019 0.006 0.000 0.077 0.018 0.020 0.006 0.000 0.100 0.015 0.020 0.013 0.000 0.079 0.020 0.023 0.002 0.000 0.058 0.012 0.015 0.000 0.000 0.064 0.008 0.015 0.000 0.000 0.046 0.009 0.021
As 0.007 0.000 0.572 0.030 0.066 0.003 0.000 0.465 0.015 0.048 0.000 0.000 0.107 0.011 0.017 0.003 0.000 0.039 0.006 0.011 0.004 0.000 12.643 1.109 2.766 0.000 0.000 0.177 0.009 0.018 0.003 0.000 0.022 0.006 0.009
Sn 0.000 0.000 0.070 0.011 0.016 0.002 0.000 0.064 0.011 0.017 0.000 0.000 0.198 0.015 0.025 0.000 0.000 0.071 0.016 0.023 0.000 0.000 0.063 0.012 0.017 0.000 0.000 0.066 0.009 0.015 0.006 0.000 0.041 0.016 0.016
S 53.097 47.820 54.054 52.917 0.691 53.129 51.272 53.868 53.032 0.457 34.935 32.604 36.432 34.864 0.373 26.270 26.094 26.644 26.267 0.138 30.708 24.929 41.090 30.457 3.404 33.309 31.900 39.116 33.333 0.648 13.590 12.954 13.625 13.453 0.283
Ni 0.003 0.000 0.080 0.013 0.018 0.004 0.000 0.068 0.012 0.016 0.000 0.000 0.082 0.011 0.017 0.000 0.000 0.033 0.005 0.010 0.000 0.000 0.074 0.011 0.017 0.005 0.000 0.059 0.013 0.017 0.000 0.000 0.000 0.000 0.000
Se 0.009 0.000 0.269 0.015 0.027 0.000 0.000 0.051 0.007 0.012 0.009 0.000 0.099 0.016 0.020 0.000 0.000 0.036 0.006 0.011 0.002 0.000 0.095 0.012 0.018 0.005 0.000 0.102 0.016 0.020 0.010 0.000 0.069 0.020 0.029
Zn 0.032 0.000 2.789 0.142 0.371 0.032 0.000 0.980 0.082 0.158 0.092 0.000 5.029 0.436 0.758 0.190 0.015 0.906 0.243 0.258 0.422 0.003 25.074 2.443 4.738 64.386 45.987 67.892 63.252 4.159 0.558 0.473 2.055 1.060 0.631
Fe 46.247 41.087 47.070 45.973 0.853 46.146 42.926 46.910 45.986 0.609 30.332 26.831 32.586 30.195 0.614 11.463 11.304 12.183 11.580 0.260 13.703 1.253 34.715 13.798 6.794 1.255 0.088 14.287 2.316 2.592 0.111 0.065 0.341 0.154 0.108
Sb 0.000 0.000 0.103 0.011 0.016 0.000 0.000 0.053 0.010 0.014 0.000 0.000 0.097 0.010 0.017 0.005 0.000 0.042 0.012 0.016 0.005 0.000 1.028 0.106 0.247 0.000 0.000 0.082 0.009 0.017 0.113 0.000 0.270 0.135 0.108
Mn 0.004 0.000 0.636 0.027 0.077 0.007 0.000 1.365 0.072 0.197 0.000 0.000 0.212 0.018 0.037 0.000 0.000 0.036 0.008 0.014 0.009 0.000 0.107 0.017 0.021 0.011 0.000 4.130 0.215 0.724 0.000 0.000 0.000 0.000 0.000
Co 0.020 0.000 0.840 0.032 0.064 0.020 0.000 0.076 0.019 0.014 0.010 0.000 0.062 0.013 0.013 0.004 0.000 0.037 0.010 0.013 0.004 0.000 0.047 0.009 0.012 0.003 0.000 0.101 0.011 0.018 0.000 0.000 0.038 0.013 0.016
W 0.000 0.000 0.298 0.028 0.050 0.000 0.000 0.231 0.029 0.052 0.000 0.000 0.000 0.000 0.000 0.000 0.000 0.000 0.000 0.000 0.000 0.000 0.000 0.000 0.000 0.000 0.000 0.293 0.033 0.055 - - - - -
Te 0.000 0.000 0.130 0.017 0.026 0.002 0.000 0.086 0.014 0.021 0.000 0.000 0.116 0.011 0.018 0.000 0.000 0.052 0.012 0.023 0.044 0.000 7.348 0.590 1.557 0.000 0.000 0.143 0.011 0.020 - - - - -
Cu 0.021 0.000 8.978 0.367 1.031 0.000 0.000 3.982 0.178 0.491 34.303 31.609 38.136 34.201 0.910 63.201 61.317 63.997 62.854 0.880 53.250 22.359 72.772 50.951 11.360 0.266 0.000 9.861 0.651 1.214 0.381 0.090 0.503 0.315 0.187
Marcas i te (n=111)Pyri te (n=310)
EPMA Analysis Statistics
Galena (n=5)Sphaleri te (n=181)Cu-rich phases (n=64)Bornite (n=16)Chalcopyri te (n=262)

Ore mineralogy and geochemistry of the Mandoos Volcanic Massive Sulphide (VMS) deposit, Sumail Ophiolite, Oman
XXII
Appendix VIII
Covellite
Bi 0.000 0.000 0.000 0.000 0.000 0.000 0.000 0.000 0.000 0.000 0.000 0.000 0.000 0.000 0.000 0.000 0.000 0.068 0.000 0.000 0.000
Ga 0.000 0.000 0.000 0.000 0.000 0.000 0.027 0.000 0.027 0.012 0.000 0.000 0.000 0.000 0.013 0.000 0.000 0.000 0.000 0.006 0.000
Pb 0.000 0.076 0.092 0.122 0.000 0.000 0.085 0.000 0.000 0.044 0.088 0.000 0.057 0.075 0.050 0.000 0.028 0.000 85.698 86.393 85.682
Au 0.000 0.022 0.009 0.000 0.000 0.000 0.000 0.000 0.000 0.000 0.036 0.000 0.000 0.000 0.000 0.000 0.001 0.000 0.000 0.000 0.000
Ag 0.037 0.007 0.000 0.000 0.006 0.000 0.000 0.000 0.000 0.035 0.016 0.004 0.000 0.051 0.049 0.000 0.028 0.019 0.000 0.006 0.000
Ge 0.000 0.000 0.001 0.000 0.000 0.000 0.021 0.000 0.000 0.000 0.000 0.000 0.000 0.000 0.015 0.000 0.010 0.000 0.011 0.000 0.000
Cd 0.000 0.000 0.000 0.000 0.000 0.000 0.000 0.007 0.011 0.043 0.000 0.018 0.005 0.000 0.046 0.293 0.154 0.168 0.000 0.000 0.000
Mo 0.000 0.014 0.018 0.000 0.017 0.023 0.027 0.015 0.026 0.024 0.012 0.042 0.019 0.000 0.000 0.077 0.072 0.060 0.000 0.000 0.000
In 0.006 0.000 0.034 0.053 0.038 0.000 0.000 0.013 0.043 0.013 0.010 0.079 0.028 0.019 0.006 0.000 0.000 0.043 0.000 0.000 0.000
As 0.184 0.000 0.000 0.031 0.003 0.000 0.000 0.026 0.060 0.000 0.000 0.008 0.000 0.000 0.000 0.000 0.000 0.001 0.000 0.000 0.006
Sn 0.017 0.000 0.004 0.008 0.000 0.000 0.000 0.010 0.029 0.010 0.041 0.000 0.000 0.000 0.000 0.000 0.000 0.022 0.022 0.006 0.000
S 53.255 53.165 53.204 52.895 52.746 53.105 35.192 34.812 35.065 26.270 26.331 26.115 31.308 27.380 28.296 33.354 33.151 33.328 12.954 13.597 13.590
Ni 0.003 0.037 0.000 0.011 0.021 0.018 0.000 0.036 0.000 0.019 0.033 0.012 0.000 0.000 0.000 0.016 0.059 0.000 0.000 0.000 0.000
Se 0.020 0.008 0.000 0.010 0.000 0.013 0.050 0.050 0.007 0.000 0.000 0.000 0.039 0.000 0.004 0.045 0.055 0.045 0.000 0.023 0.000
Zn 0.017 0.000 0.000 0.748 0.138 0.246 0.684 2.541 0.996 0.078 0.082 0.109 0.202 0.076 0.202 65.035 65.600 65.646 1.077 0.558 0.473
Fe 46.524 46.034 46.176 45.169 45.514 45.702 31.262 29.560 30.611 11.412 11.674 11.348 1.299 1.253 1.525 0.662 0.588 0.661 0.341 0.134 0.111
Sb 0.034 0.019 0.000 0.000 0.000 0.000 0.024 0.002 0.000 0.042 0.000 0.000 0.005 0.042 0.033 0.001 0.000 0.000 0.000 0.270 0.215
Mn 0.037 0.000 0.002 0.044 0.054 0.060 0.156 0.105 0.072 0.000 0.031 0.004 0.000 0.000 0.000 0.030 0.000 0.000 0.000 0.000 0.000
Co 0.007 0.019 0.011 0.021 0.028 0.007 0.004 0.025 0.000 0.000 0.000 0.004 0.000 0.004 0.000 0.012 0.013 0.000 0.038 0.010 0.000
W 0.000 0.000 0.000 0.181 0.000 0.000 0.000 0.000 0.000 0.000 0.000 0.000 0.000 - - 0.049 0.086 0.002 - - -
Te 0.001 0.000 0.028 0.000 0.021 0.013 0.000 0.006 0.009 0.000 0.052 0.000 0.043 - - 0.055 0.001 0.000 - - -
Cu 0.003 0.180 0.228 0.564 0.534 0.584 33.450 33.119 33.753 63.702 63.435 63.997 66.734 72.772 71.194 0.568 0.411 0.249 0.090 0.458 0.503
Bi 0.000 0.000 0.000 0.000 0.000 0.000 0.000 0.000 0.000 0.000 0.000 0.000 0.000 0.000 0.000 0.000 0.000 0.000 0.000 0.000 0.000
Ga 0.000 0.000 0.000 0.000 0.000 0.000 0.001 0.000 0.001 0.001 0.000 0.000 0.000 0.000 0.006 0.000 0.000 0.000 0.001 0.000 0.000
Pb 0.000 0.000 0.001 0.001 0.000 0.000 0.001 0.000 0.000 0.001 0.002 0.000 0.000 0.012 0.008 0.000 0.000 0.000 1.005 0.983 0.976
Au 0.000 0.000 0.000 0.000 0.000 0.000 0.000 0.000 0.000 0.000 0.001 0.000 0.000 0.000 0.000 0.000 0.000 0.000 0.000 0.000 0.000
Ag 0.000 0.000 0.000 0.000 0.000 0.000 0.000 0.000 0.000 0.002 0.001 0.000 0.000 0.016 0.014 0.000 0.000 0.000 0.000 0.000 0.000
Ge 0.000 0.000 0.000 0.000 0.000 0.000 0.001 0.000 0.000 0.000 0.000 0.000 0.000 0.000 0.007 0.000 0.000 0.000 0.000 0.000 0.000
Cd 0.000 0.000 0.000 0.000 0.000 0.000 0.000 0.000 0.000 0.002 0.000 0.001 0.000 0.000 0.013 0.003 0.001 0.001 0.000 0.000 0.000
Mo 0.000 0.000 0.000 0.000 0.000 0.000 0.001 0.000 0.000 0.001 0.001 0.002 0.000 0.000 0.000 0.001 0.001 0.001 0.000 0.000 0.000
In 0.000 0.000 0.000 0.001 0.000 0.000 0.000 0.000 0.001 0.001 0.000 0.003 0.000 0.005 0.002 0.000 0.000 0.000 0.001 0.000 0.000
As 0.003 0.000 0.000 0.001 0.000 0.000 0.000 0.001 0.001 0.000 0.000 0.001 0.000 0.000 0.000 0.000 0.000 0.000 0.000 0.000 0.000
Sn 0.000 0.000 0.000 0.000 0.000 0.000 0.000 0.000 0.000 0.000 0.002 0.000 0.000 0.000 0.000 0.000 0.000 0.000 0.001 0.000 0.000
S 2.000 2.000 2.000 2.000 2.000 2.000 2.000 2.000 2.000 4.000 4.000 4.000 1.000 28.000 28.000 1.000 1.000 1.000 1.000 1.000 1.000
Ni 0.000 0.001 0.000 0.000 0.000 0.000 0.000 0.001 0.000 0.002 0.003 0.001 0.000 0.000 0.000 0.000 0.001 0.000 0.000 0.000 0.000
Se 0.000 0.000 0.000 0.000 0.000 0.000 0.001 0.001 0.000 0.000 0.000 0.000 0.001 0.000 0.002 0.001 0.001 0.001 0.000 0.001 0.000
Zn 0.000 0.000 0.000 0.014 0.003 0.005 0.019 0.072 0.028 0.006 0.006 0.008 0.003 0.038 0.098 0.956 0.970 0.966 0.057 0.020 0.017
Fe 1.003 0.994 0.997 0.981 0.991 0.988 1.020 0.975 1.002 0.998 1.018 0.998 0.024 0.736 0.866 0.011 0.010 0.011 0.018 0.006 0.005
Sb 0.000 0.000 0.000 0.000 0.000 0.000 0.000 0.000 0.000 0.002 0.000 0.000 0.000 0.011 0.009 0.000 0.000 0.000 0.000 0.005 0.004
Mn 0.001 0.000 0.000 0.001 0.001 0.001 0.005 0.004 0.002 0.000 0.003 0.000 0.000 0.000 0.000 0.001 0.000 0.000 0.002 0.000 0.000
Co 0.000 0.000 0.000 0.000 0.001 0.000 0.000 0.001 0.000 0.000 0.000 0.000 0.000 0.002 0.000 0.000 0.000 0.000 0.000 0.000 0.000
W 0.000 0.000 0.000 0.001 0.000 0.000 0.000 0.000 0.000 0.000 0.000 0.000 0.000 - - 0.000 0.000 0.000 - - -
Te 0.000 0.000 0.000 0.000 0.000 0.000 0.000 0.000 0.000 0.000 0.002 0.000 0.000 - - 0.000 0.000 0.000 - - -
Cu 0.000 0.003 0.004 0.011 0.010 0.011 0.959 0.960 0.971 4.894 4.863 4.946 1.076 37.552 35.548 0.009 0.006 0.004 0.002 0.017 0.019
Sphalerite Galena
EPMA Representative Analysis
Pyrite Marcasite Chalcopyrite Bornite Spionkopite

Ore mineralogy and geochemistry of the Mandoos Volcanic Massive Sulphide (VMS) deposit, Sumail Ophiolite, Oman
XXIII
Appendix IX – Mandoos 1 Samples Data
Note: Highlighted cells in the major elements section correspond to data converted from ppm to wt%, except S wich was converted from Ox% to element%. The highlighted trace elements cells were converted from wt% to ppm.
Sulphide Ores Umber & Ochres Jaspers
Sample MD-NP-1 MD-P1-1-1 MD-174-79.00 MD-P3-4-1 MD-178-128.80 MD-429-109.10 MD-431-107.00 MD-431-108.00 MD-431-109.70 MD-431-110.5 MD-178-110.5 MD-P2-2A MD-P2-2B MD-429-104.00 MD-174-62.15 MD-178-134.20 MD-150.114.10 MD-NP-3
SiO2 wt% 11.022 0.273 8.847 2.663 11.585 12.78 13.871 12.45 10.45 45.451 35.013 18.174 25.16 40.131 30.053 10.45
Al2O3 wt% 5.457 0.097 0.28 1.165 1.474 0.037 0.053 0.039 0.044 3.648 3.247 2.097 3.562 2.134 0.447 0.044
TiO2 wt% 0.02 0.004 0.157 0.162 0.057 0.125 0.05 0.01
Fe2O3 wt% 3.955 22.459 19.686 24.731 18.857 18.992 18.818 18.287 19.208 26.519 35.212 49.928 54.726 28.491 16.559 19.208
MgO wt% 0.296 0.311 0.097 0.16 0.031 0.033 0.031 2.235 1.988 1.822 2.292 1.349 MnO wt% 0.044 0.0080 0.007 0.21 0.014 0.004 0.004 0.007 0.011 0.008 1.778 0.681 0.456 0.407 0.374 0.199 0.012 47.189
CaO wt% 1.417 0.018 0.024 16.353 0.397 0.115 0.014 0.015 0.019 0.024 5.88 12.609 6.226 9.495 2.668 1.016 0.134 0.024
Na2O wt% 0.048 0.068 0.097 0.041 0.073 0.055 0.298 0.055
K2O wt% 0.045 0.005 0.034 0.025 0.031 0.004 0.007 0.007 0.008 0.313 0.322 0.065 0.135 0.068 0.022 0.008
P2O5 wt% 0.032 1.277 0.877 1.317 1.438 0.826 0.116
S wt% 12.6 16.6 14.8 15.3 14.2 14.9 14.0 14.4 14.5 0.2 4.6 3.8 1.5 5.4 11.4 14.5
Cu wt% 2.448 0.267 0.121 0.514 0.57 0.653 0.681 0.248 0.297 0.009 0.017 0.518 0.116 3.725 1.07 0.297
Zn wt% 29.118 0.057 0.008 0.048 0.726 0.034 0.014 0.052 0.017 0.05 0.051 0.105 0.079 0.134 0.023 0.017
Pb wt% 0.005 0.006 0.004 0.004 0.004 0.002 0.007 0.008 0.005 0.003 0.008 0.004 0.004 0.028 0.009 0.02 0.003 0.003
ppm Li (ICP-MS) 0.32 0.01 7.19 0.1 4.2 5.79 2.61 4.33 1.47 0.97 21.15 11.17 13.17 6.61 9.46 14.6 6.21 2.59
Sc (ICP-MS) 4.59 4.12 5.18 2.33 4.68 2.11 0.38
V (ICP-MS) 65.69 8.81 8.7 23 33.89 56.06 62.08 67.15 20.84 53.58 165 343 778 571 931 408 63 371
Cr 18.9 22.2 55.9 40 23.9 4.64 15.9 5.5 6 13.5 15.64 97.8 66.7 69.6 92.3 140 33 16.24
Co (ICP-MS) 0.66 42.14 106.47 225.57 33.42 422.58 14.42 88.4 9.76 29.36 27.6 5.25 8.45 48.92 76.72 114.79 33.48 101.73
Ni (ICP-MS) 8.08 4.65 7.2 7.93 3.7 10.59 15.08 1.6 9.56 185.4 72.1 99.4 73.1 130.2 35.1 8.4 169.2
Ga (ICP-MS) 166.32 2.55 2.24 1.5 12.45 8.81 11.97 6.44 9.22 6.24 3.9 11.5 11.6 48.9 49.5 13.9 2.5 12.8
Ge (ICP-MS) 0.76 5.49 6.01 4.48 6.43 6.37 5.95 5.34 4.92 4.09 2.81 2.89 5.96 8.73 6.28 4 4.34 1.99
As (ICP-MS) 60.31 1024.23 244.57 323.89 476.47 265.3 303.71 280.87 342.55 273.51 383.01 66.68 165.74 322.34 229 204.05 491.11 84.13
Se (ICP-MS) 1.97 6.09 43.28 11.571 3.76 25.85 2.04 5.73 1.76 2.46 0.198 0.101 0.204 1.326 0.777 18.85 4.054 0.107
Rb (ICP-MS) 0.28 0.03 0.61 0.34 0.32 0.04 0.08 0.14 0.06 0.05 4.37 10.71 13.25 1.83 5.07 0.91 0.16 0.58
Sr (ICP-MS) 13.32 0.5 4.46 19.98 90.66 0.64 0.49 0.64 0.77 0.46 115.9 117.13 62.26 36.21 59.96 51.18 2.25 447.46
Y (ICP-MS) 0.538 0.026 0.18 3.7 0.092 0.144 0.148 0.27 0.106 0.082 60.03 40.86 55.88 27.96 57.28 27.01 2.43 2.03
Zr (ICP-MS) 1.035 0.077 0.182 0.4 0.085 0.144 0.167 0.343 0.114 0.119 33.85 27.29 33.96 14.44 30.94 12.07 2.71 1.51
Nb (ICP-MS) 0.024 0.01 0.01 0.015 0.02 0.04 0.012 2.735 1.832 2.396 1.088 2.354 0.913 0.178 0.128
Mo (ICP-MS) 108.27 8.11 3.36 17.556 26.51 1.57 8.04 3.32 2.45 4 0.443 1.191 1.44 14.707 13.412 10.498 83.082 248.007
Ag (ICP-MS) 1.69 0.194 0.238 1.062 0.372 0.233 0.872 0.962 0.642 0.87 0.019 0.018 0.018 0.332 0.022 0.601 0.592 0.004
Cd (ICP-MS) 2277.78 3.68 1.16 2.384 53.37 0.31 3.07 2.14 4.42 1.16 2.736 0.053 0.022 0.36 0.045 3.912 1.469 0.24
In (ICP-MS) 20.99 3.14 1.45 0.862 0.62 2.37 9.2 16.58 5.17 6.98 0.614 1.252 0.673 4.783 4.336 2.943 2.086 0.013
Sn (ICP-MS) 3.36 2.55 18.64 0.368 0.31 5.69 23.41 24.27 6.44 8.98 2.27 3.237 3.702 3.133 3.984 1.993 1.643 1.148
Sb (ICP-MS) 27.31 6.58 7.64 1.796 5.55 2.04 7.52 6.12 6.74 4.27 1.156 0.766 1.308 4.434 2.821 1.61 5.145 1.282
Te (ICP-MS) 0.4 27.46 5.79 13.998 3.44 21.78 10.93 15.39 3.09 28.58 0.327 0.561 0.828 1.425 5.812 6.201 1.979 0.017
Cs (ICP-MS) 0.041 0.019 0.022 0.019 0.015 0.26 0.675 0.888 0.106 0.345 0.04 0.018
Ba (ICP-MS) 2.17 0.12 6.29 0.8 34.96 0.13 0.32 0.66 0.33 0.3 78.8 27.1 28.5 9.1 25.4 17.1 1.5 742.5
La (ICP-MS) 0.062 0.013 0.041 0.38 0.029 0.037 0.034 0.049 0.02 0.022 50.07 29.25 34.58 18.8 34.97 12.1 1.04 2.21
Ce (ICP-MS) 0.147 0.039 0.04 0.5 0.039 0.04 0.071 0.092 0.031 0.042 16.5 11.6 12.9 6.5 12.9 6 0.8 5.9
Pr (ICP-MS) 0.022 0.09 0.011 0.013 8.22 4.68 6.33 3.12 6.08 2.22 0.23 0.45
Nd (ICP-MS) 0.132 0.034 0.035 0.49 0.025 0.041 0.064 0.053 0.027 0.031 34.13 19.72 27.08 12.7 25.29 9.51 1.02 1.7
Sm (ICP-MS) 0.043 0.013 0.14 0.013 0.022 0.016 6.62 3.94 5.59 2.47 5.14 2.04 0.24 0.45
Eu (ICP-MS) 0.021 0.1 0.013 1.89 1.17 1.74 0.74 1.49 0.58 0.13 0.01
Gd (ICP-MS) 0.072 0.021 0.22 0.016 0.021 0.026 8.38 5.24 7.49 3.2 6.89 2.83 0.27 0.42
Tb (ICP-MS) 0.011 0.039 1.198 0.78 1.089 0.466 1.01 0.43 0.044 0.092
Dy (ICP-MS) 0.084 0.022 0.31 0.014 0.017 0.022 0.031 0.011 0.012 7.8 4.89 7.08 3.02 6.61 3.02 0.31 0.62
Ho (ICP-MS) 0.019 0.08 1.7 1.11 1.57 0.68 1.52 0.71 0.07 0.14
Er (ICP-MS) 0.055 0.016 0.24 0.014 0.021 0.027 4.81 3.12 4.51 1.93 4.34 2.07 0.22 0.4
Yb (ICP-MS) 0.055 0.015 0.21 0.012 0.018 0.022 0.033 3.96 2.73 3.73 1.63 3.7 1.79 0.25 0.51
Lu (ICP-MS) 0.03 0.54 0.4 0.55 0.23 0.53 0.27 0.04 0.08
Hf (ICP-MS) 0.033 0.01 0.66 0.58 0.69 0.25 0.6 0.21 0.05 0.04
Ta 31.6 6 37.9 26.4 83.2 74.6 32.4 28.7 4.1 0.14 28.5 4.6 0.05 0.011
W (ICP-MS) 0.249 0.037 0.02 0.04 0.122 0.043 0.126 0.054 0.101 0.077 0.545 1.146 1.624 2.131 1.641 0.922 0.17 1.695
Tl (ICP-MS) 0.16 3.64 1.76 3.128 7.77 0.34 2.73 5.07 2.53 4.2 0.12 0.079 0.106 0.407 0.074 0.33 8.844 1.351
Bi (ICP-MS) 0.013 0.019 0.015 0.013 0.013 0.014 0.014 0.017 0.016 0.014 0.017 0.015 0.014 0.011 0.013 0.014 0.016
Th (ICP-MS) 0.005 0.024 2.189 1.712 1.828 0.706 1.633 0.606 0.137 0.046
U (ICP-MS) 0.021 1.381 0.027 1.648 0.66 0.043 0.32 0.126 0.053 0.092 0.728 0.883 0.692 4.092 2.657 2.837 1.245 5.585

24

Ore mineralogy and geochemistry of the Mandoos Volcanic Massive Sulphide (VMS) deposit, Sumail Ophiolite, Oman
XXV
Appendix X – MD-NP-3 XRD Analysis Dataset Name MD-NP-3
Ref. Code Chemical Formula Mineral Name
01-070-3755 Si O2 Quartz 98-002-0229 Mn1 O2 Pyrolusite
Pos. [°2Th.] Height [cts] FWHM Left [°2Th.] d-spacing [Å] Rel. Int. [%]
21.0671 197.58 0.2342 4.21712 12.68 25.6824 37.74 0.2007 3.46879 2.42 26.8524 1145.13 0.1673 3.32025 73.52 27.6229 56.03 0.2007 3.22936 3.60 28.8835 1557.61 0.1840 3.09122 100.00 36.7679 49.29 0.1004 2.44444 3.16 37.5418 272.51 0.2007 2.39582 17.50 39.7483 37.98 0.2007 2.26776 2.44 41.2022 98.25 0.2342 2.19104 6.31 42.9662 82.50 0.1338 2.10508 5.30 46.1574 38.41 0.5353 1.96670 2.47 50.2691 53.79 0.2342 1.81506 3.45 55.1491 14.22 0.2676 1.66544 0.91 56.7960 167.91 0.1673 1.62100 10.78 59.5141 85.62 0.2007 1.55330 5.50 60.2084 27.84 0.2007 1.53703 1.79 65.1049 18.57 0.2676 1.43278 1.19 67.3619 26.89 0.5353 1.39016 1.73 68.3650 36.69 0.3346 1.37219 2.36
Position [°2Theta] (Copper (Cu))
10 20 30 40 50 60
Counts
0
100
400
900
1600
Qu
art
z
Qu
art
z Pyro
lusi
te
Qu
art
zP
yro
lusi
te
Qu
art
z
Pyro
lusi
te
Pyro
lusi
te
Qu
art
z; P
yro
lusi
te
Qu
art
z
Qu
art
z
Pyro
lusi
te
Pyro
lusi
teQ
uart
z
Pyro
lusi
te
Pyro
lusi
te
Qu
art
z
8