ORD Tools Resources Webinar - US EPA...1 ORD Tools & Resources Webinar Chapel Hill, North Carolina...
30
1 ORD Tools & Resources Webinar Chapel Hill, North Carolina February 17, 2016 Wayne Cascio, MD, FACC Director, Environmental Public Health Division National Health and Environmental Effects Research Laboratory Office of Research and Development - US EPA
Transcript of ORD Tools Resources Webinar - US EPA...1 ORD Tools & Resources Webinar Chapel Hill, North Carolina...

1
ORD Tools & Resources Webinar
Chapel Hill, North CarolinaFebruary 17, 2016
Wayne Cascio, MD, FACC
Director, Environmental Public Health Division
National Health and Environmental Effects Research Laboratory
Office of Research and Development - US EPA

2
EPA’s Healthy Heart ProgramIncreasing Environmental Health Literacy
http://www.epa.gov/healthyheart/
EPA’s Healthy Heart program aims to
prevent heart attacks and strokes by:
• Raising public awareness about the role outdoor air pollution plays in cardiovascular health, and
• Steps individuals can take to reduce their pollution exposure

3
Global Health IssueAverage PM2.5 2001-2010
WHO: 3.7 million excess deaths globally due to ambient air pollution
Satellite-derived PM2.5 (µg/m3)
http://sedac.ciesin.columbia.edu/data/set/sdei-global-annual-avg-pm2-5-2001-2010

4
Annual U.S. PM2.5 Concentration2001-2010
http://sedac.ciesin.columbia.edu/data/set/sdei-global-annual-avg-pm2-5-2001-2010/maps
Estimate of 60,000 excess deaths in U.S. due to ambient air pollution
Satellite-derived PM2.5 (µg/m3)

5
Air Pollution and Health Effects
Subclinical Effects with No Symptoms
(e.g. asymptomatic decrease in lung function,
heart rate variability or endothelial function)
Deaths
Hospitalizations
ED, Urgent Care,
& Physician Office Visits
Restricted Activity Days
Respiratory, Cardiovascular,
Other Symptoms, and/or
Medication Use
Size of Population Affected by Exposure to Air Pollution
Excess deaths
Public health impactextends beyond deaths

6
Three-Year Average 24-hr PM2.5Concentration by County 2005-2007
6
6
Figure 3-9. Three-yr avg 24-h PM2.5 concentration by county derived from FRM or FRM-like data, 2005-2007. The population bar shows the number of people residing within counties that reported county-wide average concentrations within the specified ranges.
Table 3-8 contains summary statistics for PM2.5 reported to AQS for the period 2005-2007. All 24-h FRM and 1-h FRM-like data reported to AQS and meeting the completeness criterion outlined above are included in the table. The table provides a distributional comparison between annual, 24-h and 1-h averaging times, calendar years (2005, 2006 and 2007) and seasons: winter (December- February), spring (March-May), summer (June-August), and fall (September-November). In addition, 15 CSAs/CBSAs were chosen for their importance in recent PM health studies, as described in Section 3.4, and have been included individually in the table.
The distribution of PM2.5 annual averages (calculated without seasonal weighting and presented in Table 3-8) was generated from 2,382 individual annual means reported by 794 24-h FRM monitors reporting to AQS between 2005 and 2007. The mean of the annual averages was 12 µg/m
3, equivalent to the mean of the individual 24-h avg. The maximum annual average PM2.5
concentration calculated from 24-h FRM data over these 3 yr was 23 µg/m3 in Bakersfield, CA (AQS
monitor ID: 060290010) during 2007. This site is located in the heavily populated portion of the San Joaquin Valley where air pollution frequently becomes trapped at ground level due to local topography. The distribution of the 24-h and 1-h avg, both generated from the same 1-h FRM-like data, are comparable up to the 90th percentile. The 1-h avg is 3 µg/m3 higher than the 24-h avg at the 95
th percentile and 7 µg/m
3 higher at the 99th percentile. This deviation between 1-h and 24-h
averaging times is a result of short duration spikes in PM2.5 mass lasting long enough to influence the upper percentiles of the 1-h distribution but not necessarily the 24-h avg distribution. Exceptional events were not removed from this data set and are responsible for at least some of the higher
December 2009 3-43
Number of
people residing
within counties
that reported
county-wide
average
concentrations
within the
specified
ranges
(in millions)
US EPA Integrated Science Assessment - Particulate Matter 3-43, 2009
Co
nce
ntr
atio
n R
an
ge
≥ 20.1 µg/m3 [1 county]
18.1 – 20.0 µg/m3 [7 counties]
15.1 – 18.1 µg/m3 [53 counties]
12.1 – 15.0 µg/m3 [242 counties]
≤ 12.0 µg/m3 [237 counties]
No data
300
250
200
150
100
50
0
Population
(millions)
Millions of people live in areas that exceed the annual NAAQS for PM

7
Estimated Excess MortalityBurden of Air Pollution Deaths by US County
Fann et al. Risk Analysis 20127
PM2.5 and O3-related Mortality by County based on 2005 air pollution levels
US EPA’s BENMAPwww.epa.gov/benmap/benmap-community-edition
Southern California
<19
20 to 159
160 to 379
380 to 799
800 to 2,799
2,800 to 5,400
PM2.5 and O3
related mortality

Deaths Attributed to CV DiseaseUnited States: 1900-2011
Mozaffarian et al. Circulation. 2015;131:e29-e322
Dea
ths
in T
ho
usa
nd
s
8
Year
• We’re doing better• With an aging population
it’s imperative to work even harder to decrease riskfor heart attack and stroke
Framingham StudyNational Heart Institute
(NHLBI)

Projected total costs of CV Diseaseby age (2012 in billions)
9Mozaffarian et al. Circulation. 2015;131:e29-e322
Tota
l Do
llars
(in
bill
ion
s) MM
18-44 years
45-64 years
65-79 years
80+
2030
2016

Air Particle PollutionAssociated with CV Morbidity & Mortality
Integrated Science Assessment
for Particulate Matter
“Epidemiologic evidence is sufficient to conclude that a causalrelationship exists between:
short-term, and long-term exposure to PM2.5 and mortality.”
U.S. EPA ISA 2009 10

11
Air Pollution Worsens CV DiseaseAHA Expert Panel 2010
– Trigger heart attacks
– Trigger arrhythmia
– Trigger strokes
– Worsen heart failure• Heart disease patients should reduce their exposure to air
pollution when levels are high.
• Fine particulate matter (PM) or air particle pollution can
Brook RD et al. Circulation 121:2331-78, 2010

European Expert Panel ConcursCall for Environmental Health Education
• “Air pollution should be viewed as one of several major modifiable risk factors in the prevention and management of cardiovascular disease.”
• “Health professionals, including cardiologists, have an important role to play in supporting educational and policy initiatives as well as counseling their patients.”
12Newby D et al. European Heart Journal 36: 83–93, 2015

13
Air Pollution Triggers Heart AttacksLower exposure associated with lower risk
Population Attributable Fractions (PAF)Related to: the strength of the association between exposure to a risk factor and the prevalence of this risk factor within the population
Modified from Nawrot et al. Lancet 2011

Healthy Heart Toolkitwww.epa.gov/air-research/healthy-heart-toolkit
14

Healthy Heart Toolkit & ResearchProtect Your Heart
15
http://www.epa.gov/air-research/healthy-heart-toolkit-and-research

16
Populations at Higher Risk
Populations showing increased susceptibility to the adverse health effects of air particle pollution include:
– Aged adults & Children
– Pregnant women (?)
– Developing fetus (?)
And those having:
– Cardiovascular disease
• Ischemic heart disease
• Heart failure
• Ventricular arrhythmia
– Diabetes
– Pulmonary disease
– Genetic polymorphisms

Prevalence of CV DiseaseAdults ≥20 years old by Age and Sex
17Mozaffarian et al. Circulation. 2015;131:e29-e322
(National Health and Nutrition Examination Survey: 2009–2012)
80+60 - 7920 - 39 40 - 59
Perc
en
t o
f Po
pu
lati
on
Age (Years)
MMMen
Women
Age is a strong determinantof cardiovascular disease

Healthy Heart Flyer
18http://www.epa.gov/sites/production/files/2014-09/documents/healthy-heart-fact-sheet.pdf

19
Reduce Overall RiskReducing PM’s Health Effects
• Eat healthy foods
• Control blood pressure
• Control cholesterol levels
• Exercise according to
health provider’s
recommendation
• Stop smoking
• Take aspirin and heart
medication as directed
20Brook et al. Circulation 2010
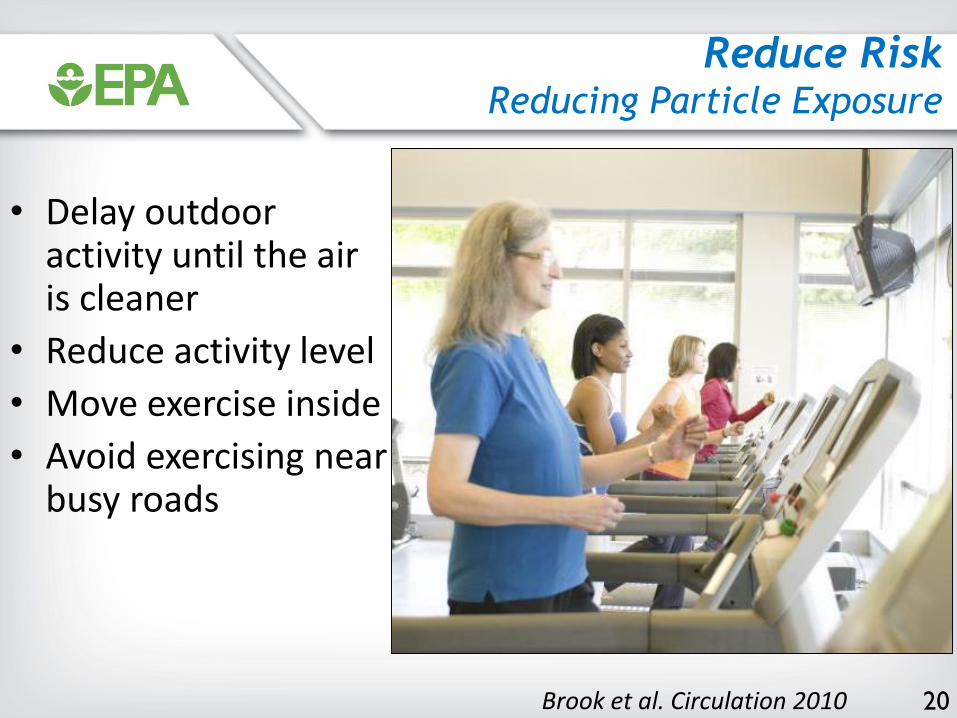
• Delay outdoor activity until the air is cleaner
• Reduce activity level
• Move exercise inside
• Avoid exercising near busy roads
Reduce RiskReducing Particle Exposure

Public EducationAir Quality Index
21
Descriptors Cautionary Statement
Good
0 – 50
No message
Moderate
51 – 100
Unusually sensitive
individuals
Unhealthy for
Sensitive Groups
101 - 150
Identifiable groups at risk -
different groups for different
pollutants
Unhealthy
151 - 200
General public at risk;
sensitive groups at greater
risk
Very Unhealthy
201 - 300
General public at greater risk;
sensitive groups at greatest
risk
• Color scale detailing how clean or polluted the air is
• Where can it be found?– Local TV, radio or
newspapers– AirNow app– Email alerts at
www.enviroflash.info

Informing the Publicwww.airnow.gov via the Internet
22
www.airnow.gov
Today’s AQI & forecast - Chicago

Air Quality NotificationsEnviroFlash
23
• AirNow app EnviroFlashURL: www.enviroflash.info
• Provided daily air quality forecasts and action day notifications to your email
• Information can be used to plan outdoor activities
• Available for iPhone and Android
• Partnership between EPA and state and local air quality agency
ZipCode
CurrentLocation

Health Care Providers
24

Continuing Medical Education
25
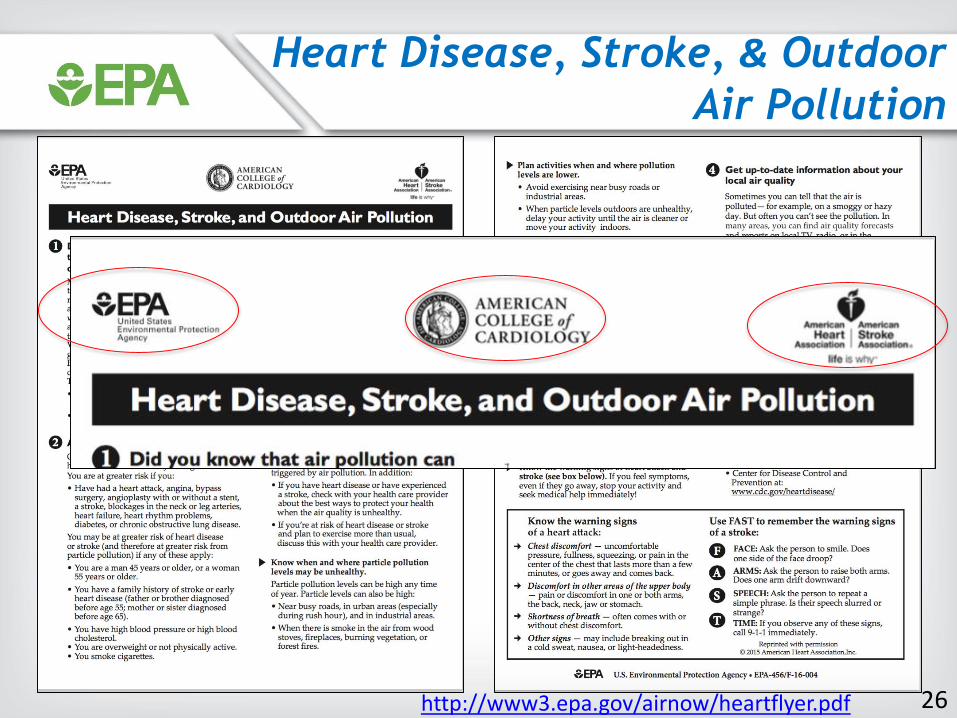
Heart Disease, Stroke, & Outdoor
Air Pollution
26http://www3.epa.gov/airnow/heartflyer.pdf

Effect of Common Air PollutantsPoster Available in Spanish
27

Conclusion
28
• Heart disease & stroke impose a substantial social and economic burden to the U.S.
• Ambient air pollution contributes to this burden
• The burden will grow as our population ages
• Aged individuals and those with prevalent heart and lung disease are more susceptible to the adverse health effects of ambient air pollution
• EPA’s Healthy Heart program supports the goals of the Million Hearts® Initiative to decrease heart attacks and strokes by providing information and tools to reduce exposure to air pollutants and possibly lower risk of heart attacks and strokes.

29
For More Information Visit
• www.epa.gov/healthyheart– EPA Healthy Heart
• www.airnow.gov– EPA AirNow
• www.millionhearts.hhs.gov– CDC Million Hearts Initiative
• www.cdc.gov/heartdisease– CDC Heart disease information
• www.cdc.gov/stroke– CDC Stroke information
• www.heart.org– American Heart Association
• www.epa.gov/benmap– BenMapContact information: Wayne Cascio, MD
email: [email protected]

30
Questions?


![[WEBINAR] Advanced AdWords Tools](https://static.fdocuments.net/doc/165x107/5549ea63b4c9050d488b4e86/webinar-advanced-adwords-tools.jpg)