Orascom Telecom Third Quarter 2012 - RNS SubmitOrascom Telecom Second Quarter 2013 ... and other...
19
ORASCOM TELECOM HOLDING Second Quarter 2013
Transcript of Orascom Telecom Third Quarter 2012 - RNS SubmitOrascom Telecom Second Quarter 2013 ... and other...
Orascom Telecom Second Quarter 2013
1 | P a g e
ORASCOM TELECOM HOLDING
Second Quarter 2013
Orascom Telecom Second Quarter 2013
2 | P a g e
1.
2.
3.
4.
5.
6.
7.
8.
9.
10.
11.
12.
13.
14.
15.
16.
17.
18.
19.
20.
21.
22.
23.
24.
25.
26.
27.
28.
29.
30.
31.
Content
1. 2Q13 Highlights 2
2. Performance Review 3
3. OTH Operations 8
4. Financial Statements 13
5. Appendix 16
Orascom Telecom Second Quarter 2013
2 | P a g e
Cairo/London (August 7, 2013), Orascom Telecom Holding S.A.E. (‘OTH’, or ‘the Group’) (EGX: ORTE.CA, ORAT
EY. LSE: ORTEq.L, OTLD LI), a leading provider of mobile telecommunications in Africa, Asia and North America,
announces its consolidated financial and operating results for the second quarter ending June 30, 2013.
1. 2Q13 Highlights1
Total subscribers2 increased 4% YoY to approximately 86 million.
Revenues grew 1% YoY organically3 to USD 904 million, despite negative impact from regulatory and
governmental actions.
EBITDA of USD 438 million. Excluding one-offs and restructuring costs in this quarter, EBITDA would have
increased 2% YoY organically. Group EBITDA was supported by EBITDA growth YoY in Algeria in local
currency.
Strong group EBITDA margin of 48.5%. EBITDA margins for the subsidiaries: Djezzy 60.1%, Mobilink 42.0%,
and banglalink 36.8%.
Net income before minority interest stood at a loss of USD 23 million, mainly driven by the adverse
impact of foreign exchange losses of USD 86 million and financial expenses of USD 126 million.
Net debt4 stood at USD 2.5 billion, decreasing 7% compared to 4Q12; with Net Debt/EBITDA5 of 1.5x as at
June 30, 2013.
Table 1: Group key indicators
Thousands 2Q13 2Q12 Change Organic Growth
1H13 1H12 Change
Total subscribers2
85,885 82,643 3.9% 85,885 82,643 3.9%
Revenues (USD) 903,756 934,199 (3.3%) 0.7% 1,753,000 1,833,708 (4.4%)
EBITDA (USD)
438,066 469,828 (6.8%) (1.1%) 851,379 902,678 (5.7%)
EBITDA margin 48.5% 50.3% (3.6%) 48.6% 49.2% (1.3%)
Net income (USD) (22,726) 31,694 n.m. (226,334) 151,476 n.m.
EPS (USD per GDR) (0.02) 0.03 n.m. (0.22) 0.14 n.m.
CAPEX (USD) 68,976 79,499 (13.2%) 109,938 143,499 (23.4%)
1. Income Statement and Balance Sheet figures are in US dollars in accordance with the International Financial Reporting Standards (IFRS). 2. As announced on July 1 2013, during an internal investigation with regards to Djezzy’s active subscribers, management found a technical bug that overstated Djezzy’s subscriber base by 1.4 million customers. The subscribers’ base comparative figures were adjusted accordingly. This event does not impact historical reported revenues or EBITDA, but positively affect MOU and ARPU. 3. Organic growth for Revenue and EBITDA: non-IFRS financial measures that reflect changes in Revenue and EBITDA excluding foreign currency movements and other factors, which includes business under liquidation, disposals, mergers and acquisitions (Please refer to glossary of terms for the definition of “organic growth”). 4. Net debt is calculated as a sum of short term debt, long term debt, less cash and cash equivalents. 5. Net Debt/EBITDA is calculated for the annualized figures for the six month ending June 30, 2013.
Orascom Telecom Second Quarter 2013
3 | P a g e
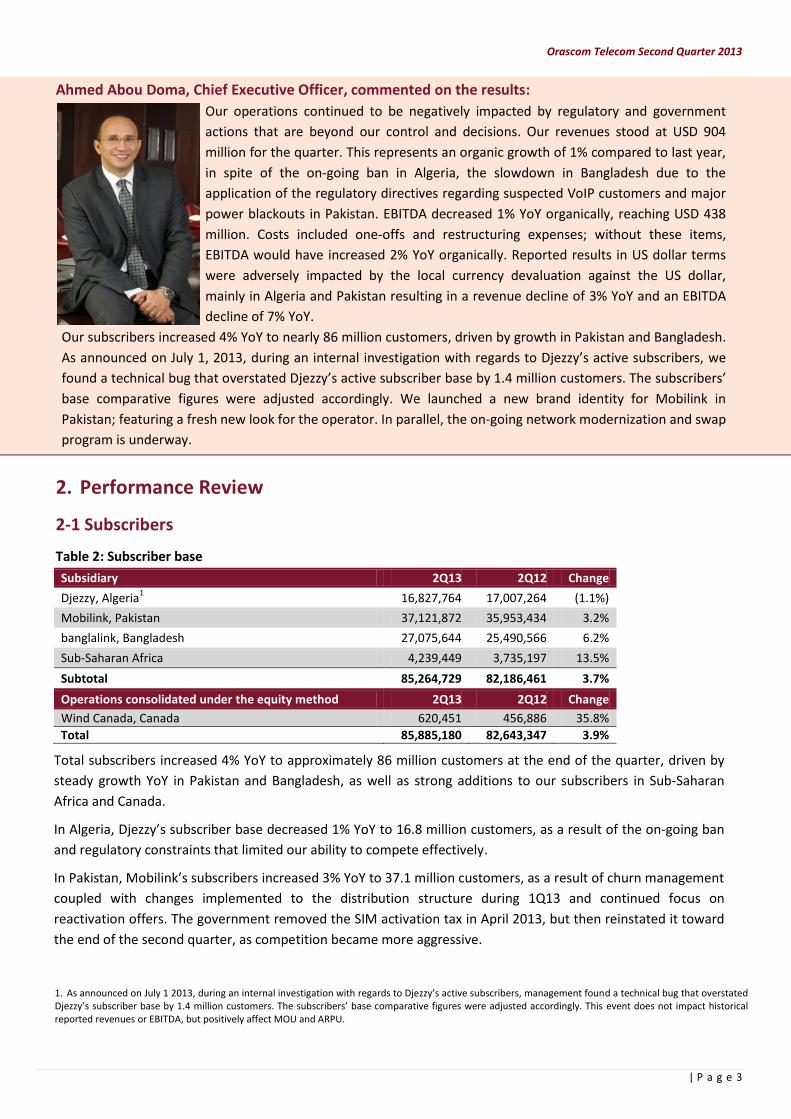
Ahmed Abou Doma, Chief Executive Officer, commented on the results:
Our operations continued to be negatively impacted by regulatory and government
actions that are beyond our control and decisions. Our revenues stood at USD 904
million for the quarter. This represents an organic growth of 1% compared to last year,
in spite of the on-going ban in Algeria, the slowdown in Bangladesh due to the
application of the regulatory directives regarding suspected VoIP customers and major
power blackouts in Pakistan. EBITDA decreased 1% YoY organically, reaching USD 438
million. Costs included one-offs and restructuring expenses; without these items,
EBITDA would have increased 2% YoY organically. Reported results in US dollar terms
were adversely impacted by the local currency devaluation against the US dollar,
mainly in Algeria and Pakistan resulting in a revenue decline of 3% YoY and an EBITDA
decline of 7% YoY.
Our subscribers increased 4% YoY to nearly 86 million customers, driven by growth in Pakistan and Bangladesh.
As announced on July 1, 2013, during an internal investigation with regards to Djezzy’s active subscribers, we
found a technical bug that overstated Djezzy’s active subscriber base by 1.4 million customers. The subscribers’
base comparative figures were adjusted accordingly. We launched a new brand identity for Mobilink in
Pakistan; featuring a fresh new look for the operator. In parallel, the on-going network modernization and swap
program is underway.
2. Performance Review
2-1 Subscribers
Table 2: Subscriber base
Subsidiary 2Q13 2Q12 Change
Djezzy, Algeria1 16,827,764 17,007,264 (1.1%)
Mobilink, Pakistan 37,121,872 35,953,434 3.2%
banglalink, Bangladesh 27,075,644 25,490,566 6.2%
Sub-Saharan Africa
4,239,449 3,735,197 13.5%
Subtotal 85,264,729 82,186,461 3.7%
Operations consolidated under the equity method 2Q13 2Q12 Change
Wind Canada, Canada 620,451 456,886 35.8%
Total 85,885,180 82,643,347 3.9%
Total subscribers increased 4% YoY to approximately 86 million customers at the end of the quarter, driven by
steady growth YoY in Pakistan and Bangladesh, as well as strong additions to our subscribers in Sub-Saharan
Africa and Canada.
In Algeria, Djezzy’s subscriber base decreased 1% YoY to 16.8 million customers, as a result of the on-going ban
and regulatory constraints that limited our ability to compete effectively.
In Pakistan, Mobilink’s subscribers increased 3% YoY to 37.1 million customers, as a result of churn management
coupled with changes implemented to the distribution structure during 1Q13 and continued focus on
reactivation offers. The government removed the SIM activation tax in April 2013, but then reinstated it toward
the end of the second quarter, as competition became more aggressive.
1. As announced on July 1 2013, during an internal investigation with regards to Djezzy’s active subscribers, management found a technical bug that overstated Djezzy’s subscriber base by 1.4 million customers. The subscribers’ base comparative figures were adjusted accordingly. This event does not impact historical reported revenues or EBITDA, but positively affect MOU and ARPU.

Orascom Telecom Second Quarter 2013
4 | P a g e
banglalink’s subscribers’ base increased 6% YoY to 27.1 million customers, driven by high gross additions and
low churn rate.
Subscribers in Sub-Saharan Africa grew 13% YoY, mainly driven by strong additions in Zimbabwe, with the
number of subscribers growing by 22% YoY. In Canada, WIND Mobile Canada grew its subscriber base by an
impressive 36% YoY, through its continued focus on “Value Plus” attracting both postpaid and prepaid
customers to the network.
2-2 Revenues
Table 3: Revenues in US dollars
Subsidiary/thousands 2Q13 2Q12 Change 1H13 1H12 Change
GSM
Djezzy Algeria 464,157 470,999 (1.5%) 897,908 928,085 (3.3%)
Mobilink, Pakistan 289,460 295,153 (1.9%) 567,236 581,176 (2.4%)
banglalink, Bangladesh 128,929 142,075 (9.3%) 246,670 271,741 (9.2%)
Telecel Globe, Africa
20,958 22,914 (8.5%) 39,589 45,279 (12.6%)
Total GSM Revenues 903,504 931,141 (3.0%) 1,751,403 1,826,281 (4.1%)
Telecom Services
Ring & Other 253 3,058 n.m. 1,598 7,427 n.m.
Total Consolidated Revenues 903,756 934,199 (3.3%) 1,753,000 1,833,708 (4.4%)
Table 4: Revenues in local currency
Subsidiary/billions 2Q13 2Q12 Change 1H13 1H12 Change
GSM
Djezzy, Algeria (DZD) 36.7 35.8 2.6% 70.8 70.1 1.0%
Mobilink, Pakistan (PKR) 28.5 27.2 4.8% 55.7 53.1 4.9%
banglalink, Bangladesh(BDT) 10.1 11.7 (13.8%) 19.4 22.4 (13.5%)
Reported revenues for the second quarter were negatively impacted by the local currency devaluation against
the US dollar mainly in Algeria and Pakistan. In Bangladesh, the local currency appreciated against the US dollar.
For more details on the foreign exchange rates applied to the financial statements, please refer to the appendix.
Group revenues achieved an organic growth of 1% YoY, reaching USD 904 million for 2Q13.
In Algeria, Djezzy’s revenues increased 3% YoY in local currency, driven by higher voice revenues following the
changes made to the communication messages of existing offers.
In Pakistan, revenues grew 5% YoY in local currency, driven by higher interconnect, VAS, data and other
revenues and a higher subscriber base. However, revenues for the quarter were impacted by the government
request to shut down all cellular networks in major cities, although shutdowns occurred at a lower rate than in
previous quarters. Furthermore, one of the worst power blackouts in Pakistan’s history was seen in May 2013,
which resulted in higher OPEX and depletion of fuel at some sites, reducing the network’s availability and
negatively impacting revenues.
In Bangladesh, revenues decreased 14% YoY in local currency, mainly driven by lower usage per subscriber,
affected by the application of the regulatory directives of disconnecting VoIP customers, and partially offset by
higher interconnection and VAS revenues. In addition, the fourteen days of national strikes in 2Q13 negatively
impacted business. The application of the regulatory directives of disconnecting high value suspected VoIP
customers is expected to have a prolonged negative impact during 2013.
Orascom Telecom Second Quarter 2013
5 | P a g e
Telecel Globe’s revenues declined by 9% YoY, primarily due to lower revenues achieved in CAR due to the on-
going security situation that followed the armed conflict in the country, alongside the devaluation of local
currency in Burundi against the US dollar. Burundi’s revenues increased 16% YoY, while CAR’s revenues
decreased 28% YoY, in local currency.
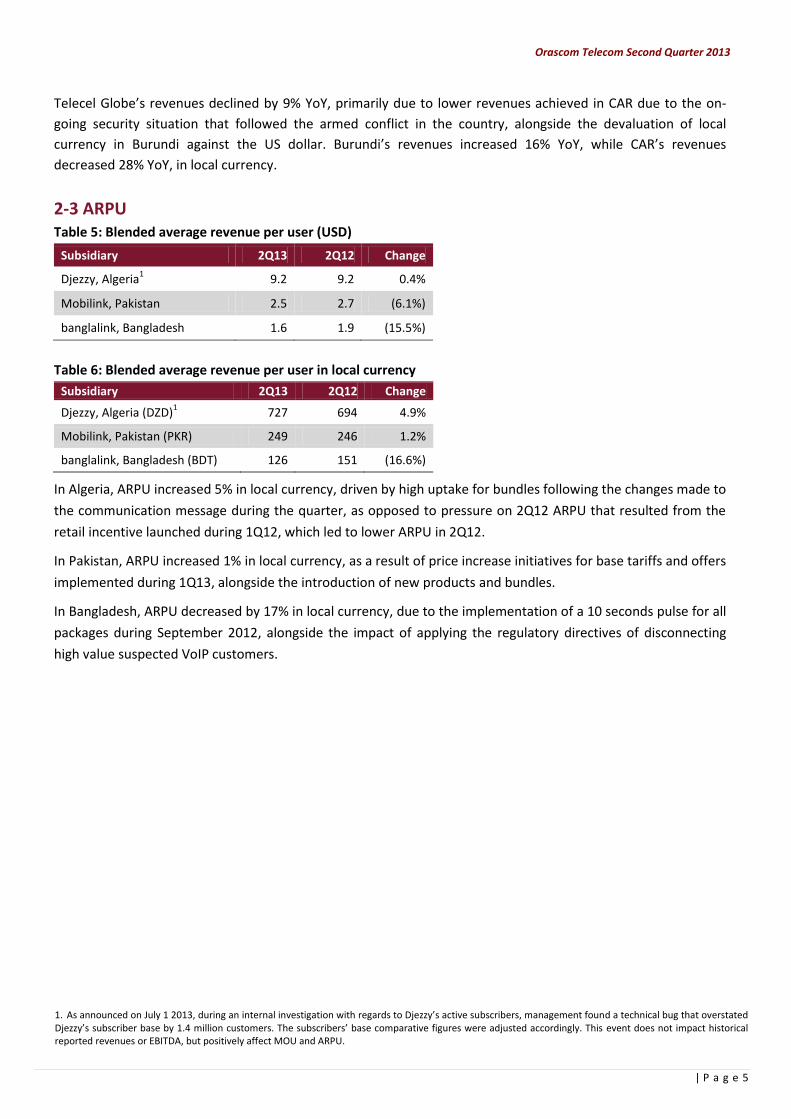
2-3 ARPU Table 5: Blended average revenue per user (USD)
Subsidiary 2Q13 2Q12 Change
Djezzy, Algeria1 9.2 9.2 0.4%
Mobilink, Pakistan 2.5 2.7 (6.1%)
banglalink, Bangladesh 1.6 1.9 (15.5%)
Table 6: Blended average revenue per user in local currency
Subsidiary 2Q13 2Q12 Change
Djezzy, Algeria (DZD)1 727 694 4.9%
Mobilink, Pakistan (PKR) 249 246 1.2%
banglalink, Bangladesh (BDT) 126 151 (16.6%)
In Algeria, ARPU increased 5% in local currency, driven by high uptake for bundles following the changes made to
the communication message during the quarter, as opposed to pressure on 2Q12 ARPU that resulted from the
retail incentive launched during 1Q12, which led to lower ARPU in 2Q12.
In Pakistan, ARPU increased 1% in local currency, as a result of price increase initiatives for base tariffs and offers
implemented during 1Q13, alongside the introduction of new products and bundles.
In Bangladesh, ARPU decreased by 17% in local currency, due to the implementation of a 10 seconds pulse for all
packages during September 2012, alongside the impact of applying the regulatory directives of disconnecting
high value suspected VoIP customers.
1. As announced on July 1 2013, during an internal investigation with regards to Djezzy’s active subscribers, management found a technical bug that overstated Djezzy’s subscriber base by 1.4 million customers. The subscribers’ base comparative figures were adjusted accordingly. This event does not impact historical reported revenues or EBITDA, but positively affect MOU and ARPU.
Orascom Telecom Second Quarter 2013
6 | P a g e
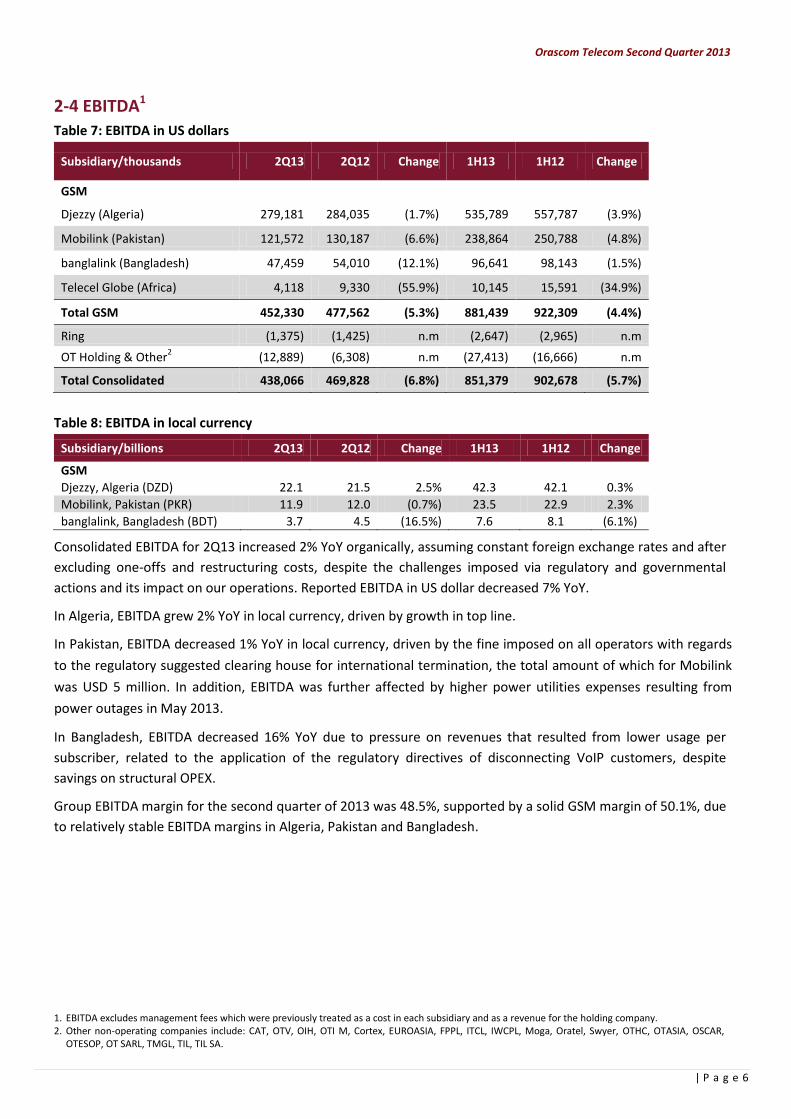
2-4 EBITDA1
Table 7: EBITDA in US dollars
Subsidiary/thousands 2Q13 2Q12 Change 1H13 1H12 Change
GSM
Djezzy (Algeria) 279,181 284,035 (1.7%) 535,789 557,787 (3.9%)
Mobilink (Pakistan) 121,572 130,187 (6.6%) 238,864 250,788 (4.8%)
banglalink (Bangladesh) 47,459 54,010 (12.1%) 96,641 98,143 (1.5%)
Telecel Globe (Africa)
4,118 9,330 (55.9%) 10,145 15,591 (34.9%)
Total GSM 452,330 477,562 (5.3%) 881,439 922,309 (4.4%)
Ring (1,375) (1,425) n.m (2,647) (2,965) n.m
OT Holding & Other2
(12,889) (6,308) n.m (27,413) (16,666) n.m
Total Consolidated 438,066 469,828 (6.8%) 851,379 902,678 (5.7%)
Table 8: EBITDA in local currency
Subsidiary/billions 2Q13 2Q12 Change 1H13 1H12 Change
GSM
Djezzy, Algeria (DZD) 22.1 21.5 2.5% 42.3 42.1 0.3%
Mobilink, Pakistan (PKR) 11.9 12.0 (0.7%) 23.5 22.9 2.3%
banglalink, Bangladesh (BDT) 3.7 4.5 (16.5%) 7.6 8.1 (6.1%)
Consolidated EBITDA for 2Q13 increased 2% YoY organically, assuming constant foreign exchange rates and after
excluding one-offs and restructuring costs, despite the challenges imposed via regulatory and governmental
actions and its impact on our operations. Reported EBITDA in US dollar decreased 7% YoY.
In Algeria, EBITDA grew 2% YoY in local currency, driven by growth in top line.
In Pakistan, EBITDA decreased 1% YoY in local currency, driven by the fine imposed on all operators with regards
to the regulatory suggested clearing house for international termination, the total amount of which for Mobilink
was USD 5 million. In addition, EBITDA was further affected by higher power utilities expenses resulting from
power outages in May 2013.
In Bangladesh, EBITDA decreased 16% YoY due to pressure on revenues that resulted from lower usage per
subscriber, related to the application of the regulatory directives of disconnecting VoIP customers, despite
savings on structural OPEX.
Group EBITDA margin for the second quarter of 2013 was 48.5%, supported by a solid GSM margin of 50.1%, due
to relatively stable EBITDA margins in Algeria, Pakistan and Bangladesh.
1. EBITDA excludes management fees which were previously treated as a cost in each subsidiary and as a revenue for the holding company. 2. Other non-operating companies include: CAT, OTV, OIH, OTI M, Cortex, EUROASIA, FPPL, ITCL, IWCPL, Moga, Oratel, Swyer, OTHC, OTASIA, OSCAR,
OTESOP, OT SARL, TMGL, TIL, TIL SA.
Orascom Telecom Second Quarter 2013
7 | P a g e
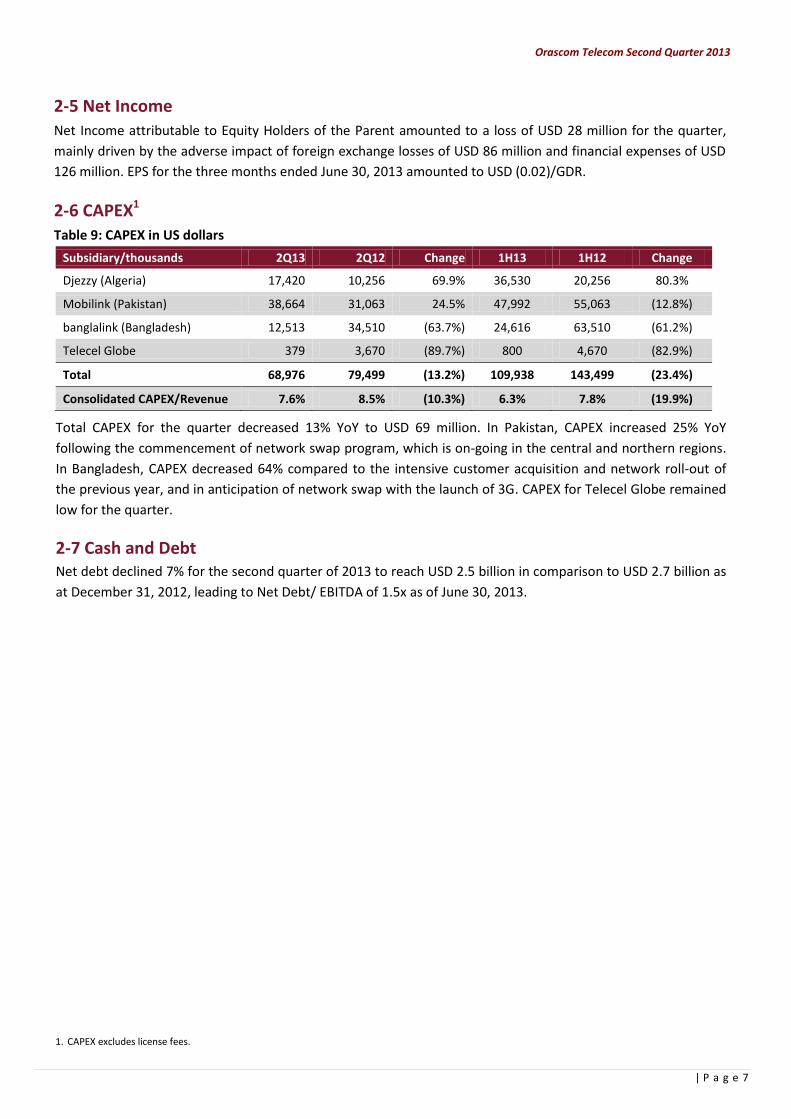
2-5 Net Income
Net Income attributable to Equity Holders of the Parent amounted to a loss of USD 28 million for the quarter,
mainly driven by the adverse impact of foreign exchange losses of USD 86 million and financial expenses of USD
126 million. EPS for the three months ended June 30, 2013 amounted to USD (0.02)/GDR.
2-6 CAPEX1
Table 9: CAPEX in US dollars
Subsidiary/thousands 2Q13 2Q12 Change 1H13 1H12 Change
Djezzy (Algeria) 17,420 10,256 69.9% 36,530 20,256 80.3%
Mobilink (Pakistan) 38,664 31,063 24.5% 47,992 55,063 (12.8%)
banglalink (Bangladesh) 12,513 34,510 (63.7%) 24,616 63,510 (61.2%)
Telecel Globe 379 3,670 (89.7%) 800 4,670 (82.9%)
Total 68,976 79,499 (13.2%) 109,938 143,499 (23.4%)
Consolidated CAPEX/Revenue 7.6% 8.5% (10.3%) 6.3% 7.8% (19.9%)
Total CAPEX for the quarter decreased 13% YoY to USD 69 million. In Pakistan, CAPEX increased 25% YoY
following the commencement of network swap program, which is on-going in the central and northern regions.
In Bangladesh, CAPEX decreased 64% compared to the intensive customer acquisition and network roll-out of
the previous year, and in anticipation of network swap with the launch of 3G. CAPEX for Telecel Globe remained
low for the quarter.
2-7 Cash and Debt Net debt declined 7% for the second quarter of 2013 to reach USD 2.5 billion in comparison to USD 2.7 billion as
at December 31, 2012, leading to Net Debt/ EBITDA of 1.5x as of June 30, 2013.
1. CAPEX excludes license fees.
Orascom Telecom Second Quarter 2013
8 | P a g e
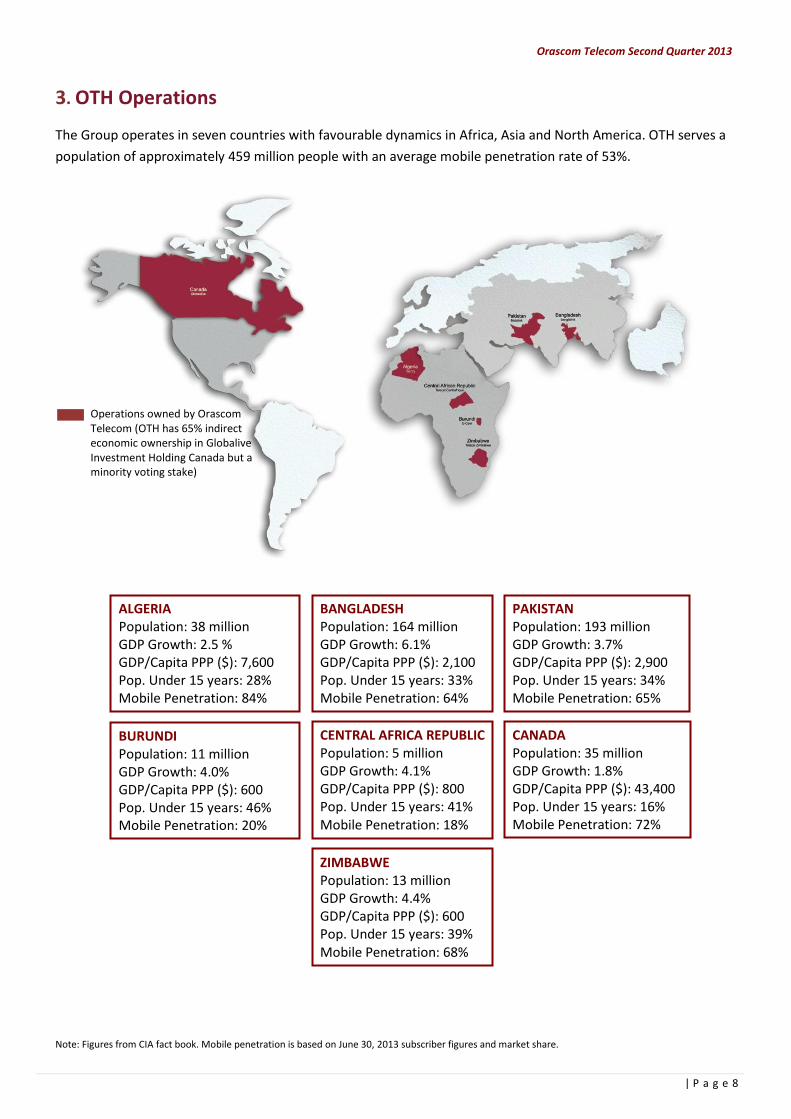
3. OTH Operations
The Group operates in seven countries with favourable dynamics in Africa, Asia and North America. OTH serves a
population of approximately 459 million people with an average mobile penetration rate of 53%.
Note: Figures from CIA fact book. Mobile penetration is based on June 30, 2013 subscriber figures and market share.
PAKISTAN Population: 193 million GDP Growth: 3.7% GDP/Capita PPP ($): 2,900 Pop. Under 15 years: 34% Mobile Penetration: 65%
BANGLADESH Population: 164 million GDP Growth: 6.1% GDP/Capita PPP ($): 2,100 Pop. Under 15 years: 33% Mobile Penetration: 64%
BURUNDI Population: 11 million GDP Growth: 4.0% GDP/Capita PPP ($): 600 Pop. Under 15 years: 46% Mobile Penetration: 20%
CENTRAL AFRICA REPUBLIC Population: 5 million GDP Growth: 4.1% GDP/Capita PPP ($): 800 Pop. Under 15 years: 41% Mobile Penetration: 18%
ALGERIA Population: 38 million GDP Growth: 2.5 % GDP/Capita PPP ($): 7,600 Pop. Under 15 years: 28% Mobile Penetration: 84%
CANADA Population: 35 million GDP Growth: 1.8% GDP/Capita PPP ($): 43,400 Pop. Under 15 years: 16% Mobile Penetration: 72%
ZIMBABWE Population: 13 million GDP Growth: 4.4% GDP/Capita PPP ($): 600 Pop. Under 15 years: 39% Mobile Penetration: 68%
Operations owned by Orascom Telecom (OTH has 65% indirect economic ownership in Globalive Investment Holding Canada but a minority voting stake)
Orascom Telecom Second Quarter 2013
9 | P a g e
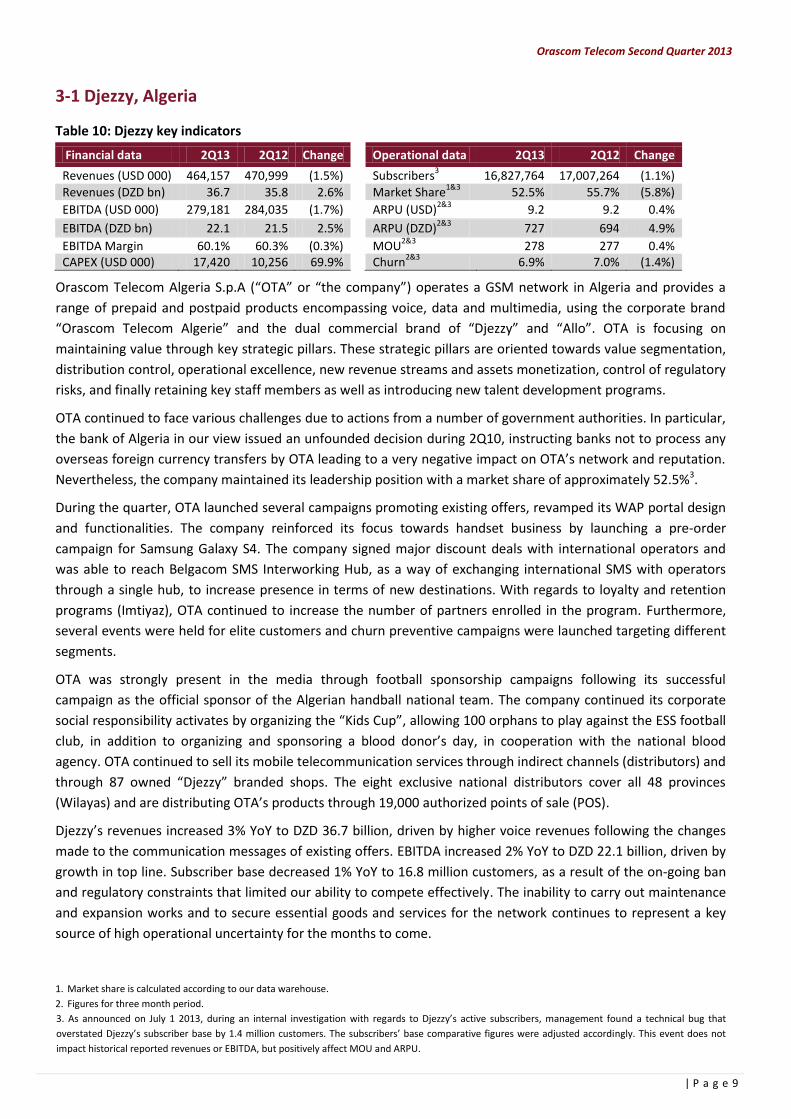
3-1 Djezzy, Algeria
Table 10: Djezzy key indicators
Financial data 2Q13 2Q12 Change
Operational data 2Q13 2Q12 Change
Revenues (USD 000) 464,157 470,999 (1.5%)
Subscribers3 16,827,764 17,007,264 (1.1%)
Revenues (DZD bn) 36.7 35.8 2.6%
Market Share1&3
52.5% 55.7% (5.8%)
EBITDA (USD 000) 279,181 284,035 (1.7%)
ARPU (USD)2&3
9.2 9.2 0.4%
EBITDA (DZD bn) 22.1 21.5 2.5%
ARPU (DZD)2&3
727 694 4.9%
EBITDA Margin 60.1% 60.3% (0.3%)
MOU2&3
278 277 0.4% CAPEX (USD 000) 17,420 10,256 69.9%
Churn
2&3 6.9% 7.0% (1.4%)
Orascom Telecom Algeria S.p.A (“OTA” or “the company”) operates a GSM network in Algeria and provides a
range of prepaid and postpaid products encompassing voice, data and multimedia, using the corporate brand
“Orascom Telecom Algerie” and the dual commercial brand of “Djezzy” and “Allo”. OTA is focusing on
maintaining value through key strategic pillars. These strategic pillars are oriented towards value segmentation,
distribution control, operational excellence, new revenue streams and assets monetization, control of regulatory
risks, and finally retaining key staff members as well as introducing new talent development programs.
OTA continued to face various challenges due to actions from a number of government authorities. In particular,
the bank of Algeria in our view issued an unfounded decision during 2Q10, instructing banks not to process any
overseas foreign currency transfers by OTA leading to a very negative impact on OTA’s network and reputation.
Nevertheless, the company maintained its leadership position with a market share of approximately 52.5%3.
During the quarter, OTA launched several campaigns promoting existing offers, revamped its WAP portal design
and functionalities. The company reinforced its focus towards handset business by launching a pre-order
campaign for Samsung Galaxy S4. The company signed major discount deals with international operators and
was able to reach Belgacom SMS Interworking Hub, as a way of exchanging international SMS with operators
through a single hub, to increase presence in terms of new destinations. With regards to loyalty and retention
programs (Imtiyaz), OTA continued to increase the number of partners enrolled in the program. Furthermore,
several events were held for elite customers and churn preventive campaigns were launched targeting different
segments.
OTA was strongly present in the media through football sponsorship campaigns following its successful
campaign as the official sponsor of the Algerian handball national team. The company continued its corporate
social responsibility activates by organizing the “Kids Cup”, allowing 100 orphans to play against the ESS football
club, in addition to organizing and sponsoring a blood donor’s day, in cooperation with the national blood
agency. OTA continued to sell its mobile telecommunication services through indirect channels (distributors) and
through 87 owned “Djezzy” branded shops. The eight exclusive national distributors cover all 48 provinces
(Wilayas) and are distributing OTA’s products through 19,000 authorized points of sale (POS).
Djezzy’s revenues increased 3% YoY to DZD 36.7 billion, driven by higher voice revenues following the changes
made to the communication messages of existing offers. EBITDA increased 2% YoY to DZD 22.1 billion, driven by
growth in top line. Subscriber base decreased 1% YoY to 16.8 million customers, as a result of the on-going ban
and regulatory constraints that limited our ability to compete effectively. The inability to carry out maintenance
and expansion works and to secure essential goods and services for the network continues to represent a key
source of high operational uncertainty for the months to come.
1. Market share is calculated according to our data warehouse.
2. Figures for three month period.
3. As announced on July 1 2013, during an internal investigation with regards to Djezzy’s active subscribers, management found a technical bug that
overstated Djezzy’s subscriber base by 1.4 million customers. The subscribers’ base comparative figures were adjusted accordingly. This event does not
impact historical reported revenues or EBITDA, but positively affect MOU and ARPU.
Orascom Telecom Second Quarter 2013
10 | P a g e
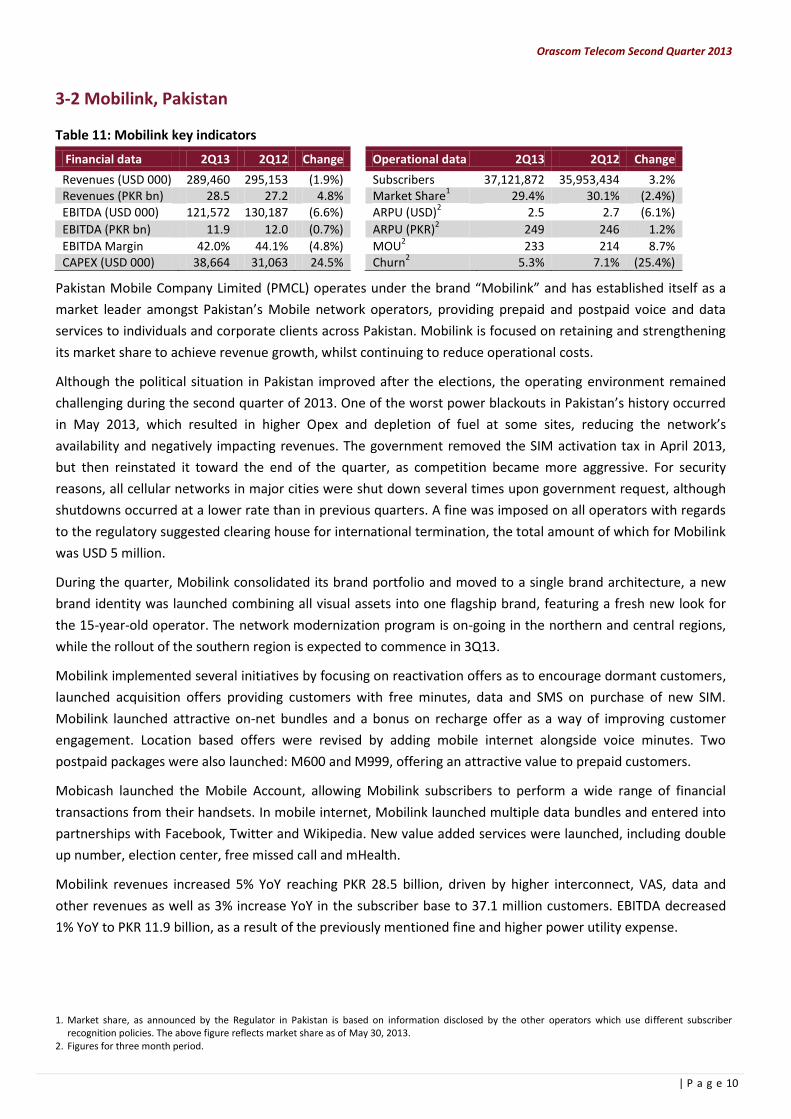
3-2 Mobilink, Pakistan
Table 11: Mobilink key indicators
Financial data 2Q13 2Q12 Change
Operational data 2Q13 2Q12 Change
Revenues (USD 000) 289,460 295,153 (1.9%)
Subscribers 37,121,872 35,953,434 3.2% Revenues (PKR bn) 28.5 27.2 4.8%
Market Share
1 29.4% 30.1% (2.4%)
EBITDA (USD 000) 121,572 130,187 (6.6%)
ARPU (USD)2 2.5 2.7 (6.1%)
EBITDA (PKR bn) 11.9 12.0 (0.7%)
ARPU (PKR)2 249 246 1.2%
EBITDA Margin 42.0% 44.1% (4.8%)
MOU2 233 214 8.7%
CAPEX (USD 000) 38,664 31,063 24.5%
Churn2 5.3% 7.1% (25.4%)
Pakistan Mobile Company Limited (PMCL) operates under the brand “Mobilink” and has established itself as a
market leader amongst Pakistan’s Mobile network operators, providing prepaid and postpaid voice and data
services to individuals and corporate clients across Pakistan. Mobilink is focused on retaining and strengthening
its market share to achieve revenue growth, whilst continuing to reduce operational costs.
Although the political situation in Pakistan improved after the elections, the operating environment remained
challenging during the second quarter of 2013. One of the worst power blackouts in Pakistan’s history occurred
in May 2013, which resulted in higher Opex and depletion of fuel at some sites, reducing the network’s
availability and negatively impacting revenues. The government removed the SIM activation tax in April 2013,
but then reinstated it toward the end of the quarter, as competition became more aggressive. For security
reasons, all cellular networks in major cities were shut down several times upon government request, although
shutdowns occurred at a lower rate than in previous quarters. A fine was imposed on all operators with regards
to the regulatory suggested clearing house for international termination, the total amount of which for Mobilink
was USD 5 million.
During the quarter, Mobilink consolidated its brand portfolio and moved to a single brand architecture, a new
brand identity was launched combining all visual assets into one flagship brand, featuring a fresh new look for
the 15-year-old operator. The network modernization program is on-going in the northern and central regions,
while the rollout of the southern region is expected to commence in 3Q13.
Mobilink implemented several initiatives by focusing on reactivation offers as to encourage dormant customers,
launched acquisition offers providing customers with free minutes, data and SMS on purchase of new SIM.
Mobilink launched attractive on-net bundles and a bonus on recharge offer as a way of improving customer
engagement. Location based offers were revised by adding mobile internet alongside voice minutes. Two
postpaid packages were also launched: M600 and M999, offering an attractive value to prepaid customers.
Mobicash launched the Mobile Account, allowing Mobilink subscribers to perform a wide range of financial
transactions from their handsets. In mobile internet, Mobilink launched multiple data bundles and entered into
partnerships with Facebook, Twitter and Wikipedia. New value added services were launched, including double
up number, election center, free missed call and mHealth.
Mobilink revenues increased 5% YoY reaching PKR 28.5 billion, driven by higher interconnect, VAS, data and
other revenues as well as 3% increase YoY in the subscriber base to 37.1 million customers. EBITDA decreased
1% YoY to PKR 11.9 billion, as a result of the previously mentioned fine and higher power utility expense.
1. Market share, as announced by the Regulator in Pakistan is based on information disclosed by the other operators which use different subscriber recognition policies. The above figure reflects market share as of May 30, 2013.
2. Figures for three month period.
Orascom Telecom Second Quarter 2013
11 | P a g e
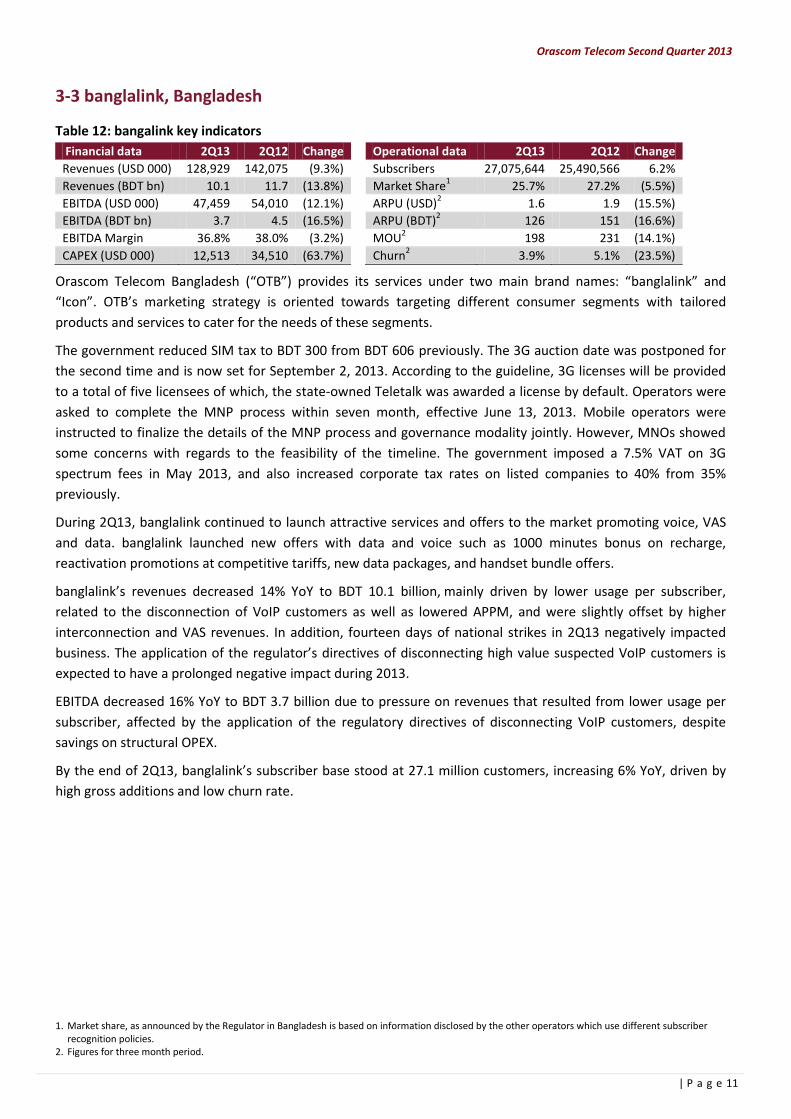
3-3 banglalink, Bangladesh
Table 12: bangalink key indicators
Financial data 2Q13 2Q12 Change
Operational data 2Q13 2Q12 Change
Revenues (USD 000) 128,929 142,075 (9.3%)
Subscribers 27,075,644 25,490,566 6.2%
Revenues (BDT bn) 10.1 11.7 (13.8%)
Market Share1 25.7% 27.2% (5.5%)
EBITDA (USD 000) 47,459 54,010 (12.1%)
ARPU (USD)2 1.6 1.9 (15.5%)
EBITDA (BDT bn) 3.7 4.5 (16.5%)
ARPU (BDT)2 126 151 (16.6%)
EBITDA Margin 36.8% 38.0% (3.2%)
MOU2 198 231 (14.1%)
CAPEX (USD 000) 12,513 34,510 (63.7%)
Churn2 3.9% 5.1% (23.5%)
Orascom Telecom Bangladesh (“OTB”) provides its services under two main brand names: “banglalink” and
“Icon”. OTB’s marketing strategy is oriented towards targeting different consumer segments with tailored
products and services to cater for the needs of these segments.
The government reduced SIM tax to BDT 300 from BDT 606 previously. The 3G auction date was postponed for
the second time and is now set for September 2, 2013. According to the guideline, 3G licenses will be provided
to a total of five licensees of which, the state-owned Teletalk was awarded a license by default. Operators were
asked to complete the MNP process within seven month, effective June 13, 2013. Mobile operators were
instructed to finalize the details of the MNP process and governance modality jointly. However, MNOs showed
some concerns with regards to the feasibility of the timeline. The government imposed a 7.5% VAT on 3G
spectrum fees in May 2013, and also increased corporate tax rates on listed companies to 40% from 35%
previously.
During 2Q13, banglalink continued to launch attractive services and offers to the market promoting voice, VAS
and data. banglalink launched new offers with data and voice such as 1000 minutes bonus on recharge,
reactivation promotions at competitive tariffs, new data packages, and handset bundle offers.
banglalink’s revenues decreased 14% YoY to BDT 10.1 billion, mainly driven by lower usage per subscriber,
related to the disconnection of VoIP customers as well as lowered APPM, and were slightly offset by higher
interconnection and VAS revenues. In addition, fourteen days of national strikes in 2Q13 negatively impacted
business. The application of the regulator’s directives of disconnecting high value suspected VoIP customers is
expected to have a prolonged negative impact during 2013.
EBITDA decreased 16% YoY to BDT 3.7 billion due to pressure on revenues that resulted from lower usage per
subscriber, affected by the application of the regulatory directives of disconnecting VoIP customers, despite
savings on structural OPEX.
By the end of 2Q13, banglalink’s subscriber base stood at 27.1 million customers, increasing 6% YoY, driven by
high gross additions and low churn rate.
1. Market share, as announced by the Regulator in Bangladesh is based on information disclosed by the other operators which use different subscriber recognition policies.
2. Figures for three month period.
Orascom Telecom Second Quarter 2013
12 | P a g e
3-4 WIND Mobile, Canada
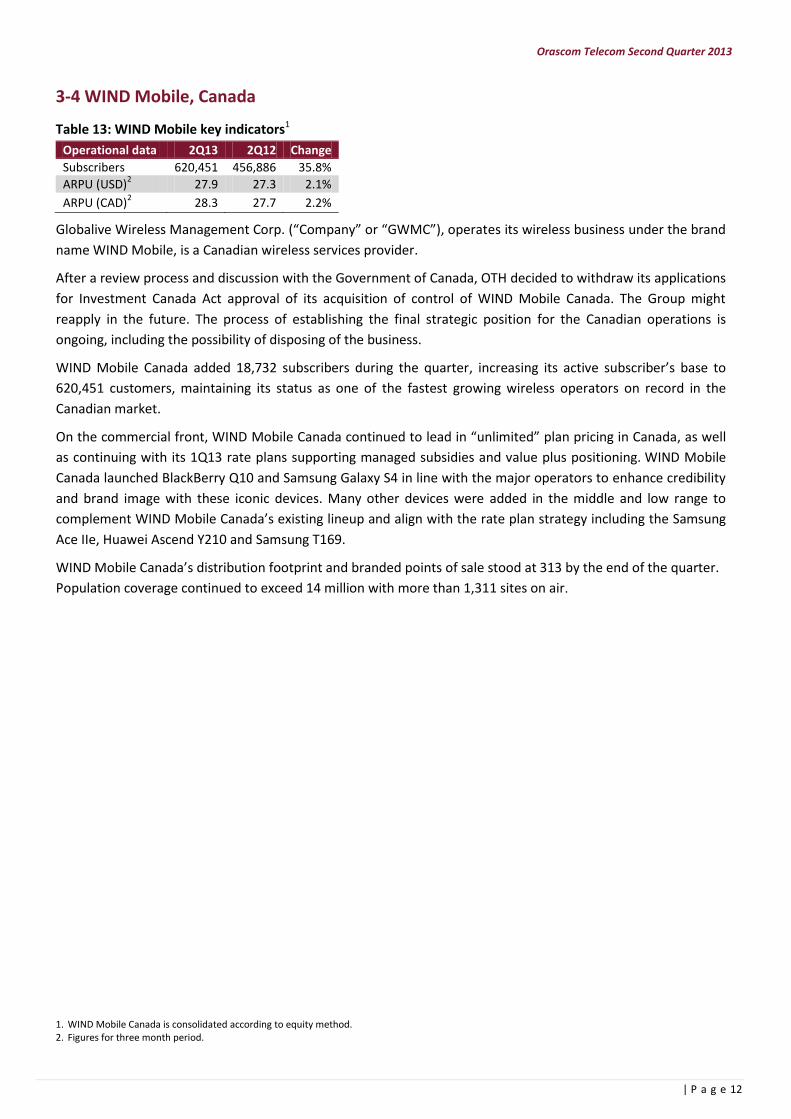
Table 13: WIND Mobile key indicators1
Operational data 2Q13 2Q12 Change
Subscribers 620,451 456,886 35.8%
ARPU (USD)2 27.9 27.3 2.1%
ARPU (CAD)2 28.3 27.7 2.2%
Globalive Wireless Management Corp. (“Company” or “GWMC”), operates its wireless business under the brand
name WIND Mobile, is a Canadian wireless services provider.
After a review process and discussion with the Government of Canada, OTH decided to withdraw its applications
for Investment Canada Act approval of its acquisition of control of WIND Mobile Canada. The Group might
reapply in the future. The process of establishing the final strategic position for the Canadian operations is
ongoing, including the possibility of disposing of the business.
WIND Mobile Canada added 18,732 subscribers during the quarter, increasing its active subscriber’s base to
620,451 customers, maintaining its status as one of the fastest growing wireless operators on record in the
Canadian market.
On the commercial front, WIND Mobile Canada continued to lead in “unlimited” plan pricing in Canada, as well
as continuing with its 1Q13 rate plans supporting managed subsidies and value plus positioning. WIND Mobile
Canada launched BlackBerry Q10 and Samsung Galaxy S4 in line with the major operators to enhance credibility
and brand image with these iconic devices. Many other devices were added in the middle and low range to
complement WIND Mobile Canada’s existing lineup and align with the rate plan strategy including the Samsung
Ace IIe, Huawei Ascend Y210 and Samsung T169.
WIND Mobile Canada’s distribution footprint and branded points of sale stood at 313 by the end of the quarter.
Population coverage continued to exceed 14 million with more than 1,311 sites on air.
1. WIND Mobile Canada is consolidated according to equity method. 2. Figures for three month period.
Orascom Telecom Second Quarter 2013
13 | P a g e
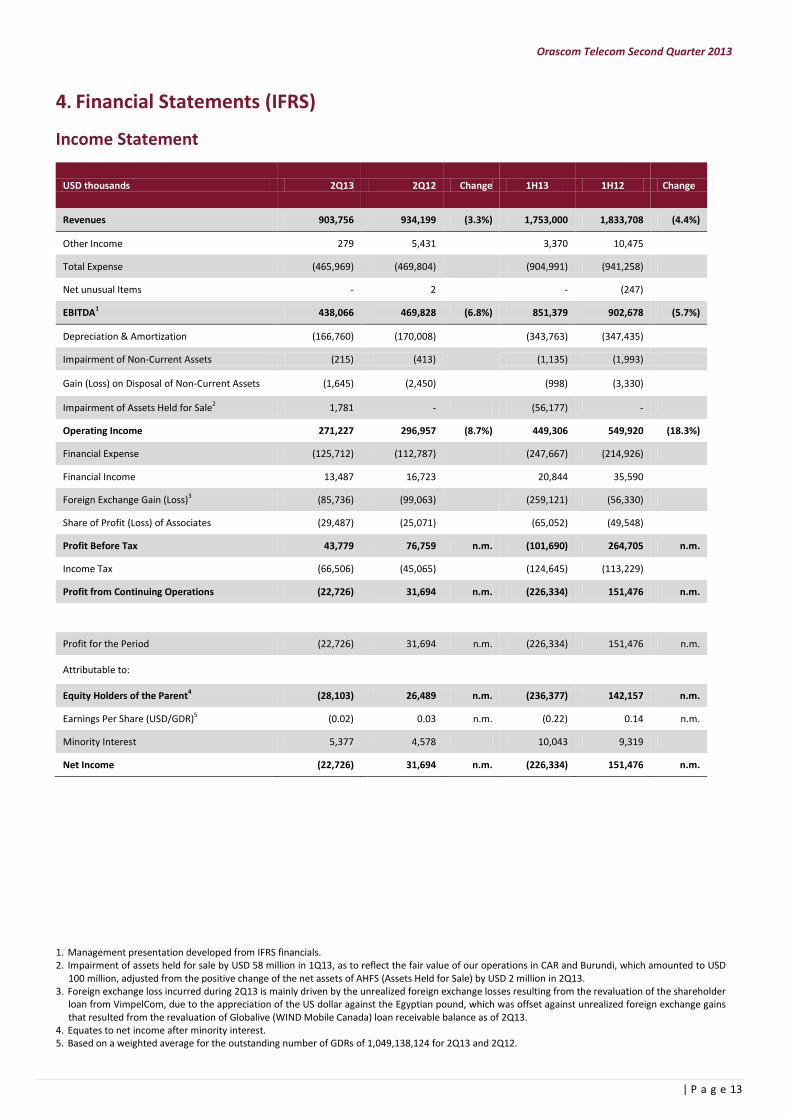
4. Financial Statements (IFRS)
Income Statement
USD thousands 2Q13 2Q12 Change 1H13 1H12 Change
Revenues 903,756 934,199 (3.3%) 1,753,000 1,833,708 (4.4%)
Other Income 279 5,431
3,370 10,475
Total Expense (465,969) (469,804)
(904,991) (941,258)
Net unusual Items - 2
- (247)
EBITDA1 438,066 469,828 (6.8%) 851,379 902,678 (5.7%)
Depreciation & Amortization (166,760) (170,008)
(343,763) (347,435)
Impairment of Non-Current Assets (215) (413)
(1,135) (1,993)
Gain (Loss) on Disposal of Non-Current Assets (1,645) (2,450)
(998) (3,330)
Impairment of Assets Held for Sale2 1,781 - (56,177) -
Operating Income 271,227 296,957 (8.7%) 449,306 549,920 (18.3%)
Financial Expense (125,712) (112,787)
(247,667) (214,926)
Financial Income 13,487 16,723
20,844 35,590
Foreign Exchange Gain (Loss)3 (85,736) (99,063)
(259,121) (56,330)
Share of Profit (Loss) of Associates (29,487) (25,071)
(65,052) (49,548)
Profit Before Tax 43,779 76,759 n.m. (101,690) 264,705 n.m.
Income Tax (66,506) (45,065)
(124,645) (113,229)
Profit from Continuing Operations (22,726) 31,694 n.m. (226,334) 151,476 n.m.
Profit for the Period (22,726) 31,694 n.m. (226,334) 151,476 n.m.
Attributable to:
Equity Holders of the Parent4 (28,103) 26,489 n.m. (236,377) 142,157 n.m.
Earnings Per Share (USD/GDR)5 (0.02) 0.03 n.m. (0.22) 0.14 n.m.
Minority Interest 5,377 4,578 10,043 9,319
Net Income (22,726) 31,694 n.m. (226,334) 151,476 n.m.
1. Management presentation developed from IFRS financials. 2. Impairment of assets held for sale by USD 58 million in 1Q13, as to reflect the fair value of our operations in CAR and Burundi, which amounted to USD
100 million, adjusted from the positive change of the net assets of AHFS (Assets Held for Sale) by USD 2 million in 2Q13. 3. Foreign exchange loss incurred during 2Q13 is mainly driven by the unrealized foreign exchange losses resulting from the revaluation of the shareholder
loan from VimpelCom, due to the appreciation of the US dollar against the Egyptian pound, which was offset against unrealized foreign exchange gains that resulted from the revaluation of Globalive (WIND Mobile Canada) loan receivable balance as of 2Q13.
4. Equates to net income after minority interest. 5. Based on a weighted average for the outstanding number of GDRs of 1,049,138,124 for 2Q13 and 2Q12.
Orascom Telecom Second Quarter 2013
14 | P a g e
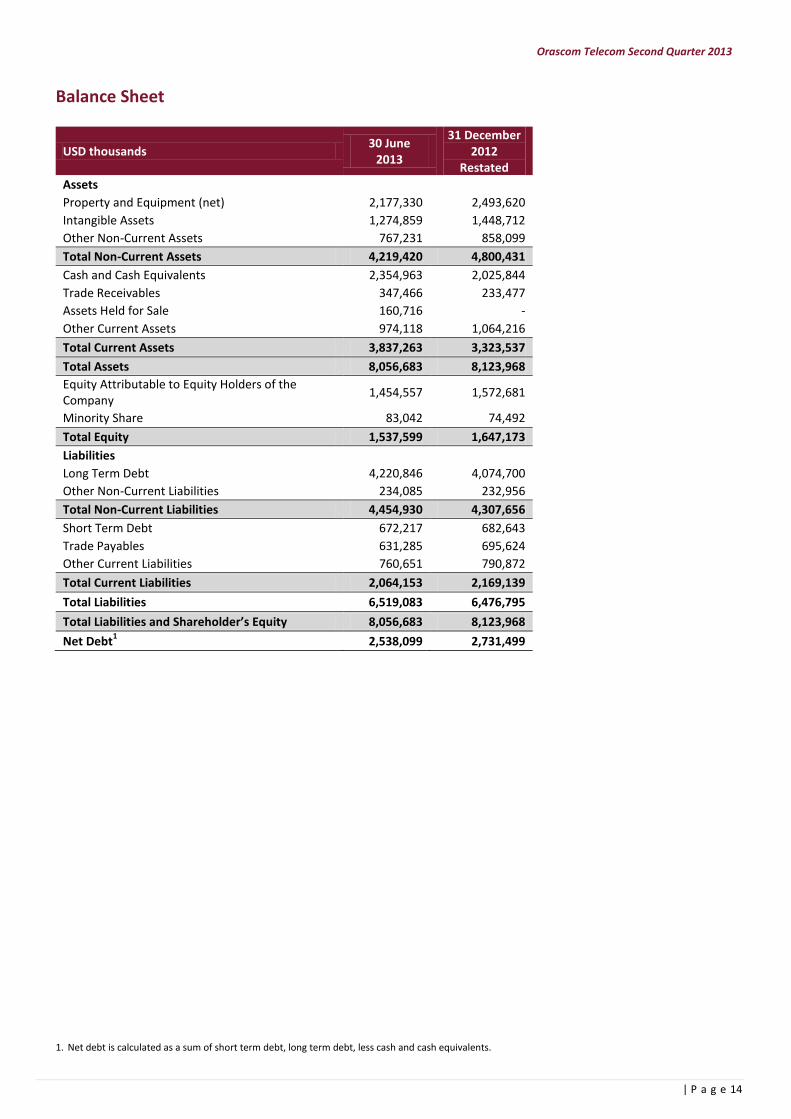
Balance Sheet
USD thousands 30 June
2013
31 December 2012
Restated
Assets
Property and Equipment (net) 2,177,330 2,493,620
Intangible Assets 1,274,859 1,448,712
Other Non-Current Assets 767,231 858,099
Total Non-Current Assets 4,219,420 4,800,431
Cash and Cash Equivalents 2,354,963 2,025,844
Trade Receivables 347,466 233,477
Assets Held for Sale 160,716 -
Other Current Assets 974,118 1,064,216
Total Current Assets 3,837,263 3,323,537
Total Assets 8,056,683 8,123,968
Equity Attributable to Equity Holders of the Company
1,454,557 1,572,681
Minority Share 83,042 74,492
Total Equity 1,537,599 1,647,173
Liabilities
Long Term Debt 4,220,846 4,074,700
Other Non-Current Liabilities 234,085 232,956
Total Non-Current Liabilities 4,454,930 4,307,656
Short Term Debt 672,217 682,643
Trade Payables 631,285 695,624
Other Current Liabilities 760,651 790,872
Total Current Liabilities 2,064,153 2,169,139
Total Liabilities 6,519,083 6,476,795
Total Liabilities and Shareholder’s Equity 8,056,683 8,123,968
Net Debt1
2,538,099 2,731,499
1. Net debt is calculated as a sum of short term debt, long term debt, less cash and cash equivalents.
Orascom Telecom Second Quarter 2013
15 | P a g e
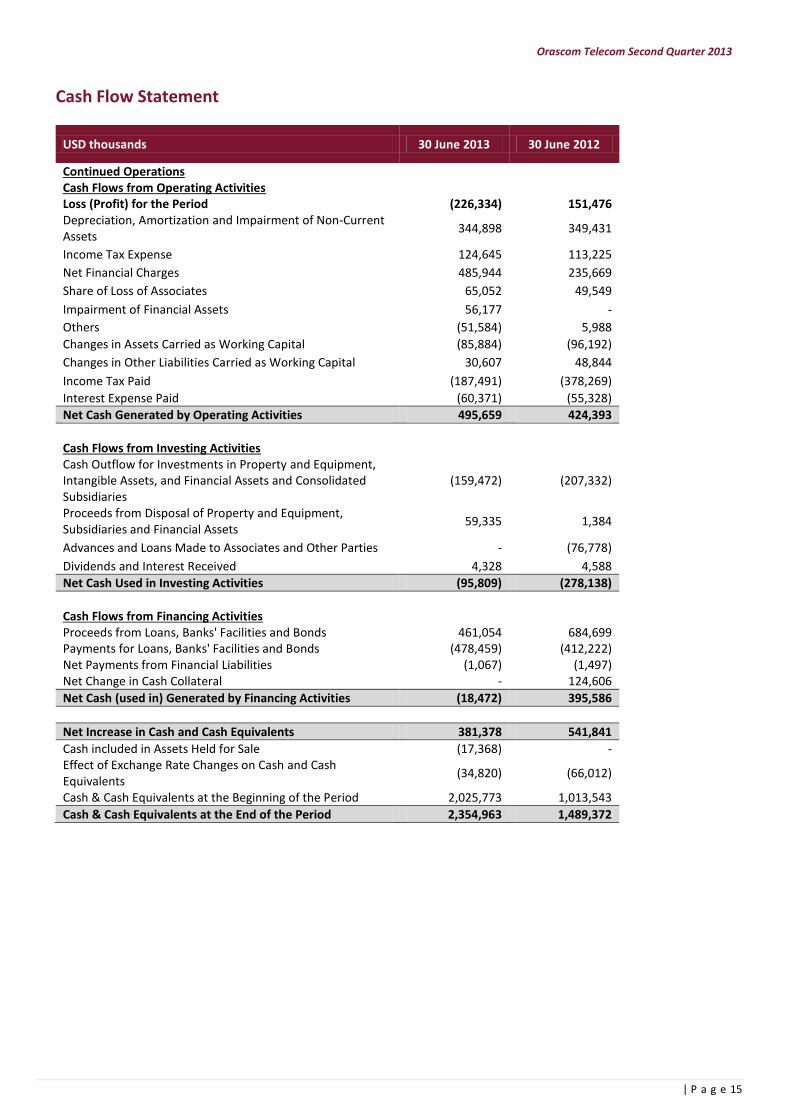
Cash Flow Statement
USD thousands 30 June 2013 30 June 2012
Continued Operations Cash Flows from Operating Activities Loss (Profit) for the Period (226,334) 151,476 Depreciation, Amortization and Impairment of Non-Current Assets
344,898 349,431
Income Tax Expense 124,645 113,225
Net Financial Charges 485,944 235,669
Share of Loss of Associates 65,052 49,549
Impairment of Financial Assets 56,177 -
Others (51,584) 5,988
Changes in Assets Carried as Working Capital (85,884) (96,192)
Changes in Other Liabilities Carried as Working Capital 30,607 48,844
Income Tax Paid (187,491) (378,269)
Interest Expense Paid (60,371) (55,328)
Net Cash Generated by Operating Activities 495,659 424,393
Cash Flows from Investing Activities Cash Outflow for Investments in Property and Equipment, Intangible Assets, and Financial Assets and Consolidated Subsidiaries
(159,472) (207,332)
Proceeds from Disposal of Property and Equipment, Subsidiaries and Financial Assets
59,335 1,384
Advances and Loans Made to Associates and Other Parties - (76,778)
Dividends and Interest Received 4,328 4,588
Net Cash Used in Investing Activities (95,809) (278,138)
Cash Flows from Financing Activities Proceeds from Loans, Banks' Facilities and Bonds 461,054 684,699 Payments for Loans, Banks' Facilities and Bonds (478,459) (412,222) Net Payments from Financial Liabilities (1,067) (1,497) Net Change in Cash Collateral - 124,606
Net Cash (used in) Generated by Financing Activities (18,472) 395,586
Net Increase in Cash and Cash Equivalents 381,378 541,841
Cash included in Assets Held for Sale (17,368) - Effect of Exchange Rate Changes on Cash and Cash Equivalents
(34,820) (66,012)
Cash & Cash Equivalents at the Beginning of the Period 2,025,773 1,013,543
Cash & Cash Equivalents at the End of the Period 2,354,963 1,489,372
Orascom Telecom Second Quarter 2013
16 | P a g e
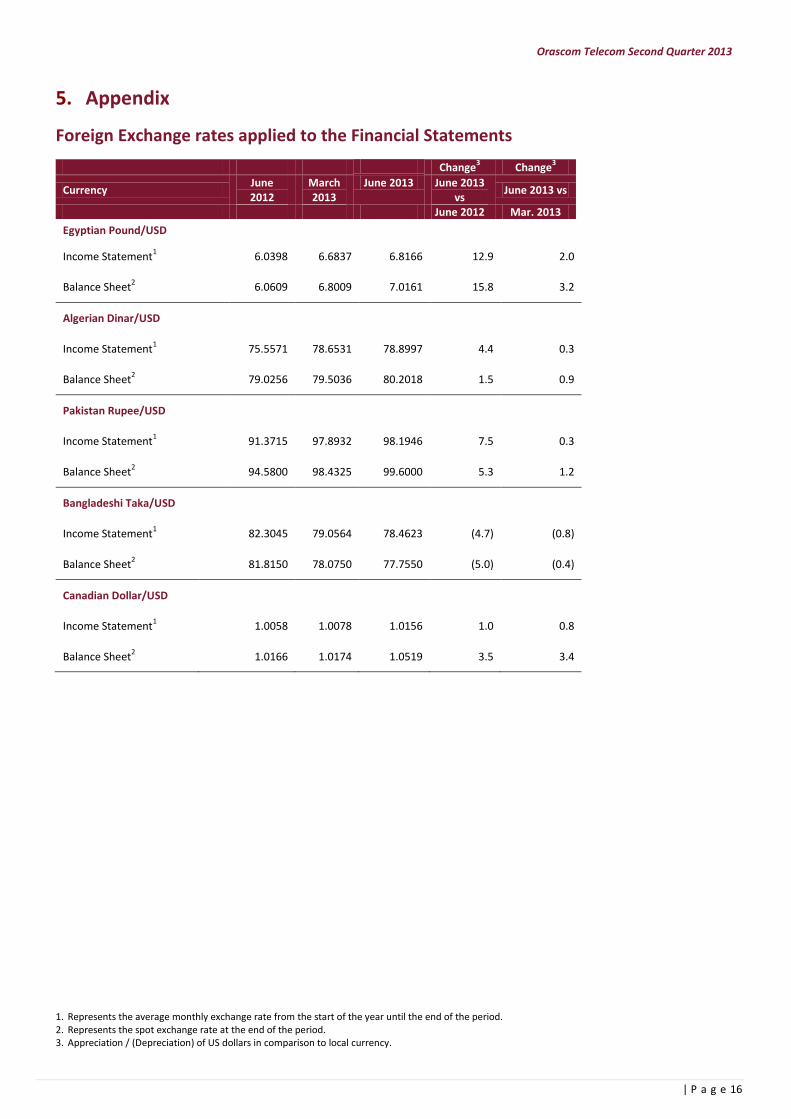
5. Appendix
Foreign Exchange rates applied to the Financial Statements
Change3
Change3
Currency June 2012
March 2013
June 2013 June 2013 vs
June 2013 vs
June 2012 Mar. 2013
Egyptian Pound/USD
Income Statement1
6.0398 6.6837 6.8166 12.9 2.0
Balance Sheet2
6.0609 6.8009 7.0161 15.8 3.2
Algerian Dinar/USD
Income Statement1
75.5571 78.6531 78.8997 4.4 0.3
Balance Sheet2
79.0256 79.5036 80.2018 1.5 0.9
Pakistan Rupee/USD
Income Statement1
91.3715 97.8932 98.1946 7.5 0.3
Balance Sheet2
94.5800 98.4325 99.6000 5.3 1.2
Bangladeshi Taka/USD
Income Statement1
82.3045 79.0564 78.4623 (4.7) (0.8)
Balance Sheet2
81.8150 78.0750 77.7550 (5.0) (0.4)
Canadian Dollar/USD
Income Statement1 1.0058 1.0078 1.0156 1.0 0.8
Balance Sheet2
1.0166 1.0174 1.0519 3.5 3.4
1. Represents the average monthly exchange rate from the start of the year until the end of the period. 2. Represents the spot exchange rate at the end of the period. 3. Appreciation / (Depreciation) of US dollars in comparison to local currency.
Orascom Telecom Second Quarter 2013
17 | P a g e
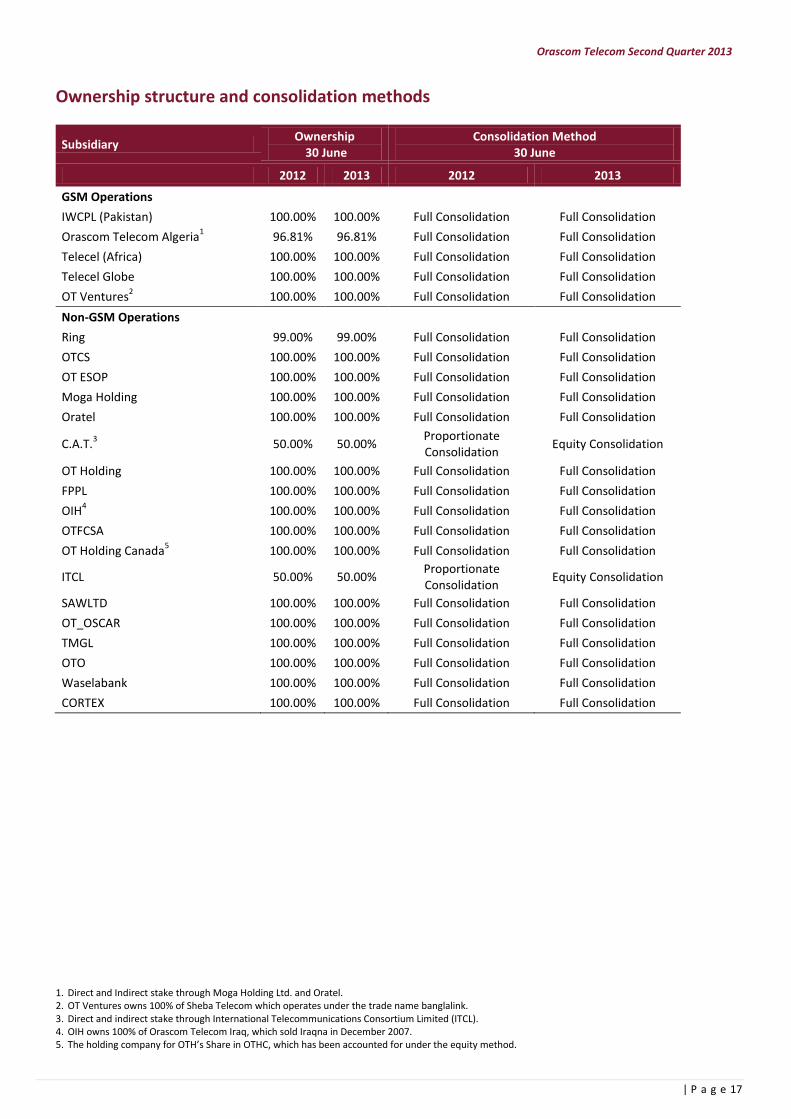
Ownership structure and consolidation methods
Subsidiary Ownership
30 June Consolidation Method
30 June
2012 2013 2012 2013
GSM Operations
IWCPL (Pakistan) 100.00% 100.00% Full Consolidation Full Consolidation
Orascom Telecom Algeria1
96.81% 96.81% Full Consolidation Full Consolidation
Telecel (Africa) 100.00% 100.00% Full Consolidation Full Consolidation
Telecel Globe 100.00% 100.00% Full Consolidation Full Consolidation
OT Ventures2
100.00% 100.00% Full Consolidation Full Consolidation
Non-GSM Operations
Ring 99.00% 99.00% Full Consolidation Full Consolidation
OTCS 100.00% 100.00% Full Consolidation Full Consolidation
OT ESOP 100.00% 100.00% Full Consolidation Full Consolidation
Moga Holding 100.00% 100.00% Full Consolidation Full Consolidation
Oratel 100.00% 100.00% Full Consolidation Full Consolidation
C.A.T.3
50.00% 50.00% Proportionate Consolidation
Equity Consolidation
OT Holding 100.00% 100.00% Full Consolidation Full Consolidation
FPPL 100.00% 100.00% Full Consolidation Full Consolidation
OIH4
100.00% 100.00% Full Consolidation Full Consolidation
OTFCSA 100.00% 100.00% Full Consolidation Full Consolidation
OT Holding Canada5
100.00% 100.00% Full Consolidation Full Consolidation
ITCL 50.00% 50.00% Proportionate Consolidation
Equity Consolidation
SAWLTD 100.00% 100.00% Full Consolidation Full Consolidation
OT_OSCAR 100.00% 100.00% Full Consolidation Full Consolidation
TMGL 100.00% 100.00% Full Consolidation Full Consolidation
OTO 100.00% 100.00% Full Consolidation Full Consolidation
Waselabank 100.00% 100.00% Full Consolidation Full Consolidation
CORTEX 100.00% 100.00% Full Consolidation Full Consolidation
1. Direct and Indirect stake through Moga Holding Ltd. and Oratel. 2. OT Ventures owns 100% of Sheba Telecom which operates under the trade name banglalink. 3. Direct and indirect stake through International Telecommunications Consortium Limited (ITCL). 4. OIH owns 100% of Orascom Telecom Iraq, which sold Iraqna in December 2007. 5. The holding company for OTH’s Share in OTHC, which has been accounted for under the equity method.
Orascom Telecom Second Quarter 2013
18 | P a g e
Glossary of terms
Average Revenue per User (“ARPU”): Average monthly recurrent revenue per customer (excluding visitors roaming revenue and connection fee). This includes airtime revenue (national and international), as well as, monthly subscription fee, SMS, GPRS & data revenue. Quarterly ARPU is calculated as an average of the last three months.
Capital Expenditure (“Capex”): Tangible & Intangible fixed assets additions during the reporting period, includes work in progress, network, IT, and other tangible and intangible fixed assets additions but excludes license fees.
Churn: Disconnection rate. This is calculated as the number of disconnections during a month divided by the average customer base for that month.
Churn Rule: A subscriber is considered churned (removed from the subscriber base) if he exceeds the 90 days from the end of the validity period without recharging. It is worth noting that the validity period is a function of the scratch denomination. In cases where scratch cards have open validity, the subscriber is considered churned in case he has not made a single billable event in the last 90 days (i.e. outgoing or incoming call or sms, wap session). Open cards validity is applied for OTA, Mobilink and Banglalink so far.
Minutes of Usage (“MOU”): Average airtime minutes per customer per month. This includes billable national & international outgoing traffic originated by subscribers (on-net, to land line & to other operators). Also, this includes incoming traffic to subscribers from land line or other operators.
OTH’s Market Share Calculation Method: The market share is calculated through the data warehouse of OTH’s subsidiaries. The number of SIM cards of competitors that appeared in the call detail record of each of OTH’s subsidiaries is collected. This reflects the number of subscribers of the competition. However, OTH deducts the number of SIM cards that did not appear in the call detail records for the last 90 days to account for churn. The same is applied to OTH subsidiaries. This method is used to calculate the market shares of Djezzy. In Pakistan and Bangladesh, Market share as announced by the Regulators is based on disclosed information by the other operators which may use different subscriber recognition policy
Organic Growth for Revenue and EBITDA: Are non-IFRS financial measures that reflect changes in Revenue and EBITDA excluding foreign currency movements and other factors, such as business under liquidation, disposals, mergers and acquisitions. We believe readers of this earnings release should consider these measures as it is more indicative of the Group’s on-going performance. Management uses these measures to evaluate the Group’s operational results and trends.
Investor Relations contacts
Mamdouh Abdel Wahab Head of Investor Relations Email: [email protected] Website: www.otelecom.com Tel: +202 2461 5120/21 Fax: +202 2461 5055/54
This presentation contains statements that could be construed as forward looking. These statements appear in a number of places in this presentation and include statements regarding the intent, belief or current expectations of the subscriber base, estimates regarding future growth in the different business lines and the global business, market share, financial results and other aspects of the activity and situation relating to the company. Such forward looking statements are no guarantees of future performance and involve risks and uncertainties, and actual results may differ materially from those in the forward looking statements as a result of various factors. You are cautioned not to place undue reliance on those forward looking statements, which speak only as of the date of this presentation, which is not intended to reflect Orascom Telecom’s business or acquisition strategy or the occurrence of unanticipated events.