Oral and dental diseases: Causes, prevention and treatment ... · Oral and dental diseases: Causes,...
24
NCMH Background Papers·Burden of Disease in India Oral and dental diseases: Causes, prevention and treatment strategies NASEEM SHAH Dental caries is an infectious microbiological disease of the teeth that results in localized dissolution and destruction of the calcified tissues. It is the second most common cause of tooth loss and is found universally, irrespective of age, sex, caste, creed or geographic location. It is considered to be a disease of civilized society, related to lifestyle factors, but heredity also plays a role. In the late stages, it causes severe pain, is expensive to treat and leads to loss of precious man-hours. However, it is preventable to a certain extent. The prevalence of dental caries in India is 50%–60%. Aetiology An interplay of three principal factors is responsible for this multifactorial disease. • Host (teeth and saliva) • Microorganisms in the form of dental plaque • Substrate (diet) Thus, caries requires a susceptible host, cariogenic oral flora and a suitable substrate, which must be present for a sufficient length of time. Host factors Teeth 1–4 • Composition: Deficiency in fluorine, zinc, lead and iron content of the enamel is associated with increased caries. • Morphological characteristics: Deep, narrow occlusal fissures, and lingual and buccal pits tend to trap food debris and bacteria, which can cause caries. As teeth get worn (attrition), caries declines. • Position: The interdental areas are more susceptible to dental caries. Malalignment of the teeth such as crowding, abnormal spacing, etc. can increase the susceptibility to caries. Saliva 5–8 Saliva has a cleansing effect on the teeth. Normally, 700– 800 ml of saliva is secreted per day. Caries activity increases as the viscosity of the saliva increases. Eating fibrous food and chewing vigorously increases salivation, which helps in digestion as well as improves cleansing of the teeth. The quantity as well as composition, pH, viscosity and buffering capacity of the saliva plays a role in dental caries. • Quantity: Reduced salivary secretion as found in xerostomia and salivary gland aplasia gives rise to increased caries activity. • Composition: Inorganic—fluoride, chloride, sodium, magnesium, potassium, iron, calcium and phosphorus are inversely related to caries. Organic—ammonia retards plaque formation and neutralizes the acid. • pH: A neutral or alkaline pH can neutralize acids formed by the action of microorganisms on carbohydrate food substances. • Antibacterial factors: Saliva contains enzymes such as lactoperoxidase, lypozyme, lactoferrin and immuno- globulin (Ig)A, which can inhibit plaque bacteria. Dental plaque 9–12 Dental plaque is a thin, tenacious microbial film that forms on the tooth surfaces. Microorganisms in the dental plaque ferment carbohydrate foodstuffs, especially the disaccharide sucrose, to produce acids that cause demineralization of inorganic substances and furnish various proteolytic enzymes to cause disintegration of the organic substances of the teeth, the processes involved in the initiation and progression of dental caries. The dental plaque holds the acids produced in close contact with the tooth surfaces and prevents them from contact with the cleansing action of saliva. DENTAL CARIES Division of Conservative Dentistry and Endodontics Centre for Dental Education and Research All India Institute of Medical Sciences, New Delhi 110029 e-mail: [email protected]
Transcript of Oral and dental diseases: Causes, prevention and treatment ... · Oral and dental diseases: Causes,...

���
NCMH Background Papers·Burden of Disease in India
Oral and dental diseases: Causes, prevention and treatment strategies
Oral and dental diseases: Causes, prevention and treatment strategies
NASEEM SHAH
Dental caries is an infectious microbiological disease ofthe teeth that results in localized dissolution and destructionof the calcified tissues. It is the second most common causeof tooth loss and is found universally, irrespective of age,sex, caste, creed or geographic location. It is considered tobe a disease of civilized society, related to lifestyle factors,but heredity also plays a role. In the late stages, it causessevere pain, is expensive to treat and leads to loss of preciousman-hours. However, it is preventable to a certain extent.The prevalence of dental caries in India is 50%–60%.
Aetiology
An interplay of three principal factors is responsible forthis multifactorial disease.
• Host (teeth and saliva)• Microorganisms in the form of dental plaque• Substrate (diet)
Thus, caries requires a susceptible host, cariogenic oralflora and a suitable substrate, which must be present for asufficient length of time.
Host factors
Teeth1–4
• Composition: Deficiency in fluorine, zinc, lead and ironcontent of the enamel is associated with increased caries.
• Morphological characteristics: Deep, narrow occlusalfissures, and lingual and buccal pits tend to trap fooddebris and bacteria, which can cause caries. As teeth getworn (attrition), caries declines.
• Position: The interdental areas are more susceptible to dental
caries. Malalignment of the teeth such as crowding, abnormalspacing, etc. can increase the susceptibility to caries.
Saliva5–8
Saliva has a cleansing effect on the teeth. Normally, 700–800 ml of saliva is secreted per day. Caries activity increasesas the viscosity of the saliva increases. Eating fibrous foodand chewing vigorously increases salivation, which helpsin digestion as well as improves cleansing of the teeth. Thequantity as well as composition, pH, viscosity and bufferingcapacity of the saliva plays a role in dental caries.
• Quantity: Reduced salivary secretion as found in xerostomiaand salivary gland aplasia gives rise to increased cariesactivity.
• Composition: Inorganic—fluoride, chloride, sodium,magnesium, potassium, iron, calcium and phosphorusare inversely related to caries.Organic—ammonia retards plaque formation andneutralizes the acid.
• pH: A neutral or alkaline pH can neutralize acids formedby the action of microorganisms on carbohydrate foodsubstances.
• Antibacterial factors: Saliva contains enzymes such aslactoperoxidase, lypozyme, lactoferrin and immuno-globulin (Ig)A, which can inhibit plaque bacteria.
Dental plaque9–12
Dental plaque is a thin, tenacious microbial film that formson the tooth surfaces. Microorganisms in the dental plaqueferment carbohydrate foodstuffs, especially the disaccharidesucrose, to produce acids that cause demineralization ofinorganic substances and furnish various proteolyticenzymes to cause disintegration of the organic substancesof the teeth, the processes involved in the initiation andprogression of dental caries. The dental plaque holds theacids produced in close contact with the tooth surfacesand prevents them from contact with the cleansing actionof saliva.
DENTAL CARIES
Division of Conservative Dentistry and EndodonticsCentre for Dental Education and ResearchAll India Institute of Medical Sciences, New Delhi 110029e-mail: [email protected]
���
NCMH Background Papers·Burden of Disease in India
Shah
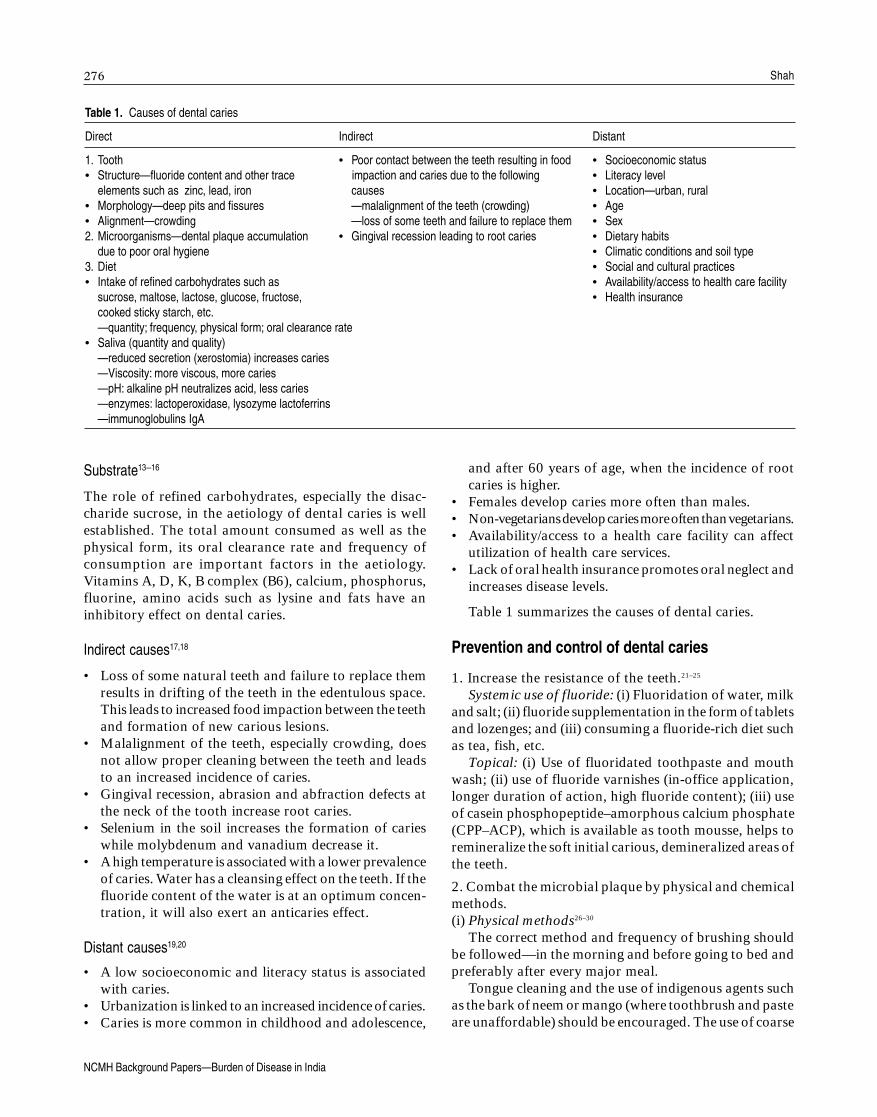
Table 1. Causes of dental caries
Direct Indirect Distant
1. Tooth • Poor contact between the teeth resulting in food • Socioeconomic status• Structure·fluoride content and other trace impaction and caries due to the following • Literacy level
elements such as zinc, lead, iron causes • Location·urban, rural• Morphology·deep pits and fissures ·malalignment of the teeth (crowding) • Age• Alignment·crowding ·loss of some teeth and failure to replace them • Sex2. Microorganisms·dental plaque accumulation • Gingival recession leading to root caries • Dietary habits
due to poor oral hygiene • Climatic conditions and soil type3. Diet • Social and cultural practices• Intake of refined carbohydrates such as • Availability/access to health care facility
sucrose, maltose, lactose, glucose, fructose, • Health insurancecooked sticky starch, etc.·quantity; frequency, physical form; oral clearance rate
• Saliva (quantity and quality)·reduced secretion (xerostomia) increases caries·Viscosity: more viscous, more caries·pH: alkaline pH neutralizes acid, less caries·enzymes: lactoperoxidase, lysozyme lactoferrins·immunoglobulins IgA
Substrate13–16
The role of refined carbohydrates, especially the disac-charide sucrose, in the aetiology of dental caries is wellestablished. The total amount consumed as well as thephysical form, its oral clearance rate and frequency ofconsumption are important factors in the aetiology.Vitamins A, D, K, B complex (B6), calcium, phosphorus,fluorine, amino acids such as lysine and fats have aninhibitory effect on dental caries.
Indirect causes17,18
• Loss of some natural teeth and failure to replace themresults in drifting of the teeth in the edentulous space.This leads to increased food impaction between the teethand formation of new carious lesions.
• Malalignment of the teeth, especially crowding, doesnot allow proper cleaning between the teeth and leadsto an increased incidence of caries.
• Gingival recession, abrasion and abfraction defects atthe neck of the tooth increase root caries.
• Selenium in the soil increases the formation of carieswhile molybdenum and vanadium decrease it.
• A high temperature is associated with a lower prevalenceof caries. Water has a cleansing effect on the teeth. If thefluoride content of the water is at an optimum concen-tration, it will also exert an anticaries effect.
Distant causes19,20
• A low socioeconomic and literacy status is associatedwith caries.
• Urbanization is linked to an increased incidence of caries.• Caries is more common in childhood and adolescence,
and after 60 years of age, when the incidence of rootcaries is higher.
• Females develop caries more often than males.• Non-vegetarians develop caries more often than vegetarians.• Availability/access to a health care facility can affect
utilization of health care services.• Lack of oral health insurance promotes oral neglect and
increases disease levels.
Table 1 summarizes the causes of dental caries.
Prevention and control of dental caries
1. Increase the resistance of the teeth.21–25
Systemic use of fluoride: (i) Fluoridation of water, milkand salt; (ii) fluoride supplementation in the form of tabletsand lozenges; and (iii) consuming a fluoride-rich diet suchas tea, fish, etc.
Topical: (i) Use of fluoridated toothpaste and mouthwash; (ii) use of fluoride varnishes (in-office application,longer duration of action, high fluoride content); (iii) useof casein phosphopeptide–amorphous calcium phosphate(CPP–ACP), which is available as tooth mousse, helps toremineralize the soft initial carious, demineralized areas ofthe teeth.
2. Combat the microbial plaque by physical and chemicalmethods.(i) Physical methods26–30
The correct method and frequency of brushing shouldbe followed—in the morning and before going to bed andpreferably after every major meal.
Tongue cleaning and the use of indigenous agents suchas the bark of neem or mango (where toothbrush and pasteare unaffordable) should be encouraged. The use of coarse
���
NCMH Background Papers·Burden of Disease in India
Oral and dental diseases: Causes, prevention and treatment strategies
toothpowder and tobacco-containing dentifrices should beavoided.
The use of various interdental cleaning aids such as dentalfloss, interdental brush, water pik, etc. supplements thecleansing effect of a toothbrush. Use of an electronictoothbrush in children and persons with decreased manualdexterity is recommended.(ii) Chemical methods
These include the use of a fluoride-containing toothpaste,mouth rinses and 0.2% chlorhexidine and povidine–iodinemouthwash. These should be used on prescription of adental surgeon.
3. Modify the diet.31–34
Reduce the intake and frequency of refined carbo-hydrates. Avoid sticky foods and replace refined withunrefined natural food. Increase the intake of fibrous foodto stimulate salivary flow, which is protective against caries.Consume caries-protective foods such as cheese, nuts, rawvegetables, fruits, etc. Stimulate salivary flow with sugar-free chewing gum. Xylitol (a sugar substitute)-containingchewing gum, if chewed between meals, produces an anti-caries effect by stimulating salivary flow.
Preventive interventions35–43
The use of pit and fissure sealants35,36 and application offluoride varnish37,38 help in slowing down the developmentof caries.
Preventive restorations should be carried out39,40 andatraumatic restorative treatment (ART) should be used asa community-based approach for the treatment and preven-tion of dental caries.41–43
Treatment of dental caries
Treatment comprises removal of decay by operative pro-cedures and restoration with appropriate materials suchas silver fillings, gold inlays, composite resin, glass ionomercement, full metal or porcelain crowns, etc. In advancedcases, where the pulp of the tooth is involved, endodontictreatment may be required. Where there is extensivedestruction of the tooth structure or when endodontictreatment is not feasible, extraction of the tooth andreplacement by an artificial prosthesis may be required.
Miscellaneous measures
These include the following:
• Prevention of malocclusion (especially crowding of theteeth)
• Prevention of premature loss of deciduous teeth• Restoration of missing permanent teeth by prostheses
(dentures)• Making sugar-free chewing gum freely available and
affordable in the country
• Using sugar substitutes such as saccharine, xylitol,mannitol, aspartame, etc. in paediatric medicinal syrups,bakery products, jams, marmalade, etc.
• Making toothbrushes and fluoridated toothpaste availableto the masses at low cost. Regular use of fluoridatedtoothpaste is proven to reduce the incidence of dentalcaries by 30%.
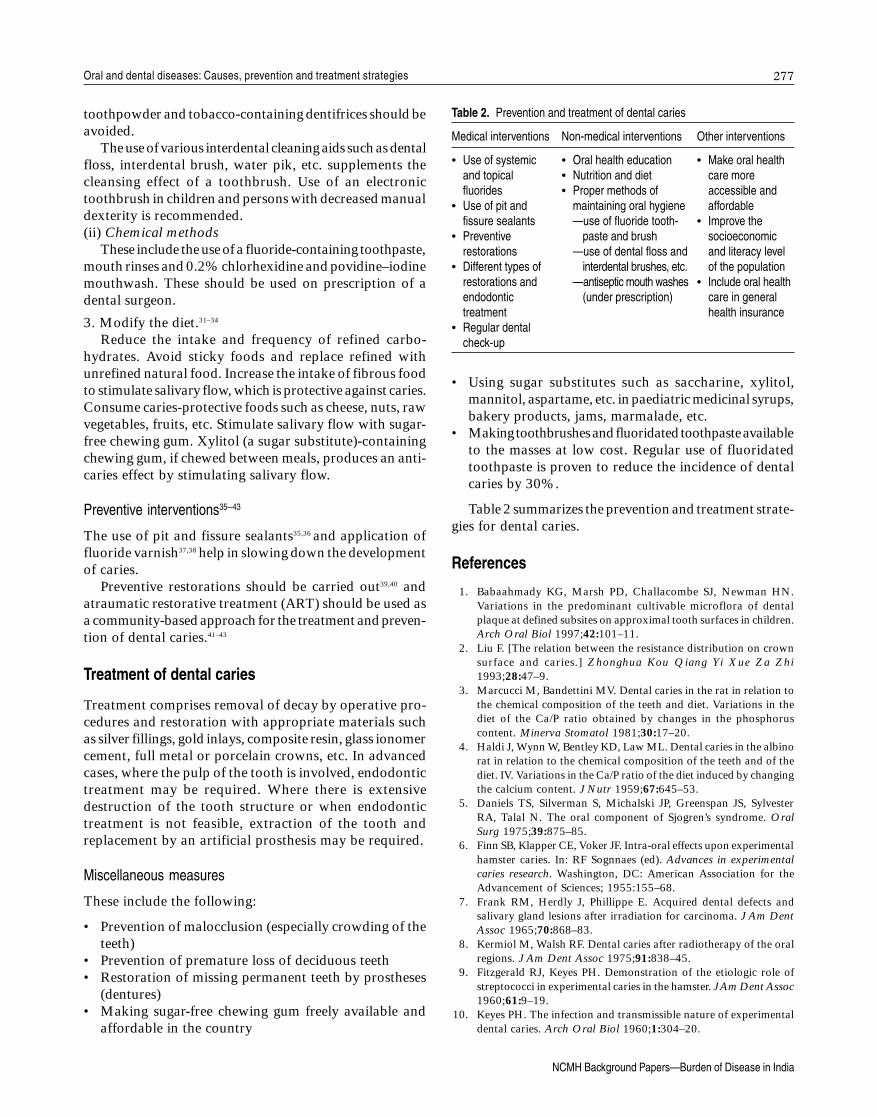
Table 2 summarizes the prevention and treatment strate-gies for dental caries.
References
1. Babaahmady KG, Marsh PD, Challacombe SJ, Newman HN.Variations in the predominant cultivable microflora of dentalplaque at defined subsites on approximal tooth surfaces in children.Arch Oral Biol 1997;42:101–11.
2. Liu F. [The relation between the resistance distribution on crownsurface and caries.] Zhonghua Kou Qiang Yi Xue Za Zhi1993;28:47–9.
3. Marcucci M, Bandettini MV. Dental caries in the rat in relation tothe chemical composition of the teeth and diet. Variations in thediet of the Ca/P ratio obtained by changes in the phosphoruscontent. Minerva Stomatol 1981;30:17–20.
4. Haldi J, Wynn W, Bentley KD, Law ML. Dental caries in the albinorat in relation to the chemical composition of the teeth and of thediet. IV. Variations in the Ca/P ratio of the diet induced by changingthe calcium content. J Nutr 1959;67:645–53.
5. Daniels TS, Silverman S, Michalski JP, Greenspan JS, SylvesterRA, Talal N. The oral component of Sjogren’s syndrome. OralSurg 1975;39:875–85.
6. Finn SB, Klapper CE, Voker JF. Intra-oral effects upon experimentalhamster caries. In: RF Sognnaes (ed). Advances in experimentalcaries research. Washington, DC: American Association for theAdvancement of Sciences; 1955:155–68.
7. Frank RM, Herdly J, Phillippe E. Acquired dental defects andsalivary gland lesions after irradiation for carcinoma. J Am DentAssoc 1965;70:868–83.
8. Kermiol M, Walsh RF. Dental caries after radiotherapy of the oralregions. J Am Dent Assoc 1975;91:838–45.
9. Fitzgerald RJ, Keyes PH. Demonstration of the etiologic role ofstreptococci in experimental caries in the hamster. J Am Dent Assoc1960;61:9–19.
10. Keyes PH. The infection and transmissible nature of experimentaldental caries. Arch Oral Biol 1960;1:304–20.
Table 2. Prevention and treatment of dental caries
Medical interventions Non-medical interventions Other interventions
• Use of systemic • Oral health education • Make oral healthand topical • Nutrition and diet care morefluorides • Proper methods of accessible and
• Use of pit and maintaining oral hygiene affordablefissure sealants ·use of fluoride tooth- • Improve the
• Preventive paste and brush socioeconomicrestorations ·use of dental floss and and literacy level
• Different types of interdental brushes, etc. of the populationrestorations and ·antiseptic mouth washes • Include oral healthendodontic (under prescription) care in generaltreatment health insurance
• Regular dentalcheck-up
���
NCMH Background Papers·Burden of Disease in India
Shah
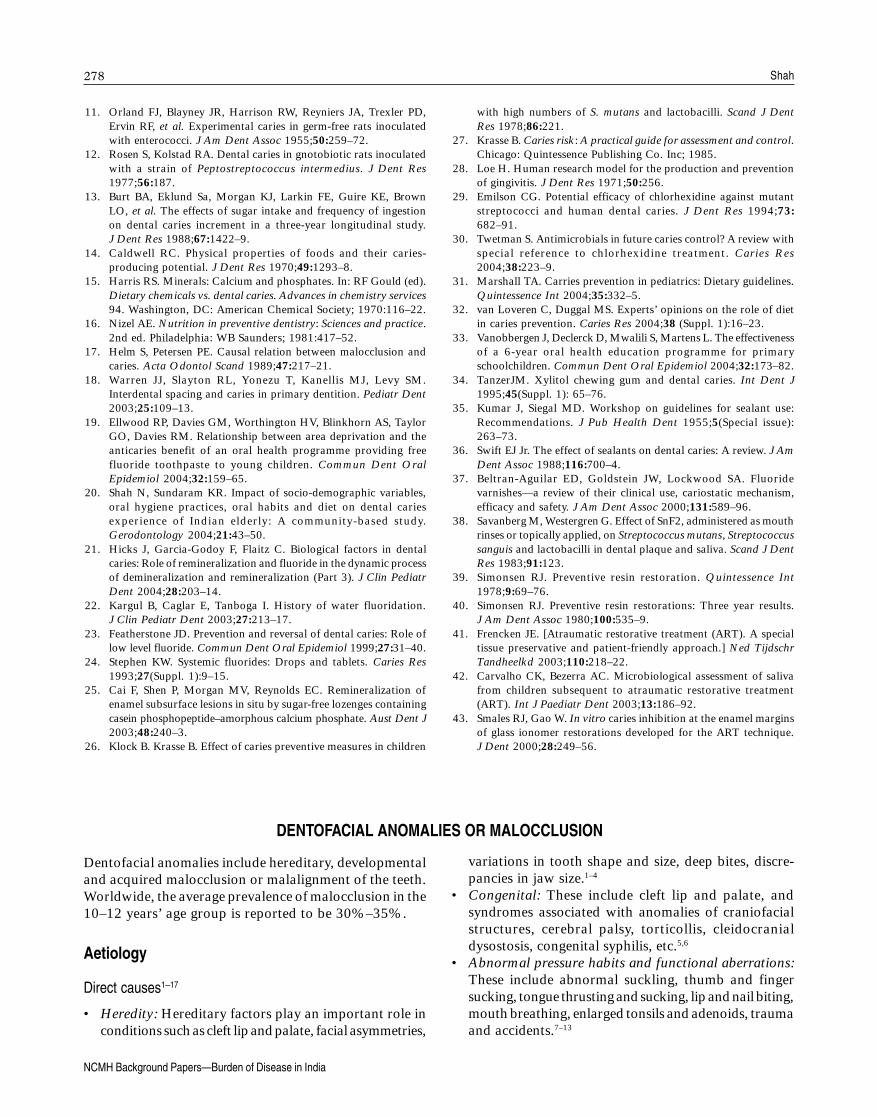
11. Orland FJ, Blayney JR, Harrison RW, Reyniers JA, Trexler PD,Ervin RF, et al. Experimental caries in germ-free rats inoculatedwith enterococci. J Am Dent Assoc 1955;50:259–72.
12. Rosen S, Kolstad RA. Dental caries in gnotobiotic rats inoculatedwith a strain of Peptostreptococcus intermedius. J Dent Res1977;56:187.
13. Burt BA, Eklund Sa, Morgan KJ, Larkin FE, Guire KE, BrownLO, et al. The effects of sugar intake and frequency of ingestionon dental caries increment in a three-year longitudinal study.J Dent Res 1988;67:1422–9.
14. Caldwell RC. Physical properties of foods and their caries-producing potential. J Dent Res 1970;49:1293–8.
15. Harris RS. Minerals: Calcium and phosphates. In: RF Gould (ed).Dietary chemicals vs. dental caries. Advances in chemistry services94. Washington, DC: American Chemical Society; 1970:116–22.
16. Nizel AE. Nutrition in preventive dentistry: Sciences and practice.2nd ed. Philadelphia: WB Saunders; 1981:417–52.
17. Helm S, Petersen PE. Causal relation between malocclusion andcaries. Acta Odontol Scand 1989;47:217–21.
18. Warren JJ, Slayton RL, Yonezu T, Kanellis MJ, Levy SM.Interdental spacing and caries in primary dentition. Pediatr Dent2003;25:109–13.
19. Ellwood RP, Davies GM, Worthington HV, Blinkhorn AS, TaylorGO, Davies RM. Relationship between area deprivation and theanticaries benefit of an oral health programme providing freefluoride toothpaste to young children. Commun Dent OralEpidemiol 2004;32:159–65.
20. Shah N, Sundaram KR. Impact of socio-demographic variables,oral hygiene practices, oral habits and diet on dental cariesexperience of Indian elderly: A community-based study.Gerodontology 2004;21:43–50.
21. Hicks J, Garcia-Godoy F, Flaitz C. Biological factors in dentalcaries: Role of remineralization and fluoride in the dynamic processof demineralization and remineralization (Part 3). J Clin PediatrDent 2004;28:203–14.
22. Kargul B, Caglar E, Tanboga I. History of water fluoridation.J Clin Pediatr Dent 2003;27:213–17.
23. Featherstone JD. Prevention and reversal of dental caries: Role oflow level fluoride. Commun Dent Oral Epidemiol 1999;27:31–40.
24. Stephen KW. Systemic fluorides: Drops and tablets. Caries Res1993;27(Suppl. 1):9–15.
25. Cai F, Shen P, Morgan MV, Reynolds EC. Remineralization ofenamel subsurface lesions in situ by sugar-free lozenges containingcasein phosphopeptide–amorphous calcium phosphate. Aust Dent J2003;48:240–3.
26. Klock B. Krasse B. Effect of caries preventive measures in children
with high numbers of S. mutans and lactobacilli. Scand J DentRes 1978;86:221.
27. Krasse B. Caries risk: A practical guide for assessment and control.Chicago: Quintessence Publishing Co. Inc; 1985.
28. Loe H. Human research model for the production and preventionof gingivitis. J Dent Res 1971;50:256.
29. Emilson CG. Potential efficacy of chlorhexidine against mutantstreptococci and human dental caries. J Dent Res 1994;73:682–91.
30. Twetman S. Antimicrobials in future caries control? A review withspecial reference to chlorhexidine treatment. Caries Res2004;38:223–9.
31. Marshall TA. Carries prevention in pediatrics: Dietary guidelines.Quintessence Int 2004;35:332–5.
32. van Loveren C, Duggal MS. Experts’ opinions on the role of dietin caries prevention. Caries Res 2004;38 (Suppl. 1):16–23.
33. Vanobbergen J, Declerck D, Mwalili S, Martens L. The effectivenessof a 6-year oral health education programme for primaryschoolchildren. Commun Dent Oral Epidemiol 2004;32:173–82.
34. TanzerJM. Xylitol chewing gum and dental caries. Int Dent J1995;45(Suppl. 1): 65–76.
35. Kumar J, Siegal MD. Workshop on guidelines for sealant use:Recommendations. J Pub Health Dent 1955;5(Special issue):263–73.
36. Swift EJ Jr. The effect of sealants on dental caries: A review. J AmDent Assoc 1988;116:700–4.
37. Beltran-Aguilar ED, Goldstein JW, Lockwood SA. Fluoridevarnishes—a review of their clinical use, cariostatic mechanism,efficacy and safety. J Am Dent Assoc 2000;131:589–96.
38. Savanberg M, Westergren G. Effect of SnF2, administered as mouthrinses or topically applied, on Streptococcus mutans, Streptococcussanguis and lactobacilli in dental plaque and saliva. Scand J DentRes 1983;91:123.
39. Simonsen RJ. Preventive resin restoration. Quintessence Int1978;9:69–76.
40. Simonsen RJ. Preventive resin restorations: Three year results.J Am Dent Assoc 1980;100:535–9.
41. Frencken JE. [Atraumatic restorative treatment (ART). A specialtissue preservative and patient-friendly approach.] Ned TijdschrTandheelkd 2003;110:218–22.
42. Carvalho CK, Bezerra AC. Microbiological assessment of salivafrom children subsequent to atraumatic restorative treatment(ART). Int J Paediatr Dent 2003;13:186–92.
43. Smales RJ, Gao W. In vitro caries inhibition at the enamel marginsof glass ionomer restorations developed for the ART technique.J Dent 2000;28:249–56.
Dentofacial anomalies include hereditary, developmentaland acquired malocclusion or malalignment of the teeth.Worldwide, the average prevalence of malocclusion in the10–12 years’ age group is reported to be 30%–35%.
Aetiology
Direct causes1–17
• Heredity: Hereditary factors play an important role inconditions such as cleft lip and palate, facial asymmetries,
variations in tooth shape and size, deep bites, discre-pancies in jaw size.1–4
• Congenital: These include cleft lip and palate, andsyndromes associated with anomalies of craniofacialstructures, cerebral palsy, torticollis, cleidocranialdysostosis, congenital syphilis, etc.5,6
• Abnormal pressure habits and functional aberrations:These include abnormal suckling, thumb and fingersucking, tongue thrusting and sucking, lip and nail biting,mouth breathing, enlarged tonsils and adenoids, traumaand accidents.7–13
DENTOFACIAL ANOMALIES OR MALOCCLUSION
���
NCMH Background Papers·Burden of Disease in India
Oral and dental diseases: Causes, prevention and treatment strategies
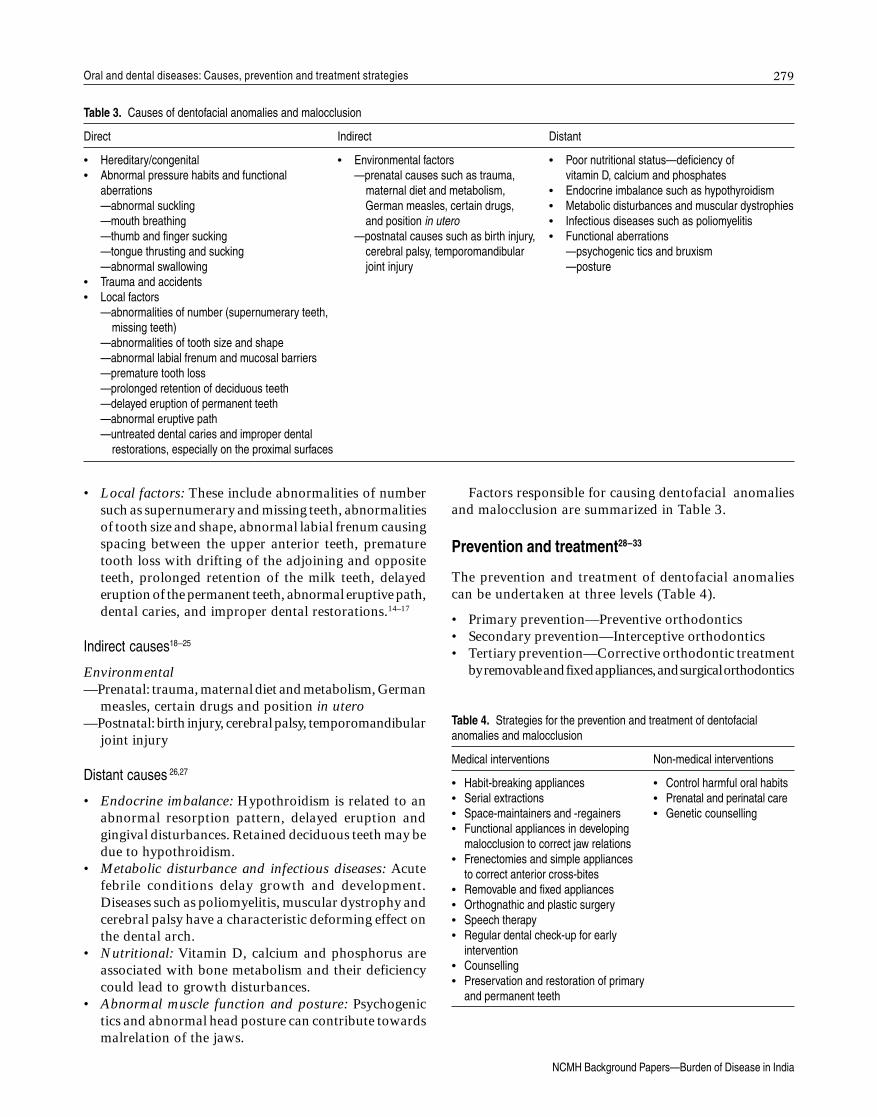
Factors responsible for causing dentofacial anomaliesand malocclusion are summarized in Table 3.
Prevention and treatment28–33
The prevention and treatment of dentofacial anomaliescan be undertaken at three levels (Table 4).
• Primary prevention—Preventive orthodontics• Secondary prevention—Interceptive orthodontics• Tertiary prevention—Corrective orthodontic treatment
by removable and fixed appliances, and surgical orthodontics
• Local factors: These include abnormalities of numbersuch as supernumerary and missing teeth, abnormalitiesof tooth size and shape, abnormal labial frenum causingspacing between the upper anterior teeth, prematuretooth loss with drifting of the adjoining and oppositeteeth, prolonged retention of the milk teeth, delayederuption of the permanent teeth, abnormal eruptive path,dental caries, and improper dental restorations.14–17
Indirect causes18–25
Environmental—Prenatal: trauma, maternal diet and metabolism, German
measles, certain drugs and position in utero—Postnatal: birth injury, cerebral palsy, temporomandibular
joint injury
Distant causes 26,27
• Endocrine imbalance: Hypothroidism is related to anabnormal resorption pattern, delayed eruption andgingival disturbances. Retained deciduous teeth may bedue to hypothroidism.
• Metabolic disturbance and infectious diseases: Acutefebrile conditions delay growth and development.Diseases such as poliomyelitis, muscular dystrophy andcerebral palsy have a characteristic deforming effect onthe dental arch.
• Nutritional: Vitamin D, calcium and phosphorus areassociated with bone metabolism and their deficiencycould lead to growth disturbances.
• Abnormal muscle function and posture: Psychogenictics and abnormal head posture can contribute towardsmalrelation of the jaws.
Table 3. Causes of dentofacial anomalies and malocclusion
Direct Indirect Distant
• Hereditary/congenital • Environmental factors • Poor nutritional status·deficiency of• Abnormal pressure habits and functional ·prenatal causes such as trauma, vitamin D, calcium and phosphates
aberrations maternal diet and metabolism, • Endocrine imbalance such as hypothyroidism·abnormal suckling German measles, certain drugs, • Metabolic disturbances and muscular dystrophies·mouth breathing and position in utero • Infectious diseases such as poliomyelitis·thumb and finger sucking ·postnatal causes such as birth injury, • Functional aberrations·tongue thrusting and sucking cerebral palsy, temporomandibular ·psychogenic tics and bruxism·abnormal swallowing joint injury ·posture
• Trauma and accidents• Local factors
·abnormalities of number (supernumerary teeth,missing teeth)
·abnormalities of tooth size and shape·abnormal labial frenum and mucosal barriers·premature tooth loss·prolonged retention of deciduous teeth·delayed eruption of permanent teeth·abnormal eruptive path·untreated dental caries and improper dental
restorations, especially on the proximal surfaces
Table 4. Strategies for the prevention and treatment of dentofacialanomalies and malocclusion
Medical interventions Non-medical interventions
• Habit-breaking appliances • Control harmful oral habits• Serial extractions • Prenatal and perinatal care• Space-maintainers and -regainers • Genetic counselling• Functional appliances in developing
malocclusion to correct jaw relations• Frenectomies and simple appliances
to correct anterior cross-bites• Removable and fixed appliances• Orthognathic and plastic surgery• Speech therapy• Regular dental check-up for early
intervention• Counselling• Preservation and restoration of primary
and permanent teeth
���
NCMH Background Papers·Burden of Disease in India
Shah
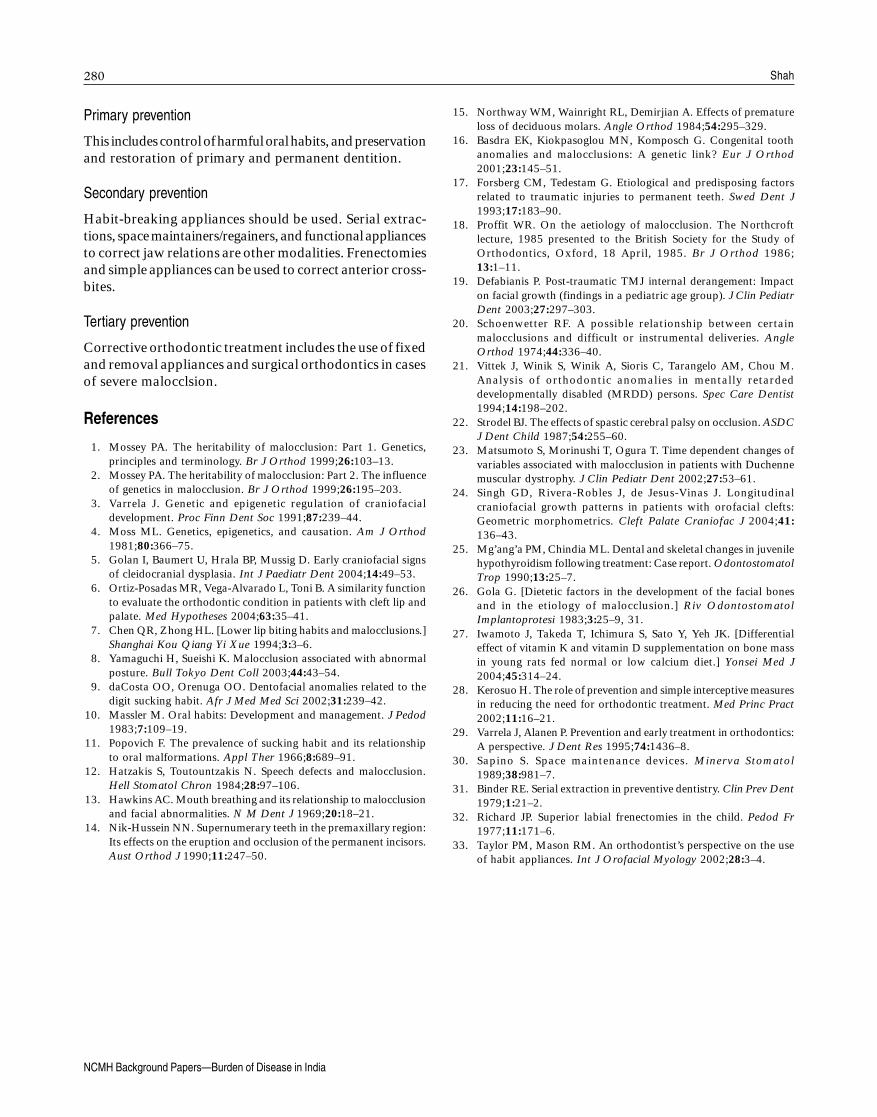
Primary prevention
This includes control of harmful oral habits, and preservationand restoration of primary and permanent dentition.
Secondary prevention
Habit-breaking appliances should be used. Serial extrac-tions, space maintainers/regainers, and functional appliancesto correct jaw relations are other modalities. Frenectomiesand simple appliances can be used to correct anterior cross-bites.
Tertiary prevention
Corrective orthodontic treatment includes the use of fixedand removal appliances and surgical orthodontics in casesof severe malocclsion.
References
1. Mossey PA. The heritability of malocclusion: Part 1. Genetics,principles and terminology. Br J Orthod 1999;26:103–13.
2. Mossey PA. The heritability of malocclusion: Part 2. The influenceof genetics in malocclusion. Br J Orthod 1999;26:195–203.
3. Varrela J. Genetic and epigenetic regulation of craniofacialdevelopment. Proc Finn Dent Soc 1991;87:239–44.
4. Moss ML. Genetics, epigenetics, and causation. Am J Orthod1981;80:366–75.
5. Golan I, Baumert U, Hrala BP, Mussig D. Early craniofacial signsof cleidocranial dysplasia. Int J Paediatr Dent 2004;14:49–53.
6. Ortiz-Posadas MR, Vega-Alvarado L, Toni B. A similarity functionto evaluate the orthodontic condition in patients with cleft lip andpalate. Med Hypotheses 2004;63:35–41.
7. Chen QR, Zhong HL. [Lower lip biting habits and malocclusions.]Shanghai Kou Qiang Yi Xue 1994;3:3–6.
8. Yamaguchi H, Sueishi K. Malocclusion associated with abnormalposture. Bull Tokyo Dent Coll 2003;44:43–54.
9. daCosta OO, Orenuga OO. Dentofacial anomalies related to thedigit sucking habit. Afr J Med Med Sci 2002;31:239–42.
10. Massler M. Oral habits: Development and management. J Pedod1983;7:109–19.
11. Popovich F. The prevalence of sucking habit and its relationshipto oral malformations. Appl Ther 1966;8:689–91.
12. Hatzakis S, Toutountzakis N. Speech defects and malocclusion.Hell Stomatol Chron 1984;28:97–106.
13. Hawkins AC. Mouth breathing and its relationship to malocclusionand facial abnormalities. N M Dent J 1969;20:18–21.
14. Nik-Hussein NN. Supernumerary teeth in the premaxillary region:Its effects on the eruption and occlusion of the permanent incisors.Aust Orthod J 1990;11:247–50.
15. Northway WM, Wainright RL, Demirjian A. Effects of prematureloss of deciduous molars. Angle Orthod 1984;54:295–329.
16. Basdra EK, Kiokpasoglou MN, Komposch G. Congenital toothanomalies and malocclusions: A genetic link? Eur J Orthod2001;23:145–51.
17. Forsberg CM, Tedestam G. Etiological and predisposing factorsrelated to traumatic injuries to permanent teeth. Swed Dent J1993;17:183–90.
18. Proffit WR. On the aetiology of malocclusion. The Northcroftlecture, 1985 presented to the British Society for the Study ofOrthodontics, Oxford, 18 April, 1985. Br J Orthod 1986;13:1–11.
19. Defabianis P. Post-traumatic TMJ internal derangement: Impacton facial growth (findings in a pediatric age group). J Clin PediatrDent 2003;27:297–303.
20. Schoenwetter RF. A possible relationship between certainmalocclusions and difficult or instrumental deliveries. AngleOrthod 1974;44:336–40.
21. Vittek J, Winik S, Winik A, Sioris C, Tarangelo AM, Chou M.Analysis of orthodontic anomalies in mentally retardeddevelopmentally disabled (MRDD) persons. Spec Care Dentist1994;14:198–202.
22. Strodel BJ. The effects of spastic cerebral palsy on occlusion. ASDCJ Dent Child 1987;54:255–60.
23. Matsumoto S, Morinushi T, Ogura T. Time dependent changes ofvariables associated with malocclusion in patients with Duchennemuscular dystrophy. J Clin Pediatr Dent 2002;27:53–61.
24. Singh GD, Rivera-Robles J, de Jesus-Vinas J. Longitudinalcraniofacial growth patterns in patients with orofacial clefts:Geometric morphometrics. Cleft Palate Craniofac J 2004;41:136–43.
25. Mg’ang’a PM, Chindia ML. Dental and skeletal changes in juvenilehypothyroidism following treatment: Case report. OdontostomatolTrop 1990;13:25–7.
26. Gola G. [Dietetic factors in the development of the facial bonesand in the etiology of malocclusion.] Riv OdontostomatolImplantoprotesi 1983;3:25–9, 31.
27. Iwamoto J, Takeda T, Ichimura S, Sato Y, Yeh JK. [Differentialeffect of vitamin K and vitamin D supplementation on bone massin young rats fed normal or low calcium diet.] Yonsei Med J2004;45:314–24.
28. Kerosuo H. The role of prevention and simple interceptive measuresin reducing the need for orthodontic treatment. Med Princ Pract2002;11:16–21.
29. Varrela J, Alanen P. Prevention and early treatment in orthodontics:A perspective. J Dent Res 1995;74:1436–8.
30. Sapino S. Space maintenance devices. Minerva Stomatol1989;38:981–7.
31. Binder RE. Serial extraction in preventive dentistry. Clin Prev Dent1979;1:21–2.
32. Richard JP. Superior labial frenectomies in the child. Pedod Fr1977;11:171–6.
33. Taylor PM, Mason RM. An orthodontist’s perspective on the useof habit appliances. Int J Orofacial Myology 2002;28:3–4.
���
NCMH Background Papers·Burden of Disease in India
Oral and dental diseases: Causes, prevention and treatment strategies
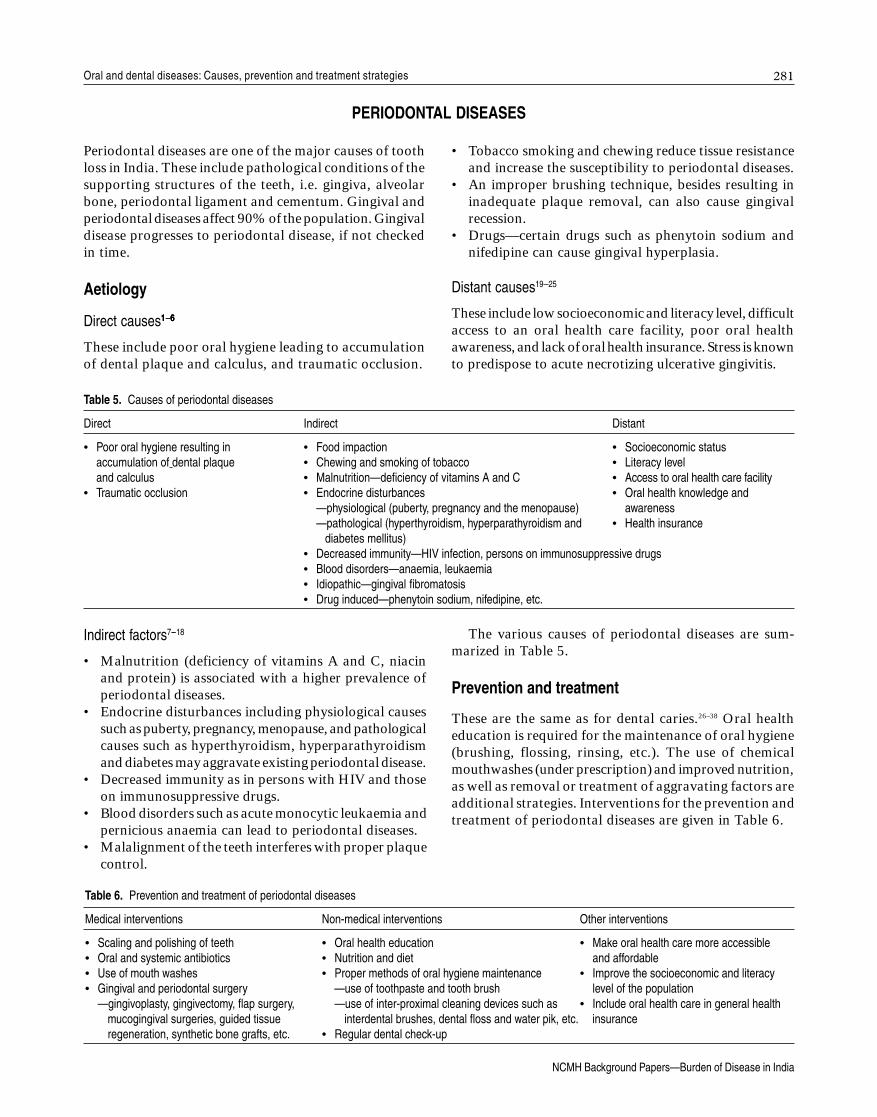
Periodontal diseases are one of the major causes of toothloss in India. These include pathological conditions of thesupporting structures of the teeth, i.e. gingiva, alveolarbone, periodontal ligament and cementum. Gingival andperiodontal diseases affect 90% of the population. Gingivaldisease progresses to periodontal disease, if not checkedin time.
Aetiology
Direct causes11111–66666
These include poor oral hygiene leading to accumulationof dental plaque and calculus, and traumatic occlusion.
PERIODONTAL DISEASES
Table 5. Causes of periodontal diseases
Direct Indirect Distant
• Poor oral hygiene resulting in • Food impaction • Socioeconomic statusaccumulation of dental plaque • Chewing and smoking of tobacco • Literacy leveland calculus • Malnutrition·deficiency of vitamins A and C • Access to oral health care facility
• Traumatic occlusion • Endocrine disturbances • Oral health knowledge and·physiological (puberty, pregnancy and the menopause) awareness·pathological (hyperthyroidism, hyperparathyroidism and • Health insurance diabetes mellitus)
• Decreased immunity·HIV infection, persons on immunosuppressive drugs• Blood disorders·anaemia, leukaemia• Idiopathic·gingival fibromatosis• Drug induced·phenytoin sodium, nifedipine, etc.
Table 6. Prevention and treatment of periodontal diseases
Medical interventions Non-medical interventions Other interventions
• Scaling and polishing of teeth • Oral health education • Make oral health care more accessible• Oral and systemic antibiotics • Nutrition and diet and affordable• Use of mouth washes • Proper methods of oral hygiene maintenance • Improve the socioeconomic and literacy• Gingival and periodontal surgery ·use of toothpaste and tooth brush level of the population
·gingivoplasty, gingivectomy, flap surgery, ·use of inter-proximal cleaning devices such as • Include oral health care in general healthmucogingival surgeries, guided tissue interdental brushes, dental floss and water pik, etc. insuranceregeneration, synthetic bone grafts, etc. • Regular dental check-up
Indirect factors7–18
• Malnutrition (deficiency of vitamins A and C, niacinand protein) is associated with a higher prevalence ofperiodontal diseases.
• Endocrine disturbances including physiological causessuch as puberty, pregnancy, menopause, and pathologicalcauses such as hyperthyroidism, hyperparathyroidismand diabetes may aggravate existing periodontal disease.
• Decreased immunity as in persons with HIV and thoseon immunosuppressive drugs.
• Blood disorders such as acute monocytic leukaemia andpernicious anaemia can lead to periodontal diseases.
• Malalignment of the teeth interferes with proper plaquecontrol.
• Tobacco smoking and chewing reduce tissue resistanceand increase the susceptibility to periodontal diseases.
• An improper brushing technique, besides resulting ininadequate plaque removal, can also cause gingivalrecession.
• Drugs—certain drugs such as phenytoin sodium andnifedipine can cause gingival hyperplasia.
Distant causes19–25
These include low socioeconomic and literacy level, difficultaccess to an oral health care facility, poor oral healthawareness, and lack of oral health insurance. Stress is knownto predispose to acute necrotizing ulcerative gingivitis.
The various causes of periodontal diseases are sum-marized in Table 5.
Prevention and treatment
These are the same as for dental caries.26–38 Oral healtheducation is required for the maintenance of oral hygiene(brushing, flossing, rinsing, etc.). The use of chemicalmouthwashes (under prescription) and improved nutrition,as well as removal or treatment of aggravating factors areadditional strategies. Interventions for the prevention andtreatment of periodontal diseases are given in Table 6.
���
NCMH Background Papers·Burden of Disease in India
Shah
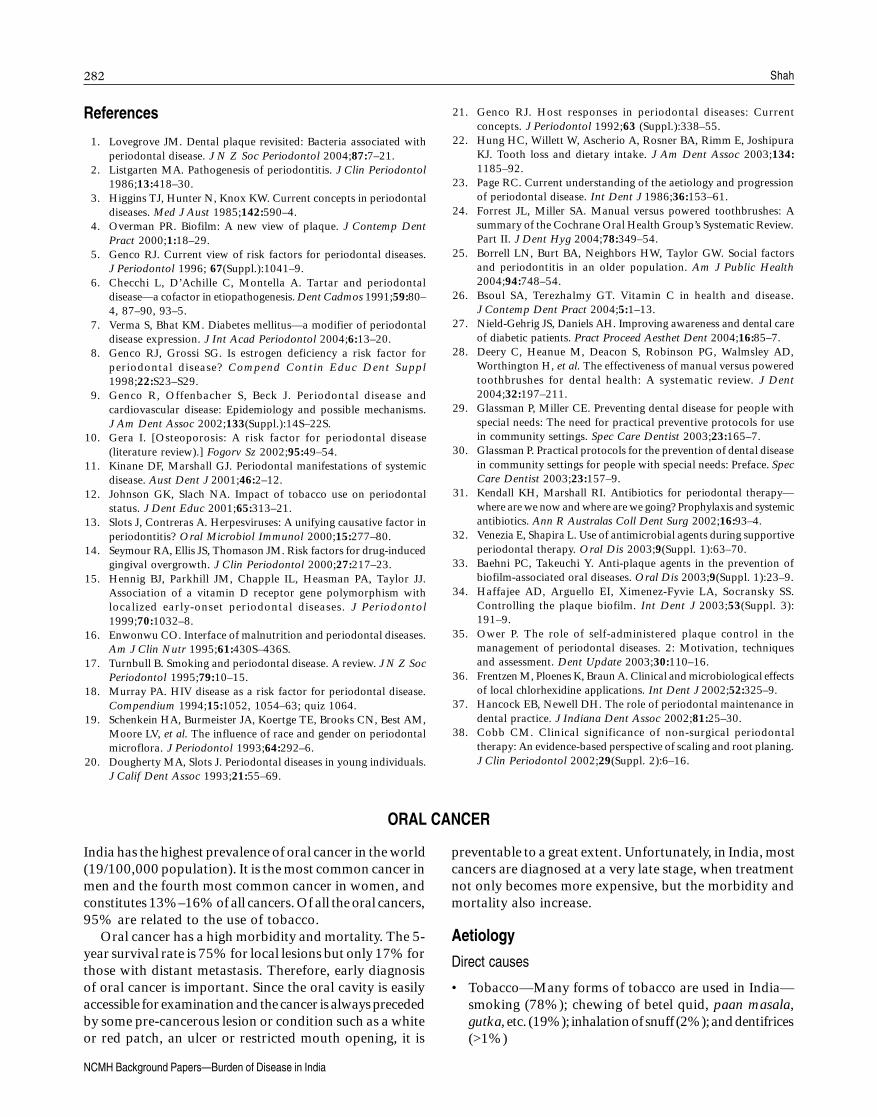
References
1. Lovegrove JM. Dental plaque revisited: Bacteria associated withperiodontal disease. J N Z Soc Periodontol 2004;87:7–21.
2. Listgarten MA. Pathogenesis of periodontitis. J Clin Periodontol1986;13:418–30.
3. Higgins TJ, Hunter N, Knox KW. Current concepts in periodontaldiseases. Med J Aust 1985;142:590–4.
4. Overman PR. Biofilm: A new view of plaque. J Contemp DentPract 2000;1:18–29.
5. Genco RJ. Current view of risk factors for periodontal diseases.J Periodontol 1996; 67(Suppl.):1041–9.
6. Checchi L, D’Achille C, Montella A. Tartar and periodontaldisease—a cofactor in etiopathogenesis. Dent Cadmos 1991;59:80–4, 87–90, 93–5.
7. Verma S, Bhat KM. Diabetes mellitus—a modifier of periodontaldisease expression. J Int Acad Periodontol 2004;6:13–20.
8. Genco RJ, Grossi SG. Is estrogen deficiency a risk factor forperiodontal disease? Compend Contin Educ Dent Suppl1998;22:S23–S29.
9. Genco R, Offenbacher S, Beck J. Periodontal disease andcardiovascular disease: Epidemiology and possible mechanisms.J Am Dent Assoc 2002;133(Suppl.):14S–22S.
10. Gera I. [Osteoporosis: A risk factor for periodontal disease(literature review).] Fogorv Sz 2002;95:49–54.
11. Kinane DF, Marshall GJ. Periodontal manifestations of systemicdisease. Aust Dent J 2001;46:2–12.
12. Johnson GK, Slach NA. Impact of tobacco use on periodontalstatus. J Dent Educ 2001;65:313–21.
13. Slots J, Contreras A. Herpesviruses: A unifying causative factor inperiodontitis? Oral Microbiol Immunol 2000;15:277–80.
14. Seymour RA, Ellis JS, Thomason JM. Risk factors for drug-inducedgingival overgrowth. J Clin Periodontol 2000;27:217–23.
15. Hennig BJ, Parkhill JM, Chapple IL, Heasman PA, Taylor JJ.Association of a vitamin D receptor gene polymorphism withlocalized early-onset periodontal diseases. J Periodontol1999;70:1032–8.
16. Enwonwu CO. Interface of malnutrition and periodontal diseases.Am J Clin Nutr 1995;61:430S–436S.
17. Turnbull B. Smoking and periodontal disease. A review. J N Z SocPeriodontol 1995;79:10–15.
18. Murray PA. HIV disease as a risk factor for periodontal disease.Compendium 1994;15:1052, 1054–63; quiz 1064.
19. Schenkein HA, Burmeister JA, Koertge TE, Brooks CN, Best AM,Moore LV, et al. The influence of race and gender on periodontalmicroflora. J Periodontol 1993;64:292–6.
20. Dougherty MA, Slots J. Periodontal diseases in young individuals.J Calif Dent Assoc 1993;21:55–69.
21. Genco RJ. Host responses in periodontal diseases: Currentconcepts. J Periodontol 1992;63 (Suppl.):338–55.
22. Hung HC, Willett W, Ascherio A, Rosner BA, Rimm E, JoshipuraKJ. Tooth loss and dietary intake. J Am Dent Assoc 2003;134:1185–92.
23. Page RC. Current understanding of the aetiology and progressionof periodontal disease. Int Dent J 1986;36:153–61.
24. Forrest JL, Miller SA. Manual versus powered toothbrushes: Asummary of the Cochrane Oral Health Group’s Systematic Review.Part II. J Dent Hyg 2004;78:349–54.
25. Borrell LN, Burt BA, Neighbors HW, Taylor GW. Social factorsand periodontitis in an older population. Am J Public Health2004;94:748–54.
26. Bsoul SA, Terezhalmy GT. Vitamin C in health and disease.J Contemp Dent Pract 2004;5:1–13.
27. Nield-Gehrig JS, Daniels AH. Improving awareness and dental careof diabetic patients. Pract Proceed Aesthet Dent 2004;16:85–7.
28. Deery C, Heanue M, Deacon S, Robinson PG, Walmsley AD,Worthington H, et al. The effectiveness of manual versus poweredtoothbrushes for dental health: A systematic review. J Dent2004;32:197–211.
29. Glassman P, Miller CE. Preventing dental disease for people withspecial needs: The need for practical preventive protocols for usein community settings. Spec Care Dentist 2003;23:165–7.
30. Glassman P. Practical protocols for the prevention of dental diseasein community settings for people with special needs: Preface. SpecCare Dentist 2003;23:157–9.
31. Kendall KH, Marshall RI. Antibiotics for periodontal therapy—where are we now and where are we going? Prophylaxis and systemicantibiotics. Ann R Australas Coll Dent Surg 2002;16:93–4.
32. Venezia E, Shapira L. Use of antimicrobial agents during supportiveperiodontal therapy. Oral Dis 2003;9(Suppl. 1):63–70.
33. Baehni PC, Takeuchi Y. Anti-plaque agents in the prevention ofbiofilm-associated oral diseases. Oral Dis 2003;9(Suppl. 1):23–9.
34. Haffajee AD, Arguello EI, Ximenez-Fyvie LA, Socransky SS.Controlling the plaque biofilm. Int Dent J 2003;53(Suppl. 3):191–9.
35. Ower P. The role of self-administered plaque control in themanagement of periodontal diseases. 2: Motivation, techniquesand assessment. Dent Update 2003;30:110–16.
36. Frentzen M, Ploenes K, Braun A. Clinical and microbiological effectsof local chlorhexidine applications. Int Dent J 2002;52:325–9.
37. Hancock EB, Newell DH. The role of periodontal maintenance indental practice. J Indiana Dent Assoc 2002;81:25–30.
38. Cobb CM. Clinical significance of non-surgical periodontaltherapy: An evidence-based perspective of scaling and root planing.J Clin Periodontol 2002;29(Suppl. 2):6–16.
India has the highest prevalence of oral cancer in the world(19/100,000 population). It is the most common cancer inmen and the fourth most common cancer in women, andconstitutes 13%–16% of all cancers. Of all the oral cancers,95% are related to the use of tobacco.
Oral cancer has a high morbidity and mortality. The 5-year survival rate is 75% for local lesions but only 17% forthose with distant metastasis. Therefore, early diagnosisof oral cancer is important. Since the oral cavity is easilyaccessible for examination and the cancer is always precededby some pre-cancerous lesion or condition such as a whiteor red patch, an ulcer or restricted mouth opening, it is
preventable to a great extent. Unfortunately, in India, mostcancers are diagnosed at a very late stage, when treatmentnot only becomes more expensive, but the morbidity andmortality also increase.
Aetiology
Direct causes
• Tobacco—Many forms of tobacco are used in India—smoking (78%); chewing of betel quid, paan masala,gutka,etc. (19%); inhalation of snuff (2%); and dentifrices(>1%)
ORAL CANCER
��
NCMH Background Papers·Burden of Disease in India
Oral and dental diseases: Causes, prevention and treatment strategies
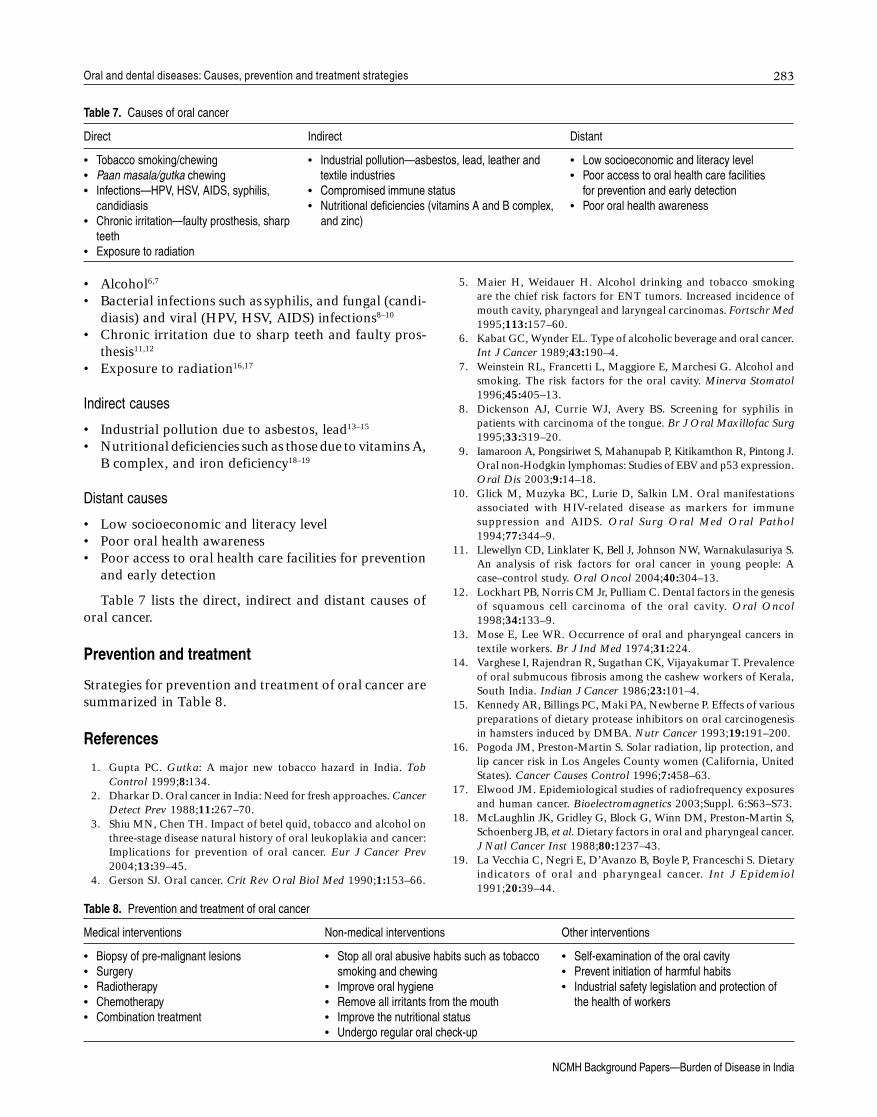
Table 7. Causes of oral cancer
Direct Indirect Distant
• Tobacco smoking/chewing • Industrial pollution·asbestos, lead, leather and • Low socioeconomic and literacy level• Paan masala/gutka chewing textile industries • Poor access to oral health care facilities• Infections·HPV, HSV, AIDS, syphilis, • Compromised immune status for prevention and early detection
candidiasis • Nutritional deficiencies (vitamins A and B complex, • Poor oral health awareness• Chronic irritation·faulty prosthesis, sharp and zinc)
teeth• Exposure to radiation
Table 8. Prevention and treatment of oral cancer
Medical interventions Non-medical interventions Other interventions
• Biopsy of pre-malignant lesions • Stop all oral abusive habits such as tobacco • Self-examination of the oral cavity• Surgery smoking and chewing • Prevent initiation of harmful habits• Radiotherapy • Improve oral hygiene • Industrial safety legislation and protection of• Chemotherapy • Remove all irritants from the mouth the health of workers• Combination treatment • Improve the nutritional status
• Undergo regular oral check-up
• Alcohol6,7
• Bacterial infections such as syphilis, and fungal (candi-diasis) and viral (HPV, HSV, AIDS) infections8–10
• Chronic irritation due to sharp teeth and faulty pros-thesis11,12
• Exposure to radiation16,17
Indirect causes
• Industrial pollution due to asbestos, lead13–15
• Nutritional deficiencies such as those due to vitamins A,B complex, and iron deficiency18–19
Distant causes
• Low socioeconomic and literacy level• Poor oral health awareness• Poor access to oral health care facilities for prevention
and early detection
Table 7 lists the direct, indirect and distant causes oforal cancer.
Prevention and treatment
Strategies for prevention and treatment of oral cancer aresummarized in Table 8.
References
1. Gupta PC. Gutka: A major new tobacco hazard in India. TobControl 1999;8:134.
2. Dharkar D. Oral cancer in India: Need for fresh approaches. CancerDetect Prev 1988;11:267–70.
3. Shiu MN, Chen TH. Impact of betel quid, tobacco and alcohol onthree-stage disease natural history of oral leukoplakia and cancer:Implications for prevention of oral cancer. Eur J Cancer Prev2004;13:39–45.
4. Gerson SJ. Oral cancer. Crit Rev Oral Biol Med 1990;1:153–66.
5. Maier H, Weidauer H. Alcohol drinking and tobacco smokingare the chief risk factors for ENT tumors. Increased incidence ofmouth cavity, pharyngeal and laryngeal carcinomas. Fortschr Med1995;113:157–60.
6. Kabat GC, Wynder EL. Type of alcoholic beverage and oral cancer.Int J Cancer 1989;43:190–4.
7. Weinstein RL, Francetti L, Maggiore E, Marchesi G. Alcohol andsmoking. The risk factors for the oral cavity. Minerva Stomatol1996;45:405–13.
8. Dickenson AJ, Currie WJ, Avery BS. Screening for syphilis inpatients with carcinoma of the tongue. Br J Oral Maxillofac Surg1995;33:319–20.
9. Iamaroon A, Pongsiriwet S, Mahanupab P, Kitikamthon R, Pintong J.Oral non-Hodgkin lymphomas: Studies of EBV and p53 expression.Oral Dis 2003;9:14–18.
10. Glick M, Muzyka BC, Lurie D, Salkin LM. Oral manifestationsassociated with HIV-related disease as markers for immunesuppression and AIDS. Oral Surg Oral Med Oral Pathol1994;77:344–9.
11. Llewellyn CD, Linklater K, Bell J, Johnson NW, Warnakulasuriya S.An analysis of risk factors for oral cancer in young people: Acase–control study. Oral Oncol 2004;40:304–13.
12. Lockhart PB, Norris CM Jr, Pulliam C. Dental factors in the genesisof squamous cell carcinoma of the oral cavity. Oral Oncol1998;34:133–9.
13. Mose E, Lee WR. Occurrence of oral and pharyngeal cancers intextile workers. Br J Ind Med 1974;31:224.
14. Varghese I, Rajendran R, Sugathan CK, Vijayakumar T. Prevalenceof oral submucous fibrosis among the cashew workers of Kerala,South India. Indian J Cancer 1986;23:101–4.
15. Kennedy AR, Billings PC, Maki PA, Newberne P. Effects of variouspreparations of dietary protease inhibitors on oral carcinogenesisin hamsters induced by DMBA. Nutr Cancer 1993;19:191–200.
16. Pogoda JM, Preston-Martin S. Solar radiation, lip protection, andlip cancer risk in Los Angeles County women (California, UnitedStates). Cancer Causes Control 1996;7:458–63.
17. Elwood JM. Epidemiological studies of radiofrequency exposuresand human cancer. Bioelectromagnetics 2003;Suppl. 6:S63–S73.
18. McLaughlin JK, Gridley G, Block G, Winn DM, Preston-Martin S,Schoenberg JB, et al. Dietary factors in oral and pharyngeal cancer.J Natl Cancer Inst 1988;80:1237–43.
19. La Vecchia C, Negri E, D’Avanzo B, Boyle P, Franceschi S. Dietaryindicators of oral and pharyngeal cancer. Int J Epidemiol1991;20:39–44.
��
NCMH Background Papers·Burden of Disease in India
Shah
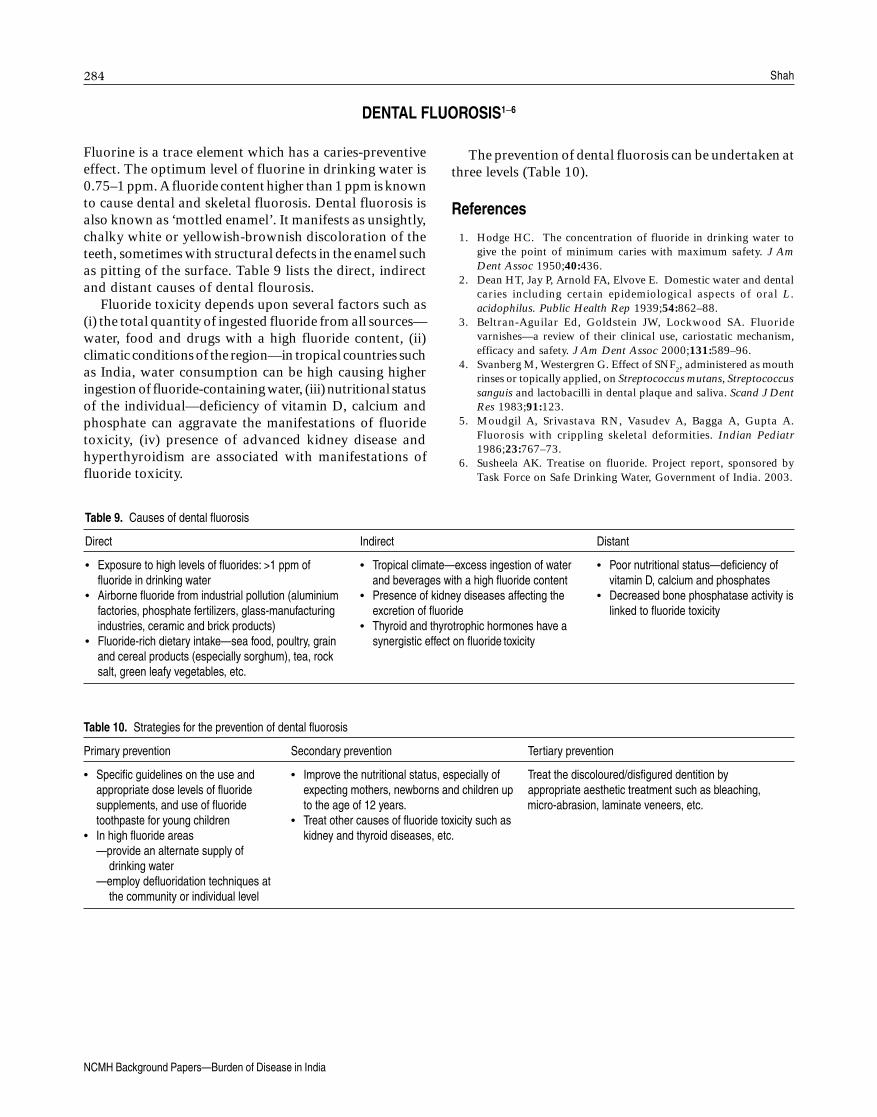
Table 9. Causes of dental fluorosis
Direct Indirect Distant
• Exposure to high levels of fluorides: >1 ppm of • Tropical climate·excess ingestion of water • Poor nutritional status·deficiency offluoride in drinking water and beverages with a high fluoride content vitamin D, calcium and phosphates
• Airborne fluoride from industrial pollution (aluminium • Presence of kidney diseases affecting the • Decreased bone phosphatase activity isfactories, phosphate fertilizers, glass-manufacturing excretion of fluoride linked to fluoride toxicityindustries, ceramic and brick products) • Thyroid and thyrotrophic hormones have a
• Fluoride-rich dietary intake·sea food, poultry, grain synergistic effect on fluoride toxicityand cereal products (especially sorghum), tea, rocksalt, green leafy vegetables, etc.
Table 10. Strategies for the prevention of dental fluorosis
Primary prevention Secondary prevention Tertiary prevention
• Specific guidelines on the use and • Improve the nutritional status, especially of Treat the discoloured/disfigured dentition byappropriate dose levels of fluoride expecting mothers, newborns and children up appropriate aesthetic treatment such as bleaching,supplements, and use of fluoride to the age of 12 years. micro-abrasion, laminate veneers, etc.toothpaste for young children • Treat other causes of fluoride toxicity such as
• In high fluoride areas kidney and thyroid diseases, etc.·provide an alternate supply of
drinking water·employ defluoridation techniques at
the community or individual level
DENTAL FLUOROSIS1–6
Fluorine is a trace element which has a caries-preventiveeffect. The optimum level of fluorine in drinking water is0.75–1 ppm. A fluoride content higher than 1 ppm is knownto cause dental and skeletal fluorosis. Dental fluorosis isalso known as ‘mottled enamel’. It manifests as unsightly,chalky white or yellowish-brownish discoloration of theteeth, sometimes with structural defects in the enamel suchas pitting of the surface. Table 9 lists the direct, indirectand distant causes of dental flourosis.
Fluoride toxicity depends upon several factors such as(i) the total quantity of ingested fluoride from all sources—water, food and drugs with a high fluoride content, (ii)climatic conditions of the region—in tropical countries suchas India, water consumption can be high causing higheringestion of fluoride-containing water, (iii) nutritional statusof the individual—deficiency of vitamin D, calcium andphosphate can aggravate the manifestations of fluoridetoxicity, (iv) presence of advanced kidney disease andhyperthyroidism are associated with manifestations offluoride toxicity.
The prevention of dental fluorosis can be undertaken atthree levels (Table 10).
References
1. Hodge HC. The concentration of fluoride in drinking water togive the point of minimum caries with maximum safety. J AmDent Assoc 1950;40:436.
2. Dean HT, Jay P, Arnold FA, Elvove E. Domestic water and dentalcaries including certain epidemiological aspects of oral L.acidophilus. Public Health Rep 1939;54:862–88.
3. Beltran-Aguilar Ed, Goldstein JW, Lockwood SA. Fluoridevarnishes—a review of their clinical use, cariostatic mechanism,efficacy and safety. J Am Dent Assoc 2000;131:589–96.
4. Svanberg M, Westergren G. Effect of SNF2, administered as mouthrinses or topically applied, on Streptococcus mutans, Streptococcussanguis and lactobacilli in dental plaque and saliva. Scand J DentRes 1983;91:123.
5. Moudgil A, Srivastava RN, Vasudev A, Bagga A, Gupta A.Fluorosis with crippling skeletal deformities. Indian Pediatr1986;23:767–73.
6. Susheela AK. Treatise on fluoride. Project report, sponsored byTask Force on Safe Drinking Water, Government of India. 2003.
���
NCMH Background Papers·Burden of Disease in India
Oral and dental diseases: Causes, prevention and treatment strategies
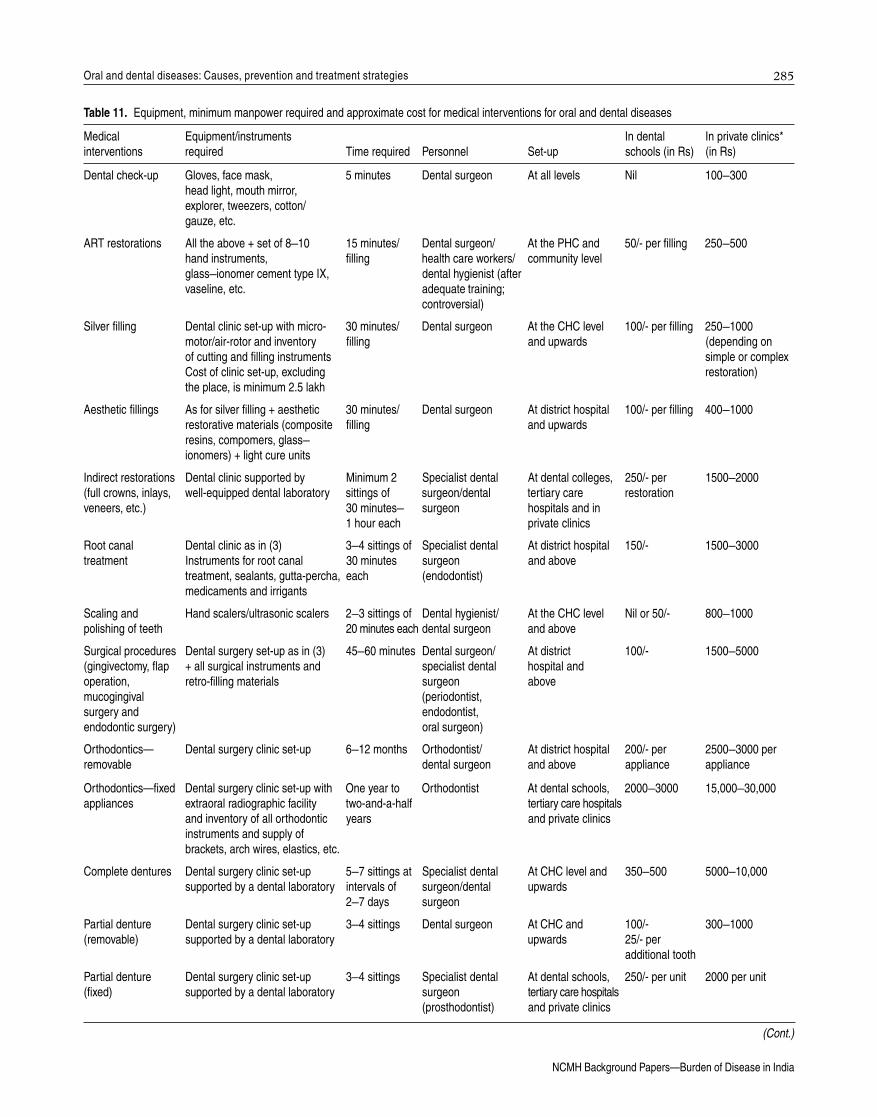
Table 11. Equipment, minimum manpower required and approximate cost for medical interventions for oral and dental diseases
Medical Equipment/instruments In dental In private clinics*interventions required Time required Personnel Set-up schools (in Rs) (in Rs)
Dental check-up Gloves, face mask, 5 minutes Dental surgeon At all levels Nil 100–300head light, mouth mirror,explorer, tweezers, cotton/gauze, etc.
ART restorations All the above + set of 8–10 15 minutes/ Dental surgeon/ At the PHC and 50/- per filling 250–500hand instruments, filling health care workers/ community levelglass–ionomer cement type IX, dental hygienist (aftervaseline, etc. adequate training;
controversial)
Silver filling Dental clinic set-up with micro- 30 minutes/ Dental surgeon At the CHC level 100/- per filling 250–1000motor/air-rotor and inventory filling and upwards (depending onof cutting and filling instruments simple or complexCost of clinic set-up, excluding restoration)the place, is minimum 2.5 lakh
Aesthetic fillings As for silver filling + aesthetic 30 minutes/ Dental surgeon At district hospital 100/- per filling 400–1000restorative materials (composite filling and upwardsresins, compomers, glass–ionomers) + light cure units
Indirect restorations Dental clinic supported by Minimum 2 Specialist dental At dental colleges, 250/- per 1500–2000(full crowns, inlays, well-equipped dental laboratory sittings of surgeon/dental tertiary care restorationveneers, etc.) 30 minutes– surgeon hospitals and in
1 hour each private clinics
Root canal Dental clinic as in (3) 3–4 sittings of Specialist dental At district hospital 150/- 1500–3000treatment Instruments for root canal 30 minutes surgeon and above
treatment, sealants, gutta-percha, each (endodontist)medicaments and irrigants
Scaling and Hand scalers/ultrasonic scalers 2–3 sittings of Dental hygienist/ At the CHC level Nil or 50/- 800–1000polishing of teeth 20 minutes each dental surgeon and above
Surgical procedures Dental surgery set-up as in (3) 45–60 minutes Dental surgeon/ At district 100/- 1500–5000(gingivectomy, flap + all surgical instruments and specialist dental hospital andoperation, retro-filling materials surgeon abovemucogingival (periodontist,surgery and endodontist,endodontic surgery) oral surgeon)
Orthodontics· Dental surgery clinic set-up 6–12 months Orthodontist/ At district hospital 200/- per 2500–3000 perremovable dental surgeon and above appliance appliance
Orthodontics·fixed Dental surgery clinic set-up with One year to Orthodontist At dental schools, 2000–3000 15,000–30,000appliances extraoral radiographic facility two-and-a-half tertiary care hospitals
and inventory of all orthodontic years and private clinicsinstruments and supply ofbrackets, arch wires, elastics, etc.
Complete dentures Dental surgery clinic set-up 5–7 sittings at Specialist dental At CHC level and 350–500 5000–10,000supported by a dental laboratory intervals of surgeon/dental upwards
2–7 days surgeon
Partial denture Dental surgery clinic set-up 3–4 sittings Dental surgeon At CHC and 100/- 300–1000(removable) supported by a dental laboratory upwards 25/- per
additional tooth
Partial denture Dental surgery clinic set-up 3–4 sittings Specialist dental At dental schools, 250/- per unit 2000 per unit(fixed) supported by a dental laboratory surgeon tertiary care hospitals
(prosthodontist) and private clinics
(Cont.)
���
NCMH Background Papers·Burden of Disease in India
Shah
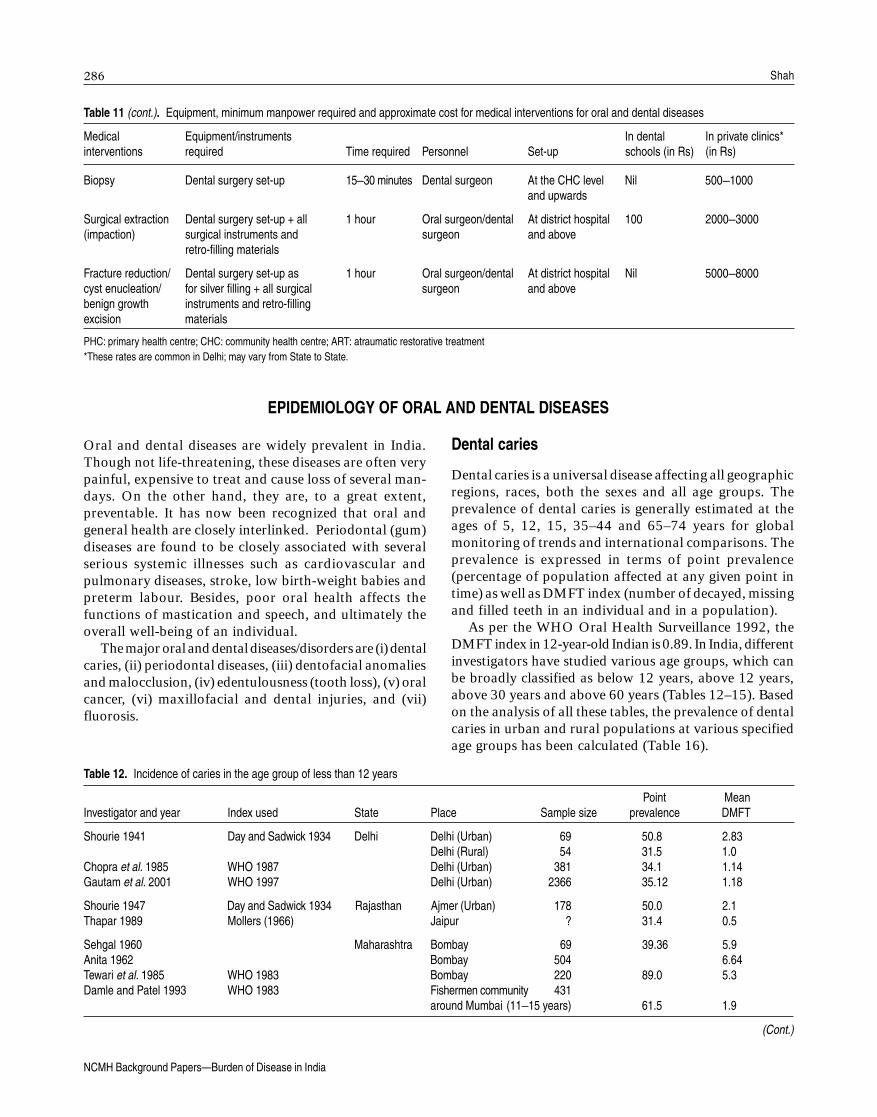
Biopsy Dental surgery set-up 15–30 minutes Dental surgeon At the CHC level Nil 500–1000and upwards
Surgical extraction Dental surgery set-up + all 1 hour Oral surgeon/dental At district hospital 100 2000–3000(impaction) surgical instruments and surgeon and above
retro-filling materials
Fracture reduction/ Dental surgery set-up as 1 hour Oral surgeon/dental At district hospital Nil 5000–8000cyst enucleation/ for silver filling + all surgical surgeon and abovebenign growth instruments and retro-fillingexcision materials
PHC: primary health centre; CHC: community health centre; ART: atraumatic restorative treatment*These rates are common in Delhi; may vary from State to State.
Table 11 (cont.). Equipment, minimum manpower required and approximate cost for medical interventions for oral and dental diseases
Medical Equipment/instruments In dental In private clinics*interventions required Time required Personnel Set-up schools (in Rs) (in Rs)
Oral and dental diseases are widely prevalent in India.Though not life-threatening, these diseases are often verypainful, expensive to treat and cause loss of several man-days. On the other hand, they are, to a great extent,preventable. It has now been recognized that oral andgeneral health are closely interlinked. Periodontal (gum)diseases are found to be closely associated with severalserious systemic illnesses such as cardiovascular andpulmonary diseases, stroke, low birth-weight babies andpreterm labour. Besides, poor oral health affects thefunctions of mastication and speech, and ultimately theoverall well-being of an individual.
The major oral and dental diseases/disorders are (i) dentalcaries, (ii) periodontal diseases, (iii) dentofacial anomaliesand malocclusion, (iv) edentulousness (tooth loss), (v) oralcancer, (vi) maxillofacial and dental injuries, and (vii)fluorosis.
EPIDEMIOLOGY OF ORAL AND DENTAL DISEASES
Dental caries
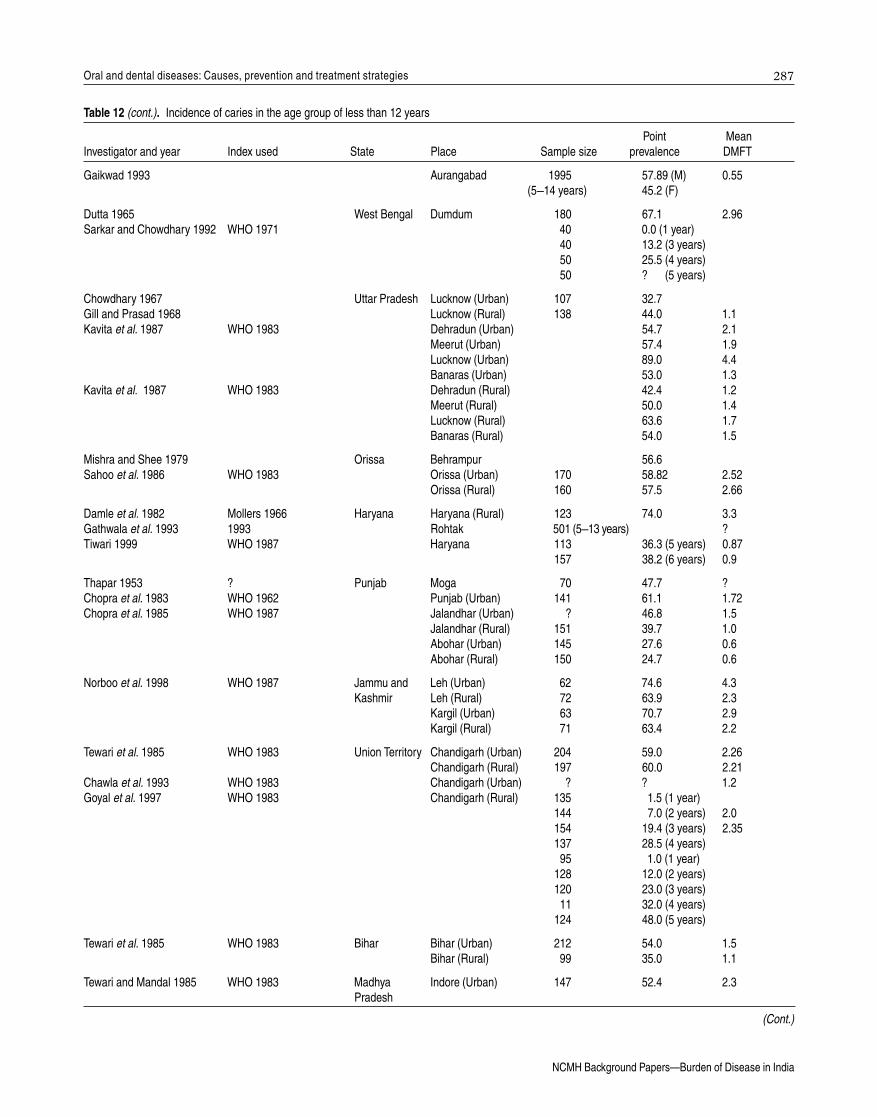
Dental caries is a universal disease affecting all geographicregions, races, both the sexes and all age groups. Theprevalence of dental caries is generally estimated at theages of 5, 12, 15, 35–44 and 65–74 years for globalmonitoring of trends and international comparisons. Theprevalence is expressed in terms of point prevalence(percentage of population affected at any given point intime) as well as DMFT index (number of decayed, missingand filled teeth in an individual and in a population).
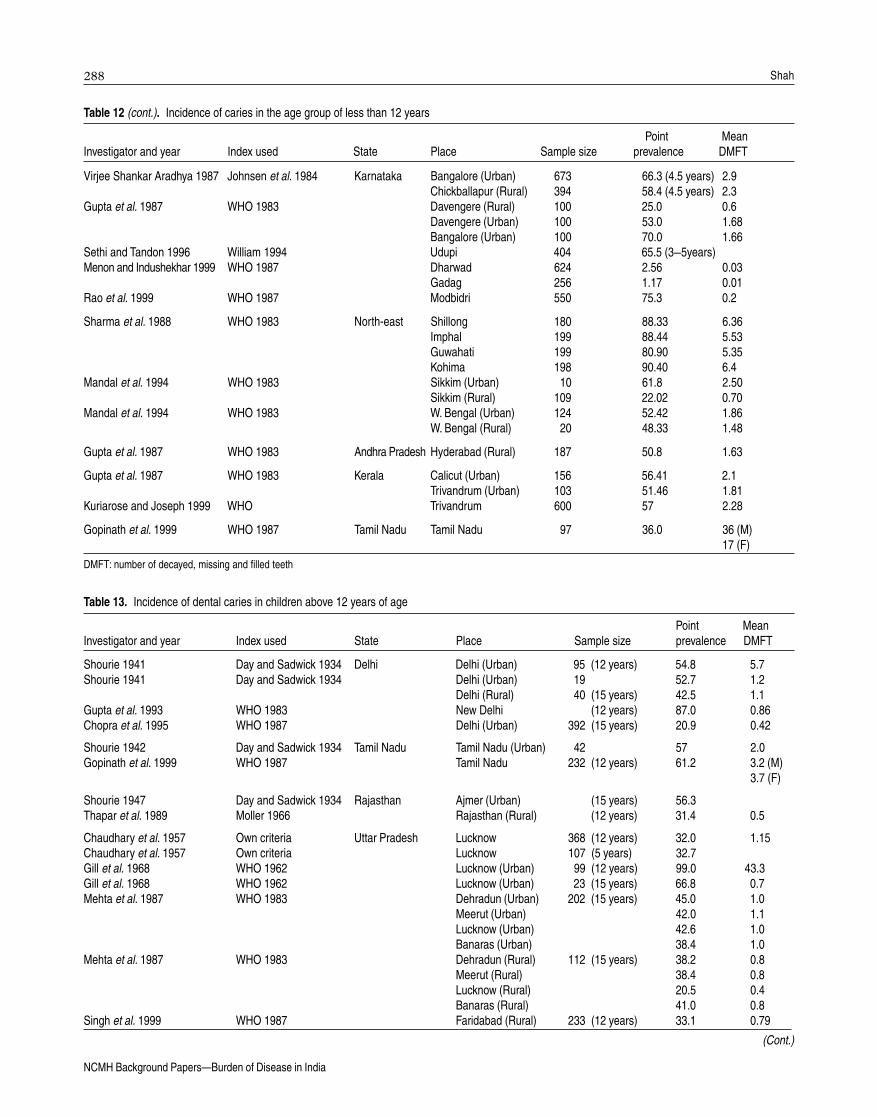
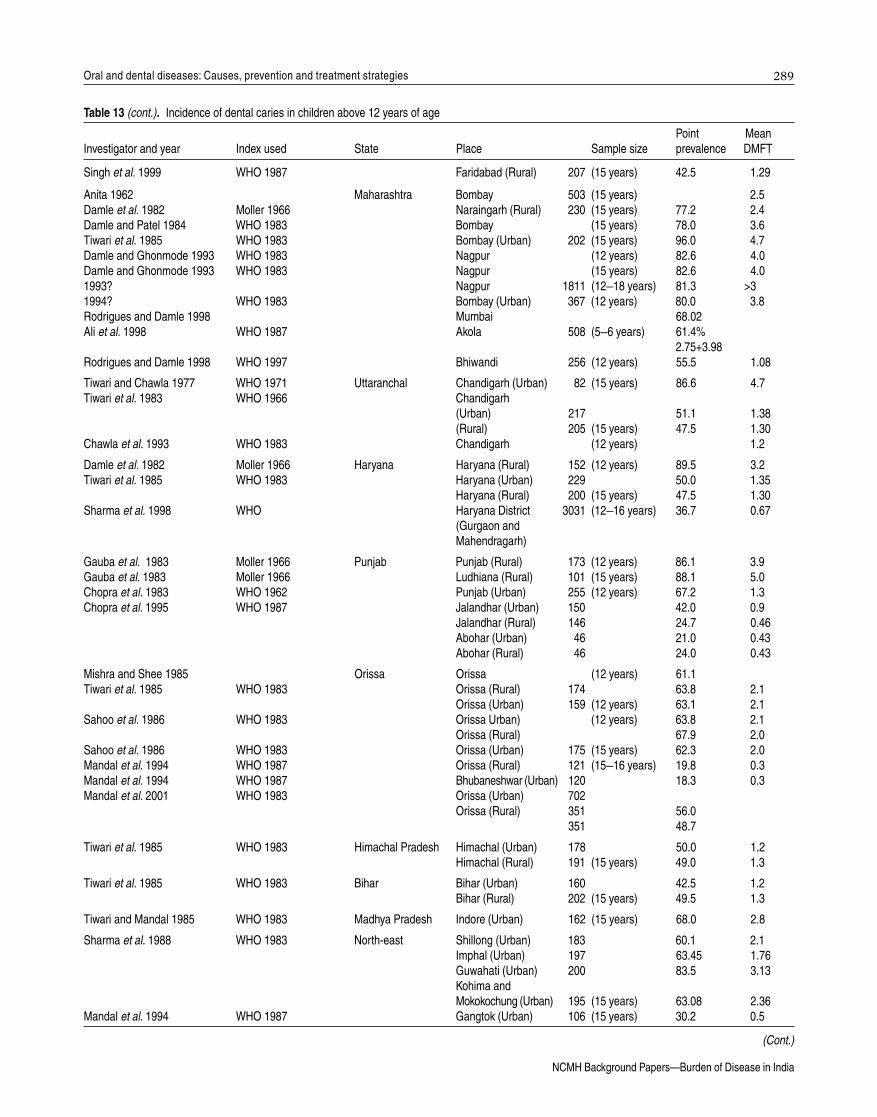
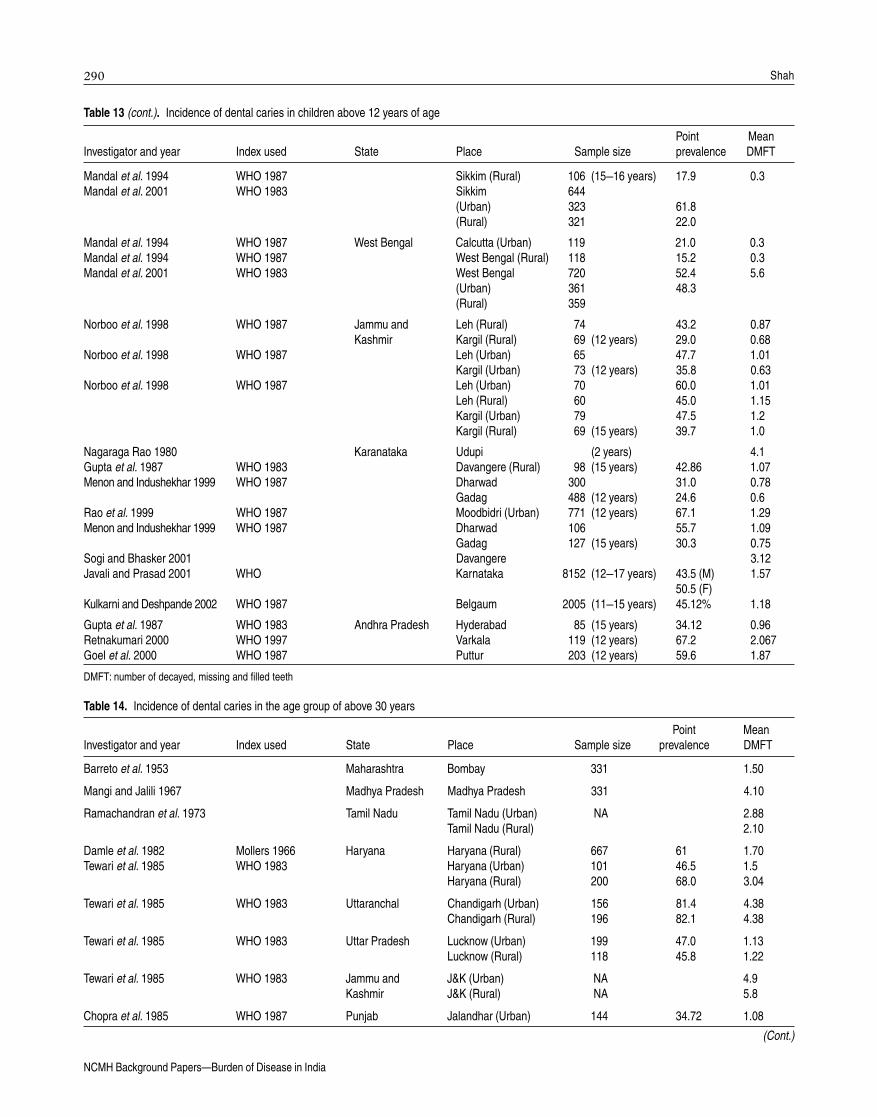
As per the WHO Oral Health Surveillance 1992, theDMFT index in 12-year-old Indian is 0.89. In India, differentinvestigators have studied various age groups, which canbe broadly classified as below 12 years, above 12 years,above 30 years and above 60 years (Tables 12–15). Basedon the analysis of all these tables, the prevalence of dentalcaries in urban and rural populations at various specifiedage groups has been calculated (Table 16).
Table 12. Incidence of caries in the age group of less than 12 years
Point MeanInvestigator and year Index used State Place Sample size prevalence DMFT
Shourie 1941 Day and Sadwick 1934 Delhi Delhi (Urban) 69 50.8 2.83Delhi (Rural) 54 31.5 1.0
Chopra et al. 1985 WHO 1987 Delhi (Urban) 381 34.1 1.14Gautam et al. 2001 WHO 1997 Delhi (Urban) 2366 35.12 1.18
Shourie 1947 Day and Sadwick 1934 Rajasthan Ajmer (Urban) 178 50.0 2.1Thapar 1989 Mollers (1966) Jaipur ? 31.4 0.5
Sehgal 1960 Maharashtra Bombay 69 39.36 5.9Anita 1962 Bombay 504 6.64Tewari et al. 1985 WHO 1983 Bombay 220 89.0 5.3Damle and Patel 1993 WHO 1983 Fishermen community 431
around Mumbai (11–15 years) 61.5 1.9
(Cont.)
���
NCMH Background Papers·Burden of Disease in India
Oral and dental diseases: Causes, prevention and treatment strategies
Table 12 (cont.). Incidence of caries in the age group of less than 12 years
Point MeanInvestigator and year Index used State Place Sample size prevalence DMFT
Gaikwad 1993 Aurangabad 1995 57.89 (M) 0.55 (5–14 years) 45.2 (F)
Dutta 1965 West Bengal Dumdum 180 67.1 2.96Sarkar and Chowdhary 1992 WHO 1971 40 0.0 (1 year)
40 13.2 (3 years)50 25.5 (4 years)50 ? (5 years)
Chowdhary 1967 Uttar Pradesh Lucknow (Urban) 107 32.7Gill and Prasad 1968 Lucknow (Rural) 138 44.0 1.1Kavita et al. 1987 WHO 1983 Dehradun (Urban) 54.7 2.1
Meerut (Urban) 57.4 1.9Lucknow (Urban) 89.0 4.4Banaras (Urban) 53.0 1.3
Kavita et al. 1987 WHO 1983 Dehradun (Rural) 42.4 1.2Meerut (Rural) 50.0 1.4Lucknow (Rural) 63.6 1.7Banaras (Rural) 54.0 1.5
Mishra and Shee 1979 Orissa Behrampur 56.6Sahoo et al. 1986 WHO 1983 Orissa (Urban) 170 58.82 2.52
Orissa (Rural) 160 57.5 2.66
Damle et al. 1982 Mollers 1966 Haryana Haryana (Rural) 123 74.0 3.3Gathwala et al. 1993 1993 Rohtak 501 (5–13 years) ?Tiwari 1999 WHO 1987 Haryana 113 36.3 (5 years) 0.87
157 38.2 (6 years) 0.9
Thapar 1953 ? Punjab Moga 70 47.7 ?Chopra et al. 1983 WHO 1962 Punjab (Urban) 141 61.1 1.72Chopra et al. 1985 WHO 1987 Jalandhar (Urban) ? 46.8 1.5
Jalandhar (Rural) 151 39.7 1.0Abohar (Urban) 145 27.6 0.6Abohar (Rural) 150 24.7 0.6
Norboo et al. 1998 WHO 1987 Jammu and Leh (Urban) 62 74.6 4.3Kashmir Leh (Rural) 72 63.9 2.3
Kargil (Urban) 63 70.7 2.9Kargil (Rural) 71 63.4 2.2
Tewari et al. 1985 WHO 1983 Union Territory Chandigarh (Urban) 204 59.0 2.26Chandigarh (Rural) 197 60.0 2.21
Chawla et al. 1993 WHO 1983 Chandigarh (Urban) ? ? 1.2Goyal et al. 1997 WHO 1983 Chandigarh (Rural) 135 1.5 (1 year)
144 7.0 (2 years) 2.0154 19.4 (3 years) 2.35137 28.5 (4 years)95 1.0 (1 year)
128 12.0 (2 years)120 23.0 (3 years)11 32.0 (4 years)
124 48.0 (5 years)
Tewari et al. 1985 WHO 1983 Bihar Bihar (Urban) 212 54.0 1.5Bihar (Rural) 99 35.0 1.1
Tewari and Mandal 1985 WHO 1983 Madhya Indore (Urban) 147 52.4 2.3Pradesh
(Cont.)
���
NCMH Background Papers·Burden of Disease in India
Shah
Virjee Shankar Aradhya 1987 Johnsen et al. 1984 Karnataka Bangalore (Urban) 673 66.3 (4.5 years) 2.9Chickballapur (Rural) 394 58.4 (4.5 years) 2.3
Gupta et al. 1987 WHO 1983 Davengere (Rural) 100 25.0 0.6Davengere (Urban) 100 53.0 1.68Bangalore (Urban) 100 70.0 1.66
Sethi and Tandon 1996 William 1994 Udupi 404 65.5 (3–5years)Menon and Indushekhar 1999 WHO 1987 Dharwad 624 2.56 0.03
Gadag 256 1.17 0.01Rao et al. 1999 WHO 1987 Modbidri 550 75.3 0.2
Sharma et al. 1988 WHO 1983 North-east Shillong 180 88.33 6.36Imphal 199 88.44 5.53Guwahati 199 80.90 5.35Kohima 198 90.40 6.4
Mandal et al. 1994 WHO 1983 Sikkim (Urban) 10 61.8 2.50Sikkim (Rural) 109 22.02 0.70
Mandal et al. 1994 WHO 1983 W. Bengal (Urban) 124 52.42 1.86W. Bengal (Rural) 20 48.33 1.48
Gupta et al. 1987 WHO 1983 Andhra Pradesh Hyderabad (Rural) 187 50.8 1.63
Gupta et al. 1987 WHO 1983 Kerala Calicut (Urban) 156 56.41 2.1Trivandrum (Urban) 103 51.46 1.81
Kuriarose and Joseph 1999 WHO Trivandrum 600 57 2.28
Gopinath et al. 1999 WHO 1987 Tamil Nadu Tamil Nadu 97 36.0 36 (M)17 (F)
DMFT: number of decayed, missing and filled teeth
Table 12 (cont.). Incidence of caries in the age group of less than 12 years
Point MeanInvestigator and year Index used State Place Sample size prevalence DMFT
Table 13. Incidence of dental caries in children above 12 years of age
Point MeanInvestigator and year Index used State Place Sample size prevalence DMFT
Shourie 1941 Day and Sadwick 1934 Delhi Delhi (Urban) 95 (12 years) 54.8 5.7Shourie 1941 Day and Sadwick 1934 Delhi (Urban) 19 52.7 1.2
Delhi (Rural) 40 (15 years) 42.5 1.1Gupta et al. 1993 WHO 1983 New Delhi (12 years) 87.0 0.86Chopra et al. 1995 WHO 1987 Delhi (Urban) 392 (15 years) 20.9 0.42
Shourie 1942 Day and Sadwick 1934 Tamil Nadu Tamil Nadu (Urban) 42 57 2.0Gopinath et al. 1999 WHO 1987 Tamil Nadu 232 (12 years) 61.2 3.2 (M)
3.7 (F)
Shourie 1947 Day and Sadwick 1934 Rajasthan Ajmer (Urban) (15 years) 56.3Thapar et al. 1989 Moller 1966 Rajasthan (Rural) (12 years) 31.4 0.5
Chaudhary et al. 1957 Own criteria Uttar Pradesh Lucknow 368 (12 years) 32.0 1.15Chaudhary et al. 1957 Own criteria Lucknow 107 (5 years) 32.7Gill et al. 1968 WHO 1962 Lucknow (Urban) 99 (12 years) 99.0 43.3Gill et al. 1968 WHO 1962 Lucknow (Urban) 23 (15 years) 66.8 0.7Mehta et al. 1987 WHO 1983 Dehradun (Urban) 202 (15 years) 45.0 1.0
Meerut (Urban) 42.0 1.1Lucknow (Urban) 42.6 1.0Banaras (Urban) 38.4 1.0
Mehta et al. 1987 WHO 1983 Dehradun (Rural) 112 (15 years) 38.2 0.8Meerut (Rural) 38.4 0.8Lucknow (Rural) 20.5 0.4Banaras (Rural) 41.0 0.8
Singh et al. 1999 WHO 1987 Faridabad (Rural) 233 (12 years) 33.1 0.79
(Cont.)
���
NCMH Background Papers·Burden of Disease in India
Oral and dental diseases: Causes, prevention and treatment strategies
Table 13 (cont.). Incidence of dental caries in children above 12 years of age
Point MeanInvestigator and year Index used State Place Sample size prevalence DMFT
Singh et al. 1999 WHO 1987 Faridabad (Rural) 207 (15 years) 42.5 1.29
Anita 1962 Maharashtra Bombay 503 (15 years) 2.5Damle et al. 1982 Moller 1966 Naraingarh (Rural) 230 (15 years) 77.2 2.4Damle and Patel 1984 WHO 1983 Bombay (15 years) 78.0 3.6Tiwari et al. 1985 WHO 1983 Bombay (Urban) 202 (15 years) 96.0 4.7Damle and Ghonmode 1993 WHO 1983 Nagpur (12 years) 82.6 4.0Damle and Ghonmode 1993 WHO 1983 Nagpur (15 years) 82.6 4.01993? Nagpur 1811 (12–18 years) 81.3 >31994? WHO 1983 Bombay (Urban) 367 (12 years) 80.0 3.8Rodrigues and Damle 1998 Mumbai 68.02Ali et al. 1998 WHO 1987 Akola 508 (5–6 years) 61.4%
2.75+3.98Rodrigues and Damle 1998 WHO 1997 Bhiwandi 256 (12 years) 55.5 1.08
Tiwari and Chawla 1977 WHO 1971 Uttaranchal Chandigarh (Urban) 82 (15 years) 86.6 4.7Tiwari et al. 1983 WHO 1966 Chandigarh
(Urban) 217 51.1 1.38(Rural) 205 (15 years) 47.5 1.30
Chawla et al. 1993 WHO 1983 Chandigarh (12 years) 1.2
Damle et al. 1982 Moller 1966 Haryana Haryana (Rural) 152 (12 years) 89.5 3.2Tiwari et al. 1985 WHO 1983 Haryana (Urban) 229 50.0 1.35
Haryana (Rural) 200 (15 years) 47.5 1.30Sharma et al. 1998 WHO Haryana District 3031 (12–16 years) 36.7 0.67
(Gurgaon andMahendragarh)
Gauba et al. 1983 Moller 1966 Punjab Punjab (Rural) 173 (12 years) 86.1 3.9Gauba et al. 1983 Moller 1966 Ludhiana (Rural) 101 (15 years) 88.1 5.0Chopra et al. 1983 WHO 1962 Punjab (Urban) 255 (12 years) 67.2 1.3Chopra et al. 1995 WHO 1987 Jalandhar (Urban) 150 42.0 0.9
Jalandhar (Rural) 146 24.7 0.46Abohar (Urban) 46 21.0 0.43Abohar (Rural) 46 24.0 0.43
Mishra and Shee 1985 Orissa Orissa (12 years) 61.1Tiwari et al. 1985 WHO 1983 Orissa (Rural) 174 63.8 2.1
Orissa (Urban) 159 (12 years) 63.1 2.1Sahoo et al. 1986 WHO 1983 Orissa Urban) (12 years) 63.8 2.1
Orissa (Rural) 67.9 2.0Sahoo et al. 1986 WHO 1983 Orissa (Urban) 175 (15 years) 62.3 2.0Mandal et al. 1994 WHO 1987 Orissa (Rural) 121 (15–16 years) 19.8 0.3Mandal et al. 1994 WHO 1987 Bhubaneshwar (Urban) 120 18.3 0.3Mandal et al. 2001 WHO 1983 Orissa (Urban) 702
Orissa (Rural) 351 56.0351 48.7
Tiwari et al. 1985 WHO 1983 Himachal Pradesh Himachal (Urban) 178 50.0 1.2Himachal (Rural) 191 (15 years) 49.0 1.3
Tiwari et al. 1985 WHO 1983 Bihar Bihar (Urban) 160 42.5 1.2Bihar (Rural) 202 (15 years) 49.5 1.3
Tiwari and Mandal 1985 WHO 1983 Madhya Pradesh Indore (Urban) 162 (15 years) 68.0 2.8
Sharma et al. 1988 WHO 1983 North-east Shillong (Urban) 183 60.1 2.1Imphal (Urban) 197 63.45 1.76Guwahati (Urban) 200 83.5 3.13Kohima andMokokochung (Urban) 195 (15 years) 63.08 2.36
Mandal et al. 1994 WHO 1987 Gangtok (Urban) 106 (15 years) 30.2 0.5
(Cont.)
���
NCMH Background Papers·Burden of Disease in India
Shah
Mandal et al. 1994 WHO 1987 Sikkim (Rural) 106 (15–16 years) 17.9 0.3Mandal et al. 2001 WHO 1983 Sikkim 644
(Urban) 323 61.8(Rural) 321 22.0
Mandal et al. 1994 WHO 1987 West Bengal Calcutta (Urban) 119 21.0 0.3Mandal et al. 1994 WHO 1987 West Bengal (Rural) 118 15.2 0.3Mandal et al. 2001 WHO 1983 West Bengal 720 52.4 5.6
(Urban) 361 48.3(Rural) 359
Norboo et al. 1998 WHO 1987 Jammu and Leh (Rural) 74 43.2 0.87Kashmir Kargil (Rural) 69 (12 years) 29.0 0.68
Norboo et al. 1998 WHO 1987 Leh (Urban) 65 47.7 1.01Kargil (Urban) 73 (12 years) 35.8 0.63
Norboo et al. 1998 WHO 1987 Leh (Urban) 70 60.0 1.01Leh (Rural) 60 45.0 1.15Kargil (Urban) 79 47.5 1.2Kargil (Rural) 69 (15 years) 39.7 1.0
Nagaraga Rao 1980 Karanataka Udupi (2 years) 4.1Gupta et al. 1987 WHO 1983 Davangere (Rural) 98 (15 years) 42.86 1.07Menon and Indushekhar 1999 WHO 1987 Dharwad 300 31.0 0.78
Gadag 488 (12 years) 24.6 0.6Rao et al. 1999 WHO 1987 Moodbidri (Urban) 771 (12 years) 67.1 1.29Menon and Indushekhar 1999 WHO 1987 Dharwad 106 55.7 1.09
Gadag 127 (15 years) 30.3 0.75Sogi and Bhasker 2001 Davangere 3.12Javali and Prasad 2001 WHO Karnataka 8152 (12–17 years) 43.5 (M) 1.57
50.5 (F)Kulkarni and Deshpande 2002 WHO 1987 Belgaum 2005 (11–15 years) 45.12% 1.18
Gupta et al. 1987 WHO 1983 Andhra Pradesh Hyderabad 85 (15 years) 34.12 0.96Retnakumari 2000 WHO 1997 Varkala 119 (12 years) 67.2 2.067Goel et al. 2000 WHO 1987 Puttur 203 (12 years) 59.6 1.87
DMFT: number of decayed, missing and filled teeth
Table 13 (cont.). Incidence of dental caries in children above 12 years of age
Point MeanInvestigator and year Index used State Place Sample size prevalence DMFT
Table 14. Incidence of dental caries in the age group of above 30 years
Point MeanInvestigator and year Index used State Place Sample size prevalence DMFT
Barreto et al. 1953 Maharashtra Bombay 331 1.50
Mangi and Jalili 1967 Madhya Pradesh Madhya Pradesh 331 4.10
Ramachandran et al. 1973 Tamil Nadu Tamil Nadu (Urban) NA 2.88Tamil Nadu (Rural) 2.10
Damle et al. 1982 Mollers 1966 Haryana Haryana (Rural) 667 61 1.70Tewari et al. 1985 WHO 1983 Haryana (Urban) 101 46.5 1.5
Haryana (Rural) 200 68.0 3.04
Tewari et al. 1985 WHO 1983 Uttaranchal Chandigarh (Urban) 156 81.4 4.38Chandigarh (Rural) 196 82.1 4.38
Tewari et al. 1985 WHO 1983 Uttar Pradesh Lucknow (Urban) 199 47.0 1.13Lucknow (Rural) 118 45.8 1.22
Tewari et al. 1985 WHO 1983 Jammu and J&K (Urban) NA 4.9Kashmir J&K (Rural) NA 5.8
Chopra et al. 1985 WHO 1987 Punjab Jalandhar (Urban) 144 34.72 1.08
(Cont.)

���
NCMH Background Papers·Burden of Disease in India
Oral and dental diseases: Causes, prevention and treatment strategies
Table 15. Incidence of dental caries in those above 60 years of age
Year State Place Index used Sample size Point prevalence Mean DMFT
1994 Karnataka 300 13.512004 Delhi New Delhi WHO 1987 1052 72.4 ·
DMFT: number of decayed, missing and filled teeth
Jalandhar (Rural) 145 30.34 0.76Abohar (Urban) 140 20.0 0.42Abohar (Rural) 149 24.16 0.41
Sharma et al. 1985 WHO 1983 North-east Meghalaya (Urban) 196 54.6 1.18Manipur (Urban) 199 63.82 1.86Assam (Urban) 244 66.0 1.86Nagaland (Urban) 202 62.4 2.13
Mandal et al. 1994 WHO 1983 Sikkim (Urban) 107 29.91 0.62Sikkim (Rural) 107 24.53 0.60
Tewari and Mandal 1985 WHO 1983 Madhya Pradesh Indore 66 70.0 3.80Tewari and Damle 1985 WHO 1983 201 80.0 3.57
Gupta et al. 1985 WHO 1983 Kerala Trivandrum (Urban) 103 79.61 2.21Calicut (Urban) 104 78.9 2.16Calicut (Rural) 90 47.8 1.2
Gupta et al. 1985 WHO 1983 Andhra Pradesh Hyderabad (Urban) 111 64.86 2.16Hyderabad (Rural) 87 44.83 1.16
Gupta et al. 1985 WHO 1983 Karnataka Bangalore (Urban) 98 73.47 2.17Davengere (Urban) 102 68.63 2.29Davengere (Rural) 102 48.04 1.07
Mandal et al. 1994 WHO 1987 Orissa Orissa (Urban) 5 24.35 0.47Orissa (Rural) 114 20.17 0.48
Mandal et al. 1994 WHO 1987 West Bengal West Bengal (Urban) 18 19.49 0.47West Bengal (Rural) 20 18.18 0.40
Chopra et al. 1995 WHO 1987 Delhi Delhi (Urban) 388 24.5 0.50
Tewari et al. 1995 WHO 1983 Bihar Bihar (Urban) 149 69 1.75Bihar (Rural) 193 63.2 1.85
DMFT: number of decayed, missing and filled teeth; NA: not available
Table 14 (cont.). Incidence of dental caries in the age group of above 30 years
Point MeanInvestigator and year Index used State Place Sample size prevalence DMFT
Table 16. Prevalence of dental caries in different age groups
Age group(years) Urban Rural Average DMFT
5–6 67.23 46.22 56.72 2.112 57.94 36.90 47.39 1.615 55.97 43.28 49.59 1.3730–35 45.21 39.27 42.24 1.3960–75 79.40 61.90 70.65 ·
DMFT: number of decayed, missing and filled teeth
are the commonest cause of tooth loss in India. A thin,adherent microbial film on the tooth surfaces, called dentalplaque, is the main pathological cause of gingival andperiodontal inflammation. Poor oral hygiene, faulty foodhabits, poor nutrition, presence of metabolic diseases suchas diabetes, use of tobacco, etc. are the major contributoryfactors for periodontal diseases.
Periodontal diseases are common in the adult population,but not very common in children. Several indices are usedto measure periodontal diseases, such as plaque index, oralhygiene index, bleeding index, community periodontal index(CPI), etc. A scoring system to score the gradation frommild to severe forms of the disease is also available.Therefore, there is no uniformity in data on the prevalenceof periodontal diseases and hence, it is difficult to comparethe data. However, it is widely accepted that periodontal
Periodontal diseases
Periodontal diseases affect the supporting structures ofteeth, i.e. the gingiva (gums), periodontal ligament, alveolarbone and cementum (covering the roots of the teeth) and
���
NCMH Background Papers·Burden of Disease in India
Shah
Table 18. Prevalence of dentofacial anomalies and malocclusion
Author and year State Place Age group (years) Prevalence (%)
Shourie 1952 Punjab Punjab 13–16 50Guaba et al. 1998 Ambala 6–15 29.2
Shaik and Desai 1966 Tamil Nadu Madras 15–25 19.6
Jacob 1969 Kerala Trivandrum 12–15 44.97Jose and Joseph 2003 Kerala 12–15 NA
Prasad and Savadi 1971 Karnataka Bangalore 5–15 51.5Nagaraja Rao 1980 Udupi 5–15 28.8Gardiner 1989 South Kanara 10–12 42
Jalili 1989 Madhya Pradesh Mandu (Tribal area) 6–14 14.4
Kharbanda 1991 Delhi Delhi 5–13 10–18Kharbanda 1995 Delhi 10–13 45.7
Goel et al. 2000 Andhra Pradesh Puttur 5–6 1.7912–13 36.95
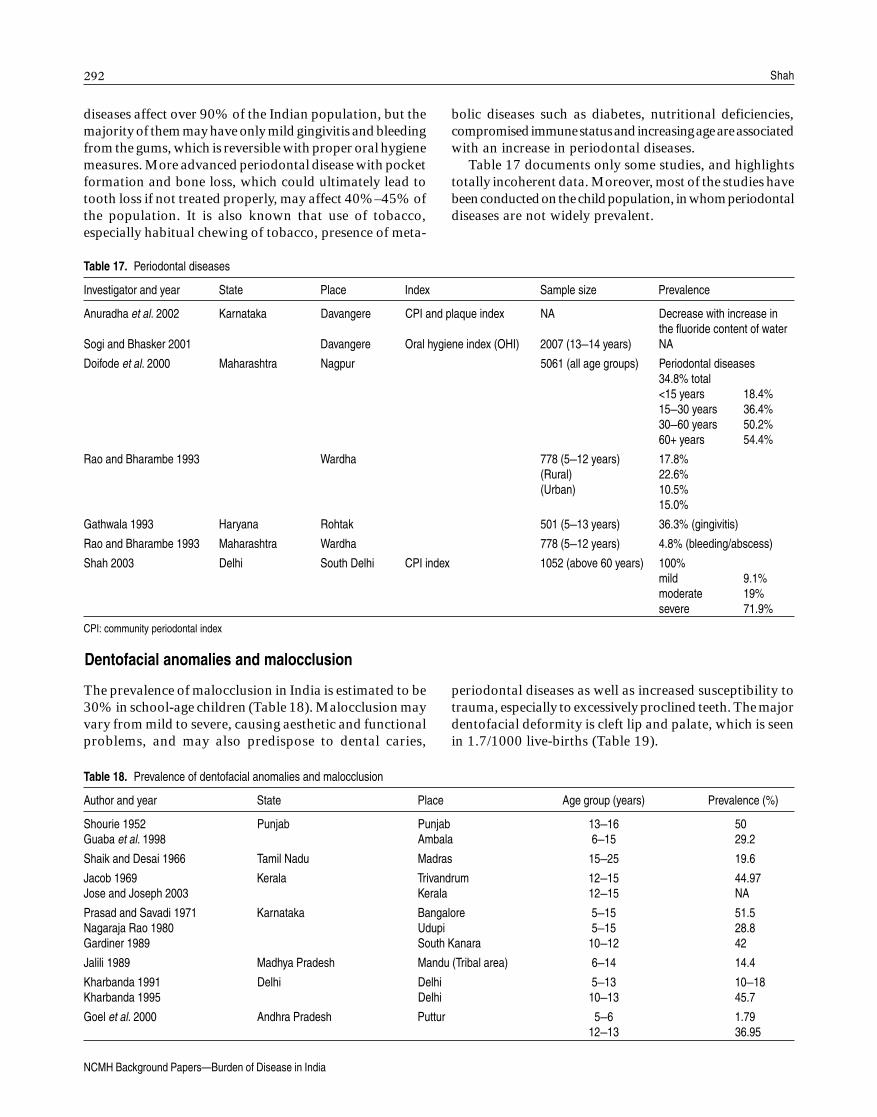
diseases affect over 90% of the Indian population, but themajority of them may have only mild gingivitis and bleedingfrom the gums, which is reversible with proper oral hygienemeasures. More advanced periodontal disease with pocketformation and bone loss, which could ultimately lead totooth loss if not treated properly, may affect 40%–45% ofthe population. It is also known that use of tobacco,especially habitual chewing of tobacco, presence of meta-
Table 17. Periodontal diseases
Investigator and year State Place Index Sample size Prevalence
Anuradha et al. 2002 Karnataka Davangere CPI and plaque index NA Decrease with increase inthe fluoride content of water
Sogi and Bhasker 2001 Davangere Oral hygiene index (OHI) 2007 (13–14 years) NA
Doifode et al. 2000 Maharashtra Nagpur 5061 (all age groups) Periodontal diseases34.8% total<15 years 18.4%15–30 years 36.4%30–60 years 50.2%60+ years 54.4%
Rao and Bharambe 1993 Wardha 778 (5–12 years) 17.8%(Rural) 22.6%(Urban) 10.5%
15.0%
Gathwala 1993 Haryana Rohtak 501 (5–13 years) 36.3% (gingivitis)
Rao and Bharambe 1993 Maharashtra Wardha 778 (5–12 years) 4.8% (bleeding/abscess)
Shah 2003 Delhi South Delhi CPI index 1052 (above 60 years) 100%mild 9.1%moderate 19%severe 71.9%
CPI: community periodontal index
Dentofacial anomalies and malocclusion
The prevalence of malocclusion in India is estimated to be30% in school-age children (Table 18). Malocclusion mayvary from mild to severe, causing aesthetic and functionalproblems, and may also predispose to dental caries,
periodontal diseases as well as increased susceptibility totrauma, especially to excessively proclined teeth. The majordentofacial deformity is cleft lip and palate, which is seenin 1.7/1000 live-births (Table 19).
bolic diseases such as diabetes, nutritional deficiencies,compromised immune status and increasing age are associatedwith an increase in periodontal diseases.
Table 17 documents only some studies, and highlightstotally incoherent data. Moreover, most of the studies havebeen conducted on the child population, in whom periodontaldiseases are not widely prevalent.

��
NCMH Background Papers·Burden of Disease in India
Oral and dental diseases: Causes, prevention and treatment strategies
Table 19. Incidence of cleft lip and cleft palate in India (hospital-basedstudies)
Incidence (%)
Location of the hospital Cleft lip Cleft lip and palate
Delhi 2.21 0.71Delhi (AIIMS) 1.40 0.30Chandigarh 1.0 ·Jaipur 1.12 0.35Patiala 1.5 ·Lucknow 1.09 ·Ajmer 0.90 ·Mumbai 1.30 0.20Ahmedabad 1.06 0.24Chennai 1.60 0.10Kolkata 0.63 0.16Hyderabad 1.90 1.90
AIIMS: All India Institute of Medical Sciences
Table 20. Tooth loss (edentulousness)
Age group (years) Number of missing teeth Edentulousness (%)
60–64 8.5 11.165–74 10.9 19.475+ 18.1 32.3
efficiency, causing a shift in dietary practices. This mayresult in nutritional deficiencies. Tooth loss may also causeproblems in speech and affect aesthetics, causing an overallloss of self-esteem and confidence. Very little data areavailable on tooth loss.
Dental fluorosis
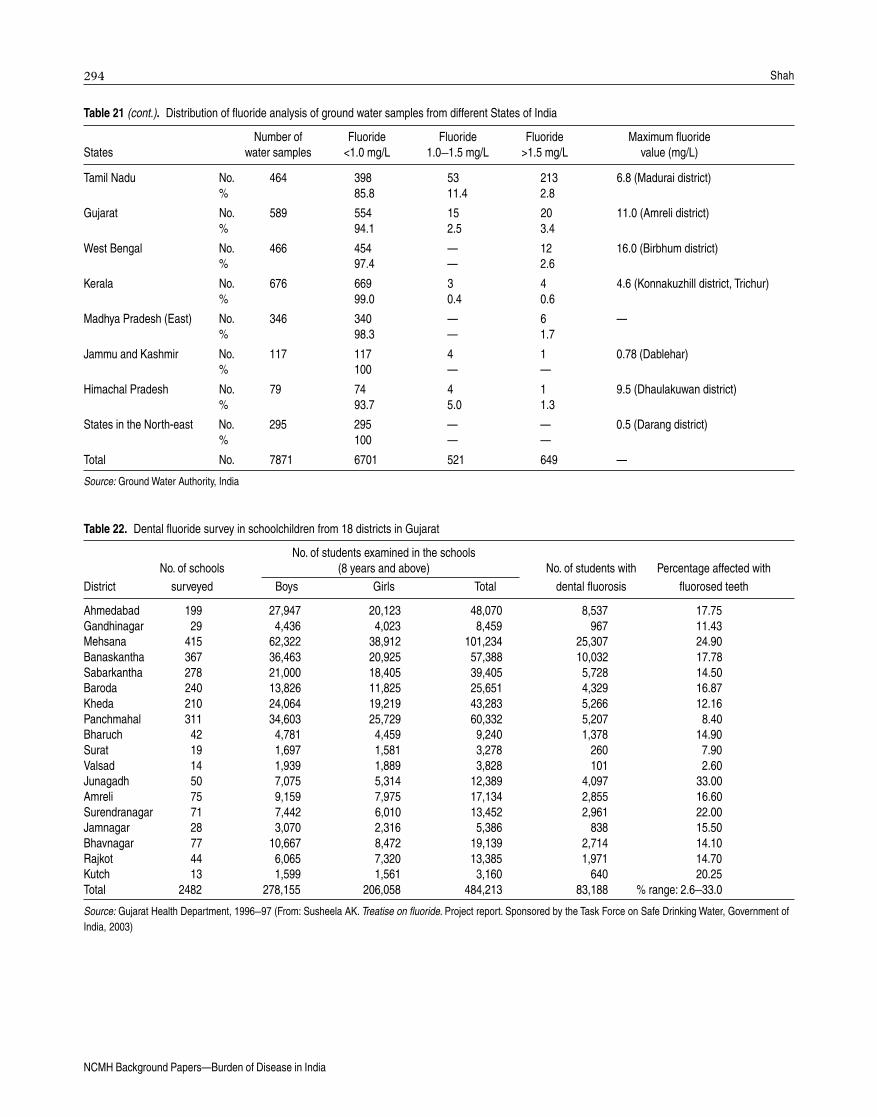
In India, a high fluoride content in ground water is endemicin some areas. The states that are most affected are AndhraPradesh, Gujarat and Rajasthan. Table 21 shows thedistribution of fluoride in different states. It has beenestimated that about 666.2 lakh people are at risk forfluoride toxicity of which children below the age of 14years constitute 60 lakh.
Data available from a field survey in Gujarat, Haryanaand Delhi are presented in Tables 22, 23 and 24, respectively.
Table 21. Distribution of fluoride analysis of ground water samples from different States of India
Number of Fluoride Fluoride Fluoride Maximum fluorideStates water samples <1.0 mg/L 1.0–1.5 mg/L >1.5 mg/L value (mg/L)
Uttar Pradesh No. 502 398 62 42 15.0 (Marksnagar, Unnao district)% 79.2 12.4 8.4
Andhra Pradesh No. 786 752 19 15 7.90 (Nalgonda district)% 95.7 2.4 1.9
Rajasthan No. 780 403 114 263 22.0 (Nagaur district)% 51.7 14.6 33.7
Maharashtra No. 161 156 · 5 5.0 (Chandrapur district)% 96.9 · 3.1
Madhya Pradesh (West) No. 749 678 51 20 4.5 (Sirohi, Bhind district)% 90.5 6.8 2.7
Karnataka No. 773 634 91 48 8.3 (Kulgeri, Bijapur district)% 82.0 11.8 6.2
Chandigarh No. 1 · 1 · ·% · 100 ·
Punjab No. 332 232 46 54 11.7 (Bathinda district)% 69.9 13.9 16.2
Haryana No. 306 134 48 124 21.0 (Hissar district)% 43.8 15.7 40.5
Delhi No. 38 31 4 3 3.25 (Palam)% 81.6 10.5 7.9
Orissa No. 83 69 5 9 11.0 (Balasore and Bolangir district)% 83.1 6.0 10.8
Bihar No. 328 313 5 10 4.2% 95.4 1.5 3.1
(Cont.)
Edentulousness (tooth loss)
Tooth loss results from dental caries, periodontal diseasesand trauma. Tooth loss increases with advancing age (Table20). Loss of the teeth results in decreased masticatory
��
NCMH Background Papers·Burden of Disease in India
Shah
Table 21 (cont.). Distribution of fluoride analysis of ground water samples from different States of India
Number of Fluoride Fluoride Fluoride Maximum fluorideStates water samples <1.0 mg/L 1.0–1.5 mg/L >1.5 mg/L value (mg/L)
Tamil Nadu No. 464 398 53 213 6.8 (Madurai district)% 85.8 11.4 2.8
Gujarat No. 589 554 15 20 11.0 (Amreli district)% 94.1 2.5 3.4
West Bengal No. 466 454 · 12 16.0 (Birbhum district)% 97.4 · 2.6
Kerala No. 676 669 3 4 4.6 (Konnakuzhill district, Trichur)% 99.0 0.4 0.6
Madhya Pradesh (East) No. 346 340 · 6 ·% 98.3 · 1.7
Jammu and Kashmir No. 117 117 4 1 0.78 (Dablehar)% 100 · ·
Himachal Pradesh No. 79 74 4 1 9.5 (Dhaulakuwan district)% 93.7 5.0 1.3
States in the North-east No. 295 295 · · 0.5 (Darang district)% 100 · ·
Total No. 7871 6701 521 649 ·
Source: Ground Water Authority, India
Table 22. Dental fluoride survey in schoolchildren from 18 districts in Gujarat
No. of students examined in the schoolsNo. of schools (8 years and above) No. of students with Percentage affected with
District surveyed Boys Girls Total dental fluorosis fluorosed teeth
Ahmedabad 199 27,947 20,123 48,070 8,537 17.75Gandhinagar 29 4,436 4,023 8,459 967 11.43Mehsana 415 62,322 38,912 101,234 25,307 24.90Banaskantha 367 36,463 20,925 57,388 10,032 17.78Sabarkantha 278 21,000 18,405 39,405 5,728 14.50Baroda 240 13,826 11,825 25,651 4,329 16.87Kheda 210 24,064 19,219 43,283 5,266 12.16Panchmahal 311 34,603 25,729 60,332 5,207 8.40Bharuch 42 4,781 4,459 9,240 1,378 14.90Surat 19 1,697 1,581 3,278 260 7.90Valsad 14 1,939 1,889 3,828 101 2.60Junagadh 50 7,075 5,314 12,389 4,097 33.00Amreli 75 9,159 7,975 17,134 2,855 16.60Surendranagar 71 7,442 6,010 13,452 2,961 22.00Jamnagar 28 3,070 2,316 5,386 838 15.50Bhavnagar 77 10,667 8,472 19,139 2,714 14.10Rajkot 44 6,065 7,320 13,385 1,971 14.70Kutch 13 1,599 1,561 3,160 640 20.25Total 2482 278,155 206,058 484,213 83,188 % range: 2.6–33.0
Source: Gujarat Health Department, 1996–97 (From: Susheela AK. Treatise on fluoride. Project report. Sponsored by the Task Force on Safe Drinking Water, Government ofIndia, 2003)
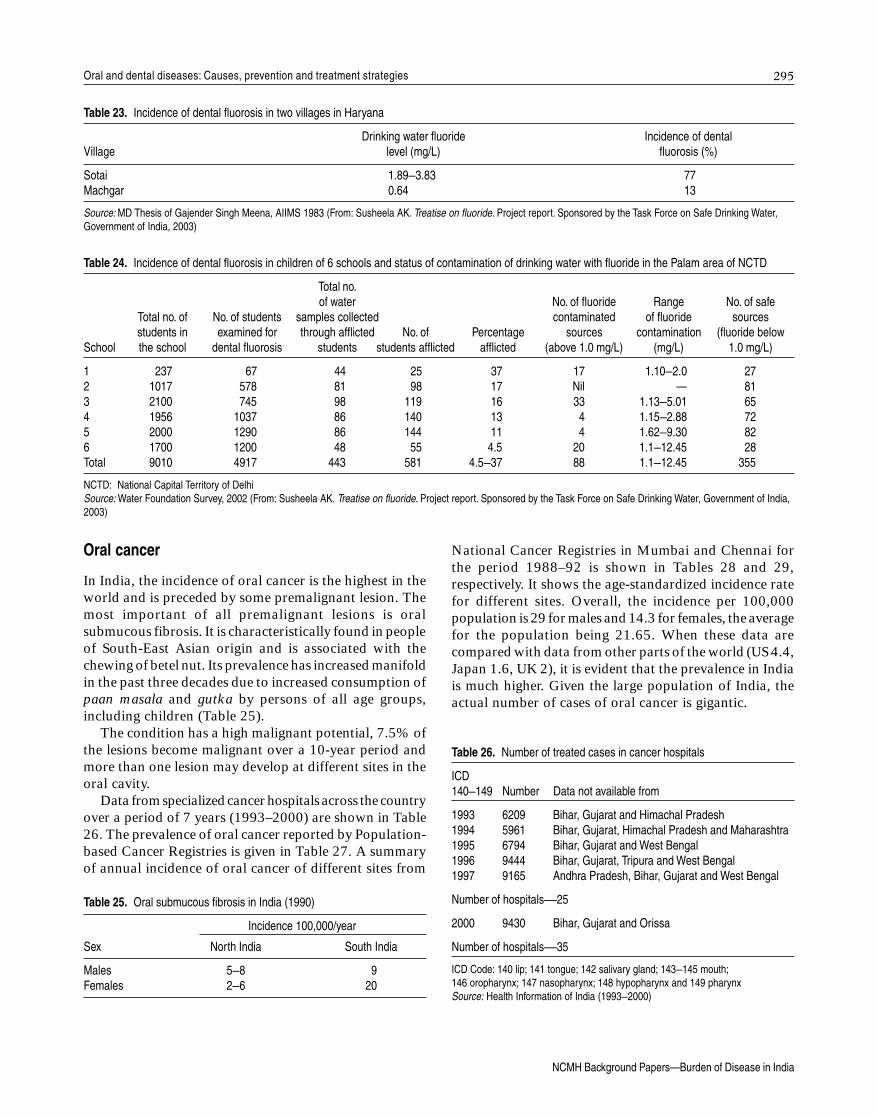
���
NCMH Background Papers·Burden of Disease in India
Oral and dental diseases: Causes, prevention and treatment strategies
Table 23. Incidence of dental fluorosis in two villages in Haryana
Drinking water fluoride Incidence of dentalVillage level (mg/L) fluorosis (%)
Sotai 1.89–3.83 77Machgar 0.64 13
Source: MD Thesis of Gajender Singh Meena, AIIMS 1983 (From: Susheela AK. Treatise on fluoride. Project report. Sponsored by the Task Force on Safe Drinking Water,Government of India, 2003)
Table 24. Incidence of dental fluorosis in children of 6 schools and status of contamination of drinking water with fluoride in the Palam area of NCTD
Total no.of water No. of fluoride Range No. of safe
Total no. of No. of students samples collected contaminated of fluoride sourcesstudents in examined for through afflicted No. of Percentage sources contamination (fluoride below
School the school dental fluorosis students students afflicted afflicted (above 1.0 mg/L) (mg/L) 1.0 mg/L)
1 237 67 44 25 37 17 1.10–2.0 272 1017 578 81 98 17 Nil · 813 2100 745 98 119 16 33 1.13–5.01 654 1956 1037 86 140 13 4 1.15–2.88 725 2000 1290 86 144 11 4 1.62–9.30 826 1700 1200 48 55 4.5 20 1.1–12.45 28Total 9010 4917 443 581 4.5–37 88 1.1–12.45 355
NCTD: National Capital Territory of DelhiSource: Water Foundation Survey, 2002 (From: Susheela AK. Treatise on fluoride. Project report. Sponsored by the Task Force on Safe Drinking Water, Government of India,2003)
Oral cancer
In India, the incidence of oral cancer is the highest in theworld and is preceded by some premalignant lesion. Themost important of all premalignant lesions is oralsubmucous fibrosis. It is characteristically found in peopleof South-East Asian origin and is associated with thechewing of betel nut. Its prevalence has increased manifoldin the past three decades due to increased consumption ofpaan masala and gutka by persons of all age groups,including children (Table 25).
The condition has a high malignant potential, 7.5% ofthe lesions become malignant over a 10-year period andmore than one lesion may develop at different sites in theoral cavity.
Data from specialized cancer hospitals across the countryover a period of 7 years (1993–2000) are shown in Table26. The prevalence of oral cancer reported by Population-based Cancer Registries is given in Table 27. A summaryof annual incidence of oral cancer of different sites from
Table 25. Oral submucous fibrosis in India (1990)
Incidence 100,000/year
Sex North India South India
Males 5–8 9Females 2–6 20
Table 26. Number of treated cases in cancer hospitals
ICD140–149 Number Data not available from
1993 6209 Bihar, Gujarat and Himachal Pradesh1994 5961 Bihar, Gujarat, Himachal Pradesh and Maharashtra1995 6794 Bihar, Gujarat and West Bengal1996 9444 Bihar, Gujarat, Tripura and West Bengal1997 9165 Andhra Pradesh, Bihar, Gujarat and West Bengal
Number of hospitals—25
2000 9430 Bihar, Gujarat and Orissa
Number of hospitals—35
ICD Code: 140 lip; 141 tongue; 142 salivary gland; 143–145 mouth;146 oropharynx; 147 nasopharynx; 148 hypopharynx and 149 pharynxSource: Health Information of India (1993–2000)
National Cancer Registries in Mumbai and Chennai forthe period 1988–92 is shown in Tables 28 and 29,respectively. It shows the age-standardized incidence ratefor different sites. Overall, the incidence per 100,000population is 29 for males and 14.3 for females, the averagefor the population being 21.65. When these data arecompared with data from other parts of the world (US 4.4,Japan 1.6, UK 2), it is evident that the prevalence in Indiais much higher. Given the large population of India, theactual number of cases of oral cancer is gigantic.
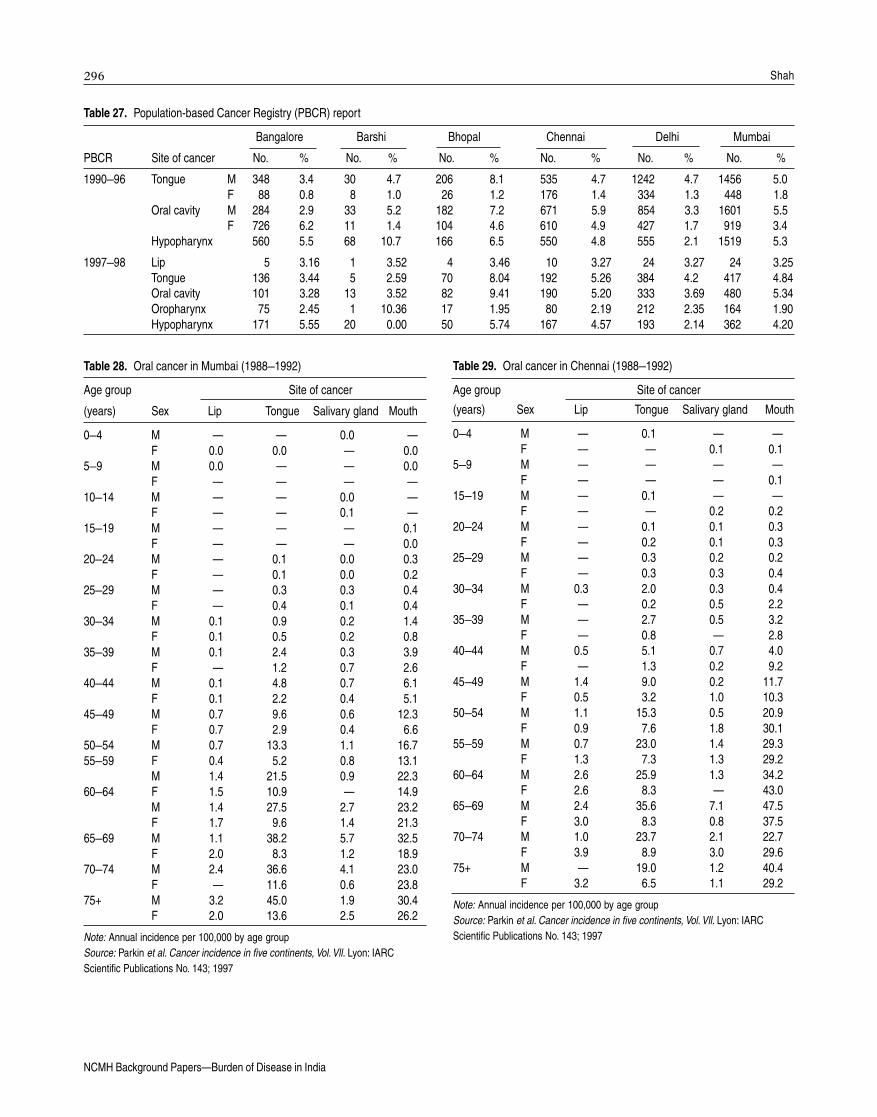
���
NCMH Background Papers·Burden of Disease in India
Shah
Table 27. Population-based Cancer Registry (PBCR) report
Bangalore Barshi Bhopal Chennai Delhi Mumbai
PBCR Site of cancer No. % No. % No. % No. % No. % No. %
1990–96 Tongue M 348 3.4 30 4.7 206 8.1 535 4.7 1242 4.7 1456 5.0F 88 0.8 8 1.0 26 1.2 176 1.4 334 1.3 448 1.8
Oral cavity M 284 2.9 33 5.2 182 7.2 671 5.9 854 3.3 1601 5.5F 726 6.2 11 1.4 104 4.6 610 4.9 427 1.7 919 3.4
Hypopharynx 560 5.5 68 10.7 166 6.5 550 4.8 555 2.1 1519 5.3
1997–98 Lip 5 3.16 1 3.52 4 3.46 10 3.27 24 3.27 24 3.25Tongue 136 3.44 5 2.59 70 8.04 192 5.26 384 4.2 417 4.84Oral cavity 101 3.28 13 3.52 82 9.41 190 5.20 333 3.69 480 5.34Oropharynx 75 2.45 1 10.36 17 1.95 80 2.19 212 2.35 164 1.90Hypopharynx 171 5.55 20 0.00 50 5.74 167 4.57 193 2.14 362 4.20
Table 28. Oral cancer in Mumbai (1988–1992)
Age group Site of cancer
(years) Sex Lip Tongue Salivary gland Mouth
0–4 M · · 0.0 ·F 0.0 0.0 · 0.0
5–9 M 0.0 · · 0.0F · · · ·
10–14 M · · 0.0 ·F · · 0.1 ·
15–19 M · · · 0.1F · · · 0.0
20–24 M · 0.1 0.0 0.3F · 0.1 0.0 0.2
25–29 M · 0.3 0.3 0.4F · 0.4 0.1 0.4
30–34 M 0.1 0.9 0.2 1.4F 0.1 0.5 0.2 0.8
35–39 M 0.1 2.4 0.3 3.9F · 1.2 0.7 2.6
40–44 M 0.1 4.8 0.7 6.1F 0.1 2.2 0.4 5.1
45–49 M 0.7 9.6 0.6 12.3F 0.7 2.9 0.4 6.6
50–54 M 0.7 13.3 1.1 16.755–59 F 0.4 5.2 0.8 13.1
M 1.4 21.5 0.9 22.360–64 F 1.5 10.9 · 14.9
M 1.4 27.5 2.7 23.2F 1.7 9.6 1.4 21.3
65–69 M 1.1 38.2 5.7 32.5F 2.0 8.3 1.2 18.9
70–74 M 2.4 36.6 4.1 23.0F · 11.6 0.6 23.8
75+ M 3.2 45.0 1.9 30.4F 2.0 13.6 2.5 26.2
Note: Annual incidence per 100,000 by age groupSource: Parkin et al. Cancer incidence in five continents, Vol. Vll. Lyon: IARCScientific Publications No. 143; 1997
Table 29. Oral cancer in Chennai (1988–1992)
Age group Site of cancer
(years) Sex Lip Tongue Salivary gland Mouth
0–4 M · 0.1 · ·F · · 0.1 0.1
5–9 M · · · ·F · · · 0.1
15–19 M · 0.1 · ·F · · 0.2 0.2
20–24 M · 0.1 0.1 0.3F · 0.2 0.1 0.3
25–29 M · 0.3 0.2 0.2F · 0.3 0.3 0.4
30–34 M 0.3 2.0 0.3 0.4F · 0.2 0.5 2.2
35–39 M · 2.7 0.5 3.2F · 0.8 · 2.8
40–44 M 0.5 5.1 0.7 4.0F · 1.3 0.2 9.2
45–49 M 1.4 9.0 0.2 11.7F 0.5 3.2 1.0 10.3
50–54 M 1.1 15.3 0.5 20.9F 0.9 7.6 1.8 30.1
55–59 M 0.7 23.0 1.4 29.3F 1.3 7.3 1.3 29.2
60–64 M 2.6 25.9 1.3 34.2F 2.6 8.3 · 43.0
65–69 M 2.4 35.6 7.1 47.5F 3.0 8.3 0.8 37.5
70–74 M 1.0 23.7 2.1 22.7F 3.9 8.9 3.0 29.6
75+ M · 19.0 1.2 40.4F 3.2 6.5 1.1 29.2
Note: Annual incidence per 100,000 by age groupSource: Parkin et al. Cancer incidence in five continents, Vol. Vll. Lyon: IARCScientific Publications No. 143; 1997
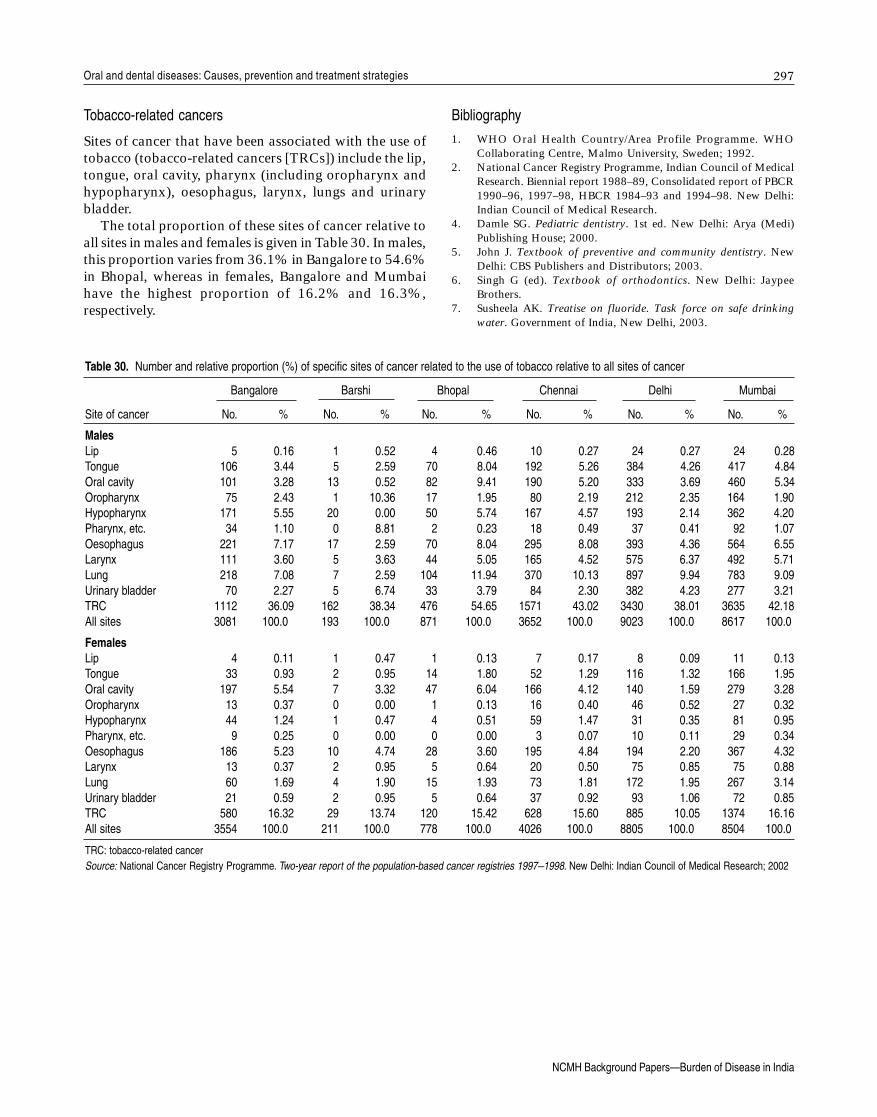
���
NCMH Background Papers·Burden of Disease in India
Oral and dental diseases: Causes, prevention and treatment strategies
Tobacco-related cancers
Sites of cancer that have been associated with the use oftobacco (tobacco-related cancers [TRCs]) include the lip,tongue, oral cavity, pharynx (including oropharynx andhypopharynx), oesophagus, larynx, lungs and urinarybladder.
The total proportion of these sites of cancer relative toall sites in males and females is given in Table 30. In males,this proportion varies from 36.1% in Bangalore to 54.6%in Bhopal, whereas in females, Bangalore and Mumbaihave the highest proportion of 16.2% and 16.3%,respectively.
Bibliography
1. WHO Oral Health Country/Area Profile Programme. WHOCollaborating Centre, Malmo University, Sweden; 1992.
2. National Cancer Registry Programme, Indian Council of MedicalResearch. Biennial report 1988–89, Consolidated report of PBCR1990–96, 1997–98, HBCR 1984–93 and 1994–98. New Delhi:Indian Council of Medical Research.
4. Damle SG. Pediatric dentistry. 1st ed. New Delhi: Arya (Medi)Publishing House; 2000.
5. John J. Textbook of preventive and community dentistry. NewDelhi: CBS Publishers and Distributors; 2003.
6. Singh G (ed). Textbook of orthodontics. New Delhi: JaypeeBrothers.
7. Susheela AK. Treatise on fluoride. Task force on safe drinkingwater. Government of India, New Delhi, 2003.
Table 30. Number and relative proportion (%) of specific sites of cancer related to the use of tobacco relative to all sites of cancer
Bangalore Barshi Bhopal Chennai Delhi Mumbai
Site of cancer No. % No. % No. % No. % No. % No. %
MalesLip 5 0.16 1 0.52 4 0.46 10 0.27 24 0.27 24 0.28Tongue 106 3.44 5 2.59 70 8.04 192 5.26 384 4.26 417 4.84Oral cavity 101 3.28 13 0.52 82 9.41 190 5.20 333 3.69 460 5.34Oropharynx 75 2.43 1 10.36 17 1.95 80 2.19 212 2.35 164 1.90Hypopharynx 171 5.55 20 0.00 50 5.74 167 4.57 193 2.14 362 4.20Pharynx, etc. 34 1.10 0 8.81 2 0.23 18 0.49 37 0.41 92 1.07Oesophagus 221 7.17 17 2.59 70 8.04 295 8.08 393 4.36 564 6.55Larynx 111 3.60 5 3.63 44 5.05 165 4.52 575 6.37 492 5.71Lung 218 7.08 7 2.59 104 11.94 370 10.13 897 9.94 783 9.09Urinary bladder 70 2.27 5 6.74 33 3.79 84 2.30 382 4.23 277 3.21TRC 1112 36.09 162 38.34 476 54.65 1571 43.02 3430 38.01 3635 42.18All sites 3081 100.0 193 100.0 871 100.0 3652 100.0 9023 100.0 8617 100.0
FemalesLip 4 0.11 1 0.47 1 0.13 7 0.17 8 0.09 11 0.13Tongue 33 0.93 2 0.95 14 1.80 52 1.29 116 1.32 166 1.95Oral cavity 197 5.54 7 3.32 47 6.04 166 4.12 140 1.59 279 3.28Oropharynx 13 0.37 0 0.00 1 0.13 16 0.40 46 0.52 27 0.32Hypopharynx 44 1.24 1 0.47 4 0.51 59 1.47 31 0.35 81 0.95Pharynx, etc. 9 0.25 0 0.00 0 0.00 3 0.07 10 0.11 29 0.34Oesophagus 186 5.23 10 4.74 28 3.60 195 4.84 194 2.20 367 4.32Larynx 13 0.37 2 0.95 5 0.64 20 0.50 75 0.85 75 0.88Lung 60 1.69 4 1.90 15 1.93 73 1.81 172 1.95 267 3.14Urinary bladder 21 0.59 2 0.95 5 0.64 37 0.92 93 1.06 72 0.85TRC 580 16.32 29 13.74 120 15.42 628 15.60 885 10.05 1374 16.16All sites 3554 100.0 211 100.0 778 100.0 4026 100.0 8805 100.0 8504 100.0
TRC: tobacco-related cancerSource: National Cancer Registry Programme. Two-year report of the population-based cancer registries 1997–1998. New Delhi: Indian Council of Medical Research; 2002
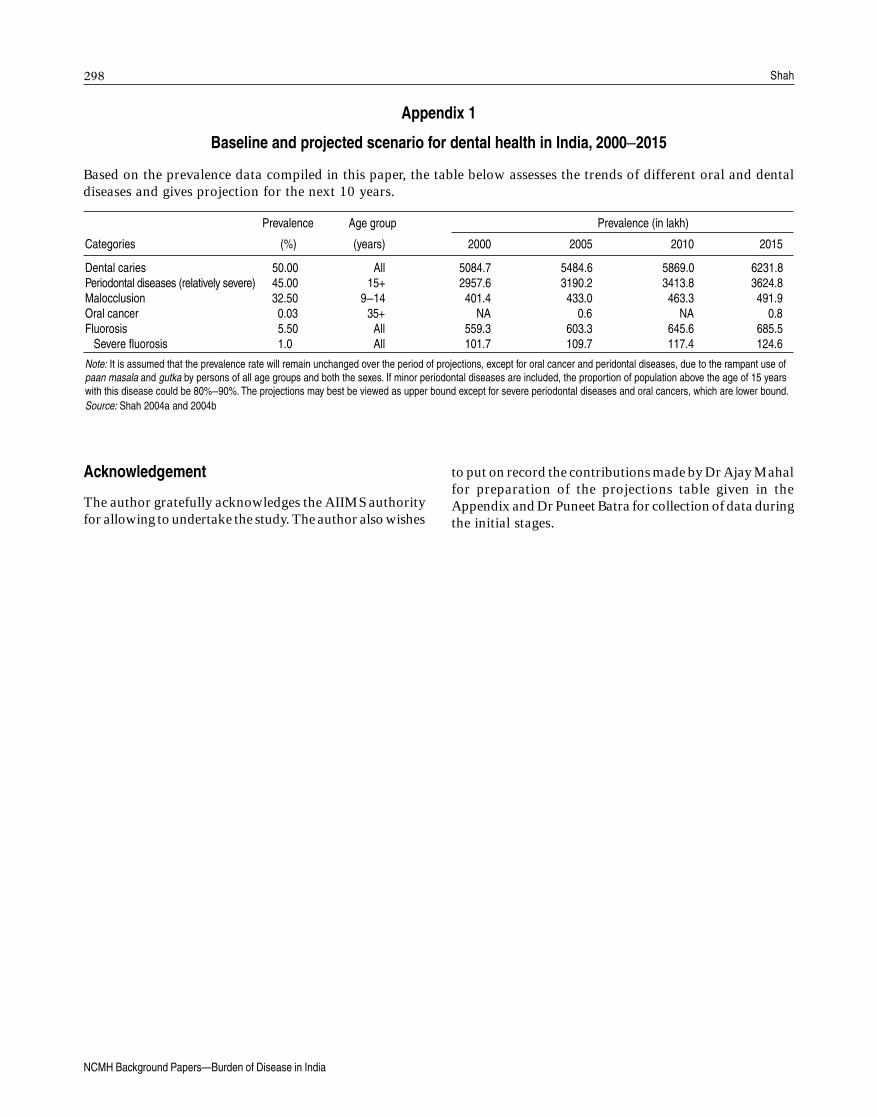
���
NCMH Background Papers·Burden of Disease in India
Shah
Acknowledgement
The author gratefully acknowledges the AIIMS authorityfor allowing to undertake the study. The author also wishes
to put on record the contributions made by Dr Ajay Mahalfor preparation of the projections table given in theAppendix and Dr Puneet Batra for collection of data duringthe initial stages.
Prevalence Age group Prevalence (in lakh)
Categories (%) (years) 2000 2005 2010 2015
Dental caries 50.00 All 5084.7 5484.6 5869.0 6231.8Periodontal diseases (relatively severe) 45.00 15+ 2957.6 3190.2 3413.8 3624.8Malocclusion 32.50 9–14 401.4 433.0 463.3 491.9Oral cancer 0.03 35+ NA 0.6 NA 0.8Fluorosis 5.50 All 559.3 603.3 645.6 685.5 Severe fluorosis 1.0 All 101.7 109.7 117.4 124.6
Note: It is assumed that the prevalence rate will remain unchanged over the period of projections, except for oral cancer and peridontal diseases, due to the rampant use ofpaan masala and gutka by persons of all age groups and both the sexes. If minor periodontal diseases are included, the proportion of population above the age of 15 yearswith this disease could be 80%–90%. The projections may best be viewed as upper bound except for severe periodontal diseases and oral cancers, which are lower bound.Source: Shah 2004a and 2004b
Appendix 1
Baseline and projected scenario for dental health in India, 2000–2015
Based on the prevalence data compiled in this paper, the table below assesses the trends of different oral and dentaldiseases and gives projection for the next 10 years.