Oracle9i Performance Tuning Chapter 12 Tuning Tools.
34
Oracle9 Oracle9 i i Performance Tuning Performance Tuning Chapter 12 Chapter 12 Tuning Tools Tuning Tools
-
Upload
leo-walters -
Category
Documents
-
view
258 -
download
3
Transcript of Oracle9i Performance Tuning Chapter 12 Tuning Tools.
Oracle9Oracle9ii Performance TuningPerformance Tuning
Chapter 12Chapter 12
Tuning ToolsTuning Tools
Chapter 12: Tuning Tools 2
Chapter ObjectivesChapter Objectives• Understand and use the four basic diagnostic tools
supplied with Oracle9i• Use statistical tools to diagnose and tune a database• Understand and use SQL tools• Use data block corruption tools• Use the resource management tools to regulate and
distribute resource usage based on priorities
Chapter 12: Tuning Tools 3
Tuning Tools CategoriesTuning Tools Categories• The following are the functional categories of the
Oracle-provided tuning tools:• Diagnostics: diagnose problems and performance issues
• Statistics: collect statistical data to determine the health of the database and perform trend analysis
• SQL: identify problematic queries
• Data block corruption: detect data block corruption in data files as well as database objects
• Analysis: gather object storage statistics• Resource management: distribute CPU allocation to database
users based on planned priorities
Chapter 12: Tuning Tools 4
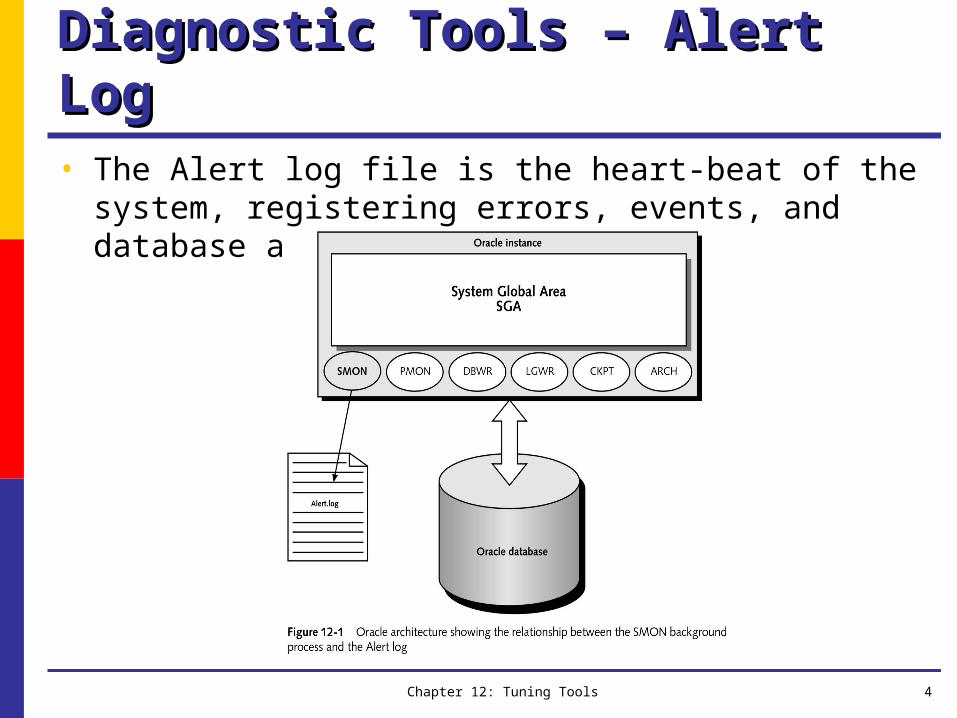
Diagnostic Tools – Alert LogDiagnostic Tools – Alert Log• The Alert log file is the heart-beat of the system, registering
errors, events, and database activities
Chapter 12: Tuning Tools 5
Contents of the Alert LogContents of the Alert Log
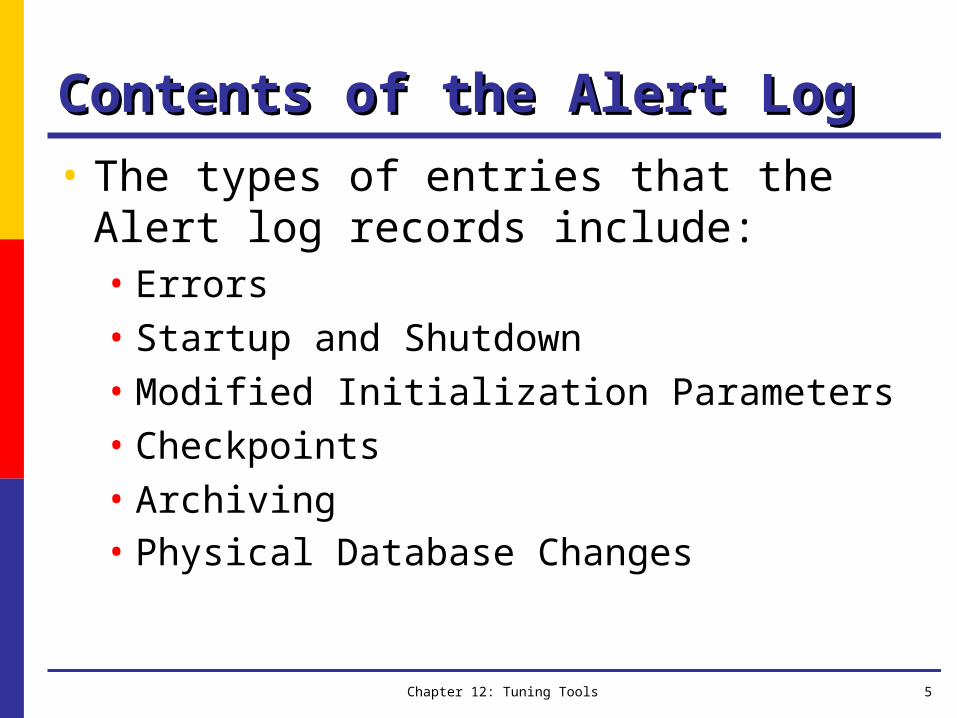
• The types of entries that the Alert log records include:• Errors• Startup and Shutdown• Modified Initialization Parameters• Checkpoints• Archiving• Physical Database Changes
Chapter 12: Tuning Tools 6
Diagnostic Tool – Background Trace Diagnostic Tool – Background Trace FilesFiles
• Each time a background process fails, an error is generated to the Alert log and a trace file is generated
• Since these trace files are usually difficult to interpret, you should work with the Oracle Technical Support team to identify the type of problem, its cause, and action necessary to resolve the problem or prevent it from occurring again
Chapter 12: Tuning Tools 7
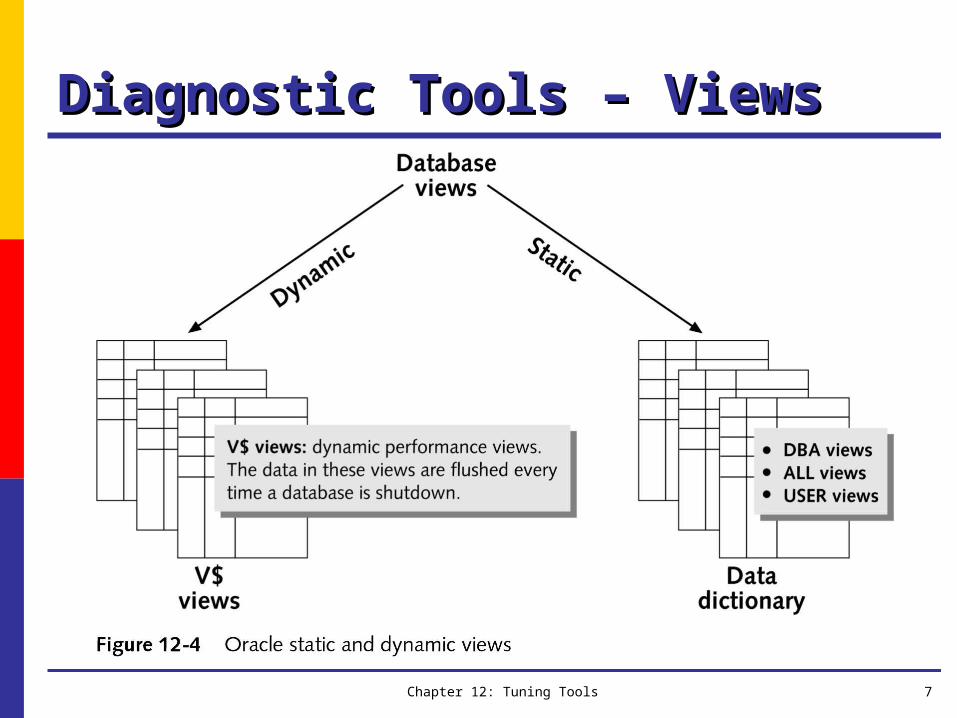
Diagnostic Tools – Views Diagnostic Tools – Views
Chapter 12: Tuning Tools 8
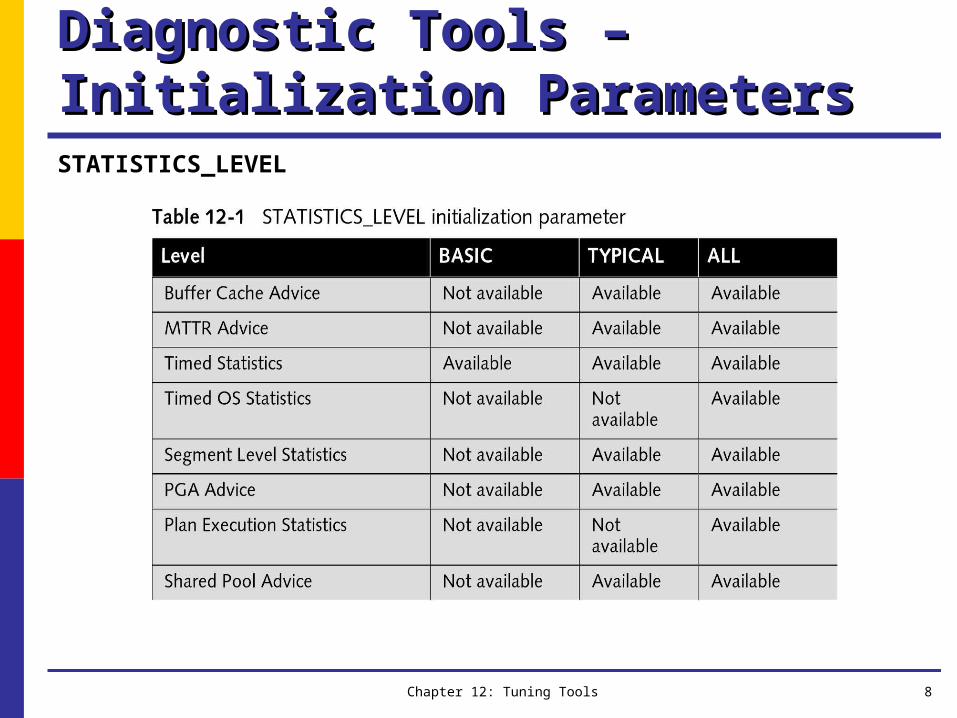
Diagnostic Tools – Initialization Diagnostic Tools – Initialization ParametersParametersSTATISTICS_LEVEL
Chapter 12: Tuning Tools 9
Diagnostic Tools – Initialization Diagnostic Tools – Initialization Parameters Parameters (continued)(continued)
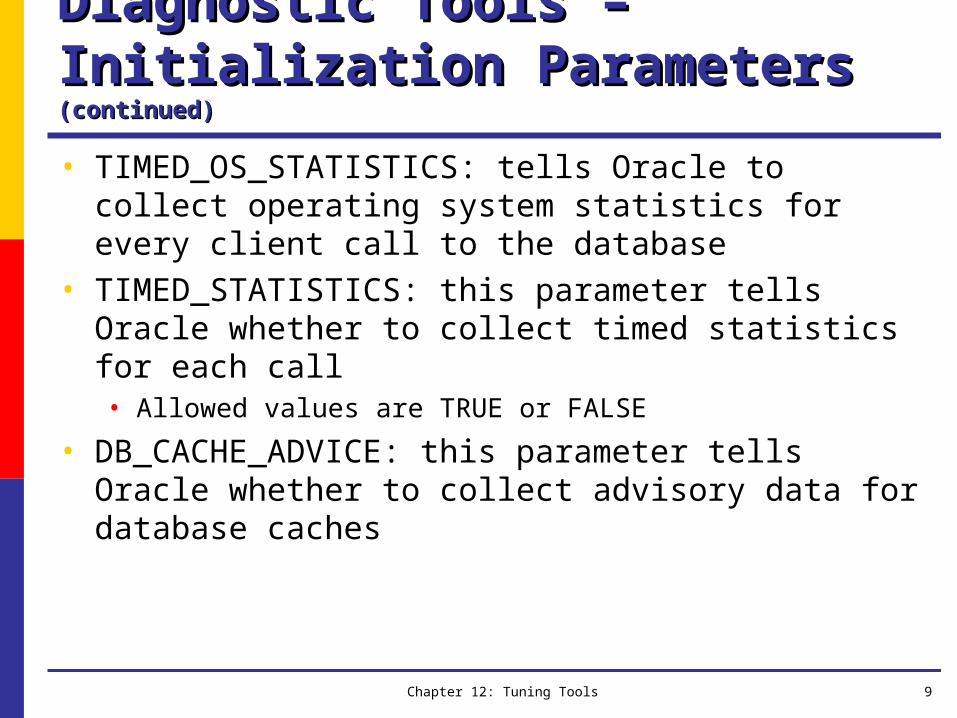
• TIMED_OS_STATISTICS: tells Oracle to collect operating system statistics for every client call to the database
• TIMED_STATISTICS: this parameter tells Oracle whether to collect timed statistics for each call• Allowed values are TRUE or FALSE
• DB_CACHE_ADVICE: this parameter tells Oracle whether to collect advisory data for database caches
Chapter 12: Tuning Tools 10
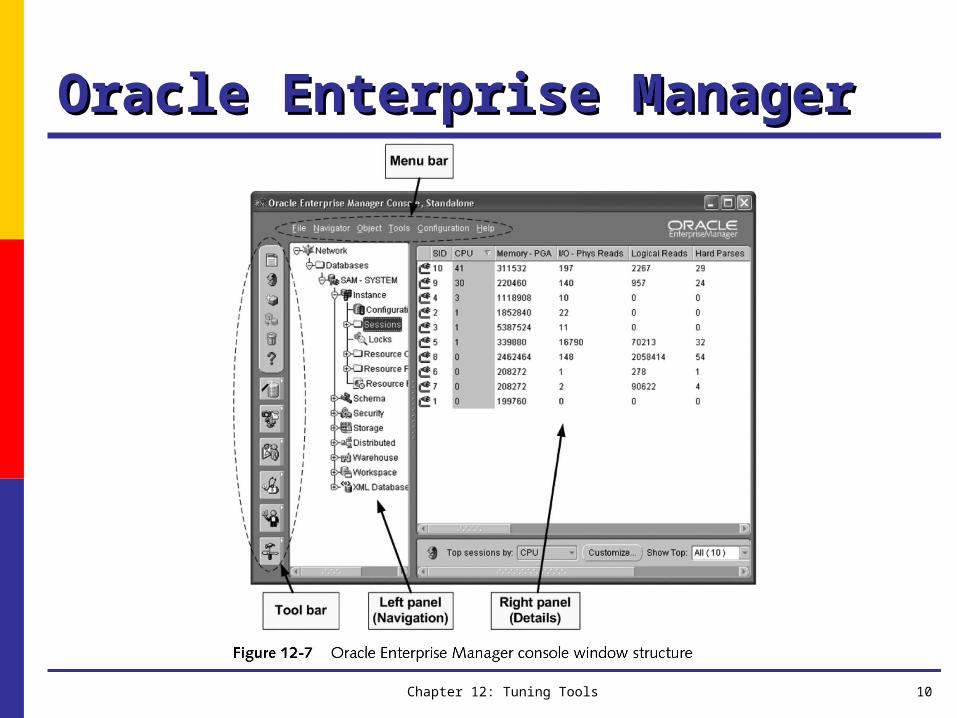
Oracle Enterprise ManagerOracle Enterprise Manager
Chapter 12: Tuning Tools 11
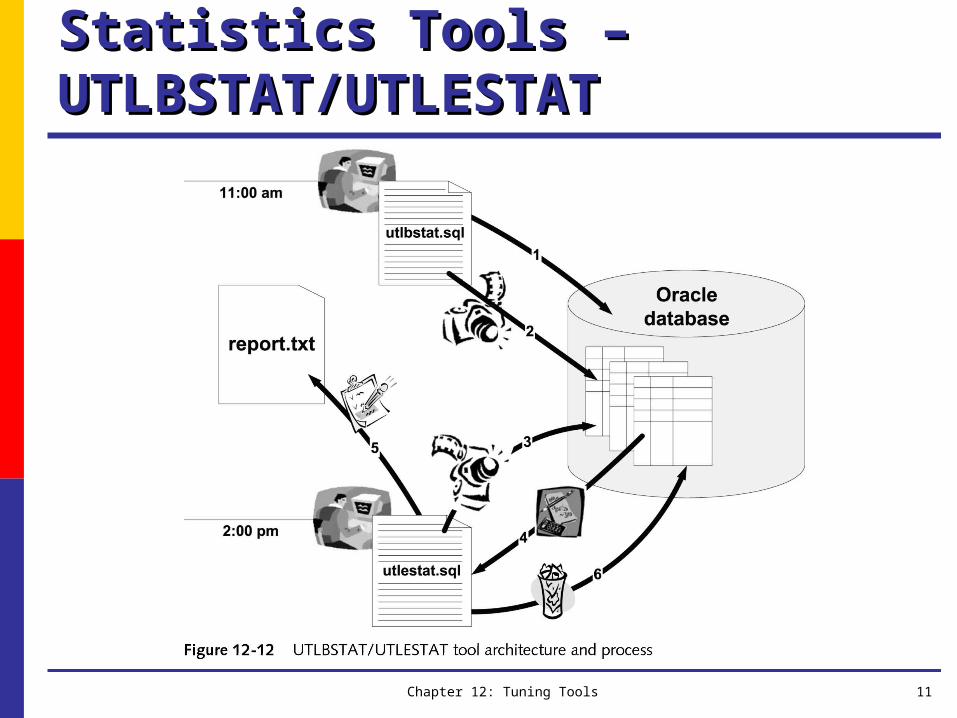
Statistics Tools – Statistics Tools – UTLBSTAT/UTLESTATUTLBSTAT/UTLESTAT
Chapter 12: Tuning Tools 12
UTLBSTAT/UTLESTAT: report.txtUTLBSTAT/UTLESTAT: report.txt• The report includes statistical readings in this specific order:
• Library cache
• Sessions and users
• System statistics
• System events
• Wait events
• Latch statistics
• Rollback segments statistics
• Modified initialization parameters
• Data dictionary
• Tablespace statistics
• Data files statistics
Chapter 12: Tuning Tools 13
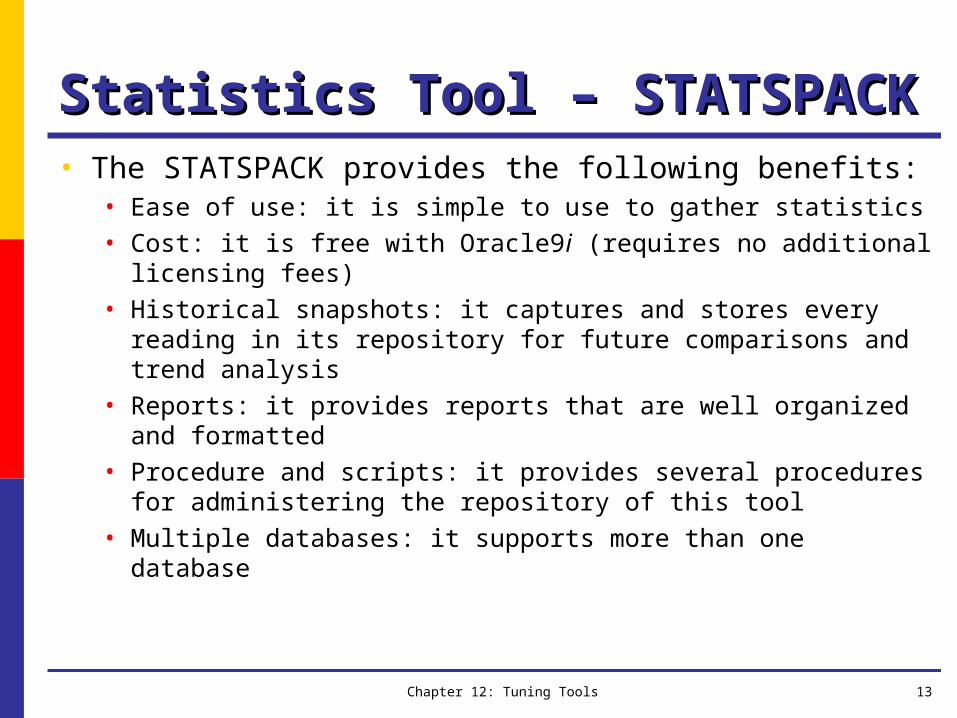
Statistics Tool – STATSPACKStatistics Tool – STATSPACK• The STATSPACK provides the following benefits:
• Ease of use: it is simple to use to gather statistics
• Cost: it is free with Oracle9i (requires no additional licensing fees)
• Historical snapshots: it captures and stores every reading in its repository for future comparisons and trend analysis
• Reports: it provides reports that are well organized and formatted
• Procedure and scripts: it provides several procedures for administering the repository of this tool
• Multiple databases: it supports more than one database
Chapter 12: Tuning Tools 14
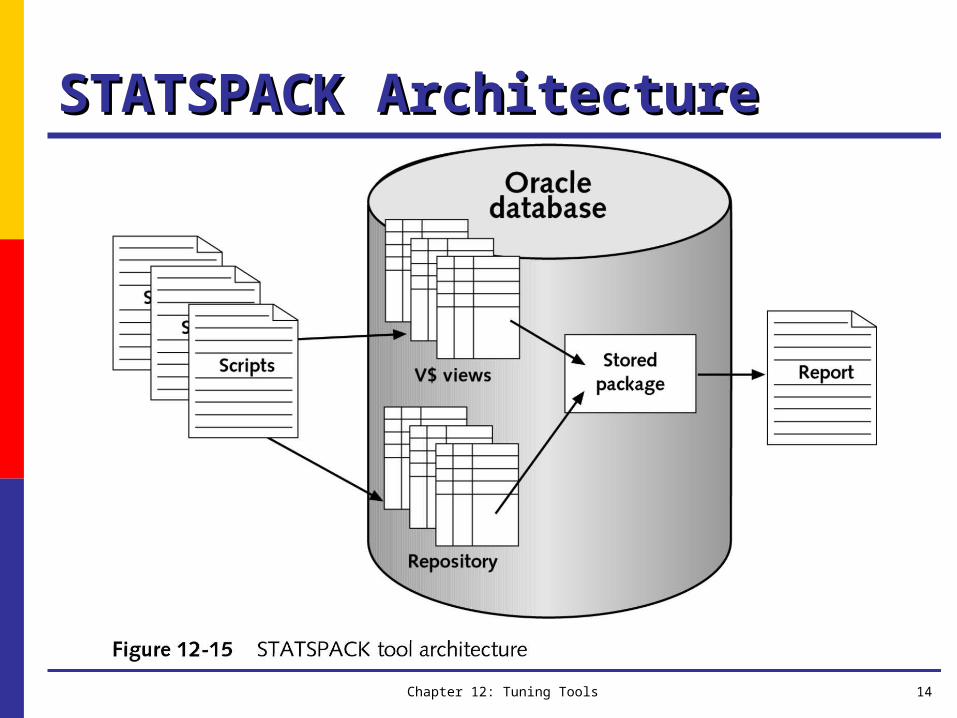
STATSPACK ArchitectureSTATSPACK Architecture
Chapter 12: Tuning Tools 15
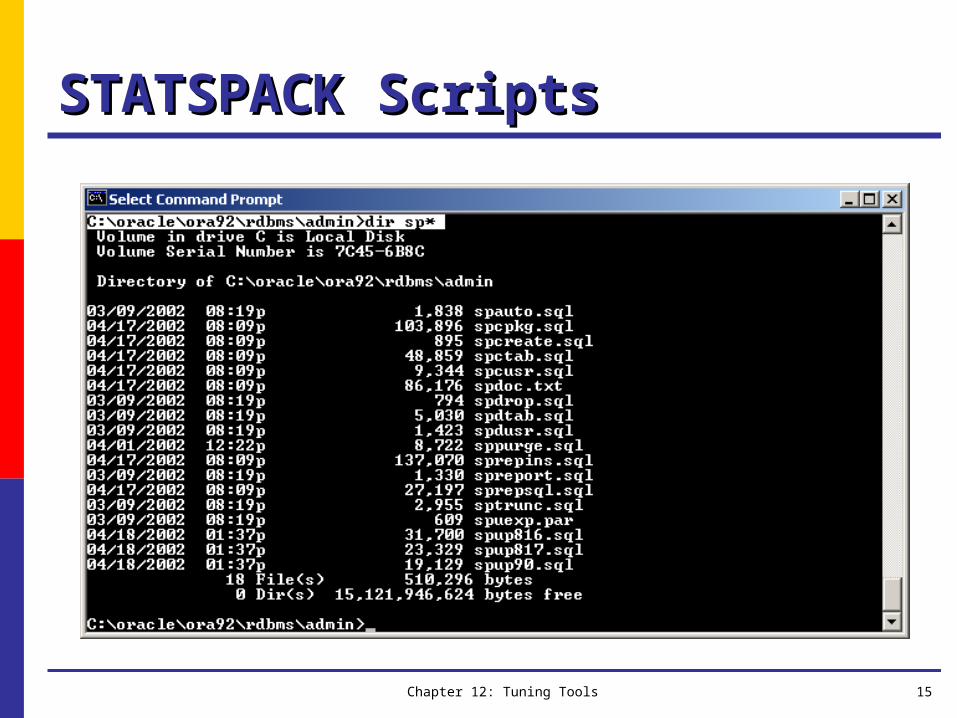
STATSPACK ScriptsSTATSPACK Scripts
Chapter 12: Tuning Tools 16
STATSPACK PL/SQL Stored STATSPACK PL/SQL Stored Package Package • The STATSPACK package is the engine of this tool• This package contains the following five methods:
• PROCEDURE MODIFY_STATSPACK_PARAMETER: modifies the thresholds of parameters (reconfigures STATSPACK hit ratios and other parameters’ thresholds)
• PROCEDURE QAM_STATSPACK_PARAMETER: provides the parameter default values from the STATS$STATSPACK_PARAMETER table
• PROCEDURE SNAP: collects a statistics snapshot of the database; the collected statistics are stored in the repository and associated with a snapshot identification number
• FUNCTION SNAP RETURNS NUMBER(38): collects a statistics snapshot of the database; the collected statistics are stored in the repository and associated with a snapshot identification number, which is returned to the calling environment
• PROCEDURE STAT_CHANGES: used by the SPREPORT.SQL script to return differences between two statistics snapshots
Chapter 12: Tuning Tools 17
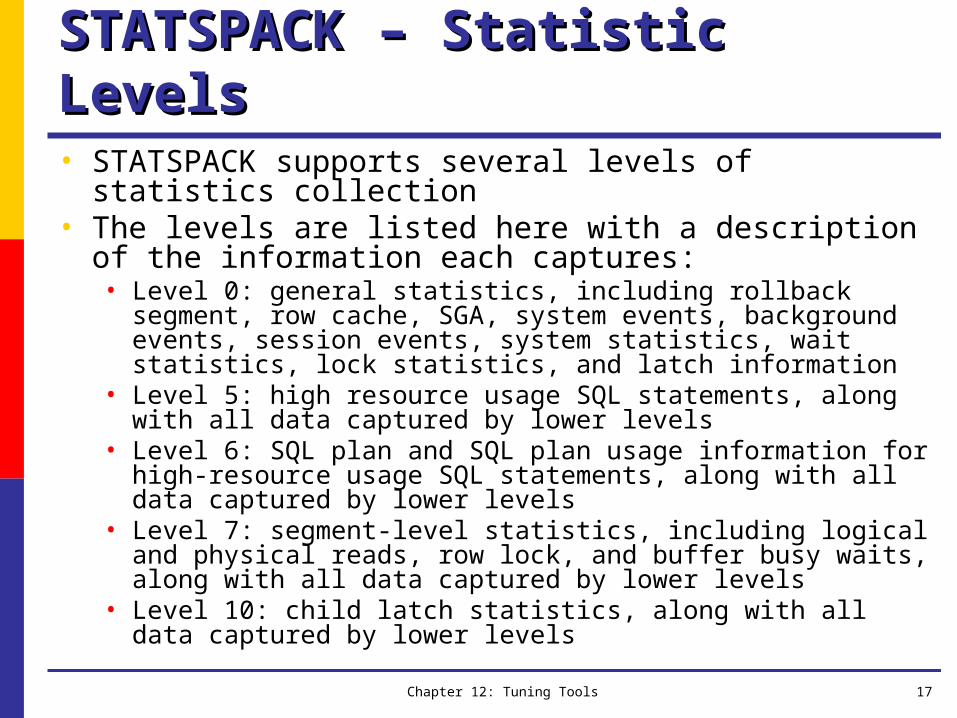
STATSPACK – Statistic LevelsSTATSPACK – Statistic Levels• STATSPACK supports several levels of statistics collection• The levels are listed here with a description of the information
each captures:• Level 0: general statistics, including rollback segment, row cache, SGA,
system events, background events, session events, system statistics, wait statistics, lock statistics, and latch information
• Level 5: high resource usage SQL statements, along with all data captured by lower levels
• Level 6: SQL plan and SQL plan usage information for high-resource usage SQL statements, along with all data captured by lower levels
• Level 7: segment-level statistics, including logical and physical reads, row lock, and buffer busy waits, along with all data captured by lower levels
• Level 10: child latch statistics, along with all data captured by lower levels
Chapter 12: Tuning Tools 18
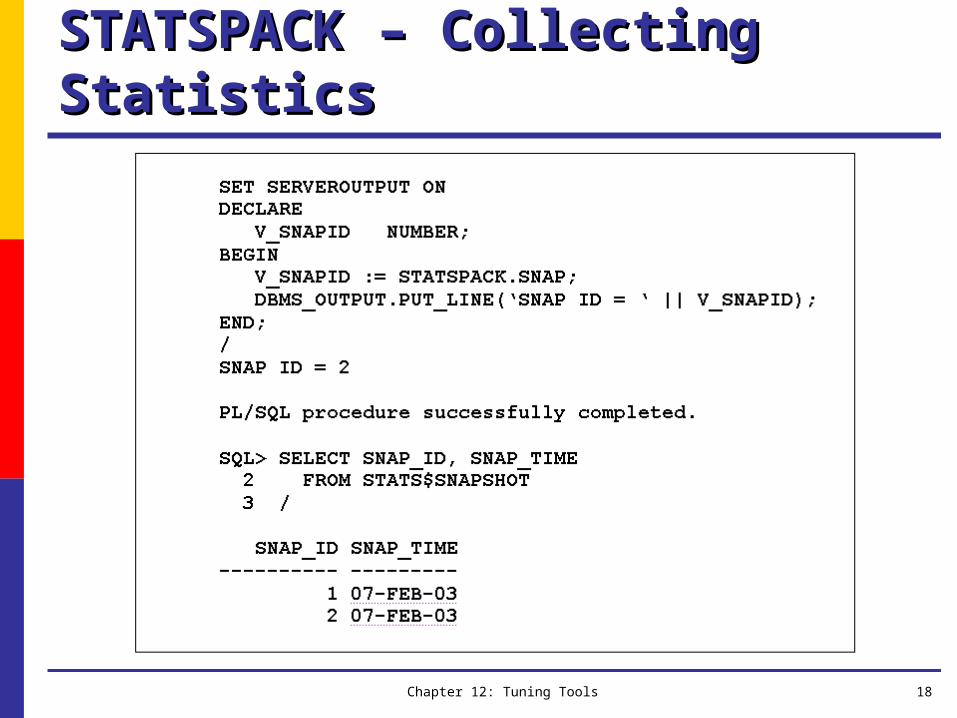
STATSPACK – Collecting StatisticsSTATSPACK – Collecting Statistics
Chapter 12: Tuning Tools 19
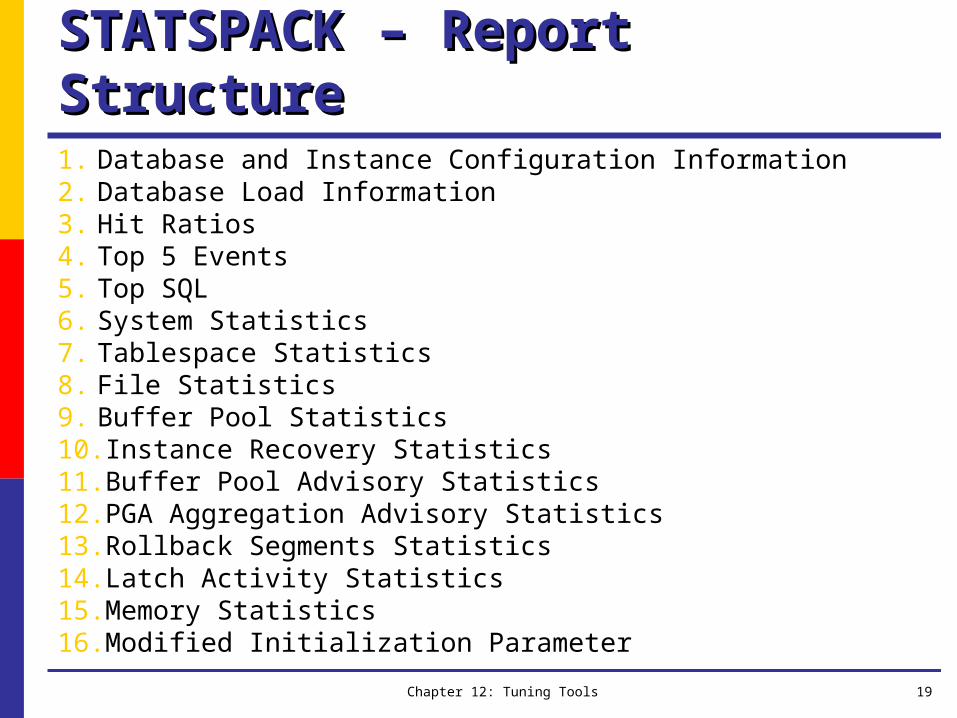
STATSPACK – Report StructureSTATSPACK – Report Structure1. Database and Instance Configuration Information 2. Database Load Information3. Hit Ratios4. Top 5 Events5. Top SQL 6. System Statistics7. Tablespace Statistics8. File Statistics9. Buffer Pool Statistics10. Instance Recovery Statistics11. Buffer Pool Advisory Statistics 12. PGA Aggregation Advisory Statistics13. Rollback Segments Statistics14. Latch Activity Statistics15. Memory Statistics16. Modified Initialization Parameter
Chapter 12: Tuning Tools 20
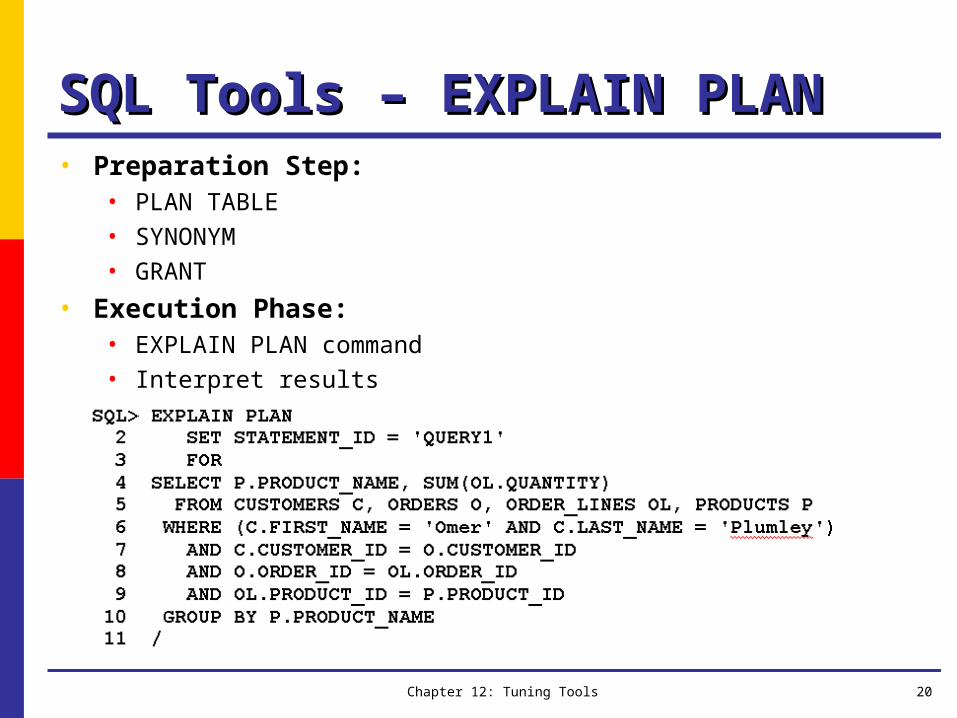
SQL Tools – EXPLAIN PLANSQL Tools – EXPLAIN PLAN• Preparation Step:
• PLAN TABLE
• SYNONYM
• GRANT
• Execution Phase:• EXPLAIN PLAN command
• Interpret results

Chapter 12: Tuning Tools 21
SQL Tools – EXPLAIN PLAN SQL Tools – EXPLAIN PLAN (continued)(continued) • Use your own SELECT statement to retrieve execution plan
• Use DBMS_XPLAN
Chapter 12: Tuning Tools 22
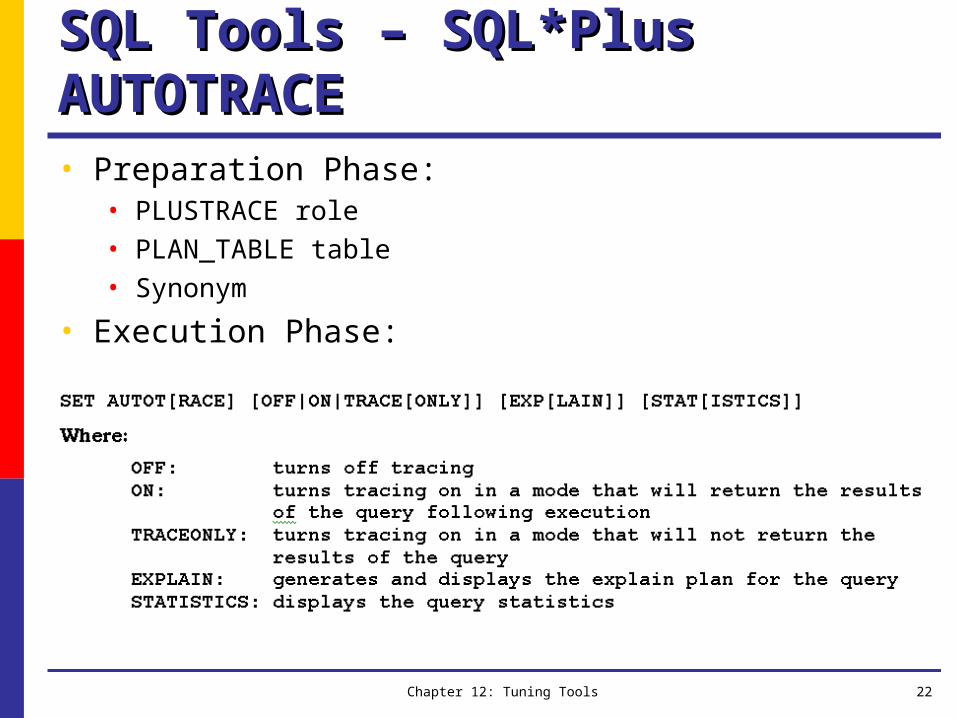
SQL Tools – SQL*Plus SQL Tools – SQL*Plus AUTOTRACEAUTOTRACE• Preparation Phase:
• PLUSTRACE role
• PLAN_TABLE table
• Synonym
• Execution Phase:
Chapter 12: Tuning Tools 23
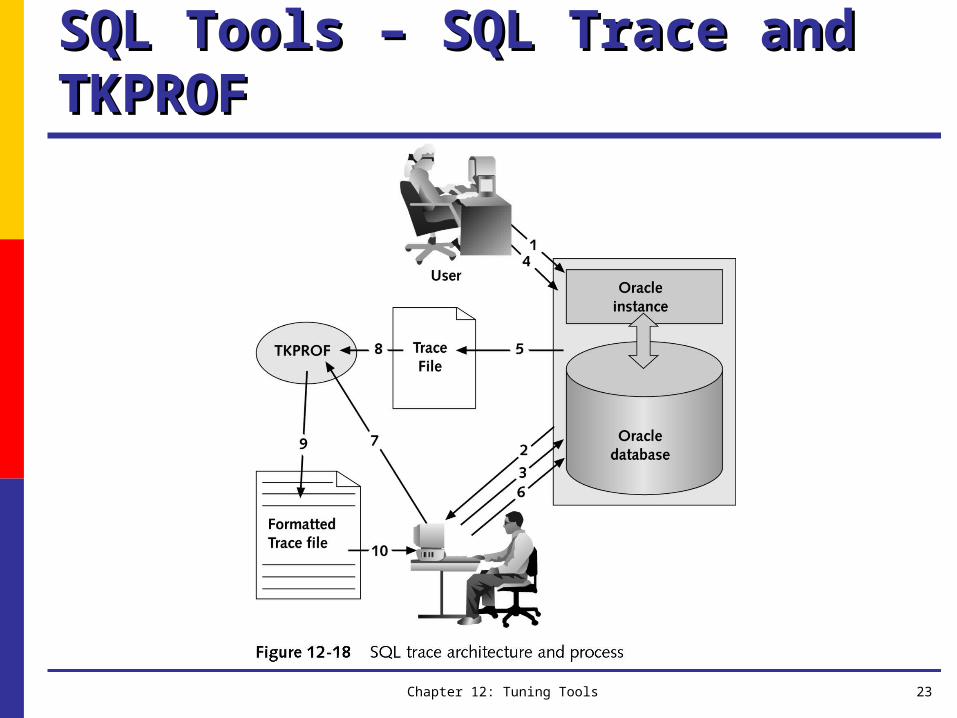
SQL Tools – SQL Trace and SQL Tools – SQL Trace and TKPROFTKPROF
Chapter 12: Tuning Tools 24
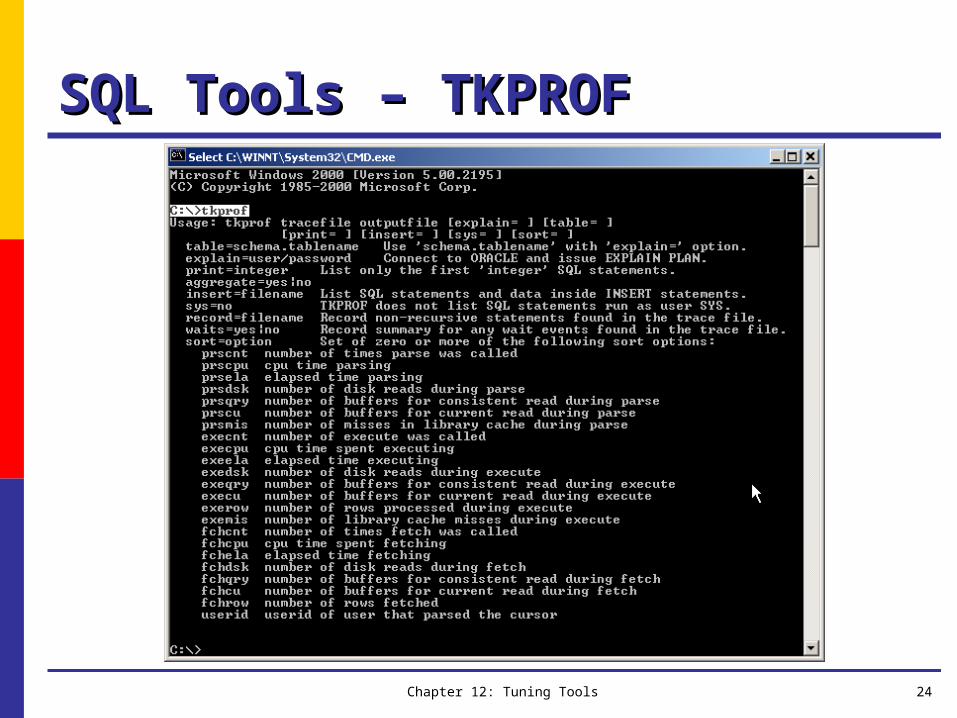
SQL Tools – TKPROFSQL Tools – TKPROF
Chapter 12: Tuning Tools 25
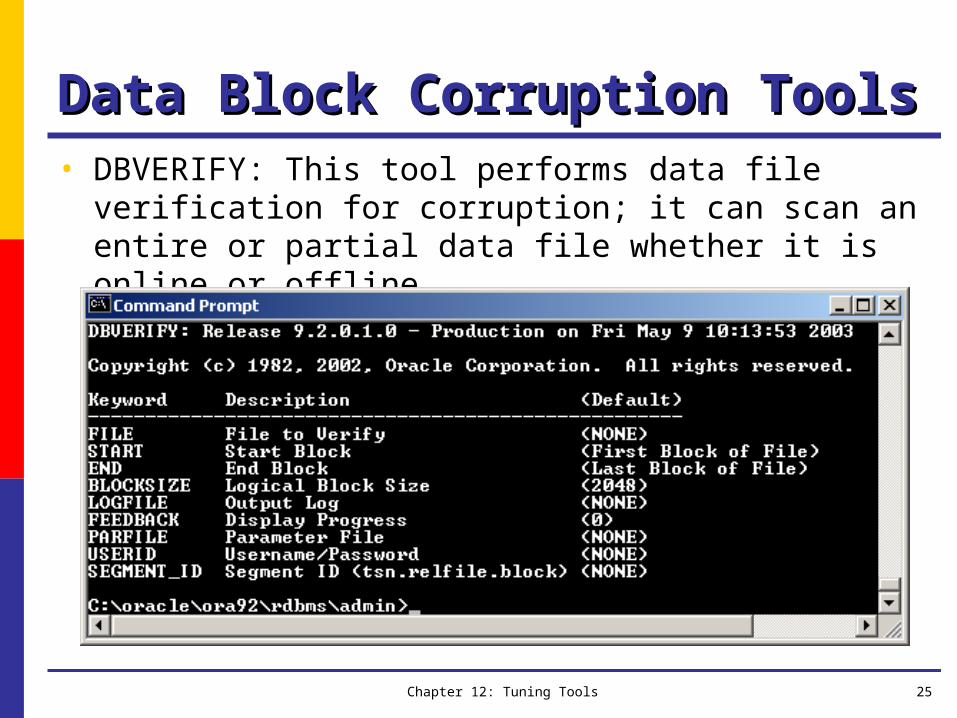
Data Block Corruption Tools Data Block Corruption Tools • DBVERIFY: This tool performs data file verification for
corruption; it can scan an entire or partial data file whether it is online or offline
Chapter 12: Tuning Tools 26
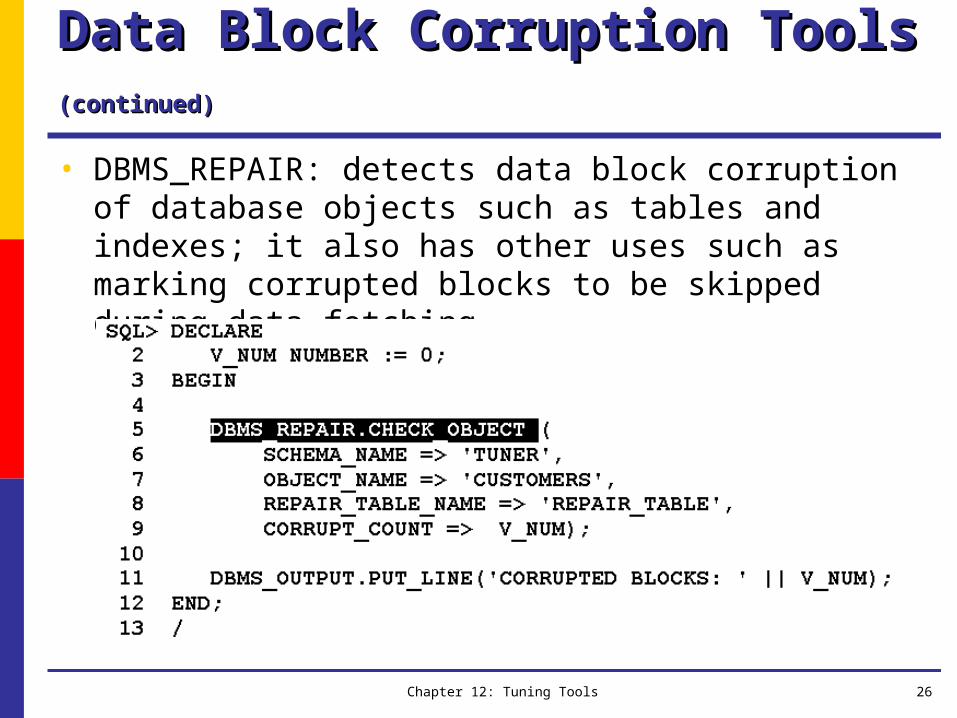
Data Block Corruption Tools Data Block Corruption Tools (continued)(continued) • DBMS_REPAIR: detects data block corruption of database
objects such as tables and indexes; it also has other uses such as marking corrupted blocks to be skipped during data fetching
Chapter 12: Tuning Tools 27
Analyze Tools Analyze Tools
• Analyze tools include:• ANALYZE command• DBMS_UTILITY• DBMS_STATS• DBMS_DDL• Oracle Enterprise Manager
Chapter 12: Tuning Tools 28
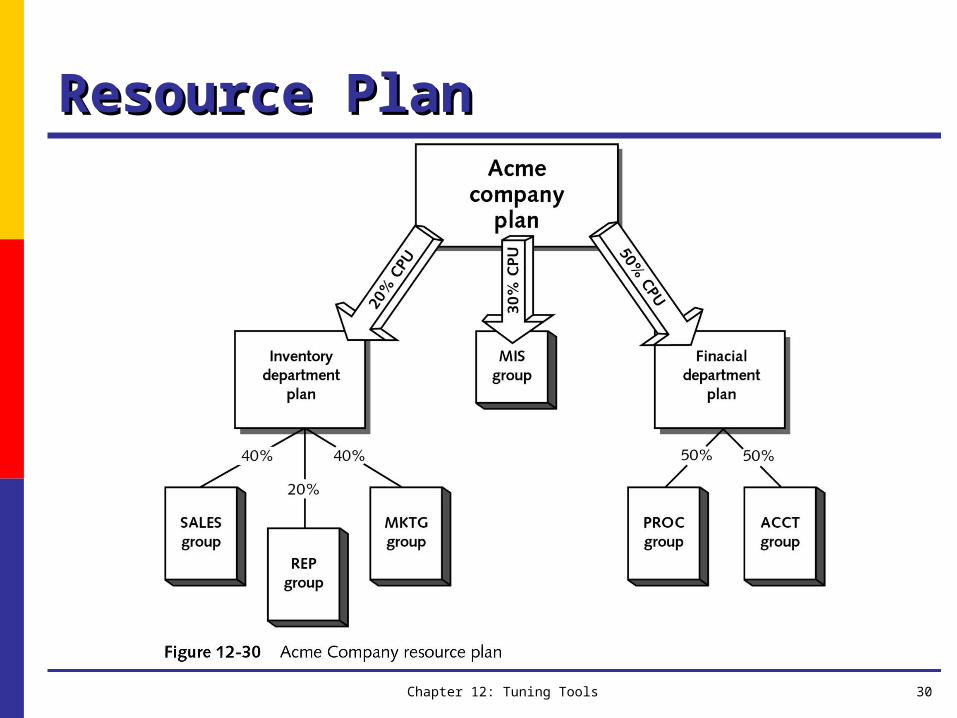
Resource Management ToolResource Management Tool• The Database Resource Manager empowers the DBA to
categorize users and application proxy users who are using the database into different categories which are referred to as resource consumer groups and to allocate a percentage of CPU usage based on user priorities
• The Database Resource Manager provides the following benefits:• Transfers the control of CPU resources from the operating system to the database
and thus to the DBA• Distributes CPU resources among users based on need and priority• Allocates degree of parallelism to different groups based on need• Prevents certain users from sporadically impacting applications that need CPU
resources• Allows DBAs to switch priority of CPU usage for users at any time• Gives the DBA control of the amount of undo space for each consumer group
Chapter 12: Tuning Tools 29
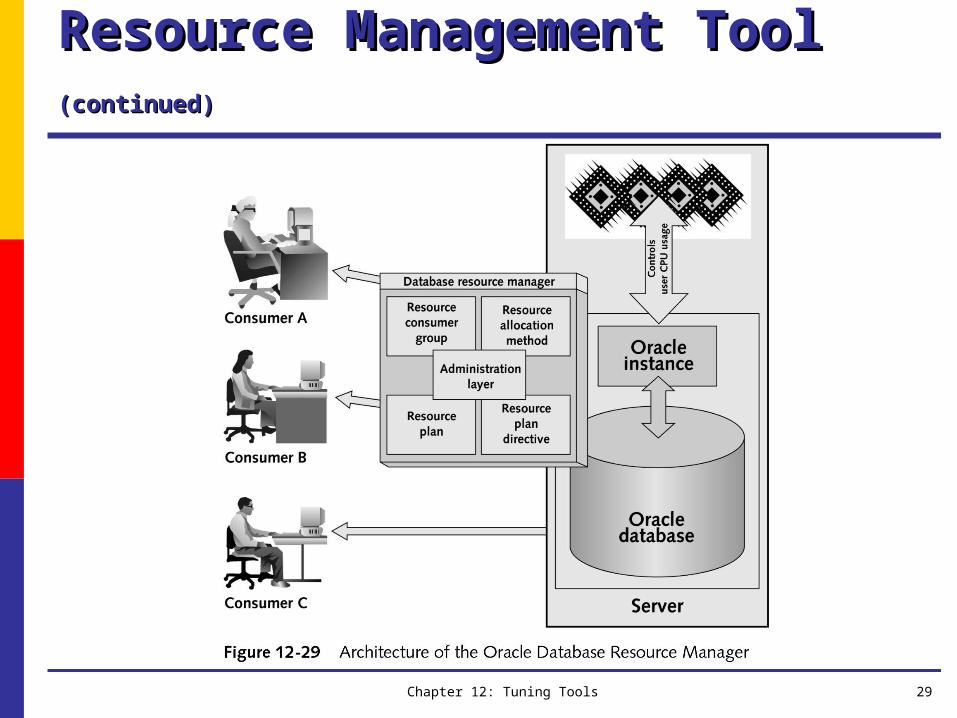
Resource Management Tool Resource Management Tool (continued)(continued)
Chapter 12: Tuning Tools 30
Resource PlanResource Plan
Chapter 12: Tuning Tools 31
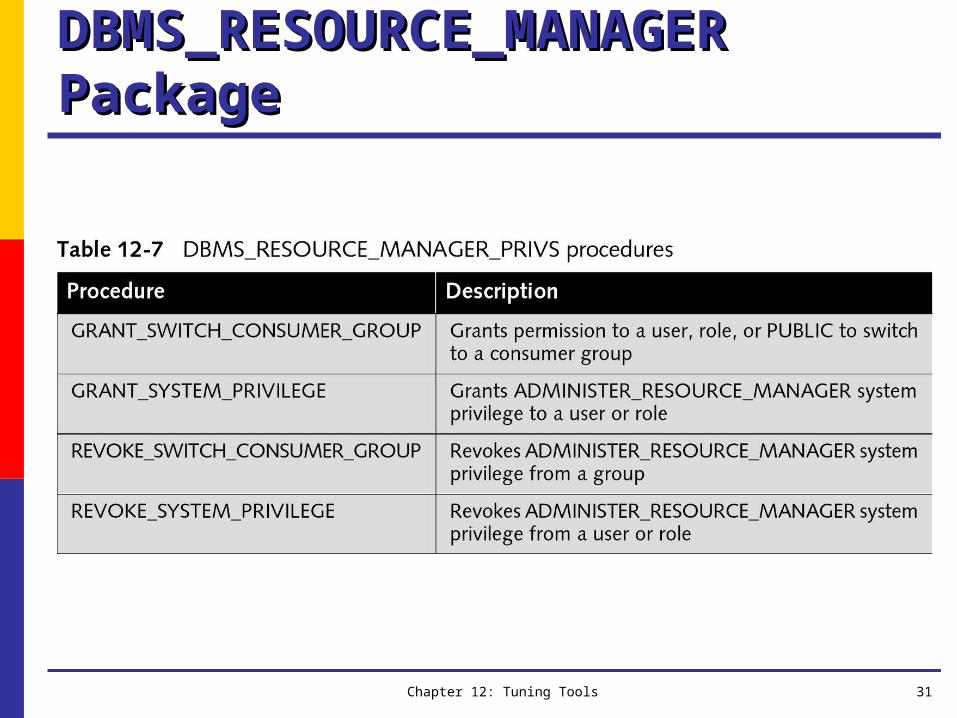
DBMS_RESOURCE_MANAGER DBMS_RESOURCE_MANAGER PackagePackage
Chapter 12: Tuning Tools 32
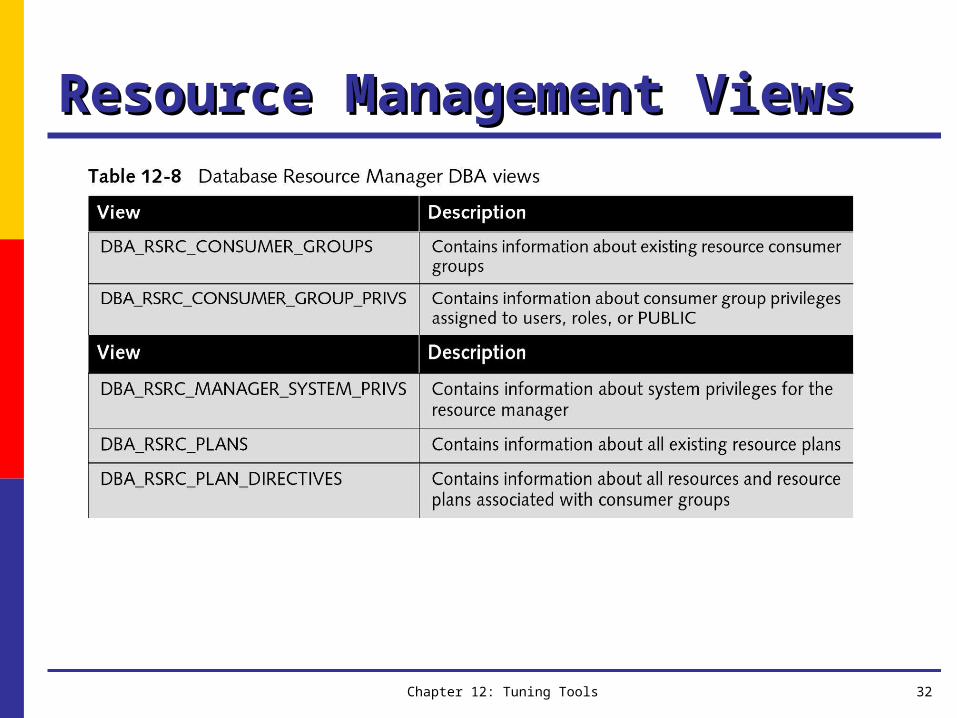
Resource Management ViewsResource Management Views
Chapter 12: Tuning Tools 33
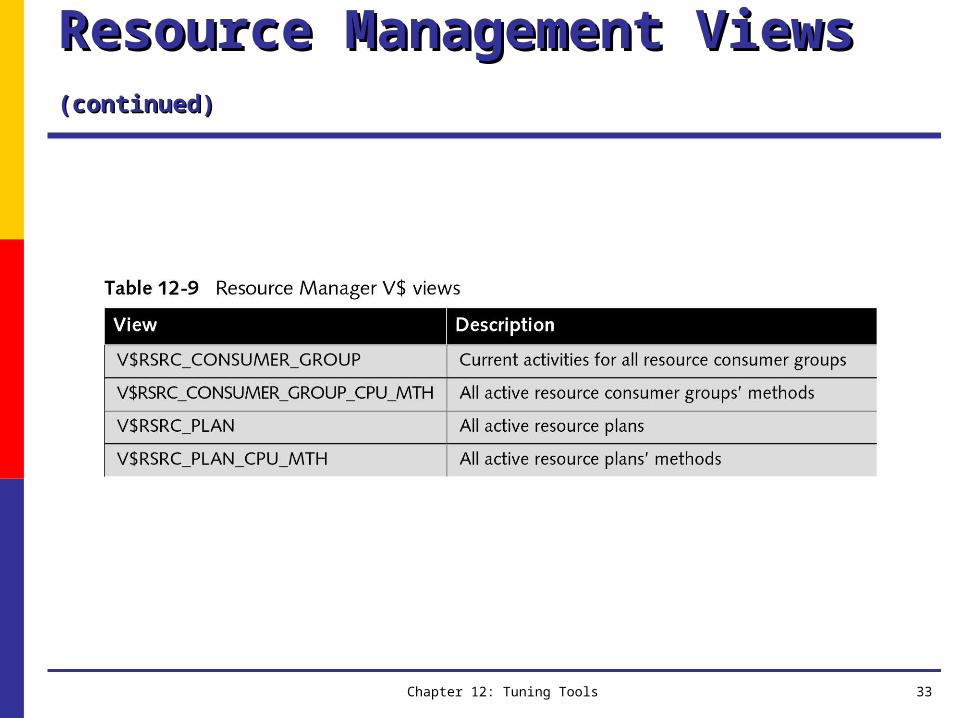
Resource Management Views Resource Management Views (continued)(continued)
Chapter 12: Tuning Tools 34
SummarySummary• The Alert log file is the heart beat of the system, registering
errors, events, and database activities• Each time a background process fails, an error is generated to the
Alert log and a trace file is generated• STATSPACK was developed to replace
UTLBSTAT/UTLESTAT• STATSPACK is an enhanced tool for collecting statistics that
help you diagnose and troubleshoot database performance• The Database Resource Manager distributes CPU and other
resources to users based on priorities set by the DBA