Oracle Maximum Availability Architecture White Paper · repeatable, and stable KPI analysis to...
59
Key Performance Indicators and Testing for Oracle Fusion Middleware 12c High Availability Oracle Maximum Availability Architecture White Paper ORACLE WHITE PAPER | JUNE 2018
Transcript of Oracle Maximum Availability Architecture White Paper · repeatable, and stable KPI analysis to...

Key Performance Indicators and Testing for Oracle Fusion Middleware 12c High Availability Oracle Maximum Availability Architecture White Paper O R A C L E W H I T E P A P E R | J U N E 2 0 1 8

Table of Contents
Executive Overview 1
Introduction 2
Overview 3
Concepts 3
Key Performance Indicators 3
Service Level Agreements 3
Fault Scenarios and Test Cases 4
Functional and Load Test Cases and Scripts 4
Testing Process 4
Why High Availability Fault Case Scenario Testing is Important 5
Just-in-Time Pre-Launch Testing 5
Quality Engineering Methodology 5
Post Launch 5
Oracle Fusion Middleware Maximum Availability Architecture 6
Oracle MAA FMW Enterprise Deployment Reference Architecture Topology 6
Highlights of the Reference Architecture Topology 6
Key Performance Indicator Metrics and Instrumentation 8
Choosing Appropriate Metrics as KPIs 8
Instrumentation Options 9
Recommended Basic HA-Related Metrics 11
Fault Case Scenarios 13
Anatomy of a Fault Case Scenario 13

Testing for High-Availability and Fault Tolerance 14
Testing Process Design 14
Comparing Fault Case Scenario Testing and Scalability Testing 15
Deciding What to Test and When 15
Data Acquisition 16
Client Data Acquisition 17
Web Tier Data Acquisition 17
Oracle HTTP Server Access Log Parsing 17
Application Tier Data Acquisition 17
WebLogic Access Log Parsing 17
WebLogic Diagnostic Framework and MBeans 18
Configuring WebLogic Diagnostic Framework (WLDF) and the Data Harvester 18
Exporting Harvested WebLogic Server Data 18
Test Results Analysis and Reporting 18
Case Study - Oracle Fusion Middleware HA Fault Testing 20
Summary 20
Initial Requirements and Assertions 20
Lessons Learned 20
Scope 21
Phase 1 21
Phase 2 22
Phase 3 (Future Testing) 23
Fault Scenarios Tested 24

Result Summary 25
Results: Web Tier Fault Testing 25
Analysis: Service Interruption and Load Balancer Monitoring Enhancements 26
Results: Application Tier - Web Services Manager – Policy Manager 30
Analysis: Session Persistence 30
Results: Application Tier - SOA – Web Service with JMS Messaging 33
Analysis: JMS Messaging 33
Analysis: User-facing Errors during WLS Fault Recovery 35
Analysis: Transaction Processing – DB2-1 Database Host Crash 36
Analysis: Effect of Tuning DB CSS Misscount Value 37
Results: WebCenter Portal Activities with SSO Login 39
Analysis: Performance Lag and Service Interruptions 39
On-Going Operational Monitoring & SLA Compliance Validation 43
Using Test Data as Baseline Data for Fault Recovery Maintenance Timings 43
Informing DR Switch-Over Decisions 43
Recommendations for SLA Compliance Validation Monitoring 44
Appendix A: Detailed Fault Case Test Plans 45
Oracle HTTP Server Fault Cases 45
Fault Case ID OHS1-1: Planned OHS Shutdown 45
Fault Case ID OHS1-2: Unplanned OHS Shutdown 45
Fault Case ID OHS2-1: OHS Host Failure 46
Fault Case ID OHS3-1: OHS Network Down 46

Oracle WebLogic Server Fault Cases 47
Fault Case ID WLS1-1: WebLogic Graceful Shutdown 47
Fault Case ID WLS1-2: WebLogic Forced Shutdown 47
Fault Case ID WLS2-1: WebLogic Host Failure 47
Fault Case ID WLS3-1: WebLogic NFS Storage Head Switchover 48
Fault Case ID WLS3-2: WebLogic Runtime NFS Storage Unmount 48
Fault Case ID WLS3-3: WebLogic Runtime NFS Storage Read-Only 48
Fault Case ID WLS4-1: WebLogic Network Down 49
Oracle Database Server Fault Cases 50
Fault Case ID DB1-1: Database Planned RAC Instance Outage 50
Fault Case ID DB1-2: Database Unplanned RAC Instance Outage 50
Fault Case ID DB2-1: Database RAC Instance Host Failure 51
Fault Case ID DB3-1: Database RAC Instance Network Down 51
Appendix B: Test Case Scenario Details 52
Web Services Manager – Policy Manager (WSM-PM) 52
Service Oriented Architecture (SOA) JMS Messaging and Web Services 52
WebCenter Portal (WCP) Activities and SSO Login 52
Appendix C: Referenced Documentation 53
1 | Key Performance Indicators and Testing for Oracle Fusion Middleware 12c High Availability
Executive Overview
This paper provides an in-depth analysis of the different metrics that can be used by businesses and
their software operations staff to determine if their environments meet required availability and service
levels. These service levels might include absolute uptime requirements as incorporated into a Service
Level Agreement (SLA).
Introduced here is an overview of the appropriate metrics, or Key Performance Indicators (KPI) that
assist in assessing a system's state and availability. Fault scenarios are also introduced and analyzed
in the context of different KPIs. The methodology for this evaluation is also explained to allow
consumers of this paper to perform further evaluations on their own.
As a result of these evaluations, readers should gain a greater understanding of the resiliency of their
system and understand the relevant KPIs for their environment. This information can assist in:
» Planning for SLA objectives » Informing decisions for Disaster Recovery » Informing decisions regarding which elements of the system should be monitored most closely » Constructing appropriate recovery plans for different monitoring events
Every customer's environment is different, so this paper cannot provide a comprehensive overview of
all relevant KPIs. Nevertheless, many of the most common and critical KPIs are discussed here in
detail, and information and a methodology is provided to allow customers to extend the work in this
paper to their environments.

2 | Key Performance Indicators and Testing for Oracle Fusion Middleware 12c High Availability
Introduction Understanding and validating how the components of distributed highly-available (HA) system architectures react to faults and outage situations, or “fault-tolerance,” is an important aspect of providing and maintaining stable business operations. Gaining this insight through system instrumentation, testing, and monitoring can be a complex and daunting task. Distributed systems, by their very nature, can be significantly complex with multiple interdependent application and infrastructure services. Standardized monitoring and analysis of various system metrics instrumented as Key Performance Indicators (KPI) across these distributed services can provide the data needed to make informed decisions on system scaling, tuning, and compliance validation against critical service level agreement (SLA) limits. Understanding how these KPI values change in response to various runtime conditions is key to planning the appropriate support levels and maintenance procedures or timings(schedules?).
Unanticipated effects of faults against a highly-available production system, especially those significant enough to violate negotiated SLA commitments, can significantly impact business value. The importance of timely, accurate, repeatable, and stable KPI analysis to inform SLA compliance validation cannot be understated. Accuracy and reliability can be achieved through implementation of stable and repeatable processes for fault testing, KPI metrics data acquisition, analysis, and results reporting / dashboards. Consistency and repeatability should be emphasized with adequate process controls and standardization during fault-tolerance validation. These aspects are vital in any project, whether implementing a more traditional QA cycle or more tightly coupled QE methodology.
This document presents a set of formalized processes, findings, and recommendations regarding the KPI metrics, fault scenarios, testing process, and results analysis based on the behavior of Oracle Fusion Middleware components during nominal baseline runtime and fault-case situations when using the Oracle recommended MAA enterprise deployment reference architecture topology.
This document discusses KPI metrics selection, instrumentation, and data analysis techniques for a sample set of high-availability fault-case scenarios and recommendations on standardized testing protocols.
The objectives for this paper are to provide:
» A recommended set of basic KPI metrics, faults, and test-cases useful to HA-fault/recovery-related functional assessments, and discussion for applying these factors to application or product components beyond scope of this paper
» Support for Quality Engineering (QE) efforts with a standardized framework applicable to on-premises and cloud implementations to assist with capacity-demand analysis and system resiliency validation during fault conditions
» Allow informed SLA compliance verification prior to launch while in HA faulted conditions and for on-going metrics dashboarding and alerting
» Provide processes and examples of how to validate FMW HA solutions with fault injection and recovery scenarios as part of the pre-launch capacity planning and load testing
» Inform and promote the need for standardized and repeatable testing/analysis processes to allow KPI reporting / SLA compliance aggregation or comparison across projects

3 | Key Performance Indicators and Testing for Oracle Fusion Middleware 12c High Availability
Overview
Concepts
Key Performance Indicators
Key Performance Indicators (KPIs) are measurements that define and track specific business goals and objectives that often roll up into larger organizational strategies that require monitoring, improvement, and evaluation. KPIs have measurable values that usually vary with time, have targets to determine a score and performance status, and can be compared over time for trending purposes and to identify performance patterns. KPI can be discrete metrics measurements queried from system instrumentation, derived metrics such as rate of change or other formula based on various discrete metrics input, or higher-level business-oriented metrics aggregated from various other KPI metrics. A simple example of a higher-level business-oriented metric could be the “Check Engine” light on your vehicle’s literal dashboard. It doesn’t tell you what specific service component has the fault and a sensor value out-of-range of the vehicle’s SLA, only that there is a problem that needs remediation.
KPI are often presented in either reports or dashboards. Reports are typically static sets of tables and graphs; dashboards provide more dynamic and interactive gauges and graphs.
The KPIs presented in this paper are selected to provide an initial basis for understanding the behavior of Oracle Fusion Middleware components against high-availability fault case scenarios and as an example of how KPIs can be used to analyze and validate fault-tolerance. Once scored, the analysis of the KPI can both help to verify functionality and performance/scalability under fault conditions against expected service level agreement (SLA) obligations, or if needed, help establish initial SLA guidance.
Service Level Agreements
A Service Level Agreement (SLA) is a contract that defines and quantifies the level of service guaranteed to be received by the consumers of the services provided, the consequences for not meeting service obligations, and any escape clauses or constraints. How services are provided or delivered are not part of the SLA. SLAs are written in terms of various metrics that define the level of service. Some SLA examples might include:
» Reliability » Availability as the percentage uptime » Recovery Point Objective for the amount of unrecoverable data
» Performance » Maximum threshold for transaction response times » Minimum required transaction rate
» Responsiveness » Recovery Time Objective – how long services can be unavailable or degraded » Support request response times/punctuality (operations rather than system-related)
» Consequences for SLA violations / non-compliance » Legal contractual details for credit/reimbursement/service termination remedies
» Escape clauses and constraints » Circumstances when the SLA may not apply. For instance, any natural disasters, fires, floods that restrict
access to the equipment and prevent work from being performed.
Understanding how the Fusion Middleware components, customizations, and system as a whole react to faults, and how quickly the system behavior returns to a steady-state, are critical to identifying the practical limits of the system

4 | Key Performance Indicators and Testing for Oracle Fusion Middleware 12c High Availability
implementation and using the technical system KPI metrics to validate common SLA elements such as the Recovery Time Objective (RTO), transaction rates, and response time thresholds.
Fault Scenarios and Test Cases
A fault scenario describes the cause of the fault and expected recovery requirements in terms easily understood. Fault test cases provide the structure around a fault scenario to allow for repeatable execution. The test case includes discussion of the fault scenario, with detailed steps to inject and recover the fault, the list of relevant KPI, and the expected behavior of the KPI values to detect the fault and its recovery.
Within the spectrum of faults that can occur in the data center, some induce a fractional loss of service and affect a limited set of individual service instances. Others have an impact comprehensive enough to disrupt the entire data center, or at least the complete set of servers for a given HA environment. This paper covers single-site behavior for a subset of faults that should not require multi-site fail-over or disaster recovery.
Examples of various potential test scenarios are provided with the expectation that every organization has their own set of risks and priorities based on existing infrastructure, best-practices and procedures. Not all possible fault test scenarios are provided, and not all provided fault test scenarios may be a priority for testing.
Functional and Load Test Cases and Scripts
When evaluating KPIs to assess baseline and fault conditions, appropriate load should be applied to the system that exercises the relevant components of your application. The test scripts used for functional validation as part of Quality Engineering best practices and/or for pre-launch load and scalability testing, can be used for fault test case execution. Use of a testing solution such as Oracle Application Testing Suite (OATS) is recommended.
The Oracle Fusion Middleware functionality chosen for the testing and analysis in this paper serves as an example only. Test cases should be designed and implemented based on your specific application functionality within your specific environment.
Testing Process
Testing is an integral part of any enterprise solution delivery. How testing is performed determines which questions about risk and value can be answered by the test results. Collecting and analyzing various KPIs while testing with a realistic workload exercising the various components of the overall architecture can raise or show potential issues with scalability and stability of the nominally running applications and services. Response time and transaction rate KPI values, as the simplest and most obvious examples, change in direct response to the test user request rate during baseline scalability testing. JVM memory metrics may also fluctuate based on heap size, OS tuning, and application design. These types of results, however, only illuminate part of the picture. What’s missing is: “How do these results change and how does the system respond, to the loss of a component or host?” and, from a business perspective, “What is our risk and exposure if we commit to an expected service level of X?” Until the system and operational maintenance procedures are tested under load during fault conditions, any answers to these questions can only be estimates. In some cases, estimates may be sufficient. If you need to know for sure, integrating fault-tolerance testing into project delivery can have several benefits for pre-launch HA validation of your specific implementation, and help inform or validate acceptable baselines toward SLA compliance.
When evaluating the system response to various fault scenarios, it can be challenging to differentiate between performance and stability changes that are due to the fault itself, or perhaps caused by a potential performance bottleneck induced as a secondary condition by the partial loss of service. It is important to validate the behavior of the system in response to the fault alone, without the additional complexity of any performance bottlenecks. To

5 | Key Performance Indicators and Testing for Oracle Fusion Middleware 12c High Availability
prepare for this, one server or service can be taken offline and scalability testing repeated to establish baseline transaction rates that remain stable and reproducible at “n-1” scale while the system scalability is degraded.
This paper offers an approach to integrating fault testing into common load and scalability assessment testing practices with a focus on stable and reproducible processes. An incremental testing methodology is discussed with a phased approach that establishes a baseline threshold transaction rate that remains stable at “n-1” fault conditions, establishing stable runtime KPI value ranges at full capacity, and then conducting iterative fault testing focusing on priority fault cases first.
Why High Availability Fault Case Scenario Testing is Important
There are several opportunities for demonstrating value to the business through fault testing under load, as part of:
» Just-in-time pre-launch scalability load testing in final stage or production environments » Continuous iterative testing during development and early testing as part of a Quality Engineering (QE)
methodology » Post-launch, as a follow-up for SLA validation in a non-production environment
Just-in-Time Pre-Launch Testing
Supplementing a traditional QA load-testing schedule with additional fault-scenario testing can be natural and intuitive. Extending traditional scalability testing can provide most of the benefits outlined in this paper, but includes all of the risks associated with end-of-project testing schedules pushed up against the launch date. If issues are found at the eleventh hour, it can be difficult and disruptive to make time to take corrective actions and re-test. In the case of fault case scenario testing, as an example, it can be highly disruptive to find that a custom-written middleware application or service needs to be re-coded and enhanced to properly support session replication days or weeks before launch.
Quality Engineering Methodology
Testing for proper clustered high availability and fault tolerant functionality as early as possible and iteratively throughout the project lifecycle can assist with assurance that platform configuration and code design are both tracking appropriately. This can help you avoid surprises and additional troubleshooting or unexpected iterative development cycles late in the project. Understanding how your applications and services respond and recover from fault situations as early as possible can also be of benefit when aligning expectations and negotiating various SLA and multi-site business continuity planning.
Considering fault testing as part of a Quality Engineering methodology can also be helpful in maintaining up-to-date baselines for scoring Oracle Fusion Middleware implementations against HA-sensitive SLAs. The effect of scaling the environment, code enhancements, new features, additional user populations, etc., may alter the baseline HA-related KPI ranges established as “normal” thresholds during fault scenarios. Understanding how these baseline values change with environmental scale can be significant and are beyond the scope of this paper.
Post Launch
Including fault testing as a follow-up post-launch requirement provides the risk assessment benefits for informing SLA validation with the business and a sanity check for the implementation team to inform for any enhancements necessary for any future phased design and development efforts, while deferring the effort and timing impact to the project pre-launch. Naturally, this approach increases the length of time the business is exposed to the associated risks because the system is live for customer use without a comprehensive understanding of how the system reacts to faults or if standard operating procedures for maintenance can successfully recover to production transaction

6 | Key Performance Indicators and Testing for Oracle Fusion Middleware 12c High Availability
rates within committed SLA requirements. The good news is that commitment to post-launch fault testing sets a horizon for mitigating these risks.
Oracle Fusion Middleware Maximum Availability Architecture
Oracle Maximum Availability Architecture (MAA) is Oracle's best practices blueprint based on proven Oracle high availability technologies, expert recommendations, and customer experiences. The goal of MAA is to achieve optimal high availability for Oracle customers at the lowest cost and complexity. Oracle MAA Best Practices can be found on the Oracle Technology Network at http://www.oracle.com/technetwork/database/features/availability/maa-best-practices-155366.html.
As part of the MAA Best Practices, Enterprise Deployment Guide documentation is available for Oracle Fusion Middleware products and provides comprehensive, scalable examples for installing, configuring, and maintaining secure, highly available, production-quality deployments. The resulting environment is called an enterprise deployment topology. See the MAA Best Practices – Oracle Fusion Middleware page on the Oracle Technology Network website at http://www.oracle.com/technetwork/database/features/availability/fusion-middleware-maa-155387.html.
Oracle MAA FMW Enterprise Deployment Reference Architecture Topology
The recommended reference architecture includes several standard features associated with redundant highly available systems: a load balancer (or pair thereof, only one logical object shown for simplicity), redundant Web tier and Application tier hosts and services, Oracle RAC database, and storage appliance. An example topology with abstracted service and application components is depicted in Figure 1: Oracle Fusion Middleware MAA Enterprise Reference Architecture Topology with KPI & Fault-Injection Annotations. Yellow “(KPI)” glyphs illustrate some examples of various objects, from a topology perspective, that can provide valuable Key Performance Indicator metrics. The red triangles illustrate points in the topology where fault cases have been injected for testing in preparation for this paper.
Highlights of the Reference Architecture Topology » Shared file systems are used for the Fusion Middleware domain configuration, Administration Server HA
portability, and shared runtime data directories, so that a single location can be used for configuration files or application created files across multiple application servers.
» Oracle Database is configured with Cluster Ready Services (CRS) and Oracle Real Application Clusters (RAC) for redundancy. It follows one of two MAA Silver configurations shown in the MAA Whitepaper “Oracle MAA Reference Architectures”.
» WebLogic JDBC data sources are configured with Oracle Single Client Access Name (SCAN) addresses for Fast Application Notification (FAN) and Fast Connection Failover (FCF). See the “Client Failover Best Practices for Highly Available Oracle Databases” section of Oracle Database High Availability Best Practices.
» WebLogic Automatic Service Migration is configured for the JMS Service inside the Oracle Service-Oriented Architecture WebLogic Managed Servers. See “Configuring Automatic Service Migration in an Enterprise Deployment” in Fusion Middleware Enterprise Deployment Guide for Oracle WebCenter Portal.
» All WebLogic Managed Servers are clustered as applicable; applications and services are targeted appropriately.

7 | Key Performance Indicators and Testing for Oracle Fusion Middleware 12c High Availability
Figure 1: Oracle Fusion Middleware MAA Enterprise Reference Architecture Topology with KPI & Fault-Injection Annotations

8 | Key Performance Indicators and Testing for Oracle Fusion Middleware 12c High Availability
Key Performance Indicator Metrics and Instrumentation
Choosing Appropriate Metrics as KPIs
Every Oracle Fusion Middleware product feature, application, and service utilizes a unique subset of functionality. Each use case to exercise a specific set of functionality requires specific consideration in terms of which of the thousands of instrumented metrics may be useful for understanding that object’s change in operational state during nominal runtime and HA fault conditions. Iterative analysis and prototype fault case scenario testing is suggested. This will help to characterize:
» How various metrics values change as the components used in your specific implementation reacts to faults » Identification of the critical metrics as key indicators of fault condition and recovery » Identification of allowable values ranges for these KPIs that fall within your acceptable SLA tolerances » Validation of whether or not your implementation’s functionality fully recovers to pre-fault state » How long it takes for any errors to cease and return to normal processing rates after a fault occurs » How long it takes for the system to re-adjust again once recovery maintenance is performed and the faulted
component is restored
Basic service availability is a good baseline starting point for components to instrument and monitor. In general, most FMW solutions could include monitors for any of the following as applicable:
» Local Traffic Manager OHS pool member health monitor status » Host availability » OHS instance status » WebLogic Server Object/Subsystem Health
» Cluster » Server » Application » JDBC Service » JMS » JMS servers » SAF » JTA » Persistent Store » Thread Pools
» Database Instances

9 | Key Performance Indicators and Testing for Oracle Fusion Middleware 12c High Availability
Instrumentation Options
There are several embedded and standalone methods of monitoring metrics for Oracle Fusion Middleware. The data acquisition requirements may be significantly different for load/fault testing and analysis versus that required for ongoing operational monitoring dashboards or reporting. Multiple unique instrumentation approaches may be needed in order to meet various business and technical monitoring and analysis requirements. Some of the notable monitoring and data collection components available within the Oracle ecosystem are itemized here with an acknowledgement that other 3rd party tools may be viable options.
Note: Instrumentation and acquisition of KPI metrics data from Network-Attached Storage appliances and traffic manager/load-balancer appliances will vary by product manufacturer. For the case-study in this paper, custom shell scripts were constructed and executed to extract, transform, and load data into to CSV files during fault test executions for data acquisition purposes when Oracle-centric methods were unavailable or provided insufficient temporal resolution (e.g. limited to 2-minute resolution vs the 10-second resolution desired.)
TABLE 1: INSTRUMENTATION OPTIONS EXAMPLES SUMMARY
WebTier AppTier Database Infrastructure
Cloud Services Control Console
Enterprise Manager Cloud Control (EMCC)
Enterprise Manager Fusion Middleware Control (EMFC)
Enterprise Manager Database Express / Database Control (EMDC)
WebLogic Scripting Tool (WLST)
WebLogic Diagnostic Framework (WLDF)
Oracle Application Testing Suite (OATS)
Custom Scripts, SNMP
3rd Party Tools
Legend: Operations Monitoring; Testing & Technical Configuration/Diagnostics; All or Various Uses
» Cloud (OMC / PaaS / SaaS)
» Cloud Services Control Console » See “Monitoring Oracle Java Cloud Service instances using the Fusion Middleware Control Console”
» IaaS / Bare Metal Cloud & On-Premise » Enterprise Manager (EM)

10 | Key Performance Indicators and Testing for Oracle Fusion Middleware 12c High Availability
» Cloud Control (EMCC) is a separate license purchase and can include extensions and plugins for multiple Oracle software suite controls and monitoring options. For more information, see the Enterprise Manager Cloud Control Oracle Fusion Middleware Management Guide
» Fusion Middleware Control (EMFC) is included with appropriate FMW suite licenses that include Oracle WebLogic Server and supports control and monitoring of local domains within a specific environment. For more information on monitoring aspects of EMFC see: “Viewing Performance of Oracle Fusion Middleware”
» Database Express (12c) | Database Control (11g) (EMDC) are part of the Oracle Database installation and supports local database control and monitoring. For more information, see “Oracle Database 12c: EM Database Express” or “Managing Oracle Enterprise Manager Database Control”
» WebLogic Scripting Tool (WLST) is included with any WebLogic Server installation and provides a command line interface for controlling, configuring, and querying data from any WebLogic domain.
» WebLogic Diagnostic Framework (WLDF) is a configurable feature of any WebLogic domain installation that provides access to a comprehensive set of metrics. WLDF features are accessed via the WebLogic Administration Console. For more information, see: “Fusion Middleware Configuring and Using the Diagnostics Framework for Oracle WebLogic Server”
» Oracle Application Testing Suite (OATS) provides function and load testing capabilities and is available as a separate software package and license purchase. OATS provides metrics instrumentation and logging for a built in set of test metrics and supports external metrics acquired via JMX. Metrics are captured during test execution only. For more information, see: “Oracle Application Testing Suite Online Documentation Library - Release 13.2.0.1”

11 | Key Performance Indicators and Testing for Oracle Fusion Middleware 12c High Availability
Recommended Basic HA-Related Metrics
All Oracle Fusion Middleware high availability topologies will include a common subset of standard components, load balancers, a web tier, WebLogic Server clusters and servers, storage appliances, database, etc. A baseline set of metrics to monitor these common components/features is recommended. Additional metrics might be needed based on your specific solution design, application/services requirements and Fusion Middleware components implemented.
The metrics found in Table 2: Baseline Key Performance Indicator Metrics for HA FMW can be used to detect operational faults with regard to high availability of the common Oracle Fusion Middleware web-tier services, application-tier services, and associated supporting infrastructure services.
TABLE 2: BASELINE KEY PERFORMANCE INDICATOR METRICS FOR HA FMW
Key Performance Indicator Service Tier Monitoring Source
ClusterRuntime.AliveServerCount MBean Application WebLogic Diagnostic Framework
ClusterRuntime.PrimaryCount MBean Application WebLogic Diagnostic Framework
ClusterRuntime.SecondaryCount MBean Application WebLogic Diagnostic Framework
JDBCOracleDataSourceInstanceRuntime.ActiveConnectionsCurrentCount MBean Application WebLogic Diagnostic Framework
JDBCOracleDataSourceInstanceRuntime.CurrCapacity MBean Application WebLogic Diagnostic Framework
JDBCOracleDataSourceRuntime.WaitingForConnectionsCurrentCount MBean Application WebLogic Diagnostic Framework
JMSDestinationRuntime.MessagesPendingCount MBean Application WebLogic Diagnostic Framework
JMSDestinationRuntime.MessagesReceivedCount MBean Application WebLogic Diagnostic Framework
ServerRuntime.StateVal MBean Application WebLogic Diagnostic Framework
ServiceMigrationDataRuntime.MigratedFrom MBean Application WebLogic Diagnostic Framework
ServiceMigrationDataRuntime.MigratedTo MBean Application WebLogic Diagnostic Framework
ServiceMigrationDataRuntime.Status MBean Application WebLogic Diagnostic Framework
ThreadPoolRuntime.StuckThreadCount MBean Application WebLogic Diagnostic Framework
ThreadPoolRuntime.Throughput MBean Application WebLogic Diagnostic Framework
WebAppComponentRuntime.OpenSessionsCurrentCount MBean Application WebLogic Diagnostic Framework
WebAppComponentRuntime.SessionsOpenedTotalCount MBean Application WebLogic Diagnostic Framework
WebLogic Java Heap Application WebLogic Diagnostic Framework
Oracle Database Instance State (Availability) Database Oracle Enterprise Manager (OEM)
Oracle Database Transactions per Second Database Oracle Enterprise Manager (OEM)
Load Balancer OHS Pool Member Connection Count Traffic Manager Appliance Script / SNMP / OEM
Load Balancer OHS Pool State (Availability) Traffic Manager Appliance Script / SNMP / OEM
NFS Shared File System Mode (read/write vs read-only) Storage Appliance Script / 3rd party appliance-specific
NAS Appliance Cluster Failover State Storage Appliance Script / 3rd party appliance-specific
12 | Key Performance Indicators and Testing for Oracle Fusion Middleware 12c High Availability
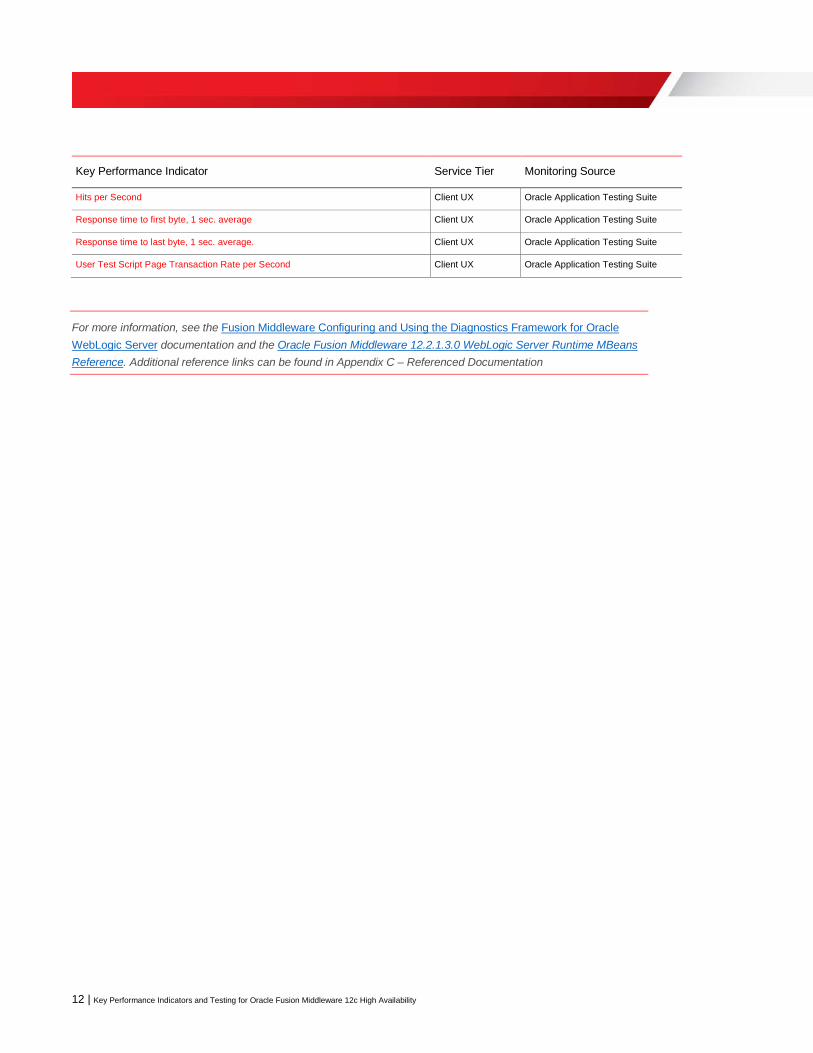
Key Performance Indicator Service Tier Monitoring Source
Hits per Second Client UX Oracle Application Testing Suite
Response time to first byte, 1 sec. average Client UX Oracle Application Testing Suite
Response time to last byte, 1 sec. average. Client UX Oracle Application Testing Suite
User Test Script Page Transaction Rate per Second Client UX Oracle Application Testing Suite
For more information, see the Fusion Middleware Configuring and Using the Diagnostics Framework for Oracle WebLogic Server documentation and the Oracle Fusion Middleware 12.2.1.3.0 WebLogic Server Runtime MBeans Reference. Additional reference links can be found in Appendix C – Referenced Documentation

13 | Key Performance Indicators and Testing for Oracle Fusion Middleware 12c High Availability
Fault Case Scenarios Faults can be injected onto a wide-variety of components to evaluate how the loss of that component effects the availability of the overall system. Faults can generally fall into two categories: planned and unplanned. Some generalized examples include:
» Planned Outages / Maintenance » Hardware
» Shutdown/reboot due to host-specific maintenance » Network-infrastructure switch or cable maintenance
» Software » Zero-downtime / Rolling Patching
» Unplanned Outages (actual or simulated) » Hardware
» Server hangs, panics, spontaneous reboots or power loss » Network switch outage / cable fault or un-plugged » Filesystem corruption or permissions change (read only vs read/write) » NAS volume un-mounted
» Software » Service hangs, requiring restart » Application hangs, requiring restart
Anatomy of a Fault Case Scenario
A Fault Case Scenario should clearly describe the scope of the fault in clear and explicit terms, how to execute and recover the fault, and the expected hypothetical impact. Technical processes and protocols for fault injection and recovery execution should be provided. Sufficient design analysis should allow specification of the system metrics to be monitored as KPI relevant to the effected components. A working hypothesis for expected results / impact, should be noted. Also, include if possible: how the relevant KPI values are expected to change after fault injection and recovery processes are executed. This hypothesis and expected changes in metrics values serve as the basis for the test pass/fail criteria during test data analysis.
For example:
» Fault Case ID <component acronym><testing phase#>-<incremental test #>: <name of test> » Description: <short one-line description suitable for the business analysts> » Execution: <specific technical operating procedure, commands/instructions to inject the fault> » Recovery: <specific technical operating procedure, commands/instructions to reverse the fault injection
procedure> » Test key performance indicators:
» <list of relevant KPI metrics believed to be directly indicative of the fault> » < include KPI suspected of being related to the fault as secondary derivatives directly correlated>
» Expected results: <detailed paragraph written for both the business analyst and testing engineers, describing what happens to the system during and after both fault execution and recovery. Test analysis reporting should include data to support what is written here.>

14 | Key Performance Indicators and Testing for Oracle Fusion Middleware 12c High Availability
Testing for High-Availability and Fault Tolerance
Testing Process Design
Conducting scalability assessments and load testing are common aspects of any modern solution delivery project. Often, this testing is conducted at full-scale with the test load tuned to meet the required response time threshold and then iterated at n-1, n/2, n/4 scale to determine the scalability factor for any future scale-up. Some infrastructure is now more elastic and allows for automatic scaling. These factors do not necessarily expose how the system reacts to unexpected faults and partial loss-of-service of pre-existing component instances. Fault testing may be warranted. Fault testing can be incorporated in phases into any existing tradition scalability testing plans and load-testing processes.
Figure 2: Overview of a standardized testing protocol
Preparing all necessary environmental instrumentation and data collection is a pre-requisite to initiating any testing protocol. Likewise, the data harvesting/ETL, and analysis processes are implied to be conducted for each test run.
Also see the Oracle Load Testing User’s Guide in the Oracle Application Testing Suite documentation Rel.13.2.0.1 for guidance on test design, planning, and execution for the assessment and baseline tests.
Each fault test execution should also follow a standardized protocol with stable and consistent timings. This helps normalize the analysis process and allows differences in how the system reacts without having to compensate for any differences as to when certain events occurred, and help isolate if a change in results might be due to some other external factor beyond the control of the fault-injection/recovery process.
The basic segments of a test-case scenario used for outage testing include:
1. Ramp-up of user traffic 2. Stable Runtime 3. Fault Runtime 4. Recovery Runtime
These segments represent periods of system response that can be compared for differences in KPI metrics behavior. The timing of KPI metrics value changes in comparison to the fault injection, the beginning & end of fault

15 | Key Performance Indicators and Testing for Oracle Fusion Middleware 12c High Availability
recovery process execution, and post-recovery execution metrics normalization can be important when validating maintenance duration thresholds against SLA limits, for example. At the transition boundaries between these runtime states, some important milestones can be tracked. These milestones correspond to known changes in system behavior during the tests. These are interesting time periods when changes in KPI values are expected. In contrast, significant changes in metrics values during the runtime periods between these milestones may indicate system instability or automatic recovery due to high availability features, especially if found during fault runtime or recovery runtime.
Figure 3: Standardized test scenario with fault injection & recovery milestones
Comparing Fault Case Scenario Testing and Scalability Testing
Scalability and load testing is an essential part of the process for establishing a baseline for how the system reacts under nominal runtime use-case scenarios and production loads. This allows the establishment of valid and acceptable value ranges and thresholds for all KPI metrics. The key is that standard scalability testing only establishes baselines under nominal conditions. These baseline value ranges are essential and must be used to inform data analysis both when validating that the system is producing valid results during fault testing execution before fault injection, and also to gauge how the system reacts to fault injection and fault recovery.
It is critical to gather baselines and perform the same scalability and stability assessments performed for full-scale load testing while under various fault conditions that include loss-of-capacity. This can include the loss of a host or particular service as provided in the example fault cases in Appendix B – Test Case Scenario Details. In this case, it may be discovered that system stability may not be successfully maintained at expected load rates during fault situations. When testing fault conditions to establish appropriate baseline ranges for KPI metric values for identification / detection of component failures, it is important to assure any changes in KPI metrics result from the fault injection/recovery changes rather than instabilities caused by performance bottlenecks. Assessing KPI value range limits that indicate scalability concerns is a related but separate topic beyond the scope of this paper.
Deciding What to Test and When
Introducing a suite of fault scenarios into your Quality Engineering or Quality Assurance testing processes can significantly increase the effort and time required. The workload multiplies quickly when factoring-in the number of basic fault scenarios, the number of components where fault cases may be applicable for each fault scenario, and iterating each specific test case multiple times to assure reliability.
For example, a graceful service shutdown fault scenario could be applied to a host, an OHS instance, a WLS managed server for each of the various FMW Upper-stack components (WCP, WCC, SOA, BI), specific dependent application or service instances running on any given WLS server… the list goes on. Then also consider running

16 | Key Performance Indicators and Testing for Oracle Fusion Middleware 12c High Availability
every one of those specific test cases at least 2 or 3 iterations to get sufficient data samples to assure reproducible and reliable results.
Key factors to successfully realizing value through fault testing include: honest risk & effort assessments, test prioritization, and the ability to show rapid results through an iterative phased approach. Once the set of functional test cases are prioritized for load & fault testing, the next step is to rank the set of fault scenarios by practical relevance and risk within your operational environment. Every business and datacenter has their own perception of high-priority risks. If this sort of testing is new to your organization, testing & analyzing the least-complex test cases and fault scenarios first may provide the most value. With an experienced test team and analysts, prioritizing testing of your highest perceived risks to your SLA compliance might be the most valuable approach.
As an example of a phased testing approach, testing for this paper was split into three phases to provide incremental progress and validate processes and results before committing to a significant volume of tests. For our initial phase, with three functional test scripts, we ran three iterations each for stability assessment, baseline metrics, and for each of the three outages per test script for a total of 39 test executions. We also chose to only include analysis and data collection effort to determine the KPI metrics needed for the user-facing web-tier transactions during Phase 1. Additional application, database, and network/NAS infrastructure metrics KPIs would follow in later phases. The details of how we chose to split up the work and our results are covered in the Case Study section.
Data Acquisition
How the KPI metrics are extracted, transformed, and loaded into your analysis and reporting tools of choice can be dependent on the source instrumentation tool set, features of any analysis tools, and your requirements for the granularity of the data samples. For example, a two-minute data granularity may be sufficient for monitoring/dashboarding, executive reports, and SLA validation purposes, however, the precision necessary to perform accurate technical root-cause analysis of fault behavior during testing using fine-grain precise visualizations may require KPI metrics resolution at a 5 to 10-second granularity or less.
The metrics data from the Oracle Fusion Middleware stack can be retrieved using JMX, WLST or log processing. KPI metrics data can also be collected and reported with Oracle Enterprise Manager via EM agent deployment and appropriate service targeting. The maximum data resolution able to be gathered using Oracle Enterprise Manager Cloud Control was at a 2-minute granularity. The analysis and reporting done during the case study for this paper required higher resolution. Various metrics were gathered at 10-second or 1-second intervals depending on logging capabilities and processing overhead consideration.
The primary goal for designing your KPI data collection strategy for the fault testing process is to provide sufficient data resolution to plot and visualize the behavior of the system components (key metrics) over time to detect any changes against baselines before, during, and after fault injection, as well as during and after fault recovery.
Some notable aspects of the application-specific data extraction and transformation for the testing results are represented in this paper. Most data transforms, aggregation of app-specific data sets, and graphing for analysis purposes was conducted using Microsoft Excel as a lowest-common denominator tool set. Comprehensive data processing details as performed within Microsoft Excel are not presented, but included the calculation of normalized timestamps as relative “time-from-test-start” quantized to consistent 5-second increments, injection of artificial data sets for indicating shaded total fault periods on the graphs for easier visualization, data processing strategies for combining the various metrics using pivot tables, etc.

17 | Key Performance Indicators and Testing for Oracle Fusion Middleware 12c High Availability
Other methods for KPI data acquisition, graphing, and dashboard presentation were also prototyped using InfluxDB and Telegraf from InfluxCorp, and Grafana, although not leveraged for the results in this paper.
Client Data Acquisition
KPI metrics regarding the client-side performance during load test baselines and fault-case tests under load were gathered into CSV data files from Oracle Application Test Suite (OATS) using the data export features available within the product.
Web Tier Data Acquisition
Oracle HTTP Server access log configuration was modified to include the “time-to-last-byte” metric (“%D”), to indicate the total time the application server took to respond to the request. Access logs were filtered and parsed into CSV format to consolidate the response time for inclusion for analysis. See Managing Oracle HTTP Server Logs in the Fusion Middleware Administering Oracle HTTP Server documentation.
Oracle HTTP Server Access Log Parsing Code Example 1 - Oracle HTTP Server Access Log Parsing for Response Time-to-Last-Byte metric extraction to CSV data file. ## For WSM-PM log files with the user-agent "Mozilla/4.0 (compatible; MSIE 6.0; Windows NT 6.0)"
$ echo "Timestamp,Response Time" > [NEW_OUTPUT_FILE]\
&& awk -F '[\[ ]' '{print $5,","$24/1000}' [INPUT_LOG_FILE] >> [NEW_OUTPUT_FILE]
## For SOA log files with the user-agent "Mozilla/5.0 (Windows NT 6.1; WOW64; Trident/7.0; rv:11.0) like Gecko"
$ echo "Timestamp,Response Time" > [NEW_OUTPUT_FILE]\
&& awk -F '[\[ ]' '{print $5,","$22/1000}' [INPUT_LOG_FILE] >> [NEW_OUTPUT_FILE]
## For WCP log files with the user-agent "Mozilla/4.0 (compatible; MSIE 6.0; Windows NT 6.0)"
$ echo "Timestamp,Response Time" > [NEW_OUTPUT_FILE]\
&& awk -F '[\[ ]' '{print $5,","$23/1000}' [INPUT_LOG_FILE] >> [NEW_OUTPUT_FILE]
Note: The field to extract the response time data changed based on the user-agent string logged for a given test agent client. Our testing scenarios used a different agent for SOA Web Service requests.
Application Tier Data Acquisition
WebLogic Server access logs were reconfigured to log access time taken using an extended log format including the following fields: date, time, time-taken, cs-method, ctx-ecid, ctx-rid, cs-uri, sc-status, bytes. Access logs were filtered and parsed into CSV format to consolidate the response time for inclusion for analysis.
See Configuring WebLogic Logging Services in the Oracle Fusion Middleware Configuring Log Files and Filtering Log Messages for Oracle WebLogic Server documentation.
WebLogic Access Log Parsing
WebLogic access logs were configured to log “time taken” with the extended log format (Logging > HTTP > Advanced > (Format & Extended Logging Format Fields)) with the following fields: date time time-taken cs-method ctx-ecid ctx-rid cs-uri sc-status bytes

18 | Key Performance Indicators and Testing for Oracle Fusion Middleware 12c High Availability
For simplicity, the date, time, and time-taken fields were parsed to a separate data file for data aggregation and analysis.
Code Example 2: Oracle WebLogic Server Access Log Parsing for Server time-taken metric extraction to CSV data file. echo "Date,Time,Response Time" > [NEW_OUTPUT_FILE].csv\ && awk -F $'\t' '{print $1,","$2,","$3*1000}' [INPUT_LOG_FILE] >> [NEW_OUTPUT_FILE].csv
Note: The OHS logs list response times in microseconds and the WebLogic logs list the response times in seconds. In order to remain consistent, the response time values are divided by 1,000 for the OHS and multiplied by 1,000 for the WLS logs in order to output the values in milliseconds.
WebLogic Diagnostic Framework and MBeans
Other more complex WebLogic Server and application metrics were available as runtime MBeans. These were captured using the WebLogic Diagnostic Framework (WLDF) and a custom-configured harvester diagnostic module in the WebLogic Server Administration Console. Harvested MBean metrics were extracted to CSV file format using WebLogic Scripting Tool (WLST) commands based on a time period for each test execution. The data is unique per WLS Managed Server and had to be retrieved iteratively, and then merged into a single data file. Each application use-case scenario used for testing purposes exercised a different set of application services and managed servers.
Configuring WebLogic Diagnostic Framework (WLDF) and the Data Harvester 1. Create new harvester diagnostic module: Module-FMWKPI-v 2. Add ServerRuntime mbeans 3. Configure collection interval to 10000 ms 4. Set targets to all clusters and all servers 5. Use exportHarvestedTimeSeriesData() online WLST to generate and export csv data files
Exporting Harvested WebLogic Server Data
Data can be extracted from the relevant WLS Managed Servers for the required harvester module and time period. Each managed servers’ harvested data is exported individually to unique CSV files and can be combined into a single data file via appropriate WLST scripting.
Code Example 3 - WebLogic Diagnostic Framework Data Export and aggregation to CSV data file via WebLogic Scripting Tool wlst connect('weblogic_wcp','********','t3://ADMINVHN:7001') # WSM-PM server_list = ['AdminServer','WLS_WSM1','WLS_WSM2'] # SOA #server_list = ['AdminServer','WLS_WSM1','WLS_WSM2','WLS_SOA1','WLS_SOA2'] # WCP #server_list = ['AdminServer','WLS_WSM1','WLS_WSM2','WLS_SOA1','WLS_SOA2','WLS_IBR1','WLS_IBR2','WLS_WCC1','WLS_WCC2','WC_Portlet1','WC_Portlet2','WC_Portal1','WC_Portal2'] for ws in server_list: exportHarvestedTimeSeriesData('Module-FMWKPI-v1', server=(ws), last='00d 00h 40m', exportFile="/tmp/fmwkpi_test_logs/WLDF-Export-"+ws+".csv", dateFormat='MM/dd/YY k:mm:ss') mergeDiagnosticData('/tmp/fmwkpi_test_logs', toFile="/tmp/fmwkpi_test_logs/WLDF-Combined-Export-"+ws+".csv") [os.remove(os.path.join("/tmp/fmwkpi_test_logs",f)) for f in os.listdir("/tmp/fmwkpi_test_logs") if f.startswith("WLDF-Export")] os.rename("/tmp/fmwkpi_test_logs/WLDF-Combined-Export-"+ws+".csv", "/tmp/fmwkpi_test_logs/WLDF_Export/WLDF-Combined-Export-"+ws+".csv") disconnect()
Test Results Analysis and Reporting
Analysis and reporting will be dependent on the testing tools and capabilities available within your organization. The perceived value of any fault-testing and analysis efforts must be carefully measured against the level of risk against

19 | Key Performance Indicators and Testing for Oracle Fusion Middleware 12c High Availability
potential service level agreement requirement violations. The effective value provided is also directly proportional to the quality of the testing & analysis effort in every respect. The case-study section of this paper provides examples for the type of analysis and conclusions that can be derived from the HA KPI metrics during fault case scenario testing.
Analyzing the test results has a different purpose than operational monitoring of actual runtime, and requires different data granularity/resolution. Operational runtime monitoring of these KPIs is important to allow detection of unplanned faults or outages and allow staff to respond accordingly. This detection can occur on the order of multiple tens of seconds or minutes. The technical objective of this testing is to analyze and understand how the middleware components react to a fault, if the system to stabilize both during a fault event prior to any corrective action as well as upon recovery, and how long that stabilization may take in each case. This is complicated due to the distributed nature of middleware solutions. Some reactions to a specific fault may be secondary based on cascading dependencies. In order to analyze this cascade effect and isolate the few truly relevant KPI metrics for the specific fault/recovery events, data points needs relatively high-resolution, on the order of one-to-ten seconds at a maximum. Otherwise, all of the metrics will aggregate into a single low-resolution (30-second/1-minute+) time record and it will be impossible to tell what happens first, or how long certain changes may really take. Figure 4: High-Resolution Data Example Graph showing Tx Rate Recovery Lag Analysis is a good example of this. It clearly shows a ten-second lag before the recovery of the transaction rate KPI even after the server response time recovers to pre-fault conditions. Data resolution is ten-seconds for the metrics presented. If it were any longer, this detail would not be readily apparent.
Figure 4: High-Resolution Data Example Graph showing Tx Rate Recovery Lag Analysis

20 | Key Performance Indicators and Testing for Oracle Fusion Middleware 12c High Availability
Case Study - Oracle Fusion Middleware HA Fault Testing
Summary
The goals of this case study have been to determine a set of KPI metrics that could be used to describe what functional changes occur to Fusion Middleware when faults occur while set up for HA with our standard enterprise reference architecture topology (single-site, not DR/multi-site), and provide a set of tests and results using these KPI values under nominal and faulted run-time conditions for the baseline topology. This set of data could then be used as a basis to further validate FMW HA functionality and as a basis for evaluating SLA compliance.
We very quickly confirmed that fully testing every FMW component feature would be prohibitive to providing results in a timely fashion. To get started, and without any particular business requirement driving the application/product use-cases, the test scripts were limited to three basic sets of functionality for efficiency. The HA-relevant fault scenarios were prioritized into phased testing. The processes of how best to test, monitor, analyze, and choose relevant KPI metrics had to be designed and validated. How tests were conducted had a significant effect on the reproducibility and accuracy of the results. The need for a proposed set of standardized lessons-leaned for testing, measurement, and analysis became evident.
Our initial requirements and starting assertions about our FMW products and this HA fault testing project grew from a combination of other product development quality engineering initiatives.
Initial Requirements and Assertions » The specific key performance indicators declared here are generally applicable to any operational highly-available
FMW environment with clustered deployments. Other metrics may be needed, but this is a good baseline to start with.
» Disaster recovery multi-site fail-over and switchover faults / testing considerations are above and beyond the scope of this project
» Fusion Middleware High Availability best practices are recommended. See the “Fusion Middleware High Availability Guide”.
» The baseline test environment will follow the Oracle Maximum Availability Architecture (MAA) Enterprise Reference Architecture topology. See the “Oracle Fusion Middleware Enterprise Deployment Guide for Oracle WebCenter Portal, Release 12.2.1.3”
» Service dependencies are known, such as dependencies upon other applications, database, storage, etc… » Loss of a dependent service may induce cascading faults and effect several key performance indicator values » Where key performance indicator success criteria / limits are not met, failures should be handled gracefully
Lessons Learned
Introducing high-availability fault testing process for the first time introduces a significant burden on project teams. The following recommendations may help offset the complexity.
» Implement fault testing in a phased approach, starting with the simplest functionality and most basic test cases first. Choose initial use-case scenarios that involve a minimum number of component dependencies before testing the more complex cases.
» Assure reproducible results and stable system performance under fault conditions through repeatable processes for KPI metrics selection, testing, data acquisition, analysis, and reporting that work well for your organization.
» Fault test at non-trivial request rates with real-world use-cases at a scale designed to be stable during n-1 fault conditions.

21 | Key Performance Indicators and Testing for Oracle Fusion Middleware 12c High Availability
» Expect multiple rounds of testing and plan accordingly » Be prepared to negotiate tuning of infrastructure services that support your Middleware implementation
Scope
The KPI testing was performed in several phases. Phase 1 began with a limited set of simple application functionality and the basic planned outages. A minimal number of KPIs focused on client user experience (UX) reduced complexity allowing for significant focus on process design validation, dependable data ETL, analysis, and repeatable results. Phase 2 included the prioritized unplanned outages and a broader set of application and service metrics to identify potential app-tier KPIs. Phase 3 potentially includes future evaluation of network and storage-appliance/file-system faults.
Phase 1
In phase 1, we chose three simple product functions to test, each with their own load test script. One fault scenario, a graceful shutdown of a service, was selected as the simplest planned outage fault to test. Choosing to execute three iterations of each test to assure we had reproducible results per test case and average-out any transient infrastructure variables, we ended up with 39 test runs, not including any aborted/incomplete tests during stability assessments:
Figure 5: Phase 1 Testing - Initial Baselines and Simple Planned Outages
» 3 sets of “n-1 stability assessments” to establish the proper load to apply » 9 baseline test executions (3 iterations x 3 test scripts) » 27 fault case test executions
(3 iterations * 3 application test scripts * 1 fault case scenario [graceful shutdown] * 3 unique fault case test plans [web/app/db])
» 3 initial FMW component test case scenarios » Web Services Manager – Policy Manager » Service Oriented Architecture Web Service with JMS Queue » WebCenter Portal Activities
» 1 Fault Case: Planned Graceful Shutdown » 3 Fault Case Scenario Test Plans
» Instance Shutdown: Oracle HTTP Server, Oracle WebLogic Server, and Oracle Database » KPI metrics for ”front-end” user experience transactions only

22 | Key Performance Indicators and Testing for Oracle Fusion Middleware 12c High Availability
» Process design, debug, and validation of testing, measurement, ETL, and analysis » Classes of KPI metrics:
» Response times » Request rates » Server availability » Connection counts » Session counts
Phase 2
The second phase of the case study included additional KPI metrics based on WebLogic Server app-tier services and two additional fault case scenarios for prioritized unplanned outages. This required re-executing the stability baseline test iterations for each test script with the additional data collection and analysis of the app-tier KPI metrics. Once the updated baseline data was analyzed, then the net-new outage testing for the 2 new fault case scenarios could proceed. Phase 2 included 54 fault test runs executed (3 iterations * 3 test scripts * 2 fault scenarios * 3 unique fault case test plans) plus 6 baseline tests (1 iteration * 3 test scripts * 2 loads [full-scale, n-1servers]). Note that the new baseline tests were aligning well with earlier baseline data so only one iteration was judged sufficient.
Figure 6: Phase 2 Testing - Priority Outages and App-Tier KPI Data Collection
» 3 initial FMW component test case scenarios » Web Services Manager – Policy Manager » Service Oriented Architecture – JMS Messaging » WebCenter Portal Activities
» 2 Fault Cases: Unplanned Instance Crash, Host Crash » 6 Fault Case Scenario Test Plans
» Instance Crash: Oracle HTTP Server, Oracle WebLogic Server, and Oracle Database » Host Crash: Oracle HTTP Server, Oracle WebLogic Server, and Oracle Database
» Updated baseline tests and data for new KPIs » Classes of KPI metrics, in addition to Phase 1 metrics:
» Transaction rates » Throughput

23 | Key Performance Indicators and Testing for Oracle Fusion Middleware 12c High Availability
» Application health » Application availability » Service availability
Phase 3 (Future Testing)
Phase 3 includes all of the fault case tests for the remaining 6 fault scenarios. The math works out to a maximum of 162 tests (3 iterations * 3 test scripts * 3 unique fault test cases [web/app/db] * 6 fault scenarios) if all scenarios apply to all test scripts/functionality and to every components where the fault might be applied.
Further optimization and consideration is warranted as certain fault scenarios may not be applicable in combination. For example, testing the effect of loss of NFS storage appliance access / filesystem unmount fault scenario is relevant only at the application-tier. This fault case scenario does not apply to the web-tier OHS servers or data-tier RAC database, as would be otherwise appropriate for, say, the “Graceful Shutdown” fault scenario.
Figure 7: Phase 3 Testing - Remaining Outages
» 3 initial FMW component test case scenarios » Web Services Manager – Policy Manager » Service Oriented Architecture JMS » WebCenter Portal Activities
» Multiple Fault Cases: various unplanned file system and network outages » Multiple Fault Case Scenario Test Plans
» Each FS outage where appropriate: Oracle HTTP Server local FS, AppTier NAS, and Oracle Database RAC » Network outages: DMZ/WebTier, AppTier, DataTier network infrastructure and host NICs
» Updated baseline tests and data for new KPIs » Classes of KPI metrics, in addition to Phase 1 & 2 metrics:
» Host OS file system read/write and read-only states » Host OS NIC/IP stack metrics » NAS Appliance metrics » Network switch metrics

24 | Key Performance Indicators and Testing for Oracle Fusion Middleware 12c High Availability
Fault Scenarios Tested
A list of potential fault scenarios utilized in this case study are itemized in Table 3: Summary of Fault Scenarios These fault scenarios have been selected specifically to evaluate limited availability situations with a single site without crossing the line past “high-availability” into the realm of “disaster recovery” with the goal to assess resiliency of the Oracle Fusion Middleware solution within the SLA boundaries and avoid the need for multi-site switch/fail-over. The fault-case identifier abbreviations are references to the fault-case tests detailed in Appendix A: Detailed Fault Case Test Plans.
TABLE 3: SUMMARY OF FAULT SCENARIOS AND CORRESPONDING FAULT CASE TESTS
Target Type Fault Description Fault Case ID by Service Tier
WEB APP DB
Instance Planned graceful shutdown Execute a shutdown of a process or instance
OHS1-1 WLS1-1 DB1-1
Instance Crash Simulate a crash of process or instance OHS1-2 WLS1-2 DB1-2
Host Reboot Execute a reboot of the host without graceful shutdown of services
OHS2-1 WLS2-1 DB2-1
Filesystem Loss of Product Binaries Volume Force product binaries volume to become unavailable
OHS3-1 WLS3-1 n/a
Filesystem Read-Only Product Binaries Volume Force product binaries filesystem / volume mount into read-only mode
n/a WLS3-2 n/a
Filesystem Loss of Configuration Volume Force configuration volume to become unavailable
OHS4-1 WLS4-1 n/a
Filesystem Read-only Configuration volume Force configuration filesystem / volume mount into read-only mode
n/a WLS4-2 n/a
Filesystem Loss of Runtime Volume Force shared runtime volume to become unavailable
n/a WLS5-1 n/a
Filesystem Read-only runtime filesystem Force runtime filesystem mount into read-only mode
n/a WLS5-2 n/a
Filesystem File corruption of runtime files Simulate corrupted configuration files. Inject random bytes into files
n/a WLS5-3 n/a
Network Connectivity Loss Simulate loss of connectivity - NIC Card total failure. Shutdown bonded interface to network for the host
OHS5-1 WLS6-1 DB3-1
25 | Key Performance Indicators and Testing for Oracle Fusion Middleware 12c High Availability
Result Summary
Testing confirms known HA fault tolerance behavior for the tested Oracle Fusion Middleware components. Some noteworthy observations resulted from the basic set of fault-case testing performed for this paper. Some measurable improvements in fault-tolerance were achieved through configuration tuning.
» Web-Tier client connection error rates improved 87% based on type of health-check monitoring used at the Load-Balancer.
» WCP: verified that new socket requests experienced connection timeouts and resulted in connection errors for Web-Tier to App-Tier connections while the WLS server failed during WLS unplanned outage fault injection. This was expected and verified during WCP testing.
» SOA: JMS Server Automatic Service Migration functioned properly with expected short period of errors at fault recovery when OHS sensed WLS server was online but in reality, the JMS server had not yet initialized.
» Database tuning best practices can reduce duration of delay after loss of a RAC node before entering cluster reconfiguration to evict the downed node. Only one SOA test case exhibited total connection loss for relevant datasources during the tested set of DB outage fault scenarios.
» All evaluated FMW Upper-Stack App-Tier: (WSM/SOA/WCP) performed efficient session migration to surviving cluster members in all fault cases.
Results: Web Tier Fault Testing
Notable observations from the Oracle HTTP Server fault case testing include:
» Web-Tier client connection error rates improved with Load-Balancer tuning » A 87% reduction of connection errors between the load-balancer and web-tier services during OHS server
outages. » The improvement is due to a change in the load-balancer server pool monitoring to use in-band passive
monitoring of real-time user connections instead of standard “retry/timeout-style” out-of-band active monitoring techniques with separate health monitor requests.
» Passive monitoring of client traffic for load-balancer pool member availability has been found to be much more sensitive and able to react in real-time to reallocate socket connections to available servers without significant errors or loss of transactions.
» Caveat: this type of monitoring feature may or may not be available in some load-balancer/traffic-management products.
» Results were combined and averaged across all three application test cases. » All test case scenarios were designed to maintain session persistence for the length of the test for each virtual
test user for all script iterations within each test run. Once an existing session was failed over to a healthy instance, it remained there for the duration of the workload test.
» After fault recovery, load remained asymmetric on the node that survived the outage and did not rebalance. Any new user sessions would be expected to distribute appropriately across all OHS instances. All long-running sessions will eventually close and allow load to even out across the servers. This was not evaluated directly as available script development and testing time was limited and this behavior is understood to be well-known.
» Even with the asymmetric load induced on the surviving OHS server due to the failed-over sessions, performance degradation was not observed. Baseline test hit-rates were scaled intentionally to remain stable during “n-1” fault conditions so changes in KPI metrics would be a direct result of the reaction of the system to the fault rather than any performance bottlenecks.
The Oracle HTTP Server fault case testing, included multiple planned and unplanned outages executed against three FMW application test scripts. Details on the specific fault cases can be found in Appendix A – Detailed Fault Case Test Plans while the test case scenarios are itemized in Appendix B – Test Case Scenario Details.

26 | Key Performance Indicators and Testing for Oracle Fusion Middleware 12c High Availability
Tests were initially performed with a load balancer configuration including traditional active health check monitoring of the OHS server pool using separate out-of-band HTTP requests to detect server availability. Lengthy service interruptions were observed while the active health check monitors required multiple timeout & retry attempts before invalidating an unavailable OHS server. Incoming client traffic would continue to be directed to the unavailable server during this period and ultimately fail.
In an attempt to improve upon the results, the load balancer was reconfigured with alternative settings to passively monitor actual in-band client traffic and attempt to re-connect those TCP sockets as necessary. No explicit additional health-check traffic was generated as a result, and client connections were automatically retried and redirected to alternate servers transparently rather than allowed to time-out and fail. Table 2: Web-Tier Fault Testing Results provides the summary of the percentage of active user populated effected with errors and the duration while errors were encountered.
As part of the data acquisition and analysis effort, client transactions, hits, and error rate KPI metrics were gathered from the Oracle Application Testing Suite (OATS). OHS server availability and current client connection metrics were acquired from the load-balancer appliance via SNMP. Post-processing of the OHS logs was performed to gather the average server time spent on the request (time-to-last-byte).
All KPI data acquired was transformed and loaded into Microsoft Excel for aggregation and graphing. Additional data was added manually to allow illustration of the time period from fault injection to fault recovery. The fault period is shown as a gray shaded region on the graphs.
TABLE 4: WEB-TIER FAULT TESTING RESULTS
Statistic Planned Faults Unplanned Faults Fault Case Scenario OHS1-1 Instance Shutdown OHS1-2 Instance Crash OHS2-1 Host Crash
Load Balancer Monitor Type Passive LBR Monitoring
Active LBR Monitoring
Passive LBR Monitoring
Active LBR Monitoring
Passive LBR Monitoring
Active LBR Monitoring
Performance Lag (All Users) None None None None None None
Service Interruption (% Users) 15% 55% 0% 54% 0% 45%
Service Interruption (Time) 15 seconds 41 seconds 0 seconds 20 seconds 0 seconds 34 seconds
Note: Actual percentages for “Service Interruption” will vary corresponding to cluster size and traffic distribution. The test environment included two servers per cluster. Loss of a cluster node or service with traditional load-balancing and monitoring results in roughly 50% +/- 5% of user traffic effected. This correlates to a standard “n-1” outage.
Service Interruption results data are aggregated across all application test scripts and will not match illustrated analysis graph data precisely.
Analysis: Service Interruption and Load Balancer Monitoring Enhancements
For the “planned” OHS Instance Shutdown fault case scenarios (OHS1-1), user/client requests experienced service interruptions for a relatively short duration immediately upon shutdown and then resumed . All of the “unplanned” fault case scenarios (OHS1-2 and OHS2-1) indicate complete elimination of all functional errors when the enhanced passive monitoring approach was implemented. Only selected results graphs are shown as examples.
OHS1-1 tests for WSM-PM and WCP indicate a significant reduction, but not an elimination, of client-facing errors when implementing enhanced passive load-balancer monitoring. OHS1-1 SOA Web Service / JMS testing and all

27 | Key Performance Indicators and Testing for Oracle Fusion Middleware 12c High Availability
OHS1-2 and OHS2-1 scenarios for all tested applications indicate a complete elimination of all functional errors that occurred due to the fault when using traditional active load-balancer monitoring of the OHS servers.
TABLE 5: OHS1-1 TESTING SUMMARY OF IMPROVEMENTS TO SERVICE INTERRUPTION STATISTICS WITH LOAD BALANCER TUNING
Statistic Condition WSM-PM WCP SOA Overall Avg. Duration of Interruption (sec.) Active Monitor 41 41 41 41
Duration of Interruption (sec.) Passive Monitor 25 19 0 15
% Users with Errors Active Monitor 46% 46% 73% 55%
% Users with Errors Passive Monitor 6% 12% 0% 15%
Improvement in Duration (%) Delta Change 39% 54% 100% 64%
Improvement in % Client errors (%) Delta Change 87% 74% 100% 87%
Figure 8: Test Results Analysis - OHS1-1 WSM-PM Active / Passive Load Balancer Monitoring Comparison

28 | Key Performance Indicators and Testing for Oracle Fusion Middleware 12c High Availability
Figure 9: Test Results Analysis - OHS1-1 WCP Active / Passive Load Balancer Monitoring Comparison
Figure 10: Test Results Analysis - OHS1-1 SOA Active / Passive Load Balancer Monitoring Comparison

29 | Key Performance Indicators and Testing for Oracle Fusion Middleware 12c High Availability
Figure 11: Test Results Analysis – OHS2-1 WCP Active / Passive Load Balancer Monitoring Comparison

30 | Key Performance Indicators and Testing for Oracle Fusion Middleware 12c High Availability
Results: Application Tier - Web Services Manager – Policy Manager
Notable observations from the Oracle WebLogic Server and Database fault case testing include:
» All transactions completed or were failed over successfully during fault injection, resulting on no service interruption and zero end-user errors
» A 4x performance lag was seen during WebLogic Server fault tests for several minutes after fault injection that returned to normal baseline rates prior to server fault recovery.
» All existing user sessions failed over to surviving server properly. Workloads were designed to maintain session persistence over iterations for the lifetime of the test. By design, long-running sessions will not re-balance back to restored servers.
» No noticeable performance lag was seen during database fault testing
Aggregated results for the WSM-PM application testing with all six fault scenario test cases for Phase 2 are presented in Table 6: WSM-PM Application Tier Fault Testing Results Summary.
TABLE 6: WSM-PM APPLICATION TIER FAULT TESTING RESULTS SUMMARY
Statistic Planned Faults Unplanned Faults Fault case scenario WLS1-1
WLS Instance Shutdown
DB1-1 DB Instance Shutdown
WLS1-2 WLS Instance
Crash
WLS2-1 WLS Host
Crash
DB1-2 DB Instance
Crash
DB2-1 DB Host Crash
Performance Lag (All Users) Yes at fault injection
None Yes at fault injection
Yes at fault injection
None None
Service Interruption (% Users) 0% 0% 0% 0% 0% 0%
Service Interruption (Time) 0 seconds 0 seconds 0 seconds 0 seconds 0 seconds 0 seconds
Analysis: Session Persistence
By watching the OpenSessionsCurrentCount metric on the WLS Managed Servers, we can see evidence that all of the existing sessions failed-over to the surviving application server and remained on the surviving server upon fault recovery. This is due to the design of the Oracle HTTP Server WLS Module (mod_wls). Existing sessions remain pinned to a managed server as long as that server is available.
Figure 12: WLS Session Distribution - Open Session Counts with Cluster Size – WLS1-2 Instance Crash – WSM-PM clearly shows that once the fault is injected (gray shaded area), the number of user sessions on the WSM2 server (solid red line) drops to zero for the duration of the test run. Likewise, the number of user sessions on the WSM1 server (dotted red line) raises to the total number of all user sessions (25) for the duration of the test run. If the use of new sessions throughout the test were integral to the test script design, then the new sessions would be distributed upon restoration of the faulted server.

31 | Key Performance Indicators and Testing for Oracle Fusion Middleware 12c High Availability
Figure 12: WLS Session Distribution - Open Session Counts with Cluster Size – WLS1-2 Instance Crash – WSM-PM
Figure 13: Availability vs Performance - WLS1-2 Instance Crash - WSM-PM suggests only a slight deviation in transaction rates with a few spikes in transaction times. Figure 14: WebLogic Server Response Times - WLS1-2 Instance Crash - WSM-PM gives a detailed look at the WLS server response times during the fault. It shows maximum response time spikes up to two seconds with average times remaining between 200-300 milliseconds, spiking up to 550 milliseconds average at the time of the 2 second maximum peak. This equates to a roughly 4x maximum increase in response times as the cluster adjusts to the fault for some users, while most might see a 2x increase. This occurs during a three-minute period of instability immediately after fault injection that returns to normal baseline performance on its own.

32 | Key Performance Indicators and Testing for Oracle Fusion Middleware 12c High Availability
Figure 13: Availability vs Performance - WLS1-2 Instance Crash - WSM-PM
Figure 14: WebLogic Server Response Times - WLS1-2 Instance Crash - WSM-PM

33 | Key Performance Indicators and Testing for Oracle Fusion Middleware 12c High Availability
Results: Application Tier - SOA – Web Service with JMS Messaging
Notable observations from the Oracle WebLogic Server and Database fault case testing include:
» Automatic Service Migration of JMS Servers functioned properly » For WLS Server outages, end-user errors occurred at fault recovery due to how the Oracle HTTP Server
WebLogic Module routes traffic to application-tier. Connections were attempted before the migrated JMS Server became available
» Known gap: Oracle HTTP Server only senses server availability, WebLogic Server “ready-app” feature not integrated into Fusion Middleware upper-stack
» SOA’s data source available connections dropped to zero at time of outage during DB2-1 Host Crash fault tests » Tuning the RAC GI CSS MISSCOUNT value (from default of 60 to MAA recommended value of 30) reduced the
WebLogic Server data source connection outage significantly.
Aggregated results for the SOA JMS Messaging web-service testing with all six fault scenario test cases for Phase 2 are presented in Table 7: SOA JMS Application Tier Fault Testing Results Summary.
TABLE 7: SOA JMS APPLICATION TIER FAULT TESTING RESULTS SUMMARY
Statistic Planned Faults Unplanned Faults Fault case scenario WLS1-1
WLS Instance Shutdown
DB1-1 DB Instance Shutdown
WLS1-2 WLS Instance
Crash
WLS2-1 WLS Host
Crash
DB1-2 DB Instance
Crash
DB2-1 DB Host Crash
Performance Lag (All Users) None Yes at fault injection
None None Yes at fault injection
Yes at fault injection
Service Interruption (% Users) 62% 0% 58% 65% 0% 6%
Service Interruption (Time) 15 seconds 0 seconds 10 seconds 22 seconds 0 seconds 36 seconds
Note: Limited examples of the data analysis are provided. All fault case scenario test results were analyzed and aggregated to report the results in the table above.
Analysis: JMS Messaging
Automatic Service Migration of the JMS server on the faulted SOA server/host occurred at the beginning of the fault period. This can be validated by observing the JMS message received count and pending count metrics. As the SOA1 JMS server is migrated to a surviving SOA managed server, the SOA 1 JMS messages received count metric (green solid line) remains flat indicating it is not receiving messages during the migration. Upon successful migration, the messages received metric begins to increase again and the number of queued requests for the SOA1 JMS server (dotted green line) resets to zero as the JMS server process reinitializes on the new host. While the SOA1 JMS server is inoperative, there is a spike in the messages queued and processed on the SOA2 JMS server (red lines). The JDBC pool connections to the database are all dropped while the RAC Grid Infrastructure recovers from the loss of a database host during the Database Host Crash fault case (DB2-1). The reset of the JDBC pool connections is the cause for the length of the spike in the surviving SOA2 JMS Server MessagesPending Count, while the magnitude of the spike is due to the increased message transaction load induced while the SOA1 JMS Server is unavailable.

34 | Key Performance Indicators and Testing for Oracle Fusion Middleware 12c High Availability
Figure 15: SOA JMS Server Messages during Automatic Service Migration at DB2-1 Host Crash fault
Figure 16: SOA JDBC Pool Connections during DB2-1 Host Crash fault

35 | Key Performance Indicators and Testing for Oracle Fusion Middleware 12c High Availability
Analysis: User-facing Errors during WLS Fault Recovery
For all of the WebLogic Server fault injections, SOA Web Service client transactions experienced errors upon fault recovery. This is due to the nature of the Oracle HTTP Server and the OHS WLS module capability to check the server availability before directing traffic to the restored WLS cluster member. This capability does not account for application availability by default.
Note: Applications and Web Services deployed on WLS can implement code for the ReadyApp feature to help expose when the deployed applications are ready to receive requests. See Using the ReadyApp Framework in the Oracle Fusion Middleware Deploying Applications to Oracle WebLogic Server documentation.
During WLS1-1 and WLS 1-2 fault testing with graceful instance shutdown, and instance crash respectively, user errors occurred upon recovery. With the WLS2-1 host outage, errors occurred upon recovery as well as shortly after the outage was injected as well. These results were averaged over the three iterations of each fault case test. Further root-cause analysis of the additional errors indicated in the WLS2-1 test after fault injection should be investigated.
Figure 17: SOA Web Service Request errors upon recovery of failed SOA Managed Server for tests WLS1-1 & WLS1-2
Figure 18: SOA Web Service Request errors upon recovery of failed SOA Host for test WLS2-1

36 | Key Performance Indicators and Testing for Oracle Fusion Middleware 12c High Availability
Analysis: Transaction Processing – DB2-1 Database Host Crash
During the DB2-1 database host crash fault test with MAA recommended tuning enhancements, the SOA Web Service requests experienced a 71% drop in transaction rate for 45 seconds with 6% of the webservice requests returning errors for 36 seconds with an transient maximum increase in response time to 4.37 seconds. The SOA service resumed stable operations after 55 seconds without recovery of the faulted DB server. This analysis is depicted in the markup on Figure 19: Performance Lag Analysis - DB2-1 Host Crash - SOA Web Service JMS Messaging Test. There was a 10-second lag in transaction rate recovery after the client-facing errors ceased as Grid Infrastructure and RAC database services recovered so application server database pool connections could be re-established as indicated in Figure 16: SOA JDBC Pool Connections during DB2-1 Host Crash fault earlier.
Figure 19: Performance Lag Analysis - DB2-1 Host Crash - SOA Web Service JMS Messaging Test

37 | Key Performance Indicators and Testing for Oracle Fusion Middleware 12c High Availability
Analysis: Effect of Tuning DB CSS Misscount Value
The tuning of the CSS misscount parameter on the RAC database provided significant improvement in the recovery of SOA Web Service availability and performance during unplanned loss of a DB node. The CSS misscount timeout period is the delay before CRS node eviction once a DB host becomes unavailable. While it may be beneficial in certain circumstances to increase the misscount timeout value, the analysis in Figure 20: SOA Web Service Performance Comparison with Database CSS Misscount Tuning indicates a notable enhancement to application performance for SOA Web Services utilizing JMS queues in this particular fault case scenario.
Always test your specific implementation. The reaction of an application or service during a fault scenario to a tuning change cannot be predicted by the results of other dis-similar applications, services, or environments.
TABLE 8: SUMMARY OF IMPROVEMENTS WITH DB MISSCOUNT TUNING
Calculated KPI Metric Analysis Description No Tuning With Tuning % Change Tx Rate Recovery Period
Request Tx/sec. Time period between change in Tx rate out of nominal range until return to nominal pre-outage levels
120 sec. 55 sec. -65 sec. 54% improvement
Server Response Time Recovery Period
Svr Resp. Time Time period between change in server response time out of nominal range until return to nominal pre-outage levels
70 sec. 25 sec. -25 sec. 64% improvement
Max Peak Server Response Time.
Svr Resp. Time Highest 1 sec. avg. Time to Last Byte returned to web server from application-tier
11.43 sec. 4.37 sec. -7.06 sec. 61.7% improvement
Avg. Nominal Tx Rate Request Tx/sec. Average Tx Rate calculated during baseline tests and pre-outage period
47.01 tx/sec. 46.56 tx/sec. n/a
Min. Tx Rate Request Tx/sec. Minimum Tx Rate observed during outage-period
5.39 tx/sec. 3.42 tx/sec. +8.03 tx/sec. improvement
Max Tx Rate Change Request Tx/sec. Difference between Avg. Nominal and Minimum Tx Rates
-41.62 tx/sec. (-88.53%)
33.14 tx/sec. (-71.18%)
18.04% improvement
Tx Rate Recovery Lag Request Tx/sec. Lag time after user errors cease before recovery is complete and the nominal transaction rate is achieved
60 sec. 0 sec. -50 sec. 83.33% improvement

38 | Key Performance Indicators and Testing for Oracle Fusion Middleware 12c High Availability
Figure 20: SOA Web Service Performance Comparison with Database CSS Misscount Tuning
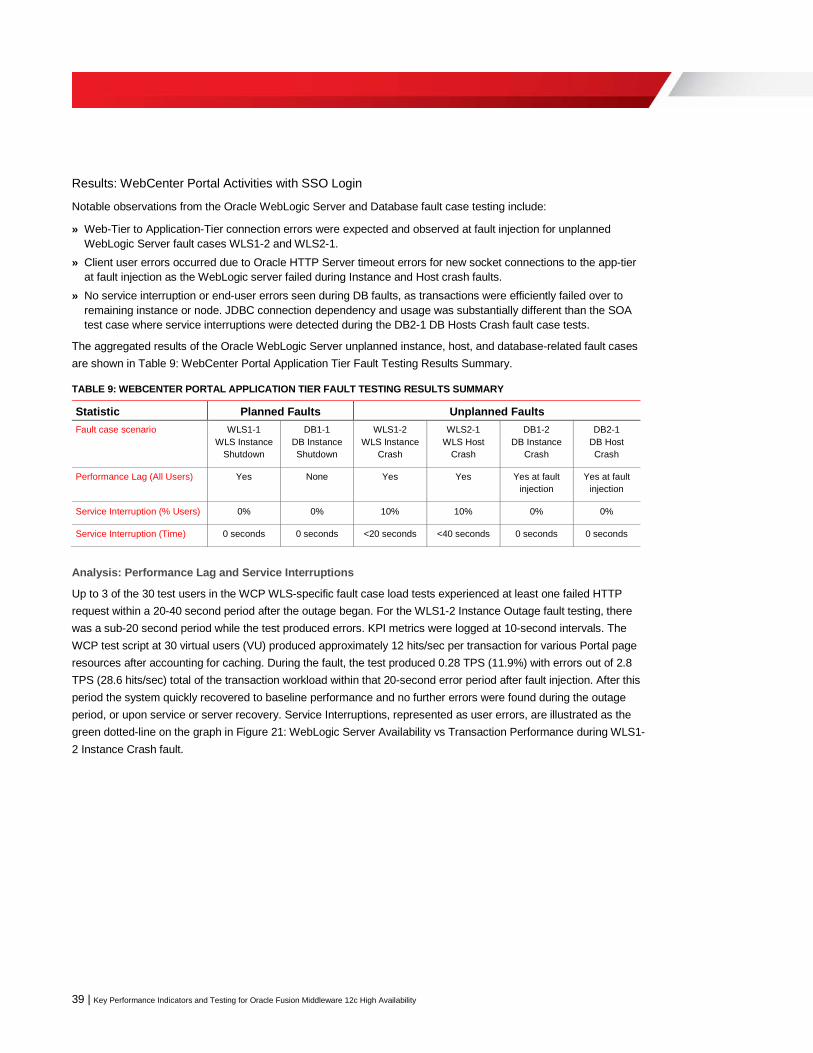
39 | Key Performance Indicators and Testing for Oracle Fusion Middleware 12c High Availability
Results: WebCenter Portal Activities with SSO Login
Notable observations from the Oracle WebLogic Server and Database fault case testing include:
» Web-Tier to Application-Tier connection errors were expected and observed at fault injection for unplanned WebLogic Server fault cases WLS1-2 and WLS2-1.
» Client user errors occurred due to Oracle HTTP Server timeout errors for new socket connections to the app-tier at fault injection as the WebLogic server failed during Instance and Host crash faults.
» No service interruption or end-user errors seen during DB faults, as transactions were efficiently failed over to remaining instance or node. JDBC connection dependency and usage was substantially different than the SOA test case where service interruptions were detected during the DB2-1 DB Hosts Crash fault case tests.
The aggregated results of the Oracle WebLogic Server unplanned instance, host, and database-related fault cases are shown in Table 9: WebCenter Portal Application Tier Fault Testing Results Summary.
TABLE 9: WEBCENTER PORTAL APPLICATION TIER FAULT TESTING RESULTS SUMMARY
Statistic Planned Faults Unplanned Faults Fault case scenario WLS1-1
WLS Instance Shutdown
DB1-1 DB Instance Shutdown
WLS1-2 WLS Instance
Crash
WLS2-1 WLS Host
Crash
DB1-2 DB Instance
Crash
DB2-1 DB Host Crash
Performance Lag (All Users) Yes None Yes Yes Yes at fault injection
Yes at fault injection
Service Interruption (% Users) 0% 0% 10% 10% 0% 0%
Service Interruption (Time) 0 seconds 0 seconds <20 seconds <40 seconds 0 seconds 0 seconds
Analysis: Performance Lag and Service Interruptions
Up to 3 of the 30 test users in the WCP WLS-specific fault case load tests experienced at least one failed HTTP request within a 20-40 second period after the outage began. For the WLS1-2 Instance Outage fault testing, there was a sub-20 second period while the test produced errors. KPI metrics were logged at 10-second intervals. The WCP test script at 30 virtual users (VU) produced approximately 12 hits/sec per transaction for various Portal page resources after accounting for caching. During the fault, the test produced 0.28 TPS (11.9%) with errors out of 2.8 TPS (28.6 hits/sec) total of the transaction workload within that 20-second error period after fault injection. After this period the system quickly recovered to baseline performance and no further errors were found during the outage period, or upon service or server recovery. Service Interruptions, represented as user errors, are illustrated as the green dotted-line on the graph in Figure 21: WebLogic Server Availability vs Transaction Performance during WLS1-2 Instance Crash fault.

40 | Key Performance Indicators and Testing for Oracle Fusion Middleware 12c High Availability
Figure 21: WebLogic Server Availability vs Transaction Performance during WLS1-2 Instance Crash fault
Short and transient performance lags are also indicated during most planned and unplanned fault cases. These lags occur immediately after faults injection and recovery. As a result, transaction rates metrics show a slight reduction corresponding to the reduced hit rate caused by the longer response times. Database-related fault analysis was covered extensively earlier, however it is noteworthy that during the WebCenter application testing we did not log any database outage-related Portal application service interruptions, perhaps due to the differences in the nature of the SOA JMS web service and the portal application functionality used for this set of testing.

41 | Key Performance Indicators and Testing for Oracle Fusion Middleware 12c High Availability
Figure 22: Server Response Times during WLS1-2 Instance Crash fault
Note: Test scripts for actual business-purposes should include a mix of reoccurring short-lived and long-running sessions appropriately representing the expected workload.
Due to the design of load test scripts used in this case-study to minimize data variability during the evaluation of HA KPI, all users maintain a single session for the length of the test, authenticating only once at the beginning and logging out upon completion of the last test iteration. As a result, consistent with the web-tier testing discussed earlier, the response time data for the WCP2 server ends at fault injection. See the red line on the graph in Figure 22: Server Response Times during WLS1-2 Instance Crash fault. Existing sessions will not re-balance back to restored managed servers in the WebLogic Server cluster unless the sessions’ current server fails, while new sessions would be distributed appropriately (if tested, not shown). The behavior for existing sessions is illustrated in Figure 23: WebLogic Server HTTP Session distribution during WLS1-2 Instance Crash fault.

42 | Key Performance Indicators and Testing for Oracle Fusion Middleware 12c High Availability
Figure 23: WebLogic Server HTTP Session distribution during WLS1-2 Instance Crash fault

43 | Key Performance Indicators and Testing for Oracle Fusion Middleware 12c High Availability
On-Going Operational Monitoring & SLA Compliance Validation
Using Test Data as Baseline Data for Fault Recovery Maintenance Timings
Some fault events may not recovery immediately upon execution of operational procedures to restore the failed server or services. Some Fusion Middleware services may need to transition services back to a restored server. Java Message Server (JMS) services are a good example of this. Full production baseline transaction rate recovery may lag behind the end of maintenance procedures as shown in Figure 24: SOA JMS Web Service Transaction Rate Lag upon Fault Recovery. The SOA Managed Server is restored by operations maintenance (red line is cluster server count KPI), but the transaction rate lags behind as in-flight JMS queue-related transactions fail and retry as the JMS server instance is re-allocated back to the restored server.
Note: JMS transaction rates under production-scale loads may significantly lengthen the observed lag. Explicit testing of actual business transaction volume should be conducted to assess risk and any impact this may have on timing for local site recovery vs DR switch-over.
Results presented here are based on minimal transaction volume and payload size.
Figure 24: SOA JMS Web Service Transaction Rate Lag upon Fault Recovery
Informing DR Switch-Over Decisions
Depending on the severity/duration of any identified post-recovery lags under representative full-scale load which extend the actual recovery time of the system, the time horizon for a go/no-go decision regarding any DR switch-over may be shorter than the expected maintenance recovery process execution timing.

44 | Key Performance Indicators and Testing for Oracle Fusion Middleware 12c High Availability
Recommendations for SLA Compliance Validation Monitoring
Once acceptable runtime baseline KPI value ranges are determined through testing, and KPI value range violations for pertinent high-risk fault conditions are characterized, this data can integrated into your operational monitoring systems. Oracle Enterprise Manager Cloud Control (EMCC) in conjunction with Oracle Real User Experience Insight (RUEI) has several highly-flexible features for monitoring application performance and SLA violations. Service availability, performance metrics, and service level objectives can all be configured. Monitoring can be customized and personalized for various operations and business roles in a services dashboard view.
For details on defining services with availability and performance tests, SLA, and associated service level objectives in EMCC, see Configuring and Using Services in the Enterprise Manager Cloud Control Administrator's Guide, release 13.2.
For more information on overall application performance monitoring with EMCC & RUEI, see Part IV Monitoring Application Performance of the Enterprise Manager Cloud Control Oracle Fusion Middleware Management Guide.

45 | Key Performance Indicators and Testing for Oracle Fusion Middleware 12c High Availability
Appendix A: Detailed Fault Case Test Plans Explicit fault case tests plans are itemized here by the Oracle Fusion Middleware component most effected by the fault scenario, even if the fault may be injected and recovered against a related infrastructure service such as a Load Balancer Appliance, Hypervisor command interface, Operating System network interface, or Network Attached Storage array.
For the Oracle Fusion Middleware Enterprise Reference Architecture, the service categorizations for the fault case nomenclature include the following services:
» Oracle HTTP Server » Oracle WebLogic Server » Oracle Database (RAC)
Oracle HTTP Server Fault Cases
Fault Case ID OHS1-1: Planned OHS Shutdown » Description: Simulates a planned shutdown of an OHS instance. » Execution: OHS command line OHS_DOMAIN_HOME/bin/stopComponent.sh script. » Recovery: OHS command line OHS_DOMAIN_HOME/bin/startComponent.sh script » Test key performance indicators:
» LBR pool member status » LBR to OHS Connection Count
» Expected results: LBR removes failed OHS server from active status after retries and timeout intervals are exhausted. Prior to the LBR monitor timeout interval, requests to the failed pool member are expected to fail. Requests after the timeout interval should succeed via the remaining OHS instances. Corresponding OHS key performance indicators should indicate the correlated shift in traffic. Application session/request key performance indicator should not deviate significantly except for the few failed requests during the fault injection prior to LBR monitor timeout ejects the pool member. Overall test throughput should not be impacted significantly if LBR retry/timeout intervals are sufficiently short.
Fault Case ID OHS1-2: Unplanned OHS Shutdown » Description: Simulates an unplanned shutdown of an OHS instance. » Execution: OHS command line kill -9 [PID] on OHS processes » Recovery: OHS command line OHS_DOMAIN_HOME/bin/startComponent.sh script » Test key performance indicators:
» LBR pool member status » LBR to OHS Connection Count
» Expected results: LBR removes failed OHS server from active status after retries and timeout intervals are exhausted. Prior to the LBR monitor timeout interval, requests to the failed pool member are expected to fail. Requests after the timeout interval should succeed via the remaining OHS instances. Corresponding OHS key performance indicators should indicate the correlated shift in traffic. Application session/request key performance indicator should not deviate significantly except for the few failed requests during the fault injection prior to LBR monitor timeout ejects the pool member. Overall test throughput should not be impacted significantly if LBR retry/timeout intervals are sufficiently short.

46 | Key Performance Indicators and Testing for Oracle Fusion Middleware 12c High Availability
Fault Case ID OHS2-1: OHS Host Failure » Description: Simulates an unplanned outage of an OHS host machine » Execution: Connect to hosting compute node and execute xm destroy [VM_ID] » Recovery: OHS command line OHS_DOMAIN_HOME/bin/startComponent.sh script after rebooted server
completes startup » Test key performance indicators:
» LBR pool member status » LBR to OHS Connection Count
» Expected results: LBR removes failed OHS server from active status after retries and timeout intervals are exhausted. Prior to the LBR monitor timeout interval, requests to the failed pool member are expected to fail. Requests after the timeout interval should succeed via the remaining OHS instances. Corresponding OHS key performance indicators should indicate the correlated shift in traffic. Application session/request key performance indicator should not deviate significantly except for the few failed requests during the fault injection prior to LBR monitor timeout ejects the pool member. Overall test throughput should not be impacted significantly if LBR retry/timeout intervals are sufficiently short. Rebooted host should recover upon up status.
Fault Case ID OHS3-1: OHS Network Down » Description: Simulates a network failure between the LBR and OHS hosts » Execution: OHS command line ifconfig <interface> down » Recovery: OHS command line ifconfig <interface> up and restart OHS (if applicable) » Test key performance indicators:
» LBR pool member status » LBR to OHS Connection Count
» Expected results: LBR removes failed OHS server from active status after retries and timeout intervals are exhausted. Prior to the LBR monitor timeout interval, requests to the failed pool member are expected to fail. Requests after the timeout interval should succeed via the remaining OHS instances. Corresponding OHS key performance indicators should indicate the correlated shift in traffic. Application session/request key performance indicator should not deviate significantly except for the few failed requests during the fault injection prior to LBR monitor timeout ejects the pool member. Overall test throughput should not be impacted significantly if LBR retry/timeout intervals are sufficiently short.

47 | Key Performance Indicators and Testing for Oracle Fusion Middleware 12c High Availability
Oracle WebLogic Server Fault Cases
Fault Case ID WLS1-1: WebLogic Graceful Shutdown » Description: Simulates a planned WebLogic server shutdown where current work is allowed to complete » Execution: Use wlst to stop managed server: shutdown('[SERVER]', 'Server', block='true') » Recovery: Use wlst to start managed server: start('[SERVER]', 'Server', block='true') » Test key performance indicators:
» All Basic Key Performance Indicators » weblogic.management.runtime.WebAppComponentRuntimeMBean.OpenSessionsCurrentCount » weblogic.management.runtime.ClusterRuntimeMBean.AliveServerCount » weblogic.management.runtime.ServerRuntimeMBean.StateVal » weblogic.management.runtime.JMSRuntimeMBean.HealthState (if applicable)
» Expected results: OHS removes failed WLS server from active status after retries and timeout intervals are exhausted. All work should complete and no application errors should be seen. Corresponding WLS key performance indicators should indicate the correlated shift in traffic. Application session/request key performance indicator should not deviate significantly except for the few failed requests during the fault injection prior to OHS timeout ejects the pool member. Overall test throughput should not be impacted significantly if OHS intervals are sufficiently short.
Fault Case ID WLS1-2: WebLogic Forced Shutdown » Description: Simulates a planned WebLogic server shutdown where current work is not allowed to complete » Execution: Use kill -9 [PID] on WebLogic Managed Server Instance Process » Recovery: Use wlst to start managed server: start('[SERVER]', 'Server', block='true') » Test key performance indicators:
» All Basic Key Performance Indicators » weblogic.management.runtime.WebAppComponentRuntimeMBean.OpenSessionsCurrentCount » weblogic.management.runtime.ClusterRuntimeMBean.AliveServerCount » weblogic.management.runtime.ServerRuntimeMBean.StateVal » weblogic.management.runtime.JMSRuntimeMBean.HealthState (if applicable)
» Expected results: OHS removes failed WLS server from active status after retries and timeout intervals are exhausted. Prior to the OHS timeout interval, requests to the failed pool member are expected to fail. Requests after the timeout interval should succeed via the remaining WLS instance(s). Application errors may be seen due to abrupt server failure. Corresponding WLS key performance indicators should indicate the correlated shift in traffic. Application session/request key performance indicator should not deviate significantly except for the few failed requests during the fault injection prior to OHS timeout ejects the pool member. Overall test throughput should not be impacted significantly if OHS intervals are sufficiently short.
Fault Case ID WLS2-1: WebLogic Host Failure » Description: Simulates an unplanned outage of an OHS host machine » Execution: Connect to hosting compute node and execute xm destroy [VM_ID] » Recovery: vDC management will automatically shift the VM to a different compute node and restart. Once up and
running, the node manager and all WebLogic managed servers on that VM will need to be restarted via wls" » Test key performance indicators:
» All Basic Key Performance Indicators » weblogic.management.runtime.WebAppComponentRuntimeMBean.OpenSessionsCurrentCount

48 | Key Performance Indicators and Testing for Oracle Fusion Middleware 12c High Availability
» weblogic.management.runtime.ClusterRuntimeMBean.AliveServerCount » weblogic.management.runtime.ServerRuntimeMBean.StateVal » weblogic.management.runtime.JMSRuntimeMBean.HealthState (if applicable)
» Expected results: OHS removes failed WLS server from active status after retries and timeout intervals are exhausted. Prior to the OHS timeout interval, requests to the failed pool member are expected to fail. Requests after the timeout interval should succeed via the remaining WLS instance(s). Corresponding WLS key performance indicators should indicate the correlated shift in traffic. Application session/request key performance indicator should not deviate significantly except for the few failed requests during the fault injection prior to OHS timeout ejects the pool member. Overall test throughput should not be impacted significantly if OHS intervals are sufficiently short. Rebooted host should recover upon up status.
Fault Case ID WLS3-1: WebLogic NFS Storage Head Switchover » Description: Simulates a ZFS network share appliance head switchover to the WebLogic file shares » Execution: From the ZFS BUI, Select the Configuration > cluster menu then click the “Failover”
button » Recovery: From the ZFS BUI, Select the Configuration > cluster menu item then click the “Failback”
button » Test key performance indicators:
» All Basic Key Performance Indicators » weblogic.management.runtime.WebAppComponentRuntimeMBean.OpenSessionsCurrentCount » weblogic.management.runtime.ClusterRuntimeMBean.AliveServerCount » weblogic.management.runtime.ServerRuntimeMBean.StateVal » weblogic.management.runtime.JMSRuntimeMBean.HealthState (if applicable)
» Expected results: No effect during runtime, failure during restart of server
Fault Case ID WLS3-2: WebLogic Runtime NFS Storage Unmount » Description: Simulates an the unmounting of the WebLogic runtime file location » Execution: WLS command line umount ORACLE_RUNTIME -f » Recovery: WLS command line mount ORACLE_RUNTIME and restart managed server at AdminServer console
or via WLST (if applicable) » Test key performance indicators:
» All Basic Key Performance Indicators » weblogic.management.runtime.WebAppComponentRuntimeMBean.OpenSessionsCurrentCount » weblogic.management.runtime.ClusterRuntimeMBean.AliveServerCount » weblogic.management.runtime.ServerRuntimeMBean.StateVal » weblogic.management.runtime.JMSRuntimeMBean.HealthState (if applicable)
» Expected results: Affects file adapter during runtime. (NFS file references are kept for open files, only files that are being opened again will face problems). Failure during restart of server
Fault Case ID WLS3-3: WebLogic Runtime NFS Storage Read-Only » Description: Simulates the WebLogic runtime file location becoming read-only » Execution: Change mode of ORACLE_RUNTIME share at ZFS BUI to be read-only » Recovery: Change mode of ORSCLE_RUNTIME share at ZFS BUI to be read/write and restart managed server at
AdminServer console or via WLST (if applicable) » Test key performance indicators:
» All Basic Key Performance Indicators

49 | Key Performance Indicators and Testing for Oracle Fusion Middleware 12c High Availability
» weblogic.management.runtime.WebAppComponentRuntimeMBean.OpenSessionsCurrentCount » weblogic.management.runtime.ClusterRuntimeMBean.AliveServerCount » weblogic.management.runtime.ServerRuntimeMBean.StateVal » weblogic.management.runtime.JMSRuntimeMBean.HealthState (if applicable) » EM Host Target monitoring of NFS shares
» Expected results: Affects file adapter during runtime. It affects all file stores but does not cause the servers to go into failed state. Specifically for JMS stores messages are not written until paging is required or memory limits are reached according to the JMS server tuning. Failure during restart of server.
Fault Case ID WLS4-1: WebLogic Network Down » Description: Simulates a network failure between the OHS and WLS hosts » Execution: WLS command line ifconfig <interface> down » Recovery: WLS command line ifconfig <interface> up and restart managed server at AdminServer
console or via WLST » Test key performance indicators:
» All Basic Key Performance Indicators » weblogic.management.runtime.WebAppComponentRuntimeMBean.OpenSessionsCurrentCount » weblogic.management.runtime.ClusterRuntimeMBean.AliveServerCount » weblogic.management.runtime.ServerRuntimeMBean.StateVal » weblogic.management.runtime.JMSRuntimeMBean.HealthState (if applicable)
» Expected results: OHS removes failed server from active status after retries and timeout intervals are exhausted. Prior to the OHS timeout interval, requests to the failed pool member are expected to fail. Overall test throughput should not be impacted significantly if OHS intervals are sufficiently short.

50 | Key Performance Indicators and Testing for Oracle Fusion Middleware 12c High Availability
Oracle Database Server Fault Cases
Fault Case ID DB1-1: Database Planned RAC Instance Outage » Description: Simulates a planned RAC instance shutdown where current work is allowed to complete » Execution: DB command line: shutdown transactional command from sqlplus prompt: echo -e "shutdown transactional\nexit" | sqlplus / as sysdba
» Recovery: DB command line: srvctl start instance command » Test key performance indicators:
» Database RAC node target up/down (via EM) » weblogic.management.runtime.JDBCDataSourceRuntimeMBean.ConnectionsTotalCount
» Expected results: Current transactions on RAC instance with requested shutdown should successfully complete, connections should be terminated upon transaction completion, and instance should come down successfully. There should not be any transaction errors in logs. All database traffic from the point of requested shutdown should be routed to the remaining RAC instance.
Fault Case ID DB1-2: Database Unplanned RAC Instance Outage » Description: Simulates an unplanned RAC instance shutdown where current work not allowed to complete » Execution: DB command line: shutdown abort command from sqlplus prompt echo -e "shutdown abort\nexit" | sqlplus / as sysdba
» Recovery: DB command line: srvctl start instance command » Test key performance indicators:
» Database RAC node target up/down (via EM) » weblogic.management.runtime.JDBCDataSourceRuntimeMBean.ConnectionsTotalCount
» Expected results: Current transactions on RAC instance with forced shutdown should be rolled back. Transaction errors will most likely be seen in WebLogic logs. All database traffic from the point of requested shutdown should be routed to the remaining RAC instance.

51 | Key Performance Indicators and Testing for Oracle Fusion Middleware 12c High Availability
Fault Case ID DB2-1: Database RAC Instance Host Failure » Description: Simulates an unplanned outage of a RAC instance host machine » Execution: Perform a Power Cycle from one RAC node's ILOM UI
[ILOM_URL] > Host Management > Power Control > --Select Action--: Power Cycle
> Save
» Recovery: DB command line: srvctl start instance command after rebooted server completes startup » Test key performance indicators:
» Database RAC node target up/down (via EM) » weblogic.management.runtime.JDBCDataSourceRuntimeMBean.ConnectionsTotalCount
» Expected results: Current transactions on RAC instance with forced shutdown would be hung and would not be rolled back. Transaction errors will most likely be seen in WebLogic logs. All database traffic from the point of the instance failure should be routed to the remaining RAC instance. Possible data corruption could result from incomplete transactions, which were not rolled back.
Fault Case ID DB3-1: Database RAC Instance Network Down » Description: Simulates a network failure between the WLS and database RAC instance hosts » Execution: DB command line ifconfig <interface> down » Recovery: DB command line ifconfig <interface> down and srvctl start instance command to
restart instance » Test key performance indicators:
» Database RAC node target up/down (via EM) » weblogic.management.runtime.JDBCDataSourceRuntimeMBean.ConnectionsTotalCount
» Expected results: Current transactions on RAC instance with forced shutdown would be hung and would not be rolled back. Transaction errors will most likely be seen in WebLogic logs. All database traffic from the point of the instance failure should be routed to the remaining RAC instance. Possible data corruption could result from incomplete transactions, which were not rolled back.

52 | Key Performance Indicators and Testing for Oracle Fusion Middleware 12c High Availability
Appendix B: Test Case Scenario Details The following Fusion Middleware web-applications and services use-cases were tested as the basis for this paper. They were selected due to their simplicity as a way to validate the testing methodology, KPI metrics selection and analysis processes. The test cases represented here serve as examples and do not reflect the entire combination of Oracle Fusion Middleware application or services functionality available.
Web Services Manager – Policy Manager (WSM-PM)
The Policy Manager is an integral part of almost every component in the Fusion Middleware stack. It is how non-SSO authentication is configured.
Use Case Details
» Iteration completes a successful basic authentication login of one of one thousand users set up on an Oracle Identity Management (IDM) server.
» Once authenticated, the user accesses the WSM-PM home page. » From the base page, the user selects the Policy Manager page and views the listing of WSM policies » Each new iteration has the user accessing the home page, then the Policy Manager page until the end of the
workload, when the user logs out of the its session and closes its browser.=
Service Oriented Architecture (SOA) JMS Messaging and Web Services
JMS messaging is only one small function of the SOA application and its services. This functionality was selected, as it creates and writes messages to a JMS queue for use by other applications. It is a common functionality of SOA end users.
Use Case Details
» At iteration start, the present time (hh:mm:ss.0) is queried to write into a JMS message. » The JMS_Producer_composite_v2 SOA composite reads from the web service input and uses the JMS Adapter
for writing messages into the jms/dist_sample_queue. » Then the JMS_Consumer_composite SOA composite reads from the queue jms/dist_sample_queue and uses the
FileAdapter to write the message to a local file system.
WebCenter Portal (WCP) Activities and SSO Login
WebCenter Portal has numerous functions and add-on applications, such as WebCenter Content. The use case used is a simple functionality of a registered user’s home portal.
Use Case Details
» User requests the base portal URL and is redirected to authenticate via Oracle Access Manager (OAM) Form Login. This user retains the same SSO login session for the duration of the test. User session cookies are persisted throughout the test script iterations within a test run.
» Once logged in, the user accesses its home portal, which contains the activities page. » The user then creates a time-stamped activity, which writes the activity into the database. » The user then deletes the activity, removing it from the database. » Each iteration has the user accessing the home portal and repeating the activities steps until the end of the
workload, when the user logs out of the its session and closes its browser.

53 | Key Performance Indicators and Testing for Oracle Fusion Middleware 12c High Availability
Appendix C: Referenced Documentation
» Fusion Middleware Enterprise Deployment Guide for Oracle WebCenter Portal Release 12.2.1.3.0
» Enterprise Manager Cloud Control Oracle Fusion Middleware Management Guide
» Administrating Oracle Fusion Middleware – Monitoring Oracle Fusion Middleware
» Fusion Middleware High Availability Guide
» Oracle MAA Reference Architectures - Oracle Database High Availability On-Premises and in the Cloud (PDF)
» Database High Availability Best Practices
» Oracle Database 12c: EM Database Express
» Database Administrator’s Guide 11g – Managing Oracle Enterprise Manager Database Control
» Monitoring Oracle Java Cloud Service Instances Using the Fusion Middleware Control Console (Tutorial)
» Oracle WebLogic Server 12.2.1.3.0 MBean Reference
» Fusion Middleware Configuring and Using the Diagnostics Framework for Oracle WebLogic Server
» Oracle Application Testing Suite Documentation Release 13.2.0.1

Oracle Corporation, World Headquarters Worldwide Inquiries 500 Oracle Parkway Phone: +1.650.506.7000 Redwood Shores, CA 94065, USA Fax: +1.650.506.7200
Copyright © 2018, Oracle and/or its affiliates. All rights reserved. This document is provided for information purposes only, and the contents hereof are subject to change without notice. This document is not warranted to be error-free, nor subject to any other warranties or conditions, whether expressed orally or implied in law, including implied warranties and conditions of merchantability or fitness for a particular purpose. We specifically disclaim any liability with respect to this document, and no contractual obligations are formed either directly or indirectly by this document. This document may not be reproduced or transmitted in any form or by any means, electronic or mechanical, for any purpose, without our prior written permission. Oracle and Java are registered trademarks of Oracle and/or its affiliates. Other names may be trademarks of their respective owners. Intel and Intel Xeon are trademarks or registered trademarks of Intel Corporation. All SPARC trademarks are used under license and are trademarks or registered trademarks of SPARC International, Inc. AMD, Opteron, the AMD logo, and the AMD Opteron logo are trademarks or registered trademarks of Advanced Micro Devices. UNIX is a registered trademark of The Open Group. Oracle Fusion Middleware MAA - Key Performance Indicators for High Availability Authors: Francesco Rizzo, Chuck Boucher
C O N N E C T W I T H U S
blogs.oracle.com/oracle
facebook.com/oracle
twitter.com/oracle
oracle.com