Oracle® Inventory Optimization Preface Intended Audience Welcome to Release 12.2 of the Oracle...
202
Oracle® Inventory Optimization Users Guide Release 12.2 Part No. E48774-01 September 2013
Transcript of Oracle® Inventory Optimization Preface Intended Audience Welcome to Release 12.2 of the Oracle...

Oracle® Inventory OptimizationUsers GuideRelease 12.2Part No. E48774-01
September 2013

Oracle Inventory Optimization Users Guide, Release 12.2
Part No. E48774-01
Copyright © 2013, Oracle and/or its affiliates. All rights reserved.
Primary Author: Margot Murray
Contributing Author: Tom Myers
Oracle and Java are registered trademarks of Oracle and/or its affiliates. Other names may be trademarks of their respective owners.
Intel and Intel Xeon are trademarks or registered trademarks of Intel Corporation. All SPARC trademarks are used under license and are trademarks or registered trademarks of SPARC International, Inc. AMD, Opteron, the AMD logo, and the AMD Opteron logo are trademarks or registered trademarks of Advanced Micro Devices. UNIX is a registered trademark of The Open Group.
This software and related documentation are provided under a license agreement containing restrictions on use and disclosure and are protected by intellectual property laws. Except as expressly permitted in your license agreement or allowed by law, you may not use, copy, reproduce, translate, broadcast, modify, license, transmit, distribute, exhibit, perform, publish, or display any part, in any form, or by any means. Reverse engineering, disassembly, or decompilation of this software, unless required by law for interoperability, is prohibited.
The information contained herein is subject to change without notice and is not warranted to be error-free. If you find any errors, please report them to us in writing.
If this is software or related documentation that is delivered to the U.S. Government or anyone licensing it on behalf of the U.S. Government, the following notice is applicable:
U.S. GOVERNMENT END USERS: Oracle programs, including any operating system, integrated software, any programs installed on the hardware, and/or documentation, delivered to U.S. Government end users are "commercial computer software" pursuant to the applicable Federal Acquisition Regulation and agency-specific supplemental regulations. As such, use, duplication, disclosure, modification, and adaptation of the programs, including any operating system, integrated software, any programs installed on the hardware, and/or documentation, shall be subject to license terms and license restrictions applicable to the programs. No other rights are granted to the U.S. Government.
This software or hardware is developed for general use in a variety of information management applications. It is not developed or intended for use in any inherently dangerous applications, including applications that may create a risk of personal injury. If you use this software or hardware in dangerous applications, then you shall be responsible to take all appropriate fail-safe, backup, redundancy, and other measures to ensure its safe use. Oracle Corporation and its affiliates disclaim any liability for any damages caused by use of this software or hardware in dangerous applications.
This software or hardware and documentation may provide access to or information on content, products, and services from third parties. Oracle Corporation and its affiliates are not responsible for and expressly disclaim all warranties of any kind with respect to third-party content, products, and services. Oracle Corporation and its affiliates will not be responsible for any loss, costs, or damages incurred due to your access to or use of third-party content, products, or services.

iii
Contents
Send Us Your Comments
Preface
1 OverviewOverview of Oracle Inventory Optimization........................................................................... 1-1Stochastic Optimization Technology........................................................................................1-2Business Process........................................................................................................................ 1-3Key Inventory Decisions........................................................................................................... 1-4Input.......................................................................................................................................... 1-5Output........................................................................................................................................ 1-6BIS Key Performance Indicators............................................................................................... 1-7
2 Defining an Inventory PlanRunning an Inventory Plan....................................................................................................... 2-1Copying an Inventory Plan....................................................................................................... 2-3
3 Inventory Plan OptionsPlan Options Overview............................................................................................................. 3-2Plan Options.............................................................................................................................. 3-2Planned Items: ABC Classification........................................................................................... 3-3Selecting Planned Items............................................................................................................ 3-4The Main Tabbed Region......................................................................................................... 3-4Plan Start Date in Future........................................................................................................... 3-7Plan End Date............................................................................................................................ 3-9The Organizations Tabbed Region........................................................................................... 3-9
iv
Using an Existing Plan as a Demand Schedule For a New Plan............................................ 3-12Setting Demand Variability.................................................................................................... 3-12Cumulative Demand Distribution..........................................................................................3-13How Probability Data is Used by Oracle Inventory Optimization....................................... 3-15Weighted Average Calculation............................................................................................... 3-16How to Assign Forecasts and Forecast Sets to Scenario Sets................................................. 3-16Specifying Sources of Demand............................................................................................... 3-19The Constraints Tabbed Region............................................................................................. 3-19Service Level and Fulfillment Lead Time...............................................................................3-23Lead Time Variability............................................................................................................. 3-24Inventory Budget..................................................................................................................... 3-25
4 Key SetupsSetting Plan Level Default Service Level................................................................................. 4-2Setting Plan Level Default Demand Fulfillment Lead Time................................................... 4-2Service Level Set........................................................................................................................ 4-3Defining Service Level Sets...................................................................................................... 4-4Item Simulation Set................................................................................................................... 4-6Defining Item Attribute Simulation Sets................................................................................. 4-7Defining User-specified Safety Stock.....................................................................................4-12Defining Budgets.................................................................................................................... 4-12Enforcing a Plan Option Budget Name or Value................................................................... 4-15Setting Default Lead Time Variability................................................................................... 4-16Setting Up Manufacturing Lead Time Variability for a Plan................................................ 4-17Setting Up Manufacturing Lead Time Variability for an Item.............................................. 4-17Setting Up In-Transit Lead Time Variability......................................................................... 4-18Setting Up Supplier Lead Time Variability........................................................................... 4-19Setting Penalty Costs............................................................................................................... 4-21Setting Item Purchase Price by Supplier................................................................................ 4-22Setting Performance Indicators...............................................................................................4-23Setting Intermittent Demand.................................................................................................. 4-24
5 Viewing OutputOverview of Viewing Output................................................................................................... 5-1Queries....................................................................................................................................... 5-2Creating Queries........................................................................................................................5-3Editing and Maintaining Queries............................................................................................. 5-5Executing Queries......................................................................................................................5-5Setting Queries Preferences...................................................................................................... 5-6Performance Indicators............................................................................................................. 5-7

v
Time-phased Supply and Demand........................................................................................... 5-8Visibility to Forecast Variability...............................................................................................5-9Viewing the Demand Fulfillment Lead Time........................................................................ 5-10Safety Stock and Target Safety Stock..................................................................................... 5-10Safety Stock Analysis - Viewing the Plan.............................................................................. 5-14Resource Requirements...........................................................................................................5-14Material/Resource Availability............................................................................................... 5-15Reviewing Exception Messages.............................................................................................. 5-16
6 Analysis WorkbenchOverview of Analysis Workbench............................................................................................ 6-1Analyzing Inventory Plans....................................................................................................... 6-2Using the Analysis Workbench................................................................................................ 6-3Creating and Editing Preference Sets....................................................................................... 6-5Analyzing Service Level Versus Profit..................................................................................... 6-7Analyzing Postponement........................................................................................................ 6-14Analyzing Safety Stocks......................................................................................................... 6-18Analyzing Inventory Budgets................................................................................................. 6-25Analyzing Revenue and Cost Breakdown.............................................................................. 6-29Analyzing Service Level Breakdown...................................................................................... 6-36
7 Managing Inventory and Safety StockPlanning Safety Stock for Components and Co-products....................................................... 7-1Defining and Generating Safety Stock Levels......................................................................... 7-1Safety Stock Inflation................................................................................................................ 7-2Safety Stock Smoothing............................................................................................................ 7-2Safety Stock Level Days of Supply........................................................................................... 7-4User-Specified Safety Stock...................................................................................................... 7-5
8 Oracle Inventory Optimization and Asset Intensive PlanningIntroduction to Asset Intensive Planning.................................................................................8-1Computing Total Demand........................................................................................................ 8-2
Calculating Total Demand................................................................................................... 8-3Modeling Repair Operations................................................................................................8-4
eAM Activity Definition........................................................................................................... 8-4Rebuilding the T56 Engine Activity..................................................................................... 8-5Item and Activity Identification........................................................................................... 8-6Repair Lead Time................................................................................................................. 8-8
IMM Rebuild Activity............................................................................................................... 8-8
vi
9 Oracle Inventory Optimization Warehouse Capacity Constraints and Cycle Inventory Safety Stock
Oracle Inventory Optimization Warehouse Capacity Constraints.......................................... 9-1Organization Level Constraints........................................................................................... 9-1
Order Quantity and Effects of Order Modifiers............................................................ 9-2Safety Stock Push Down to Downstream Locations............................................................ 9-3Specifying Warehouse Capacity Level................................................................................. 9-4Specifying Safety Stock Days............................................................................................... 9-4Defining Item Order Modifiers............................................................................................ 9-5Specifying Order Period...................................................................................................... 9-6Specifying Inventory Days Increment..................................................................................9-6Defining Warehouse Capacity at the Organization Level.................................................... 9-6Defining Storage Capacity at the Category Level................................................................ 9-7Defining Item Volume......................................................................................................... 9-8Specifying the Enforce Warehouse Capacity Constraints Plan Option................................ 9-9Warehouse Capacity Exceeded Exception........................................................................... 9-9Pushing Warehouse Capacity Facts to APCC.................................................................... 9-11
Setting Up Warehouse Constraints......................................................................................... 9-11
10 Accounting for Cycle Inventory in Safety Stock CalculationIntroduction to Accounting for Cycle Inventory in Safety Stock Calculation...................... 10-1Enabling Cycle Stock Functionality........................................................................................10-1Target Service Level De-rating................................................................................................10-1
De-rating Service Level in a Multi-echelon Case................................................................10-3Requirements Explosion De-rating.........................................................................................10-3
11 Service Parts PlanningIntegration with Oracle Inventory Optimization................................................................... 11-1
12 Cross-Product IntegrationIntegration with Demand Planning........................................................................................ 12-1
A Profile OptionsProfile Options Introduction.................................................................................................... A-1Special Considerations............................................................................................................. A-2Inventory Optimization Profile Options..................................................................................A-2

vii
Glossary
Index


ix
Send Us Your Comments
Oracle Inventory Optimization Users Guide, Release 12.2Part No. E48774-01
Oracle welcomes customers' comments and suggestions on the quality and usefulness of this document. Your feedback is important, and helps us to best meet your needs as a user of our products. For example:
• Are the implementation steps correct and complete? • Did you understand the context of the procedures? • Did you find any errors in the information? • Does the structure of the information help you with your tasks? • Do you need different information or graphics? If so, where, and in what format? • Are the examples correct? Do you need more examples?
If you find any errors or have any other suggestions for improvement, then please tell us your name, the name of the company who has licensed our products, the title and part number of the documentation andthe chapter, section, and page number (if available).
Note: Before sending us your comments, you might like to check that you have the latest version of the document and if any concerns are already addressed. To do this, access the new Oracle E-Business Suite Release Online Documentation CD available on My Oracle Support and www.oracle.com. It contains the most current Documentation Library plus all documents revised or released recently.
Send your comments to us using the electronic mail address: [email protected]
Please give your name, address, electronic mail address, and telephone number (optional).
If you need assistance with Oracle software, then please contact your support representative or Oracle Support Services.
If you require training or instruction in using Oracle software, then please contact your Oracle local officeand inquire about our Oracle University offerings. A list of Oracle offices is available on our Web site at www.oracle.com.


xi
Preface
Intended AudienceWelcome to Release 12.2 of the Oracle Inventory Optimization Users Guide.
Welcome to the Oracle Inventory Optimization User's Guide, Release 12.
This guide assumes you have a working knowledge of the following:
• The principles and customary practices of your business area.
• Oracle Advanced Supply Chain Planning and Oracle Inventory Optimization
If you have never used Oracle Advanced Planning or Oracle Inventory Optimization, Oracle suggests you attend one or more of the Oracle Applications training classes available through Oracle University.
• Oracle Self-Service Web Applications
To learn more about Oracle Self-Service Web Applications, read the Oracle Self-Service Web Applications Implementation Manual.
• The Oracle Applications graphical user interface
To learn more about the Oracle Applications graphical user interface, read the Oracle E-Business Suite User's Guide.
• See Other Information Sources for more information about Oracle Applications product information.
See Related Information Sources on page xii for more Oracle E-Business Suite product information.
Documentation AccessibilityFor information about Oracle's commitment to accessibility, visit the Oracle
xii
Accessibility Program website at http://www.oracle.com/pls/topic/lookup?ctx=acc&id=docacc.
Access to Oracle SupportOracle customers have access to electronic support through My Oracle Support. For information, visit http://www.oracle.com/pls/topic/lookup?ctx=acc&id=info or visit http://www.oracle.com/pls/topic/lookup?ctx=acc&id=trs if you are hearing impaired.
Structure1 OverviewThis chapter describes Oracle Inventory Optimization and its benefits. It also provides an overview of how Oracle Inventory Optimization works and its input and output data.
2 Defining an Inventory Plan3 Inventory Plan OptionsThis chapter details various options that you can set for your inventory plan by using Oracle Inventory Optimization.
4 Key SetupsThis chapter describes the key setups such as the target service levels and performance indicators that you need to specify before you run your inventory plan.
5 Viewing OutputThis chapter details how to view the output after you run an inventory plan.
6 Analysis WorkbenchThis chapter describes the Analysis Workbench and how you can use it to analyze your inventory plans.
7 Managing Inventory and Safety StockThis chapter documents procedures for planning safety stock inventory.
8 Oracle Inventory Optimization and Asset Intensive Planning9 Oracle Inventory Optimization Warehouse Capacity Constraints and Cycle Inventory Safety Stock10 Accounting for Cycle Inventory in Safety Stock Calculation11 Service Parts Planning12 Cross-Product IntegrationThis chapter details the integration between Oracle Inventory Optimization and Oracle Demand Planning.
A Profile OptionsGlossary
Related Information SourcesOracle Inventory Optimization shares business and setup information with other OracleApplications products. Therefore, you may want to refer to other guides when you set

xiii
up and use Oracle Inventory Optimization.
You can access other guides from the Oracle E-Business Suite Online Documentation Library CD that was included with your media pack:
• Oracle E-Business Suite User's Guide
• Oracle Advanced Planning Command Center User's Guide
• Oracle Advanced Supply Chain Planning Implementation and User's Guide
• Oracle Bills of Material User's Guide
• Oracle Collaborative Planning Implementation and User's Guide
• Oracle Demand Planning User's Guide
• Oracle E-Business Suite Upgrade Guide: Release 11i to Release 12.1.1
• Oracle E-Business Suite Installation Guide: Using Rapid Install
• Oracle Global Order Promising Implementation and User's Guide
• Oracle Inventory Optimization User's Guide
• Oracle Inventory User's Guide
• Oracle Manufacturing Operations Center Implementation Guide
• Oracle Order Management Using Oracle Workflow in Oracle Order Management
• Oracle Production Scheduling Implementation Guide
• Oracle Project Manufacturing User's Guide
• Oracle Project Manufacturing Implementation Guide
• Oracle Purchasing User's Guide
• Oracle Service Parts Planning Implementation and User's Guide
• Oracle Shopfloor Management User's Guide
• Oracle Strategic Network Optimization Implementation Guide
• Oracle Work in Process User's Guide
• Oracle Workflow User's Guide
xiv
Integration RepositoryThe Oracle Integration Repository is a compilation of information about the service endpoints exposed by the Oracle E-Business Suite of applications. It provides a complete catalog of Oracle E-Business Suite's business service interfaces. The tool lets users easily discover and deploy the appropriate business service interface for integration with any system, application, or business partner.
The Oracle Integration Repository is shipped as part of the E-Business Suite. As your instance is patched, the repository is automatically updated with content appropriate for the precise revisions of interfaces in your environment.
You can navigate to the Oracle Integration Repository through Oracle E-Business Suite Integrated SOA Gateway.
Do Not Use Database Tools to Modify Oracle E-Business Suite DataOracle STRONGLY RECOMMENDS that you never use SQL*Plus, Oracle Data Browser, database triggers, or any other tool to modify Oracle E-Business Suite data unless otherwise instructed.
Oracle provides powerful tools you can use to create, store, change, retrieve, and maintain information in an Oracle database. But if you use Oracle tools such as SQL*Plus to modify Oracle E-Business Suite data, you risk destroying the integrity of your data and you lose the ability to audit changes to your data.
Because Oracle E-Business Suite tables are interrelated, any change you make using an Oracle E-Business Suite form can update many tables at once. But when you modify Oracle E-Business Suite data using anything other than Oracle E-Business Suite, you may change a row in one table without making corresponding changes in related tables.If your tables get out of synchronization with each other, you risk retrieving erroneous information and you risk unpredictable results throughout Oracle E-Business Suite.
When you use Oracle E-Business Suite to modify your data, Oracle E-Business Suite automatically checks that your changes are valid. Oracle E-Business Suite also keeps track of who changes information. If you enter information into database tables using database tools, you may store invalid information. You also lose the ability to track whohas changed your information because SQL*Plus and other database tools do not keep arecord of changes.

Overview 1-1
1Overview
This chapter describes Oracle Inventory Optimization and its benefits. It also provides an overview of how Oracle Inventory Optimization works and its input and output data.
This chapter covers the following topics:
• Overview of Oracle Inventory Optimization
• Stochastic Optimization Technology
• Business Process
• Key Inventory Decisions
• Input
• Output
• BIS Key Performance Indicators
Overview of Oracle Inventory OptimizationOracle Inventory Optimization is a comprehensive Internet-based inventory planning solution that enables you to determine when and where to hold your inventories across the supply chain to achieve the desired customer service levels. You can factor in criteria such as demand variability and supply lead time variability when you make your inventory decisions. It is a strategic planning tool that can help you address the following key business issues:
• How can I improve customer service while reducing inventory?
• Where do I position my inventories?
• How can I manage demand and supply variability?
• What service levels can I achieve given specific budgets and other constraints?

1-2 Oracle Inventory Optimization Users Guide
The following are the key capabilities of Oracle Inventory Optimization:
• Oracle Inventory Optimization uses stochastic optimization technology that enablesyou to factor in the multilevel supply chain network and interdependence of demand variability and supply lead time variability when generating time-phased safety stock recommendations.
• Oracle Inventory Optimization enables you to evaluate multiple inventory planningscenarios and graphically compare the results. The planning scenarios for example can include different sets of customer service levels, budget constraints, and capacity constraints.
• Oracle Inventory Optimization is integrated with Oracle's E-Business Suite and Advanced Planning products including Oracle Advanced Supply Chain Planning and Oracle Demand Planning. This enables collaboration between these applications. For example, the safety stock recommendations of Oracle Inventory Optimization can be automatically fed into Oracle Advanced Supply Chain Planning to drive tactical supply chain planning decisions.
Stochastic Optimization TechnologyStochastic optimization is a technique for prudent decision-making under uncertainty. Stochastic optimization considers:
• Factors that you are trying to maximize or minimize. For example, you would want to maximize service level and profit and minimize cost.
• Factors that you have under control. For example the investment on inventory when there are no budget constraints.
• The limiting factors of your plan such as service level and budget constraints.
Oracle Inventory Optimization uses this technology to help you manage the uncertaintyinherent to your business decisions. Based on your requirements and objectives, you can determine the optimal inventory stocking levels and other operational policies.
Oracle Inventory Optimization enables you to:
• Determine the optimal inventory levels across the supply chain, which improves customer service while lowering inventory investment.
• Consider uncertainty in demand and supply.
• Manage variability and risk.
• Evaluate cost and risk trade-off.
• See a graphical representation of your strategic inventory plan.
Overview 1-3
• Plan telescoping time horizons.
• Provide accurate inputs to tactical plans.
• Manage key performance indicators (KPIs) and drive continuous improvement.
Business ProcessThe following diagram describes the business process flow for Oracle Inventory Optimization:
The following steps summarize the business process flow depicted in the diagram:
1. Determine the key objective of the inventory plan by linking to Corporate Balanced Scorecard.
2. Collect existing data from other source instances. For detailed information about

1-4 Oracle Inventory Optimization Users Guide
collections, see Oracle Advanced Planning Implementation and User's Guide.
3. Review the data collected by the inventory planning engine and make changes as needed.
4. Specify additional inputs for the inventory plan. The following are the data that youcan specify:
• Service level policy
• Inventory budget (optional)
• Supplier lead time variability
• Safety stock levels
• Minimum and maximum inventory levels
5. The inventory planning engine processes the input and runs the inventory plan.
6. The inventory planning engine reports the results after running the inventory plan.
7. Review the output generated by the inventory planning engine.
8. If the inventory plan is not optimal, make changes to the input. Step 3 through 6 arerepeated until the inventory plan is optimal.
For information on what Oracle Inventory Optimization takes as input, see Input, page 1-5.
For information on what Oracle Inventory Optimization provides as output, see Output, page 1-6.
For information on setting up Oracle Inventory Optimization, see Oracle Advanced Planning Implementation and User's Guide.
Key Inventory DecisionsSome of the key factors that can influence your decision factors are:
• Service Level Decision Factors, page 1-5
• Safety Stock Decision Factors, page 1-5
• Inventory Location Decision Factors, page 1-5

Overview 1-5
Service Level Decision FactorsService level is a measure of satisfying demand through inventory or by the current production schedule to satisfy the customers' requested delivery dates and quantities. The decision on service level may depend on factors such as your business objectives, budget constraints, and targeted profit. For example, profits may rise as you increase the service level. However, increased service level beyond a certain point may not increase the profits because of the relative increase in inventory costs. Therefore, if your service level is driven by profit, you need to determine the most profitable scenario withan acceptable service level.
The service level may also influence your safety stock level and inventory location. For example, if you are targeting a high service level, you may want to reduce the transportation lead time by locating your inventory close to your customers.
Safety Stock Decision FactorsAs safety stock can provide a buffer against uncertainty, you may want to consider the variability in demand and supply when you calculate the safety stock level. In many cases, the degree of variability in supply and demand changes over time. You need to consider all possible scenarios when you calculate safety stock.
Inventory Location Decision FactorsThe decision on where to locate your inventory can be a trade-off between several factors such as supplier lead times, transportation lead time, manufacturing lead time, and the flexibility of your manufacturing system. For example, when you store safety stock in the form of finished goods, the manufacturing lead time for those finished goods decreases. However, the components and materials used in making those finished goods are committed and you cannot use them to meet unexpected customer requirements. Therefore, if your safety stock is in the form of raw materials, then you may want to locate your inventory close to your manufacturing plant.
InputOracle Inventory Optimization takes the following information as input:
• Demand uncertainty
• Customer service level for each demand
If the customer service level is specified at a deeper level of granularity, the service level value will apply to all independent demands for that customer.
• Supplier lead time variation

1-6 Oracle Inventory Optimization Users Guide
• Supply chain network in the form of sourcing rules and bill of distribution
• List of items to be included in the plan
• Bills of material including effectivity
• Routings and key resources for items
• Capacity constraints
Capacity constraints can be in the form of supplier capacity, transportation capacity, and resource availability or line rates.
• Cost elements
Cost can include production cost, item cost, carrying cost percentages, purchase cost, transportation cost, and resource cost.
You can establish the following instances as eligible source instances for Oracle Inventory Optimization:
• Oracle Applications R11 (Discrete or Process Manufacturing)
• Oracle Applications R11i (Discrete or Process Manufacturing)
• Oracle Applications R12 (Discrete or Process Manufacturing)
OutputThe output of Oracle Inventory Optimization is a time-phased strategic inventory plan. More specifically, output includes the following:
• Time-phased constrained and unconstrained safety stock levels for each item
You can specify the time-phased constrained safety stock quantities as input to Oracle Advanced Supply Chain Planning in the form of demand plan(s).
• Recommended service levels
• Key performance indicators
• Recommendations and exception messages such as for service level and budget violations
• Total cost of achieving the target customer service level and the individual cost elements that make up the total cost
Overview 1-7
BIS Key Performance IndicatorsOracle Inventory Optimization is integrated with Oracle Business Intelligence System's Performance Management System. You can set your organizational objectives using Oracle Business Intelligence System.
You can use key performance indicators to drive continuous improvement in your enterprise. You can set performance targets and exception tolerances by business units or by period and automatically notify the appropriate people when exceptions arise.
Note: Organizational objectives are referred to as Performance Measures in Oracle Business Intelligence System and as key performance indicators in Oracle Inventory Optimization and Oracle Advanced Supply Chain Planning

Defining an Inventory Plan 2-1
2Defining an Inventory Plan
Running an Inventory PlanBefore you run an inventory plan, complete the prerequisite tasks. For information on how to perform these tasks, see the Oracle Advanced Planning Implementation and User's Guide.
To create and launch an inventory plan:
Prerequisites❒ Set up each planned organization on the source instance.
❒ Direct the collection programs to collect data from the transactional instance of eachplanned organization.
❒ Enable the items to be planned in each organization that can produce or distribute the item. During item setup, you can enable items in all organizations or only in specific organizations.
❒ Set up bills of material.
❒ Enable the routings and bills of resource for each planned item in all planned organizations.
❒ Enable the suppliers and sourcing rules in all relevant organizations.
Steps:1. Sign in using the Inventory Planner responsibility.
2. Choose Inventory Plan > Names.
The Inventory Plan Names window appears.

2-2 Oracle Inventory Optimization Users Guide
The following table describes the fields in the Inventory Plan Names window.
Field Description
Name Name of the plan.
Description Description of the plan.
Inactive Date The date until when the plan is active.
3. Click Plan Options.
The Plan Options window appears.
4. Continue setting plan options and parameters.
Only selected organizations are planned regardless of whether planned items, routings, and so on have been enabled in other organizations.
5. Click Launch Plan in the Inventory Plan Names window.
The Parameters window appears.
The following table describes the fields in the Parameters window.
Field Description
Plan Name Name of the plan.
Launch Snapshot Set it to "yes" if you want the inventory planning engine to snapshot data such as items and BOMs.
Launch Planner Set it to "yes" if you want the inventory planning engine to run the netting.
Anchor Date The plan start date is displayed by default. For more information, see Oracle Advanced Planning Implementation and User's Guide.
6. Click OK in the Parameters window after you have verified the parameters.
The parameters appear in the Parameters field in the Launch Inventory Plan window.
7. Click Submit to launch the plan.
Defining an Inventory Plan 2-3
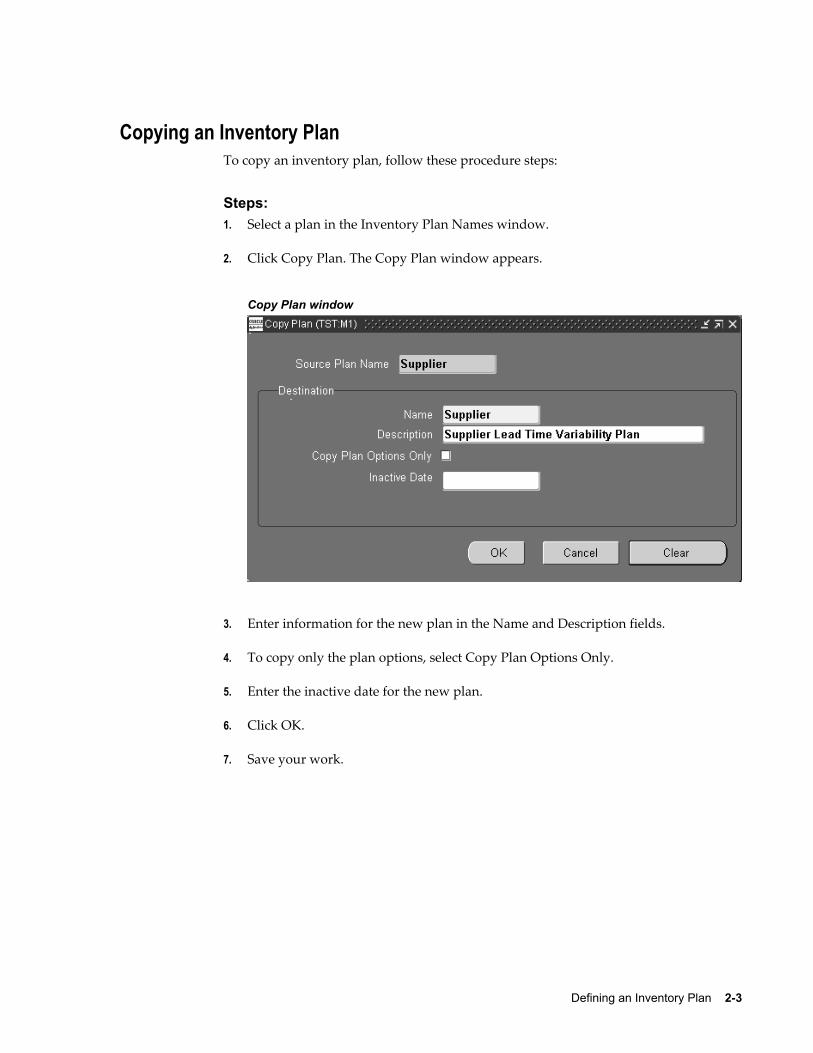
Copying an Inventory PlanTo copy an inventory plan, follow these procedure steps:
Steps:1. Select a plan in the Inventory Plan Names window.
2. Click Copy Plan. The Copy Plan window appears.
Copy Plan window
3. Enter information for the new plan in the Name and Description fields.
4. To copy only the plan options, select Copy Plan Options Only.
5. Enter the inactive date for the new plan.
6. Click OK.
7. Save your work.

Inventory Plan Options 3-1
3Inventory Plan Options
This chapter details various options that you can set for your inventory plan by using Oracle Inventory Optimization.
This chapter covers the following topics:
• Plan Options Overview
• Plan Options
• Planned Items: ABC Classification
• Selecting Planned Items
• The Main Tabbed Region
• Plan Start Date in Future
• Plan End Date
• The Organizations Tabbed Region
• Using an Existing Plan as a Demand Schedule For a New Plan
• Setting Demand Variability
• Cumulative Demand Distribution
• How Probability Data is Used by Oracle Inventory Optimization
• Weighted Average Calculation
• How to Assign Forecasts and Forecast Sets to Scenario Sets
• Specifying Sources of Demand
• The Constraints Tabbed Region
• Service Level and Fulfillment Lead Time
• Lead Time Variability
• Inventory Budget

3-2 Oracle Inventory Optimization Users Guide
Plan Options OverviewSeveral factors define the basis for calculating optimal levels of inventory. The level of inventory you hold has an impact on the service level that you can offer. You can set various plan options in Oracle Inventory Optimization based on your requirements. Forexample, you can specify the desired service level and calculate the safety stock required to achieve the service level. You can also specify budget constraints.
Plan OptionsThis section describes plan options. The plan options appear in the following tabbed regions of the Plan Options window:
• Main, page 3-4
• Organizations, page 3-9
• Constraints, page 3-19
You can access the plan options, via either of the following navigation methods:
• From the Navigator select Inventory Plan > Options, or.
• From the Navigator select Inventory Plan > Names. From the Plan Names form, select a plan, and then click Plan Options.
This table describes the fields located in the header region of the Plan Options window.
Field Description
Plan This field contains the Plan Name. The Plan description field appears in the next field to the right.
Planned Items The selected ABC classification determines the planned items in this plan. For more information on how the inventory planner engine calculates the safety stock based on this classification, see Planned Items: ABC Classification, page 3-3.
Assignment Set An assignment set is a named group of sourcing rules and bills of distribution that control replenishment of designated items and organizations.

Inventory Plan Options 3-3
Field Description
Service Level Set A Service Level Set is a named group of specific service level targets and demand fulfillment lead times assigned to items, categories of items, customers, classes of demand, organizations, orcombinations of these.
See Defining Service Agreement Simulation Sets, page 4-4.
Item Simulation Set Item attribute simulation sets enable Inventory Optimization plansto simulate changes to key item attributes. You attach values of keyattributes to item-organizations or to item-regions, and then save those assignments under an item attribute simulation set name.
Item Simulation Sets provide the ability to mass maintain planning-related item attributes. Planners can create multiple item simulation sets, with each simulation set addressing a set of "what-if" scenarios.
See Defining Item Attribute Simulation Sets, page 4-7.
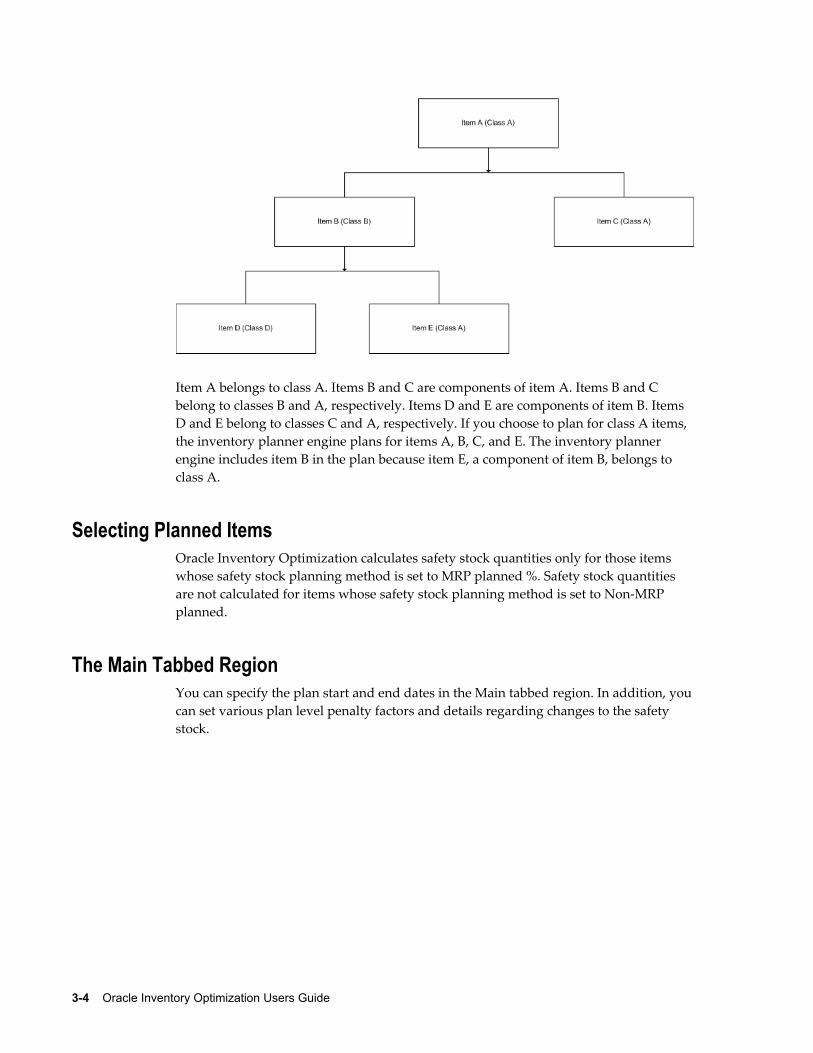
Planned Items: ABC ClassificationThe inventory planner engine may include items that have a classification other than what you specify in the Planned Items field in the Plan Options window. Consider the following illustration that depicts the bill of material for Item A.
The inventory planner engine may include items that have a classification other than what you specify in the Planned Items field in the Plan Options window. Consider the following illustration that depicts the bill of material for Item A.
3-4 Oracle Inventory Optimization Users Guide
Item A belongs to class A. Items B and C are components of item A. Items B and C belong to classes B and A, respectively. Items D and E are components of item B. Items D and E belong to classes C and A, respectively. If you choose to plan for class A items, the inventory planner engine plans for items A, B, C, and E. The inventory planner engine includes item B in the plan because item E, a component of item B, belongs to class A.
Selecting Planned ItemsOracle Inventory Optimization calculates safety stock quantities only for those items whose safety stock planning method is set to MRP planned %. Safety stock quantities are not calculated for items whose safety stock planning method is set to Non-MRP planned.
The Main Tabbed RegionYou can specify the plan start and end dates in the Main tabbed region. In addition, youcan set various plan level penalty factors and details regarding changes to the safety stock.

Inventory Plan Options 3-5
Main tabbed region
Penalty factors are plan level values that:
• You can override by setting values for organizations and items in the source instance
• Override those set in profile options
The following table describes the fields and options in the Main tabbed region:
3-6 Oracle Inventory Optimization Users Guide
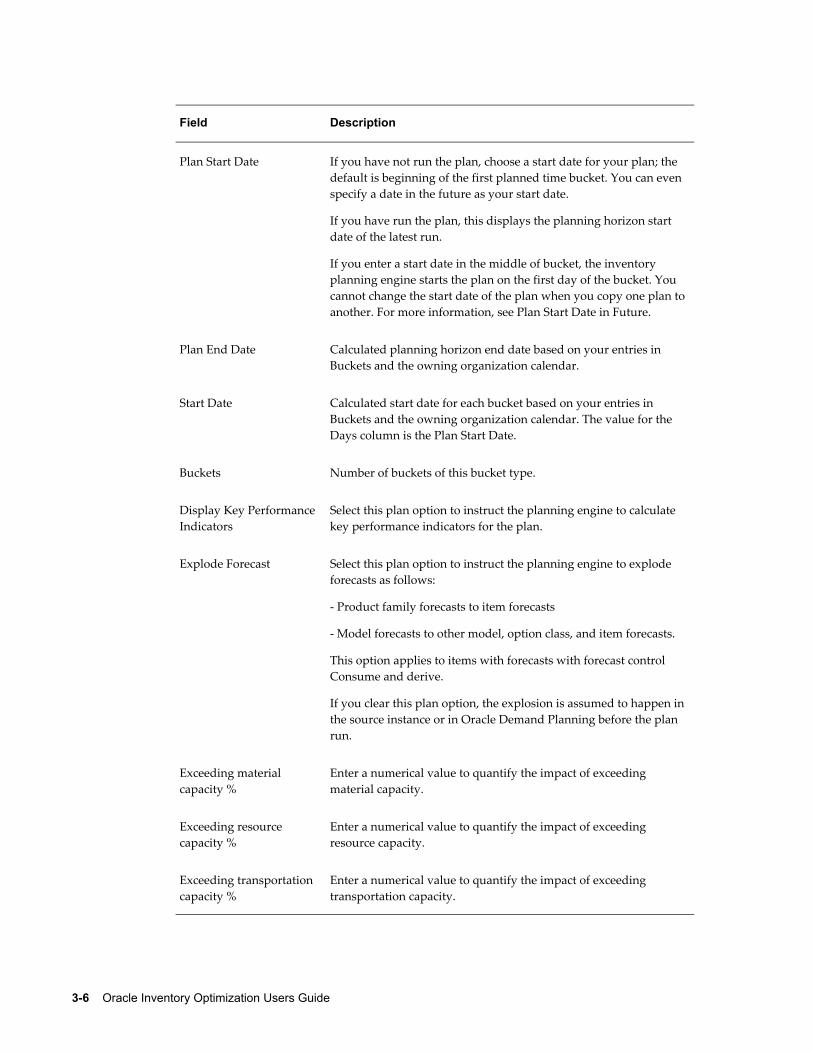
Field Description
Plan Start Date If you have not run the plan, choose a start date for your plan; the default is beginning of the first planned time bucket. You can even specify a date in the future as your start date.
If you have run the plan, this displays the planning horizon start date of the latest run.
If you enter a start date in the middle of bucket, the inventory planning engine starts the plan on the first day of the bucket. You cannot change the start date of the plan when you copy one plan toanother. For more information, see Plan Start Date in Future.
Plan End Date Calculated planning horizon end date based on your entries in Buckets and the owning organization calendar.
Start Date Calculated start date for each bucket based on your entries in Buckets and the owning organization calendar. The value for the Days column is the Plan Start Date.
Buckets Number of buckets of this bucket type.
Display Key PerformanceIndicators
Select this plan option to instruct the planning engine to calculate key performance indicators for the plan.
Explode Forecast Select this plan option to instruct the planning engine to explode forecasts as follows:
- Product family forecasts to item forecasts
- Model forecasts to other model, option class, and item forecasts.
This option applies to items with forecasts with forecast control Consume and derive.
If you clear this plan option, the explosion is assumed to happen inthe source instance or in Oracle Demand Planning before the plan run.
Exceeding material capacity %
Enter a numerical value to quantify the impact of exceeding material capacity.
Exceeding resource capacity %
Enter a numerical value to quantify the impact of exceeding resource capacity.
Exceeding transportation capacity %
Enter a numerical value to quantify the impact of exceeding transportation capacity.
Inventory Plan Options 3-7
Field Description
Demand lateness % Enter a numerical value to quantify the impact of late demand.
Safety Stock Change Interval
Enter the number of days that the inventory planning engine should hold the item safety stock levels constant. It does not recommend a change in safety stock levels during this time but may recommend a change after this time.
Safety Stock Change Threshold Interval
Enter the percentage of safety stock change that is significant to your business. When the inventory planning engine calculates a new recommended safety stock level for an item, it checks its percentage difference from the safety stock values of the previous adjacent change interval. If this percentage difference is lower thanthe this plan option, the inventory planning process does not recommend a change to the safety stock level for the item.
Plan Start Date in FutureIf you consider immediate demand and supplies, your safety stock level requirements may vary across the horizon. For example, owing to short term jobs and on-hand, you may have an excess supply in the beginning of a horizon. As such, your safety stock requirement may be low. However, your safety stock requirements may be higher later in the planning horizon.
To calculate stable safety stock levels, you may want to consider demand in a relatively stable part of the horizon to determine long-term inventory holding policies.
To determine your plan start date, use the following guidelines:
• Determine the initial part of the plan horizon where you want to disregard the demand and supply. Select a date in future to avoid near-term supplies.
• Choose to start the plan after the initial time period in the plan horizon. The inventory planning engine validates the start date to ensure that it matches with thebucket start date.
• Review the safety stocks suggested by the plan across the horizon.
Consideration of existing supplies:
The inventory planning engine does not consider those supplies that are available before the plan start date. For example, the inventory planning engine considers the on-hand supplies if you specify the system date as the plan start date. However, if you specify a future date as the plan start date, the inventory planning engine ignores the on-hand supplies. You can use the Organizations tabbed region to indicate whether or

3-8 Oracle Inventory Optimization Users Guide
not you want the inventory planning engine to consider the net purchased supplies, work in process, and on-hand.
Consideration of demand and supplies available before the system date:
If you specify the system date as your plan start date, the inventory planning engine does not consider any demands and supplies that were available before the system date.This helps avoid issues arising out of huge backlogs and spikes in supplies required dueto an increase in the near term demand.
Consideration of demand and supplies available before the plan start date in future:
The inventory planning engine does not consider past due forecasts, immediate forecasts, dependent demands, and their supplies to calculate safety stocks. The inventory planning engine calculates safety stock based on the demand and supply available after the start date in future so that you can plan accordingly.
Note: To determine the plan start date, you can use the planning time fence that works for most of your items. Alternatively, you can estimatethe length of time until when the existing supplies are going to last. Theinventory planning engine does not consider any dependent demands that are placed before the plan start date.
Consequences of changing the plan start date:
If you change the plan start date after selecting the safety stock change interval, the inventory planning engine displays a warning message as the safety stock change interval may not be valid in certain cases.
If the number of days in the planning horizon is less than the safety stock change interval, the inventory planning engine replaces the value of the safety stock change interval with null. In addition, the inventory planning engine displays a warning message prompting you to enter a different value for the safety stock change interval.
Defaulting of week start date or period start date:
The inventory planning engine defaults the week start date to be the plan start date. Conversely, if your plan does not consider weekly buckets, the inventory planning engine defaults the period start date to be the plan start date.
For example, the week start and end dates are D1 - D7, D8 - D14, D-15 - D21. If you define a plan starting in weekly buckets on day 11 (D11), the inventory planning enginestarts the plan on D15. If you choose your start date as D20, which is in the future, the inventory planning engine selects D22, which is the corresponding week start date.
Note: The inventory planning engine may starts the plan on a non-working day if you specify the week start date or the period start date to be on a non-working day.
Inventory Plan Options 3-9
Plan End DateForecast bucket and plan bucket granularity
In the inventory plan, the forecast buckets and granularity (defined in the ERP system in the Forecast Entries window) and the planning granularity (defined in the Plan Options window) should be aligned correctly so that the appropriate safety stock requirements are passed on to Oracle Advanced Supply Chain Planning. It is recommended that the start date and the end date for each forecast entry should match the start date and the end date for each planning bucket, respectively.
The plan end date is calculated based on the length of the planning horizon defined by the specified bucket sizes in the Main tab.
You cannot change the start date that appears in the Weeks field. The start date in the Weeks field defaults from the plan start date.
To view the end date for your inventory plan
Steps:1. Navigate to the Planner Workbench.
2. Choose Plan Options > Main tab.
The Main tab appears showing the end date for your inventory plan.
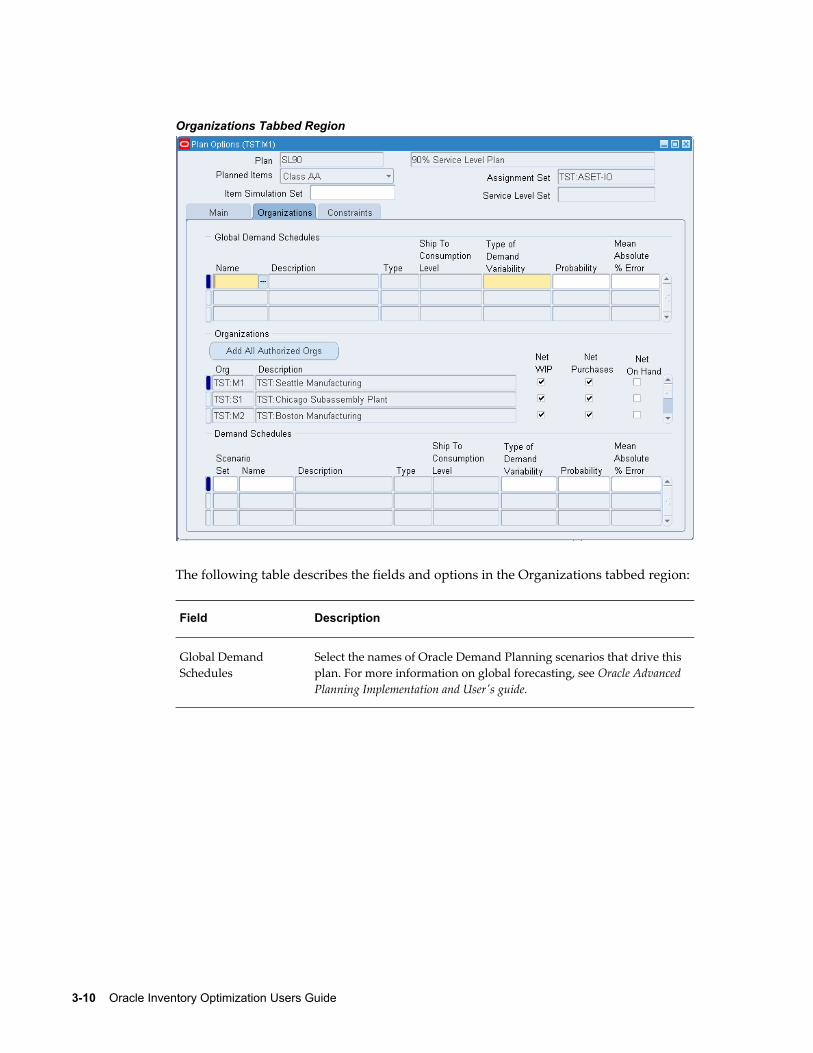
The Organizations Tabbed RegionThe Organizations tabbed region enables you to specify information including the global demand schedule, type of demand variability that applies to the plan, and the forecast scenario.
3-10 Oracle Inventory Optimization Users Guide
Organizations Tabbed Region
The following table describes the fields and options in the Organizations tabbed region:
Field Description
Global Demand Schedules
Select the names of Oracle Demand Planning scenarios that drive this plan. For more information on global forecasting, see Oracle Advanced Planning Implementation and User's guide.
Inventory Plan Options 3-11
Field Description
Type of Demand Variability
Select a demand variability type for the global forecast. Values are:
• Accuracy Metric MAPE or Accuracy Metric MAD: Instructs the Oracle Demand Planning to use demand variability information. This selection changes according to the scenario and the error measure provided by Oracle Demand Planning.
• Probability: If Oracle Demand Planning demand variability information is not available or you want to run quick variability simulations, select this value, determine a confidence factor for this forecast, and enter it in Probability.
• Mean Absolute % Error: If Oracle Demand Planning demand variability information is not available or you want to run quick variability simulations, select this value, determine a mean absolute percent error (MAPE) of this forecast, and enter it in Mean Absolute % Error.
Note: If you select a value for one forecast in a scenario set, that value applies to all forecasts in that scenario set; you cannot select different variability for the other forecasts in the scenario set.
Mean Absolute % Error
If Type of Demand Variability is Mean Absolute % Error, enter your mean absolute percent error (MAPE) of the global forecast.
If you enter a value for one forecast in a scenario set, that value applies to all forecasts in that scenario set; you cannot enter different mean absolute percent errors for the other forecasts in the scenario set. '
Add All Authorized Orgs
When you click, the form retains the organizations that appear in Org and adds all organizations to which you have organization security (according to your responsibility). If one of your authorized organizations is already listed, the form does not add it a second time.
Org An organization for which this plan is intended.
Description The name of the organization.
Net WIP Select to consider discrete jobs and other production orders as supply in the planning demand/supply netting process. Only firm supplies are considered.

3-12 Oracle Inventory Optimization Users Guide
Field Description
Net Purchases Select to consider purchase orders, purchase requisitions, in-transit shipments and other non production order scheduled receipts as supply in the planning demand/supply netting process. Only firm supplies are considered.
Net On Hand Select to consider on-hand inventory in the netting process.
Demand Schedules Select the names of forecasts and Oracle Demand Planning scenarios that drive this plan.
Scenario Set Enter the identifier for the scenario set with which the forecast is associated. See Setting Demand Variability.
Probability If Type of Demand Variability is Probability, enter your confidence in the local forecast. For 35% confidence, enter 35.
If you enter a value for one forecast in a scenario set, that value applies to all forecasts in that scenario set; you cannot enter different probabilities for the other forecasts in the scenario set.
Using an Existing Plan as a Demand Schedule For a New PlanThe plan for one organization can be used as a demand source (or demand schedule) for the plan of another organization.
Setting Demand VariabilityYou can specify demand variability as a discrete distribution. Using the Plan Options window, you can specify the probability for a given forecast set. Forecast sets are grouped together in scenario sets by using the scenario set field.
Note: Scenario sets are planned separately.
To set demand variability
Steps:1. Choose Plan Options > Organizations tab.
2. In the Scenario Set field, enter the scenario set number.
Inventory Plan Options 3-13
3. In the Name field, enter the demand schedule name (forecast set).
4. In the Probability field, specify corresponding probabilities for forecast sets.
Note: One scenario set includes a list of one or more forecast sets. Aforecast set includes a list of one or more forecasts. Use the Probability field to enter an estimate of probability that a particular forecast set within the scenario set will occur. For example, if a scenario set includes three forecasts sets named; Optimistic, Most likely, and Pessimistic, you can enter the probability of the forecastsoccurring as 0.15, 0.65, and 0.20, respectively.
Note: The sum of probabilities of forecast sets in a scenario set can be more than 1. If a forecast set probability is not specified, a value of 1 is considered as default.
Note: Safety stock is not calculated if there is no demand and supplier lead time.
Cumulative Demand DistributionYou can specify demand uncertainty in terms of either noncumulative probabilities or cumulative probability distribution. You can view the demand probability in the Supply/Demand window of the Planner Workbench.
Profile option to indicate demand distribution format
The profile option MSR: Probability Distribution Type is used to indicate whether the demand variability is assumed to be in terms of forecast set probabilities or in terms of forecast set cumulative probabilities. The valid options are Probabilities and Cumulative Probabilities. The default value is Probabilities.
This option applies uniformly to all scenario sets. It is not possible to express demand variability in one scenario set in terms of probabilities and in another scenario set in terms of cumulative probabilities. You need to implement a consistent type of demand variability across scenario sets.
Specifying cumulative probabilities
You can specify cumulative probabilities in the Probability field in the Organizations tabbed region (Demand Schedules section).
The maximum value of the cumulative probability, for a given scenario set, needs to equal 1.0. If this is not true, a warning message appears when you attempt to save the plan options. If you run the plan at this point, the plan errors out.

3-14 Oracle Inventory Optimization Users Guide
The following tables provide an example of the correct user input:
Scenario Set Forecast Set Qty Prob
1 FSET-A 50 0.4
1 FSET-B 75 0.2
1 FSET-C 100 0.4
Scenario Set Forecast Set Qty Cum. Prob
1 FSET-A 50 0.4
1 FSET-B 75 0.6
1 FSET-C 100 1.0
The following two tables provide examples of incorrect user input:
Scenario Set Forecast Set Qty Cum. Prob.
1 FSET-B 75 0.4
1 FSET-A 50 0.6
1 FSET-C 100 1.0
The cumulative probability cannot go up when the demand quantity comes down. For example, if the cumulative probability is 0.4 for a quantity of 75, the cumulative probability should be less than 0.4 for a quantity of 50. Oracle Inventory Optimization logs the following message during planning and exits if the forecast quantities in the demand distribution do not increase with the cumulative probabilities:
• Error: Forecast quantity does not follow cumulative pattern for scenario set: <scenario_set>, forecast set id: <forecast_set_id>, item_id: <item_id>, org_id: <org_id>, instance_id: <instance_id>, date: <date>

Inventory Plan Options 3-15
Scenario Set Forecast Set Qty Cum. Prob
1 FSET-A 50 0.4
1 FSET-B 75 0.6
1 FSET-C 100 0.9
In Example 2, the maximum cumulative probability equals 0.9. However, as the maximum value of the cumulative probability needs to equal 1.0, an error message appears. If you run the plan at this point, the plan errors out.
How Probability Data is Used by Oracle Inventory OptimizationThe probability information is used in three ways:
• Probability acts like a weight in a normalization calculation.
• Normalized probabilities are used to calculate an expected value for forecast quantities.
• The distribution of the discrete probabilities is used to estimate variance, which is a factor in calculating safety stock quantity.
Safety stock is sized in proportion to the variance of forecast sets probability distributions.
The following table shows how the variance of forecast set probability distribution affects the size of the safety stock.
Forecast Set Prob. Dist A Prob. Dist B
FCSTA 0.182 0.100
FCSTB 0.364 0.800
FCSTC 0.454 0.100
All other relevant factors being equal, the safety stock quantity for a situation depicted by probability distribution B would be smaller than safety stock quantity for a situation depicted by probability distribution A because the variance of probability distribution Bis less than the variance of probability distribution A.
3-16 Oracle Inventory Optimization Users Guide
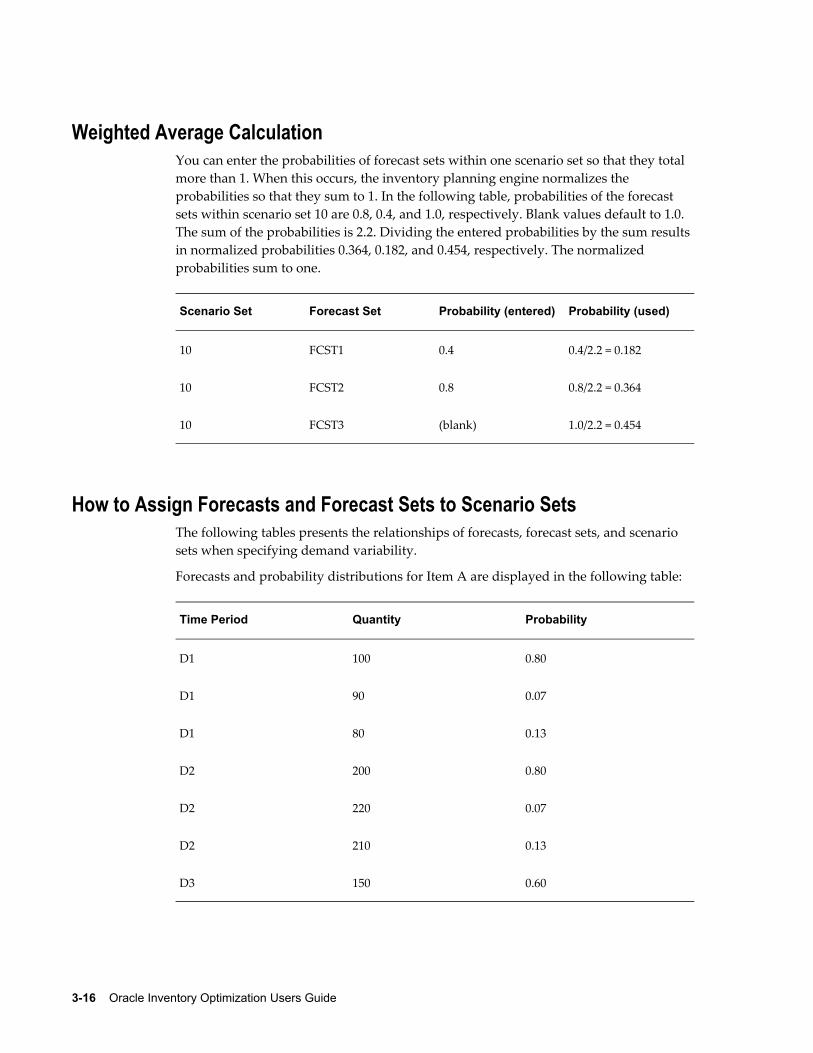
Weighted Average CalculationYou can enter the probabilities of forecast sets within one scenario set so that they total more than 1. When this occurs, the inventory planning engine normalizes the probabilities so that they sum to 1. In the following table, probabilities of the forecast sets within scenario set 10 are 0.8, 0.4, and 1.0, respectively. Blank values default to 1.0. The sum of the probabilities is 2.2. Dividing the entered probabilities by the sum results in normalized probabilities 0.364, 0.182, and 0.454, respectively. The normalized probabilities sum to one.
Scenario Set Forecast Set Probability (entered) Probability (used)
10 FCST1 0.4 0.4/2.2 = 0.182
10 FCST2 0.8 0.8/2.2 = 0.364
10 FCST3 (blank) 1.0/2.2 = 0.454
How to Assign Forecasts and Forecast Sets to Scenario SetsThe following tables presents the relationships of forecasts, forecast sets, and scenario sets when specifying demand variability.
Forecasts and probability distributions for Item A are displayed in the following table:
Time Period Quantity Probability
D1 100 0.80
D1 90 0.07
D1 80 0.13
D2 200 0.80
D2 220 0.07
D2 210 0.13
D3 150 0.60

Inventory Plan Options 3-17
Time Period Quantity Probability
D3 120 0.30
D3 180 0.10
D4 180 0.60
D4 190 0.30
D4 120 0.10
Notice that Item A has the same probability distribution for D1 and D2, and another distribution represents its demand for D3 and D4.
The scenario sets, forecast sets, and forecasts shown in the following tables specify the demand variability for item A:
Item Quantity Date
A 100 D1
A 200 D2
Item Quantity Date
A 90 D1
A 220 D2
Item Quantity Date
A 80 D1
A 210 D2

3-18 Oracle Inventory Optimization Users Guide
Item Quantity Date
A 150 D3
A 180 D4
Item Quantity Date
A 120 D3
A 190 D4
Item Quantity Date
A 180 D3
A 120 D4
These forecast sets are tied to their corresponding probabilities and assigned to scenarios sets in the Organization tabbed region as shown in the following table:
Scenario Set Forecast Set Probability
10 FCST1 0.80
10 FCST2 0.07
10 FCST3 0.13
20 FCST4 0.60
20 FCST5 0.30
20 FCST6 0.10
If item B has the same probability distribution as item A, you can include item B in the above forecasts and forecast sets. If item B does not follow the same probability distributions, then define separate forecast sets and forecasts for item B. In this case,

Inventory Plan Options 3-19
item A and B cannot share the same scenario sets either.
Note: If there are multiple forecast sets that have forecasts for the same item, ensure that the bucket size is the same.
Specifying Sources of DemandDemand Schedules
You can specify a forecast set or a demand planning scenario as input demand for an inventory plan.
To specify sources of demand
Steps:1. Navigate to the Planner Workbench.
2. Choose Plan Options > Organization tab.
3. Select the demand schedule (Forecast or demand planning scenario) from the list of values.
The Constraints Tabbed RegionYou can specify constraints and information regarding the planning horizon in the Constraints tabbed region. Constraint-based planning is an approach for balancing material, budget and plant resources while meeting service levels. It takes into account constraints at the enterprise and plant levels. Material, resources, capacity, or budget constraints are considered. Factory, distribution, and transportation issues are integrated. This complete picture of the problem provides instant and global visibility to the effects of planning and scheduling decisions throughout the supply chain.

3-20 Oracle Inventory Optimization Users Guide
This table describes the fields and options in the Constraints tabbed region.
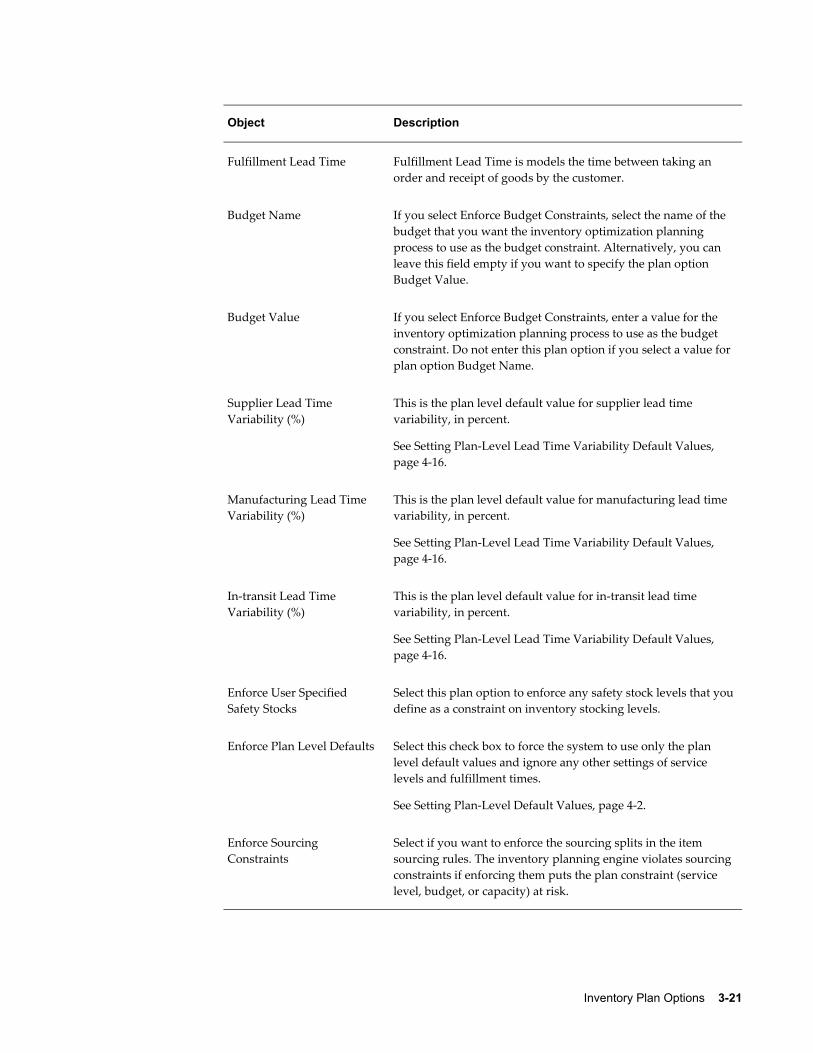
Object Description
Enforce Service Level Constraints
Select to enforce the service levels specified at the most detailed level. The inventory planning engine exceeds the material, budget, and resource available capacity if needed.
Enforce Budget Constraints Select this plan option to use a budget amount as a constraint oninventory investment.
Enforce Capacity Constraints
Select if you want material and resource capacity constraints to be respected.
Service Level % If you select Enforce Service Level Constraints, enter the service level that you want the inventory optimization planning process to use as the service level requirements for all parts in the plan
Inventory Plan Options 3-21
Object Description
Fulfillment Lead Time Fulfillment Lead Time is models the time between taking an order and receipt of goods by the customer.
Budget Name If you select Enforce Budget Constraints, select the name of the budget that you want the inventory optimization planning process to use as the budget constraint. Alternatively, you can leave this field empty if you want to specify the plan option Budget Value.
Budget Value If you select Enforce Budget Constraints, enter a value for the inventory optimization planning process to use as the budget constraint. Do not enter this plan option if you select a value for plan option Budget Name.
Supplier Lead Time Variability (%)
This is the plan level default value for supplier lead time variability, in percent.
See Setting Plan-Level Lead Time Variability Default Values, page 4-16.
Manufacturing Lead Time Variability (%)
This is the plan level default value for manufacturing lead time variability, in percent.
See Setting Plan-Level Lead Time Variability Default Values, page 4-16.
In-transit Lead Time Variability (%)
This is the plan level default value for in-transit lead time variability, in percent.
See Setting Plan-Level Lead Time Variability Default Values, page 4-16.
Enforce User Specified Safety Stocks
Select this plan option to enforce any safety stock levels that youdefine as a constraint on inventory stocking levels.
Enforce Plan Level Defaults Select this check box to force the system to use only the plan level default values and ignore any other settings of service levels and fulfillment times.
See Setting Plan-Level Default Values, page 4-2.
Enforce Sourcing Constraints
Select if you want to enforce the sourcing splits in the item sourcing rules. The inventory planning engine violates sourcingconstraints if enforcing them puts the plan constraint (service level, budget, or capacity) at risk.

3-22 Oracle Inventory Optimization Users Guide
Object Description
Start Date Displays the start date for each bucket type.
Buckets Displays the number of buckets of this bucket type.
Resource Constraints Select Yes to consider resource constraints.
Material Constraints Select Yes to consider material constraints.
Constraint OptionsYou can select one of the following three constraint options:
• Enforce Service Level Constraints
This option enforces the service level specified at the most detailed level. In a simple example, if the plan level (global) service level is set to 95% and the service level for item AS12345 is set to 98%, the 98% service level is enforced for item AS12345 and the 95% service level is enforced for all other items of the inventory plan. Material and production resources along with budgets are utilized beyond availability if necessary to attain the desired service levels.
• Enforce Capacity Constraints
This option enforces material and resource capacity constraints throughout the plan. The inventory planning engine calculates the service levels achieved and budgets required based on the amount of available material and production capacity.
• Enforce Budget Constraints
This option enforces a budget amount as a constraint on inventory investment. You can create budgets and specify one for each plan run. You can specify a value for a budget at the plan level. Oracle Inventory Optimization calculates the service levels achieved based on the amount of the available budget. The inventory planning engine calculates the material and production resource requirements based on the supply created after considering budget constraints.
For more information, see Oracle Advanced Planning Implementation and User's Guide.
Plan Level DefaultsTo facilitate simulations, you can enter plan level overrides of key Inventory Optimization planning parameters in the Plan Options window:
Inventory Plan Options 3-23
• Service level
• Fulfillment lead time
• Budget value
• Lead time variation
• Manufacturing variability (%)
• In-transit lead time variability (%)
• Supplier lead time variability (%)
Note: These values supersede all values specified at more granular levels when the Enforce Plan Level Defaults check box is selected.
See:
• Setting Plan Level Default Service Level, page 4-2
• Defining Budgets, page 4-12
• Setting Default Lead Time Variability, page 4-16
Service Level and Fulfillment Lead TimeThe definition of Service Level used here is the percent of order lines received that can befilled immediately and completely from stock. It is assumed that orders can be forecast, but advance notice of orders is not typically provided by customers. Therefore safety stock is sized to buffer uncertainty of demand quantity and time.
The Demand Fulfillment Lead Time models the situation where the customer provides advance notice to fulfill demand. The Demand Fulfillment Lead time spans all activities between taking an order and receipt of goods by the customer. Modeling Demand Fulfillment Lead Time is useful for evaluating the cost of different fulfillment time promises and their impact on inventory. For example, comparing inventory investment requirements for a 95% service level with a promised five-day order fulfillment time versus a 90% service level with a three-day fulfillment time.
Modeling fulfillment time also allows you to evaluate the impact of changes in fulfillment time on the degree and point of postponement. Postponement refers to delaying commitment of material to a specific end use. This concept is sometimes calleddelayed differentiation.
Inventory stored in raw material form generally has greater flexibility with respect to how it is eventually used by the consumer. However raw material takes longer to convert to the usable form than it would if in anticipation of receiving sales orders the

3-24 Oracle Inventory Optimization Users Guide
material has been partially transformed and stored as modular subassemblies. Inventory stored as finished goods can fulfill customer demand immediately, but has no flexibility with respect to end use. In between raw material form and finished goods form are various degrees of completion, each with an associated lead time for transformation to end use. The trade-off is between shorter demand fulfillment lead time and postponing differentiation of material to retain end use flexibility. The longer your fulfillment time, the greater the opportunity to postpone. Postponement tends to lower your inventory carrying costs because the material that you do carry is stored in aform that can be used to fulfill demand for a variety of end items.
See Analyzing Postponement, page 6-14.
The key setup steps are:
1. Define default values for target service levels and fulfillment lead times in the Plan Options form.
These values are used for those items for which target service levels or fulfillment lead times are not specified..
2. Setup specific values for target service levels and fulfillment lead times for specific items, categories of items, customers, demand classes, and so on, by defining a Service Level Set.
See Defining Service Agreement Simulation Sets, page 4-4.
3. Associate a defined Service Level Set with a plan when setting up the plan options. See Setting Up Plan Options, page 3-2.
When the plan is run, the system tries to meet the specific target service levels and fulfillment lead times assigned in the service level set.
The process is then executed as follows:
1. Run the Inventory Optimization module with service levels and fulfillment lead times setup as described.
2. Review the results of the plan – check the inventory, safety stock and service levels.
3. If the results are satisfactory, use this plan as a demand schedule in tactical planning, using Oracle Advanced Supply Chain Planner.
4. If the results are unsatisfactory you change your goals (service levels) or constraints (budgets, minimum or maximum inventory levels) to achieve your desired results.
5. Return to step 1 (rerun the plan).
Lead Time VariabilityBy modeling different sources of variability, it is possible to understand the

Inventory Plan Options 3-25
contribution to buffer inventory from each source of variability. These uncertainties in production, transportation, and procurement are expressed as a percent variance for manufacturing lead time, in-transit lead time, and supplier lead time.
The key setup steps are:
1. Set up manufacturing lead time, in-transit lead time, and supplier lead time percent default values on the Constraints tab of the Plan Options form.
2. If you want to set up lead time variability at more detailed levels, see:
• Setting Up Manufacturing Lead Time Variability, page 4-17
• Setting Up In-Transit Lead Time Variability, page 4-18
• Setting Up Supplier Lead Time Variability, page 4-19
After setting up manufacturing, in-transit, and supplier lead variance percent, the process is then executed as follows:
1. Run the Inventory Optimization module with the lead time variability setup as described.
2. Review the results of the plan – check the inventory, safety stock and service levels.
3. If the results are satisfactory, use this plan as a demand schedule in tactical planning, using Oracle Advanced Supply Chain Planner.
4. If the results are unsatisfactory you change your goals (variability percentages) or constraints (budgets, minimum or maximum inventory levels) to achieve your desired results.
5. Return to step 1 (rerun the plan).
Inventory BudgetAn Inventory budget is the maximum amount allocated to be spent on inventory duringa planning period, and it represents the total value of the inventory. The inventory budget applies to both safety stocks and prebuilt stocks. It also applies to the surplus inventory that gets carried over from one planning bucket to the next.
You can specify budget for the following:
• Inventory plan
• Organizations in an inventory plan
• Categories in an organization

3-26 Oracle Inventory Optimization Users Guide
As the feasibility of an inventory plan depends on its budget, you need to take your budget into consideration in your inventory plan. After you define the budget, you can run your plans and analyze them by using the Analysis Workbench to:
• Ensure that your inventory plans are well within your budget.
• Determine if a specific service level is achievable with the given budget.
• Calculate the budget required to achieve a specific service level.
You can then drill down to the items causing budget violations using the Planner Workbench. For information on the Analysis Workbench, see Overview of Analysis Workbench, page 6-1. For information on the Planner Workbench, see Oracle AdvancedPlanning Implementation and User's Guide.
• Drill down to the items causing budget violations.
You can also allocate the budget to specific items, customers, market segments, and business units. You can also exclude some of the planned items from the budget. For example, you may want to exclude the items that are managed by your suppliers.
See Defining Budgets, page 4-12 and Analyzing Inventory Budgets, page 6-25.
Budget Constraints LogicOracle Inventory Optimization provides an enhanced logic for budget constraints. The enhanced logic ensures Inventory Optimization outputs integer safety stocks in the presence of a budget constraint and also ensures the deviation from the input budget constraint is minimal. For intermittent low volume demands the current logic was unable to provide an integer valued solution within the input budget constraint.
The logic for budget constraints is demonstrated in the following example.
The supply chain is as shown below.
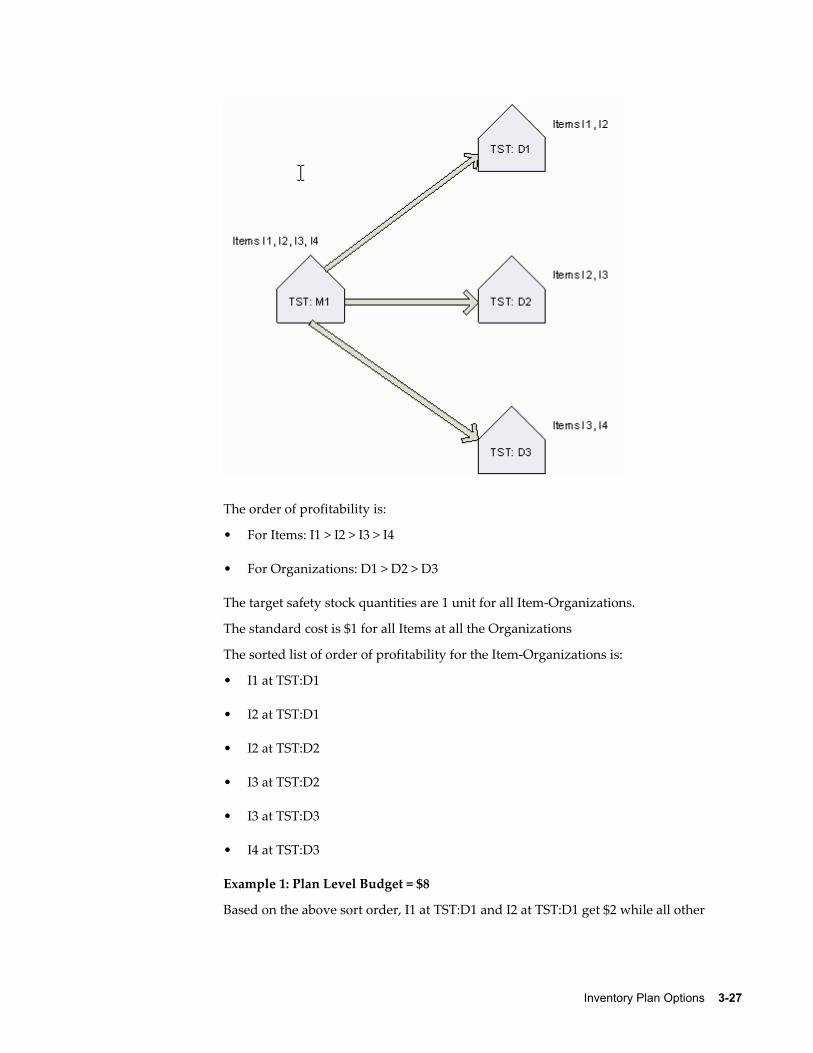
Inventory Plan Options 3-27
The order of profitability is:
• For Items: I1 > I2 > I3 > I4
• For Organizations: D1 > D2 > D3
The target safety stock quantities are 1 unit for all Item-Organizations.
The standard cost is $1 for all Items at all the Organizations
The sorted list of order of profitability for the Item-Organizations is:
• I1 at TST:D1
• I2 at TST:D1
• I2 at TST:D2
• I3 at TST:D2
• I3 at TST:D3
• I4 at TST:D3
Example 1: Plan Level Budget = $8
Based on the above sort order, I1 at TST:D1 and I2 at TST:D1 get $2 while all other

3-28 Oracle Inventory Optimization Users Guide
item-organizations get $1.
Example 2: Plan Level Budget = $4
Given the sort order, I3 at TST:D3 and I4 at TST:D4 do not get any allocation while all other item-organizations get $1.
Example 3: Budget specified at Organization Level. TST:D1 = $5; TST:D2 = $1
At organization TST:D1, I1 will get $3 and I2 will get $2
At organization TST:D2, I2 will get $1 and I3 will get nothing
Example 4: Plan Level Budget = $3; User Specified SS for Item I3 at TST:D3 is 3 units
Allocate $1 to I1 at TST:D1, I2 at TST:D1, and I2 at TST:D2
Allocate $3 to I3 at TST:D3
All other Item-Organization get zero allocation
Key Setups 4-1
4Key Setups
This chapter describes the key setups such as the target service levels and performance indicators that you need to specify before you run your inventory plan.
This chapter covers the following topics:
• Setting Plan Level Default Service Level
• Setting Plan Level Default Demand Fulfillment Lead Time
• Service Level Set
• Defining Service Level Sets
• Item Simulation Set
• Defining Item Attribute Simulation Sets
• Defining User-specified Safety Stock
• Defining Budgets
• Enforcing a Plan Option Budget Name or Value
• Setting Default Lead Time Variability
• Setting Up Manufacturing Lead Time Variability for a Plan
• Setting Up Manufacturing Lead Time Variability for an Item
• Setting Up In-Transit Lead Time Variability
• Setting Up Supplier Lead Time Variability
• Setting Penalty Costs
• Setting Item Purchase Price by Supplier
• Setting Performance Indicators
• Setting Intermittent Demand

4-2 Oracle Inventory Optimization Users Guide
Setting Plan Level Default Service LevelTarget service level is the percentage of demand that you plan to satisfy using your available inventory. The inventory planning engine uses the specified target service level to make recommendations such as target safety stock.
You can enforce target service levels to make sure that the plan meets the target service levels. To meet the enforced target service levels, the plan may violate budget or capacity constraints.
You can define the plan service level in the Service Level % field in the Constraints tabbed region of the Plan Options window.
Steps:1. From the Inventory Planner responsibility, navigate to the Plan Options window.
Inventory Plan > Options
2. Click the Constraints tab.
3. In the Plan Level Defaults region, set the default target Service Level for the plan.
4. (Optional) To ensure that these default values override any other specification or setting that may occur at a more detailed level, select the Enforce Plan Level Defaults check box.
Note: If the Enforce Plan Level Defaults' is unchecked, the most specific assignment of Service Levels in the Service Level Set associated with the plan is used for planning. If no value has been assigned in the associated Service Level Set, then the plan level default values, if set, are used. If the plan level default values are not set, then the system assumes a target service level of 50%.
See Defining Service Agreement Simulation Sets, page 4-4.
5. Save your work.
Setting Plan Level Default Demand Fulfillment Lead TimeYou can define the demand fulfillment service level in the Constraints tabbed region of the Plan Options window.
Steps:1. From the Inventory Planner responsibility, navigate to the Plan Options window.

Key Setups 4-3
Inventory Plan > Options
2. Click the Constraints tab.
3. In the Plan Level Defaults region, set the default Demand Fulfillment Lead Time forthe plan.
4. (Optional) To ensure that these default values override any other specification or setting that may occur at a more detailed level, select the Enforce Plan Level Defaults check box.
Note: If the Enforce Plan Level Defaults' is unchecked, the most specific assignment of Fulfillment Lead Time in the Service Level Set associated with the plan is used for planning. If no value has been assigned in the associated Service Level Set, then the plan level default values, if set, are used. If the plan level default values are not set, then the system assumes a fulfillment lead time of zero days.
See Defining Service Agreement Simulation Sets, page 4-4.
5. Save your work.
Service Level SetSpecific service level targets can be assigned to items, categories of items, customers, classes of demand, an organization or combinations of these. These are defined in a form titled Service Levels and Fulfillment Lead Time. This form serves as a central placeto set service levels for items, categories, organizations, customers, and so on. It makes obsolete several ways that service levels could be set prior to Release 12.0, such as a flex field in Oracle Inventory, and the Allocations form.
When an item has target service levels assigned at different levels of specificity, the more specific setting overrides the less specific one. The various levels of assignment allowed in a Service Level Set are listed below in increasing order of specificity.
ExampleFor example, Item-Demand Class is more specific than Customer Site. In the case wherethe scope of target service level overlaps Customer Site and Item-Demand Class, the settings for Item-Demand Class would be in effect.
1. Instance-Organization
2. Customer
3. Customer Site

4-4 Oracle Inventory Optimization Users Guide
4. Demand Class
5. Instance-Organization-Demand Class
6. Category
7. Category Demand Class
8. Item-Demand Class
9. Item-Instance-Organization
10. Item-Instance-Organization-Demand Class
See Defining Service Agreement Simulation Sets, page 4-4.
Defining Service Level SetsA service level set needs to be associated with a plan to ensure that specific assignmentsof target service levels and fulfillment lead times are respected in the planning process. The Service Level Set is associated with a plan by clicking the constraints tab of the PlanOptions folder, and then selecting the appropriate Service Level Set from the list of values to use with the plan.
Specific service level targets can be assigned to items, categories of items, customers, classes of demand, an organization or certain allowed combinations. These are done by choosing the appropriate assignment level, and then specifying the desired target service level and fulfillment lead time.
To set up a Service Level Set, use this procedure:

Key Setups 4-5
Prerequisites❒ As part of the setup it is necessary to specify the value of the profile option MSC:
Service Level Category Set. Only categories from this category set are available when assigning target service levels and fulfillment lead times at a category level during the setup of specific item or category level service levels and fulfillment leadtimes.
Steps:
To set up a Service Level Set1. From the Inventory Planner responsibility, navigate to the Service Levels and
Fulfillment Lead Time window.
Inventory Planner > Setup > Service Levels & Fullment Lead Time
2. Define a Service Level Set name and description.
3. (Optional) Select the 'Set as display default' check box to indicate that this Service Level Set should appear as the default value in the header region of the Plan Options window.
4. In a row under the Assignment Level column, select an Assignment Level from the list of values.
5. For that same row, specify the applicable details, such as: Category, Demand Class, Item, Customer, and Customer site, to apply to the selected Assignment Level.
Note: The fields in the Assignment Level row in which you can adddetails varies, depending on the Assignment Level you selected.
6. For that same row, in the Service Level (%) column, specify the target service level, in percent, for the Assignment Level.
7. For that same row, in the Fulfillment Lead Time column, specify the Demand Fulfillment Lead Time, in days. See Demand Fulfillment Lead Time, page 3-23.
8. Repeat steps 4 - 7 for each additional Assignment Level in the Service Level Set.
9. Save your work.
To associate a Service Level Set with a Named Plan10. Navigate to the Inventory Plan Options window:
Inventory Planner > Inventory Plan > Names
4-6 Oracle Inventory Optimization Users Guide
The Organizations window appears.
11. Select an organization and click OK.
The Inventory Plan Names window appears.
12. Select a plan and then click Plan Options
The Plan Options window appears.
13. Select the Constraints Tab.
The Service Level Set field located in the header region is enabled.
14. From the Service Level Set list of values, select a Service Level Set.
15. Save your work.
Item Simulation SetItem Attribute Simulation Sets enable Inventory Optimization plans to more easily simulate changes to key item attributes. You to attach values of key attributes to item-organizations or to item-regions, and then save those assignments under an Item Attribute Simulation Set name.
Item Simulation Sets provide the ability to mass maintain planning-related item attributes. Planners can create multiple item simulation sets, with each simulation set addressing a set of "what-if" scenarios.
The Item Simulation Set field appears in the header region of the Plan Options window.When you specify a particular item attribute simulation set name in the Item SimulationSet field of the Plan Options window, the plan uses the item attribute values specified inthe named simulation set.
Key setup steps are:
1. Identify the scenario to be simulated.
2. Determine the scope of the simulation.
3. Create a Query to identify Items that fit the scope.
See Queries, page 5-2.
4. Identify attributes that need to be modified to meet the simulation objective.
5. Modify the attributes according to the scenario to be simulated.
6. Save the attributes as a named Item Simulation Set.

Key Setups 4-7
7. Link the Item Simulation Set to a plan in the header region of the Plan Options form.
• The simulation set holds only the changes for the collected planning item attributes.
• When running a plan these changes overwrite the collected data values for that specific plan.
• Collected data remains unaltered.
• If there is no simulation set linked with a plan, the plan runs against the collected data.
See Defining Item Attribute Simulation Sets, page 4-7.
Defining Item Attribute Simulation Sets
Steps:1. From the Advanced Supply Chain Planner responsibility, navigate to the Item
Attributes Mass Maintenance window.
Setup > Item Attributes Mass Maintenance
The Item Attributes Mass Maintenance window appears.
2. Define the Simulation Set Name and Description.
3. Find relevant items.
ExampleExample, using the Find Items - 'Included' radio button:
• Item A:
• Make/Buy: Make
• Planner: J. Smith
• Processing LT: 3 days
• Item A was previously updated.
• Item B:
• Make/Buy: Buy

4-8 Oracle Inventory Optimization Users Guide
• Planner: J. Smith
• Processing LT: 2 days
• Item C:
• Make/Buy: Buy
• Planner: J. Smith
• Processing LT: 3 days
• Item C was previously updated.
• Query criteria:
• Make/Buy: Buy
• Planner: J. Smith
• The 'Included' radio button is selected
• Result: the query results return Item C only.
Note: Item B does not qualify since it has not been updated in this simulation set, and Item A does not qualify since it does not meet the query criteria
• Use the 'Not included' radio button when finding those items that have not been updated as part of the simulation set. This is useful for adding new items to the simulation set. The results of the query filters out the items that have been updated in this simulation set.
Continuing the previous example, if the query is used in conjunction with the 'Not included' radio button, query results return Item B only.
Note: Item C does not qualify since it has been updated in this simulation set, and Item A does not qualify since it does not meet the query criteria.
• Use the 'All' radio button for finding all items regardless of update status. This is useful in situations where a new simulation scenario is being developed and is applicable to all items.
Continuing the previous example, if the query is used in conjunction with the 'All' radio button, query results return Item B and Item C.

Key Setups 4-9
Note: Item A does not qualify since it does not meet the query criteria
4. Define the simulation set. Select the check boxes associated with relevant items.

4-10 Oracle Inventory Optimization Users Guide
5. Modify attributes. The available conditions that can be used to update the Attributes are as follows:
• Set value to: set the attribute to a specified value
• Increase by value: increase the original attribute by a specified value
• Increase by percentage: Increase the original attribute by a specified percentage (%)
• Decrease by value: Decrease the original attribute by a specified value
• Decrease by percentage: Decrease the original attribute by a specified percentage (%)
• Set original value: Reset the attribute back to the original collected value

Key Setups 4-11
6. Repeat the preceding step for all attributes to be modified. Click Apply.
The form updates to show the original and modified values.
Note: The original set of values refer to the collected data, and hence cannot be updated.
7. Specify the simulation set in the Item Simulation Set field of the Plan Options window.

4-12 Oracle Inventory Optimization Users Guide
See Setting Up Plan Options, page 3-2.
Note: If the Item Simulation Set field is left blank, then collected data will be used for planning.
Defining User-specified Safety StockSeveral factors may influence your decision related to the level of safety stock that you need to maintain. These include:
• Contractual obligations
• Vendor-managed inventory
• Policies regarding service levels
• Subjective experience
The inventory planning engine recommends optimal safety stock levels. However, you can override the recommendations that the inventory planning engine generates with your specific inputs. For more information, see User-Specified Safety Stock, page 7-5.
Defining BudgetsTo define an inventory budget
Prerequisites❒ To define a budget, you need to set up a category set for budget purposes and
associate categories to this category set. Both these tasks are done in Oracle Inventory. For more information on categories and category sets, see Oracle Inventory User's Guide.
Steps:1. Log on to Oracle Inventory Optimization.
2. From the Navigator, choose Other > Profile.
• The Personal Profile Values window appears.
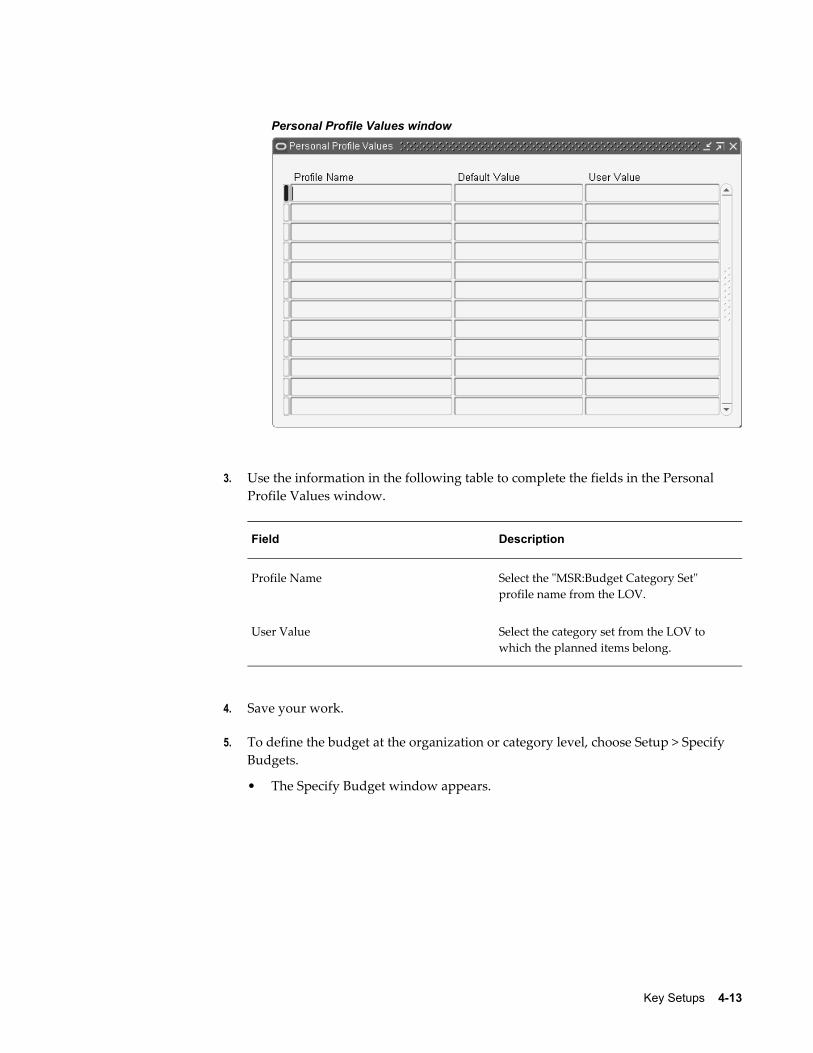
Key Setups 4-13
Personal Profile Values window
3. Use the information in the following table to complete the fields in the Personal Profile Values window.
Field Description
Profile Name Select the "MSR:Budget Category Set" profile name from the LOV.
User Value Select the category set from the LOV to which the planned items belong.
4. Save your work.
5. To define the budget at the organization or category level, choose Setup > Specify Budgets.
• The Specify Budget window appears.

4-14 Oracle Inventory Optimization Users Guide
Specify Budget window
6. Use the information in the following table to complete the fields in the Specify Budget window.
Field Description
Name Specify a name for the budget.
Description Specify a description for the budget.
Organization Select the organizations from the LOV for which you want to define the budget.
Category Select the categories from the LOV for which you want to define the budget.
Budget Specify the value for the budget.
7. To define the budget at the plan level, navigate to the Constraints tabbed region of the Plan Options window. For more information, see The Constraints Tabbed Region, page 3-19.

Key Setups 4-15
Note: To exclude an item from your budget, clear the Exclude FromBudget check box in the MPS/MRP Planning tabbed region of the Master Item window in Oracle Inventory. For more information, see Oracle Inventory User's Guide.
Enforcing a Plan Option Budget Name or ValueSelect Enforce Budget Constraints on the Plan Options window if you want the plan to be constrained by a budget. To Enforce Budget Constraints, select the name of the budget that you want the inventory optimization planning process to use as the budget constraint.
Alternatively, you can leave this field empty if you want to specify the plan option Budget Value. Enter a value for the inventory optimization planning process to use as the budget constraint. Do not enter a Budget Value if you select a value for the plan option Budget Name.
If you enforce the budget that you have defined, the inventory planning engine makes sure that the inventory plan adheres to the budget at all levels. Consider that you plan for two organizations where $75,000 is the total budget for the plan, and $50,000 and $30,000 are the budgets for the first and second organizations respectively. If you enforce this budget in your plan, the inventory planning engine recommends an inventory of only up to $50,000 and $30,000 for the first and second organizations respectively. At the plan level, it recommends an inventory of only up to $75,000. If the plan level budget exceeds $75,000, then the engine optimizes the recommended inventory at the organization level so that the combined budget of the two organizations does not exceed $75,000.
Enforcing service level constraints or capacity constraints may violate budget constraints. Conversely, enforcing budget constraints may violate service level constraints and capacity constraints. You can enforce budget constraints at the plan level by specifying the budget name or the budget value in the Plan Options window. For information on enforcing constraints for a plan, see The Constraints Tabbed Region,page 3-19. The inventory planning engine reports any violations as exceptions. For information on plan exception messages, see Reviewing Exception Messages, page 5-16.
Usually, target safety stock and user-defined safety stock are enforced when there is adequate budget. The inventory planning engine's built-in logic makes sure that the budget is allocated accordingly to meet the enforced service levels for all items. The inventory planning engine allocates any surplus budget based on the following criteria:
• Potential profitability
• Service levels

4-16 Oracle Inventory Optimization Users Guide
• Demand distribution
Note: If you enforce target safety stock or user-defined safety stock, it isassumed that you have specified an adequate budget. If the budget is not adequate, the engine violates the budget constraints even if you have enforced budget constraints.
The following example details how the inventory planning engine allocates the budget surplus.
ExampleConsider a plan for three items with a total budget of $10,000. Assume that you have specified a target service level of 85% for all three items. The inventory planning engine calculates the safety stock levels required to achieve a service level of 85% for the three items. Assume that the budget required for a service level of 85% for the three items is $7000. The inventory planning engine distributes the surplus $3000 proportionately for the three items based on their potential profitability and demand distribution. As a result, the actual service level for the three items may differ from one another even though you have specified a consistent service level of 85% for all the three items.
Setting Default Lead Time VariabilityPlan-wide default values for manufacturing, in-transit, and supplier lead time variability are specified in the constraints tab of the Plan Options form. The values specified here are used as defaults in the case where users have not specified the value of the variability for specific items. Optionally a user can check the Enforce Plan Level Defaults check box to ensure that these defaults override any other detailed specification or setting.
Steps:1. Plan-wide default values for lead time variability are specified in the constraints tab
of the Plan Options form. From the Inventory Planner responsibility, navigate to thePlan Options window.
Inventory Plan > Names
The Inventory Names window appears.
2. Click the Constraints tab.
3. In the Plan Level Defaults region, set the default lead time variability percentages for the plan.
4. (Optional) To ensure that these default values override any other specification or setting that may occur at a more detailed level, select the Enforce Plan Level Defaults check box.

Key Setups 4-17
5. Save your work.
Setting Up Manufacturing Lead Time Variability for a PlanManufacturing lead time variability for a plan is set in the Items window accessed from the Collections Workbench.
Steps:1. From the Inventory Planner responsibility, navigate to Inventory Planner >
Collections >View Collected Data.
The Navigator window opens.
2. On the Plans tab of the Navigator, select View by Organization.
3. In the Navigation window, drill down to Plan Name: : Plans>Collection>Plan Name.
4. Drill down to the item for which you want to set manufacturing lead time variability.
5. Access the Items form: Right click the item and then choose Items from the menu.
6. Click the Item field and then select the item for which you want to set the manufacturing lead time variability from the menu.
7. Set the manufacturing lead time variability, in percent.
8. Save your work.
Setting Up Manufacturing Lead Time Variability for an ItemManufacturing lead time variability for an item is set in the Item Attributes Mass Maintenance window, which is accessed from the Workbench.
Steps:1. From the Inventory Planner responsibility, navigate to Inventory
Planner>Setup>Item Attributes Mass Maintenance.
The Item Attributes Mass Maintenance window opens.
2. In the Item Simulation Set window, enter the name of the Item Simulation Set.
3. Click the Item field and select the item from the drop-down menu and click OK. If necessary, enter a partial name in the Find field to locate the item and them click

4-18 Oracle Inventory Optimization Users Guide
OK.
4. Click the Org field and select the organization that contains the item from the drop-down menu and click OK. If necessary, enter a partial name in the Find field to locate the organization and them click OK.
5. Click the Select checkbox to the left of the Item and Org.
6. In the Item attributes available for update section at the bottom of the window, clickthe Attribute Name field.
The Item Attributes window opens.
7. In Item Attributes window, select Manufacturing LT Variability and click OK.
8. Click the Condition field.
A window opens with a list of all the possible conditions.
9. Select the desired condition.
10. Click the Attribute Value field and enter the desired value.
11. Click Apply.
12. Save you work.
Setting Up In-Transit Lead Time VariabilityIn-transit lead time variability is setup in the transit times form accessed from the navigator. In addition to specifying the in-transit time, you can specify the variability of the transit time. This variability is expressed as a percent (%) variance for each ship method between a source and a destination organization.
Note: This form should be accessed only in the planning instance and not from the source (ERP) instance. The same form in the source instance does not allow setting of in-transit lead time variability.
Steps:1. From the Inventory Planner responsibility, navigate to the Transit Times window.
Inventory Planner > Setup > Transit Times
The Transit Times window appears.

Key Setups 4-19
2. In the Shipping Networks region, select the row for the from - to organization combination for which you want to specify in-transit lead time variability.
The Ship Methods region populates with established shipment methods between the source and destination organizations.
3. In the Ship Methods region, set up the Transit Time and the In-transit Lead Time Variability as a percentage of the Transit Time.
4. Save your work.
Setting Up Supplier Lead Time VariabilitySupplier lead time variability represents the uncertainty in the availability of supplies. You need to set this up for the inventory planning engine to factor in this uncertainty when it calculates the safety stock levels.
You can specify supplier lead time variability either at the item-supplier level or at the supplier level. The inventory planning engine uses the information specified at the supplier level if you have not specified it at the item-supplier level.
Supplier lead time variability is set in the Suppliers window accessed from the Collections Workbench. Supplier variability can be specified either as a discrete distribution or as a percent (%) variance for a normal distribution.
Note: You can specify supplier lead time variability information only inthe planning server.
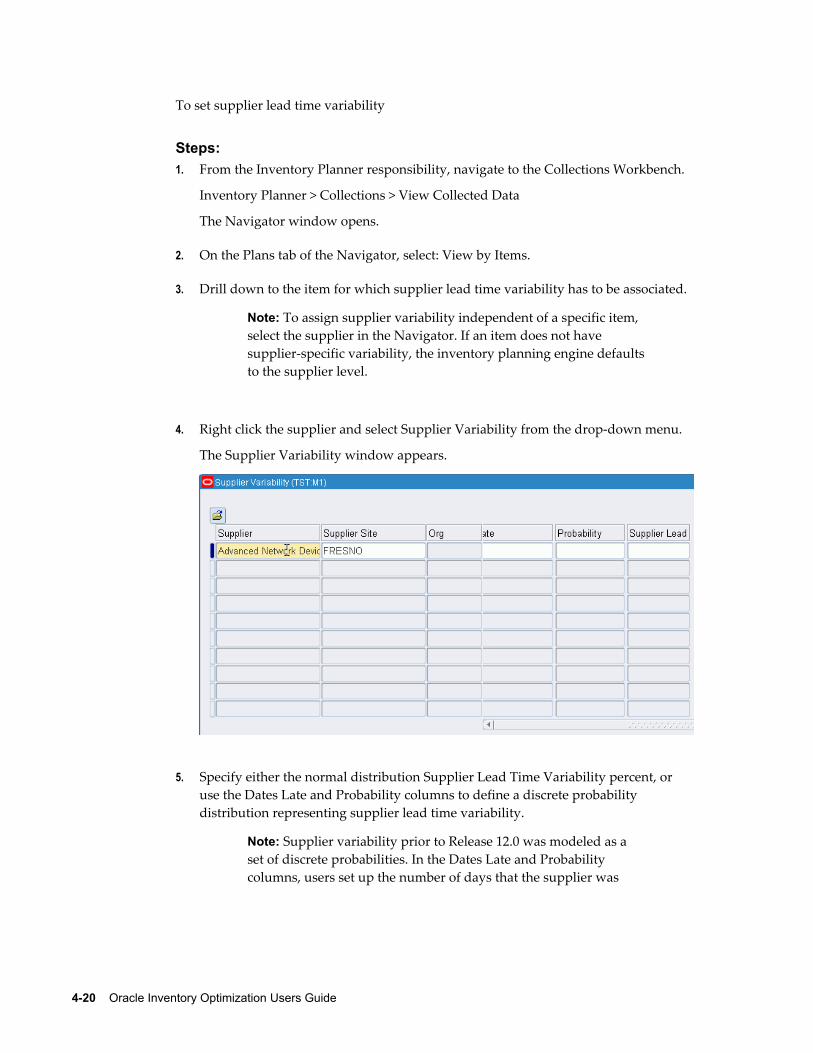
4-20 Oracle Inventory Optimization Users Guide
To set supplier lead time variability
Steps:1. From the Inventory Planner responsibility, navigate to the Collections Workbench.
Inventory Planner > Collections > View Collected Data
The Navigator window opens.
2. On the Plans tab of the Navigator, select: View by Items.
3. Drill down to the item for which supplier lead time variability has to be associated.
Note: To assign supplier variability independent of a specific item, select the supplier in the Navigator. If an item does not have supplier-specific variability, the inventory planning engine defaultsto the supplier level.
4. Right click the supplier and select Supplier Variability from the drop-down menu.
The Supplier Variability window appears.
5. Specify either the normal distribution Supplier Lead Time Variability percent, or use the Dates Late and Probability columns to define a discrete probability distribution representing supplier lead time variability.
Note: Supplier variability prior to Release 12.0 was modeled as a set of discrete probabilities. In the Dates Late and Probability columns, users set up the number of days that the supplier was
Key Setups 4-21
expected to be late, along with an associated discrete probability forthe occurrence. With Release 12.0, the user can specify a percent (%)variance in the Supplier Lead Time Variability column. Users can specify variance using one or the other methods, but not both.
Fields Description
Supplier Supplier name
Supplier Site Supplier site name
Org Organization
Days Late The number of days by which the item has been delivered late. You can enter only whole numbers. You can enter a negative whole number to indicate early delivery.
Probability Specify a number between 0 and 1 corresponding to each estimation of days late for the item. The probabilities should sum to 1.
Supplier Lead Time Variability Specify a percentage.
See Setting Plan-Level Lead Time Variability Default Values, page 4-16.
6. Save your work.
Setting Penalty CostsPenalty costs are what you think will be the costs for violating such things as supplier capacity and resource capacity. You set this up to indicate to the inventory planning engine how much it is going to cost when you exceed the capacities. For example, you can set up the cost of overloading your suppliers and the cost of overworking your production team.
You can set the penalty costs at either the plan options level or at the profile options level. The penalty costs at the plan options level takes precedence over the penalty costsset up at the profile options level.
The inventory planning engine uses the penalty costs or the service level or both in calculating safety stock quantities as shown in the following table:

4-22 Oracle Inventory Optimization Users Guide
Plan Level Defaults Enforce Service Level Enforce Capacity
Service Level Used Used only for target safety stock calculation
Resource Penalty Costs Used Used only for target safety stock calculation.
Material Penalty Costs Used Used only for target safety stock calculation
Late Demand Penalty Costs Not used Used
When you enforce service level constraints, the inventory planning engine calculates safety stock quantities for the specified service levels while minimizing penalty costs forexceeding material capacity, exceeding resource capacity, and exceeding transportation capacity.
Penalty costs for late demand is used only when you enforce capacity constraints.
Note: You can specify either input service level or input penalty costs for late demand.
Setting Item Purchase Price by SupplierDuring the collections process, Oracle Inventory Optimization captures the item purchase price by supplier and supplier site by taking the unit price from the most recent purchase order for each item. Oracle Inventory Optimization uses the item purchase price to calculate the purchasing cost for an item. You can view the item purchase price in the Supplier Capacity window. You can navigate to this window fromboth the Collections Workbench and the Planner Workbench.
To view item price by supplier:
Steps:1. Navigate to the Collections Workbench (Collections > View Collected Data) or
Planner Workbench (Inventory Plan > Workbench).
2. View by Suppliers.
3. In the Navigator, drill down and select an item underneath a supplier.
4. Select Supplier Information from the right-click popup menu. The Supplier

Key Setups 4-23
Capacity window appears.
Supplier Capacity window
5. Scroll to the right to view the Supplier Price field.
Setting Performance IndicatorsYou can compare inventory plan output to the following performance indicators:
• Inventory turns
• Service level
• Planned utilization
• Margin
• Margin percentage
• Cost breakdown
• Inventory value

4-24 Oracle Inventory Optimization Users Guide
Note: You can set targets for all Performance Indicators except margin and cost breakdown.
For information on setting performance indicator targets, see the Oracle Business Intelligence System Implementation Guide.
The Constraints Tabbed Region, page 3-19
Reviewing Exception Messages, page 5-16
Overview of Analysis Workbench, page 6-1
User-Specified Safety Stock, page 7-5
Setting Intermittent DemandOracle Inventory Optimization explicitly supports the computation of Safety Stock and service level calculations for Intermittent demands. Sparse or sporadic demands fed into Oracle Inventory Optimization from Service Parts Planning have been generated using a statistical method designated as being for intermittent demands, or forecasts that are designated via plan options to be of the intermittent demand variety, will now be assumed by Oracle Inventory Optimization to have a more appropriate Poisson distribution.
To define intermittent demand
1. Log on to Oracle Inventory Optimization.
2. From the Navigator, choose Inventory Planner> Item Attribute Mass Maintenance.
The Item Attribute Mass Maintenance table appears.
3. Populate the Item Attribute Mass Maintenance table as shown in the table below.
Field Values Description
Key Setups 4-25
Intermittent Demand Yes, No Enter values at level ITEM-ORGANIZATION, ITEM-ZONE.
If set to YES, safety stock for the Item-Organization or Item-Zone is computed using POISSON distribution.
If set to NO, Safety stock for the Item-Organization or Item-Zone is computed using NORMAL distribution.
Mean Inter Arrival Enter the mean inter arrival in days.
ExampleExample of Intermittent Demand
This example illustrates item-organizations with sporadic or intermittent demands.
Item Intermittent Demand Mean Inter Arrival (time in days)
Forecast Rule for Demands
RMR_IO_B Yes 10
RMR_IO_C No 4 St-1
RMR_IO_D No 4 St-1
In the above table, the safety stock for Item RMR_IO_B is computed using Poisson distribution because Intermittent Demand is set to Yes. For Items RMR_IO_C and RMR_IO_D, safety stock is computed using Normal distribution.
Safety Stock Calculations for Item: RMR_IO_B (Poisson distribution)
Item: RMR_IO_B; Since Intermittent Demand is set to YES; it is modeled as Poisson
Item Lead Time (L) = 5 days
Demand Rate (Lambda) = 1/(Mean Inter Arrival Time) = 1/10 = 0.1
Service Level (SL) = 90%


Viewing Output 5-1
5Viewing Output
This chapter details how to view the output after you run an inventory plan.
This chapter covers the following topics:
• Overview of Viewing Output
• Queries
• Creating Queries
• Editing and Maintaining Queries
• Executing Queries
• Setting Queries Preferences
• Performance Indicators
• Time-phased Supply and Demand
• Visibility to Forecast Variability
• Viewing the Demand Fulfillment Lead Time
• Safety Stock and Target Safety Stock
• Safety Stock Analysis - Viewing the Plan
• Resource Requirements
• Material/Resource Availability
• Reviewing Exception Messages
Overview of Viewing OutputYou can view the output of your inventory plans using the Planner Workbench as well as the Analysis Workbench. The Analysis Workbench enables you to view and analyze the output both at the aggregate level and the detailed level. The Planner Workbench enables you to do a detailed analysis of the output.

5-2 Oracle Inventory Optimization Users Guide
For more information on the Analysis Workbench, see Overview of Analysis Workbench, page 6-1
This chapter explains how you can view the output through Planner Workbench using the following:
• Horizontal plan
• Vertical Plan
• Performance Indicators
• Time-phased Supply and Demand
• Constrained and Unconstrained Safety Stocks
For information on the Horizontal Plan window and the Vertical Plan window, see Oracle Advanced Planning Implementation and User's Guide.
QueriesInventory Optimization supports personal queries for orders. This allows planners to retrieve key demand and supply orders such as: forecasts for all items with service levelviolations. Queries can be specified as Public, and then shared with other planners.
In addition to retrieving orders on the basis of supply/demand attributes such as quantity, due date, planner code, and order type, planners can retrieve orders related toInventory Optimization exceptions. The Match All and Match Any features are available for query criteria. Match All is similar to the 'and' logic condition, and Match Any is similar to the 'or' logic condition.
Planners can create multiple queries, with each query addressing a specific set of ordersthat need to be reviewed. Multiple sub queries can be combined to form a query. When the Order query is executed, all the sub queries within the Order query are executed. Thus, the displayed orders are the result of the union of all executed sub queries. Any ofthe individual query criteria can be made inactive by deselecting the 'Active' check box. This offers flexibility in restructuring the query.
Planners can selectively execute the queries, review the results directly, and take necessary actions using standard processes. Execution of the query opens the Supply and Demand window directly.
See:
• Queries, page 5-3
• Editing and Maintaining Queries, page 5-5
• Executing Queries, page 5-5
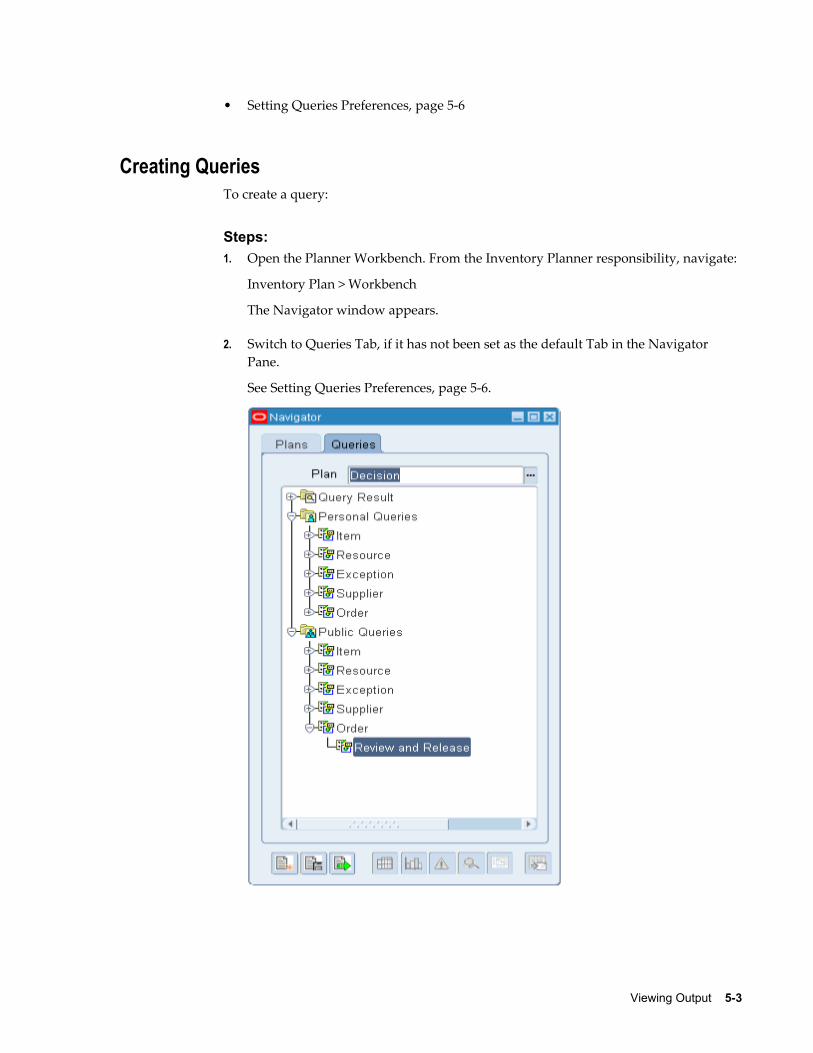
Viewing Output 5-3
• Setting Queries Preferences, page 5-6
Creating QueriesTo create a query:
Steps:1. Open the Planner Workbench. From the Inventory Planner responsibility, navigate:
Inventory Plan > Workbench
The Navigator window appears.
2. Switch to Queries Tab, if it has not been set as the default Tab in the Navigator Pane.
See Setting Queries Preferences, page 5-6.

5-4 Oracle Inventory Optimization Users Guide
3. Select the 'Create Query' icon located at the bottom left of the Navigator Pane.
The Create Query window appears.
4. Specify a Query Name and Description.
5. Select a Query Type, Owner, and specify whether this query will be available to the public.
6. (Optional) If this query includes existing sub-queries, in the Query region, list the Names of the sub queries.
Note: Multiple sub-queries can be entered, each with its own criteria Upon execution, all sub-queries will be executed
7. Select the Active check box for sub-queries that you want to be in effect.
8. In the Query Criteria region, enter the query criteria. Multiple criteria can be specified.

Viewing Output 5-5
• Select the Match All radio button to retrieve the intersection of all criteria.
• Select the Match Any radio button to retrieve the union of all criteria.
9. Click Save.
Editing and Maintaining QueriesTo edit a query:
Steps:1. Open the planner work bench, and then switch to Queries tab if the Queries tab is
not the default tab in the Navigator pane.
2. If the query is specified as a non public query, drill down to the query from the Personal Queries node.
3. If the query is specified as a Public query, drill down from the Public Queries node.
Note: Queries specified as Public can only be edited by the user who created the query. Other users can only view and use them.
4. Drill down to the required Order query from the Order Node. Highlight the required query. Right mouse click the query, and then select View Query from the right-click menu.
5. Edit the query, and then click Save.
Executing QueriesTo execute a query:
Steps:1. Open the planner work bench, and then switch to Queries tab if the Queries tab is
not the default tab in the Navigator pane.
Drill down to the Order Query to be executed, and highlight the query.
2. Specify the Plan name against which the query should be executed.
3. Click the Execute Query icon.
The Supply/Demand Query Review and Release window appears.
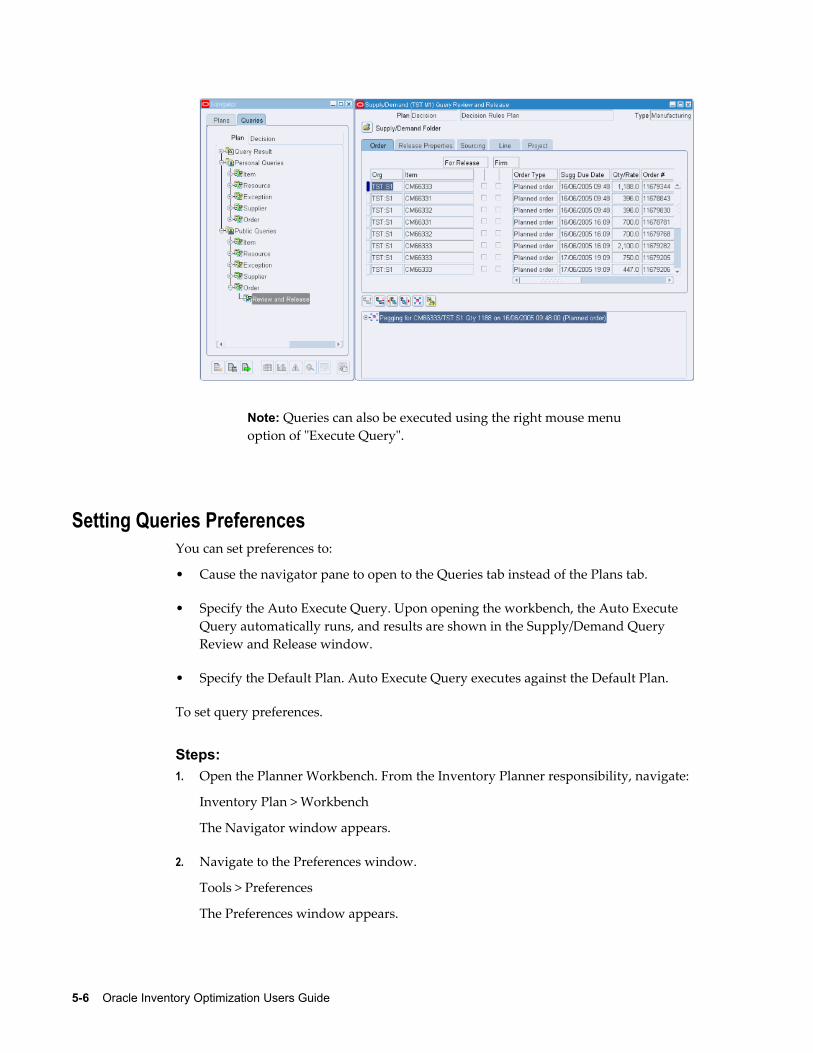
5-6 Oracle Inventory Optimization Users Guide
Note: Queries can also be executed using the right mouse menu option of "Execute Query".
Setting Queries PreferencesYou can set preferences to:
• Cause the navigator pane to open to the Queries tab instead of the Plans tab.
• Specify the Auto Execute Query. Upon opening the workbench, the Auto Execute Query automatically runs, and results are shown in the Supply/Demand Query Review and Release window.
• Specify the Default Plan. Auto Execute Query executes against the Default Plan.
To set query preferences.
Steps:1. Open the Planner Workbench. From the Inventory Planner responsibility, navigate:
Inventory Plan > Workbench
The Navigator window appears.
2. Navigate to the Preferences window.
Tools > Preferences
The Preferences window appears.
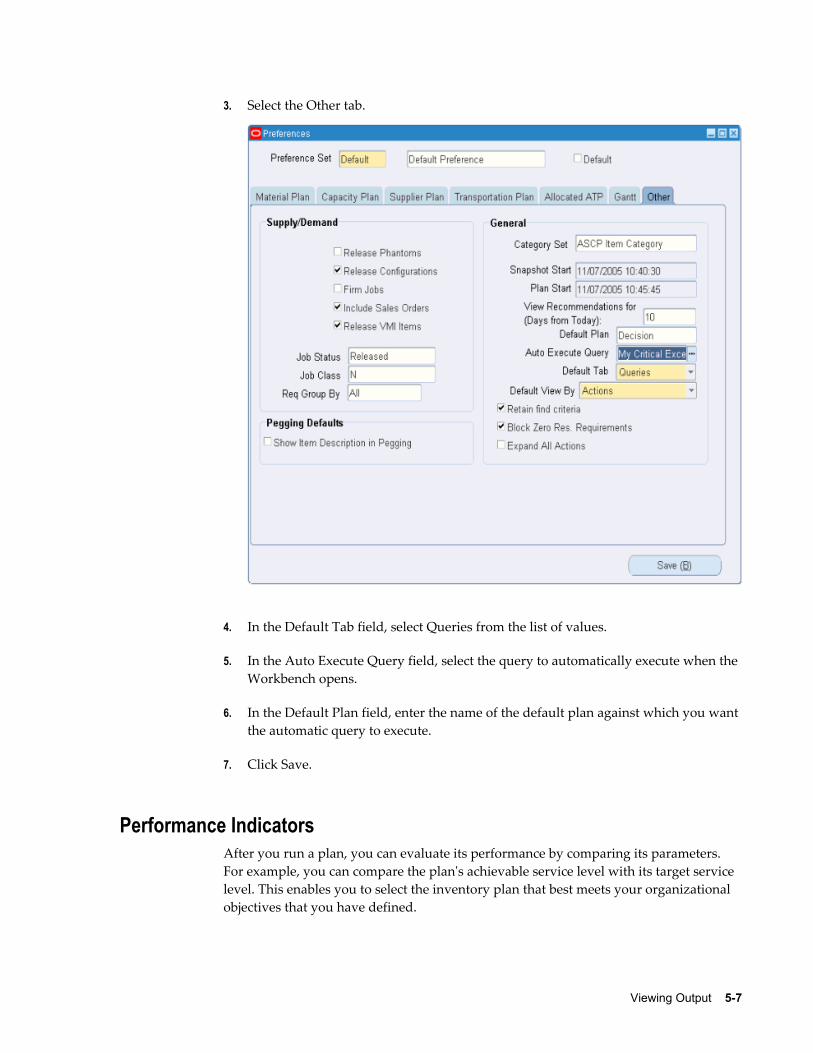
Viewing Output 5-7
3. Select the Other tab.
4. In the Default Tab field, select Queries from the list of values.
5. In the Auto Execute Query field, select the query to automatically execute when the Workbench opens.
6. In the Default Plan field, enter the name of the default plan against which you want the automatic query to execute.
7. Click Save.
Performance IndicatorsAfter you run a plan, you can evaluate its performance by comparing its parameters. For example, you can compare the plan's achievable service level with its target service level. This enables you to select the inventory plan that best meets your organizational objectives that you have defined.

5-8 Oracle Inventory Optimization Users Guide
The Key Indicators window is a summary chart that provides a graphical display of an inventory plan's key performance indicators. Using this window, you can see how the inventory plan performs relative to the following measures:
• Inventory turns
• Service level
• Planned utilization
• Margin
• Margin percentage
• Cost breakdown
• Inventory value
To navigate to the Key Indicators window, select a plan in the Navigator and choose Key Indicators from the right-click popup menu.
For more information on performance indicators, see Oracle Advanced Planning Implementation and User's Guide.
Time-phased Supply and DemandYou can view time-phased supply and demand for all the items in your inventory plan using the Supply/Demand window. This enables you to analyze factors regarding supply and demand on a day-by-day or bucket-by-bucket basis. For example, you can find out how demands are met and how supplies are planned over a specify time frame.You can navigate to the Supply/Demand window from various node types such as items, organizations, and plans from the Navigator. In addition to the Navigator, you can also drill down to the Supply/Demand window from other windows such as the Vertical Plan window.
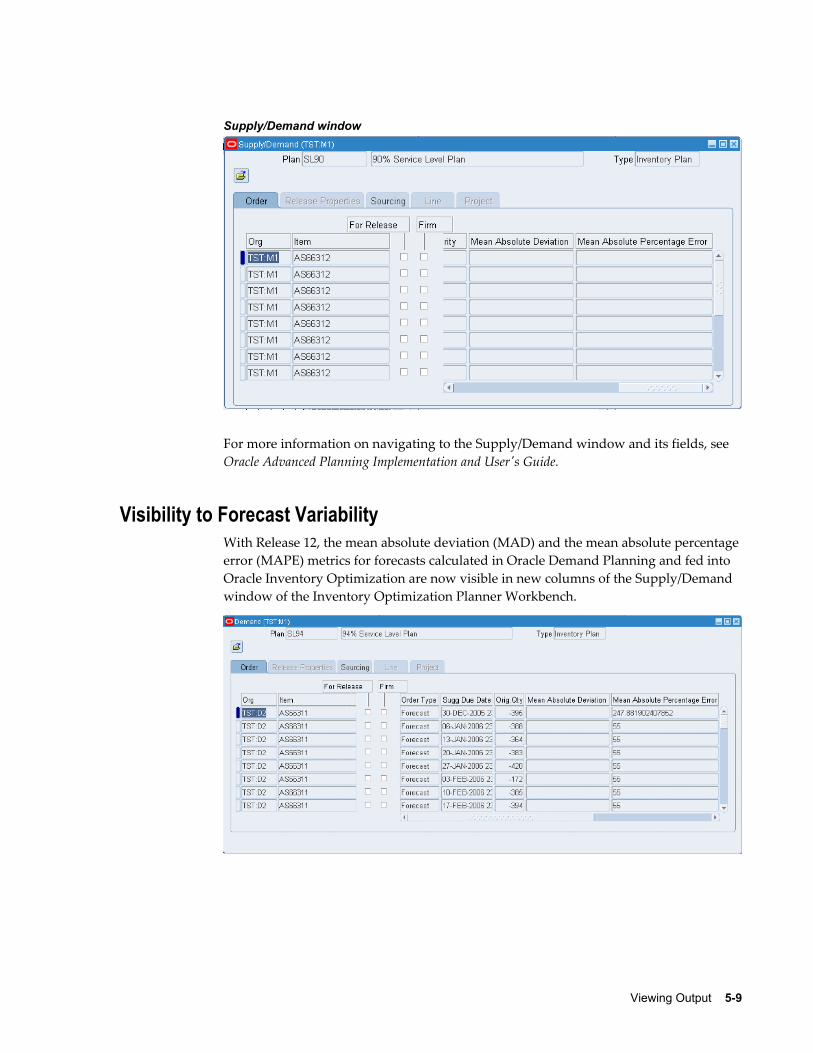
Viewing Output 5-9
Supply/Demand window
For more information on navigating to the Supply/Demand window and its fields, see Oracle Advanced Planning Implementation and User's Guide.
Visibility to Forecast VariabilityWith Release 12, the mean absolute deviation (MAD) and the mean absolute percentageerror (MAPE) metrics for forecasts calculated in Oracle Demand Planning and fed into Oracle Inventory Optimization are now visible in new columns of the Supply/Demand window of the Inventory Optimization Planner Workbench.

5-10 Oracle Inventory Optimization Users Guide
Viewing the Demand Fulfillment Lead TimeWhen reviewing a plan, the fulfillment lead time assigned at different levels can be viewed in the service levels folder of the analysis workbench. The fulfillment lead time shown is the value set by the user in the service level set at the particular level of aggregation being viewed. In the case where there is no assignment at the level at whichthe user is viewing the data, the results of default values, or assignments at more aggregate and less specific levels are not shown.
Steps:1. Navigate to the Service Level Breakdown page.
Inventory Analyst > Service Levels Folder
2. Select one or more Plans. Click Go.
This folder shows the service levels and fulfillment lead times at the level that you are viewing the data.
Safety Stock and Target Safety StockSafety stock levels are the stock levels required to provide a specific service level. The plan constraints such as budget and capacity constraints are considered when the safetystock levels are calculated. Target safety stock levels are the safety stock levels without
Viewing Output 5-11
considering the plan constraints.
The inventory planning engine calculates and displays both safety stock and target safety stock levels. It calculates the target safety stock based on the target service level that you specify. It calculates the safety stock level after taking the constraints into account. Viewing the target safety stock and safety stock levels helps you find answers to the following questions:
• What service level is achievable?
• What do I need to do in order to achieve the target service level?
You can view the time-phased safety stock quantities for all items in a plan using the Horizontal Plan window. The values for the safety stock displayed in the Horizontal Plan and the Supply/Demand window may vary because the inventory planning enginerounds off the safety stock quantity in the horizontal plan. To access the Horizontal Plan window, click the Horizontal Plan icon in the Planner Workbench.

5-12 Oracle Inventory Optimization Users Guide
Horizontal Plan window

Viewing Output 5-13
With Release 12, the horizontal plan of the Inventory Optimization Planner Workbench can now display the following additional rows:
• Target Service Level, expressed in percent (%)
• Achieved Service Level, expressed in percent (%)
• Mean Absolute Deviation
• Mean Absolute Percent Error
• Safety stock - non pooled (units)
• Safety stock units sub rows that show the percentage of safety stock to be carried to protect against the following types of variability:
• Manufacturing variability
• Supplier lead time variability
• In-transit lead time variability
• Demand variability

5-14 Oracle Inventory Optimization Users Guide
Note: If you want the inventory planning engine to consider an item as a purchased item, ensure that you have a sourcing rule specifying a buysource. If you do not define sourcing details for an item, the inventory planning engine considers the item as a make item. If an item is a buy item, the inventory planning engine considers the preprocessing, processing and postprocessing lead times to calculate the safety stock.
Safety Stock Analysis - Viewing the Plan
Steps:1. From the Inventory Analyst responsibility, navigate to the Safety Stock folder.
Click the Safety Stock tab
The safety stock tab of the Inventory Optimization page opens.
The Safety Stock folder in the analysis workbench displays the percent (%) contribution to safety stock from each source of variability (demand, manufacturinglead time, in-transit lead time, and supplier lead time variability).
Resource RequirementsResource requirements are the number of hours for which resources are needed to
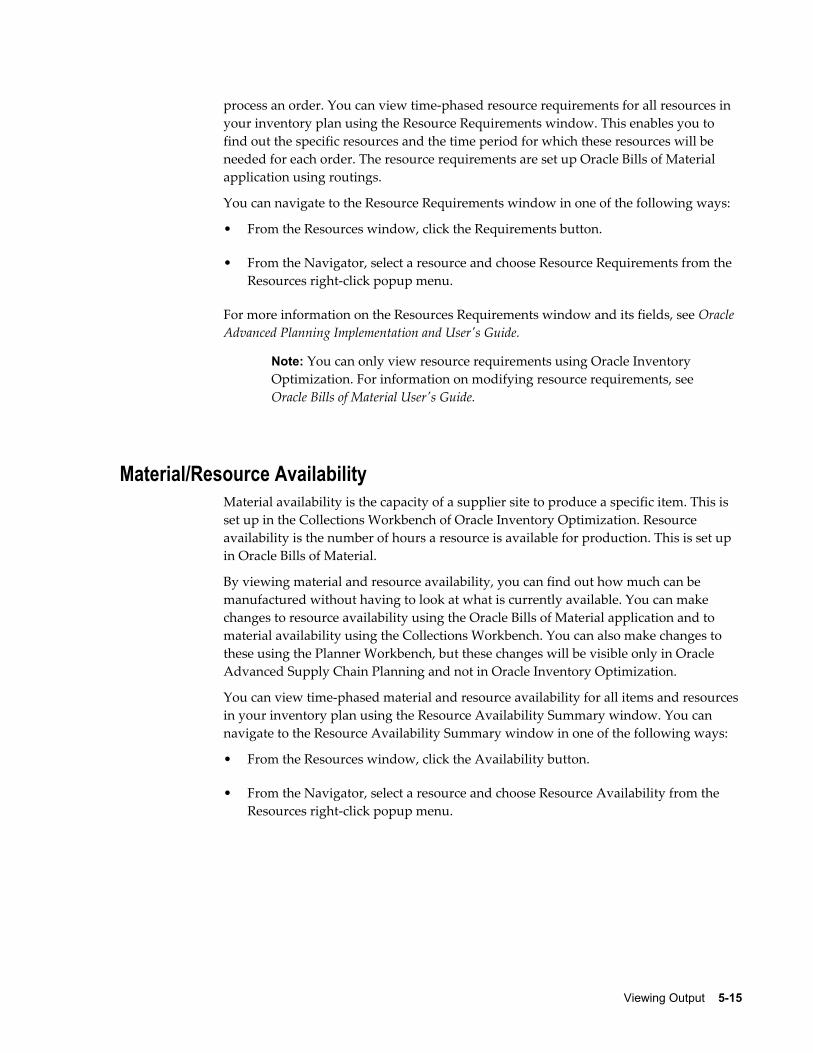
Viewing Output 5-15
process an order. You can view time-phased resource requirements for all resources in your inventory plan using the Resource Requirements window. This enables you to find out the specific resources and the time period for which these resources will be needed for each order. The resource requirements are set up Oracle Bills of Material application using routings.
You can navigate to the Resource Requirements window in one of the following ways:
• From the Resources window, click the Requirements button.
• From the Navigator, select a resource and choose Resource Requirements from the Resources right-click popup menu.
For more information on the Resources Requirements window and its fields, see Oracle Advanced Planning Implementation and User's Guide.
Note: You can only view resource requirements using Oracle InventoryOptimization. For information on modifying resource requirements, seeOracle Bills of Material User's Guide.
Material/Resource AvailabilityMaterial availability is the capacity of a supplier site to produce a specific item. This is set up in the Collections Workbench of Oracle Inventory Optimization. Resource availability is the number of hours a resource is available for production. This is set up in Oracle Bills of Material.
By viewing material and resource availability, you can find out how much can be manufactured without having to look at what is currently available. You can make changes to resource availability using the Oracle Bills of Material application and to material availability using the Collections Workbench. You can also make changes to these using the Planner Workbench, but these changes will be visible only in Oracle Advanced Supply Chain Planning and not in Oracle Inventory Optimization.
You can view time-phased material and resource availability for all items and resources in your inventory plan using the Resource Availability Summary window. You can navigate to the Resource Availability Summary window in one of the following ways:
• From the Resources window, click the Availability button.
• From the Navigator, select a resource and choose Resource Availability from the Resources right-click popup menu.
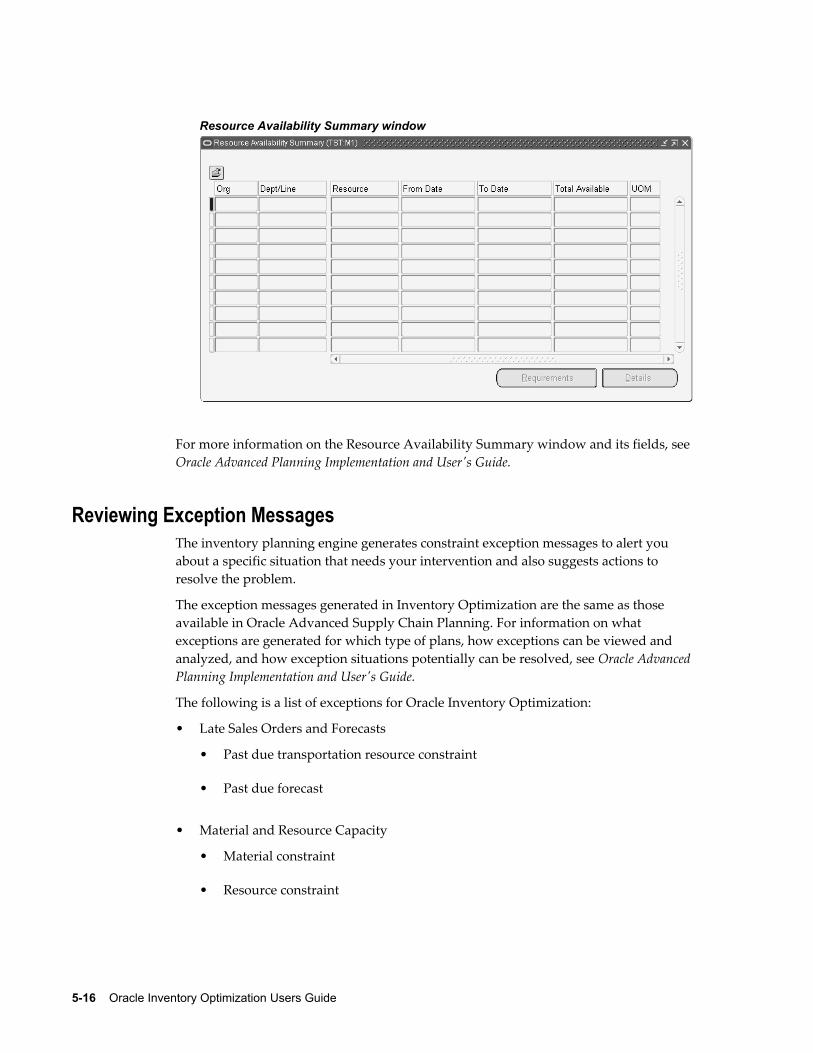
5-16 Oracle Inventory Optimization Users Guide
Resource Availability Summary window
For more information on the Resource Availability Summary window and its fields, see Oracle Advanced Planning Implementation and User's Guide.
Reviewing Exception MessagesThe inventory planning engine generates constraint exception messages to alert you about a specific situation that needs your intervention and also suggests actions to resolve the problem.
The exception messages generated in Inventory Optimization are the same as those available in Oracle Advanced Supply Chain Planning. For information on what exceptions are generated for which type of plans, how exceptions can be viewed and analyzed, and how exception situations potentially can be resolved, see Oracle Advanced Planning Implementation and User's Guide.
The following is a list of exceptions for Oracle Inventory Optimization:
• Late Sales Orders and Forecasts
• Past due transportation resource constraint
• Past due forecast
• Material and Resource Capacity
• Material constraint
• Resource constraint

Viewing Output 5-17
• Resource overloaded
• Supplier capacity overloaded
• Resource underloaded
• Transportation and Distribution
• Transportation resource overloaded
• Transportation resource under loaded
• Shortage and Excess
• Item with a shortage
• Item with excess inventory
• Substitutes and Alternates Used
• Planned order uses alternate BOM
• Planned order uses alternate routing
• Planned order uses substitute components
• Planned order uses alternate resources
• Order sourced from alternate facility
• Order sourced from alternate supplier
• Item Exceptions
• Items with negative starting onhand
• Items with no activity
Note: The inventory planning engine generates material and resource constraint exception messages only when the Enforce Capacity Constraints check box in the Constraints Tab of the Plan Options window is checked. In this option, the output contains both the target safety stock and the safety stock levels.


Analysis Workbench 6-1
6Analysis Workbench
This chapter describes the Analysis Workbench and how you can use it to analyze your inventory plans.
This chapter covers the following topics:
• Overview of Analysis Workbench
• Analyzing Inventory Plans
• Using the Analysis Workbench
• Creating and Editing Preference Sets
• Analyzing Service Level Versus Profit
• Analyzing Postponement
• Analyzing Safety Stocks
• Analyzing Inventory Budgets
• Analyzing Revenue and Cost Breakdown
• Analyzing Service Level Breakdown
Overview of Analysis WorkbenchYou create and run several inventory plans to evaluate different scenarios. You compare and analyze these plans to determine the most optimal one. Analysis Workbench enables you to compare and analyze multiple inventory plans by providinggraphical and tabular comparison.
You can analyze the output from your inventory plans at both aggregate and detail levels. The Analysis Workbench provides context-sensitive drill down that enables root-cause analysis. For example, if achieving a specific service level costs an excessive amount of money, you can drill down to cost analysis for a break down of costs and identify the categories or items that contribute to the high costs.
You can use the Analysis Workbench to view and analyze factors such as budgets,

6-2 Oracle Inventory Optimization Users Guide
inventory levels, and costs. In addition, you can use the Analysis Workbench to determine target service level. The following are some of the questions for which you can find answers using the Analysis Workbench:
• What is my most profitable service level?
• Have I achieved my target service levels?
• How much inventory do I have to carry for a target service level?
• Where should I position my inventories?
• How is my inventory budget allocated?
• What is my cost breakdown?
Note: The Analysis Workbench is displayed in a Web browser. For information on the Web browsers that you need for Analysis Workbench, see OA Framework Documentation.
Analyzing Inventory PlansYou can use the analysis pages to analyze the output of your inventory plans. The following analysis pages are available in the Analysis Workbench:
• Service Level versus Profit Analysis
This page enables you to determine the estimated profit for a specific service level. You can use this page to analyze multiple plans corresponding to different service levels and identify the plan with the most profitable service level.
• Postponement Analysis
This page enables you to view the effect of postponement on safety stock carrying cost and inventory value.
• Safety Stock Analysis
This page enables you to analyze the safety stock levels. You can use this page to analyze the safety stock details for a specific service level.
• Inventory Budget Analysis
This page enables you to analyze inventory budgets. You can analyze the budget value and the corresponding inventory value and service level details. You can use this page to determine the budget required to meet a specific service level.
• Revenue and Cost Breakdown

Analysis Workbench 6-3
This page enables you to view revenue and cost breakdown details such as production cost, carrying cost, and purchasing cost.
• Service Level Breakdown
This page enables you to view the achievable service levels at various levels of aggregation.
You can view information related to a specific aspect of your inventory plan in an analysis page. For example, you can view the cost-related information such as planned production cost and planned purchasing cost in the Revenue and Cost Breakdown page. For a complete analysis of your inventory plans, you may need to use multiple analysis pages along with Planner Workbench.
The following is an example of how you may want to use the analysis pages for analyzing your inventory plans:
After you create and run plans with various target service levels, you may determine the most profitable service level using the Planned Service Level Vs Profit page.
1. You may then use the Inventory Budget Analysis page to find out the budget required to achieve the most profitable service level.
2. You may then determine the safety stock levels for the most profitable service level using the Safety Stock Analysis page.
3. You can then access the Planner Workbench for more information on factors such asitem level supply and demand, the BOM structure, and sourcing.
Using the Analysis WorkbenchThe following are the steps involved in using the Analysis Workbench.
1. Run your inventory plans.
You need to run the plans that you want to analyze before you use the Analysis Workbench. For information on running inventory plans, see Running an InventoryPlan, page 2-1.
2. Select the category set in the Preferences window of the Planner Workbench.
To use the Analysis Workbench, you need to select the category set of the items thatare to be displayed in the Analysis Workbench. You can specify the category set in the Category Set field of the Other tabbed region in the Preferences window. For more information on the Preferences window, see Oracle Advanced Planning Implementation and User's Guide. You can analyze only those categories and items belonging to the category set that you select in the Preferences window.
6-4 Oracle Inventory Optimization Users Guide
Note: You can analyze items and categories belonging to one category set at a time. The items and categories that appear in the analysis pages belong to an item category set defined in the Inventory Optimization Workbench preferences, Others tab.
3. Specify the number of decimal places in the Preferences window of the Planner Workbench.
Optionally, you can specify the required number of decimal places for the numerical data displayed in the Analysis Workbench. You can specify this in the Decimal Places field of the Material Plan tabbed region in the Preferences window. After you set the decimal places, numerical data is displayed with the specified number of decimal places in all the analysis pages. For more information on the Preferences window, see Oracle Advanced Planning Implementation and User's Guide.
4. Create your preference sets.
Optionally, you can create preference sets. Preference sets enable you to customize how information is displayed in an analysis page. For example, you can choose to hide or display the graphical display in an analysis page. For more information, see the section on creating and editing preference sets.
5. Navigate to the Analysis Workbench from the Navigator.
6. Select an analysis page based on your needs.
7. Search and select one or more plans for analysis.
You can select specific plans and navigate to other analysis pages for a complete analysis of the plans.
Note: You can analyze only plans that have matching start dates, weekly buckets, and period buckets.
The Search Criteria area in the analysis pages enables you to analyze specific elements of your inventory plans. For example, you can analyze the details of a specific organization in the plan. After you select the plans for analysis, you can search based on the following:
• Organization
• Category
• Demand class
• Period

Analysis Workbench 6-5
• Item
• Customer
• Customer class
• ABC classification
The availability of fields for searching these parameters depends on the analysispage that you select. You can save a specific search criteria as the default for an analysis page by clicking Save As Default in the analysis page. The selected search criteria appear automatically every time you navigate to the analysis page.
8. Use the View By field to specify your view by preference. For example, you can view by period for a month-wise display of the details. The availability of this field depends on the analysis page that you select.
Creating and Editing Preference SetsA preference set is a group of options that you specify for viewing information in the analysis pages. Preference sets enable you to specify how and what information you want to be displayed in an analysis page. For example, you can specify the row headings for the tabular display in the Inventory Budget Analysis page. You can create and edit preference sets using the Preferences pages.
You can create multiple preference sets for an analysis page. You can also make a preference set as the default for an analysis page so that the preference set is chosen automatically every time you navigate to that analysis page. The preference sets that you create for an analysis page are exclusive to that page. Depending on the analysis page, preference sets enable you to specify options such as the number of rows and columns for printing and the type of calendar for viewing information by period or week.
To create and edit preference sets
Steps:1. To create a preference set, click Click/Edit from an analysis page. To edit a
preference set, select the preference set from the list in the Display using Preference Set field in the analysis page and click Click/Edit.
• The corresponding Preferences page appears. The Preferences page of Inventory Budget Analysis is shown as an example.

6-6 Oracle Inventory Optimization Users Guide
Preferences page of Inventory Budget Analysis
2. Use the information in the following table to complete the fields in the Preferences pages.
Field Description
Preference Set Name Enter a name for the preference set.
Default Select this check box to make a preference set as the default for the analysis page. The settings are automatically applied when you navigate to this analysis page.
Available This column displays the available row headings for the tabulardisplay in the Safety Stock Analysis page or the Inventory Budget Analysis page. Select items in the list and move them to the Selected column to include them in the analysis page.
Selected This column displays the selected row headings for the tabular display in the Safety Stock Analysis page or the Inventory Budget Analysis page. Select items in the list and move them to the Available column to remove them from the analysis page.

Analysis Workbench 6-7
Field Description
Rows Specify the number of rows if you are printing the information in the analysis page.
Columns Specify the number of columns if you are printing the information in the analysis page.
Orientation Specify the page orientation if you are printing the information in the analysis page.
Graphing Options You can choose to hide or display the graphical display in the analysis page. This is available for the following analysis pages:
Service Level versus Profit Analysis
Postponement Analysis
Safety Stock Analysis
Inventory Budget Analysis
Revenue and Cost Breakdown
Service Level Breakdown
Reporting Calendar You can select the type of calendar for viewing by period or week. To view by week, you need to select manufacturing calendar from the list.
3. Click Save to save the preference set.
Analyzing Service Level Versus ProfitService level is one of the factors that can affect your profit. Typically profits increase as you increase the service level, but increased service level beyond a certain point may not increase the profits because of the relative increase in inventory costs. To determine the most profitable service level, you can create and run multiple plans depicting different service levels. You can then analyze these plans using the Service Level versus Profit Analysis page of the Analysis Workbench to determine the most profitable service level.
You can also widen the scope of your analysis by navigating to other related analysis pages from the Service Level versus Profit Analysis page. You can navigate to other analysis pages the same search criteria specified in the Service Level versus Profit Analysis page. You can select the plans from the list and navigate to the following analysis pages from the Service Level versus Profit Analysis page:

6-8 Oracle Inventory Optimization Users Guide
• Revenue and Cost Breakdown
• Postponement Analysis
• Inventory Budget Analysis
• Service Level Breakdown
• Safety Stock Analysis
Navigating to Other Related Analysis Pages
You can view service level versus profit details in both tabular and graphical formats. The Service Level versus Profit Analysis page provides two graphs, the Plan Gross Profit Breakdown graph and the Plan Gross Profit Percent graph. The Plan Gross Profit Breakdown graph shows the planned total cost, planned revenue, and planned gross profit against the service level for the selected inventory plans. The planned gross profitpercent shows the planned gross profit percentage against the service level for the selected inventory plans.
To analyze service level versus profit
Steps:1. From the Navigator, choose Analysis Workbench.
The Service Level versus Profit Analysis page appears.

Analysis Workbench 6-9
Service Level versus Profit Analysis page
2. Use the information in the following table to complete the fields in the Service Levelversus Profit Analysis page.
Field Description
Plan Select the inventory plans that you want to analyze.
To set the selected plans as the default plansto be analyzed in this page, click Save As Default. The selected plans appear automatically every time you navigate to this analysis page.
Display using Preference Set Optionally, select a preference set from the list. For more information, see the section oncreating and editing preference sets under Analyzing Inventory Plans, page 6-2.
3. Click Go to analyze the selected inventory plans.
The inventory planning engine displays the service level versus profit details for the

6-10 Oracle Inventory Optimization Users Guide
selected plans. The following table describes the column headings of the tabular display in the Service Level versus Profit Analysis page:
Column Heading Description
Attained Service Level The achievable service level for a plan. The inventory planningengine calculates the attained service level based on the inputs for the plan.
Target Service Level The target service level that you have set up. You can set the target service level for a plan in the Constraints tabbed region of the Plan Options window. For more information on setting target service levels, see Setting Target Service Levels, page 4-2.
Planned Production Cost The estimated cost of producing the planned items. The inventory planning engine calculates the production cost for each item in the plan and aggregates the cost at the plan level.
The inventory planning engine calculates the planned production cost for an item by multiplying the resource unit cost and the required hours. The resource unit cost and required hours for items are specified in Oracle Bills of Material. For more information, see the Oracle Bills of Material User's Guide.
Planned Carrying Cost The estimated cost of stocking the planned items. The inventory planning engine calculates the carrying cost for eachitem in the plan and aggregates the cost at the plan level.
The inventory planning engine calculates the carrying cost based on the carrying cost percentage. Carrying cost percentage can be set up at the item level using Oracle Inventory or at the profile option level. The carrying cost percentage set up at the item level takes precedence over the carrying cost percentage set up at the profile option level. For information on setting up carrying cost percentage at the item level, see Oracle Inventory User's Guide.

Analysis Workbench 6-11
Column Heading Description
Planned Purchasing Cost The estimated purchasing cost for the planned items. The inventory planning engine calculates the purchasing cost for each item in the plan and aggregates the cost at the plan level.
The inventory planning engine calculates the purchasing cost for an item based on its standard cost. The standard costs for items are specified in purchase orders of type blanket purchaseagreement. These purchase orders are created in the Oracle Purchasing application. For more information, see Oracle Purchasing User's Guide.
The standard costs for items can also be specified in the Oracle Cost Management application. For more information, see Oracle Cost Management User's Guide. The standard costs specified in Oracle Purchasing takes precedence over the standard costs specified in Oracle Cost Management.
6-12 Oracle Inventory Optimization Users Guide
Column Heading Description
Planned Transportation Cost
The estimated cost for transporting the planned items from an organization to another. The inventory planning engine calculates the transportation cost for each item in the plan and aggregates the cost at the plan level. The inventory planning engine calculates the transportation cost for an item by multiplying the number of unit items supplied, unit weight or unit volume, and transportation cost per unit weight or unit volume.
The inventory planning engine calculates the number of units supplied based on the item's demand schedule. It takes the organization name from which the item is sourced and the organization name to which the item is supplied from the item's sourcing rule. It also takes the shipment method from the sourcing rule.
The inventory planning engine takes the unit weight or unit volume for the item and the cost of transporting an unit weightor unit volume of the item between the two organizations by the specified shipping method from Oracle Inventory.
Unit weight or unit volume for an item is specified in the Physical Attributes tabbed region of Master Items window or Organization Items window of Oracle Inventory. The cost of transporting a unit weight or unit volume between two organization using a specific shipping method is specified in the Transit window of Oracle Inventory.
For information on demand schedule, see the section on demand schedules in The Organizations Tabbed Region, page 3-9. For information on sourcing rules, see Oracle Advanced Planning Implementation and User's Guide. For information on transportation cost per unit weight or unit volume of an item, see Oracle Inventory User's Guide.
Planned Total Cost The sum of planned production cost, planned carrying cost, planned purchasing cost, and planned transportation cost.

Analysis Workbench 6-13
Column Heading Description
Planned Revenue The estimated gross income for the plan from the sales of itemsthat have an independent demand. The inventory planning engine calculates the revenue for each planned item that has an independent demand and aggregates the revenue at the plan level. The inventory planning engine calculates the revenue for an item by multiplying its selling price and the number of unit items supplied.
The selling price for an item is specified in the List Lines tabbed region in the Price Lists window of Oracle Order Management. For more information, see Oracle Order Management User's Guide.
The inventory planning engine calculates the number of units supplied based on the item's demand schedule. The demand schedule for an item is defined in the Organization tabbed region of the Plan Options window of Oracle Optimization. For information on demand schedule, see the section on demand schedules in The Organizations , page 3-9Tabbed Region.
Planned Gross Profit The difference between the planned total cost and planned revenue for the plan.
Planned Gross Profit% Planned gross profit divided by planned revenue and then multiplied by 100.
Inventory Value The estimated value of inventory at the end of the planning horizon. The inventory planning engine calculates the inventory value for each item in the plan and aggregates the value at the plan level. The inventory planning engine calculates the inventory value for an item by multiplying its projected available balance and its standard cost.
You can view the projected available balance for items in the Horizontal Plan in Oracle Inventory Optimization. For more information see, Oracle Advanced Planning Implementation and User's Guide. The standard costs for items are specified in the Oracle Cost Management application. For more information, see Oracle Cost Management User's Guide.
Plan The name of the plans that you have selected for analysis.
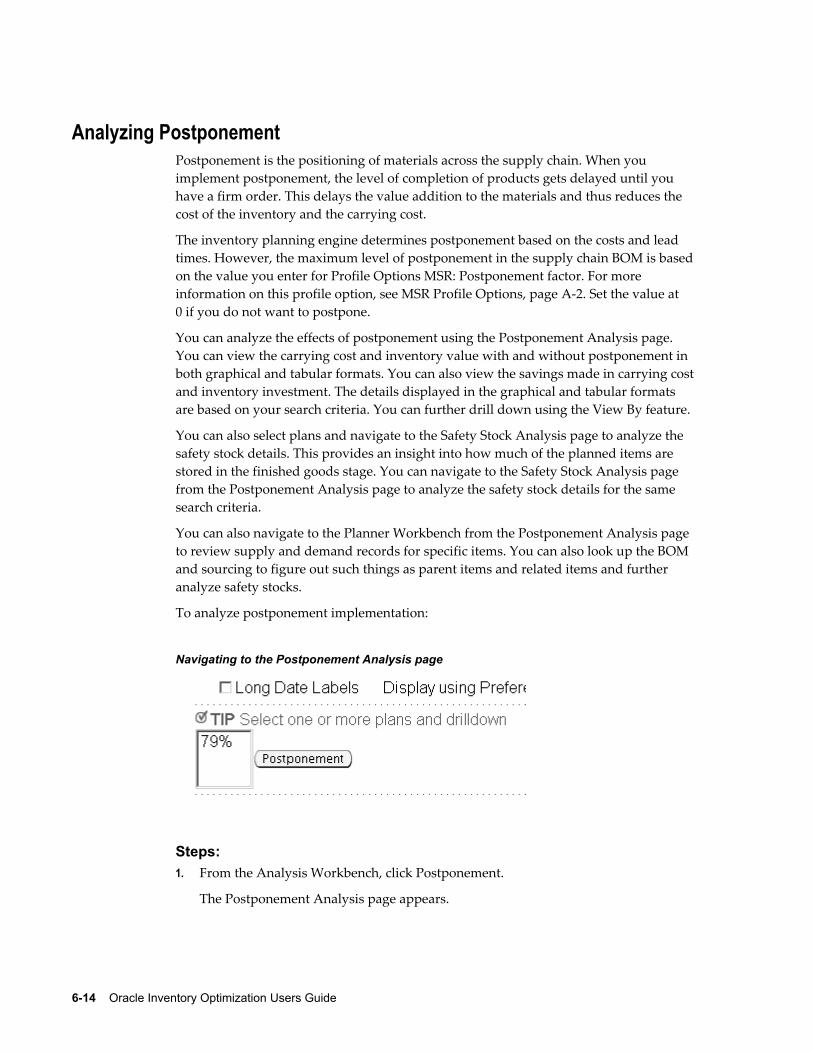
6-14 Oracle Inventory Optimization Users Guide
Analyzing PostponementPostponement is the positioning of materials across the supply chain. When you implement postponement, the level of completion of products gets delayed until you have a firm order. This delays the value addition to the materials and thus reduces the cost of the inventory and the carrying cost.
The inventory planning engine determines postponement based on the costs and lead times. However, the maximum level of postponement in the supply chain BOM is basedon the value you enter for Profile Options MSR: Postponement factor. For more information on this profile option, see MSR Profile Options, page A-2. Set the value at 0 if you do not want to postpone.
You can analyze the effects of postponement using the Postponement Analysis page. You can view the carrying cost and inventory value with and without postponement in both graphical and tabular formats. You can also view the savings made in carrying costand inventory investment. The details displayed in the graphical and tabular formats are based on your search criteria. You can further drill down using the View By feature.
You can also select plans and navigate to the Safety Stock Analysis page to analyze the safety stock details. This provides an insight into how much of the planned items are stored in the finished goods stage. You can navigate to the Safety Stock Analysis page from the Postponement Analysis page to analyze the safety stock details for the same search criteria.
You can also navigate to the Planner Workbench from the Postponement Analysis page to review supply and demand records for specific items. You can also look up the BOM and sourcing to figure out such things as parent items and related items and further analyze safety stocks.
To analyze postponement implementation:
Navigating to the Postponement Analysis page
Steps:1. From the Analysis Workbench, click Postponement.
The Postponement Analysis page appears.

Analysis Workbench 6-15
Postponement Analysis page
2. Use the information in the following table to complete the fields in the Postponement Analysis page:
Field Description
Plan Search and select the inventory plans that you want to analyze.
Click Save As Default to make the details selected in the Search Criteria as default in this page. The selected search criteria appear automatically every time you navigate to this analysis page.
Org Optionally, search and select an organization to analyze its postponement details.
Category Optionally, search and select a category to analyze its postponement details.
6-16 Oracle Inventory Optimization Users Guide
Field Description
View By Select a view by to drill down. You can view by plan, organization, category, period, week, and plan-organization-category.
You can view month-wise postponement details for either the manufacturing calendar or financial calendar by selecting period from the list.
You can view week-wise postponement details only for the manufacturing calendar. You can select the type of calendar in the preference set created for the Postponement Analysis page.
For more information, see the section on creating and editing preference sets in Analyzing Inventory Plans, page 6-2.
Display using Preference Set
Optionally, select a preference set from the list. For more information, see the section on creating and editing preference sets in Analyzing Inventory Plans, page 6-2.
3. Click Go to analyze the postponement implementation for the selected plans.
The inventory planning engine displays the postponement details for the selected plans. The following table describes the column headings of the tabular display in the Postponement Analysis page:
Column Heading Description
Plan The name of the plans that you have selected for analysis.
Org The organizations in the selected plans whose postponement details are displayed. This column appears if you are viewing by organization or plan-organization-category.
Category The categories in the selected plans whose postponement details are displayed. This column appears if you are viewing by category or plan-organization-category.
Time The bucket for which the postponement details are displayed. This column appears if you are viewing by period or week.
Analysis Workbench 6-17
Column Heading Description
Safety Stock Carrying Cost - without Postponement
The carrying cost for the safety stock without considering postponement. The inventory planning engine calculates the carrying cost based on the carryingcost percentage. You can set the carrying cost percentage at the item level or using a profile option. The carrying cost percentage set at the item level takes precedence over the carrying cost set using profile option. For more information on setting carrying cost percentage at the item level, see Oracle Inventory User's Guide.
Safety Stock Carrying Cost - with Postponement
The carrying cost for the safety stock considering postponement.
Safety Stock Carrying Cost Savings
The amount of money saved in carrying cost by implementing postponement. The inventory planning engine calculates this by subtracting the safety stock carrying cost with postponement from safety stock carrying cost without postponement.
Safety Stock Inventory Value-without Postponement
The value of the safety stock without postponement. The inventory planning engine calculates the value of safety stock for an item by multiplying the item's projected available balance and standard cost.
You can view the projected available balance for items in the Horizontal Plan in Oracle Inventory Optimization. For more information see, Oracle Advanced Planning Implementation and User's Guide. The standard costs for items are specified in the Oracle Cost Management application. For more information, see Oracle Cost Management User's Guide.
Safety Stock Inventory Value-with Postponement
The value of the safety stock considering postponement.
Safety Stock Inventory Value Savings
The amount of money that can be saved by implementing postponement. The inventory planning engine calculates this by subtracting the safety stock inventory value with postponement from the safety stock inventory value without postponement.
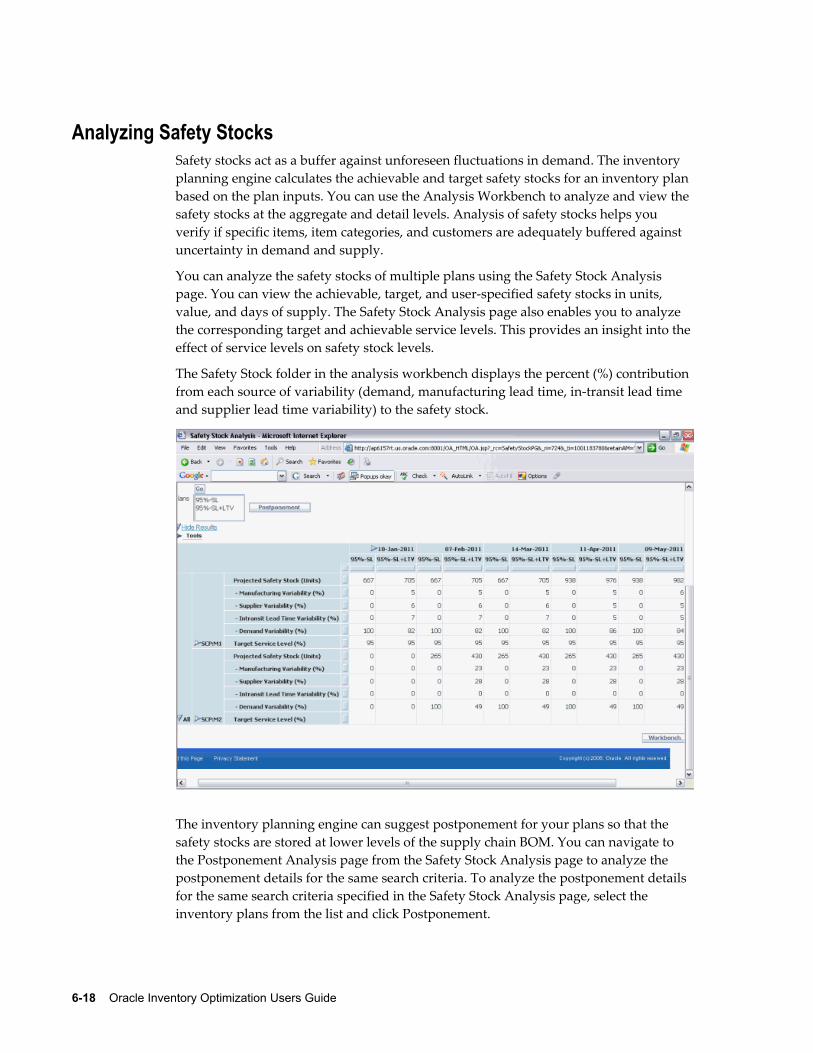
6-18 Oracle Inventory Optimization Users Guide
Analyzing Safety StocksSafety stocks act as a buffer against unforeseen fluctuations in demand. The inventory planning engine calculates the achievable and target safety stocks for an inventory plan based on the plan inputs. You can use the Analysis Workbench to analyze and view the safety stocks at the aggregate and detail levels. Analysis of safety stocks helps you verify if specific items, item categories, and customers are adequately buffered against uncertainty in demand and supply.
You can analyze the safety stocks of multiple plans using the Safety Stock Analysis page. You can view the achievable, target, and user-specified safety stocks in units, value, and days of supply. The Safety Stock Analysis page also enables you to analyze the corresponding target and achievable service levels. This provides an insight into the effect of service levels on safety stock levels.
The Safety Stock folder in the analysis workbench displays the percent (%) contribution from each source of variability (demand, manufacturing lead time, in-transit lead time and supplier lead time variability) to the safety stock.
The inventory planning engine can suggest postponement for your plans so that the safety stocks are stored at lower levels of the supply chain BOM. You can navigate to the Postponement Analysis page from the Safety Stock Analysis page to analyze the postponement details for the same search criteria. To analyze the postponement details for the same search criteria specified in the Safety Stock Analysis page, select the inventory plans from the list and click Postponement.
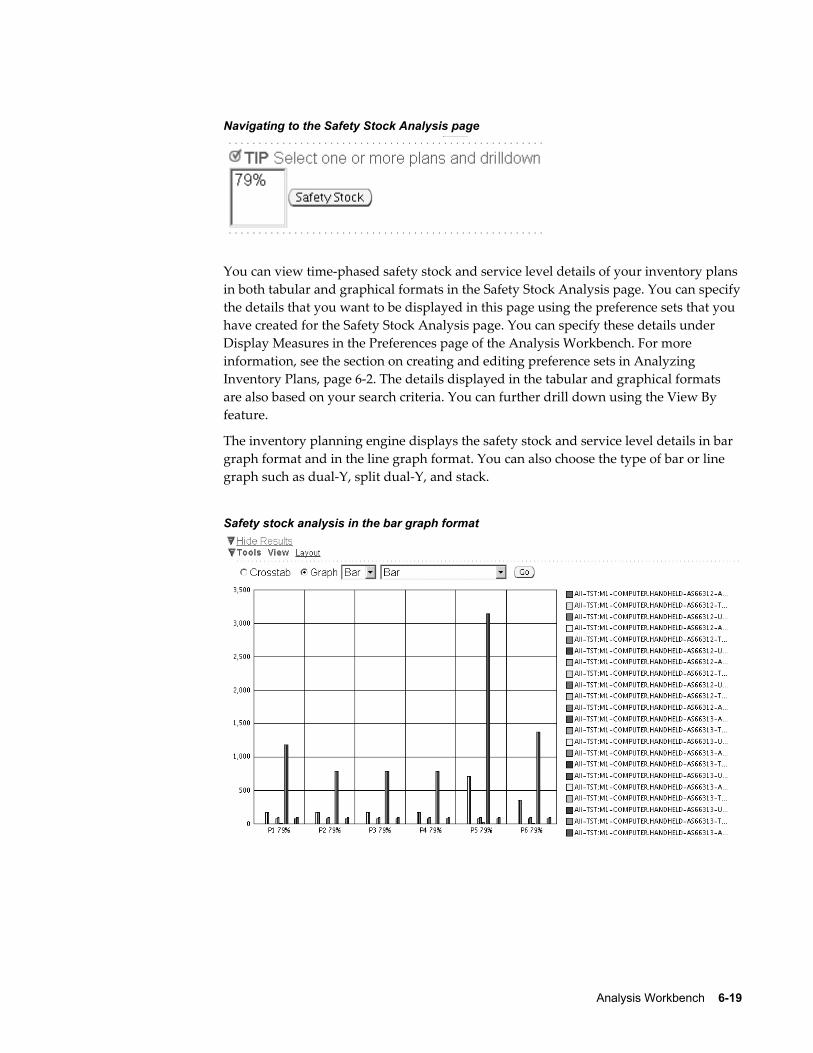
Analysis Workbench 6-19
Navigating to the Safety Stock Analysis page
You can view time-phased safety stock and service level details of your inventory plans in both tabular and graphical formats in the Safety Stock Analysis page. You can specifythe details that you want to be displayed in this page using the preference sets that you have created for the Safety Stock Analysis page. You can specify these details under Display Measures in the Preferences page of the Analysis Workbench. For more information, see the section on creating and editing preference sets in Analyzing Inventory Plans, page 6-2. The details displayed in the tabular and graphical formats are also based on your search criteria. You can further drill down using the View By feature.
The inventory planning engine displays the safety stock and service level details in bar graph format and in the line graph format. You can also choose the type of bar or line graph such as dual-Y, split dual-Y, and stack.
Safety stock analysis in the bar graph format

6-20 Oracle Inventory Optimization Users Guide
Safety stock analysis in the line graph format
You can use the Layout link and the View By field for drilling down in the tabular display. For example if you choose Org/Category/Item in the View By field, then you can drill down from the organization level to the category level and then to the item level as shown in the following figure.
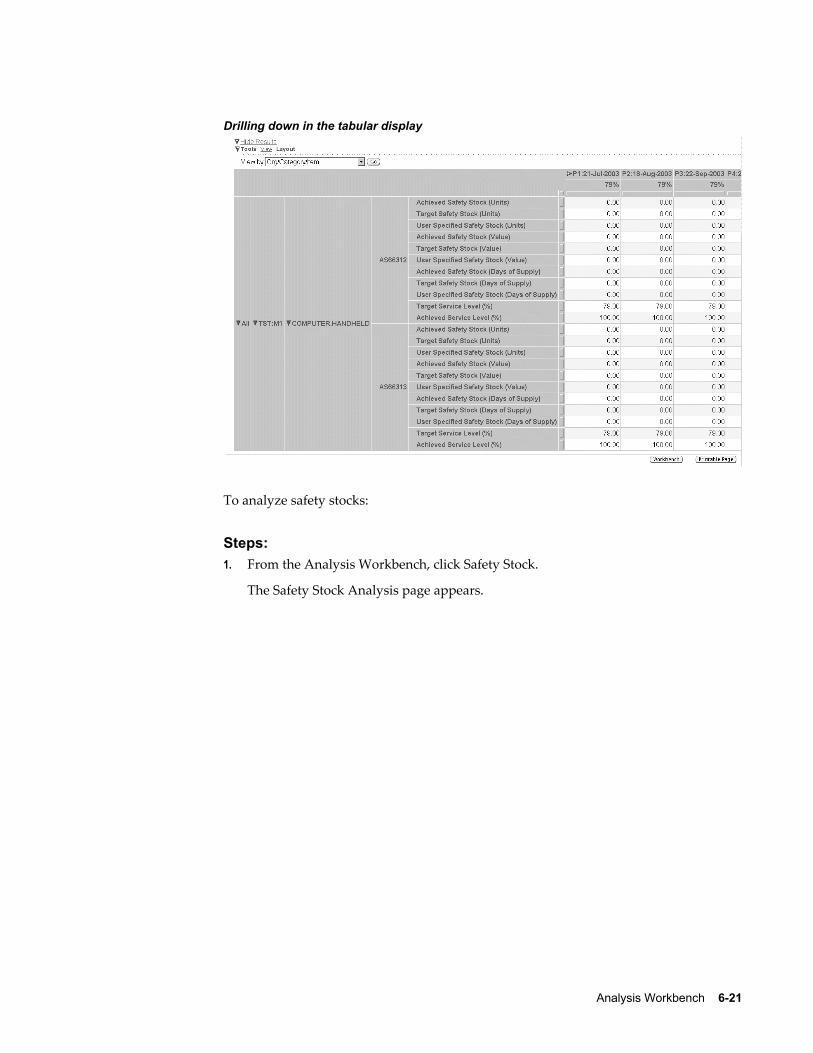
Analysis Workbench 6-21
Drilling down in the tabular display
To analyze safety stocks:
Steps:1. From the Analysis Workbench, click Safety Stock.
The Safety Stock Analysis page appears.

6-22 Oracle Inventory Optimization Users Guide
Safety Stock Analysis page
2. Use the information in the following table to complete the fields in the Safety Stock Analysis page:
Field Description
Plan Search and select the inventory plans that you want to analyze.
Click Save As Default to make the details selected in the Search Criteria as default in this page. The selected search criteria appear automatically every time you navigate to this analysis page.
Org Optionally, search and select an organization to analyze its safety stocks.
Category Optionally, search and select a category to analyze its safety stocks.
Analysis Workbench 6-23
Field Description
Item Optionally, search and select an item to analyze its safety stocks.
Customer Optionally, search and select a customer to analyze the customer's safety stocks.
Customer Class Optionally, search and select a customer class to analyze its safety stocks.
Long Date Labels Select this check box to the display the starting date of the periods in the tabular and graphical displays.
Display using Preference Set
Optionally, select a preference set from the list. For more information, see the section on creating and editing preferencesets in Analyzing Inventory Plans, page 6-2. You can specify the safety stock and service level details that you want to viewwhen you create the preference sets for Safety Stock Analysis page.
Crosstab To view this option, click the View link. Select this option to view the safety stock details in the tabular format.
Graph To view this option, click the View link. Select this option to view the safety stock details in the graphical format. You can also specify the type of graph.
View By To view this field, click the Layout link. Select a view by from the list to drill down in the tabular format.
3. Click Go to analyze the safety stocks for the selected plans.
The inventory planning engine displays the safety stock details for the selected plans in the tabular or graphical format based on your selection. The following tabledescribes the row headings of the tabular display in the Safety Stock Analysis page:
Row Heading Description
Achieved Safety Stocks (Units)
The achievable safety stock level in number of units calculated by the inventory planning engine. The inventory planning engine calculates this value based on the plan inputs.

6-24 Oracle Inventory Optimization Users Guide
Row Heading Description
Target Safety Stocks (Units)
The safety stock level in number of units recommended by the inventory planning engine to meet a specific service level. For more information on target safety stocks, see Safety Stock and Target Safety Stock, page 5-10.
User Specified Safety Stock (Units)
The safety stock level in number of units specified by you. The user specified safety stock level overrides the target safety stock level. You can specify this value in Safety Stock window in the Planner Workbench. For more information, seeUser-Specified Safety Stock, page 7-5.
Achieved Safety Stocks (Value)
The currency value of the achievable safety stock level. The inventory planning engine calculates this value by multiplying the number of unit items in the achievable safety stock and the standard cost of an item.
The standard costs for items are specified in the Oracle Cost Management application. For more information, see Oracle Cost Management User's Guide.
Target Safety Stocks (Value)
The currency value of the target safety stock level. The inventory planning engine calculates this value by multiplying the number of unit items in the target safety stockand the standard cost of an item.
The standard costs for items are specified in the Oracle Cost Management application. For more information, see Oracle Cost Management User's Guide.
User Specified Safety Stock (Value)
The currency value of the user specified safety stock level. The inventory planning engine calculates this value by multiplying the number of unit items in the user specified safety stock and the standard cost of an item.
The standard costs for items are specified in the Oracle Cost Management application. For more information, see Oracle Cost Management User's Guide.
Achieved Safety Stocks (Days of Supply)
The number of days for which the achievable safety stock level can meet the demand. For information how the inventory planning engine calculates the days of supply, see Safety Stock Level Days of Supply, page 7-4.

Analysis Workbench 6-25
Row Heading Description
Target Safety Stocks (Daysof Supply)
The number of days for which the target safety stock level canmeet the demand. For information on how the inventory planning engine calculates the days of supply, see Safety Stock Level Days of Supply, page 7-4.
User Specified Safety Stock (Days of Supply)
The number of days for which the user specified safety stock level can meet the demand. For information how the inventory planning engine calculates the days of supply, see Safety Stock Level Days of Supply, page 7-4.
Achieved Service Level (%)
The achievable service level for a plan. The inventory planning engine calculates the attained service level based on the inputs for the plan.
Target Service Level (%) The target service level that you have set. You can set the target service level at various levels such as plan, organization, and item. For more information on setting target service levels, see Setting Target Service Levels, page 4-2.
Analyzing Inventory BudgetsInventory budget is the maximum amount to be spent on inventory during a planning period. You can analyze your inventory plans to ensure that the budget has been allocated in the best way possible to achieve the desired service levels and profits. You can also verify if adequate budgets have been allocated to specific organizations and item categories. Analysis of your inventory budgets also enables you to know the corresponding inventory value for a budget amount.
Note: You can use the Planner Workbench to analyze budgets at the item level.
You can analyze the budgets and the corresponding inventory value and service level details of multiple plans using the Inventory Budget Analysis page. You can view these details in a time-phased format both on a monthly and weekly basis.
You can also widen the scope of your budget analysis by navigating to other related pages from the Inventory Budget Analysis page. This enables you to analyze the selected plans with the same search criteria specified in the Inventory Budget Analysis page. You can select the plans from the list and navigate to the following analysis pages from the Inventory Budget Analysis page:

6-26 Oracle Inventory Optimization Users Guide
• Revenue and Cost Breakdown
• Service Level Breakdown
• Service Level versus Profit Analysis
• Safety Stock Analysis
Navigating to other related analysis pages
You can view time-phased inventory budget details of your inventory plans in both tabular and graphical formats. You can specify the details that you want to be displayedusing the preference sets that you have created for the Inventory Budget Analysis page. You can specify these details under Display Measures in the Preferences page of the Inventory Budget Analysis page. You can also choose the type of calendar, manufacturing or financial, in the preferences set. For more information, see the section on creating and editing preference sets in Analyzing Inventory Plans, page 6-2. The details displayed in the tabular and graphical formats are also based on your search criteria. You can further drill down using the View By feature.
The inventory planning engine displays the budget details in the bar graph format and in the line graph format. You can also choose the type of bar or line graph such as dual-Y, split dual-Y, and stack.
You can use the View By field for drilling down in the tabular display. For example if you choose Category/Org/Plan in the View By field, then you can drill down from the category level to the organization level and then to the plan level.
To analyze inventory budgets:
Steps:1. From the Analysis Workbench, click Budget.
The Inventory Budget Analysis page appears.
2. Use the information in the following table to complete the fields in the Inventory Budget Analysis page:
Analysis Workbench 6-27
Field Description
Plan Search and select the inventory plans that you want to analyze.
Click Save As Default to make the details selected in the Search Criteria as default in this page. The selected search criteria appear automatically every time you navigate to this analysis page.
Org Optionally, search and select an organization to analyze its inventory budget.
Category Optionally, search and select a category to analyze its inventory budget.
Item Optionally, search and select an item to analyze its inventory budget.
ABC Class Optionally, search and select an ABC Class to analyze its inventory budget.
Long Date Labels Select this check box to the display the starting date of the periods in the tabular and graphical displays.
Display using Preference Set
Optionally, select a preference set from the list. For more information, see the section on creating and editing preference sets in Analyzing Inventory Plans, page 6-2. You can specify the budget details that you want to be displayed using the preference sets. You can also choose the type of calendar for the tabular and graphical displays using the preference sets.
Crosstab To view this option, click the View link. Select this option to view the safety stock details in the tabular format.
Graph To view this option, click the View link. Select this option to view the safety stock details in the graphical format. You can also specify the type of graph.
View By To view this field, click the Layout link. Select a view by to drill down in the tabular format.
3. Click Go to analyze the inventory budgets for the selected plans.

6-28 Oracle Inventory Optimization Users Guide
The inventory planning engine displays the budget details for the selected plans in the tabular or graphical format based on your selection.
The following table describes the row headings of the tabular display:
Row Heading Description
Budget The allocated budget for a plan. The budget value can be specified in the Constraints tabbed region of Plan Options window or in the Specify Budget window. For more informationon budgets, see Defining Budgets, page 4-12.
Inventory Value The estimated value of inventory at the end of each planned bucket. The inventory planning engine calculates the inventory value for each item in the plan and aggregates the value at the category, organization, and plan level. The inventory planning engine calculates the inventory value for an item by multiplying its projected available balance and its standard cost.
You can view the projected available balance for items in the Horizontal Plan in Oracle Inventory Optimization. For more information see, Oracle Advanced Planning Implementation and User's Guide. The standard costs for items are specified in the Oracle Cost Management application. For more information, see Oracle Cost Management User's Guide.
Difference The difference between the budget amount and the inventory value amount. The inventory planning engine calculates this difference by subtracting the inventory value from the budget.
Cum. Diff. The collective difference between the budget amount and the inventory value. The inventory planning engine calculates the cumulative difference by adding the difference amount from the previous columns in the tabular display.
Target Service Level (%)
The target service level that you have set for a plan. You can set the target service level for a plan in the Constraints tabbed region of the Plan Options window. For more information on setting target service levels, see Setting Target Service Levels, page 4-2.
Achieved Service Level(%)
The achievable service level for a plan. The inventory planning engine calculates the achieved service level based on the inputs for the plan.

Analysis Workbench 6-29
Analyzing Revenue and Cost BreakdownThere is a cost involved in achieving the service levels and safety stocks that you specifyin your inventory plans. To determine the most profitable inventory plan, you need to know the cost that can be incurred and the revenue that can be generated by implementing a plan. You can analyze the cost and revenue details of your inventory plans using the Revenue and Cost Breakdown page. This analysis helps you identify how the allocated budget will be spent and how much revenue can be generated by implementing an inventory plan. This analysis helps you identify the most profitable organizations, item categories, and items in your inventory plan. This analysis also enables root cause analysis. For example, if achieving a specific service level costs an excessive amount of money, you can drill down to the categories or items contributing to the high costs using the Revenue and Cost Breakdown page.
The Revenue and Cost Breakdown page enables you to view the revenue and cost breakdown in both the tabular and graphical formats. The details displayed in these formats are based on your search criteria. You can further drill down using the View Byfeature. The graphical format shows the planned cost against an organization, category, or item in the plan.
You can also widen the scope of your analysis by navigating to other related pages fromthe Revenue and Cost Breakdown page. This enables you to analyze the selected plans with the same search criteria specified in the Inventory Budget Analysis page. You can select the plans from the list and navigate to the following analysis pages from the Revenue and Cost Breakdown page:
• Inventory Budget Analysis
• Safety Stock Analysis
Navigating to other related analysis pages
You can also navigate to the Planner Workbench from the Revenue and Cost Breakdown page by clicking Workbench to view supply and demand information alongwith sourcing and BOM information.
To analyze revenue and cost breakdown
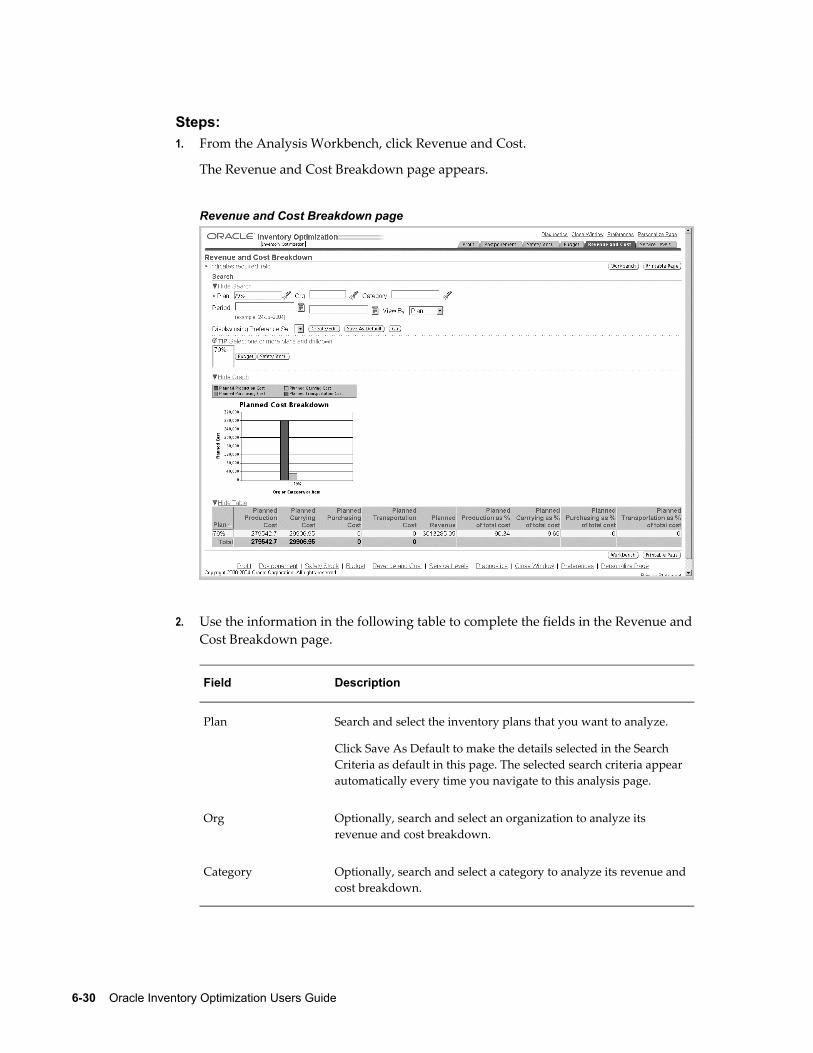
6-30 Oracle Inventory Optimization Users Guide
Steps:1. From the Analysis Workbench, click Revenue and Cost.
The Revenue and Cost Breakdown page appears.
Revenue and Cost Breakdown page
2. Use the information in the following table to complete the fields in the Revenue andCost Breakdown page.
Field Description
Plan Search and select the inventory plans that you want to analyze.
Click Save As Default to make the details selected in the Search Criteria as default in this page. The selected search criteria appear automatically every time you navigate to this analysis page.
Org Optionally, search and select an organization to analyze its revenue and cost breakdown.
Category Optionally, search and select a category to analyze its revenue andcost breakdown.

Analysis Workbench 6-31
Field Description
Period Optionally, specify the period for which you want to analyze the revenue and cost breakdown. You can select the start and end dates from the date editor.
View By Select a view by to drill down. You can view by plan, category, item, period, or week.
You can view month-wise revenue and cost breakdown detail for either the manufacturing or financial calendar by selecting period from the list.
You can view week-wise details only for the manufacturing calendar. You can select the type of calendar in the preference set created for Revenue and Cost Breakdown page. For more information, see the section on creating and editing preference sets in Analyzing , page 6-2Inventory Plans.
Display using Preference Set
Optionally, select a preference set from the list. For more information, see the section on creating and editing preference sets in Analyzing Inventory Plans, page 6-2.
3. Click Go to analyze the selected inventory plans.
The inventory planning engine displays the revenue and cost breakdown details forthe selected plans.
The following table describes the column headings of the tabular display in Revenue and Cost Breakdown page:
Column Heading Description
Plan The name of the plan that you have selected for analysis.
Category The categories in the selected plans whose revenue and cost breakdown details are displayed. This column appears if youare viewing by category.
Item The items in the selected plans whose revenue and cost breakdown details are displayed. This column appears if youare viewing by item.
6-32 Oracle Inventory Optimization Users Guide
Column Heading Description
Time The bucket for which the revenue and cost breakdown details are displayed. This column appears if you are viewing by period or week.
Planned Production Cost The estimated cost of producing the planned items. The inventory planning engine calculates the production cost for each item in the plan and aggregates the cost at the plan level.
The inventory planning engine calculates the planned production cost for an item by multiplying the resource unit cost and the required hour. The resource unit cost and required hour for items are specified in Oracle Bills of Material. For more information, see the Oracle Bills of MaterialUser's Guide.
Planned Carrying Cost The estimated cost of stocking the planned items. The inventory planning engine calculates the carrying cost for each item in the plan and aggregates the cost at the plan level.
The inventory planning engine calculates the carrying cost based on the carrying cost percentage. Carrying cost percentage can be set up at the item level using Oracle Inventory or at the profile option level. The carrying cost percentage set up at the item level takes precedence over the carrying cost percentage set up at the profile option level. For information on setting up carrying cost percentage at the item level, see Oracle Inventory User's Guide.

Analysis Workbench 6-33
Column Heading Description
Planned Purchasing Cost The estimated purchasing cost for the planned items. The inventory planning engine calculates the purchasing cost for each item in the plan and aggregates the cost at the plan level.
The inventory planning engine calculates the purchasing cost for an item based on its standard cost. The standard costs for items are specified in blanket purchase order agreement. These purchase orders are created in the Oracle Purchasing application. For more information, see Oracle Purchasing User's Guide.
The standard costs for items can also be specified in the Oracle Cost Management application. For more information, see Oracle Cost Management User's Guide. The standard costs specified in Oracle Purchasing takes precedence over the standard costs specified in Oracle Cost Management.

6-34 Oracle Inventory Optimization Users Guide
Column Heading Description
Planned Transportation Cost
The estimated cost for transporting the planned items from an organization to another. The inventory planning engine calculates the transportation cost for each item in the plan and aggregates the cost at the plan level. The inventory planning engine calculates the transportation cost for an itemby multiplying the number of unit items supplied, unit weight or unit volume, and transportation cost per unit weight or unit volume.
The inventory planning engine calculates the number of units supplied based on the item's demand schedule. It takes the organization name from which the item is sourced and the organization name to which the item is supplied from theitem's sourcing rule. It also takes the shipment method from the sourcing rule.
The inventory planning engine takes the unit weight or unit volume for the item and the cost of transporting an unit weight or unit volume of the item between the two organizations by the specified shipping method from Oracle Inventory.
Unit weight or unit volume for an item is specified in the Physical Attributes tabbed region of Master Items window orOrganization Items window of Oracle Inventory. The cost of transporting a unit weight or unit volume between two organization using a specific shipping method is specified in the Transit window of Oracle Inventory.
For information on demand schedule, see the section on demand schedules in The Organizations Tabbed Region, page 3-9. For information on sourcing rules, see Oracle Advanced Planning Implementation and User's Guide. For information on transportation cost per unit weight or unit volume of an item, see Oracle Inventory User's Guide.

Analysis Workbench 6-35
Column Heading Description
Planned Revenue The estimated gross income for the plan from the sales of items that have an independent demand. The inventory planning engine calculates the revenue for each planned item that has an independent demand and aggregates the revenue at the plan level. The inventory planning engine calculates the revenue for an item by multiplying its selling price and the number of unit items supplied.
The selling price for an item is specified in the List Lines tabbed region in the Price Lists window of Oracle Order Management. For more information, see Oracle Order Management User's Guide.
The inventory planning engine calculates the number of units supplied based on the item's demand schedule. The demand schedule for an item is defined in the Organization tabbed region of the Plan Options window of Oracle Optimization. For information on demand schedules, see the section on demand schedules in The Organizations , page 3-9Tabbed Region.
Planned Production as % of total cost
The percentage of the production cost in the total cost.
The inventory planning engine calculates this value by dividing the planned production cost by the total cost and then multiplying the result by 100. The total cost is the sum of the planned production cost, planned carrying cost, planned purchasing cost, and planned transportation cost.
Planned Carrying as % of total cost
The percentage of the carrying cost in the total cost.
The inventory planning engine calculates this value by dividing the planned carrying cost by the total cost and then multiplying the result by 100. The total cost is the sum of the planned production cost, planned carrying cost, planned purchasing cost, and planned transportation cost.
Planned Purchasing as % of total cost
The percentage of the purchasing cost in the total cost.
The inventory planning engine calculates this value by dividing the planned purchasing cost by the total cost and then multiplying the result by 100. The total cost is the sum of the planned production cost, planned carrying cost, planned purchasing cost, and planned transportation cost.

6-36 Oracle Inventory Optimization Users Guide
Column Heading Description
Planned Transportation as % of total cost
The percentage of the transportation cost in the total cost.
The inventory planning engine calculates this value by dividing the planned transportation cost by the total cost andthen multiplying the result by 100. The total cost is the sum of the planned production cost, planned carrying cost, planned purchasing cost, and planned transportation cost.
Analyzing Service Level BreakdownService level is the percentage of meeting your customers' requirements through your finished-goods inventory. Inventory Optimization enables you to specify service levels at various levels such as plan, demand class, organization, and item. The inventory planning engine calculates the achievable service levels based on the plan inputs.
You can analyze the service level breakdown of your inventory plans using the Service Level Breakdown page. This analysis helps you view the achievable service levels at thevarious levels for an inventory plan. This enables you to view the achievable service levels for your most profitable organization, demand class, item, and item categories. This analysis also enables root cause analysis. For example, if there is a service level violation, you can drill down to the items for which the achievable service level is lowerthan the targeted service level. Further you can navigate to the Safety Stock Analysis page to find out if the user-specified safety stocks or the calculated safety stock values are causing service level violation.
The Service Level Breakdown page enables you to view the service level breakdown details in both the tabular and graphical formats. The details displayed in these formats are based on your search criteria. You can further drill down using the View By feature. The graphical format shows the planned service level against an item, category, or organization.
You can also widen the scope of your analysis by navigating to other related pages fromthe Service Level Breakdown page. This enables you to analyze the selected plans with the same search criteria specified in the Service Level Breakdown page. You can select the plans from the list and navigate to the following analysis pages from the Service Level Breakdown page:
• Revenue and Cost Breakdown
• Safety Stock Analysis
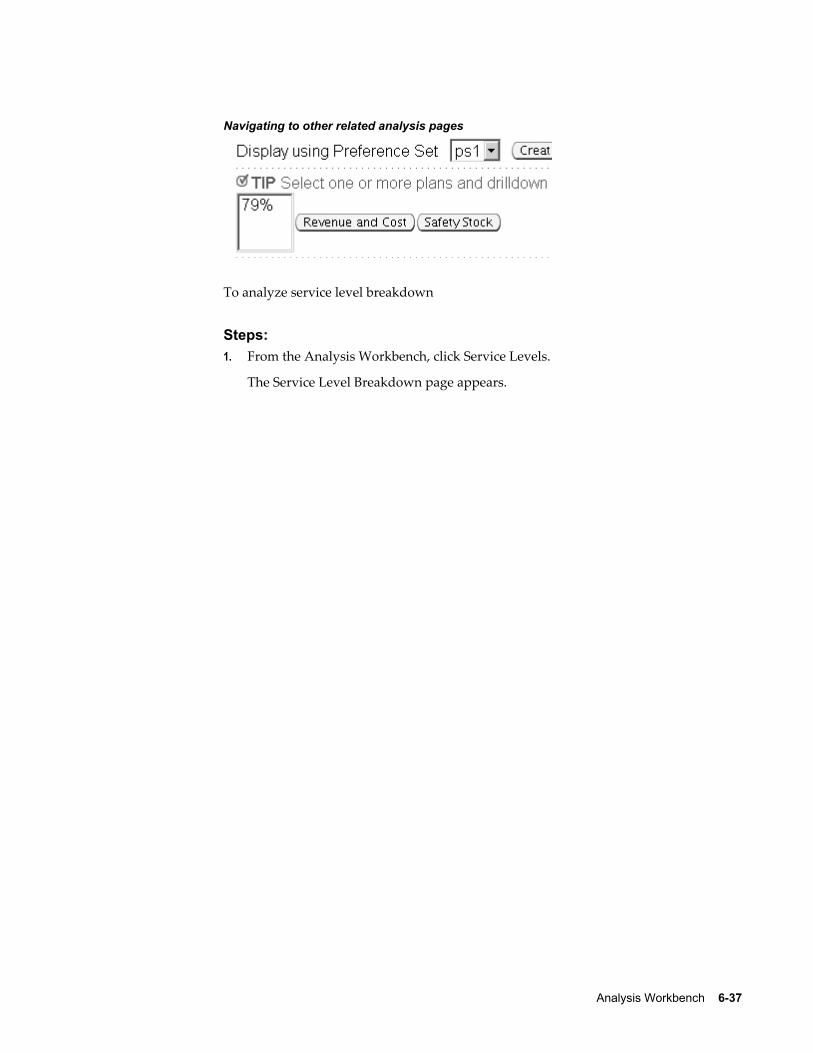
Analysis Workbench 6-37
Navigating to other related analysis pages
To analyze service level breakdown
Steps:1. From the Analysis Workbench, click Service Levels.
The Service Level Breakdown page appears.

6-38 Oracle Inventory Optimization Users Guide
Service Level Breakdown page
2. Use the information in the following table to complete the fields in the Service LevelBreakdown page.
Field Description
Plan Search and select the inventory plans that you want to analyze.
Click Save As Default to make the details selected in the Search Criteria as default in this page. The selected search criteria appear automatically every time you navigate to this analysis page.
Org Optionally, search and select an organization to analyze its service level breakdown.
Category Optionally, search and select a category to analyze its service level breakdown.
Analysis Workbench 6-39
Field Description
Demand Class Optionally, search and select a demand class to analyze its service level breakdown.
Period Optionally, specify the period for which you want to analyze the service level breakdown. You can select the start and end dates from the date editor.
View By Select a view by to drill down. You can view by plan, category, item, period, week, or demand class.
Display using Preference Set
Optionally, select a preference set from the list. For more information, see the section on creating and editing preference sets in Analyzing Inventory Plans, page 6-2.
3. Click Go to analyze the selected inventory plans.
The inventory planning engine displays the service level breakdown details for the selected plans.
The following table describes the column headings of the tabular display in Service Level Breakdown page:
Column Heading Description
Plan The name of the plan that you have selected for analysis.
Category The categories in the selected plans whose service level details are displayed. This column appears if you are viewing by category.
Item The items in the selected plans whose service level details are displayed. This column appears if you are viewing by item.
Time The bucket for which the service level details are displayed.This column appears if you are viewing by period or week.
Demand Class The demand class in the selected plans whose service level details are displayed. This column appears if you are viewing by demand class.
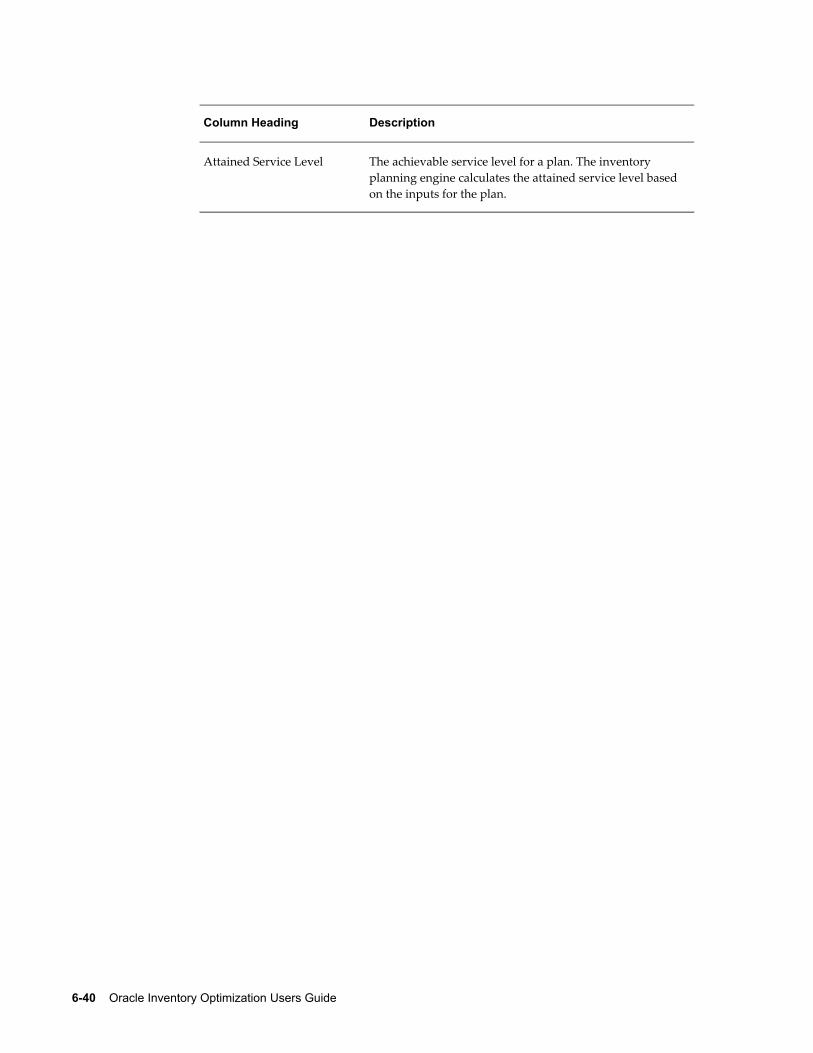
6-40 Oracle Inventory Optimization Users Guide
Column Heading Description
Attained Service Level The achievable service level for a plan. The inventory planning engine calculates the attained service level based on the inputs for the plan.
Managing Inventory and Safety Stock 7-1
7Managing Inventory and Safety Stock
This chapter documents procedures for planning safety stock inventory.
This chapter covers the following topics:
• Planning Safety Stock for Components and Co-products
• Defining and Generating Safety Stock Levels
• Safety Stock Inflation
• Safety Stock Smoothing
• Safety Stock Level Days of Supply
• User-Specified Safety Stock
Planning Safety Stock for Components and Co-productsYou can get multiple assemblies when processing a component. Oracle Inventory Optimization considers the combined variability of such end items to calculate safety stock quantities for common components. This reduces the required safety stock levels.
You can specify the time-phased split for product ratios (co-products).
Oracle Inventory Optimization also calculates safety stock quantities based on statistically calculated demand variability for all nodes across the supply chain bill. Based on the independent demand probability distributions across the bill of distribution, the inventory planning engine generates appropriate levels of safety stock at different levels of supply chain bill.
Defining and Generating Safety Stock LevelsThe following steps indicate the process of defining and generating safety stock levels for common components of independent end items along with their components across the supply chain bill:
• Define the bills of material in the Bills of Material form.

7-2 Oracle Inventory Optimization Users Guide
• In the case of multiple components, define the bill of materials for the item and the multiple components.
• Define the co-product and the split percentage in the Define Co-products form.
• Define the alternate split percentages for different time periods in the Define Co-product form.
• Collect the co-products definition to Oracle Advanced Supply Chain Planning.
• Plan safety stock levels for all eligible items.
Safety Stock InflationYou might see varying safety stock requirements across the planning horizon owing to the following reasons:
• Compressed lead time: The demands in the beginning of the horizon have less lead time as compared to demands later in the horizon. As a result, you may see differing safety stocks across the horizon.
• Existing supply: If you have enough existing supply, you do not need safety stocks to cover uncertainty. As you start to consume existing supply, you need safety stocks later in the horizon. As a result, you may view varying safety stocks across the horizon.
Safety Stock SmoothingOracle Inventory Optimization calculates time phased safety stock values across the planning horizon. However, there may be frequent changes to the safety stock if the demand variability is high. You may prefer estimating safety stock that is stable across the planning horizon. Oracle Inventory Optimization enables you to hold a constant safety stock for a specified time in the planning horizon. If you do not want the inventory planning engine to recommend any change in the safety stock for a specific duration, you can indicate the number of days. Oracle Inventory Optimization ignores the negative on-hand when it calculates the safety stock. The inventory planning engineconsiders the negative on-hand as an independent demand due in the first bucket.
You can use the following plan level options in the Plan Options window to control the stability of the safety stock:
• Safety stock change interval (days)
• Safety stock change threshold interval (%)
For more information on these plan level options, see Plan Options Overview, page 3-2.

Managing Inventory and Safety Stock 7-3
Consider an example. In the following illustration, the vertical axis represents the safetystock level while the horizontal axis represents the planning horizon. In this example, planning horizon is split into 4 quarters. The safety stock change threshold interval is set to 1%.
Safety Stock Change Threshold
The highest level of safety stock is indicated in the last change interval (Q4) at 115. The safety stock requirement in the adjacent interval is 95, which is lower than the requirement in Q4. This indicates that the safety stock quantity for Q3 needs to be reduced. As the safety stock change threshold interval is set to 1%, the inventory planning engine changes the safety stock levels at 113. The inventory planning engine reduces the stock from Q4 by a maximum of 1%. This amounts to 1.5, which leads to a reduction of 2 units. The inventory planning engine compares the safety stock requirements between the next adjacent quarters subsequently. In Q2, the safety stock required is 112. As 112 is within 1% of 113, the inventory planning engine does not change the safety stock levels. In Q1, the inventory planning engine recommends a reduction in the safety stock level by 1% of 112 (Q2).
Follow the steps provided to smoothen the safety stock:
• Review your inventory policy to determine the change interval.
• Divide the planning horizon into several equal sizes of change interval.
• Set the safety stock change interval in the Plan Options form.
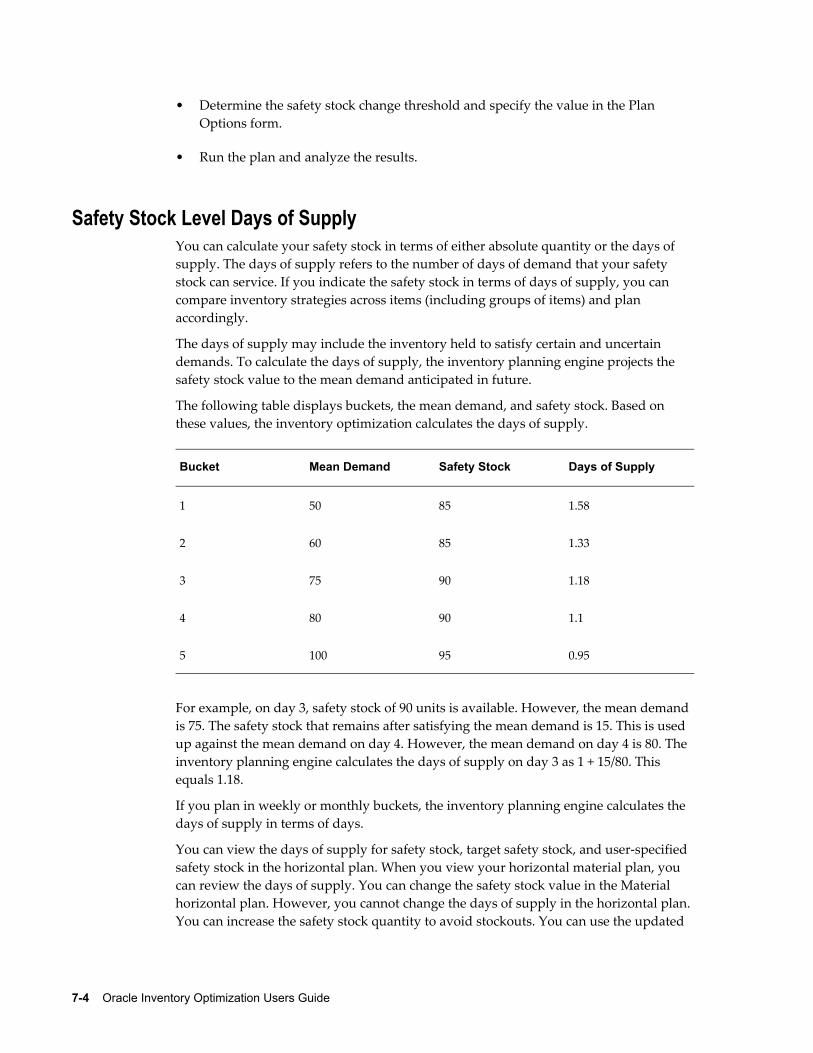
7-4 Oracle Inventory Optimization Users Guide
• Determine the safety stock change threshold and specify the value in the Plan Options form.
• Run the plan and analyze the results.
Safety Stock Level Days of SupplyYou can calculate your safety stock in terms of either absolute quantity or the days of supply. The days of supply refers to the number of days of demand that your safety stock can service. If you indicate the safety stock in terms of days of supply, you can compare inventory strategies across items (including groups of items) and plan accordingly.
The days of supply may include the inventory held to satisfy certain and uncertain demands. To calculate the days of supply, the inventory planning engine projects the safety stock value to the mean demand anticipated in future.
The following table displays buckets, the mean demand, and safety stock. Based on these values, the inventory optimization calculates the days of supply.
Bucket Mean Demand Safety Stock Days of Supply
1 50 85 1.58
2 60 85 1.33
3 75 90 1.18
4 80 90 1.1
5 100 95 0.95
For example, on day 3, safety stock of 90 units is available. However, the mean demand is 75. The safety stock that remains after satisfying the mean demand is 15. This is used up against the mean demand on day 4. However, the mean demand on day 4 is 80. The inventory planning engine calculates the days of supply on day 3 as 1 + 15/80. This equals 1.18.
If you plan in weekly or monthly buckets, the inventory planning engine calculates the days of supply in terms of days.
You can view the days of supply for safety stock, target safety stock, and user-specified safety stock in the horizontal plan. When you view your horizontal material plan, you can review the days of supply. You can change the safety stock value in the Material horizontal plan. However, you cannot change the days of supply in the horizontal plan. You can increase the safety stock quantity to avoid stockouts. You can use the updated
Managing Inventory and Safety Stock 7-5
safety stock values in the supply plan to create supplies. For more information on the horizontal plan, see Overview of Viewing Output, page 5-1.
User-Specified Safety StockSeveral factors may influence your decision related to the level of safety stock that you need to maintain. These include:
• Contractual obligations
• Vendor-managed inventory
• Policies regarding service levels
• Subjective experience
The inventory planning engine recommends optimal levels of safety stock. However, you can override the recommendations that the inventory planning engine generates with your specific inputs.
You can use Oracle Inventory Optimization to specify a definite quantity for the safety stock in a time phased manner. Alternatively, you can specify the safety stock quantity in terms of days of supply. If you are uncertain about the definite safety stock quantity, you can specify the levels of inventory you want to maintain. The inventory planning engine validates the projected available balance against the inventory level that you specify.
If you enforce the level of safety stock based on your inputs, the inventory planning engine may need to violate constraints and other factors such as:
• Service levels
• Inventory postponement
• Budget and capacity
For example, you may have specified a budget constraint. If you enforce a certain level of safety stock that exceeds the budget limit, the inventory planning engine violates the budget constraint. Based on your specific safety stock requirements, you can estimate your budget and capacity requirements. In addition, you can calculate the planned service levels.
If you enforce user-specified safety stock, the inventory planning engine honors the user input and recommends the user-specified value rather than determining the optimal safety stock levels. To know the optimal safety stock levels, you can run a separate plan without enforcing user specified safety stock.
The user defined safety stock may violate the postponement suggestions that Oracle Inventory Optimization generates. Optimal inventory to be carried may be higher or lower than what the user would like to carry in some circumstances. In such a case,

7-6 Oracle Inventory Optimization Users Guide
safety stock values with and without postponement may not follow any logic as they may be affected by the user-specified safety stocks. Any associated costs will also be skewed based on safety stock numbers. In addition, the inventory planning engine can ignore the safety stock smoothing, and the minimum and maximum levels of inventory if you enforce the user-defined safety stock.
You can set the postponement factor profile option (MSR: Postponement Factor) to control the safety stock levels in a supply chain. The value you set for postponement factor might conflict with the user-specified safety stock. For example, you may input a safety stock value for an item four levels down in the supply chain and set postponement factor to be two. This will be considered an invalid setup. If you define both, the postponement factor and the user-defined safety stock, the inventory planningengine ignores the user-defined safety stock and enforces the postponement factor.
Setting Up User-Specified Safety StockFollow these steps to specify the safety stock level you want the inventory planning engine to use:
• Determine the items for which you need to specify the safety stock. You can run collections to collect the safety stock from the source instance. Review the safety stock for the items in the Planner Workbench. You can drill down to the safety stockvalue from the Items window in the Planner Workbench.
• Override the existing safety stock value with the value you want in the Safety Stock window (Planner Workbench). You can enter either an absolute quantity for the safety stock or the days of supply. If you enter the user-specified safety stock in terms of days of supply, the inventory planning engine converts the days of supply to a quantity based on the average demand quantity. When you enforce the user-specified safety stock, the inventory planning engine enforces the quantity calculated based on the average demand quantity. The enforced safety stock quantity may be different from the safety stock expressed in terms of the days of supply. Days of supply can be input to or output from the inventory planning engine. It is an input when you, as a user, specify the number of days you want the inventory to last. It is an output when the inventory planning engine expresses the optimal safety stock value in terms of days of supply. The input quantity specified as part of user specified safety stocks may not match the days of supply specified bythe engine as the days of supply calculation is based on different statement of demands.
• Alternatively, you can set up the minimum or maximum inventory levels in the Inventory Levels window. If you provide an absolute quantity and the inventory level, the inventory planning engine considers the absolute quantity.
• Enforce the target safety stock by selecting the Enforce Target Safety Stocks check box in the Plan Options window.

Managing Inventory and Safety Stock 7-7
• Run and evaluate the plan.
Viewing the User-Specified Safety StockYou can view the user-specified safety stock in the horizontal plan (Planner Workbench). User-specified safety stocks are expressed in terms of units, days of supply, and value. If you specified the minimum or maximum inventory levels, the horizontal plan displays the values for the same.
For more information on viewing safety stock levels, see Safety Stock and Target Safety Stock, page 5-10.
Analyze the Impact of User-Specified Safety StockYou can use the Analysis Workbench to analyze the impact of user-specified safety stock values on the existing budget, capacity, and inventory postponement. For more information on the analysis views, see Analyzing Inventory Plans, page 6-2.


Oracle Inventory Optimization and Asset Intensive Planning 8-1
8Oracle Inventory Optimization and Asset
Intensive Planning
Introduction to Asset Intensive PlanningThe purpose of this functionality is to plan asset intensive maintenance to enable OracleInventory Optimization (IO) to compute safety stock for consumables and rebuildables that will be required for maintenance in an asset intensive industry.
Oracle Inventory Optimization (IO) sets safety stock levels that understand the holistic supply chain, including planning for maintenance of assets. The planning of maintenance of assets includes rebuilding defective items into a usable state to fulfill maintenance component demands. A complex asset, such as an aircraft, a vehicle, or manufacturing equipment contains components that are considered repairable or rebuildable.
IO provides an inventory postponement optimization solution that leads to a much more efficient supply chain, characterized by lower levels of inventory and better delivery performance to customers.
In order to support postponement and to accomplish the rebuild of defective items into a usable state, IO will rebuild activity bill of material and routing.
Process Overview
Rebuild activity, as defined in Oracle eAM, is recognized in IO. IO uses the bill of material and routing that is associated with this rebuild activity to understand which materials and resources are used in the repair process. This helps IO to compute safety stock for components used in the repair process, in addition to the repair item itself.
IO supports the definition of a "rebuild" activity, which is used to calculate the points ofpostponement. This activity is collected to support ASCP planning of maintenance requirements.
Rebuildable items (rebuildables) are assets that you install, remove, overhaul, and reinstall, for example, engines, control boxes, and computer boards. Other components

8-2 Oracle Inventory Optimization Users Guide
that you remove, discard, or replace are consumables
Maintenance activities, such as, inspections, overhauls, lubrications, repairs, servicing, and cleanings, are the templates of work orders. The activities have an activity structure—the material requirements (maintenance bill of material) and operations and resource requirements (activity routing) that you need to perform the maintenance. You associate the activities with assets.
The rebuild activity tells IO which maintenance of asset and routing will be used for themaintenance of the asset. IO gets the repair lead times from the Item Attribute and respects it. In case no rebuild activity is specified for a component that has a repair sourcing rule specified, the repair lead time that is specified on the item attribute must be respected. This being the case where no Rebuild Activity has been specified, IO assumes that there are no additional components required to rebuild the defective part. The treatment here is identical to that of ASCP. For more details, refer to Oracle Advanced Supply Chain Planning Implementation and User's Guide Supplement.
The fact that items are being repaired or rebuilt implies that there are defective items in the supply chain. Inventory optimization will plan safety stocks only for usable items.
Computing Total DemandBoth eAM and cMRO maintenance applications produce a set of forecasted Maintenance Work Orders. These are collected into ASCP as a statement of forecasted maintenance activities and the associated material and resources requirements. These forecasted work orders are created based on the known condition and expected preventative maintenance schedule of each asset, such as aircraft, truck, metal press.
ASCP then produces a supply chain plan for these work orders that will be used by the Demantra Sales & Operations Planning (S&OP) process and combined with Demantra's traditional demand forecast for independent demand, based on historical sales orders. Demantra combines its sales order based forecast and with the forecasted work orders to create a single statement of total demand each item. This one number demand forecast is compared to actual historical demands to calculate the forecast accuracy, as shown in the diagram below:
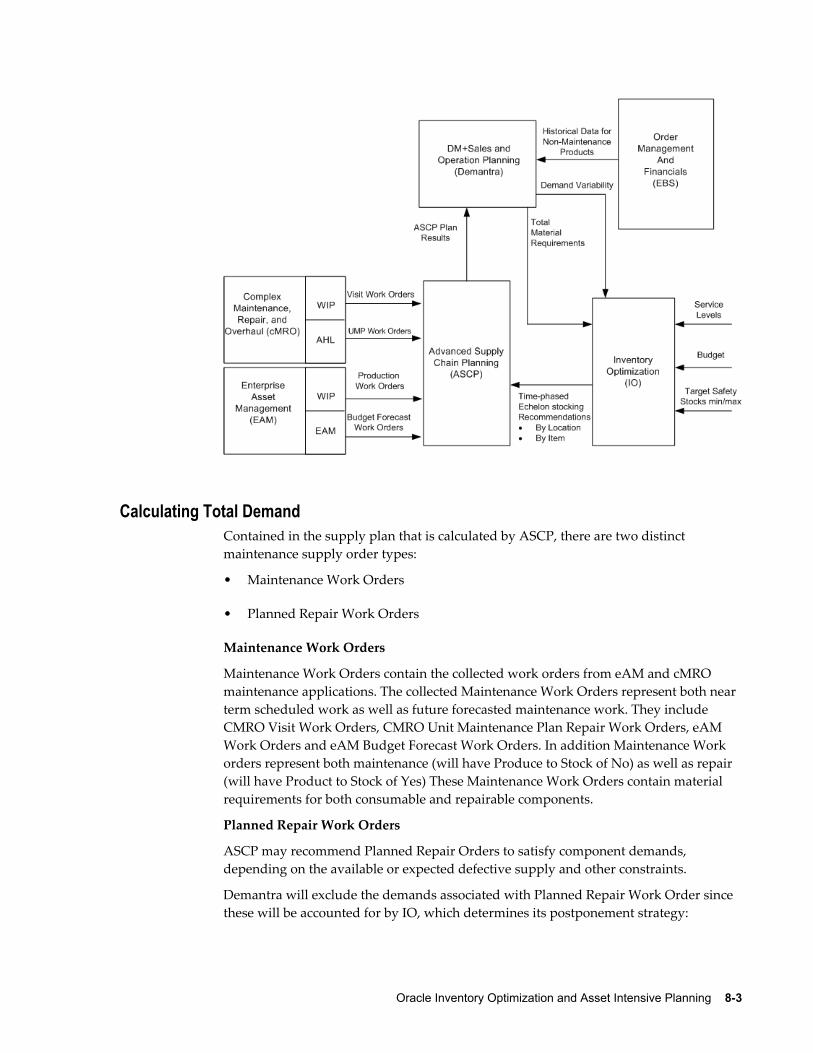
Oracle Inventory Optimization and Asset Intensive Planning 8-3
Calculating Total DemandContained in the supply plan that is calculated by ASCP, there are two distinct maintenance supply order types:
• Maintenance Work Orders
• Planned Repair Work Orders
Maintenance Work Orders
Maintenance Work Orders contain the collected work orders from eAM and cMRO maintenance applications. The collected Maintenance Work Orders represent both near term scheduled work as well as future forecasted maintenance work. They include CMRO Visit Work Orders, CMRO Unit Maintenance Plan Repair Work Orders, eAM Work Orders and eAM Budget Forecast Work Orders. In addition Maintenance Work orders represent both maintenance (will have Produce to Stock of No) as well as repair (will have Product to Stock of Yes) These Maintenance Work Orders contain material requirements for both consumable and repairable components.
Planned Repair Work Orders
ASCP may recommend Planned Repair Orders to satisfy component demands, depending on the available or expected defective supply and other constraints.
Demantra will exclude the demands associated with Planned Repair Work Order since these will be accounted for by IO, which determines its postponement strategy:
8-4 Oracle Inventory Optimization Users Guide
1. Demantra will calculate "Total Demand" as the sum of:
• Consensus Forecasted This is the forecast for non-maintenance products.
• Maintenance Work Order Demand
2. Demantra will calculate Demand Variability by comparing the total demand" to actual demands
Demantra will send a statement of Total Demand and Demand Variability to IO, which will then use this information to calculate optimized safety stocks, based on user input of service level targets and budget.
Modeling Repair OperationsAs part of the enhancements, ASCP can now model repair operations. Each maintenance application (eAM and cMRO) supports a repair or rebuild process to transform a defective item into a usable item to satisfy maintenance demands. Contained in each set of Work Orders are component requirements for Rebuildable items ASCP will recommend "supplies to satisfy"
To support its postponement functionality, IO must be cognizant of the "Rebuildable" BOM and Route utilized in these rebuild activities. Inventory Optimization recognizes the Repair-at sourcing rule.
For more information on Asset Intensive Planning and the role of ASCP, refer to Oracle Advanced Supply Chain Planning Implementation and User's Guide Supplement.
eAM Activity DefinitionThe activity shown below, Rebuild T56-Engine, is the process of transforming a defective T56-Engine in to a usable T56-Engine. The BOM and Routing associated with the item define the process. This example uses the T56 Engine to illustrate the modeling setups.
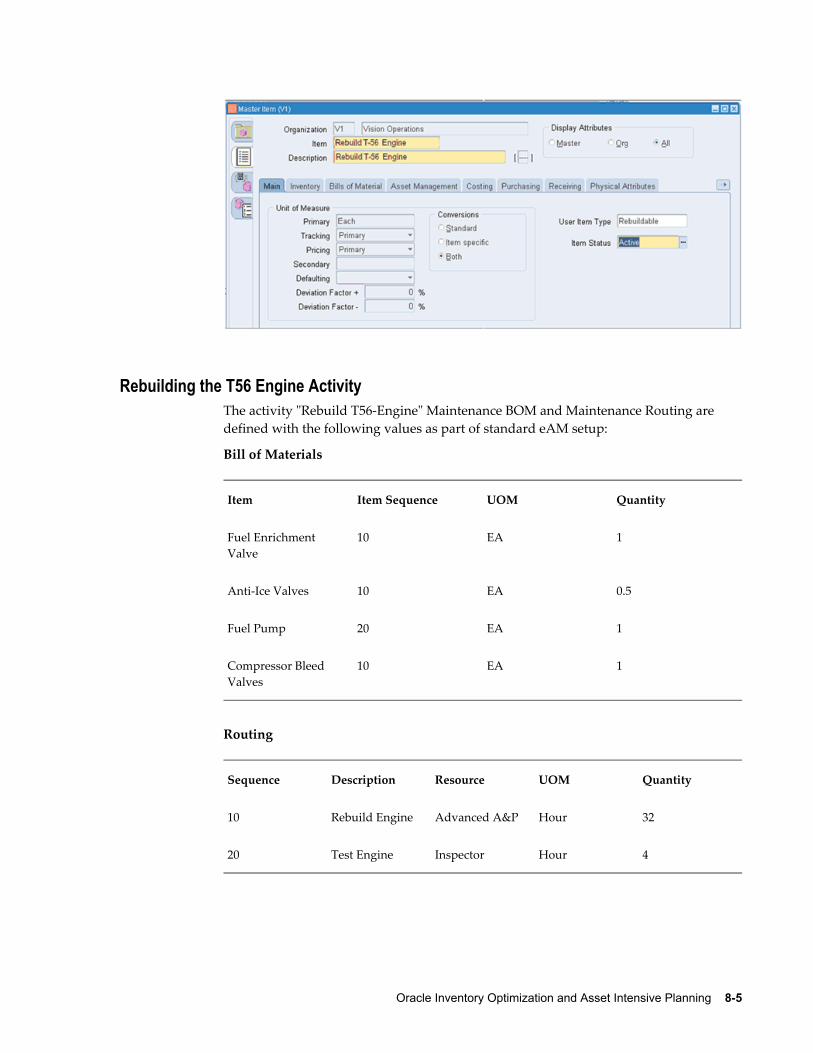
Oracle Inventory Optimization and Asset Intensive Planning 8-5
Rebuilding the T56 Engine ActivityThe activity "Rebuild T56-Engine" Maintenance BOM and Maintenance Routing are defined with the following values as part of standard eAM setup:
Bill of Materials
Item Item Sequence UOM Quantity
Fuel Enrichment Valve
10 EA 1
Anti-Ice Valves 10 EA 0.5
Fuel Pump 20 EA 1
Compressor Bleed Valves
10 EA 1
Routing
Sequence Description Resource UOM Quantity
10 Rebuild Engine Advanced A&P Hour 32
20 Test Engine Inspector Hour 4
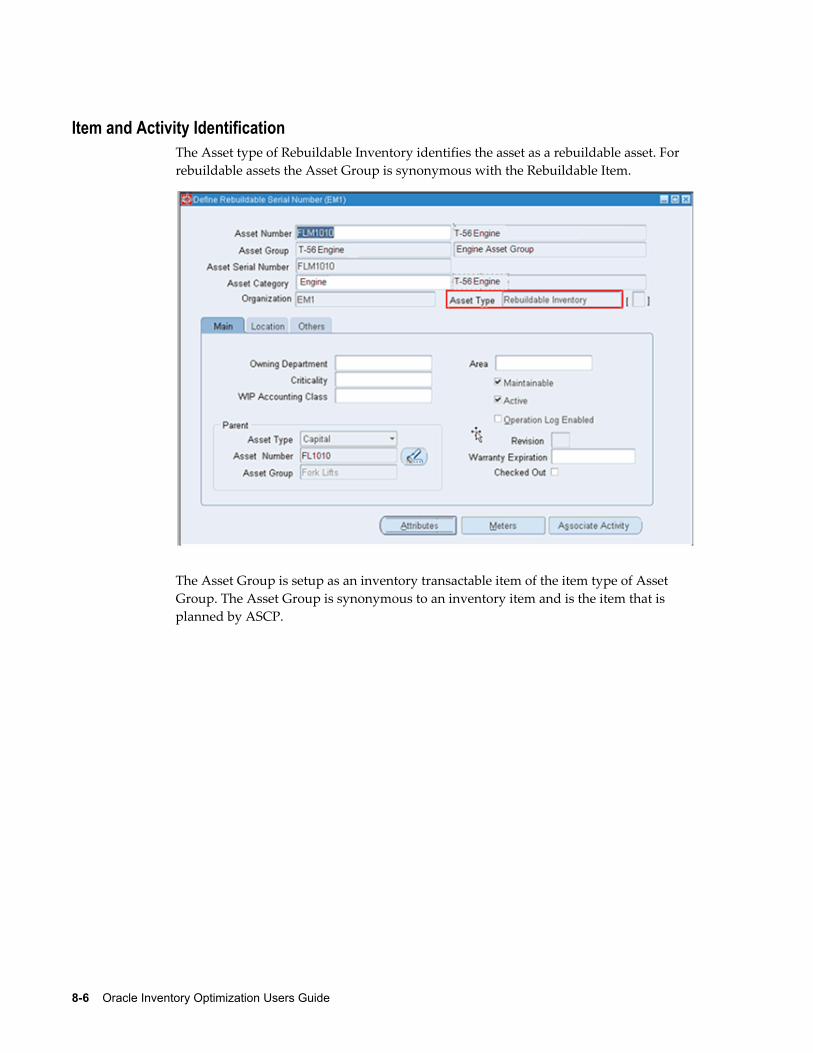
8-6 Oracle Inventory Optimization Users Guide
Item and Activity IdentificationThe Asset type of Rebuildable Inventory identifies the asset as a rebuildable asset. For rebuildable assets the Asset Group is synonymous with the Rebuildable Item.
The Asset Group is setup as an inventory transactable item of the item type of Asset Group. The Asset Group is synonymous to an inventory item and is the item that is planned by ASCP.

Oracle Inventory Optimization and Asset Intensive Planning 8-7
Activity Types describe the type of maintenance work that is performed on an asset, such as, inspections, lubrications, overhauls, calibration, and repetitive work. The "Rebuild – Rebuild Spare" activity determines which activity that is associated with a rebuildable item should be used by ASCP to plan for the rebuild or repair of the rebuildable item. Activity types of Rebuild are those collected over into ASCP for use ingenerating planned repair work orders.
Note: eAM does not enforce the assignment of one and only one Rebuild Activity type for each rebuildable asset group. Since ASCP needs to identify a specific rebuild activity to use in planning purposes,there is an attribute set on the destination that specifies which of these multiple rebuild activities is used for planning. It is an implementation task and business rule to enforce to assignment of Rebuild activities to rebuildable asset groups. For example:
Activity Type Description
Calibration Calibration
Construction Construction
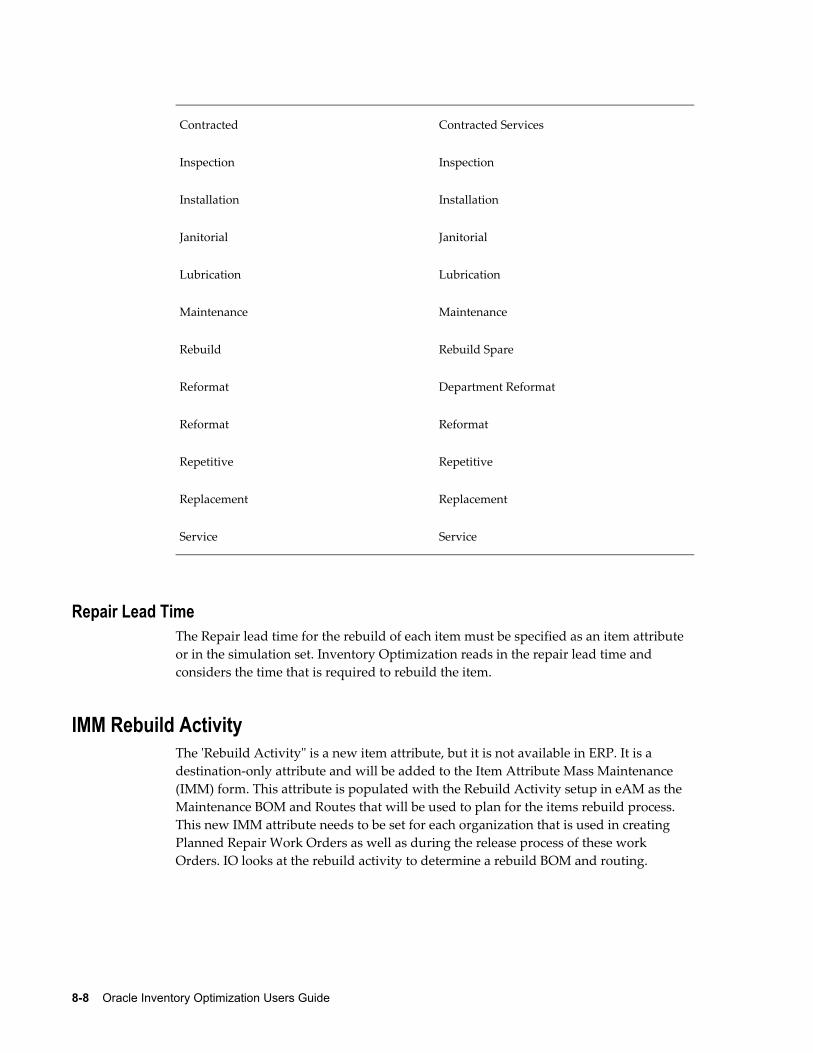
8-8 Oracle Inventory Optimization Users Guide
Contracted Contracted Services
Inspection Inspection
Installation Installation
Janitorial Janitorial
Lubrication Lubrication
Maintenance Maintenance
Rebuild Rebuild Spare
Reformat Department Reformat
Reformat Reformat
Repetitive Repetitive
Replacement Replacement
Service Service
Repair Lead TimeThe Repair lead time for the rebuild of each item must be specified as an item attribute or in the simulation set. Inventory Optimization reads in the repair lead time and considers the time that is required to rebuild the item.
IMM Rebuild ActivityThe 'Rebuild Activity" is a new item attribute, but it is not available in ERP. It is a destination-only attribute and will be added to the Item Attribute Mass Maintenance (IMM) form. This attribute is populated with the Rebuild Activity setup in eAM as the Maintenance BOM and Routes that will be used to plan for the items rebuild process. This new IMM attribute needs to be set for each organization that is used in creating Planned Repair Work Orders as well as during the release process of these work Orders. IO looks at the rebuild activity to determine a rebuild BOM and routing.

Oracle Inventory Optimization and Asset Intensive Planning 8-9
Note: Oracle Inventory Optimization assumes that there are no additional components required to rebuild the defective part. The treatment here is identical to ASCP.
Note: Oracle Inventory Optimization will not use the existing Maintenance Work Orders and External Repair Orders as sources of supply computing safety stock
Note: Oracle Inventory Optimization will not have the dummy work order construct used in ASCP to model shut-down of eAM resources while they are being maintained since the impact on the safety stock calculation will be fairly limited.


Oracle Inventory Optimization Warehouse Capacity Constraints and Cycle Inventory Safety Stock 9-1
9Oracle Inventory Optimization Warehouse Capacity Constraints and Cycle Inventory
Safety Stock
Oracle Inventory Optimization Warehouse Capacity ConstraintsOracle Inventory Optimization has added a new IO constraint set to implement warehouse capacity. These warehouse constraints are considered as hard constraints when combined with budget or capacity constraints. They are considered as soft constraints when combined with service level constraints. These constraints are defined either at the organization level or at the category org. level, depending on the value you specify for the profile option MSR: Warehouse Capacity Granularity.
Organization Level ConstraintsThe organization level Warehouse Capacity Constraint for an organization and each planning time buckets is calculated by taking into consideration the following criteria:
• The organization
• The item in the organization
• The number of projected available units of the item, as calculate by IO, and includeson hand, firm supplies, safety stock, and planned orders
Note: The number on had quantity is used if the plan option Net On Hand is implemented. The onhand quantity is not considered by the plan if Net On Hand is in its NULL default state.
• Item volume as specified in the Item Attributes Mass Maintenance window or in the Organization Item window

9-2 Oracle Inventory Optimization Users Guide
• Capacity for the organization as specified in the Organization Parameters window or uploaded via the TradingPartner.dat file
• Average Cycle Stock of the item
The Average Cycle Stock of the item is calculated by taking into account the following:
• Order quantity of the item, based on the item's demand adjusted for the item order modifiers.
• Order Period of the item as specified in the Item Attributes Mass Maintenance window.
• Average Daily Demand for an item during a planning bucket, as determined bysumming up the item's demand over Safety Stock Days working days, starting with the planning bucket start date, and then dividing by Safety Stock Days. Safety Stock Days is an item attribute.
• Inventory Quantity Increment of the item , as determine by the average demand and the number of days represented by the Inventory Days Increment
• Inventory Days Increment of the item, as specified in the Item Attributes Mass Maintenance window. It may represent the number of days that supply of the item remains on hold for quality testing.
Order Quantity and Effects of Order ModifiersThe IO Planning engine considers the following item order modifiers when calculating Cycle Stock:
• FOQ: Fixed Order Quantity
• MIN: Minimum Order Quantity
• FLM: Fixed Lot Multiplier
If FOQ is defined for an item, then the system ignores the MIN and FLM order modifiers and sets the Order Quantity to FOQ:
Order Quantity = FOQ
If there is no FOQ, then the system calculates the order quantity based on the item's demand with respect to MIN and FLM:
A NULL value for MIN is considered as zero.
A NULL value for FLM is considered as 1

Oracle Inventory Optimization Warehouse Capacity Constraints and Cycle Inventory Safety Stock 9-3
Safety Stock Push Down to Downstream LocationsThe objective of warehouse capacity constraints is to minimize the total system inventory cost. To do this, the IO Postponement algorithm in determines the safety stock levels at downstream warehouses as a result of restricted capacity at their upstream warehouse.
Example:
Consider items A and B at 3 inventory locations:
CP: Central Production Facility (Upstream)
DW1: Distribution Warehouse 1 (Downstream)
DW2: Distribution Warehouse 2 (Downstream)
Customer demands are satisfied from distribution warehouses.
The item costs and unit volumes are:
• Cost: A = $100/Unit, B = $50/Unit
• Volume: A = 50 cu.ft/Unit, A = 100 cu.ft/Unit
Without any warehouse capacity constraints, the optimized inventory levels determined by IO for items A and B at Central Production Facility are:
With a total warehouse capacity of 20,000 cuft for the Central Production Facility (CP), the optimized inventory levels determined by IO for items A and B at each warehouse become:
Based on the warehouse capacity constraints, IO keeps the inventory of higher priced item (A) at the upstream location (CP) to minimize the inventory holding costs.
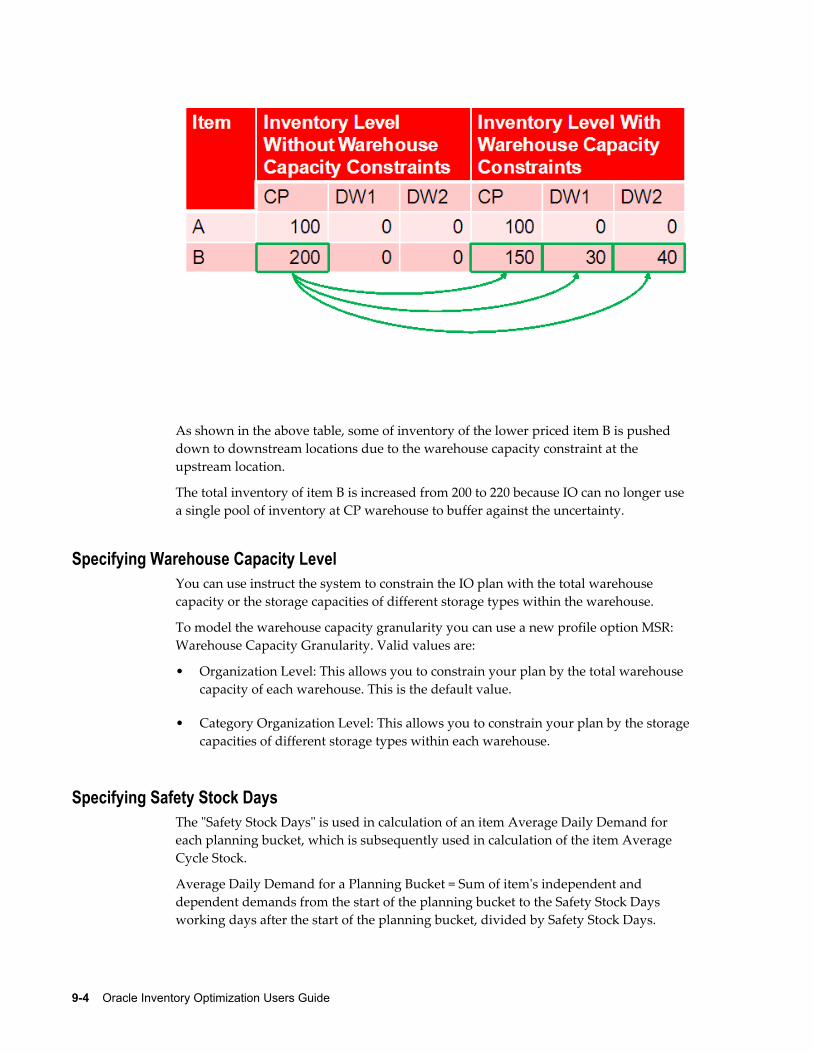
9-4 Oracle Inventory Optimization Users Guide
As shown in the above table, some of inventory of the lower priced item B is pushed down to downstream locations due to the warehouse capacity constraint at the upstream location.
The total inventory of item B is increased from 200 to 220 because IO can no longer use a single pool of inventory at CP warehouse to buffer against the uncertainty.
Specifying Warehouse Capacity LevelYou can use instruct the system to constrain the IO plan with the total warehouse capacity or the storage capacities of different storage types within the warehouse.
To model the warehouse capacity granularity you can use a new profile option MSR: Warehouse Capacity Granularity. Valid values are:
• Organization Level: This allows you to constrain your plan by the total warehouse capacity of each warehouse. This is the default value.
• Category Organization Level: This allows you to constrain your plan by the storage capacities of different storage types within each warehouse.
Specifying Safety Stock DaysThe "Safety Stock Days" is used in calculation of an item Average Daily Demand for each planning bucket, which is subsequently used in calculation of the item Average Cycle Stock.
Average Daily Demand for a Planning Bucket = Sum of item's independent and dependent demands from the start of the planning bucket to the Safety Stock Days working days after the start of the planning bucket, divided by Safety Stock Days.

Oracle Inventory Optimization Warehouse Capacity Constraints and Cycle Inventory Safety Stock 9-5
You specify the Safety Stock Days at the item-org level in the Item Attributes Mass Maintenance window, in the Attribute Name field of the Item attributes available for update field.
Note: The Average Demand (AD) is calculated over the working days based on the Organization Manufacturing Calendar.
You then specify the Simulation Set with the desired values for the Order Modifiers or Safety Stock Days in the Plan Options window. Alternatively, you can define the Safety Stock Bucket Days in the General Planning tab of Oracle Inventory Master Item or Organization Item window.
Note: If you are an E1 user, you can specify this item attribute by populating the following parameter in the Item.dat file and then uploadthis file by means of the Legacy Collections: SAFETY_STOCK_BUCKET_DAYS: This is the item Safety Stock Days.
Defining Item Order ModifiersSpecifying item order modifiers is very similar to specifying Safety Stock Day. Specify the item order modifiers at the item-org level in the Item attribute available for update field of the Item Attributes Mass Maintenance window, under Attribute Name. You then specify the Simulation Set with the desired values for the Order Modifiers or Safety Stock Days in the Plan Options window.
Alternatively you can define the item order modifiers in the General Planning tab of Oracle Inventory Master Item or Organization Item window.
The IO Planning engine considers the following item order modifiers for calculating theAverage Cycle Stock:
• FOQ: Fixed Order Quantity
• MIN: Minimum Order Quantity
• FLM: Fixed Lot Multiplier
If FOQ is defined for an item, then the system ignores the MIN and FLM order modifiers and sets the Order Quantity to FOQ then Order Quantity = FOQ.
f there is no FOQ, then the system calculates the order quantity based on the item's demand with respect to MIN and FLM, then Order Quantity = Smallest Multiple of FLM ≥ Maximum (MIN, Demand).
A NULL value for MIN is considered as zero.
A NULL value for FLM is considered as 1.

9-6 Oracle Inventory Optimization Users Guide
Note: E1 users can define Fixed Order Quantity and Order Multiplier inE1 source and then upload these attributes to planning server via E1-VCP Integration. Alternatively E1 users can specify these item order modifiers by populating the following parameters in the Item.dat file and then upload this file via Legacy Collections FIXED_ORDER_QUANTITY ( the item Fixed Order Quantity) and FIXED_LOT_MULTIPLIER (the item Fixed Lot Multiplier).
Specifying Order PeriodThe Order Period is the interval between orders. It is used in the calculation of the Average Cycle Stock as in the section Warehouse Capacity Constraints. The purpose of the Order Period is to allow the specification of an alternate order quantity that may be larger than the item's FOQ, MIN or FLM attributes. This allows the consideration of both production mechanics (e.g., must process 500 pounds = 1 container at a time) (by means of the item's order modifier attributes) and manufacturing operations constraints(e.g., must produce at least 3 week's worth of a product at a time) (by means of the Order Period) in determining an effective order quantity to be used for cycle stock calculation purposes.
You define the Order Period (OP) item attribute at the item-org level in the Item Attributes Mass Maintenance window in the same way as you defined Safety Stock Days and Order Modifiers.
Note: The attribute value for the Order Period is specified in working days based on the Organization Manufacturing Calendar.
Specifying Inventory Days IncrementThe Inventory Days Increment is an item attribute, which can represent the number of days that supply of an item remains on hold for quality testing.
You define the Inventory Days Increment (IDI) attribute at the item-org level in the ItemAttributes Mass Maintenance window in the same way as you defined Safety Stock Days and Order Modifier
Note: The attribute value for the Inventory Days Increment is specified in working days based on the Organization Manufacturing Calendar.
Defining Warehouse Capacity at the Organization LevelYou define the total volume capacity available in a warehouse in the Inventory Parameters tab of the Organization Parameters window
Oracle Inventory Optimization Warehouse Capacity Constraints and Cycle Inventory Safety Stock 9-7
The value of this field represents the warehouse capacity for the organization as specified in the Organization Parameters window or as uploaded by means of the Trading Partner.dat file.
The planning engine constrains the plan with the warehouse capacities at the org level when the profile option MSR: Warehouse Capacity Granularity is set to "Organization Level".
Note: There are no source fields in E1 for warehouse capacity volume and volume unit of measure. E1 users can specify warehouse capacity volume and its unit of measure by populating the following parametersin the TradingPartner.dat file and then upload this file by means of Legacy Collections MAXIMUM VOLUME (the warehouse capacity volume) and . VOLUME_UOM (the capacity volume unit of measure).
Defining Storage Capacity at the Category LevelTo set up your system to define storage capacity at the category level, follow the steps below:
1. Define a category set and then define your storage types as categories in this category set. For example:
• Category set: ABC
• Category Set: Storage Type
2. Define your storage types as categories in this category set:
• Category: Frozen
• Category: Refrigerated
• Category: Dry
• Category: Other
3. Define capacities for your storage types, using the category set and categories defined in steps 1 and 2..
You can define the capacities for different storage types in a warehouse in the Storage Capacity window under the Setup menu for the Inventory Planner responsibility.
In the Storage Capacity window, you specify capacities for the categories in the category set defined in Step 1 above
You specify capacities for storage types in multiple warehouses (organizations) in the Storage Capacity window.

9-8 Oracle Inventory Optimization Users Guide
Note: You can only define one category set at a time for specifying storage capacity. This means that when you select a category set in the Storage Capacity window and define capacities, selecting another category set will replace the one previously defined.
For example, if you select category set ABC in the Storage Capacity window and define the storage capacity and then alter decide to specify storage capacity in category set DEF, the new definition of capacity in category set DEF replaces the previous definition of capacity in category set ABC. Therefore, there is a maximum of one record associatedto the Storage Capacity window.
Note: If you try to save a new definition of capacity in a different category set, the systems alerts you with a pop-up window, which says "This action replaces storage capacities defined in category set <ABC> do you want to continue? You can respond by clicking the Yes or No button.
The planning engine constrains the plan with the warehouse capacities at the category org level when the profile option MSR: Warehouse Capacity Granularity is set to Category Organization Level.
Note: E1 users can utilize a user-configurable category code to define a Category Set for storage types. Each category code that comes over by means of E1-VCP integration becomes a Category Set, and the values that are held in that category code field for various items become the Categories. Subsequently these attributes can be uploaded to planning server via E1-VCP Integration. Alternatively E1 users can specify category sets and categories in the CategorySet.dat and Category.dat files and then upload these files via Legacy Collections.
Defining Item VolumeYou specify the item volume and its unit of measure at the item-org level in the Item Attributes Mass Maintenance window. You then specify the Simulation Set with the desired values for the item volume in the Plan Options window.
Alternatively you can define the item volume in the Physical Attributes tab of Oracle Inventory Master Item or Organization Item window.
Note: E1 users can define item volume and item volume unit of measure in E1 source and then upload these attributes to planning server via E1-VCP Integration. Alternatively you can specify item volume and its unit of measure by populating the following parametersin the Item.dat file and then upload this file via Legacy Collections:
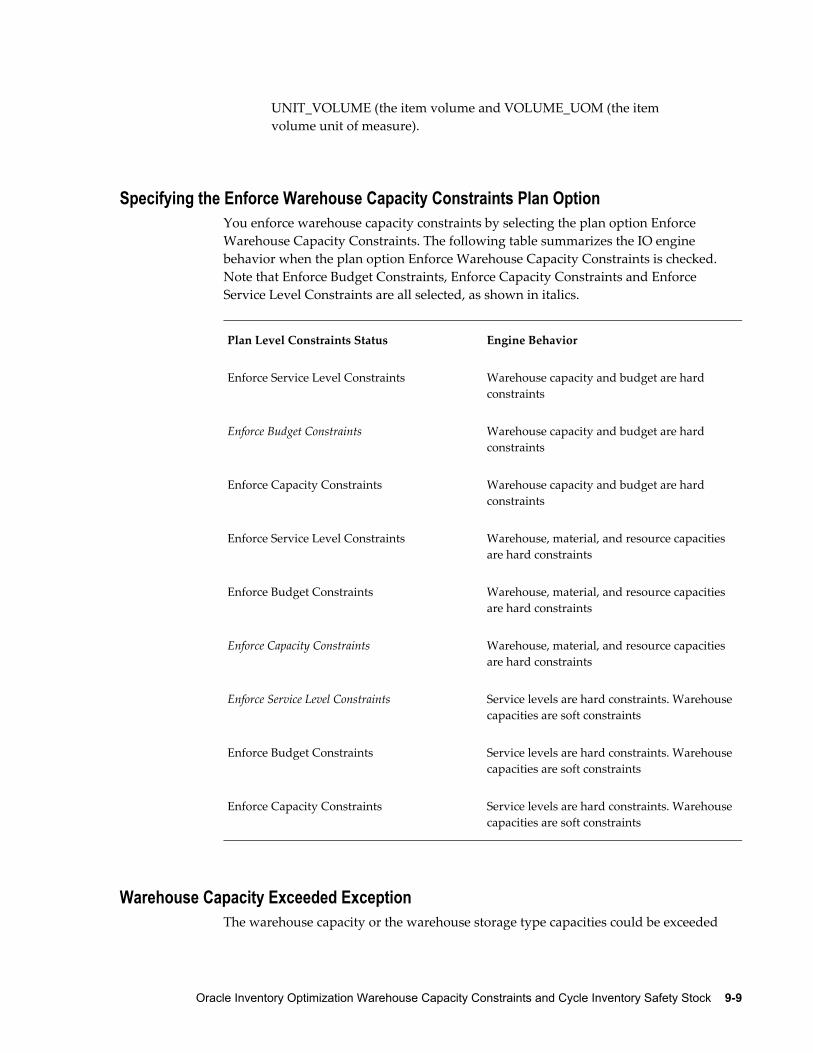
Oracle Inventory Optimization Warehouse Capacity Constraints and Cycle Inventory Safety Stock 9-9
UNIT_VOLUME (the item volume and VOLUME_UOM (the item volume unit of measure).
Specifying the Enforce Warehouse Capacity Constraints Plan OptionYou enforce warehouse capacity constraints by selecting the plan option Enforce Warehouse Capacity Constraints. The following table summarizes the IO engine behavior when the plan option Enforce Warehouse Capacity Constraints is checked. Note that Enforce Budget Constraints, Enforce Capacity Constraints and Enforce Service Level Constraints are all selected, as shown in italics.
Plan Level Constraints Status Engine Behavior
Enforce Service Level Constraints Warehouse capacity and budget are hard constraints
Enforce Budget Constraints Warehouse capacity and budget are hard constraints
Enforce Capacity Constraints Warehouse capacity and budget are hard constraints
Enforce Service Level Constraints Warehouse, material, and resource capacities are hard constraints
Enforce Budget Constraints Warehouse, material, and resource capacities are hard constraints
Enforce Capacity Constraints Warehouse, material, and resource capacities are hard constraints
Enforce Service Level Constraints Service levels are hard constraints. Warehousecapacities are soft constraints
Enforce Budget Constraints Service levels are hard constraints. Warehousecapacities are soft constraints
Enforce Capacity Constraints Service levels are hard constraints. Warehousecapacities are soft constraints
Warehouse Capacity Exceeded ExceptionThe warehouse capacity or the warehouse storage type capacities could be exceeded

9-10 Oracle Inventory Optimization Users Guide
above the available capacity when the Warehouse Capacity Constraints are considered as soft constraints by the planning engine. This can happen when the plan option Enforce Service Level Constraints is checked:
Plan Level Constraints Status Engine Behavior
Enforce Service Level Constraints Service levels are hard constraints. Warehousecapacities are soft constraints.
Enforce Budget Constraints Service levels are hard constraints. Warehousecapacities are soft constraints.
Enforce Budget Constraints Service levels are hard constraints. Warehousecapacities are soft constraints.
The generated exception is called "Warehouse Capacity Exceeded".
When the plan is constrained by the warehouse capacity at the org level, this exception is generated by organization and planning bucket. When the plan is constrained by the warehouse storage type capacity at the category org level, this exception is generated byorganization, category, and planning bucket.
The Exception Details window displays the following fields:
• Exception: Warehouse capacity exceeded
• Organization
• Category: This field is blank if the plan is constrained by the warehouse capacity at the org level.
• Start Constraint Date
• End Constraint Date
• End Constraint Date
• Available Warehouse Capacity
• Load Ratio: This is the ration of Required Warehouse Capacity over Available Warehouse Capacity
Note: The exception is part of "Material and resource capacity" exception group.
Oracle Inventory Optimization Warehouse Capacity Constraints and Cycle Inventory Safety Stock 9-11
Pushing Warehouse Capacity Facts to APCCThe Archive Plan Summary concurrent program is enhanced by adding the following facts and dimensions and pushing them to the APCC repository:
• Required Warehouse Capacity
• Available Warehouse Capacity
• Average Cycle Stock
• Dimensions
• Organization
• Category
Setting Up Warehouse ConstraintsTo set up IO warehouse constraints, follow the steps below:
1. Set up the profile option MSR: Warehouse Capacity Granularity
• Organization level
• Category Organization Level
2. Specify the "Safety Stock Days" at item-org level in the "Item Attributes Mass Maintenance" window (Alternatively you can define this attribute in Oracle Inventory Organization Item window, General Planning tab). This item attribute is used as the time horizon for calculating the Average Demand.
3. Specify item order modifiers at item-org level in the "Item Attributes Mass Maintenance" window (Alternatively you can define item order modifiers in Oracle Inventory Organization Item window, General Planning tab).
4. Specify the "Order Period" at item-org level in the Item Attributes Mass Maintenance window.
5. Specify the "Inventory Days Increment" at item-org level in the Item Attributes Mass Maintenance window.
6. Define the "Warehouse Volume Capacity" in Oracle Inventory (Organization Parameters window, Inventory Parameters tab). This is used if the "Organization Level: is selected in Step 1.
7. Define the storage capacities at the org category level in the "Storage Capacity"
9-12 Oracle Inventory Optimization Users Guide
window under the Setup menu for the Inventory Planner responsibility. The category level capacities are used if the "Category Organization Level: is selected in Step 1.
8. Define the item's "Unit Volume" and item's "Volume Unit of Measure" at item-org level in the "Item Attributes Mass Maintenance" window (Alternatively you can define these attributes in Oracle Inventory Organization Item window, Physical Attributes tab).
9. Enforce Warehouse Capacity Constraints in the Constraints tab of the Inventory Optimization Plan Options window.
Accounting for Cycle Inventory in Safety Stock Calculation 10-1
10Accounting for Cycle Inventory in Safety
Stock Calculation
Introduction to Accounting for Cycle Inventory in Safety Stock Calculation
Enabling Cycle Stock FunctionalityTo enable the ability to calculate safety stock with respect to cycle stock you need to set the profile option MSR: Include Cycle Inventory in Safety Stock Calculations in your personal profile values. Valid values are:
• Yes: Calculate safety stock using cycle stock
• No (default): Do not calculate safety stock using cycle stock
Target Service Level De-ratingTarget Service Level can be de-rated for calculating safety stock requirements based on the cycle inventory levels. The safety stock inventory that is calculated, based on the de-rated service level values in conjunction with the cycle inventory, results in the original target service levels
The optimization engine de-rates the target service level based on the cycle inventory levels. It then uses the de-rated target service level to calculate the safety stock. The engine also de-rates the target service level based on how many buckets of demand the order quantity represents. For example,
• Target service level (TSL): 0.99
• Order quantity (OQ): 100
The demands are:

10-2 Oracle Inventory Optimization Users Guide
• Week 1: 20
• Week 2: 20
• Week 3: 20
• Week 4: 20
Total demand is 100.
The demands consume the order quantity in four weeks. Thus the total demand of Week 1 through Week 4 is:
20+20+30+30=100 Order Quantity
The de-rated service level is: 0.96 [0.994]
The optimization engine de-rates the target service level for each order of the item.
IO calculates "W" dynamically based on an order quantity and future demands that are covered by that order quantity. For example,

Accounting for Cycle Inventory in Safety Stock Calculation 10-3
In the example presented by the above diagram, "W1" is calculated based on the first order quantity (OQ1) and the future demands that consume this order quantity. As a result W1 = 4 since the order quantity of 100 is consumed by demands of time buckets 1 through 4:
100 = 20 + 20 + 30 + 30 W1 = 4
Similarly, "W2" is calculated based on the first order quantity (OQ2) and the future demands that consume this order quantity.
As a result W2 = 3 since the order quantity of 80 is consumed by demands of time buckets 4 through 6:
80 = 30 + 20 + 30 W2 = 3
De-rating Service Level in a Multi-echelon CaseThe calculations for de-rating the service level in a multi echelon case are the same as the single level scenario. The system uses the same calculations after the propagation of the target service levels throughout all supply chain levels.
Requirements Explosion De-ratingDuring the requirements explosion process, the optimization engine performs the follow tasks:
• Calculates the target service levels of components from the target service levels of their assemblies
• De-rates the target service levels
• Calculates the total assembly safety stock

10-4 Oracle Inventory Optimization Users Guide
• Postpones the safety stock to lower levels using the target service levels
• Calculates the de-rated safety stock using the safety stock and the de-rated service levels
Using hypothetical figures for Items A, B, C, D and Target Service Levels, and applying the IO engine, De-rated Safety Stock might look as shown in the table below. Note that the safety stock quantities are lower as a result of de-rating.
Item Target Service Level
De-rated ServiceLevel
Safety Stock De-rated Safety Stock
Total Assembly Safety Stock
100
A 96 94 52
B 97 95 21
D 98 96 27
Total Assembly Safety Stock
80

Service Parts Planning 11-1
11Service Parts Planning
Integration with Oracle Inventory OptimizationField technicians may carry a very large inventory. Technican warehouses can be planned, especially if you want to constrain your inventory plan with inventory budgets. A major consideration in Oracle Inventory Optimization in planning the service parts business is its support of Poisson's distribution for intermittent demand and demand for small quantities.
When the user specifies the forecast method as one of CROSTON for Intermittent, Regression with Seasonal Causal for Intermittent, Multiplicative Monte Carlo Regression with Seasonal Causal for Intermittent, Inventory Optimization infers the distribution of inter arrival times as Poisson. For all other forecast methods, the distribution of inter-arrival times is assumed to be Normal.
The item mass maintenance has an additional item attributes to setup details around demand characteristics to time between two demands:
• The average demand per day, standard deviation, and coefficient of variation for demand
• The mean of inter-arrival time for demands; standard deviation and coefficient of variation for inter arrival time; the inter-arrival time distribution.
The key parameters that need to be defined are: mean inter-arrival times for demand and Intermittent Demand.
In the case of Poisson's distribution, Oracle Inventory Optimization will only use a Simple Poisson Process to model the intermittent demand pattern, which means that the size of an individual order is a constant. In this case, the demand arrival rate can be obtained directly from the item attribute – average inter-arrival time:
For more information on Intermittent Demand, refer to Setting Intermittent Demand in this document.
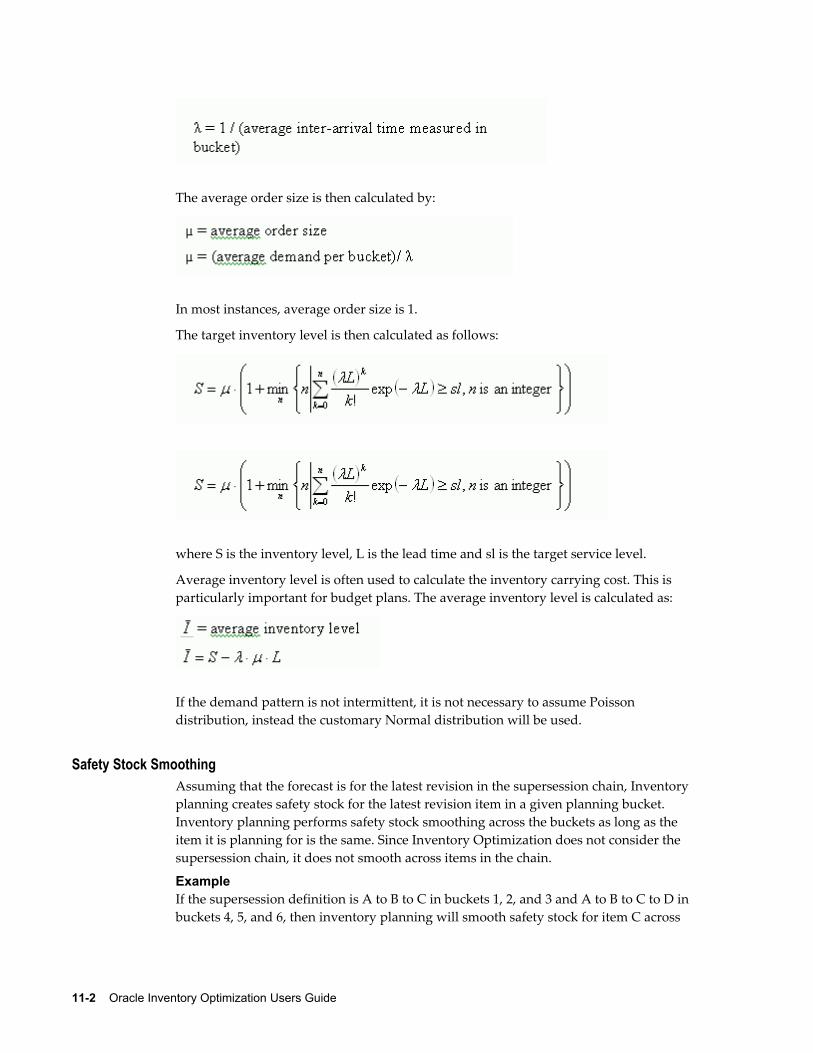
11-2 Oracle Inventory Optimization Users Guide
The average order size is then calculated by:
In most instances, average order size is 1.
The target inventory level is then calculated as follows:
where S is the inventory level, L is the lead time and sl is the target service level.
Average inventory level is often used to calculate the inventory carrying cost. This is particularly important for budget plans. The average inventory level is calculated as:
If the demand pattern is not intermittent, it is not necessary to assume Poisson distribution, instead the customary Normal distribution will be used.
Safety Stock SmoothingAssuming that the forecast is for the latest revision in the supersession chain, Inventory planning creates safety stock for the latest revision item in a given planning bucket. Inventory planning performs safety stock smoothing across the buckets as long as the item it is planning for is the same. Since Inventory Optimization does not consider the supersession chain, it does not smooth across items in the chain.
ExampleIf the supersession definition is A to B to C in buckets 1, 2, and 3 and A to B to C to D in buckets 4, 5, and 6, then inventory planning will smooth safety stock for item C across

Service Parts Planning 11-3
the three buckets and then smooth for D across buckets 4, 5 and 6. But there will be no smoothing between the third and fourth bucket.
After Oracle Inventory Optimization smoothing:

11-4 Oracle Inventory Optimization Users Guide
An improved safety stock rounding heuristic is introduced, particularly to handle the case of intermittent demand.
This modifies the safety stock at each level in the chain. The Process is as follows:
1. Round Up the safety stock at the end item level. Compute the difference between the rounded up safety stock value and the actual value.
2. Subtract the difference from the safety stock at the next level in the supply chain. Round Up the resulting safety stock and compute the difference as state in step 1.
3. The process is repeated all the way up the supply chain.
In traversing the supply chain, the logic ensures that the sum total of the safety stock across the echelons is equal to the rounded up integer value of the computed safety stock.
The improved heuristic is controlled by the item attribute ROUND. If this is set to 'Yes', the improved heuristic is invoked. If 'No,' safety stock rounding is based on the older heuristic. The Item-Attribute ROUND is available both in the Item-Org and Item-Zone tabs of the Item Attribute Mass Maintenance window.
For intermittent demand, Inventory Optimization generates a single value of safety stock so that the smoothing parameters do not have a performance impact. However, if there is a user specified safety stock value, it overrides the Inventory Optimization recommended values.
Budget ConstraintsInventory planning currently supports budget constraints when prescribing the echelonstocking recommendations.
The technician organizations for planning, including the inventory plan is not considered. Hence for budget constraints, it is recommended that the budget to be considered in Inventory Optimization should include the inventory budget for the

Service Parts Planning 11-5
entire supply chain, except the field technician organizations.
Plan Options Simulation SetThe Inventory planning plan option includes the simulation set. When a simulation set is provided, planning uses the simulation set to determine the item attributes. If the value of the simulation set is 'NULL" then planning uses the collected data.
Evaluation of Multiple Service Levels Specified on Different FormsService levels can be specified:
• at the plan level
• in item simulation sets
• in service level sets
Different service levels apply according to the following rules:
1. A service level specified in the Plan Options form (and enforced by checking the Enforce Plan Level defaults check box) overrides any other value. If not enforced, then this service level serves as the default value for items where service level is notset by any other means.
2. If the service level is not enforced through Plan Level defaults, and if the service level for an item-organization combination is specified in the Item Simulation Set, then the value from the Item Simulation Set applies for the plan run.
3. If the service level is not enforced through Plan Level defaults, and no service level is set in the Item Simulation Set, but service levels are set using the Service Level Set, then the service levels from the Service Level Set are used in the plan run.
There is a specific hierarchy in which service level values default in Oracle Inventory Optimization if entered as part of the 'Service Level Set'. In general, if service level is not provided at a lower level, then the logic checks for service level default values from higher (more general) levels. For example, service level is not provided at the demand class level. Then logic looks in 'category', and then 'item-instance-organization' level, and so on.
4. If service levels are specified at lower levels, then Inventory Optimization logic picks up service level from those lower levels. The only exception to this rule is when you use plan level enforcement. If you specify the service level in plan options (plan level enforcement), Oracle Inventory Optimization logic always uses the service level from plan option, even if service levels are specified at lower levels using a 'Service Level Set.'
The following matrix helps explain the service levels considered by the planning engineas applicable when service levels are enforced (ESL). Note in plans that enforce capacityconstraints (ECC), or enforce budget constraints (EBC), the service level achieved is an

11-6 Oracle Inventory Optimization Users Guide
outputof the plan rather than an input.
Service level entered at plan option (Plan level defaults)
Enforce plan level default
Service levels specified in Item Simulation Set
Service levels entered via service level set
Expected behavior
Yes Yes Yes or No Yes or No Service level requirement for all the demands is taken from service level that you enter in at plan option.
Yes No Yes Yes or No Service level requirement is picked up from the Item Simulation Set if specified there orfrom collected data. If missing then the value set in the ServiceLevel Set is used.If none available then the value set for plan level defaults are used.
Yes No No Yes Service level youspecify in the 'service level set' will be used. If no service level can be inferred for an item then plan level defaults are used.

Service Parts Planning 11-7
No (Null) No Yes Yes or No Service level requirement is inferred from theItem Simulation Set. If no service level can be inferred from theSimulation Set then it is inferredfrom the Service Level Set. If service levels cannot be inferred from Service Level Seteither then a default service level of 50% is assumed.
Tip: In EBC plans, the main task is to figure out the achievableservice levels given a budget. The service level to be achieved is not specified in this case (EBC plans). However, EBC plans require you toprovide a target service level that needs to be achieved for all items in a plan, such target service level is entered at

11-8 Oracle Inventory Optimization Users Guide
plan option. The default value for the target is considered to be 50%.
No (Null) No No Yes or No Service Levels specified in the Service Level Setare used. If none then a default Target Service Level of 50% is assumed.
No (Null) Yes Yes Yes or No Plan will use the service levels specified in the Item Simulation Set or collected data. If nothing is specified in the Simulation Set, the Service Levels from the Service Level Setare used. If none then a default service level of 50% is assumed.
No (Null No No Yes Plan will use the service levels specified in the service level set.
No (Null) No No No Plan will interpret the service level requirement at 50%, in other words, no safety stocks are calculated.

Service Parts Planning 11-9
Defaulting Service Levels
As mentioned previously, there is a specific hierarchy in which service levels are defaulted in Oracle Inventory Optimization if entered as part of 'service level set'. In general, if service level is not provided at a lower level, logic checks for defaulting service levels from the higher level. For example, if service level is not provided at demand class level, logic looks for 'category', 'item-instance-organization' level, and so on.
If service levels are specified at lower levels, Oracle Inventory Optimization logic picks up service level from lower levels. The only exception to this rule is when you use plan-level enforcement. If you specify the service level in Plan Option (plan level enforcement), Oracle Inventory Optimization logic always picks up service level from the Plan Options, even if service levels are specified at lower levels using 'service level set'.

Cross-Product Integration 12-1
12Cross-Product Integration
This chapter details the integration between Oracle Inventory Optimization and Oracle Demand Planning.
This chapter covers the following topics:
• Integration with Demand Planning
Integration with Demand PlanningOracle Inventory Optimization requires inputs such as demand forecast and demand variability from Oracle Demand Planning. This chapter also briefs how the inventory planning engine spreads forecast that it receives from Oracle Demand Planning.
Uncertainty in demand influences inventory optimization decisions. For example, you may increase the level of your safety stock to satisfy demand spikes during a specific time period. You may want to consider the distribution of demand over a time period or an order replenishment lead-time to drive safety stock calculations.
Oracle Inventory Optimization uses the following inputs from Oracle Demand Planningto plan optimal levels of inventory:
• Demand forecast
• Demand variability
Forecast Accuracy MeasuresAn estimate of demand variability indicates the forecast accuracy, also referred to as theforecast error. Oracle Demand Planning calculates the following to estimate the standard deviation of forecast error:
• Mean absolute deviation
• Mean absolute percentage error

12-2 Oracle Inventory Optimization Users Guide
Based on the demand variability information from Oracle Demand Planning, Oracle Inventory Optimization estimates the safety stock required to avoid stock out. Oracle Advanced Supply Chain Planning uses the demand variability information to suggest the optimal quantity that you need to order and the time when you need to place the order. For more information on mean absolute deviation and mean absolute percentage error, see The Organizations Tabbed Region, page 3-9.
Business Process FlowThe following illustration represents flow of information between Oracle Demand Planning and Oracle Inventory Optimization.
Business Process Flow
You need to perform steps 1 through 5 using Oracle Demand Planning. Perform steps 6 and 7 using Oracle Inventory Optimization. The following steps summarize the business process flow depicted in the illustration:
• Step 1: In Oracle Demand Planning, you can use the Demand Planning System Administrator responsibility to specify an output accuracy measure (mean absolute deviation or mean absolute percentage error) for each scenario. In addition, you canspecify the output levels for each scenario based on your inventory planning requirements.
• Step 2: You can use the Demand Planning System Administrator responsibility, the Demand Planning Manager responsibility, or the Demand Planners responsibility to select an accuracy measure (mean absolute deviation or mean absolute percentage error) that is associated to statistical forecast. Oracle Demand Planning calculates the specified accuracy measure when it generates statistical forecast.

Cross-Product Integration 12-3
• Step 3: You can select a forecast and the levels at which Oracle Demand Planning needs to calculate the forecast accuracy measure. You can also select a comparison measure to calculate the forecast accuracy measure.
• Step 4: You can view the properties of accuracy methods and scenarios. Oracle Demand Planning compares the demand forecast with historical data to calculate forecast accuracy. However, as the demand forecast is futuristic, it is unlikely to have any common time period to compare against with the historic data. Therefore, you can modify the forecast accuracy measures in Oracle Demand Planning.
• Step 5: Using the Demand Planning Manager and Demand Planner responsibilities, you can submit the forecast accuracy measure and the forecast for each scenario at specific output levels. When you submit the forecast accuracy measure, the Oracle Demand Planning Express pushes the information to Oracle Demand Planning Server. Oracle Demand Planning Server shares this information with Oracle Inventory Optimization. The forecast accuracy measure is identified by a scenario name, a forecast name, and a measure type (mean absolute deviation or mean absolute percentage error). Oracle Inventory Optimization requires forecast accuracy measures at the following levels:
• Item or product in the Product dimension
• Organization in the Ship From Location dimension
• Day, week, or manufacturing in the Time dimension
• Highest level such as All Geography and All Sales Channel for all other dimensions
• Step 6: In Oracle Inventory Optimization, you can use the Inventory Planners responsibility to select forecasts and demand variability for planning inventory. You can select the demand variability as a plan option in Oracle Inventory Planning. Alternatively, if you want to run simulations of an inventory plan using different percentage demand variability values for different scenario sets, you can specify a default demand variability percentage at the scenario set level. The following are characteristics of a scenario set:
• You can deploy only one type of demand variability (accuracy metric from Oracle Demand Planning, user-defined probability, or user-defined mean absolute % error) in a scenario set.
• The list of values for the type of demand variability depends on the forecast you select. For example, Accuracy Metric appears as a type of demand variability only when you select a scenario from Oracle Demand Planning.
• Oracle Inventory Optimization uses the forecast accuracy information that Oracle Demand Planning provides to calculate the safety stock.
12-4 Oracle Inventory Optimization Users Guide
• If you select a specific type of demand variability for a scenario set, the scenariosets having the same scenario set number acquire the type of demand variability. For example, if you select Accuracy Metric as the type of demand variability for a scenario set, it applies to all scenario sets that have the same scenario set number. In addition, the Mean % Error and Probability fields for the scenario sets become disabled.
• Step 7: You can launch the inventory plan in Oracle Inventory Optimization to determine the standard deviation and the safety stock.
Forecast SpreadingIf Oracle Inventory Optimization receives a period level forecast from Oracle Demand Planning, the inventory planning engine spreads the forecast to weekly forecasts of equal sizes. Oracle Inventory Optimization spreads forecasts to prevent safety stock spikes.

Profile Options A-1
AProfile Options
This appendix covers the following topics:
• Profile Options Introduction
• Special Considerations
• Inventory Optimization Profile Options
Profile Options IntroductionThere are different categories of profile options that relate to the Oracle Advanced Planning suite:
• MRP profile options
• MSC profile options
• MSD profile options
• MSO profile options
• MSR profile options
• INV profile options
Oracle Inventory Optimization uses the MSR profile options. In addition, Oracle Inventory Optimization may use MRP, MSC, and MSO profile options. For more information on other profile options, see Oracle Advanced Supply Chain Planning Implementation and User's Guide.
The following sections contain tables which describe each profile option.

A-2 Oracle Inventory Optimization Users Guide
Special Considerations
Automatic CalculationsWhen the Default Value of a profile option states that it is automatically calculated, this means that the Planning Engine determines the default value of that particular profile option. These profile options are included in this appendix for information purposes only. If you must change these profile option values, do so only after consulting Oracle Development and Oracle Support.
Flexfield AttributesFlexfield attribute profile options store the name of the flexfield column that contains the value in the corresponding table. For example, if the Aggregate Resource Name is stored in column ATTRIBUTE1, the profile option MSC: Aggregate Resource Name Flexfield Attribute will contain the value 1.
This setup is performed only during an Oracle Applications installation. Do not modify it unless absolutely necessary.
Floating Point PrecisionCertain quantities used by Oracle Advanced Supply Chain Planning have fractional values. For internal processing purposes these quantities must have integer values. To resolve this problem, floating-point precision profile options act as internal multipliers. When a fractional quantity is encountered it is multiplied by the appropriate floating-point precision profile option value, and the resulting integer is processed by the Planning Engine.
There are several floating-point precision profile options. This enables greater flexibilityin controlling the precision with which to consider each quantity. It also provides more flexibility to avoid numerical overflow on 32-bit platforms where the each equivalent integer processed by the Planning Engine cannot exceed 2.1 x 10⁹. The floating-point precision profile options are: Floating Point Precision for Usages in Routing, Floating Point Precision, Floating Point Precision for Transportation Capacities (Weight and Volume), Floating Point Precision for Planning Bucket Efficiency.
Inventory Optimization Profile OptionsThe following table lists and defines the MSR profile options in Oracle Inventory Optimization:

Profile Options A-3
Profile Option Name Valid Values Default Value Description
MSC: IO_UI_PERSETNAME
N/A N/A Use this profile option to specify the period set name that is being used if it is any value other than 'Accounting'. The profile value hasno validation and the text has to beentered manually.
MSR: Budget Category Set
Null or any category sets
Null Use this profile option to specify the category set that includes all items that follow a budget.
Valid values are:
- Null: Budget constraints are not applied to any item in the plan.
- Any category set: Specify the category set that contains all items following a budget. Ensure that you have included all items that follow the budget within the category set.
MSR: Postponement Factor
Integers >= 0 10 Specifies maximum depth in the bill of materials and sourcing tree to which uncertainty must be postponed.
MSR: Safety Stock Holding Strategy
Destination Organization or Source Organization
Source Organization
Specifies where safety stock should be held when the cost is thesame for an item in the destinationorganization and a source organization. Valid values are:
- Destination Organization: The safety stock is held at the destination organization.
- Source Organization: The safety stock is held at the source organization.

A-4 Oracle Inventory Optimization Users Guide
Profile Option Name Valid Values Default Value Description
MSR: Probability Distribution Type
Cumulative Probabilities/ Probabilities
Probabilities Determines probability distribution type associated with forecast sets as input to Oracle Inventory Optimization. Valid Values are:
• Probabilities: Demand uncertainty is stated in terms of a (non-cumulative) probability distribution.
• Cumulative Probabilities: Demand uncertainty is stated in terms of a cumulative probability distribution.

Glossary-1
Glossary
A
...
absolute error
Magnitude of forecast errors, actual less forecast values, without regard to sign.
accuracy measures
In Oracle Demand Planning and Oracle Inventory Optimization, a statistical data element that estimates the accuracy of a comparison between two measures. In Oracle Inventory Optimization, accuracy measures include MAD and MAPE.
See also Mean Absolute Deviation (MAD) and Mean Absolute Percent Error (MAPE).
Analysis Workbench
You can use the Analysis Workbench to analyze inventory plans. You can analyze service levels, profits, most profitable service levels, inventory levels, postponement, and budget. The Analysis Workbench facilitates a graphical and tabular comparison between multiple inventory plans.
API
An Application Programming Interface (API) is a published interface to accomplish a business or scientific function. An API defines a contract to its users by guaranteeing a published interface but hides it's implementation details.
assignment hierarchy
You can assign sourcing rules and bills of distribution to a single item in an inventory organization, all items in an inventory organization, categories of items in an inventory organization, a site, and an organization. These assignments have an order of precedence relative to one another.
assignment set
A group of sourcing rules and/or bills of distribution and a description of the items and/or organizations whose replenishment they control.

Glossary-2
B
...
budget
The amount of money allotted for inventory operations for a specific time period. You can define budgets at various levels such as plan, organization, and category.
C
...
constrained forecast
Unconstrained forecasts are generated from historical data or by individuals without regard to limitations. For example, a retailer with no knowledge of manufacturing capability or a manufacturer without knowledge might generate an unconstrained forecast. When an unconstrained forecast is appropriately modified based on knowledge of constraints, it is known as a constrained forecast. See also unconstrained forecast.
D
...
discrete job
Discrete jobs are used to manufacture assemblies using specific materials and resources within a start and end date. (Also known as work order or assembly order).
E
...
end item
Any item that can be ordered or sold.
F
...
forecast
An estimate of future demand on inventory items. A forecast contains information on the confidence factor and any specific customer information. You can assign any number of inventory items to the forecast and use the same item in multiple forecasts. For each inventory item, you can specify any number of forecast entries.
forecast error
Each forecast that Oracle Demand Planning generates includes an estimate of the
Glossary-3
forecast error. The types of errors computed are Mean Absolute Percent Error (MAPE) and Mean Absolute Deviation (MAD). See also Mean Absolute Percent Error (MAPE) and Mean Absolute Deviation (MAD).
forecasting methods
Refers to the statistical methods that you can use to generate forecasts in Oracle Demand Planning. These are Linear Regression, Polynomial Regression, Exponential Fit, Logarithmic Fit, Asymptotic fit, Exponential Asymptotic Fit, Single Exponential Smoothing, Double Exponential Smoothing, and Holt-Winters. As an alternative to selecting a specific method, you can allow the system to automatically determine the best-fit method.
I
...
Independent Demand
Demand for an item unrelated to the demand for other items.
M
...
Make Order
An order to manufacture an item. The following Oracle Applications entities are make orders:
- Batches (Oracle Process Manufacturing)
- Discrete jobs (Oracle Work in Process)
- Flow schedules (Oracle Flow Manufacturing)
- Jobs (Oracle Project Manufacturing)
- Jobs (Oracle Shopfloor Management (OSFM))
Mean Absolute Deviation (MAD)
A performance metric for evaluating forecast accuracy. , where N is the total number of observations, the summation is for all N observations, Y represents the observed data atany time, and Z is the corresponding forecast data.
Mean Absolute Percent Error (MAPE)
A performance metric for evaluating forecast accuracy, where N is the total number of observations, the summation is for all N observations, Y represents the observed data atany time, and Z is the corresponding forecast data.

Glossary-4
O
...
Optimized Plan
In this plan, you can generate an optimized and executable plan based on plan objectives as well as material, resource, and transportation constraints.
P
...
planned order
A suggested quantity, release date, and due date that satisfies net item requirements.
Planner Workbench
You can use the Planner Workbench in Oracle Advanced Supply Chain Planning to act on recommendations generated by the planning process for a plan. You can implement planned orders as discrete jobs or purchase requisitions, maintain planned orders, reschedule scheduled receipts, and implement repetitive schedules. You can choose all suggestions from an MRP plan, or only those that meet a certain criteria. In Oracle Inventory Optimization, Planner Workbench is used to perform tasks such as setting upitem attributes, setting up supply chain BOM, and analyzing time-phased safety stocks.
Planning Exception Set
An item attribute the planning process uses to decide when to raise planning exceptionsfor the item.
planning horizon
The amount of time a master schedule extends into the future.
planning time bucket
A time period into which the planning engine accumulates time-phased data and nets (performs the gross to net explosion on) that data as a unit. The planning engine plans in planning time buckets of minutes, hours, days, weeks, and periods (months).
You specify the types and number of planning time buckets for each plan when you establish its plan options; typically, you specify smaller buckets closer in and larger buckets farther out.
For example, for a weekly bucket, the planning engine accumulates all of the time-phased data that falls within that week and nets that data such that demand and supply are balanced for the week without attempting to balance for each day, hour, andminute.
The time-phased data included all demands (which are due at the end of the week), all supplies, and all capacities (material and resource).

Glossary-5
A planning time bucket is different from a time bucket used for reporting purposes; youuse that type of bucket to specify a number of days of plan data summarized into a display.
probability
The confidence factor for a demand variability forecast to be accurate. If you are 100% confident about a forecast, then its probability is 1. You can choose to specify a probability value if demand variability information is not available from Oracle Demand Planning or when you want to run quick variability simulations.
S
...
safety stock
Quantity of stock planned to have in inventory to protect against fluctuations in demand and/or supply.
Safety Stock (item attribute)
An item attribute the planning process uses to decide whether to use fixed or dynamically calculated safety stock quantities when planning material requirements forthe item. A value of MRP-planned percent means the planning process plans to safety stock quantities it calculates dynamically as a user-defined percentage of the average gross requirements for a user-defined number of days.
The user-defined percentage is defined by the value you enter for the Safety Stock Percent attribute for the item. For discretely planned items, the user-defined number of days is defined by the value you enter for the Safety Stock Bucket Days attribute for the item. For repetitively planned items, the planning process uses the repetitive planning period rather than Safety Stock Bucket Days. These safety stock quantities are dynamic in that they vary as a function of the average gross requirements calculated by the planning process for the item. A value of Non-MRP planned means the planning process plans to safety stock quantities calculated and maintained in Inventory. These safety stock quantities are fixed in that the Snapshot loads them from Inventory before the planning process and they do not vary unless they are recalculated in Inventory.
Safety Stock Bucket Days
An item attribute the planning process uses when you set the Safety Stock attribute for the item to MRP-planned percent. The planning process dynamically calculates safety stock quantities for the item by multiplying the average gross requirements for the item,over the time period defined by the value you enter for Safety Stock Bucket Days, by thevalue you enter for Safety Stock Percent.
Safety Stock Percent
An item attribute the planning process uses when you set the Safety Stock attribute for the item to MRP-planned percent. The planning process dynamically calculates safety

Glossary-6
stock quantities for the item by multiplying the average gross requirements for the item,over the time period defined by the value you enter for Safety Stock Bucket Days, by thevalue you enter for Safety Stock Percent.
safety stock quantity
The quantity suggested by MRP as additional supply needed for safety stock. This quantity can change according to an effective date set in Inventory.
sourcing rule
Specifies how to replenish items in an organization, such as purchased items in plants.
T
...
time bucket
A unit of time used for defining and consuming forecasts. A bucket can be one day, one week, or one period.
U
...
unconstrained plan
In this plan, the system performs traditional MRP type planning and assumes infinite material availability and resource capacity. Statements of material availability and resource capacity are used to generate exceptions. Demand priorities are included during the planning run to determine the appropriate pegging relationships between supply and demand.
unconstrained forecasts
Forecast that is generated from historical data or by individuals without regard to limitations. For example, a retailer with no knowledge of manufacturing capability or a manufacturer without knowledge of customer demand might generate an unconstrained forecast. See also constrained forecast.
user-specified safety stock
The safety stock value that you determine based on your requirements, experience, or parameters that the inventory planning engine cannot model. If you have provided the user-specified safety stock value, Oracle Inventory Optimization considers this value as the safety stock for processing.

Index-1
Index
Aaccessing inventory plan options, 3-2Analysis Workbench
overview, 6-1using, 6-3
analyzingimpact of user-specified safety stock, 7-7inventory budgets, 6-25inventory plans, 6-2postponement implementation, 6-14revenue and cost breakdown, 6-29safety stocks, 6-18service level breakdown, 6-36service level versus profit, 6-7
asset intensive planningcomputing total demand, 8-2eAM activity definition, 8-4IMM rebuild activity, 8-8introduction, 8-1process overview, 8-1
assigningforecast sets to scenario sets, 3-16forecasts to scenario sets, 3-16
BBIS key performance indicators, 1-7budget constraints
enforcing, 3-22business process flow
between Oracle Demand Planning and Oracle Inventory Optimization, 12-2
Ccalculating safety stock
introduction to cycle inventory, 10-1capacity constraints
enforcing, 3-22computing total demand
asset intensive planning, 8-2constraints
enforcing, 3-19Constraints tabbed region, 3-19copying inventory plans, 2-3creating
preference sets, 6-5cumulative demand distribution, 3-13cycle inventory
calculating safety stock, 10-1enabling cycle stock functionality, 10-1requirements explosion de-rating, 10-3target service level de-rating, 10-1
Ddefining
budgetsprerequisites, 4-12
inventory budget, 3-25safety stock level, 7-1target service level
plan, 4-2, 4-2user-specified safety stock, 4-12
defining item order modifierswarehouse capacity constraints, 9-5

Index-2
defining item volumewarehouse capacity constraints, 9-8
defining storage capacity at the category levelwarehouse capacity constraints, 9-7
defining warehouse capacity at the organization level
warehouse capacity constraints, 9-6demand distribution, 3-13demand probability, 3-13demand schedule from an inventory plan, 3-12demand schedules, 3-19demand source, 3-12demand sources, 3-19demand variability
setting, 3-12determining
plan start date, 3-7
EeAM activity definition
asset intensive planning, 8-4editing
preference sets, 6-5enabling cycle stock functionality
cycle inventory, 10-1enforcing
budget constraints, 3-22budgets, 4-12capacity constraints, 3-22constraints, 3-19service level constraints, 3-22
exception messagesviewing, 5-16
Fflexfield attributes, A-2forecast accuracy
measurement, 12-1forecasts, 3-13forecast set, 3-13forecast spreading, 12-4future plan start date, 3-7
Ggenerating
safety stock level, 7-1
HHorizontal Plan window, 5-11
IIMM rebuild activity
asset intensive planning, 8-8inflated safety stock, 7-2inputs to Oracle Inventory Optimization, 1-5integrating Oracle Inventory Optimization and Oracle Demand Planning, 12-1intermittent demand
setting, 4-24inventory budget
defining, 3-25enforcing, 4-12
inventory budget analysis, 6-25Inventory Budget Analysis page, 6-26inventory plan
copying, 2-3defining target service level, 4-2, 4-2prerequisites for running, 2-1running, 2-1
Inventory PlanItem Attribute Simulation Sets, 4-7
inventory plan optionsaccessing, 3-2overview, 3-2setting up, 3-2
Inventory Plansanalyzing, 6-2
item purchase price by suppliersetting, 4-22viewing, 4-22
KKey Indicators window, 5-8key performance indicators, 1-7
LLead time variability
manufacturing for an item, 4-17
M
Index-3
Main tabbed region, 3-4manufacturing lead time variability
for a plan, 4-17material/resource availability
viewing, 5-15measuring forecast accuracy, 12-1MSC: IO_UI_PERSETNAME, A-3MSR: Budget Category Set, A-3MSR: Postponement Factor, A-3MSR: Probability Distribution Type, 3-13, A-4MSR: Safety Stock Holding Strategy, A-3MSR Profile Options, A-2
OOracle Business Intelligence System, 1-7Oracle Inventory Optimization
business process, 1-3Evaluation of multiple service levels, 11-5inputs to, 1-5integrating with Oracle Service Parts Planning, 11-1integration with Oracle Demand Planning, 12-1output from, 1-6overview, 1-1setting up, 1-4
organization level constraintsintroduction, 9-1
Organizations tabbed region, 3-9output from Oracle Inventory Optimization, 1-6overview
inventory plan options, 3-2viewing output, 5-1
Ppage
Inventory Budget Analysis, 6-26Postponement Analysis, 6-14Preferences, 6-5Safety Stock Analysis, 6-21Service Level Breakdown, 6-37Service Level versus Profit Analysis, 6-8
penalty costssetting, 4-21
penalty factors, 3-5performance indicators
setting, 4-23viewing, 5-7
Personal Profile Values window, 4-12plan end date, 3-9planned items
selecting, 3-4Planned Items
ABC Classification, 3-3planning
safety stock for components, 7-1safety stock for co-products, 7-1
planning safety stock forPlan Options window, 3-2
Main tabbed region, 3-4Organization tabbed region, 3-9
plan start date, 3-7plan start date in future, 3-7Postponement Analysis page, 6-14postponement implementation analysis, 6-14preference sets
creating, 6-5editing, 6-5
Preferences page, 6-5probability data
how it's used, 3-15probability of forecasts, 3-13profile options, A-1
automatic calculations, A-2flexfield attributes, A-2floating point precision, A-2introduction, A-1
Profile Options MSR:Postponement, 6-14pushing warehouse capacity facts to APCC
warehouse capacity constraints, 9-11
Rrequirements explosion de-rating
cycle inventory, 10-3Resource Availability Summary window, 5-15resource requirements
viewing, 5-14Resource Requirements window, 5-15revenue and cost breakdown analysis, 6-29reviewing exception messages, 5-16running inventory plans, 2-1
prerequisites, 2-1

Index-4
Ssafety stock
user-specified, 7-5viewing, 5-10
Safety Stock Analysis page, 6-21safety stock change interval, 7-2safety stock change threshold interval, 7-2safety stock inflation, 7-2safety stock level
days of supply, 7-4defining, 7-1generating, 7-1
safety stock push down to downstream locationswarehouse capacity constraints, 9-3
safety stocks analysis, 6-18safety stock smoothing, 7-2scenario set, 3-13selecting planned items, 3-4service level breakdown analysis, 6-36Service Level Breakdown page, 6-37service level constraints
enforcing, 3-22service level versus profit analysis, 6-7Service Level versus Profit Analysis page, 6-8setting
item purchase price by supplier, 4-22penalty costs, 4-21performance indicators, 4-23supplier lead time variability, 4-19target service levels, 4-2
setting demand variability, 3-12setting up
inventory plan options, 3-2user-specified safety stock, 7-6
smoothening safety stock, 7-3Specify Budget window, 4-13specifying
demand schedules, 3-19sources of demand, 3-19
specifying inventory days incrementwarehouse capacity constraints, 9-6
specifying order periodwarehouse capacity constraints, 9-6
specifying safety stock dayswarehouse capacity constraints, 9-4, 9-4
specifying the enforce warehouse capacity constraints plan option
warehouse capacity constraints, 9-9stochastic optimization technology, 1-2Supplier Capacity window, 4-22supplier lead time variability
setting, 4-19Supply/Demand window, 3-13, 5-8
Ttarget safety stock
viewing, 5-10target service level de-rating
cycle inventory, 10-1target service levels
setting, 4-2time-phased supply and demand
viewing, 5-8
Uuser specified safety stock
defining, 4-12user-specified safety stock, 7-5
analysis, 7-7setting up, 7-6viewing, 7-7
Vviewing
exception messages, 5-16item purchase price by supplier, 4-22material/resource availability, 5-15plan end date, 3-9resource requirements, 5-14safety stock, 5-10target safety stock, 5-10time-phased supply and demand, 5-8user-specified safety stock, 7-7
Wwarehouse capacity constraints
defining item order modifiers, 9-5defining item volume, 9-8defining storage capacity at the category level,9-7

Index-5
defining warehouse capacity at the organization level, 9-6introduction, 9-1organization level constraints, 9-1pushing warehouse capacity facts to APCC, 9-11safety stock push down to downstream locations, 9-3specifying inventory days increment, 9-6specifying order period, 9-6specifying safety stock days, 9-4, 9-4specifying the enforce warehouse capacity constraints plan option, 9-9warehouse capacity exceeded exception, 9-9
warehouse capacity exceeded exceptionwarehouse capacity constraints, 9-9
warehouse constraintssetting up, 9-11
weighed average calculation, 3-16window
Horizontal Plan, 5-11Key Indicators, 5-8Personal Profile Values, 4-12Plan Options, 3-2Resource Availability Summary, 5-15Resource Requirements, 5-15Specify Budget, 4-13Supplier Capacity, 4-22Supply/Demand, 5-8