Oracle Business Intelligence Enterprise Edition 10.1.3.4 · PDF fileOracle BI Enterprise...
155
Oracle Business Intelligence Enterprise Edition 10.1.3.4.1 By, Sujitha & Satish
Transcript of Oracle Business Intelligence Enterprise Edition 10.1.3.4 · PDF fileOracle BI Enterprise...
Oracle Business Intelligence
Enterprise Edition
10.1.3.4.1
By,
Sujitha & Satish

Table Of Contents
1.Introduction to BI
2.Introduction to OBIEE
3.OBIEE Architecture
4.Creation Of Repository Project Design(RPD)
-Physical Layer
-Business Model and Mapping Layer
-Presentation Layer
5.Answers
6.Different Types of Views
7.Navigation between reports
8.Top N analysis
9.Dashboards
-Dashboard Creation
-Dashboard Navigation
-Dashboard Editing
10.Variables
-Session Variables
-System Variables
-Non-System Variables
-Repository Variables
-Dynamic Variables
-Static Variables
11.Security
-Object-Level Security
-Data-Level Security
Oracle BI Enterprise Edition
BUSINESS INTELLIGENCE
Definition : Business intelligence (BI) is a broad category of applications and technologies for
gathering, storing, analyzing, and providing access to data to help enterprise users make better business
decisions.
BI applications include the activities of decision support systems, query and reporting, online
analytical processing (OLAP), statistical analysis, forecasting, and data mining.
Business intelligence applications can be:
Mission-critical and integral to an enterprise's operations or occasional to meet a special
requirement
Enterprise-wide or local to one division, department, or project
Centrally initiated or driven by user demand
ORACLE BI ENTERPRISE EDITION
Definition : Oracle Business Intelligence Suite Enterprise Edition (Oracle BI EE ) is a comprehensive
suite of enterprise BI products that delivers a full range of analysis and reporting capabilities.
Oracle BI EE provides intelligence and analytics empowering the largest communities with complete
and relevant insight.
Benefits of OBIEE :
Comprehensive BI functionality built on a unified infrastructure:
Includes interactive dashboards
Full ad hoc queries and analysis
Proactive intelligence delivery and alerts
Enterprise and financial reporting
Online analytical processing (OLAP) analysis and presentation
High-volume production reporting
Real-time predictive intelligence
Disconnected analytics as well as integration with Microsoft Office

OBIEE ARCHITECTURE
COMPONENTS
Oracle BI Server :
The core component of the OBIEE stack is the BI Server. The server accepts logical SQL requests
submitted against the published subject areas and translates them to physical SQL queries.
Oracle BI Server reads the rpd file and all of the definition into memory.
When user queries the data model, BI Server finds in the definition of the data model's mapping with
the backend data source and generate dynamic sql according to the query and send the sql to different
backend data source.
BI Server will also assemble query result from different data sources and return to the end user.

Oracle BI Presentation Services:
Presentation Services provide the end-user access to the subject areas published by the Oracle BI
Server
Oracle BI Scheduler:
The Scheduler component enables reports and dashboards to be scheduled.
Oracle BI Publisher:
Provides pixel-perfect production reporting with Microsoft Office integration.
Corda PopChart Server:
This third party component provides the charting capabilities in OBIEE.
Repository file (RPD):
OBIEE Server uses the RPD file to translate the end-user requests (reports) to physical SQL queries.
The RPD holds all the metadata definitions.
Scheduler Database:
The Scheduler connects to a database schema with a small number of tables containing the scheduling
metadata.
Data Sources:
OBIEE is by design database independent and supports heterogeneous data sources.
Administration Tool:
The Administration Tool is used to create and manage the RPD repository file.
OBIEE END-USER APPLICATIONS
ORACLE BI COMPONENTS FROM END-USER PERSPECTIVE :
Oracle BI Answers
Oracle BI Interactive Dashboards
Oracle BI Delivers
Oracle BI Disconnected Applications
Oracle BI Briefing Books
Oracle BI Marketing
Oracle BI Publisher
Oracle BI Presentation Services Administration
Oracle BI Answers :
Oracle Answers is mainly used for ad-hoc analysis and building reports.
Oracle BI Interactive Dashboards :
Oracle BI Interactive Dashboards provide personalized views of corporate and external information.
Oracle BI Delivers :
Delivers is used for scheduling reports and dashboards.
Oracle BI Disconnected Analytics :
Disconnected Analytics enables reports and dashboards to be viewed offline, e.g. for mobile users who
need to access the reports while not connected to the network.
Oracle BI Briefing Books :
Briefing Books enables snapshots of dashboards and reports to be distributed offline.
Oracle BI Marketing :
The Marketing module provides segmentation and output lists generating functionality.

Oracle BI Publisher :
Publishes Answers reports as PDF, HTML,RTF etc. Used in developing “Pixel-perfect” reports
Oracle BI Presentation Services Administration :
Manages administration tasks, such as defining which groups and users have access to which
applications and which dashboards.
DATAWAREHOUSE TERMINOLOGY
Fact:
Facts are numeric data that can be examined and analyzed. A fact associated with metrics,
counters and stopwatches that supply the values. Measures are calculations based on facts.
Examples: Quantity, Revenue etc.
Fact Table:
A fact table is a table that contains the measure of interest. These measures are stored in the
fact table
Dimension:
A dimension is a structure that categorizes data in order to enable users to answer
business questions.
Examples: Time, Product etc.
Dimension Table:
A relational table that stores all or part of the values for a logical dimension in a schema.
Dimension tables describe the business entities of an enterprise, represented as hierarchical,
categorical information. They are sometimes called lookup or reference tables.

DATA WAREHOUSE SCHEMA
A collection of related database objects. Relational schemas include tables, views, and other
objects. A dimensional model includes fact tables and dimension tables. Fact tables connect to one
or more dimension tables. Dimensions and hierarchies are represented by dimension tables.
TYPES
Star Schema
Snow Flake Schema
Star Schema : Star schema is data warehouse schema where there is a centrally located „fact table‟ and
many denormalized dimension tables connected in the form of STAR.
Snow Flake Schema : Snowflake schema contain normalized dimension tables in a tree like structure
with many nesting levels.

CREATION OF REPOSITORY FILE (.RPD)
The Oracle BI Server stores meta data in repositories.
The repository consists of three layers :
Physical Layer
Business Model and Mapping Layer
Presentation Layer
Physical Layer :
The Physical layer in the Administration Tool establishes connection with the database.
Importing Tables from Database into Physical Layer
These are the Three Layers in Administration tool
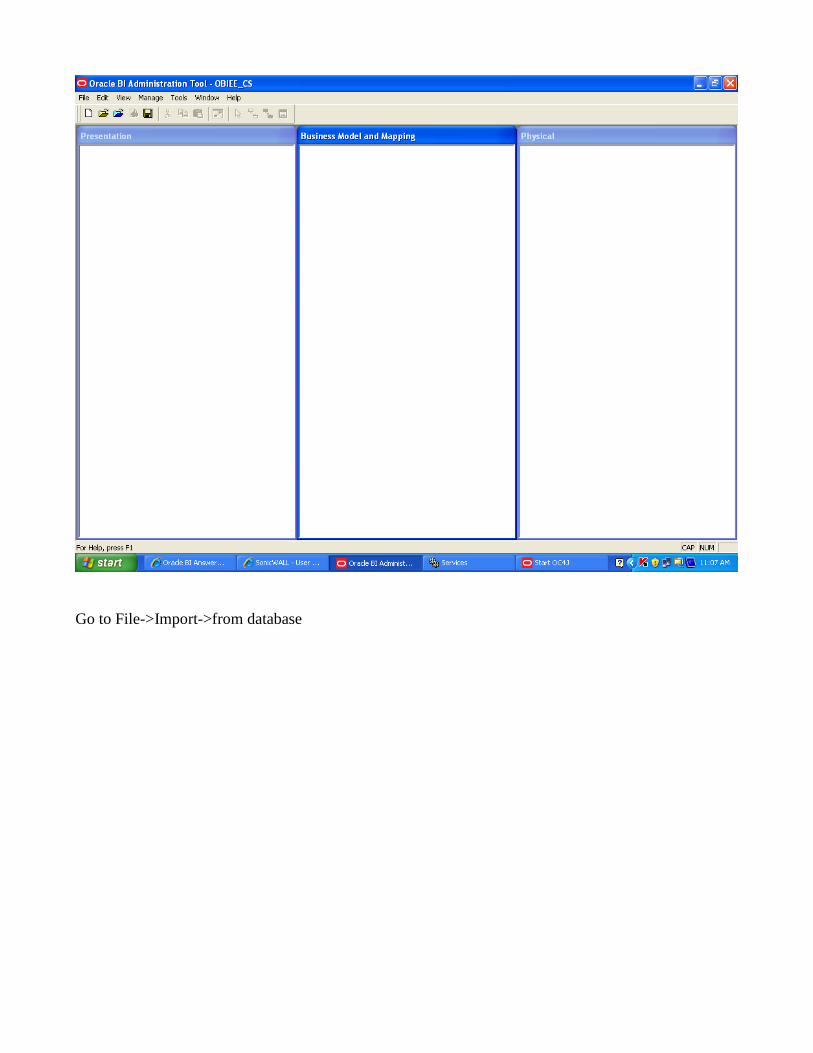
Go to File->Import->from database

Give the required details for the Data Source
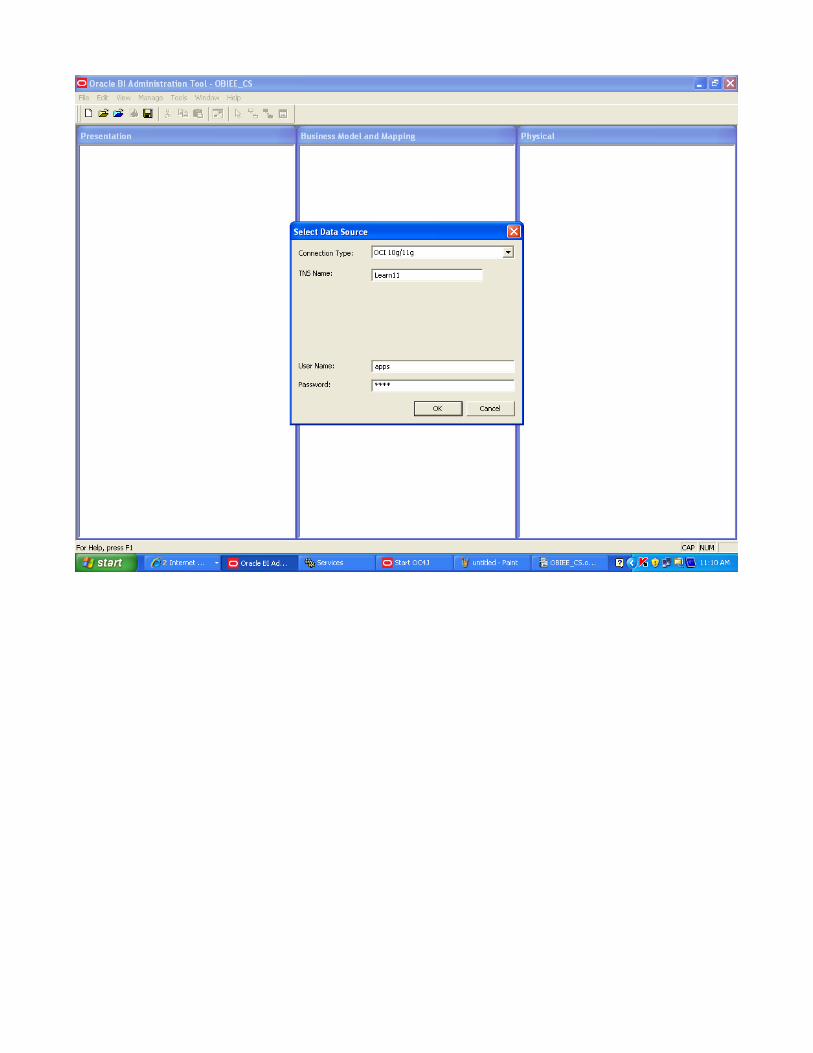

Select the tables to be imported


Connection Pool:
The connection pool is an object in the Physical layer that describes access to the data source.
It contains information about the connection between the Oracle BI Server and that data source.
Give the Connection Pool details :
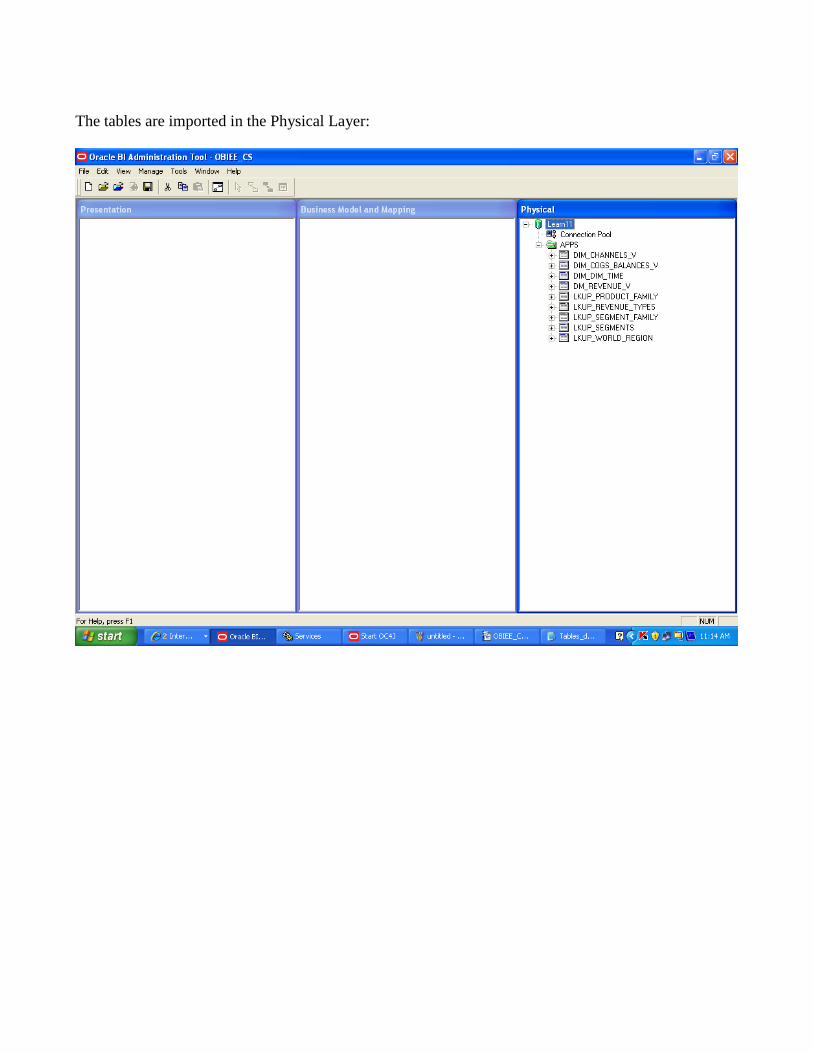
The tables are imported in the Physical Layer:

In the physical layer right click on the folder and select Physical Diagram->objects and all joins:
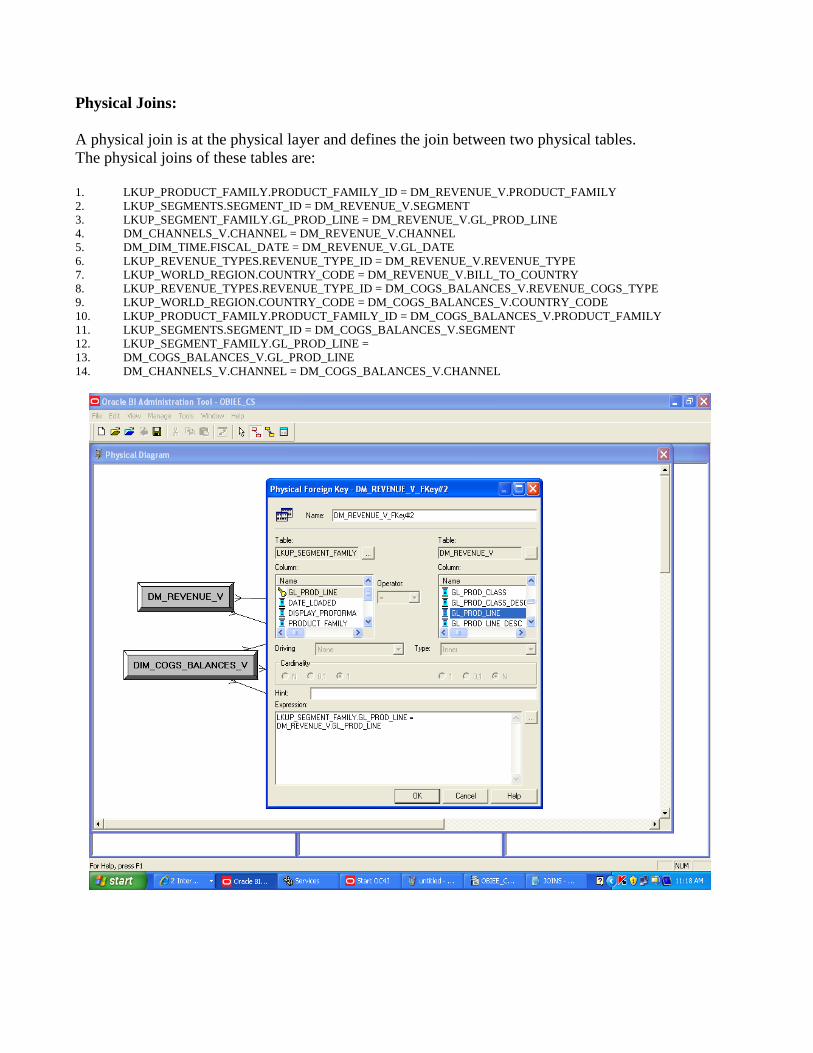
Physical Joins:
A physical join is at the physical layer and defines the join between two physical tables.
The physical joins of these tables are:
1. LKUP_PRODUCT_FAMILY.PRODUCT_FAMILY_ID = DM_REVENUE_V.PRODUCT_FAMILY
2. LKUP_SEGMENTS.SEGMENT_ID = DM_REVENUE_V.SEGMENT
3. LKUP_SEGMENT_FAMILY.GL_PROD_LINE = DM_REVENUE_V.GL_PROD_LINE
4. DM_CHANNELS_V.CHANNEL = DM_REVENUE_V.CHANNEL
5. DM_DIM_TIME.FISCAL_DATE = DM_REVENUE_V.GL_DATE
6. LKUP_REVENUE_TYPES.REVENUE_TYPE_ID = DM_REVENUE_V.REVENUE_TYPE
7. LKUP_WORLD_REGION.COUNTRY_CODE = DM_REVENUE_V.BILL_TO_COUNTRY
8. LKUP_REVENUE_TYPES.REVENUE_TYPE_ID = DM_COGS_BALANCES_V.REVENUE_COGS_TYPE
9. LKUP_WORLD_REGION.COUNTRY_CODE = DM_COGS_BALANCES_V.COUNTRY_CODE
10. LKUP_PRODUCT_FAMILY.PRODUCT_FAMILY_ID = DM_COGS_BALANCES_V.PRODUCT_FAMILY
11. LKUP_SEGMENTS.SEGMENT_ID = DM_COGS_BALANCES_V.SEGMENT
12. LKUP_SEGMENT_FAMILY.GL_PROD_LINE =
13. DM_COGS_BALANCES_V.GL_PROD_LINE
14. DM_CHANNELS_V.CHANNEL = DM_COGS_BALANCES_V.CHANNEL


Drag and drop the tables in the Business Model and Presentation layer:
Business Model and Mapping Layer: The Business Model and Mapping layer of the Administration Tool defines the business, or logical,
model of the data and specifies the mappings between the business model and the Physical layer
schemas. This is where the physical schemas are simplified to form the basis for the users‟ view of the
data.
The main purpose of the business model is to capture how users think about their business using their
own vocabulary. The business model simplifies the physical schema and maps the users‟ business
vocabulary to physical sources. Most of the vocabulary translates into logical columns in the business
model. Collections of logical columns form logical tables. Each logical column (and hence each logical
table) can have one or more physical objects as sources.

Use Complex Joins to join new items created in the Business Layer, if any
Aggregate items that can be summed
Use Rename Wizard to rename fields and tables
Complex Joins:
Right click on folder select Business Model diagram->Whole Diagram
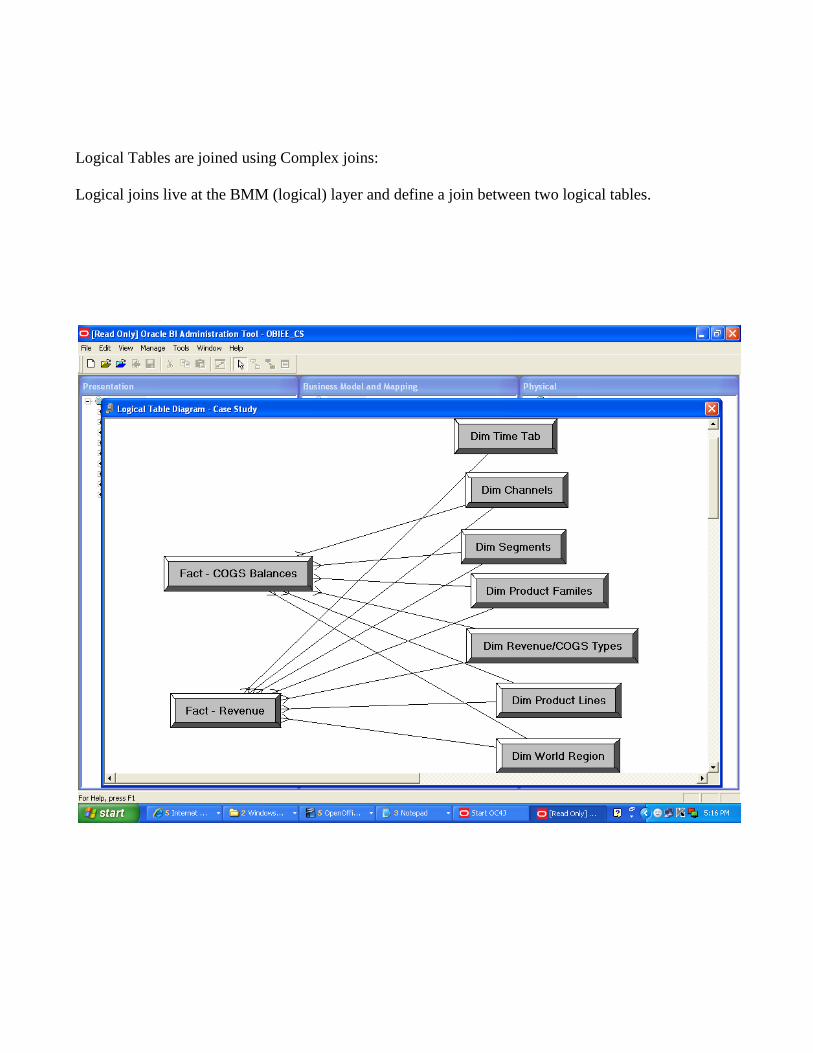
Logical Tables are joined using Complex joins:
Logical joins live at the BMM (logical) layer and define a join between two logical tables.

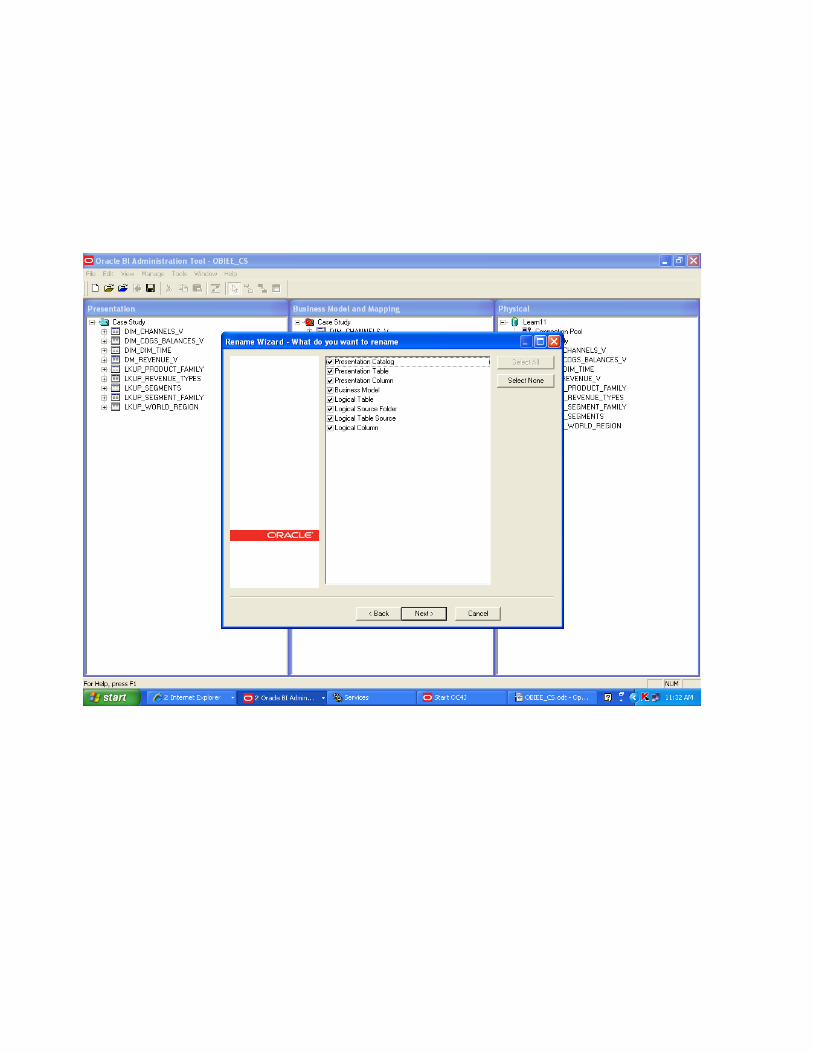
Renaming of Logical and Presentation tables using 'Renaming Wizard'(Tools->Utilities)

Select the Rename Wizard and click on Execute:

Select the folder in Business Model Layer and click on 'Add Hierarchy' which includes all the columns
and tables:(we can make the necessary changes in the names here)
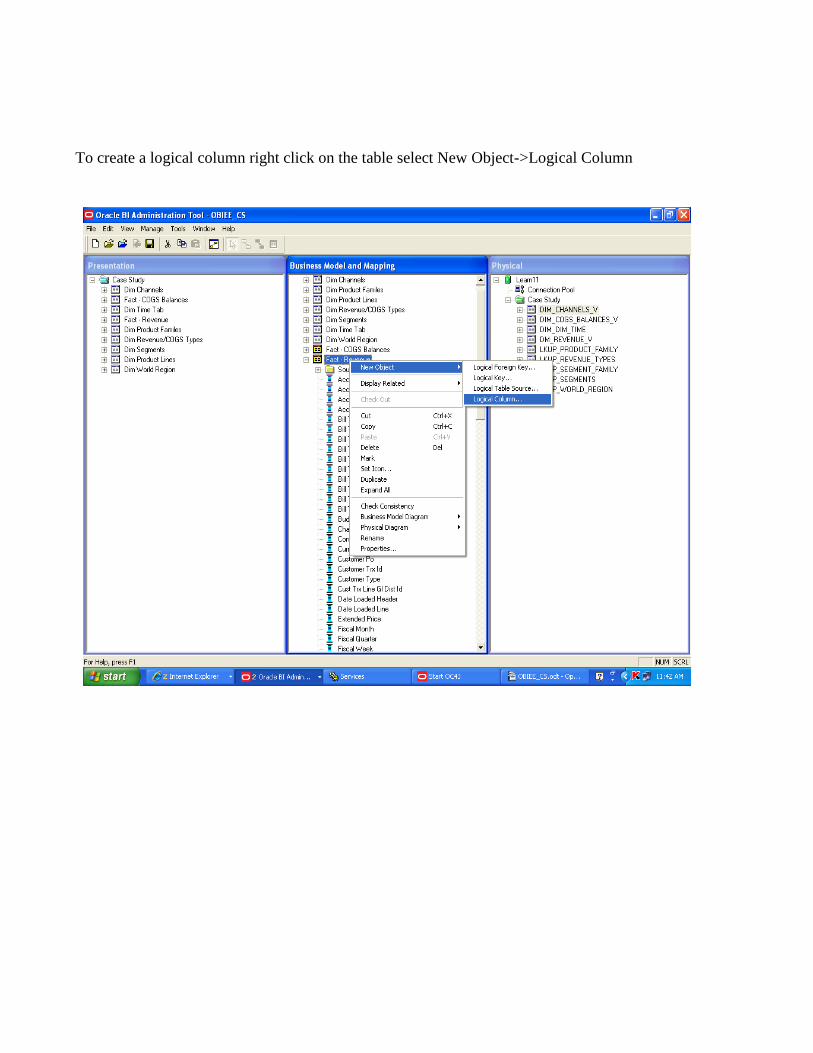
To create a logical column right click on the table select New Object->Logical Column
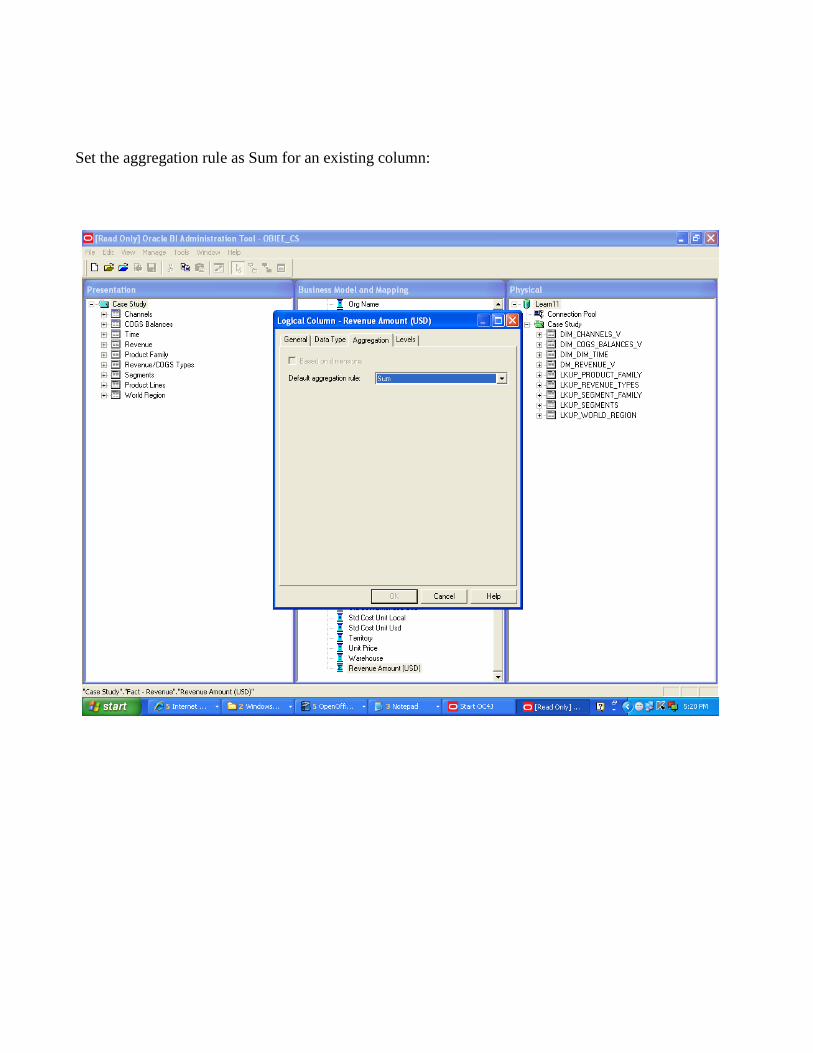
Set the aggregation rule as Sum for an existing column:

Creation of Hierarchies:
Right-click dimension table and select Create Dimension at the bottom of the shortcut menu.

1. A Hierarchy is created using the name of the dimension table followed by the word Dim.
2. A Grand Total level and Detail level will be created. The Detail level will contain all of the
columns of the dimension.
3. Create parent levels using names that match your hierarchy. Right-click the Detail level, select New
Object, parent level.
4. Create a parent level above the lowest child level (this will contain the dimension key.) Move the
dimension key to this level.
5. Move other columns to their respective levels.
6. Delete any unneeded columns from any level.
7. Select columns within each level, right-click and select New Logical Level Key. Select all columns
as keys if you want to see them in drilldown.
8. For any levels that should be skipped in the drill-down, select all columns in the level, right-click
and remove the checkmark next to Use for drilldown.

9. At level two check for a Detail key that was automatically created. (Right-click level two,
Properties, click the Keys tab). Highlight and delete Detail Key.
Here the hierarchy is created for 'Times' logical table:

Presentation Layer
Group columns with sub-folders and give the names which are convenient to understand by the
'End User' in the 'Oracle BI Answers'.
The final RPD is as shown:
This is saved as '.rpd' in OracleBI\server\Repository
rpd - BI repository file which contains physical layer, logical layer & presentation layer definitions:
NQSConfig.ini - BI Server configuration file, specify important parameters that will have more or less
impact of BI Server
for example:
Star = <<filename>>.rpd, DEFAULT;
This instructs the BI Server to use <<filename>>.rpd as the data model.

ANSWERS
Oracle BI Answers provides answers to business questions.
This interface allows users with the appropriate permissions to build and modify reports that let
endusers explore and interact with information.
Reports created with Oracle BI Answers can be saved in the Oracle BI presentation Catalog and
integrated into any dashboard
The results of an Oracle BI Answers request can be formatted, saved, organized, and shared with
others.
Prerequisites :-
1)Put the RPD in this directory
OBIEE_HOME\OracleBI\server\Repository
2)Refer this in config file in path
OBIEE_HOME\OracleBI\server\Config\NQSConfig.INI
In the config file refer this at
Star=OBIEE_CS.rpd(your rpd file name)
3)Start the following services
a)Oracle BI Server
b)Oracle BI Presentation Server
c)Oracle BI Java Host Server
4)Go To start ->All Programs->Oracle BI,click on Start OC4J and start Presentation Services.

Now we will get the following window

Now login,then select your subject area as shown below

In criteria,you select the colunms and perform different operations like column properties,edit
formula,add filter.

Some of the views in results are:
1)Compound Layout
2)Title
3)Table
4)Chart
5)Pivot table
6)Filters
7)Column Selector
8)View Selector
9)Legend
10)Narrative
11)Gauge view
Compound Layout:-To assemble different views for display on a dashboard and this is the default view.
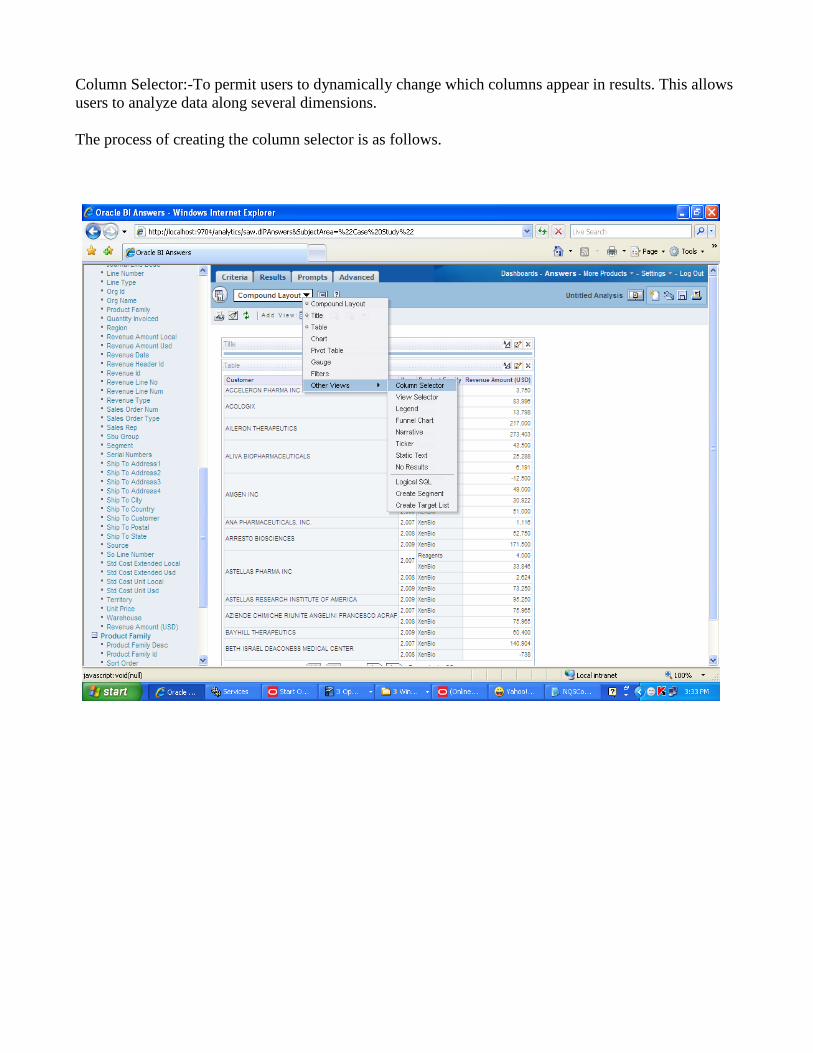
Column Selector:-To permit users to dynamically change which columns appear in results. This allows
users to analyze data along several dimensions.
The process of creating the column selector is as follows.

Here we have to check for column and add other columns to display in drop down list.
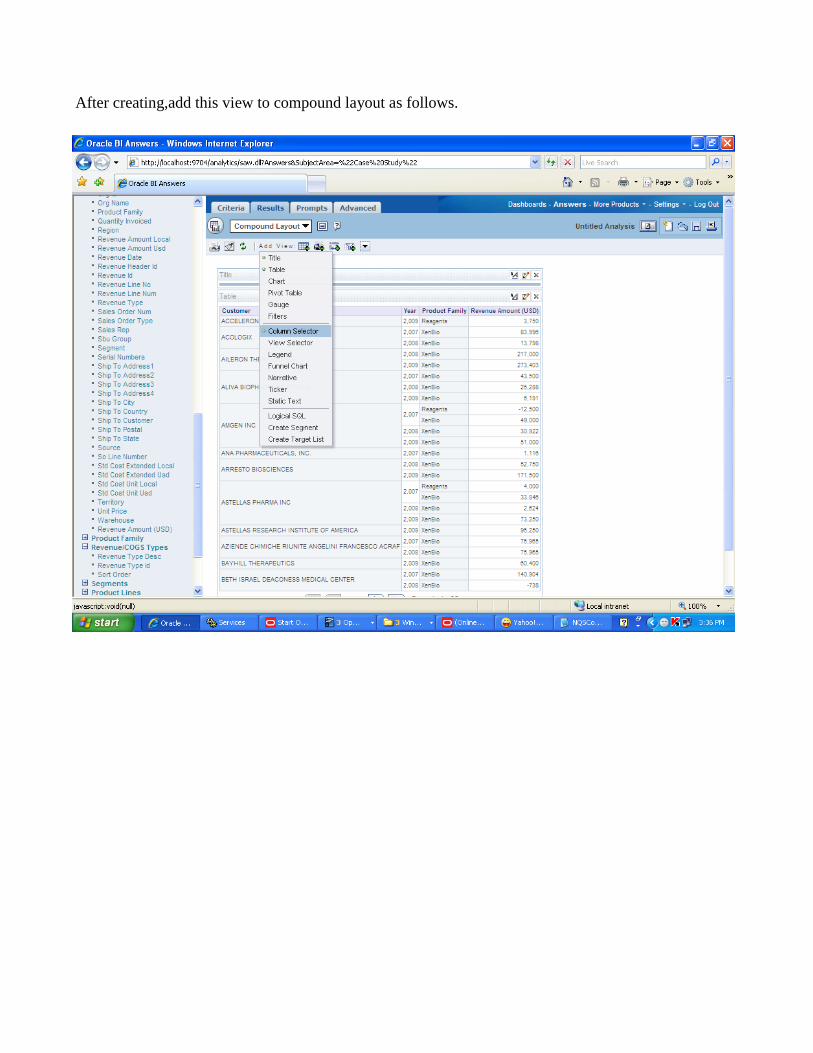
After creating,add this view to compound layout as follows.

Here we can select columns and according to that column the data will display.

Title View: In this view we can add Titles,Sub Titles,logos,date,time etc. to the reports .

Legend: Using this view we can easily identify the data in a particular range in the report.

Here we give the condition for a particular column and for each range we will assign an image. And at
last we use above legend here to identify the range.


Here we add the legend view to the compound layout as follows.
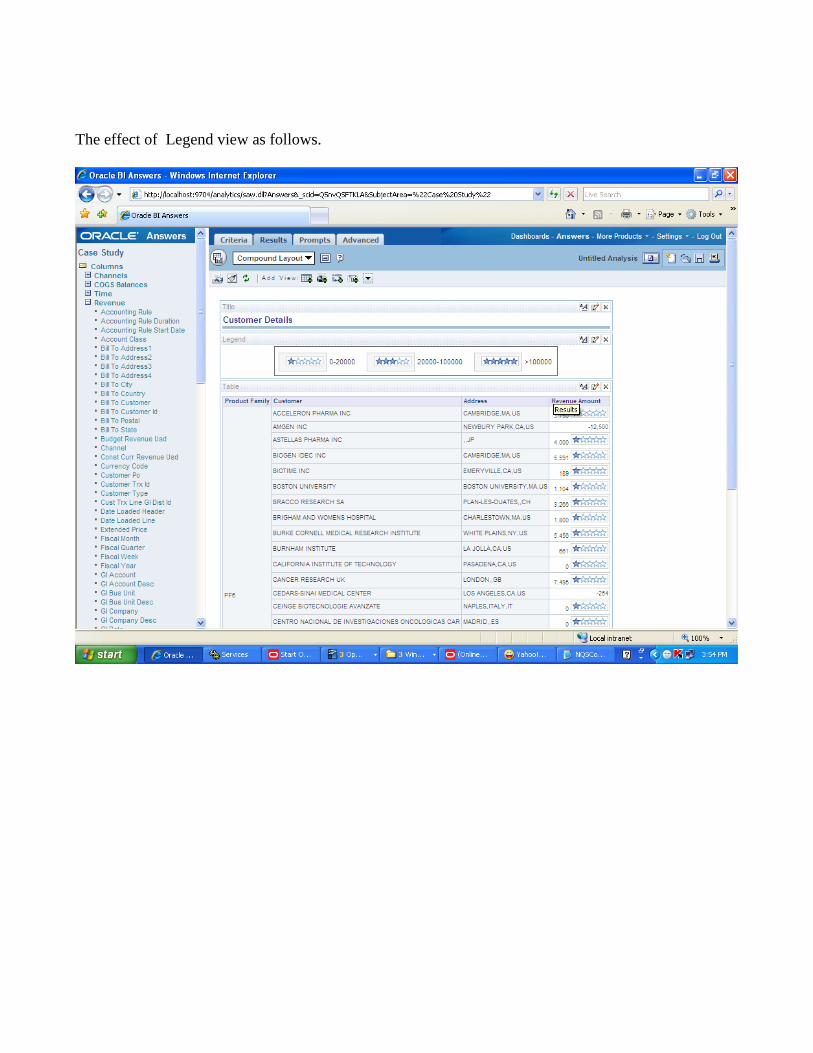
The effect of Legend view as follows.

Pivot Table:
In this view we will arrange the table content according to measure label column(EX. Year).To do this
view we should have at least one measure column. It contains pages,sections,rows,columns etc,.
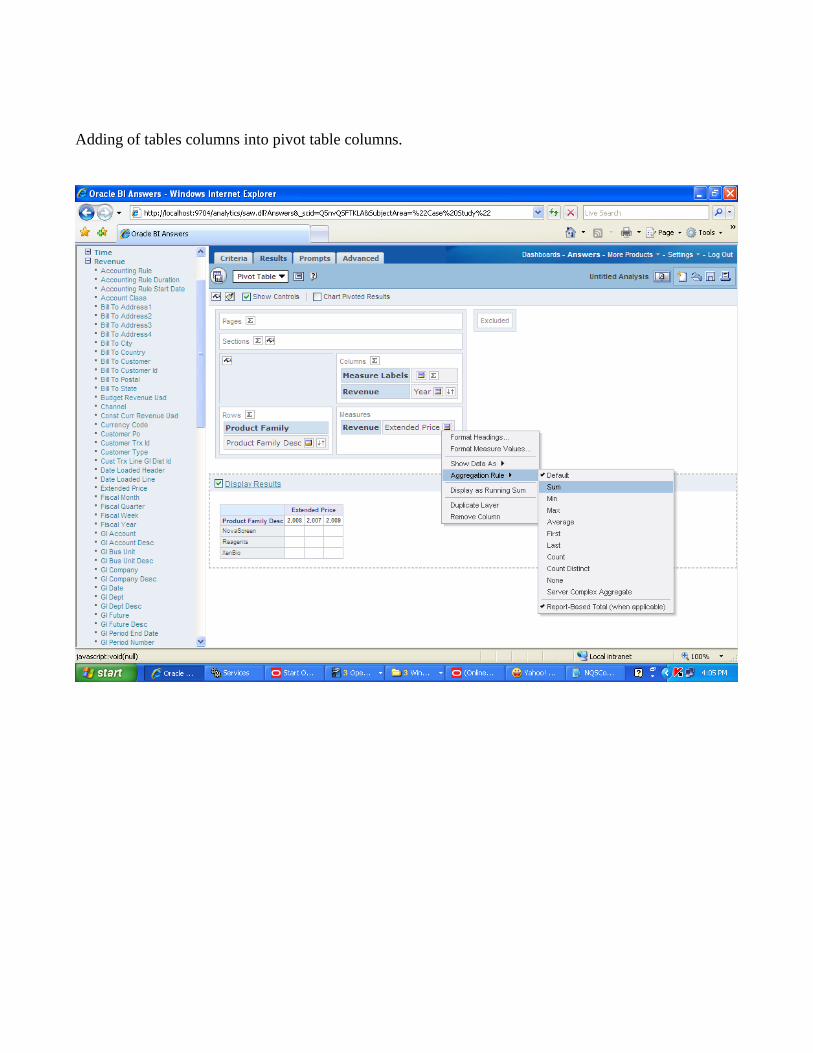
Adding of tables columns into pivot table columns.

After adding the pivot view to compound layout the table is as follows.
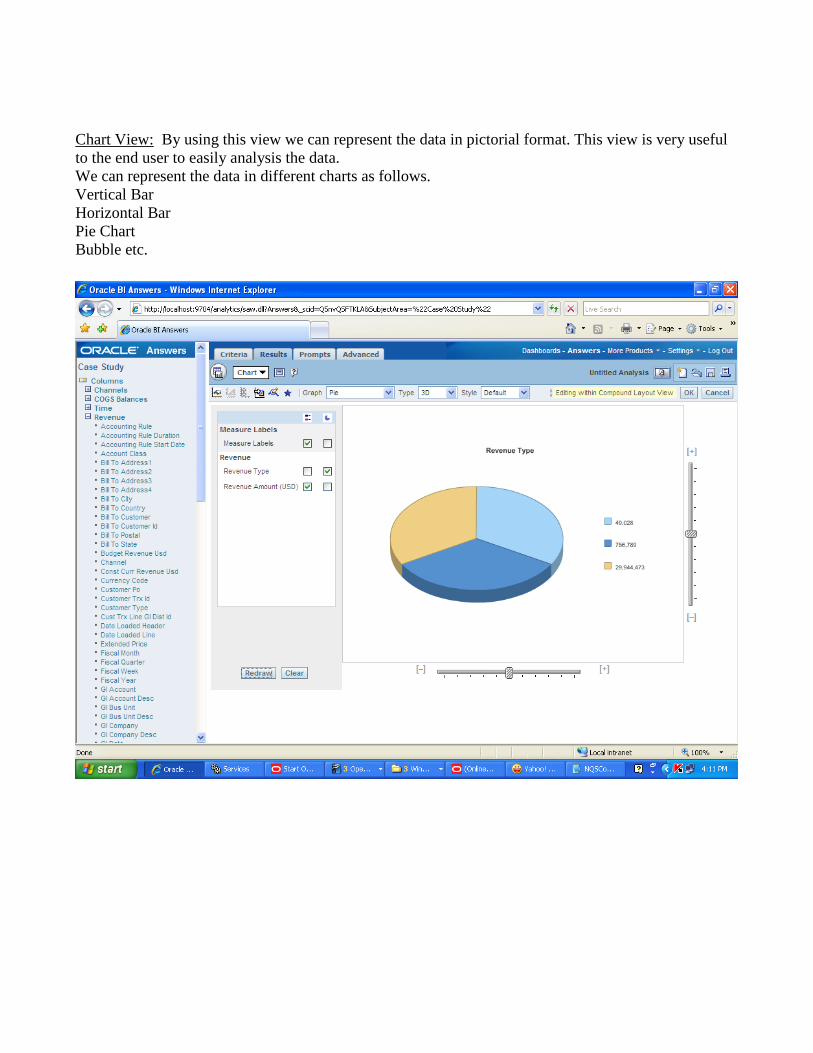
Chart View: By using this view we can represent the data in pictorial format. This view is very useful
to the end user to easily analysis the data.
We can represent the data in different charts as follows.
Vertical Bar
Horizontal Bar
Pie Chart
Bubble etc.

View Selector: In this view we can select a view from a list of views which are already created.

Adding the view selector to compound layout.

As shown below we can select one view from drop down list.
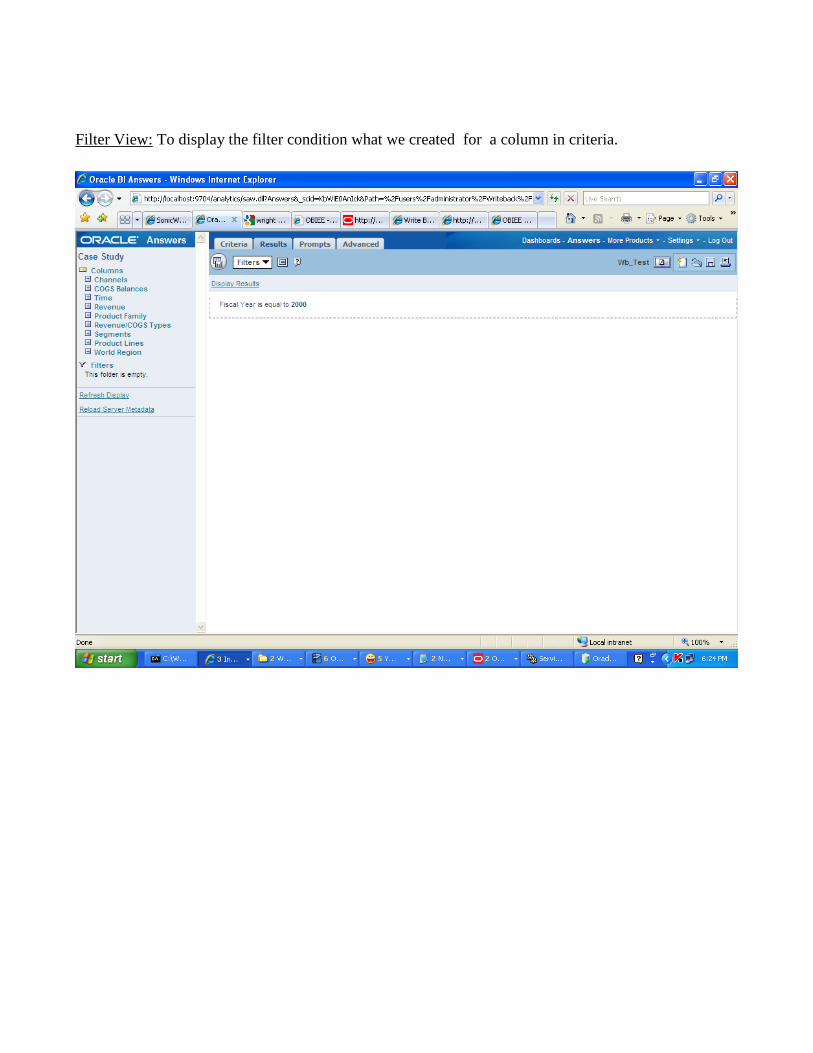
Filter View: To display the filter condition what we created for a column in criteria.


Narrative View: To show the results as one or more paragraphs of text.
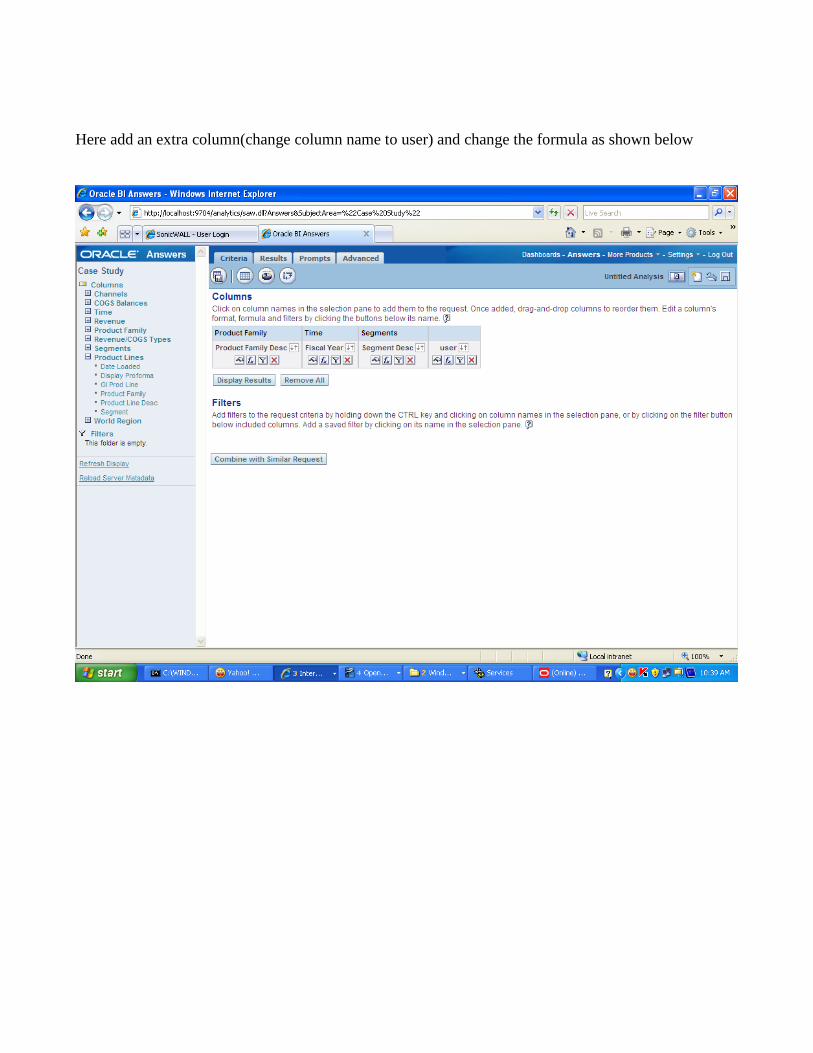
Here add an extra column(change column name to user) and change the formula as shown below

In formula add the session variable name.
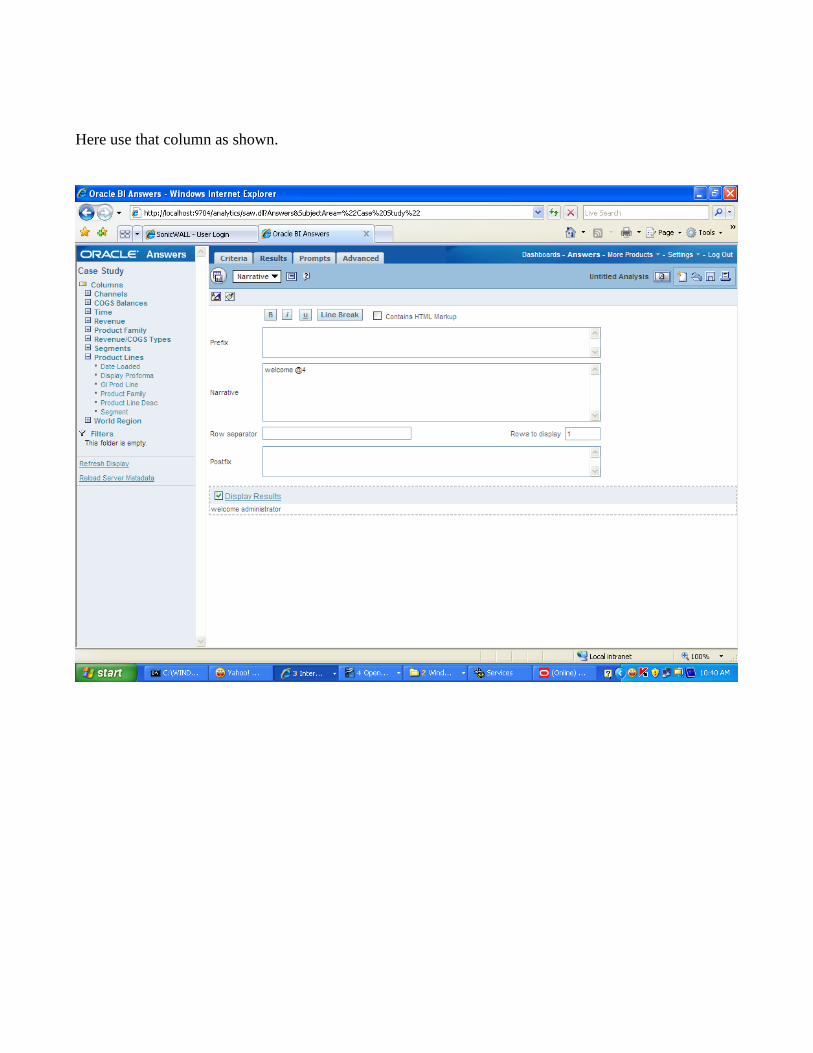
Here use that column as shown.
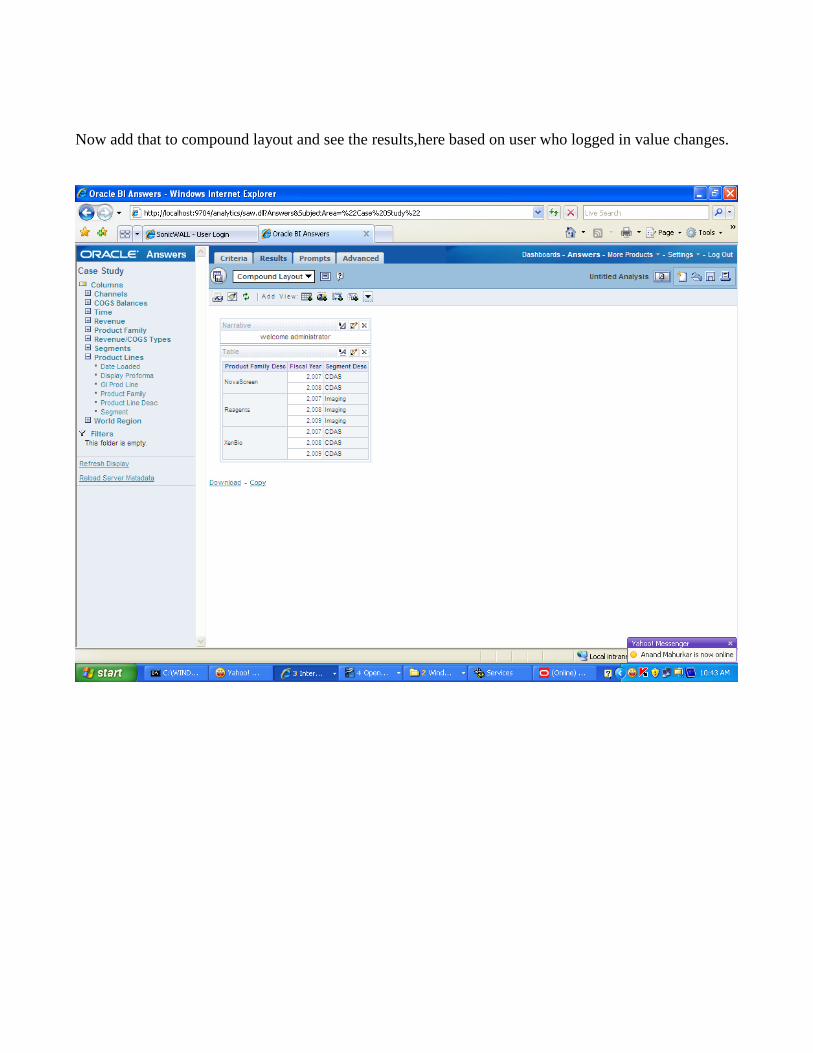
Now add that to compound layout and see the results,here based on user who logged in value changes.
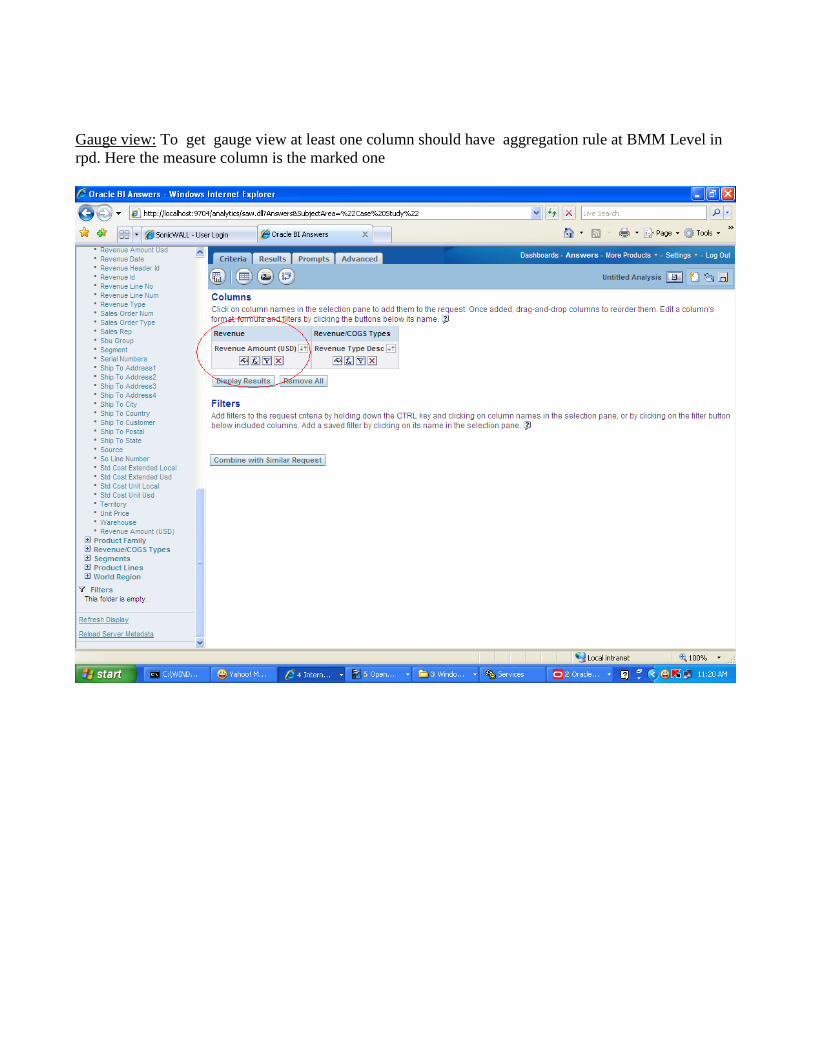
Gauge view: To get gauge view at least one column should have aggregation rule at BMM Level in
rpd. Here the measure column is the marked one

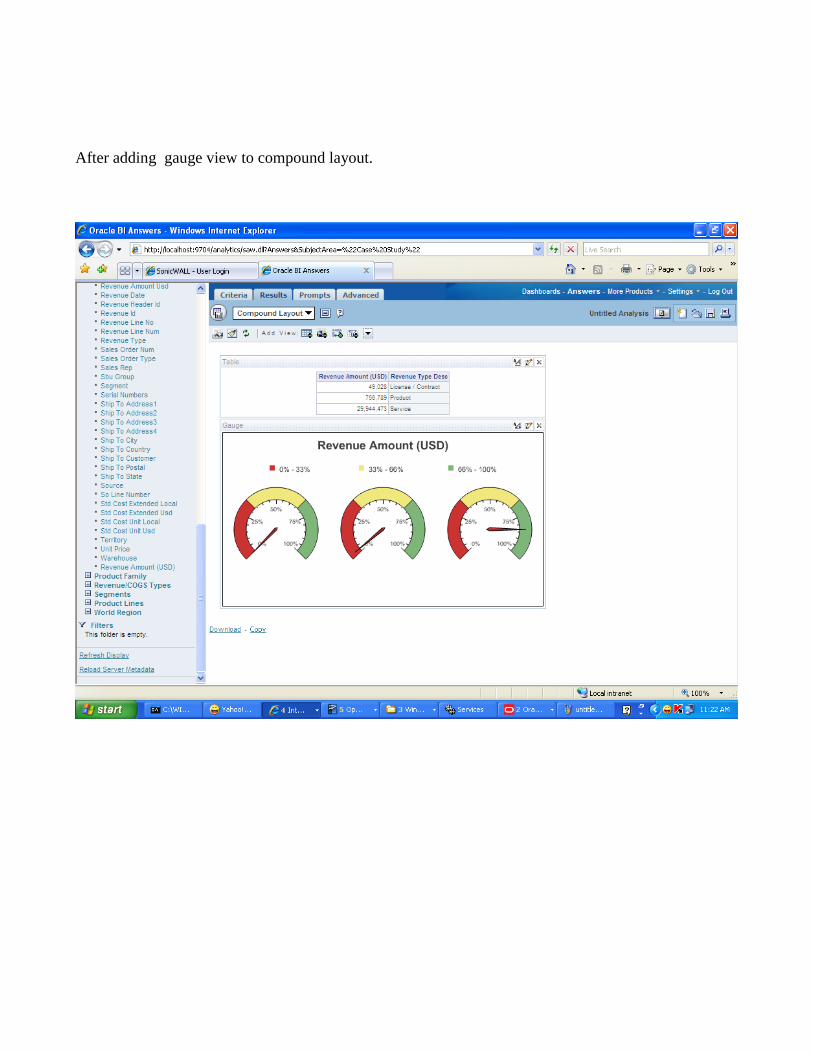
After adding gauge view to compound layout.
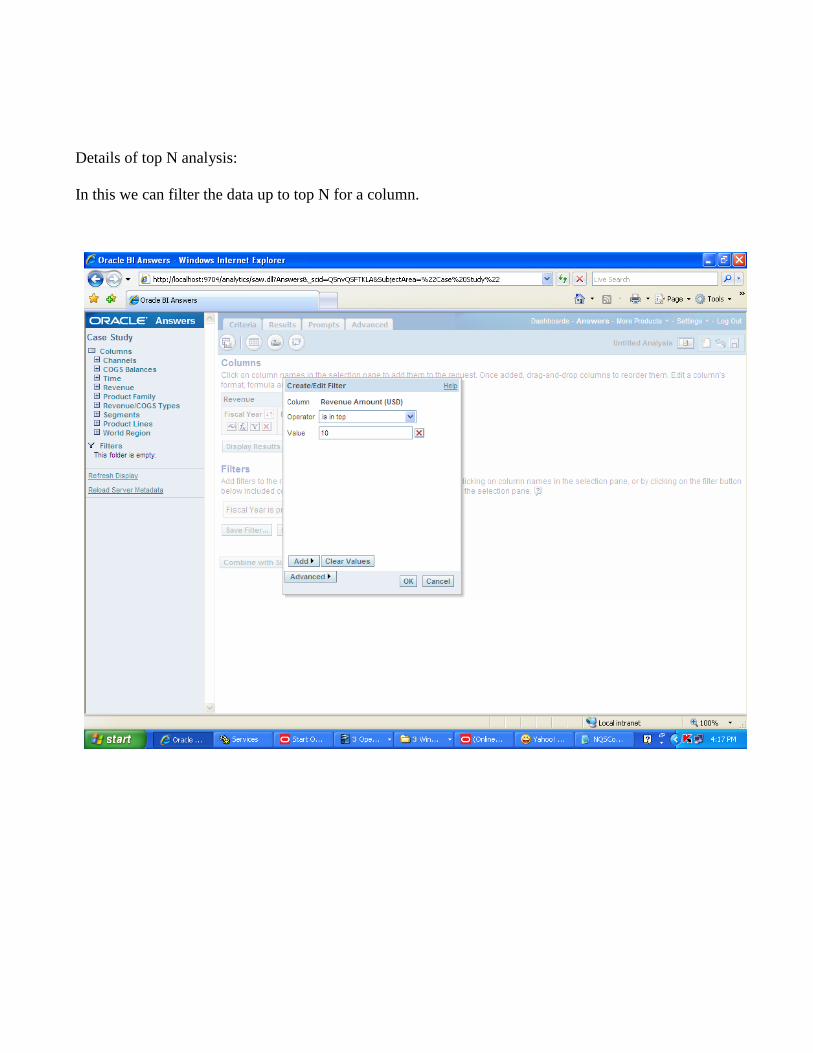
Details of top N analysis:
In this we can filter the data up to top N for a column.
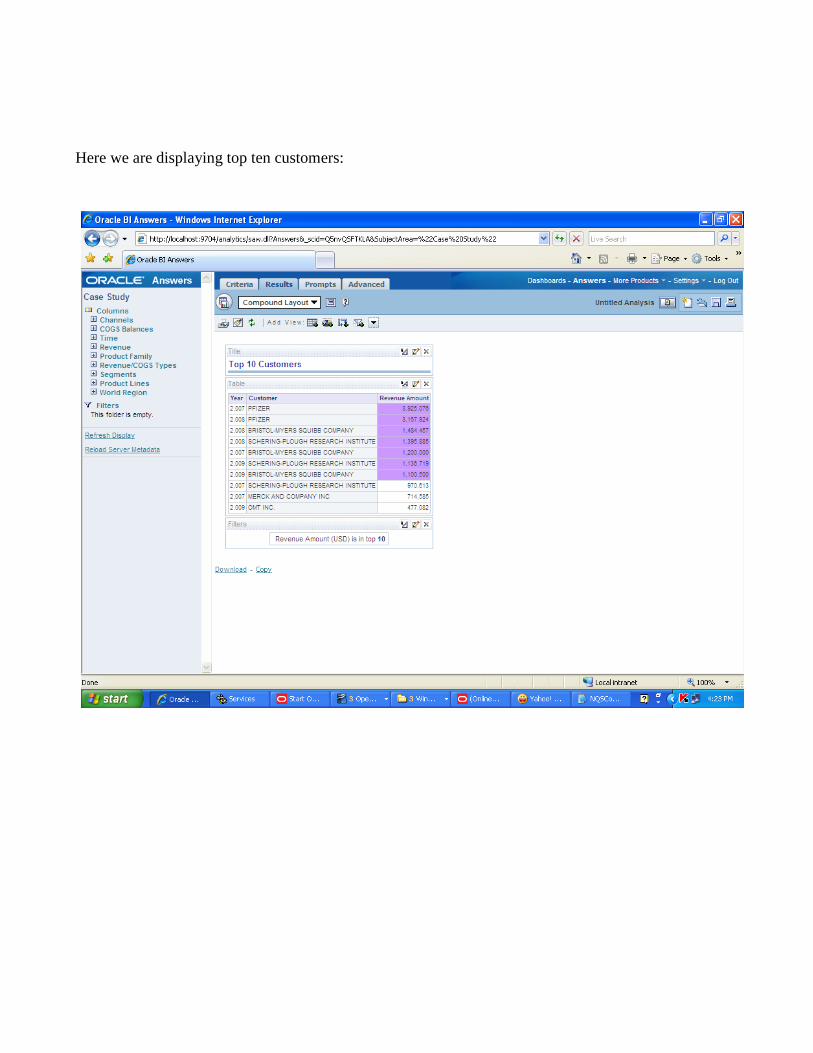
Here we are displaying top ten customers:
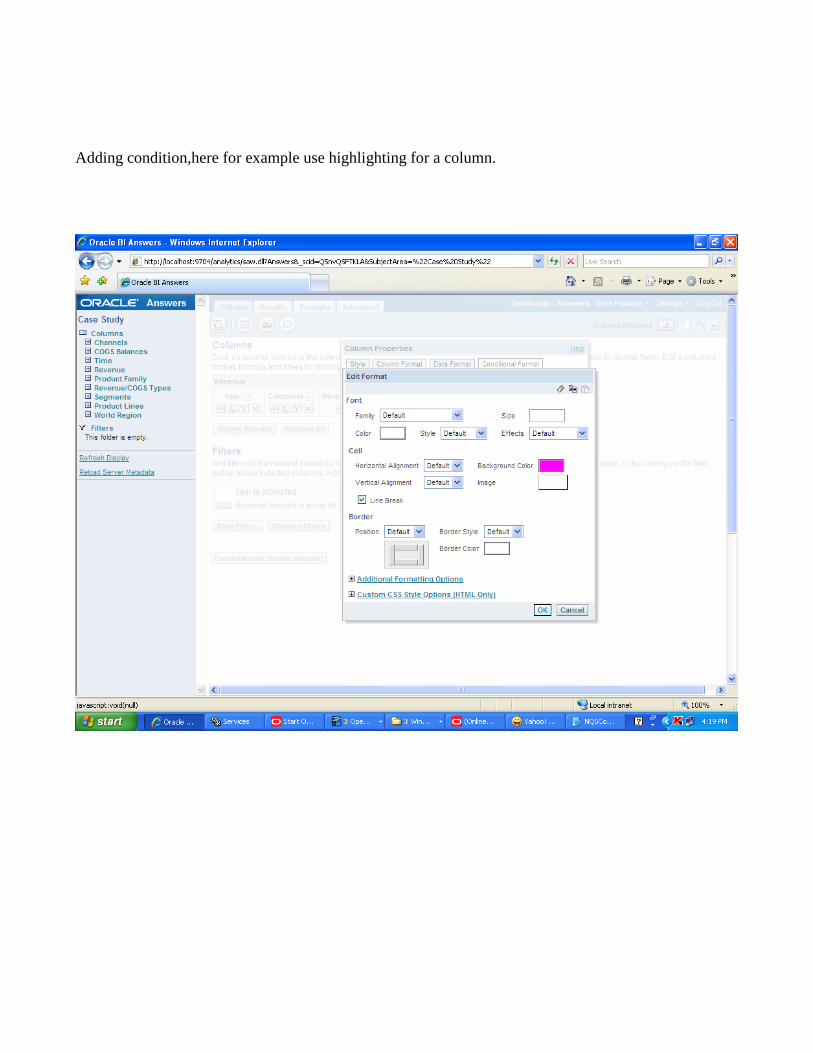
Adding condition,here for example use highlighting for a column.

After adding condition:

The column data is highlighted based on the condition as shown:
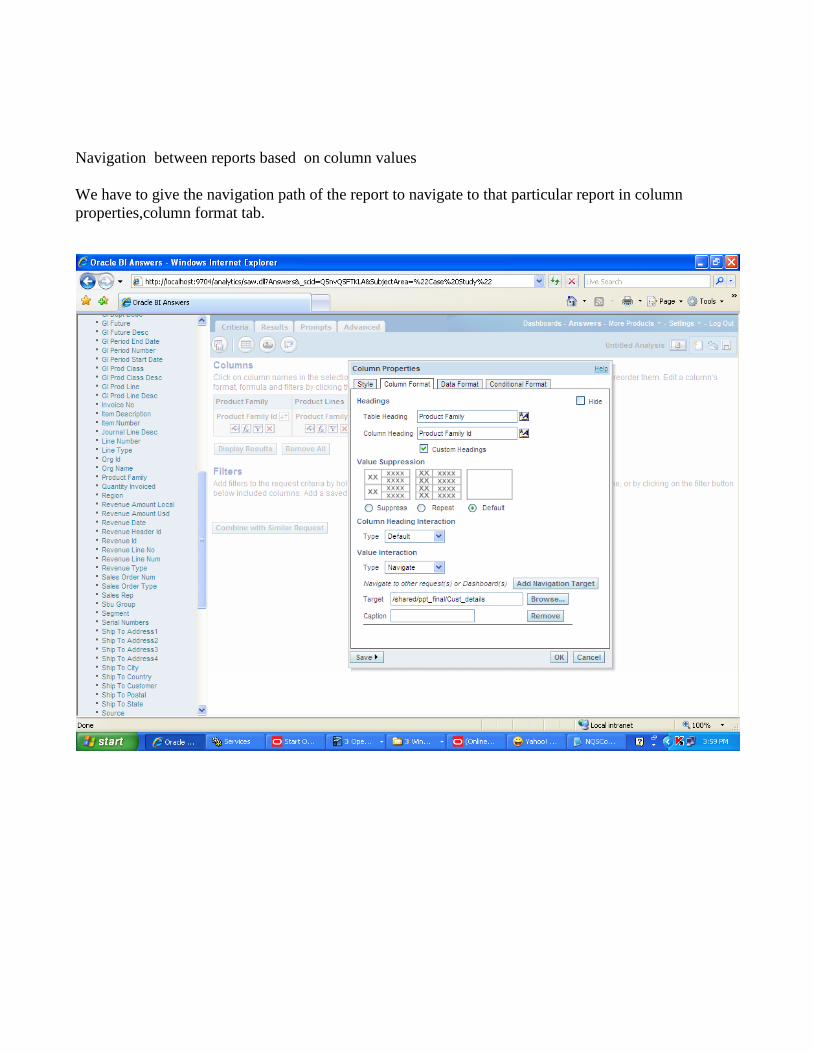
Navigation between reports based on column values
We have to give the navigation path of the report to navigate to that particular report in column
properties,column format tab.
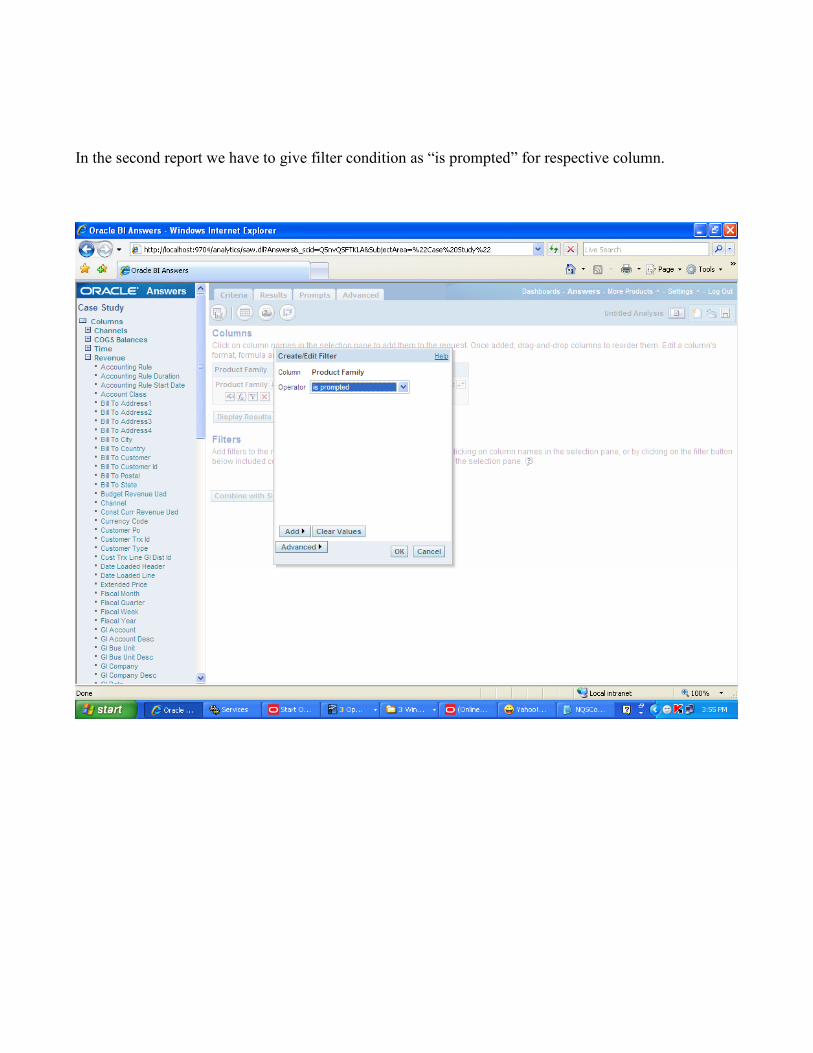
In the second report we have to give filter condition as “is prompted” for respective column.
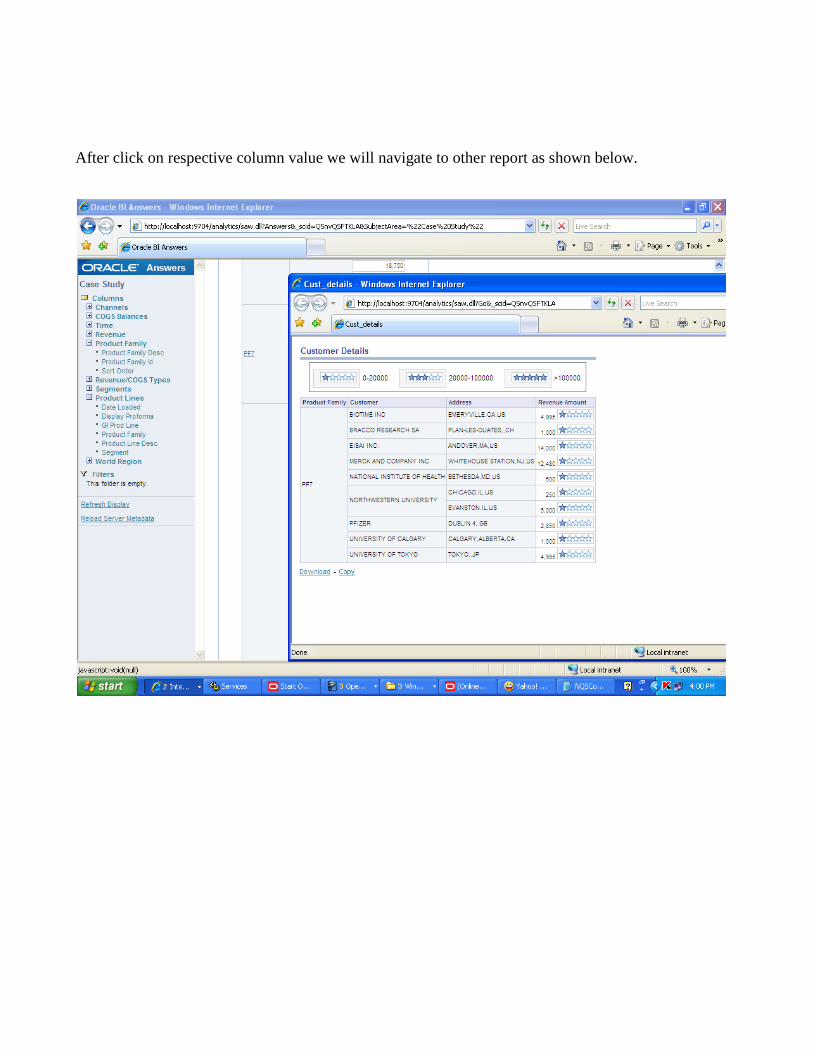
After click on respective column value we will navigate to other report as shown below.

Dashboards Dashboard Creation:-
To create a new, empty dashboard
1. Log in to Oracle BI and click Settings, and the Administration link.
The Oracle BI Presentation Services Administration page appears.
2. In the Activities section, click the following link:
Manage Interactive Dashboards
The Manage Dashboards page appears.
3. Click the following link at the bottom of the page:
Create a new Interactive Dashboard
4. At the Create Dashboard page, enter a location and name for the dashboard, and the name of the
user or group that can modify the dashboard.
5. Exit Oracle BI Administration and return to Oracle BI Interactive Dashboards.
The name of the new dashboard appears at the top of the screen.
NOTE: Newly-created dashboards contain one blank page. Dashboards that contain only one
page do not display the page name as a tab at the top of the dashboard. Dashboard page names
appear at the top of a dashboard only when the dashboard contains multiple pages.
6. Click the name of the new dashboard.
An empty dashboard page appears.
7. To add content to the dashboard, click either of the following links:
Click here to add content
Edit Dashboard .
The Dashboard Editor appears.

Adding a new page to a dashboard:-
To add a new page to a dashboard
1. Log in to Oracle BI and navigate to Oracle BI Interactive Dashboards.
2. At the top of the page, click the name of a dashboard to which you want to add a new page.
The dashboard appears.
3. Click the Edit Dashboard link.
The Dashboard Editor appears.
4. Click the Add Dashboard Page button near the top of the Dashboard Editor:
The Add Dashboard Page screen appears.
5. Type a name and a description for the dashboard page.
6. Click the Finished button.
The new page appears on the dashboard.
Adding a new column to a dashboard:-
To add a new column
Click the Add Column button near the top of the Dashboard Editor:
The column is added to the dashboard page.
Adding a Section to a column:-
Sections are used within columns to hold the content of a dashboard.
To add a section to a column

From the selection pane, drag and drop a Section object from the Dashboard Objects area into
the column.
The column is highlighted when you are at an appropriate location in the column to drop the
section.
Adding a Guided navigation link to a Section:-
Guided navigation links can be static or conditional. Static links always appear. Conditional links
appear only if results meet certain criteria.
To add a guided navigation link
1. From the selection pane, drag and drop a Guided Navigation Link object into a section in the
dashboard page.
2. Click the Properties button for the link.
The Guided Navigation Link Properties dialog box appears.
3. Choose the type of link to add:
To make the link conditional, specify your choices in the Conditional Link Properties
area.
To make the link static, specify your choices in the Guided Navigation Properties area.
NOTE: For URLs, provide the full path.
4. Click OK.
Adding Embedded content to a Section:-
Embedded content is any content that appears within a window (called a frame) inside the dashboard,
as opposed to content that is accessed by clicking a link. Content that you might want to embed
includes reports, Excel charts, documents, Web sites, tickers from Web sites, and so on.
To add embedded content
1. From the selection pane, drag and drop an Embedded Content object onto a section in the
dashboard page.
2. Click the Properties button for the object.
The Embedded Content Properties dialog box appears.
3. In the URL box, type the location and name of the content to embed.
These are examples:
http://www.oracle.com/dashboardfiles/piechart.xls
If you want to change the default size of the window, type new values into the Width and Height boxes.
If you do not want the window to have scroll bars, click the following option:
Hide Scroll Bars
6. Click OK.
Adding a folder view to a dashboard:-
To add a view of a folder
1. From the selection pane, drag and drop a Folder object onto a section in the dashboard page.
2. Click the Properties button for the folder.
The Folder Properties dialog box appears.
3. Browse to select the folder and click OK.
4. Click OK to save the properties.
Adding saved content to a dashboard:-
You can add content that you or someone else has already saved in a shared folder or dashboard, such
as dashboard prompts and reports. To locate the content, you can browse by either the Presentation
Catalog folder it is stored in, or by the dashboard it appears on.
To add saved content
1. From the selection pane, in the Saved Content area, navigate to the folder or dashboard that
contains the content you want to add to the dashboard.
2. Locate the content that you want to add, and drag and drop it into a section in the dashboard
page.
Renaming an Object:-
To rename an object
1. In the Dashboard Editor, click the Rename button for the object.
The Rename dialog box appears.
2. Type a new name for the object and click OK.
Deleting an object:-
To delete an object on a dashboard page
In the Dashboard Editor, click the Delete button for the object.
Editing Dashboard properties:-
To change dashboard properties
1. Click the Dashboard Properties button near the top of the Dashboard Editor:
The Dashboard Properties page appears.
Specify your choices.
2. When you are done, click the Finished button to return to the Dashboard Editor.
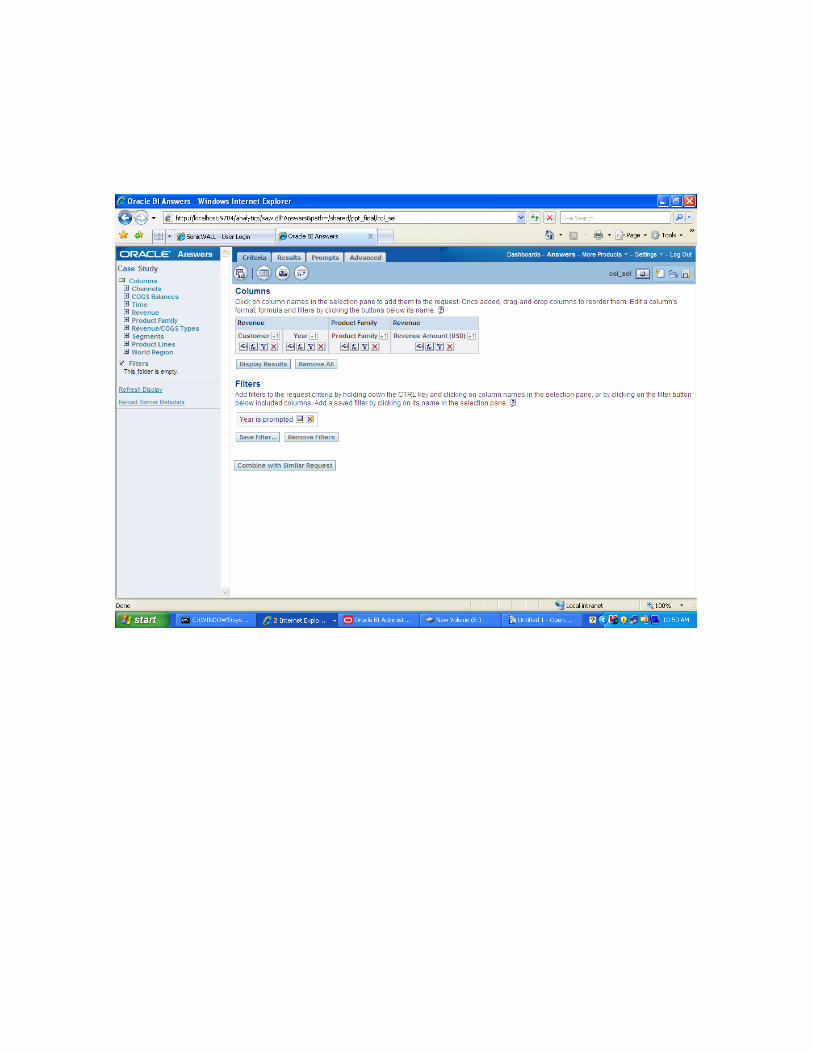
Dashboard Prompt:-
To create a new dashboard prompt click on the symbol 'New dashboard prompt' symbol that appears to
the left side pane.
Scope of the dashboard prompt determines what part of the dashboard should get affected based on the
prompt. Scope can be a page or a dashboard.
Click on the columns in the selection pane to add them to the dashboard prompt. On a dashboard
multiple column prompts will be shown on one line. Checking the group option will allow a stacked
presentation.
Based on the value given through the prompt the report output gets displayed.
Note:- To reflect the prompt condition in the results, set the filter as 'is prompted' for the columns on
which prompt is applied in the target report.
Navigation from one dashboard page to another dashboard page:-
We can create a navigation from one report in dashboard board page to another report in a dashboard
page by giving the path of the target file in the Column or value interaction properties of a column in a
source report. The following screen shots illustrate this scenario.
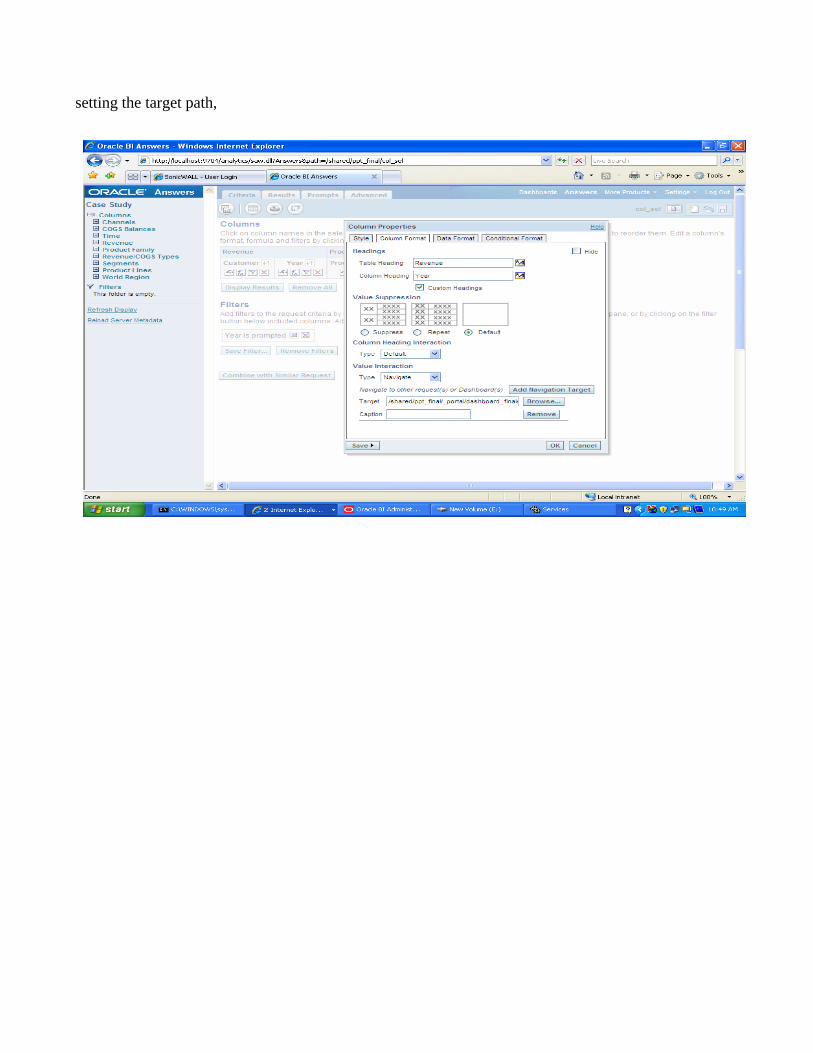
setting the target path,

Click a value in the Year column to navigate to the report in the target dashboard.
Final report opened when the year 2009 is clicked.
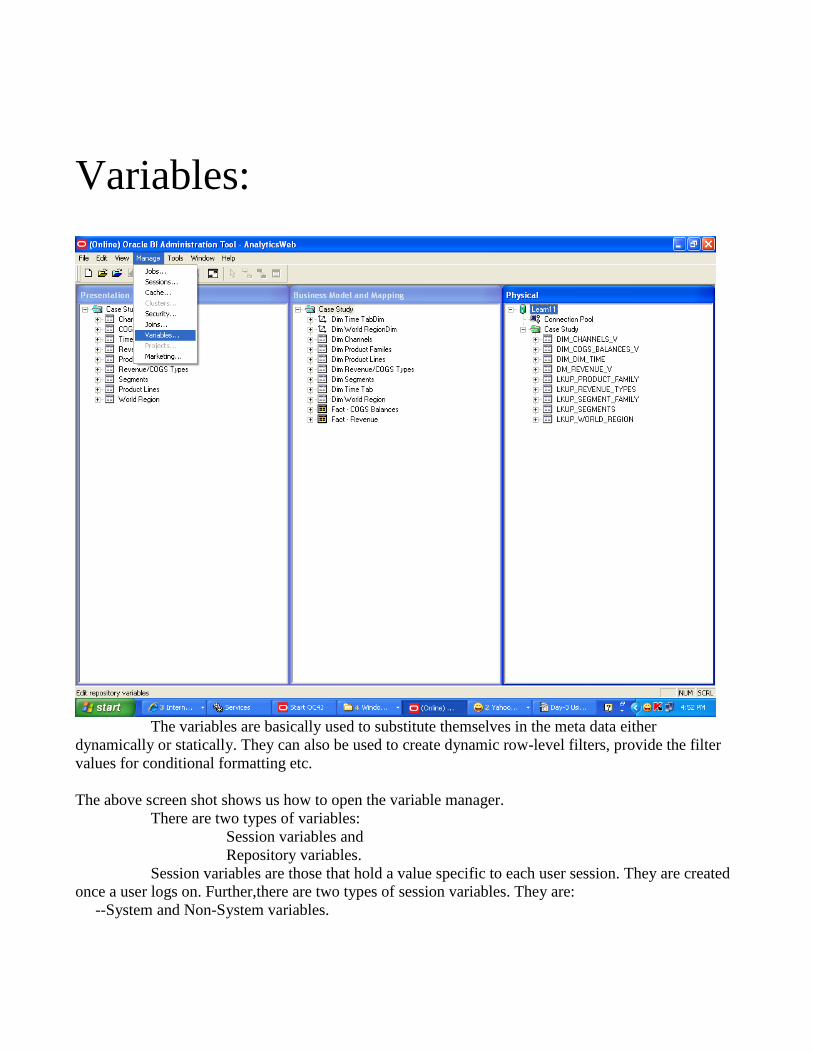
Variables:
The variables are basically used to substitute themselves in the meta data either
dynamically or statically. They can also be used to create dynamic row-level filters, provide the filter
values for conditional formatting etc.
The above screen shot shows us how to open the variable manager.
There are two types of variables:
Session variables and
Repository variables.
Session variables are those that hold a value specific to each user session. They are created
once a user logs on. Further,there are two types of session variables. They are:
--System and Non-System variables.
System variables are the variables which are created directly by the oracle BI server for
specific purposes. They have reserved names.
The Non-system variables are those which can be created by the Administrator for usage in the reports
etc .Hence, they are application specific.
Now , let us look at the usage of session variables.
Initially , an initialization block has to be created for the session variables.Once a session is
begun ,Oracle BI server creates new instances of session variables and initializes them.The number of
instances of the session variables depends on the number of active sessions of the BI server.
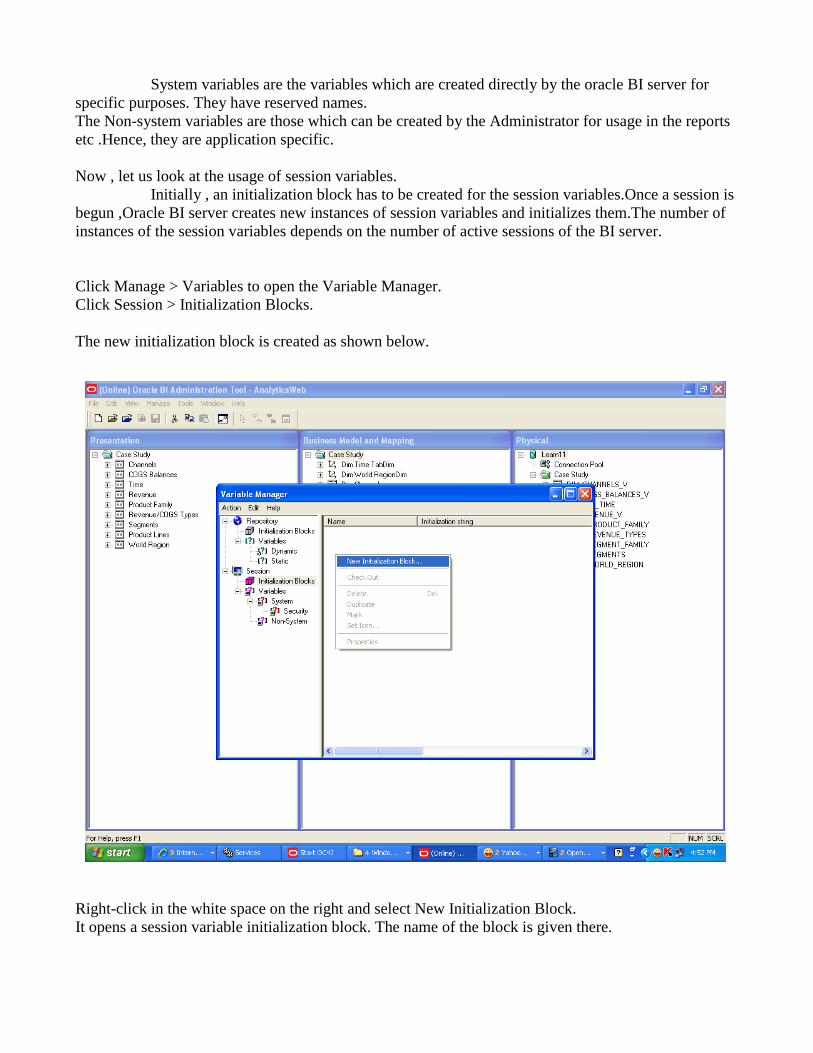
Click Manage > Variables to open the Variable Manager.
Click Session > Initialization Blocks.
The new initialization block is created as shown below.
Right-click in the white space on the right and select New Initialization Block.
It opens a session variable initialization block. The name of the block is given there.

Now, edit the data source .
Click the Edit Data Source button to open the Session Variable Initialization Block Data Source dialog
box and in the Default Initialization String field, type the following initialization string:
SELECT ':USER', case when upper(':USER') = 'SWAPNA' then 'US' when upper(':USER') = 'DIVYA'
then 'AU' when upper(':USER')= 'ANUSHA' then 'UK' when upper(':USER') = 'NIROSHA' then 'AT'
end, 'CountryManagers', 2 from Dual .


Click the Browse button and select case study Connection Pool in the Select connection Pool dialog
box shown below.
Click OK to close the Session Variable Initialization Block Data Source dialog box. The initialization
string is visible in the Session Variable Initialization Block dialog box.

Click on Edit Data Target to open the Session Variable Initialization Block Variable Target dialog box.
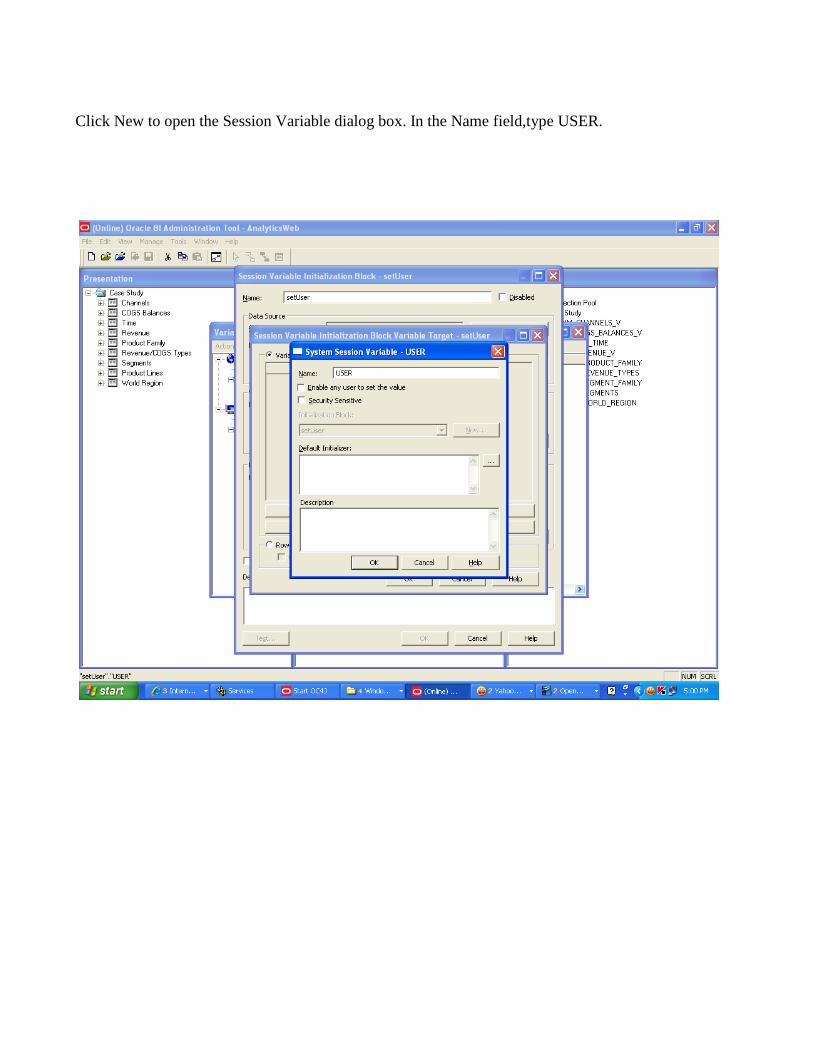
Click New to open the Session Variable dialog box. In the Name field,type USER.

Click OK to close the Session Variable dialog box.
Click Yes when prompted about the USER session variable having a special purpose because USER is
a reserved variable.
The USER variable is added to the Session Variable Initialization Block Variable Target dialog box.
Repeat the steps and add three more variables: UserCountry, GROUP, and LOGLEVEL. Click Yes
when promoted about the GROUP and LOGLEVEL session variables having a special purpose(as they
are reserved variables).The order of the variables must match the order of the values for the variables in
the initialization string in the initialization block. Hence, the order is important.
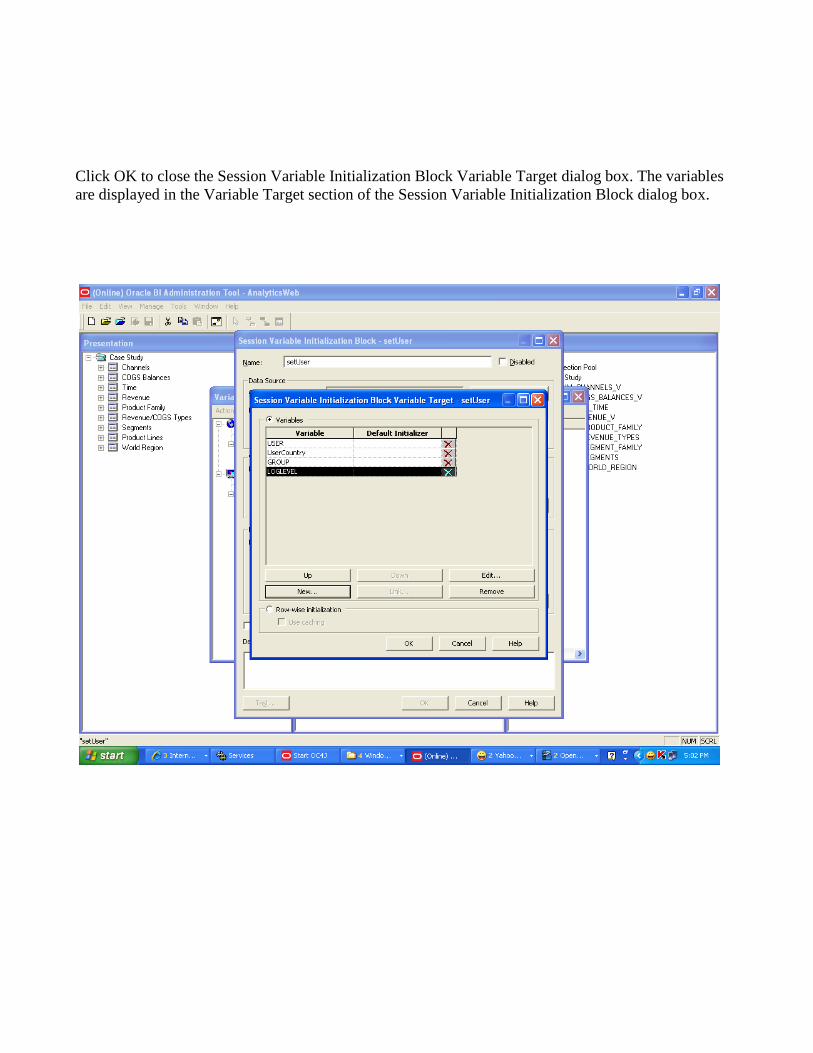
Click OK to close the Session Variable Initialization Block Variable Target dialog box. The variables
are displayed in the Variable Target section of the Session Variable Initialization Block dialog box.

Click OK to close the Session Variable Initialization Block dialog box. The setUser initialization block
is visible in the Security Manager.

Click Action > Close to close the Variable Manager. Check in changes. Save the repository.
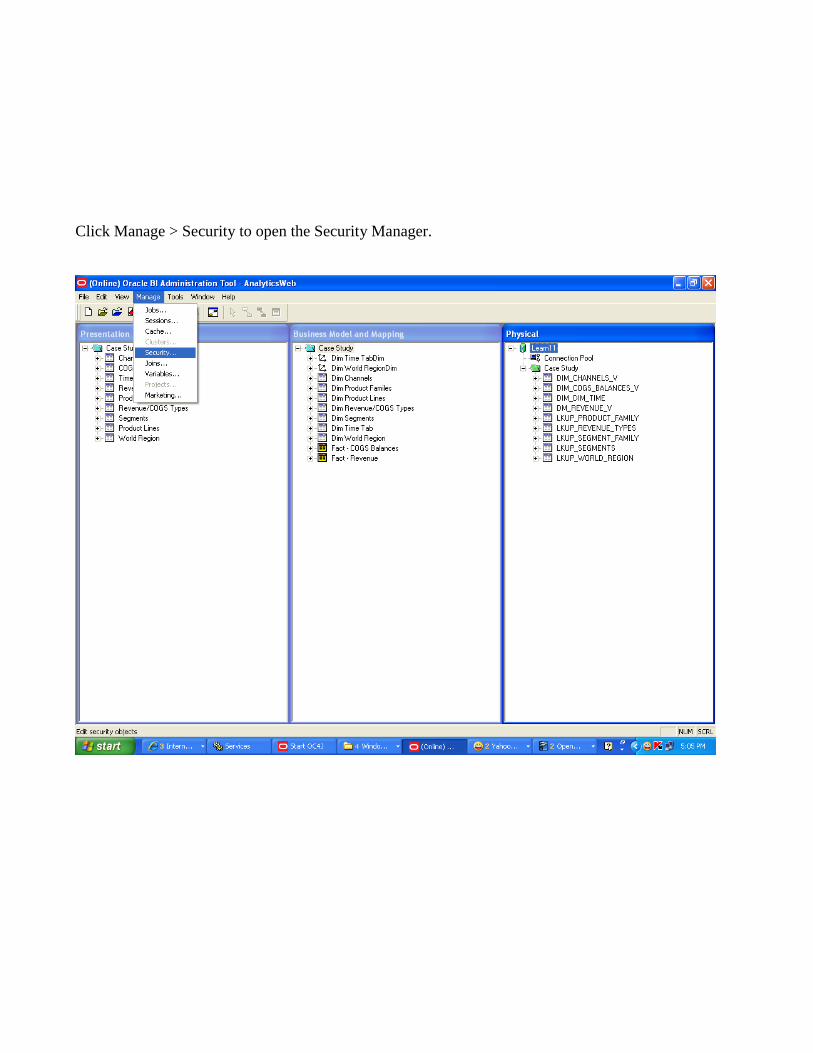
Click Manage > Security to open the Security Manager.

Click Users in the left pane.
Right-click the white space in the right pane and select New User.
Create the new user by giving the name password and the desired log level.

Similarly, create three more users as per the query given in the default initialization block. .
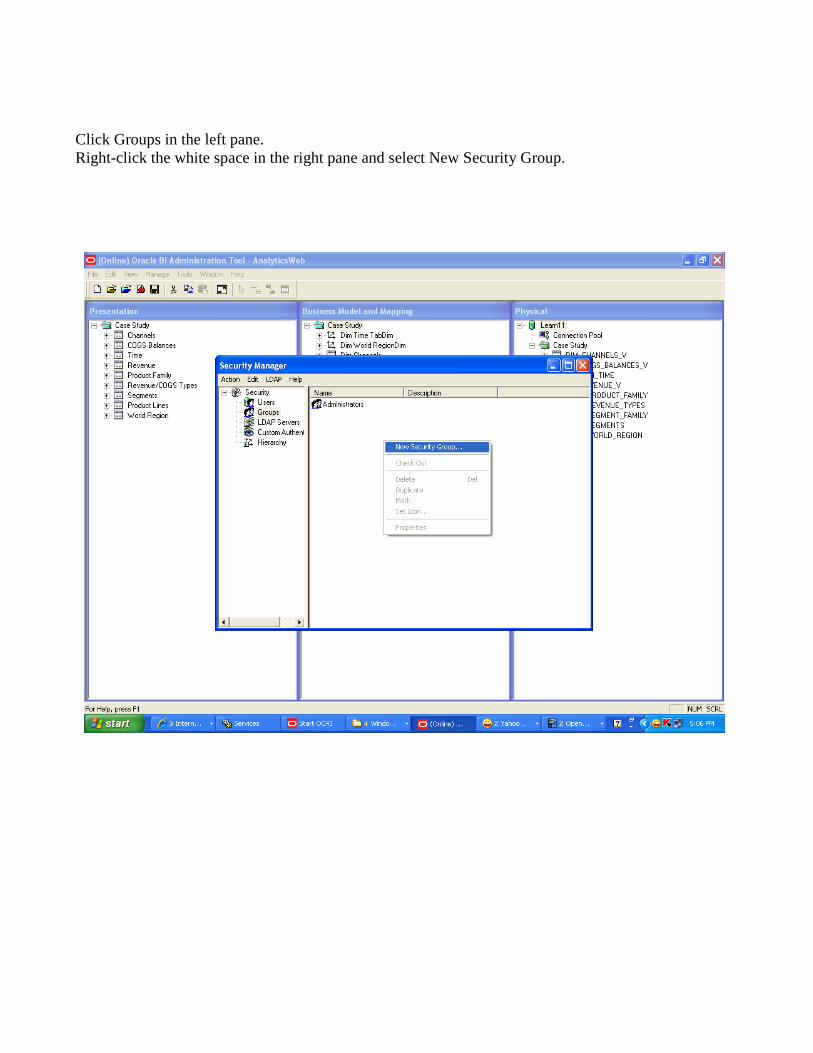
Click Groups in the left pane.
Right-click the white space in the right pane and select New Security Group.
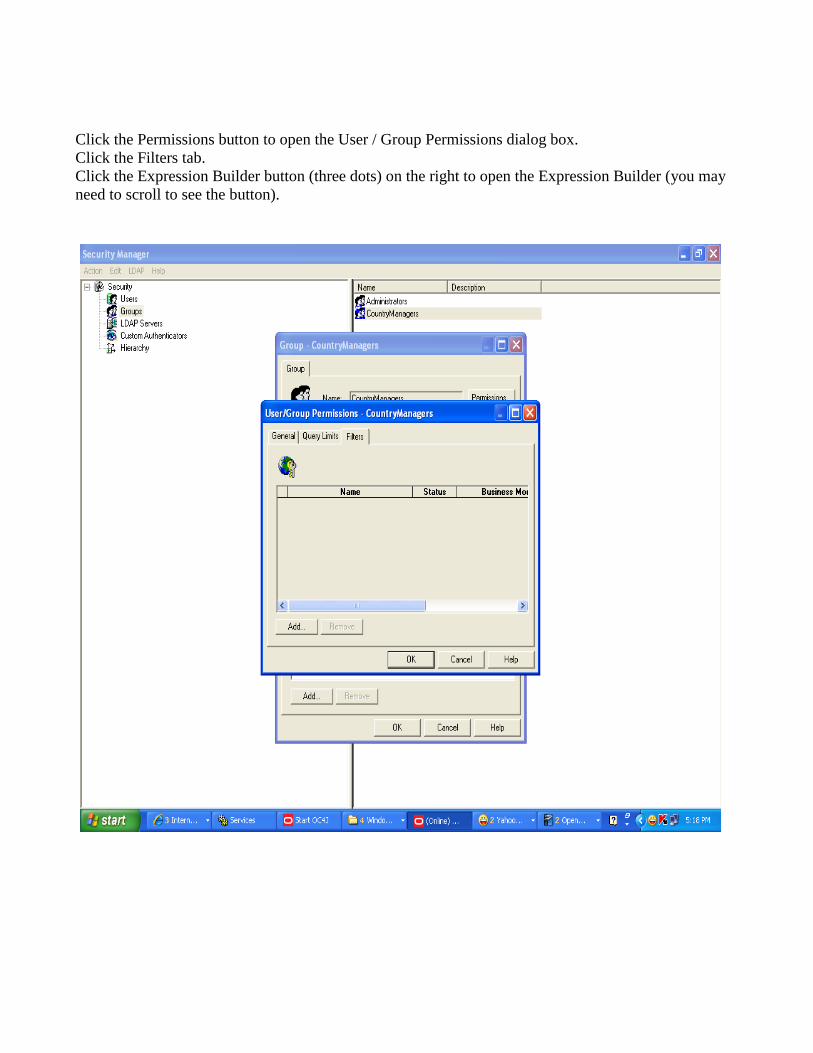
Click the Permissions button to open the User / Group Permissions dialog box.
Click the Filters tab.
Click the Expression Builder button (three dots) on the right to open the Expression Builder (you may
need to scroll to see the button).

Select Logical Tables > Fact - Revenue >Bill to Country and then click the Insert button to add
Country to the formula.
Click the = operator to add it to the formula.
Select Session Variables > UserCountry and click the Insert button to add UserCountry to the formula
as an argument in the VALUEOF()function.
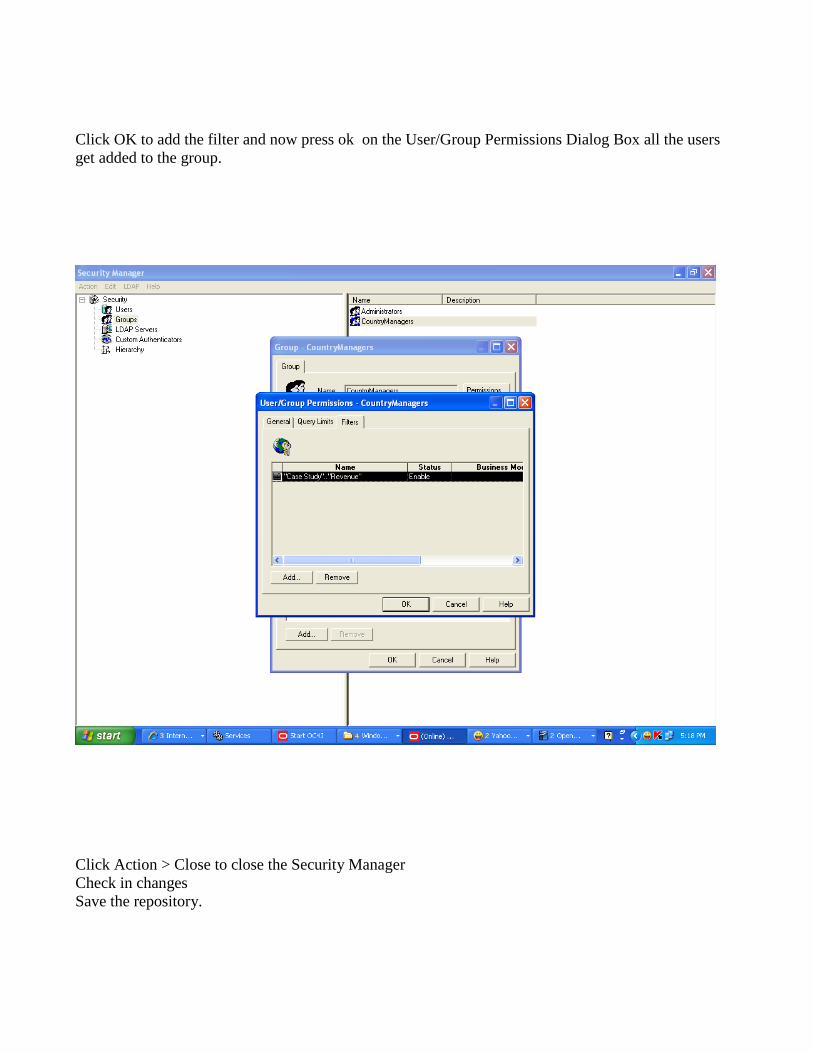
Click OK to add the filter and now press ok on the User/Group Permissions Dialog Box all the users
get added to the group.
Click Action > Close to close the Security Manager
Check in changes
Save the repository.

Login to Answers as Administrator and reload the server meta data.
Now,logout and re-login as one of the users for example as SWAPNA and check the column on which
the filter has been put. It displays the country name accordingly.

Test the initialization block by logging in to Answers as one of the users in the initialization block:
Anusha,Swapna,Divya or Nirosha. As, we have logged in as Swapna it shows the country name
according to the default initialization string.

REPOSITORY VARIABLES:
Repository variables are those variables which have a single value at any point of time.
There are two types of variables:
Static variables and
Dynamic Variables.
Static repository variables have values that are constant and do not change while Oracle BI Server is
running.
Dynamic repository variables have values that are refreshed by data returned from queries in
initialization blocks.
Let us see the creation of a dynamic repository variable.

Click Manage > Variables to open the Variable Manager.
Click Repository > Initialization Blocks.
Right-click the white space and select New Initialization Block to open the Repository Variable Init
Block dialog box.
Name the initialization block SetLatestYear.
Click Edit Data Source to open the Repository Variable Init Block Data Source dialog box.
In the Default Initialization String field, type the following SQL:
SELECT fiscal_year from dim_dim_time where fiscal_date=(select max(gl_date) from dm_revenue_v)
Click the Browse button to open the Select Connection Pool dialog box.

Now, Click Edit Data Target to open the Repository Variable Init Block Variable Target dialog box
Use the New button to create a new variable 'Year'.

Click Test and verify the results you get in the picture.

Close Results.
Click OK to close the Repository Variable Init Block Data Source dialog box.
Click OK to close the Repository Variable Init Block dialog box. The SetLatestYear initialization block
is displayed in the Variable Manager.
Click Action > Close to close the Variable Manager.
Check in changes.
Select File > Check Global Consistency. If the Consistency Check Manager displays any errors, edit
the repository to correct the errors before continuing. If there are no error messages, close the
Consistency Check Manager.
Save the repository.

Now, login into answers and create the filter for the column
Add>Variable>Repository to add the repository variable.

Now type Year ie the dynamic repository variable as the server variable .
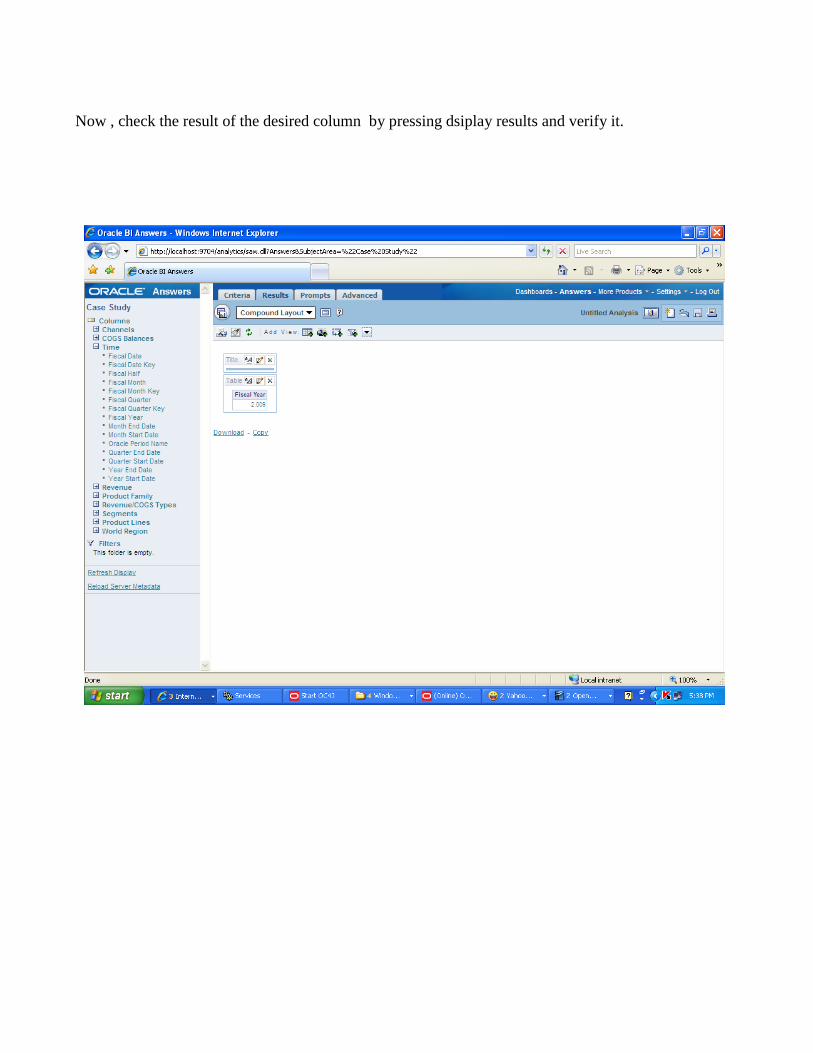
Now , check the result of the desired column by pressing dsiplay results and verify it.

Static Variables :
Click Manage > Variables to open the Variable Manager.
Then click on Static in the left pane and in the white space to the right , right click and create a new
repository variable.

Give the static variable name as product and hard code the value in the default initializer as 'Imaging'.
Press ok and check for the static variable in the variable manager.
Click Action > Close to close the Variable Manager.
Check in changes.
Select File > Check Global Consistency. If the Consistency Check Manager displays any errors, edit
the repository to correct the errors before continuing. If there are no error messages, close the
Consistency Check Manager.
Save the repository.

Now, login into answers and create the filter for the column
Add>Variable>Repository to add the repository variable.
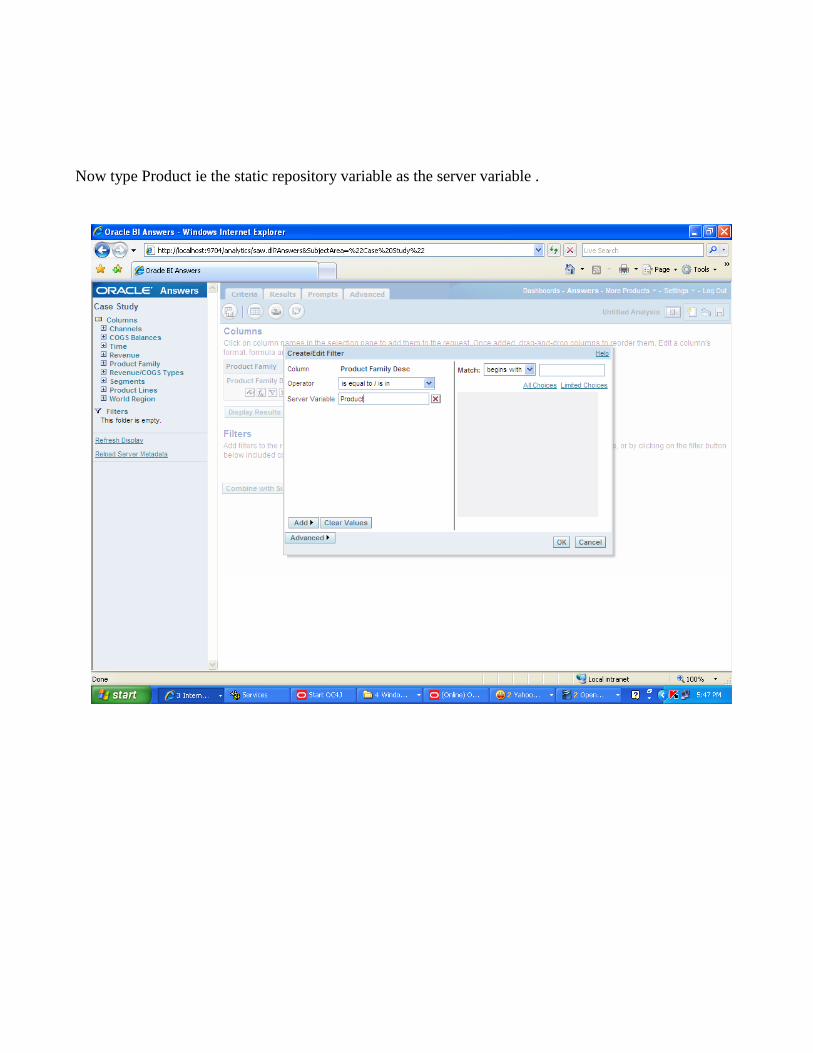
Now type Product ie the static repository variable as the server variable .

After you display the results you we can clearly notice that only the columns having their value equal
to the hard-coded value gets displayed.

SECURITY
BUSINESS REQUIREMENTS:
The following are the Bussiness Requirements for Security
Only Qualified Users Should have access rights to the data analysis applications.
Users should see different data based on their roles without actually creating different
reports.
Data should be protected so that only authorized users can access sensitive information.
ORACLE BI SECURITY MANAGER:
The most basic way to set up with a Username and Password is via the Security Manager.Once
someone is set up in this manner,their Username(:USER) and Password(:PASSWORD) are stored on
the Oracle BI Server.
Set up access privileges for objects such as tables and columns,set filters on information.
Sets up managed query environment providing great deal of control over when users access
data.
Used to set up users and groups, synchronize users and groups.
OBIEE SECURITY METHODS:
OBI-EE security is enforced in two levels:
Object-level Security
Data-level Security
Object- level Security:
In Administration Tool:
Controls access to Analytics repository objects (metadata), such as subject areas, tables, and
columns.
In web applications:
Controls access to Analytics Web catalog objects, such as dashboards, folders, filters, views,
and reports.
Data-level Security:
In the Administration Tool:
Controls access to content that appears in end-user objects, such as dashboard reports

IMPLEMENTATION OF OBJECT LEVEL SECURITY:
Object-level Security for Repository Objects:
Create a new User
Create a new Group in repository
Define Permissions
Create a new user:
Use Security Manager, in the Administration Tool, to create a user in the repository
Manage->security
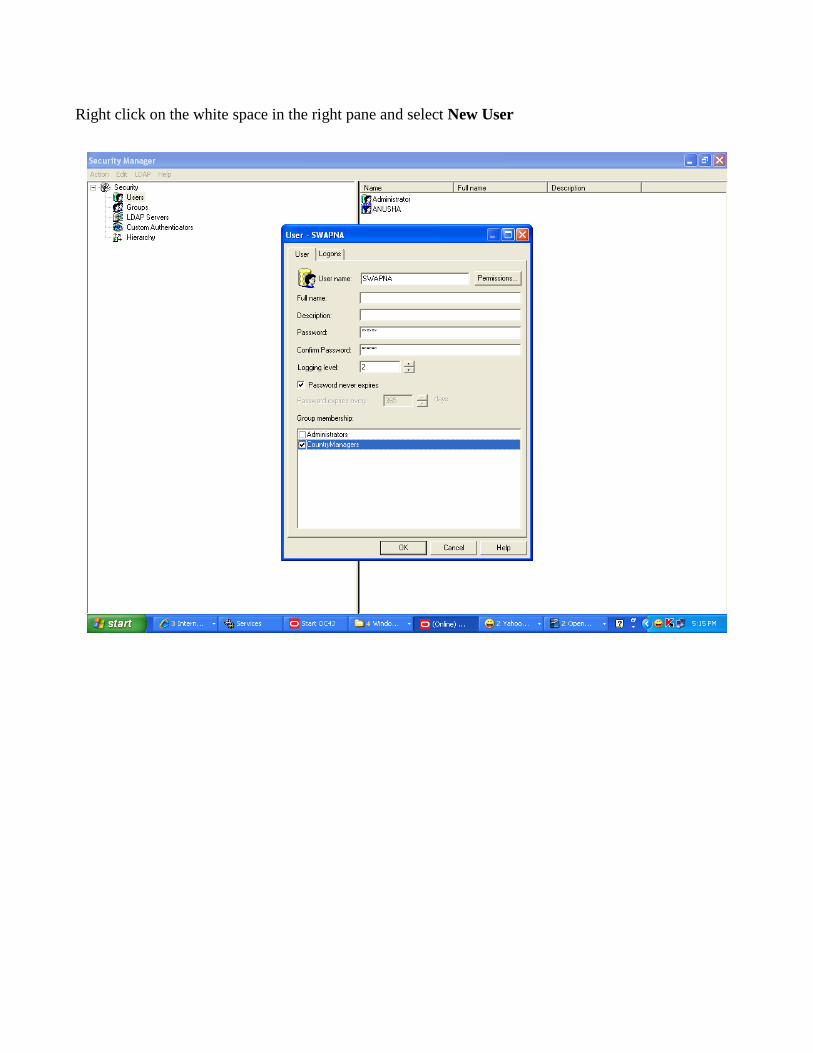
Right click on the white space in the right pane and select New User
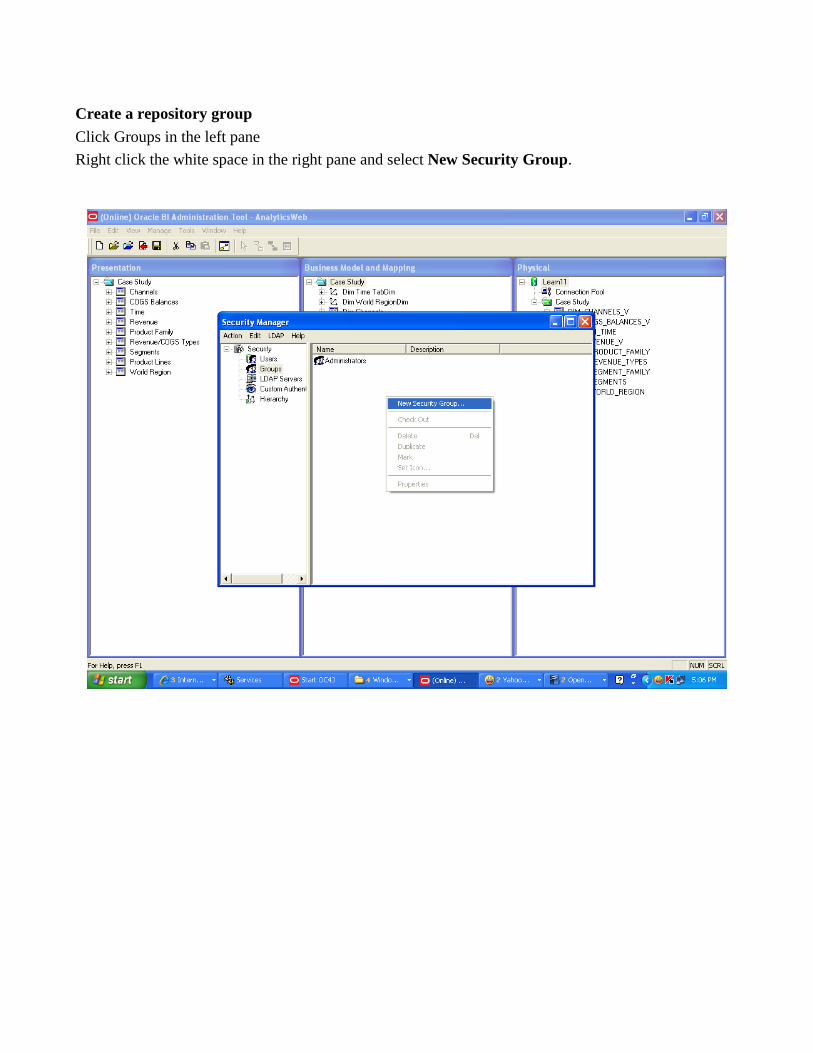
Create a repository group
Click Groups in the left pane
Right click the white space in the right pane and select New Security Group.

Enter the name of the New Group. And Click on add button to add users/groups to the new group

Defining Permissions:
Table level:
To implement the object level security, set permissions in the presentation table properties
dialog box.
As an example, restrict the Channels table from accessing by the 'user2'

Click on Permissions tab
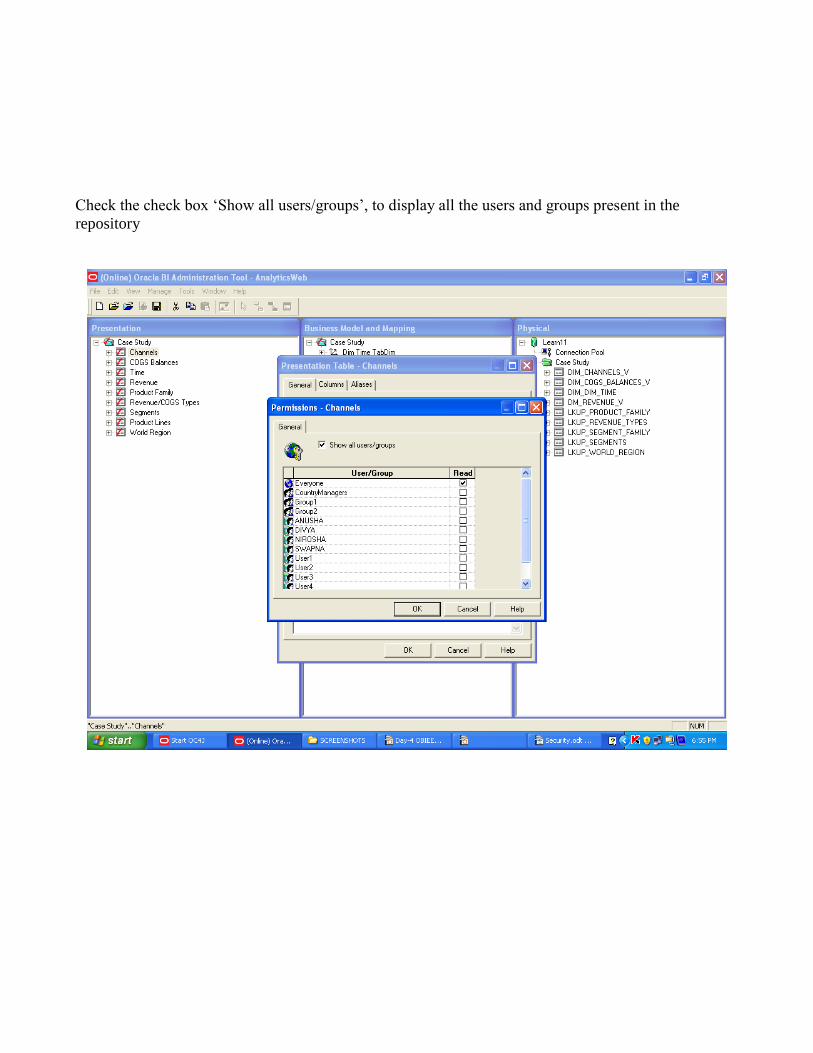
Check the check box „Show all users/groups‟, to display all the users and groups present in the
repository

Uncheck the Read check box for user2
Click Ok to close the Permissions box.
Click Ok to close the Properties dialog box. Save the repository.
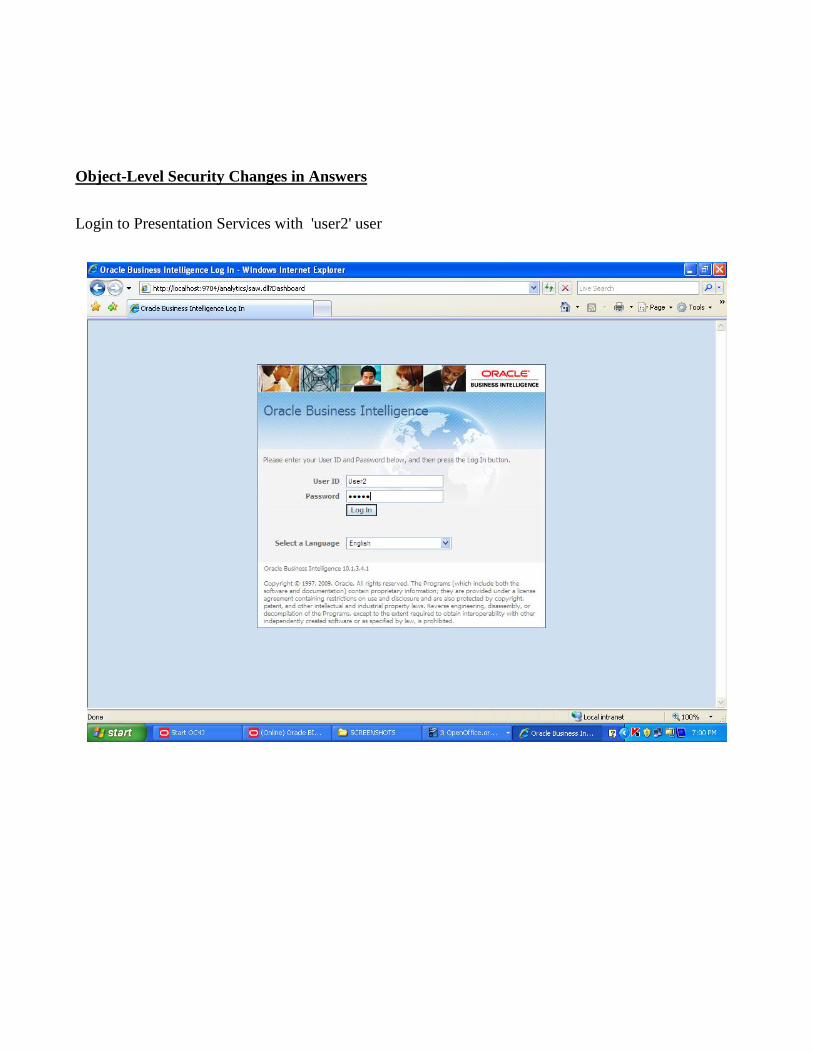
Object-Level Security Changes in Answers
Login to Presentation Services with 'user2' user
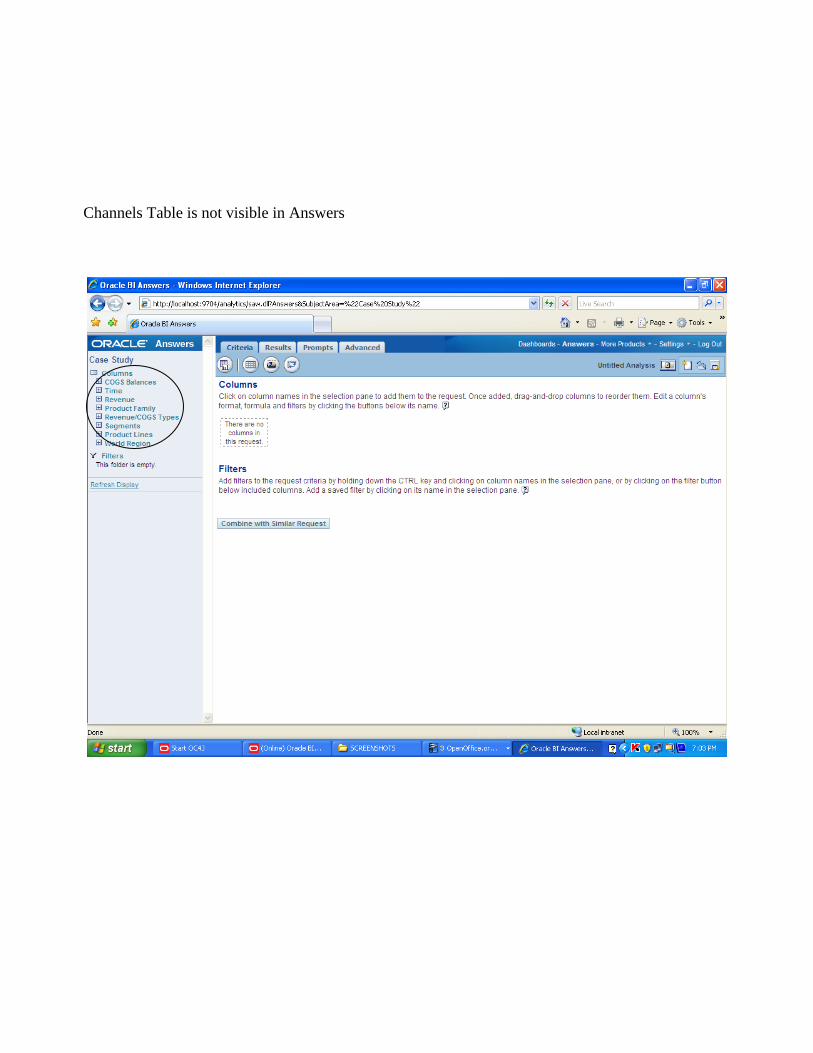
Channels Table is not visible in Answers

Column Level:
To implement the object level security, set permissions in the presentation table Column
properties dialog box.
As an example, restrict the Channels table from accessing by the 'Group1'

Click on Permissions tab

Uncheck the Read check box for Group1(user1,user2)
Click Ok to close the Permissions box.
Click Ok to close the Properties dialog box. Save the repository.
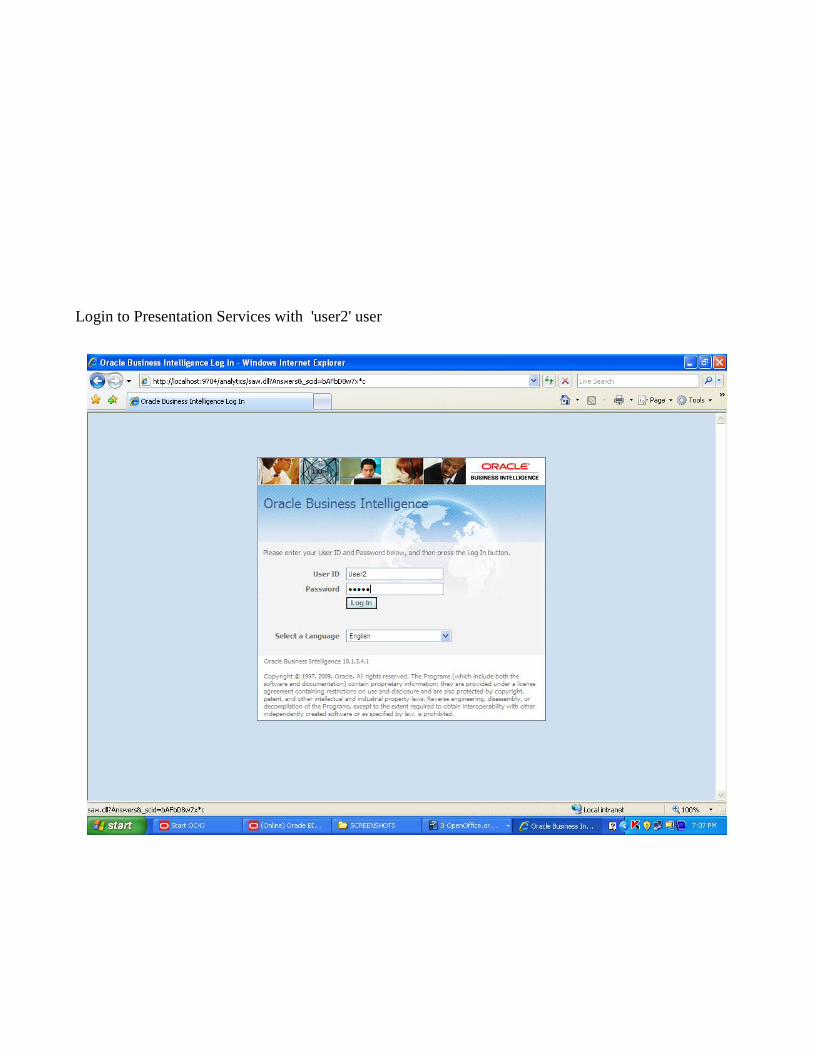
Login to Presentation Services with 'user2' user

'Fiscal Quarter' column cannot not visible in Answers
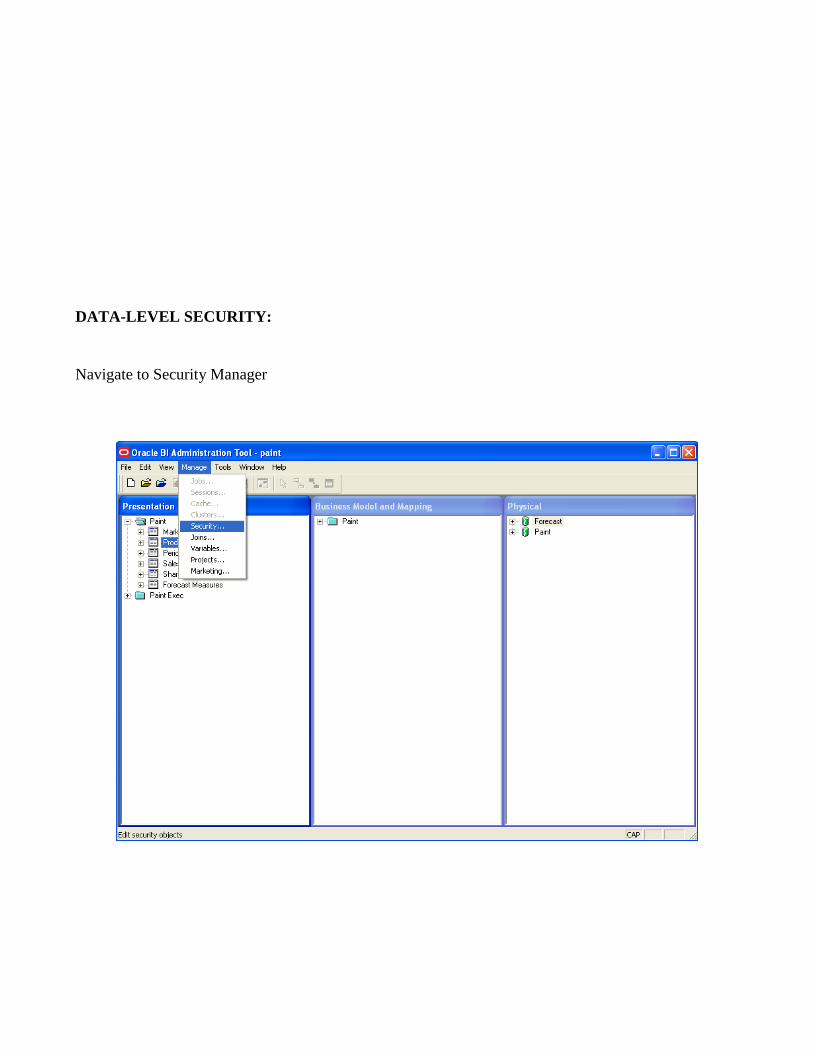
DATA-LEVEL SECURITY:
Navigate to Security Manager
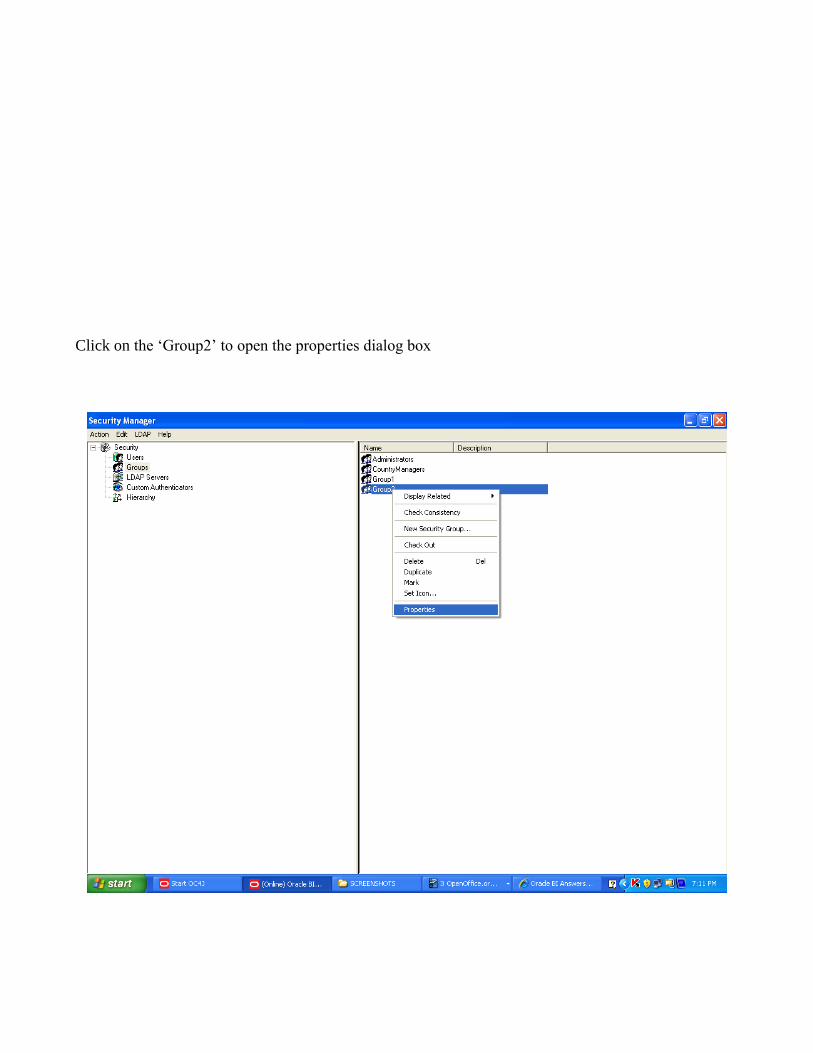
Click on the „Group2‟ to open the properties dialog box
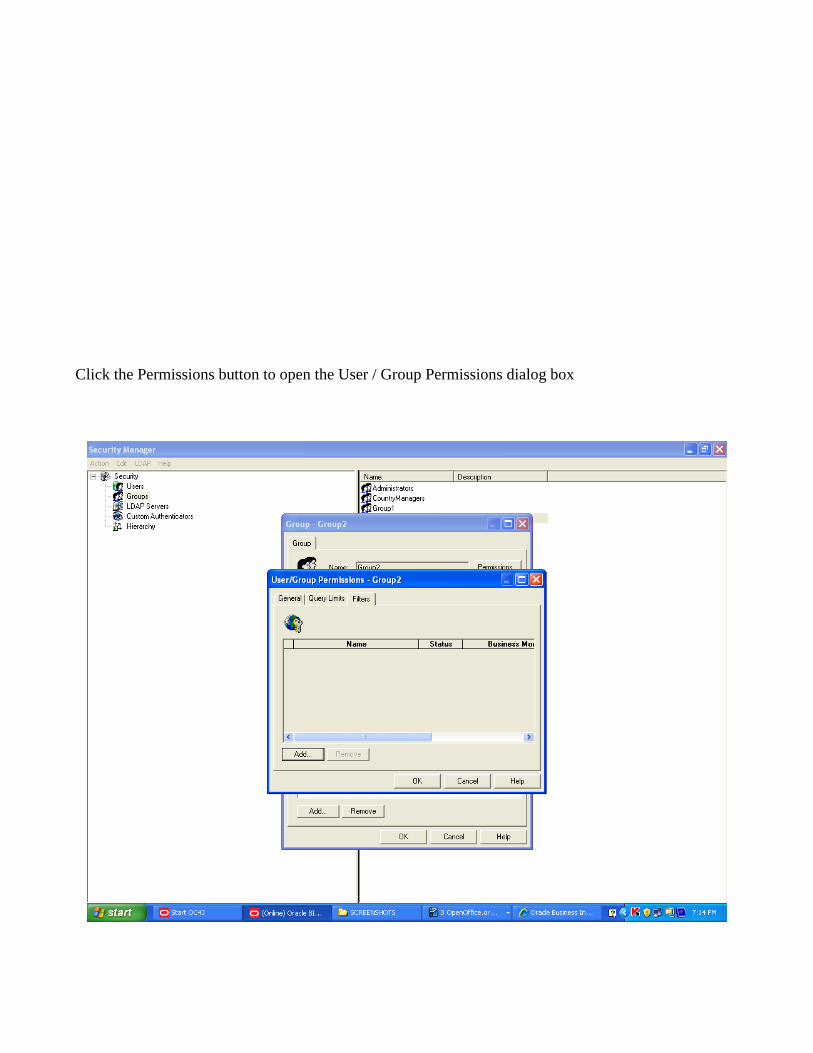
Click the Permissions button to open the User / Group Permissions dialog box

Click on Filters tab to apply the filter
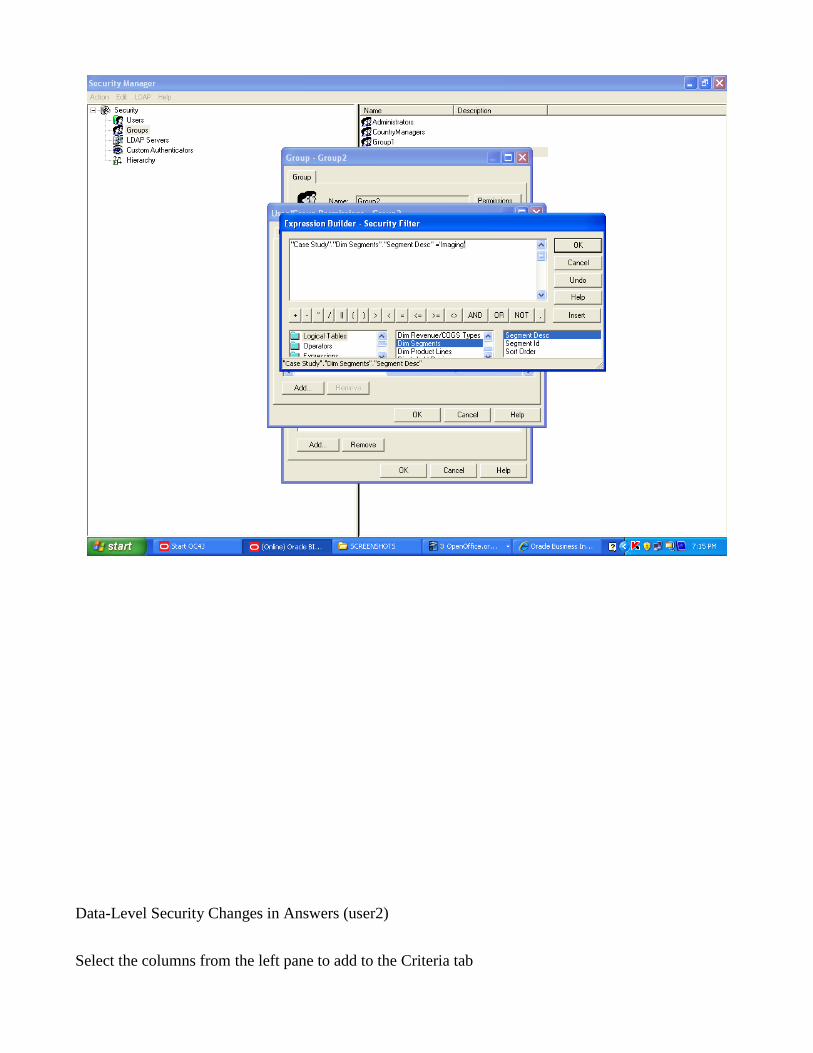
Data-Level Security Changes in Answers (user2)
Select the columns from the left pane to add to the Criteria tab

We can find only selected data(Imaging) of the Column 'Segment Desc'.
Object-Level Security in Presentation Services

Login to Presentation Services with Administrator User to apply the security.
Click on Settings -> Administration to navigate to Presentation Services Administration

Click on Manage Presentation Catalog link to view the Manage Catalog window


Click on the link „ppt_final‟ to view the subfolders and reports present in that folder.
Click on the Permissions symbol related to the folder you want to hide.
Select 'No Access' option to user you want to take out the permissions for the folder.


Click on Finished button to Close Permissions window.
Click Finished button to Close the Catalog window.
Click Close Window button to close Presentation Services Administration.
Now Login with the 'User5' to see the changes.

Report 'Revenue Details' cannot be seen in the selected folder.
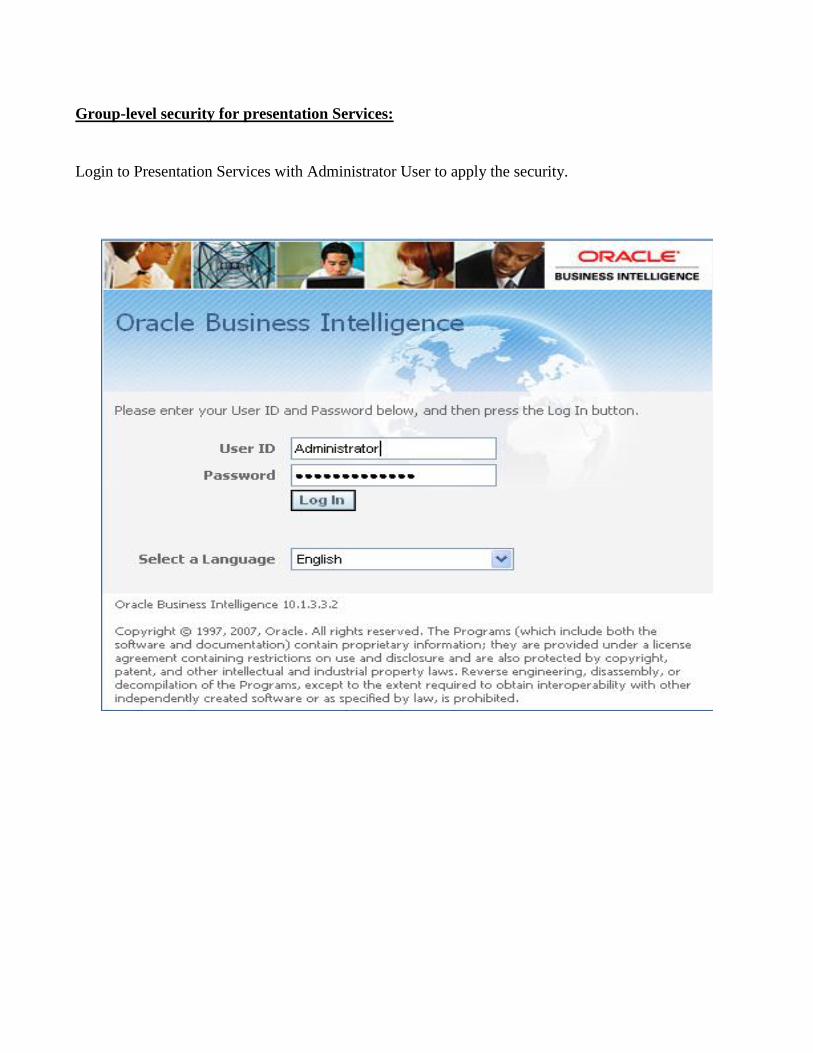
Group-level security for presentation Services:
Login to Presentation Services with Administrator User to apply the security.

Click on Settings -> Administration to navigate to Presentation Services Administration
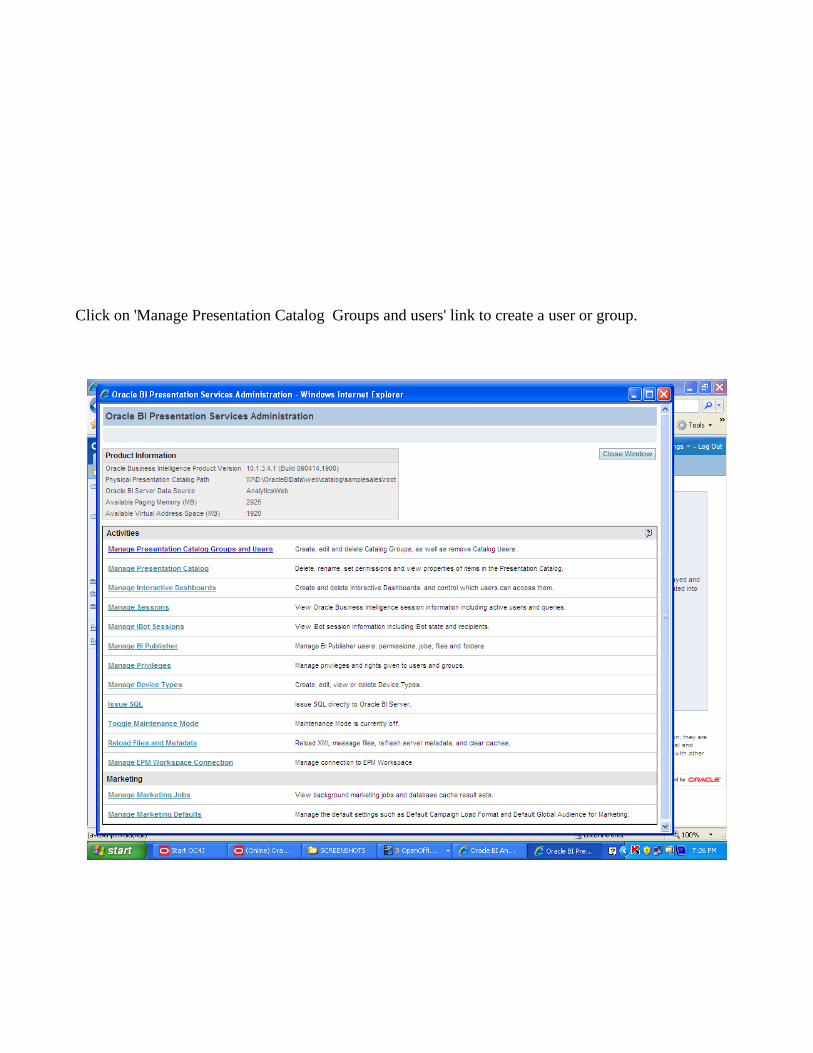
Click on 'Manage Presentation Catalog Groups and users' link to create a user or group.

Create a Catalog Group.
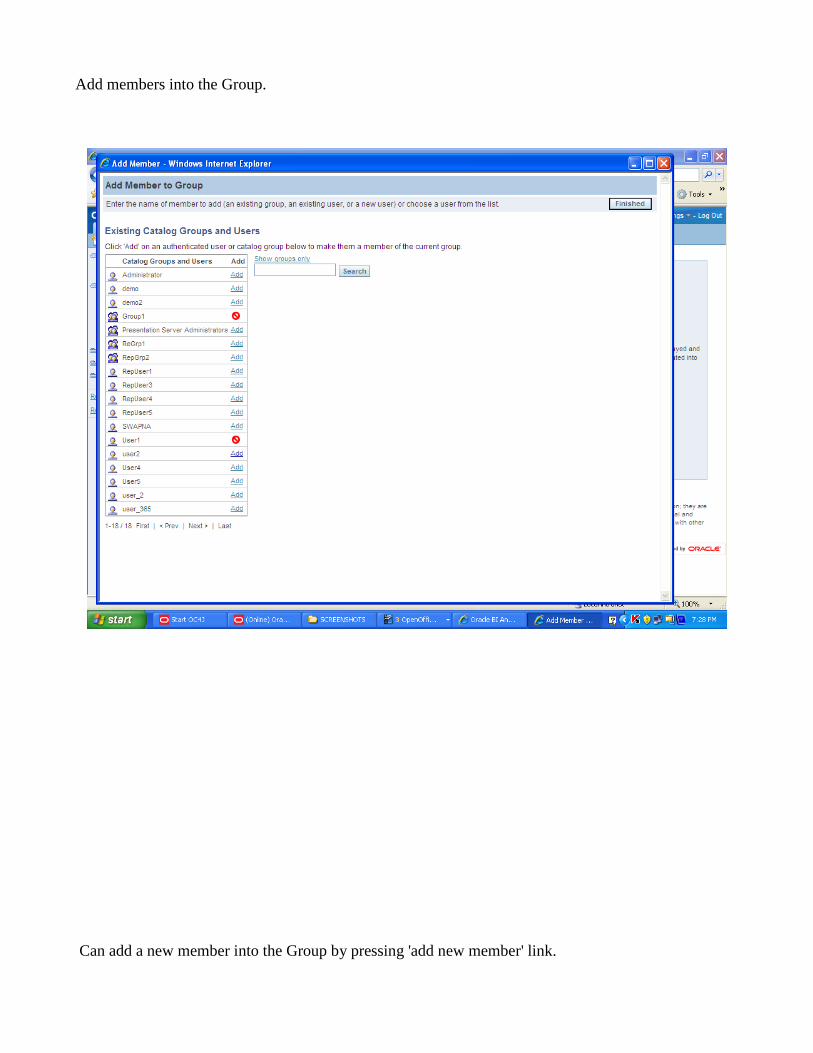
Add members into the Group.
Can add a new member into the Group by pressing 'add new member' link.

Click on 'Manage Presentation Catalog ' link to view the Manage Catalog window.

Click on the link „ppt_final‟ to view the subfolders and reports present in that folder.

Click on the Permissions symbol related to the folder you want to hide.
Select 'No Access' option to Group you want to take out the permissions for the folder.

Click on Finished button to Close Permissions window.
Click Finished button to Close the Catalog window.
Click Close Window button to close Presentation Services Administration.

Now Login with the 'User1' to see the changes.
Report 'Top 10 Customers' cannot be seen in the selected folder.

_________________________________The End___________________________________