Options Trading Strategies: Retirement Income from Weekly ... · Options Trading Strategies:...
43
Options Trading Strategies: Retirement Income from Weekly Options Introduction: What You’ll Learn in this Guide..................................................................................... 5 Chapter 1: Option Basics…………………. ................................................................................................... 6 Calls and Puts………................................................................................................................. 7 Options Profits and Leverage................................................................................................................. 8,9 Exercising Options……............................................................................................................ 10 Intrinsic and Time Value…………...............................................................................................10,11 Bids and Offers……………………………..........................................................................................11 Option Expirations .................................................................................................................................... 11 Options Chains……. .................................................................................................................................. 11,12 Settlements ………………………………...........................................................................................12,13 Benefits of Weekly Options…….............................................................................................. 14 http://www.TradingTips.com 1
Transcript of Options Trading Strategies: Retirement Income from Weekly ... · Options Trading Strategies:...
Options Trading Strategies:
Retirement Income from Weekly Options
Introduction: What You’ll Learn in this Guide ..................................................................................... 5
Chapter 1: Option Basics…………………. ................................................................................................... 6
Calls and Puts………................................................................................................................. 7
Options Profits and Leverage ................................................................................................................. 8,9
Exercising Options……............................................................................................................ 10
Intrinsic and Time Value…………...............................................................................................10,11
Bids and Offers……………………………..........................................................................................11
Option Expirations .................................................................................................................................... 11
Options Chains……. .................................................................................................................................. 11,12
Settlements ………………………………...........................................................................................12,13
Benefits of Weekly Options…….............................................................................................. 14 http://www.TradingTips.com 1

Important Things to Remember ............................................................................................................ 14
Chapter 2 Writing Options ...................................................................................................................... 12
Covered and Naked Calls ......................................................................................................................... 15
Why Sell Covered Calls………………............................................................................................15,16
Naked Calls……………………….…….............................................................................................. 17
Important Things to Remember ............................................................................................................ 17
Chapter 3 Greeks…………….......................................................................................................18
Delta,Vega Gamma, Theta and Rho....................................................................................................... 18,19
Option Pricing…..…………….......................................................................................................20
Implied Volatility…………….......................................................................................................20
Important Things to Remember……........................................................................................ 21
Chapter 4 Credit Spreads…..………............................................................................................22
Bear Call Spread.……………….…….............................................................................................. 22,23
http://www.TradingTips.com 2

Bull Put Spread…………………….................................................................................................24
The Benefits of Credit Spreads ............................................................................................................. 25
Important Things to Remember….......................................................................................... 25
Chapter 5 Trading Credit Spreads ......................................................................................................... 26
Trading Bull Put Spreads………................................................................................................27
Trading Bear Call Spreads……………........................................................................................ 28
Determining Adequate Liquidity……......................................................................................29
Lack of Volatility………………….................................................................................................29
Important Things to Remember….......................................................................................... 25
Chapter 5 Trading Credit Spreads ......................................................................................................... 26
Trading Bull Put Spreads………................................................................................................27
Trading Bear Call Spreads……………........................................................................................ 28
Credit Spread Strategies..……………........................................................................................ 29
http://www.TradingTips.com 3
How to Choose the Right Credit Spread ............................................................................................. 30
The Delta of the Credit Spread .............................................................................................................. 31
The Wideness of the Credit Spread ...................................................................................................... 31
Risk Management…………………….............................................................................................32
Stop Loss and Take Profit..……................................................................................................33
Support and Resistance / Trend Lines .................................................................................................. 34
Specific Trades……………………………………..................................................................................35-40
Important Things to Remember ........................................................................................................... 40
Apendix………………………………………........................................................................................ 41
Bollinger Bands, MACD and RSI............................................................................................. 41-43
http://www.TradingTips.com 4

Introduction
Options continue to grow at a very sharp pace as investor become aware of their enormous
capabilities. With options, an investor can profit during trending markets as well as sideways
markets, and can provide insurance for a portfolio of stocks, commodities and even currencies.
This guide will focus on a number of specific trading strategies, but prior to diving into these
strategies, we will discuss calls and puts, which can be either short or long. That is correct,
you can have a long call or a short put, a short call or a long put, and by the time you are
finished reading this book, it will all make sense to you!
Once you have the basics down, we will move on to credit spread strategies, which the
best income producing strategies available. If you are interested in creating a strategy that
has defined risk, produces profitable monthly cash flows, while performing well in all
market conditions, then credit spreads are the right strategy for you.
Every trader should be aware of these types of option trading strategies, because if you don’t,
you risk being on the losing side of a game. In fact, historically, 80% of the options traded settle
out of the money.
Learning about options may seem like a daunting task at first. In many ways, it is like learning
a new language. Fortunately, once you get a handle on this topic it will make sense.
So read on and learn how you too can profit with credit spreads, and earn a safe
monthly income with predetermine risk.
http://www.TradingTips.com 5
Chapter 1: Option Basics
Exchange-traded options, the subject of this guide, are contracts between two individuals: a
buyer and a seller. There are options available for nearly every kind of financial security. There
are options on foreign currencies, commodities, and even more sophisticated financial
instruments, such as weather, but this guide will deal exclusively with equity options, which
are options that give their owner the right to buy or sell shares of a stock at a specific price, on
or before a certain date.
Options are relatively new products when compared to stocks. Options, in their current
form, have only been around since 1973, and they have only gained their current level of
popularity recently. For example, in 1999, the volume of options contracted traded in the
U.S. stood at around 500 million a year, and by 2013 that number has increased 8 fold.
The options industry notched its second-heaviest volume year in 2013, helped by strong
gains in options tied to benchmark indexes. Trading volumes grew 2.7% in 2013 to 4.1 billion
contracts, with a total of $1.2 trillion in options premium exchanging hands throughout the
year.
Standardization is the key to making options widely accessible to individual investors.
Whereas a real-estate deals for a particular house, is customized, a stock option contract
deals with 100 shares of a given stock, for which there are millions exactly alike.
http://www.TradingTips.com 6

Call and Puts
In this section we will introduce a number of definitions that will help you become familiar
with options.
A call option is a derivative security that gives the option buyer the right but not the
obligation to purchase an underlying stock on or before a specific date.
A put option is a derivative security that gives the buyer the right but not the obligation to
sell or short a stock on or before a specific date.
When an option is converted into the underlying stock, it is said to be exercised.
The strike price of an option can be defined as the price at which the holder of an option can
purchase (in the case of a call option) or sell (in the case of a put option) the underlying
stock when the option is exercised.
The price of the option or value of the option is referred to as the premium. The date when an
option is no longer active is called the expiration date. American style options ca be exercised
on or before the expiration date. European style option can only be exercised on the expiration
date a.
Option Contracts
Options trade in contracts. Each options contract provides the owner the right to purchase 100
shares of the underlying stock. When an investor purchases one option contract for $1 they are
in fact paying for $1 for each share they have the right to purchase. In this case, one contract
would cost an investor $100 dollars ($1 * 100 shares).
An investor who owns one put contract has the right but not the obligation to sell or short
100 shares of the underlying stock.
http://www.TradingTips.com 7

Option Profits
Option prices fluctuate like stocks with market sentiment on daily basis. When the price of the
underlying security is above the strike price of a call option, the option is “in the money”. If
the underlying security is below the strike price of a put option the put is “in the money”.
If the underlying price of the security is equal to the strike price of a call or put option, the
option is “at the money”. If an option is under water, the option is to be “out of the money”.
For example if the strike price on a call option for XYZ stock is $25 and the underlying price
of XYZ stock is $23, the call option is “out of the money”.
Leverage
One of the most apparent advantages of trading options is leverage. Leverage is the ability to
increase the amount of capital you risk, without having to pony up the funds. As discussed
earlier, each option contract controls 100 shares of the underlying stock. The higher the stock
price, the more value the option controls.
For example, if a trader purchases one call option of Apple, with a strike price of $600, when
the price of the stock is $600, the option contract theoretically controls 100 shares * $600
which equates to a notional value of $60,000. Obviously, the owner of a call option would pay
a premium for this type of control, but the amount paid is a fraction of the capital that is
controlled.
http://www.TradingTips.com 8

The price of an Apple May $600 calls is $1.24 which means that an investor would pay $1.24 *
100 = $124 dollars for the right to purchase 100 shares of Apple at $600 dollars a share. This
would allow the investor to use $124 to control $60,000 dollars of Apple stock. As you can see,
the leverage is substantial. For every dollar used to purchase the option, a trader controls $484
dollars ($60,000 / $124)
The profits can also be substantial when using options, but when purchasing options the risk
is limited to the premium. Many traders use options as a way to pump up their ability to hit
home runs on trades where the amounts are substantial, while the risks are limited to the
premiums. Of course, using options in such an aggressive manner amounts to little more than
gambling.
For example, the Apple $600 call discussed above shows a price of $1.24 when the price of
Apple stock was $565. If the price moved to $610 prior to the expiration date of the option, the
value of the option would be at least $10. While owning the stock would allow an investor to
achieve a gain of nearly 8% = ($610 - $565) / $565, by purchasing the call the investor
achieves a return of 700% = ($10 - $1.24) / $1.24.
Leverage on options change based on a few factors. The most important is the distance the
strike price is from the current underlying price of the stock. The $565 option which was at the
money, cost $9.80 per option contract. While $980 controlling $56,500 is substantial, it is not
nearly has high as $1.24 controlling $60,000. This occurs because the price of an option will
increase as the strike price of the option moves closer to the money or further into the money.
Since it is more likely that an option with a strike price of $565 will be in the money as
compared to an option with a strike price of $600, the premium for the $565 option is higher.
This investment strategy is simply intended to illustrate how options can be used to leverage
relatively limited funds for comparatively larger profits. Of course, if you do have a hunch that
a stock will experience a rapid gain, it’s okay to make a play similar to the one outlined above,
so long as you do it with money you can afford to lose. Options do not have to be risky, but
out-of- the-money calls with little time before expiration are risky, and there is a very good
chance you will lose your entire investment.
http://www.TradingTips.com 9

Should You Exercise Your Option
This question has a relatively simple answer. Unless the value you receive from exercising the
option is greater than the value of the option itself, an investor should always sell an option
as opposed to exercising it.
There are a number of benefits of selling an option as opposed to exercising the option into
a stock, or short stock position.
For example, let us assume that an investor purchases option XYZ for $1 that expires in 30
days, at a strike price of $25 dollars, when the underlying price of XYZ is $25.
We will also assume that the underlying price of XYZ moves to $27, over the next 5-days
and the price of the option moves up to $3.25.
The investor can take profit on the option in two ways. The first is by selling the option for
$3.25 and gain $2.25 on the option position. They do not need to wait another 25 days to until
the option expires.
The second way is the exercise the option, but the exercise price, which is also the strike price
is $25 per share. The investor can sell the stock at $27 per share in the market, which would
result in a gain of $2. The investor would miss the additional $0.25 per share that represents
the time value of the option.
Additionally, if the investor exercises the option, they will have to pay for the stock. The stock
price is $25 per share, and each contract is worth 100 shares of stock, which would mean the
investor would have to fork over $2,500 dollars.
Approximately 10% of options are exercised. Instead, it is much easier to sell your option
contract. This achieves the same effect without having to go to the hassle of buying and
selling the underlying shares, and paying the additional commission for the stock.
Intrinsic and Extrinsic (time) value
The price of the option consists of two specific parts, the intrinsic value of an option and
the value that is attributed to the amount of time left before the option expires.
The intrinsic value of an option is calculated by determining how far an option is in the
money. Remember, an in the money call option occurs when the price of the underlying stock
is above the strike price.
Therefore, if the price of a stock is $30 per share and the strike price of a call option is $25,
the intrinsic value of the option is $5 per contract.
http://www.TradingTips.com 10

The time value of an option is the price of the option minus the intrinsic value of the option. For
example, if the price of the option is $5.5 per contract when the share price is $30 and the strike
price of the call option is $25, then the time value of the option is $5.5 - $5.0 = $0.50.
The time value of an option is constantly declining. It erodes away faster as the expiration day
approaches.
Bid / Offer
Similar to stocks, options trade with market sentiment and fluctuate throughout the
trading day.
When an investor is looking to purchase an option, he can either purchase it at the offer
price, which is the price that a market maker (or another investor) is willing to sell that
option, or place a bid, which is the price where the investor is willing to buy the option. To
reiterate, the bid is the price where investors are willing to purchase an asset, while the offer
is the price were investors are willing to sell or short and asset.
Option Expirations
An option exchange will offer a number of different types of option expiration dates. Most
liquid options have expiration dates once a month. Options exchange also offer quarterly
options, which expire at the end of every quarter.
Another liquid option is a weekly option. Weekly options are options that are listed to provide
expiration opportunities every week. Weekly options are typically listed on Thursdays and
expire on Fridays. Weekly options are not listed if they would expire on a 3rd Friday of a
month or if a Quarterly option will expire on the same day. Weekly options are physically
delivered into the underlying stock.
Options Chains
When an investor looks at options that he is interested in trading there are a few key
components that are pertinent. Besides focusing on the underlying stock, the strike price of the
option, the premium and the expiration are the most important factors a traders should
evaluate when looking at specific options.
http://www.TradingTips.com 11

As discussed earlier, the premium is usually quoted with a bid / offer spread, which
reflects were buyers will buy the options and sellers, will sell options.
In addition, an option chain will tell an investor the liquidity of the option by reporting the
open interest, which is the total number of outstanding long and short options contracts that
have not yet been closed out by offsetting transactions. Additionally, the options volume also
helps describe liquidity. Volume tells an investor the number of options that of a specific strike
price that have traded during a day.
High levels of open interest tell an investor that other traders are willing to buy or sell an
option if he is interested in buying or covering the option before the expiration date.
Settlements
Option settlements can be tricky as each stock or index could potentially have a different
settlement methodology. In this guide we will cover some of the basics, but prior to trading a
specific option an investor should understand the settlement procedures if they plan on
holding the option through settlement.
Exchange traded equity options are "physical delivery" options. This means that there is a
physical delivery of the underlying stock to or from your brokerage account if the option
is exercised.
The owner of an equity option can exercise the contract at any time prior to the exercise
deadline set by the investor's brokerage firm. Generally, this deadline occurs on the option's
last day of trading. The expiration date for equity options is the Saturday immediately
following the third Friday of the expiration month until February 15, 2015.
http://www.TradingTips.com 12

If a call option is exercised, the owner of the call will immediately own the shares of the
underlying stock. The new shares will have a value and the owner of these shares will need to
have the capital available to purchase the shares.
For example, let us assume that an investor exercises a call option on XYZ stock that has a
strike price of $20 per share. For every contract (100 shares) the owner of the call exercises, he
will need to post funds of $2,000 to hold the shares.
If a put option is exercised, the owner of the put will immediately be short the shares of
the underlying stock. Short sales have specific margin requirements as the owner is in fact
borrowing the stock from his broker, with an agreement to pay the stock back once it is
repurchased. Prior to exercising a put option, an investor should understand the costs
associated with short sales.
Index Option Settlement
Details of an index option's sale and expiration can be determined in a variety of ways, but the
two most common are an AM Settlement and a PM Settlement. Like the hours of the day,
these exercise settlements reflect the opening numbers and closing values of the day's trading.
To avoid surprises on the Friday of stock options expiration, the issues associated with the
individual settlement styles require careful handling.
PM Settlement
A PM Exercise Settlement establishes its value at the close of the market, when the last
reported prices for the individual stock components are calculated to determine the
index's value. Most ETFs are PM Settlement, including the most favored (QQQ), (SPY),
(IWM) and (DIA).
AM Settlement
AM Exercise Settlement is established by calculating the opening prices of the individual
component stocks of an index and thus the index option is exercised or sold based on
that value. The S&P 500 Index (SPX) covering a broad range of industries is a commonly
known AM Exercise Settlement index option.
http://www.TradingTips.com 13

The Benefits of Weekly Options
Weekly options are generally attractive to both buyers and sellers. Buyers generally look at
weekly options as a way to take a quick gamble on a stock or ETF without paying for
substantial time value. For sellers, weekly options generally have high levels of implied
volatility, which make these options relatively attractive, as the value of time is expensive,
even if the premium does not have a high dollar value.
When selling options, time is always on your side. You earn money each day that the option
you sell remain out of the money.
While selling weekly options might look obviously profitable, you have to be very aware that if
the trade goes against you, you will be forced to buy back your short put or call at a huge loss.
Important Concepts to Remember
Call options give the holder the right—but not the obligation—to buy a given stock at
a specific price before their expiration date.
Options are traded in contracts of 100 shares. The quote of an options contract is priced per-share, and must be multiplied by 100
to get the real contract price.
The strike price of a call option is the price at which shares of the underlying stock
can be purchased.
Options contracts expire the Saturday after the third Friday of the given month. A call option with a strike price lower than the current share price of the
underlying stock is considered in-the-money.
A call option with a strike price higher than the current share price of the
underlying stock is considered out-of-the-money.
The intrinsic value of an in-the-money call option is the difference between the
share price of the underlying stock and the strike price of the option.
http://www.TradingTips.com 14
Chapter 2: Writing Options
Thus far, we have looked at options from the perspective of the buyer. We touched on the
idea of selling option but this was in context of selling options that have already been
purchased. Investors can also short options, which is similar to the idea of shorting a stock.
When an investor short sells an option they have unlimited risk since the upside on a call
option is infinite.
To short an option, a buyer needs someone to be a seller and create the option contract. This
person is the option writer. The writer of the option receives a premium for giving up the rights
associated with buying an option.
Covered and Naked Calls
A “covered call” is a combination of products, which include both options and stocks. This is a
strategy were you sell a call against stock that you already own or are planning to purchase at
the same time you buy the stock.
This strategy is an income-producing strategy, the strategy is to sell, or “write”, call options
against shares of stock you already own. Typically, you will sell one contract for every 100
shares of stock. In exchange for selling the call options, you collect an option premium.
Obviously, that premium comes with an obligation. If the buyer exercises the call option you
sold, you may be obligated to deliver your shares of the underlying stock. Hence, the name of
the strategy, “covered call” as the investor is covered by the underlying stock which mitigates
the covered call sellers risks.
Investors should be aware that covered calls are subject to transaction costs. This strategy
involves two trades and therefore has two commissions: one to purchase the stock and one to
sell the call.
Why Sell Covered Calls
When you sell covered calls, you are hoping to keep your shares of the underlying stock while
generating extra income via the option premium. You will want the stock price to remain below
your strike price, and avoid having the calls exercised, which in turn will call your shares of stock
away. If price stays below the strike price of the call, the options will expire worthless, and you
http://www.TradingTips.com 15

will keep the entire option premium at expiration. Additionally you will also keep your shares
of the underlying stock.
If your stock’s price is neutral or dropping a bit, but you still want to hold onto the shares
longer-term, writing covered calls can be a good way to earn extra income on your long
position. In essence, you are capping your upside by selling away a call, but you are also
reducing your risk to lower prices, as the premium acts as a partial hedge of your shares.
An example of a covered call in action
Imagine you already own 100 shares of XYZ. You bought them for $50 each and XYZ is trading
at $50. The stock has traded in a tight range between $48 and $52 over the past 3-months
and it does not seem likely to rise much in the short-term. You still believe the stock will rise
over the long-term, and you are waiting for a catalyst to push the stock price higher. You
decide that in addition to your dividend, you want to see if you can make a little extra cash
while waiting for a bigger bump in the stock.
In June, you sell one covered call contract on XYZ. Let us say the option you have sold has
August expiration and a strike price of 55. The premium you collect is $1.50 per option, or
$150 ($1.50 x 100 shares = $150) less commissions 10.
If XYZ stays around $50 until August expiration, the call would be out-of-the-money. That
means buying the stock for the strike price $55 is more expensive than buying the stock in the open
market at the price of $50. Therefore, the option buyer would not exercise the call and the option
would expire worthless. You pocket the $150 premium and keep your 100 shares of XYZ. Keep in
mind, as long as the options you sell are not exercised, you can repeat this strategy from month to
month, selling additional covered calls against the same shares of stock.
Now let us say the stock price moves up to $56, the buyer of the call option will likely
exercise the call option on the expiration date. When the stock is exercised, your shares will
be called away and you will receive the proceeds of the sale of the stock at the strike price of
$55. You still get to keep your premium, which is $150.
You are also protected somewhat if the price of the stock falls. If the stock price falls to $48.50
at expiration, the buyer of the options will not exercise the options contract, and you will
receive $150, which offsets the decline in the shares of the stock price.
http://www.TradingTips.com 16
Naked Calls
The opposite of covered calls is naked calls which are very risky as they have unlimited risk. The
price of a stock can theoretically climb to infinity. The naked call seller does not own the
underlying stock. As opposed to having your stock called away as in a covered call situation, the
naked call seller would need to go out on the open market and purchase the stock, which will
be delivered to the call buyer.
A naked call has a similar risk reward profile of shorting a stock. The investor is betting that the
price of the stock will either move lower or remain the same. The breakeven point on a naked
call is the strike price plus the premium.
For example, assume an investor shorts call XYZ at a strike price of $15 per share, with an
expiration date in 30 days. The premium received for this call is $1, which makes the breakeven
price for the underlying stock $16 per share ($15 strike + $1 Premium = $16).
Important Concepts to Remember
A covered call is an option were the writer owns the underlying stock Covered calls allow an investor to earn additional income while the stock
is consolidating
Covered calls also provide protection against an adverse move in the underlying stock A naked call is one where the option writer does not have any underlying stock
to protect his position
http://www.TradingTips.com 17

Chapter 3 Options Greeks
The Delta
When an investor purchases a call option, they are purchasing the right to buy the underlying
security. As the security rises in price, the value of the option also generally rises. There are a
number of inputs to an option price that creates this dynamic. One of these components is the
idea that the investor owns a theoretical number of shares of the underlying stock, which
allows the value of the option to increase as the price of the underlying security increases. This
theoretical value is called the delta of the option.
The actually definition of the delta is the change in value of an option for every change in $1
of the underlying stock.
The theoretical number of shares will change with the underlying stock prices as well as time
to maturity. Generally, “at the money” call option have a delta of 50%. This means that one
option contract on XYZ stock will have a theoretical value of 50 shares. It also means that the
option has approximately a 50% chance of expiring in the money. If the price of the underlying
stock rises $1 dollar, with all other inputs into the option remaining the same, the value of the
option will increase by $50 dollars (50 shares * $1).
Vega
The value of an option is determined by many factors, which include the perception of how much a
specific security will move over a certain period. Market participants value this by determining the
implied volatility of a security. The implied volatility is a forward-looking concept, which is the
amount a security will move in percentage terms over a specific period on an annualized basis.
Implied volatility is different from historical volatility as it is the markets
http://www.TradingTips.com 18
estimate of how much a security will move in the future, compared to how much the
market has actually moved in the past.
The exposure and options trader has to implied-volatility is referred to as vega. The vega of a
option is the change in the value of the option for every 1% increase in implied volatility. A
long vega position means that a trader benefits as implied volatility rises. A short vega
positions benefits when implied volatility of a security falls. Option values decline if implied
volatility drops.
Gamma
Gamma is defined as the rate of change of the delta with respect to the underlying
asset's price.
All individual option trades have inherent gamma risk associated with the position. The closer
the strike price of an option is to the current underlying market, the higher the gamma. The
closer an option is to expiration the higher the theoretical gamma.
Gamma is dynamic risk, meaning the risk changes as other option inputs change. Gamma is a
function of the underlying price of the asset, along with time to maturity, interest rates, and
implied volatility. The underlying price plays the largest roll toward determining the gamma
associated with an individual option.
Theta
The theta of an option refers to its exposure to time. The value of an option erodes as the time
to maturity declines. An investor can measure the theoretical cost per day of an option, which
describes the daily theta.
When an option is out of the money, the entire option is described as only having time
value. This is also referred to as the extrinsic value of an option. When the price of an
underlying security moves above the strike price of a call option, the difference between the
underlying security price and the strike price is called the intrinsic value and the balance of
the value is referred to as the time value or extrinsic value.
Rho
Rho is the sensitivity of an option to changes in interest rates. Rho generally is more influential
on options that have long tenors. This Greek calculation mainly focuses on the present value of
the option those changes as the discount value of the security changes.
http://www.TradingTips.com 19
Rho can be hedged buy using interest rate products such as futures or swaps. An investor who
trades leap options, which are long dated options, could consider hedging their Rho exposure.
Option Pricing
Using a combination of values, which include, the strike price, the time to maturity, the
implied volatility, the underling price of a security, and the current interest rates, an investor
can value the price of an option.
Most market makers use a basic options pricing model created by Black and Scholes. There are
many variations but this close formed solution values an option based on the chance that it
will be in or out of the money. It is important for options investors to understand that an
option is value based on the markets interpretation of the chance that the underlying price of
a security will be in the money.
Implied Volatility
Fear and greed generally dominate the capital market landscape, especially in the equity
space. When prices of stocks climb, investors may become complacent, believing stocks can
move higher indefinitely. When stocks begin to fall, fear grips investor sentiment, and many
seem to head for the exit doors at the same time.
One way to gauge investor sentiment based on fear and greed is to monitory implied volatility.
Options traders use the implied volatility to price option on stocks. Although implied volatility
is just one component of an option price, it is generally the most important. Implied volatility
is the markets estimate of how much a security will move in percentage terms on an
annualized basis.
The price of an option is mainly based on the markets perception that a security will
move above or below the strike price (depending on whether the option is a call or a
put), on or before the expiration date of the option. The chance of that type of move is
based on the percentage chance that a specific move will take place. This chance is
captured implied volatility.
Prior to risking capital in the options markets, an investor should have a basic understanding
of the numerous risks that affect option transactions.
Important Concepts to Remember
The delta of an option is the change in the value of the option for every $1 change in
the value of the underlying stock
http://www.TradingTips.com 20

The vega of an option is the change in the value of the option for every 1% change
in implied volatility
Implied volatility is the markets estimate of how much the underlying stock will
move over a specific period on an annualized basis
The gamma of an option is the change in the delta relative to the change in
the underlying stock
The rho of a stock is the change in the value of an option for every 1 basis point
change in the value of interest rates
The theta of an option is the change in the value of the option for every one day
less relative to the expiration date
http://www.TradingTips.com 21
Chapter 4 Credit Spreads - Introduction
A credit spread is a type of option spread that allows an investor to speculate on the
direction of the underlying without the stock moving very far.
There are two types of vertical spreads, credit spreads and debit spread. In a credit spread
transaction the investor receives cash which is a credit when placing the trade, with a
debit spread the investor is paying cash or a debit to put on the trade.
A credit spread is a type of vertical spread, whereby the investor purchases a specific number
of options and simultaneously sells an equal number of options of the same underlying
security, with a different strike price. Each option within the spread will have the with the same
expiration date.
Credit spreads are used to initiate options positions were the risks are clearly defined. The
potential upside and downside are capped by the offsetting option positions. A credit spread
can be created with either all calls or all puts, and can be bullish or bearish.
A credit spread is an option spread strategy where the premiums received from the options
that are sold are greater than the premiums paid from the options that are purchased. The
resulting credit is deposited into the investors account when the position is entered.
The net credit received from this type of option structure is also the maximum profit
attainable when implementing the credit spread option strategy.
There are two specific types of credit spreads, the bear call spread and the bull put
spread. Credit spreads allows an investor to profit even when the price of the underlying
stock is moving sideways.
Bear Call Spread
A bear call spread is a vertical spread where the investor sells call option and simultaneously
purchases another call option with a higher strike price. For example, an investor sells a call on
XYZ stock when the stock price is $37 dollars per share, and simultaneously purchases at $40.
The premium on the $37 call option is $3, while the premium for the $40 call is $1. The credit
on this credit spread is $2 ($3 - $1)
The maximum gain attainable using the bear call spread options strategy is the credit received
upon entering the trade. To reach the maximum profit, the stock price needs to close below the
http://www.TradingTips.com 22

strike price of the lower strike call sold at expiration. In this case stock XYZ would need to be
below $37 per share.
The formula for calculating maximum profit is:
Max Profit = Net Premium Received – Brokerage Fees
If the stock price rise above the strike price of the higher strike call at the expiration date,
then the bear call spread strategy suffers a maximum loss equals to the difference in strike
price between the two options minus the original credit taken in when entering the position.
In the case of XYZ stock the investor would lose $1, which is calculated by subtracting
the difference between $37 and $40, and adding back the $2 of premium received from
the difference in the premiums.
The payout diagram shows that as the stock price rises, the investor loses up to the
maximum of the difference between the two strike prices, and as it falls the investor receives
the premium differential.
Aggressive bear call spreads are option structures where the investor sells a call that is in the
money. In using the example of XYZ stock, the investor would sell a call $35 call and purchase a
$38 call. The $35 call would garner a premium that incorporated the $2 dollar per share that
http://www.TradingTips.com 23
the call is in the money plus the time value of the option. This is an aggressive option since by
selling an option that is in the money, the investor guarantees a loss if the underlying security
does not move at all.
Bull Put Spread
A bull put credit spread is a trading strategy used when a trader thinks a security will
move higher, and allow him to capture the credit that is received from selling a put, and
simultaneously purchasing a deeper out of the money put.
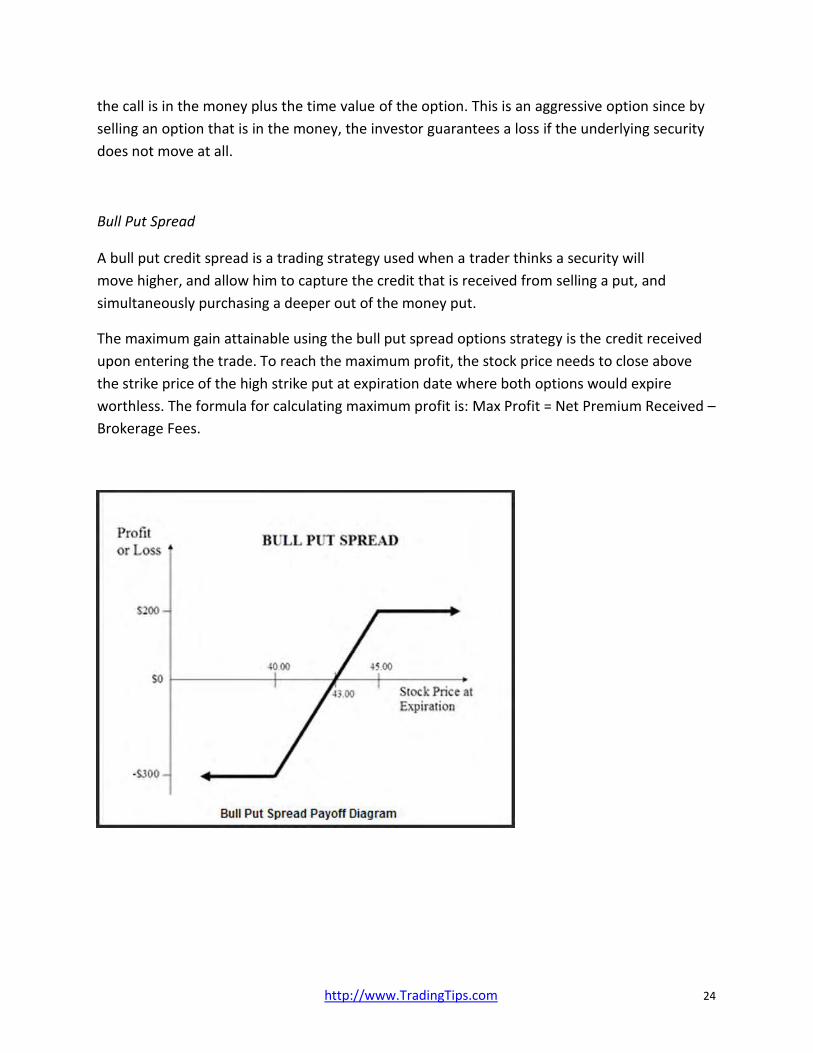
The maximum gain attainable using the bull put spread options strategy is the credit received
upon entering the trade. To reach the maximum profit, the stock price needs to close above
the strike price of the high strike put at expiration date where both options would expire
worthless. The formula for calculating maximum profit is: Max Profit = Net Premium Received –
Brokerage Fees.
http://www.TradingTips.com 24
The Benefits of a Credit Spread
A credit spread strategy allows an investor to assume a specific risk, for a predetermine
reward. By purchasing either an out of the money call for a bearish call spread or an out of the
money put, for a bullish put spread, an investor is capping the losses that can be experience if
the underlying security moves against the credit spread owner.
The large the distance between the sold call and the protective call or the sold put and the
protective put, the greater the risk of loss. For example, an XYZ $43-$40 puts spread has less
of a risk of loss compared to a $43-$35 puts spread. In the first case an investor has a
maximum loss of $3 minus the premium received for the credit spread. In the second case the
investor could lose $8 minus the premium of the credit spread. Unless the additional premium
will compensate the investor for the additional risk, investor should be careful of large range
credit spreads.
Important Factors to Remember
A credit spread is a vertical spread A bearish credit spread is a vertical spread where the investor is selling a call spread A bullish credit spread is a vertical spread where the investor is selling a put spread The maximum profit on a credit spread is the amount of premium collected The maximum loss is the distance between the two strikes of the spread The benefits of a credit spread is it provides a predetermine reward for a
predetermine risk
http://www.TradingTips.com 25
Chapter 6 Trading Credit Spreads
Placing a Credit Spread Trade
Most trading platforms allow investors to trade credit spreads directly and offer a bid/offer
rate for each spread. Trading credit spreads directly as opposed to trading individual legs is
preferable.
If an investor attempts to sell one leg of a bear call or put spread and the underlying security
moves higher or lower in between transactions, the actually credit can be higher or lower
which defeats the purpose of placing the trade at a specific level.
For example, let’s assume an investor wants to place a bull put spread on XYZ stock when the
stock price is at $50. If the investor sells a $50 put at $4 and then attempts to purchase a $45
put at $1, but as he is placing the trade XYZ moves down to $49.50, the $1 offer will likely
move higher eroding the $3 credit that he attempted to generate.
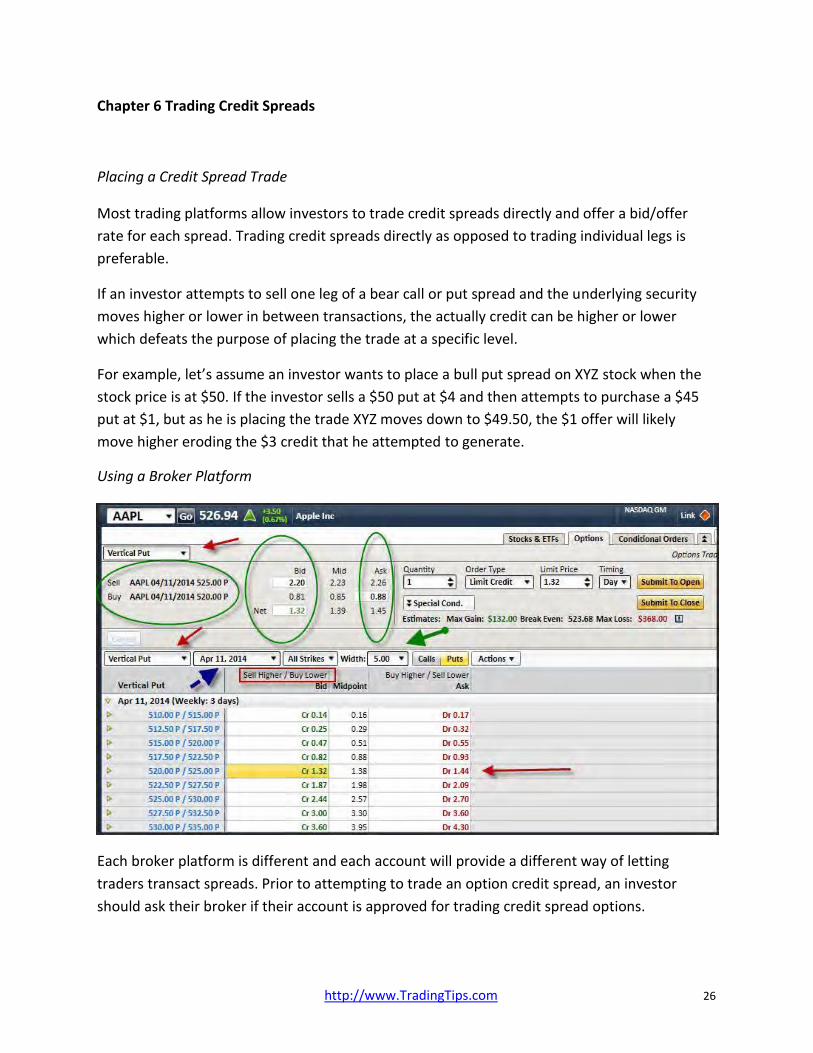
Using a Broker Platform
Each broker platform is different and each account will provide a different way of letting
traders transact spreads. Prior to attempting to trade an option credit spread, an investor
should ask their broker if their account is approved for trading credit spread options.
http://www.TradingTips.com 26
Additionally, an investor should determine if they have the ability to see and transact
credit spreads a one trade.
Bullish Put Spread
Underneath the stock name and symbol is the type of option structure, in this case it’s a
vertical put spread, which is pointed to using red arrows.
The date when the credit spread expires is listed next to the type of option structure and
is pointed to with a blue arrow.
The platform also allows an investor to alter and see width of the put spread and it is pointed
to with a green arrow.
In the example above a $5 Apple vertical put spread is chosen, and is listed with a green
circle around it. It is a weekly put spread that expires in 3-days.
It is recommended that an investor places an offer for this slightly higher than the bid
to achieve the best price possible.
On this transaction the most a trader could earn if they hit the bid is $1.32, and the
maximum loss is $5 - $1.32 or $3.68.
There are two green circles, one lists the bid and the other lists the offer. In the middle is the
mid-price of the credit spread. The next bid price and the net offer price are where this
structure can be traded.
In the lower portion of the trading screen a red arrow points to the credit put spread. Above
the credit spread is a red square that shows that a credit means that an investor is selling the
higher put and buying the lower. A debit to the account would mean that the investor is buying
the higher put and selling the lower.
Bearish Call Spread
http://www.TradingTips.com 27

The bearish call spread shows all the same items as the bullish put spread. The red arrow listed
at the top shows that this is a vertical call spread structure. The blue arrow in the middle shows
that expiration date of the credit spread. The green arrow in the middle shows that width of
the credit spread while the red box shows that to gain a credit an investor needs to sell the
lower call and buy the higher call. The green circles up top show the bid offer and the net credit
to transact this structure.
The bearish calls spread has a maximum gain of $1.66 if the bid is hit, and the maximum loss
on this trade is $3 - $1.66 = $1.34.
Credit Spread Strategies
There are a number of ways to create a trading strategy around credit spreads. Most conform
to robust risk management techniques as investors attempt to capture income when the
trade when the risk / reward is in an investors favor.
Prior to attempting to formulate a technique to enter into a credit spread, an investor
should create disqualifiers that are bound to generate losing trades.
Determine Adequate Liquidity
One of the first disqualifiers is the lack of liquidity. Investors should avoid writing credit spreads
for stocks that have low volume and open interest. The reason for this is simple; stocks with
limited liquidity tend to gap and can move against a credit spread trader rapidly. Stocks or ETF’s
with robust liquidity are more likely to provide the ability to stop out of a position if it
http://www.TradingTips.com 28

moves against you. This concept is not just for credit spreads, investors should always be leery
of trades were your downside is not secured by liquidity.
A stock that is thinly traded will also generally have poor options volume and open interest. This
will also make the bid / off spread wide which has ramifications for an investor’s profitability. For
example, if traders are looking to generate 60 cents from a credit spread trade and the bid off
spread to enter the spread is 0.40 / 0.80, than there a strong likelihood that the investor will pay
away a large chunk of their profits based on a wide bid / offer spread.
There is not hard any fast rule to use to insure sufficient volume, but traders can use 1
million shares a day in average daily volume as a potential disqualifier guideline. This means
that shares with less than this daily volume would not qualify for your strategy.
Lack of Volatility
Volatility is a 2-edged sword and investors should understand the need for adequate
volatility, which generates satisfactory premiums. A stock with a history of relatively low
volatility is known as a low beta stock. These types of stocks will not generate significant
volatility and therefore can be disqualified from consideration from credit spreads.
Earnings Report prior to Expiration Date
A stock should be considered for disqualification from consideration if there is an earnings
report prior to the expiration date. Stocks can be extremely volatile immediately after an
earnings report is released. A gap or quick market move might push the credit spread beyond
the point where an investor can exit using a stop.
How to Choose the Right Credit Spread
When an investor evaluates credit spreads, there is always a tradeoff between premiums
and the distance you credit spread is from the current price of your underlying stock. The
further away the nearby spread is from the current price of the underlying stock, the lower
the premium will be. This occurs because option traders correctly assume that the chances
of reaching a strike price that is out of the money is less likely than reaching a strike price
that is closer to the money.
In determining how far the short leg of the credit spread should be form the at the money
strike, an investor can either formulate a fixed number, or perform analysis to determine the
appropriate measure. Generally, using a number near 15% will provide for a conservative strike
http://www.TradingTips.com 29
level to place a credit spread trade. Another way is to use historical volatility to make this
decision.
Historical volatility is a measure of the daily (or weekly, monthly etc...) standard deviations,
which are used to create an annualized move on a percent basis. Risk calculations base many
of their assumption on historical price action, given that it is a benchmark to gauge future
price action.
Historical volatility is formulated by comparing the standard deviation the returns of a financial
instrument and multiplying that number by the square root of time. This formula will create a
decimal, which can be reflected as a percent, which describes a move over an annualized basis.
The standard deviation shows how much variation or dispersion from the average exists. A
low standard deviation indicates that the data points tend to be very close to the mean where
a high standard deviation indicates that the data points are spread out over a large range of
values.
One way to determine how far a spread should be from the current price is to determine how
likely the stock is to move a specific percent prior to the expiration of the credit spread. Each
standard deviation separates the price data. One standard deviation from a mean represents
approximately 66% of the date points were 2-standard deviations represents 95% of the data
points. Since the returns of stock prices represents a log normal return, then returns above the
mean at 2-standard deviations will only miss 2.5% of the price returns.
For example, if an investor were to find that 2-standard deviations from the current price
is 12%, then the likelihood of reaching that level is only 2.5%.
Using the Delta
As we mentioned earlier the delta of an option, tell an investor the theoretical number of
shares owned for every option contract owned. It also shows the price change for every $1
change in the underlying price of a stock.
The delta can also be used to estimate the probability that the option will be in the money
at expiration. For example, an option with a delta of 10% has a 10% change of being in the
money.
Since the delta is based on what traders estimate how volatile the markets will be (implied
volatility), the delta really shows an investor how likely the market thinks the option will be
in the money.
Wideness of the Credit Spreads
http://www.TradingTips.com 30

Finding a spread between strike prices depends on the stock and option chain available to
that stock. The distance between strikes is $1, $2.5 and $5. The further away the long leg is
from the short leg of the spread the great the premium will be available for a credit spread.
But there is a tradeoff, the further the long leg is from the short leg of the spread, the higher
the risk, and therefore the less rapidly the long leg will gain protective premium when the
underlying is moving in an unfavorable direction.
Since the goal of selling credit spreads is for the net premium to shrink to zero, an adverse
move in the direction of the underlying asset will increase the net premium, generating an
unrealized loss. Additionally, the wider the spread, the great the margin requirements for the
credit spread.
As discussed earlier, margin requirements on credit spreads is equal to the distance between
the strikes times the number of contracts held. For example, the margin requirement on a
credit spread on ABC stock with strikes of $15 and $20, where the writer sells one contract,
is $500 dollars.
Risk Management
Trading the options markets requires a sound strategy that employs robust research, a
technique for initiating a trade and solid risk management. Managing risk appropriately is the
key underlying element for successful returns over the long term. Risk management as it
pertains to individual trades focuses on the exit point of a trade, which is often overlooked
when a trade is initiated.
The plan
Money management focuses on the amount of capital that will be risk on a specific trade. This
concept can be broken down into the expected gain or loss as it relates to return on a trade,
along with the potential bet size for each trade.
Prior to initiating a trade, an investor should formulate a strategy in which they will
determine the appropriate profit and loss that they are willing to accept.
An investor needs to determine a prudent risk reward profile in which the profit is a multiple
of the loss. Although there are a number of trading strategies that win more than they lose,
there are very few that will be successful over time if the amount of loss on a trade is a
multiple of the profit made on a winning trade. These include credit spread. This is based on
the idea that with credit spread trading you will win more than you lose.
An example of how risk management directly affects a trading strategy is as follows. If an investor
is planning on making twice as much on a winning trade than losing on an unsuccessful
http://www.TradingTips.com 31

trade, he would need to win slightly more than 33% of the time to have a successful
trading strategy. Exactly 33% would break even. The math reflecting this scenario would
work as follows:
Let's assume 9 trades. If there are 3 winning trades at $4 dollars per share (for a total of $12
dollars in profit) and 6 losing trades at $2 per share (for a total of $12 dollars) the strategy
would be break even.
From this example, the risk profile shows that the winners and the loser would cancel each
other out, generating zero profit. Slightly more than 33.3% would allow an investor to generate
gains. A different risk reward profile would require either a greater percent of gains on the
strategy or a more robust risk reward profile to generate a successful strategy.
When entering into a trade, the trader most have a specific idea of where they would want
to stop out of the trade, and where they would want to take profits on a trade.
Creating a stop loss
Prior to initiating a trade, an investor should first determine the risk reward profile of the
transaction. The first step in determining this profile is to decide the amount of loss you are
willing to accept, based on a market movement against your position. In general, with credit
spread trading an investor should not place trades were they are planning to lose more than
twice as much as they can gain.
The stop loss determines how much capital a trader is willing to risk on a trade. Stop losses can
be based purely on a notional amount of money, such as risking $100 dollars, or a percent
move in the market. Using the risk capital, investors can back into a specific price, which
equates to a stop level.
There are a number of techniques that can be used to help determine a robust stop loss. One
of the most popular ways to pinpoint a stop loss level is to use support and resistance price
levels, which when breached trigger a stop loss.
Taking Profit
Taking profit on a position prior to initiating a trade is just as important as determining how
much should be risked on a trade. The take profit level is combined with a stop loss level to
determine the risk reward profile an investor will use on a specific trade. The take profit in a
credit spread trade is the premium received, and it is based on the concept that the options
will expire worthless.
http://www.TradingTips.com 32
Placing a Stop on a Credit Spread
When using option credit spreads to generate income, you need to place a stop loss order to if
the difference between the strike prices are greater than the amount you plan on risking. For
example, if you decide that you like a $40 – $50 credit spread, that has a net premium of $2,
when the price of the stock is $35, then you would likely consider stopping out of the position
if the credit spread increases to $4. To do, this you would need to stop out of your credit
spread position.
No matter how good your strategy is there is always some possibility of a trade going the
wrong way.
There are a number of ways to stop out of a credit spread position, but the easiest is to have
a stop on the credit spread itself.
For example, suppose we have an ABC credit spread on which we collected a net premium of
$1 up front, and we choose to limit our risk on the spread to a maximum loss of $2 (2 times
net premium received).
Stop on the Spread
The first trigger method for stopping out of the trade involves simply placing a stop order on
the option spread itself. By using the example on stock ABC we would place an order to exit the
credit spread if the price on the offer moved above $2 net for the credit spread.
This is a perfectly good method for assuring that an adverse move against our trade does
not result in an unacceptably large loss.
Using delta to calculate your probability of success will help you make intelligent choices about
your position sizes. Traders should be cognizant that position sizing is very important and even
though the delta is telling an investor a high probability of winning, you should not bet the ranch.
That potential 20% probability that you'll lose money should make you acutely aware of how much
you're risking, and how much you could lose should the trade go against you.
Using the Price of the Underlying
The second trigger method for stopping out of the trade involves placing creating a stop on
the underling price and relating back to the credit spread. The underlying price is easier for
many traders as they are used to using some form of technical analysis on an underlying stock
position. One of the best and easiest is support and resistance levels.
http://www.TradingTips.com 33
Support and Resistance
A trend line is a subjective drawn line that helps a trader determine support and resistance. A
trend line connects two or more points and the slope of the line is extended to pinpoint and
area where the price of an asset will either break through or run into support or resistance.
Support is price levels that can be viewed on a chart were prices run into demand and
are buoyed by buying. If prices are unable to move lower through a specific price level it
is considered support. Many traders use trend line to find areas of potential support.
Resistance is price levels that can be on a chart as well were prices run into supply and are
held lower by selling. If prices are unable to move higher through a specific price level it is
considered resistance. Traders will use trend lines to find areas of potential resistance.
Trend lines
A trend line generally connects two or more points and is upward sloping when it connects
two more lows and downward sloping when it connects two or more highs. The issue for many
traders is the trend lines are drawn in a very subjective manner. Some people create trend
lines that are upward sloping connecting tops, while other connect high points that are not the
most recent highest highs.
Calculating the Underlying price
To do this we will use the delta to help us find an approximate price to exit our credit
spread trade. We can also then use price action and technical analysis to find the best price
of the underlying stock to help us exit the trade.
Happily, the delta values of spread strike prices are provided in the options chain
tables supplied by any options-friendly brokerage you are using.
Delta is the first "Greek" that most traders learn about when they get started with options.
Since we are dealing with a spread, and want to estimate at what price the underlying will be
if the spread reaches the point where we want to abandon the trade, we need to consider the
deltas for both our short and long option legs.
The key is to combine the two legs of the credit spread and calculate a net delta. In other
words, how much does the underlying XYZ stock have to go down to bring the option spread
to a level that you would want to place a stop.
In our example of ABC stock we were willing to risk $2 to make $1 on our credit spread. Let’s
assume that the net delta of the options is 0.25. To determine how much we could let the
http://www.TradingTips.com 34

underlying stock run before stopping out of the position, we simple divide the net delta into
the credit spread stop loss dollar amount.
So $2 / 0.25 = $8.
Now all we need to do is place a stop loss that is based on the currently underlying price
minus $8, to get a level that we are comfortable exiting our credit spread position.
Placing you Stops
Order entry can be tricky which means that investors should completely understand the
ramification of their orders prior to making them live. When placing a stop loss order, investors
should stick can consider both day orders and good till cancel orders. Traders that plan on
watching their screens actively can adjust their orders using day orders, while those who plan
on placing the order and leaving the order until it is filled will be better served with a good
until canceled order.
Specific trades
Below are a number of specific trades that will help an investor understand some of the analysis
that can be used to generate profits from weekly credit spread options. The broker Options House
was used and charged a commission of $12.50 + $0.15/contract on each spread.
IWM
This trade was transacted on March 28, 2014 for expiration on April 4, 2014. This trade is a
bullish put spread, and we used a technical analysis tool to generate this trading idea. This
trade expired worthless, as the price of the IWM on the expiration date (April 4, 2014) was
well above the 110 put we sold. I was able to keep the 12 cents we received a premium for this
trade minus commissions. That equates into a profit of (150 * 100 * 0.12) – ($12.50 + 150 *
0.15) = $1,800 - $35 = $1,765.00
http://www.TradingTips.com 35

The decision to enter this trade was based on using a technical indicator called Bollinger
bands This indicator is explained in detail in the appendix.
The IWM is the iShares Russell 2000 ETF. As the IWM traded lower in late March, it hit is
Bollinger band low (2-standard deviations below the 20-day moving average). This told us
that the security had moved to the outer end of a range around the 20-day moving average.
LNKD
This trade was transacted on April 4, 2014 for expiration on April 18, 2014. This trade is a
bullish put spread, and we used a couple of technical analysis tools to generate this trading
idea. This trade expired worthless, as the price of LNKD was well above the higher strike put
that I sold at $150 on expiration day. I was able to keep the 43 cents we received a premium
for this trade minus commissions. That equates into a profit of (80 * 100 * 0.43) – ($12.50 + 80
* 0.15) = $3,400 - $24.50 = $3,375.50
http://www.TradingTips.com 36

The decision to enter this trade was based on using a combination of a technical indicator
called Bollinger bands as well as the relative strength index. These indicators are explained in
detail in the appendix.
As the LNKD traded lower in early April, it hit is Bollinger band low (2-standard deviations
below the 20-day moving average). This told us that the security had moved to the outer end
of a range around the 20-day moving average. At the same time the RSI printed in oversold
territory at 29, which told us that LNKD could quickly rebound.
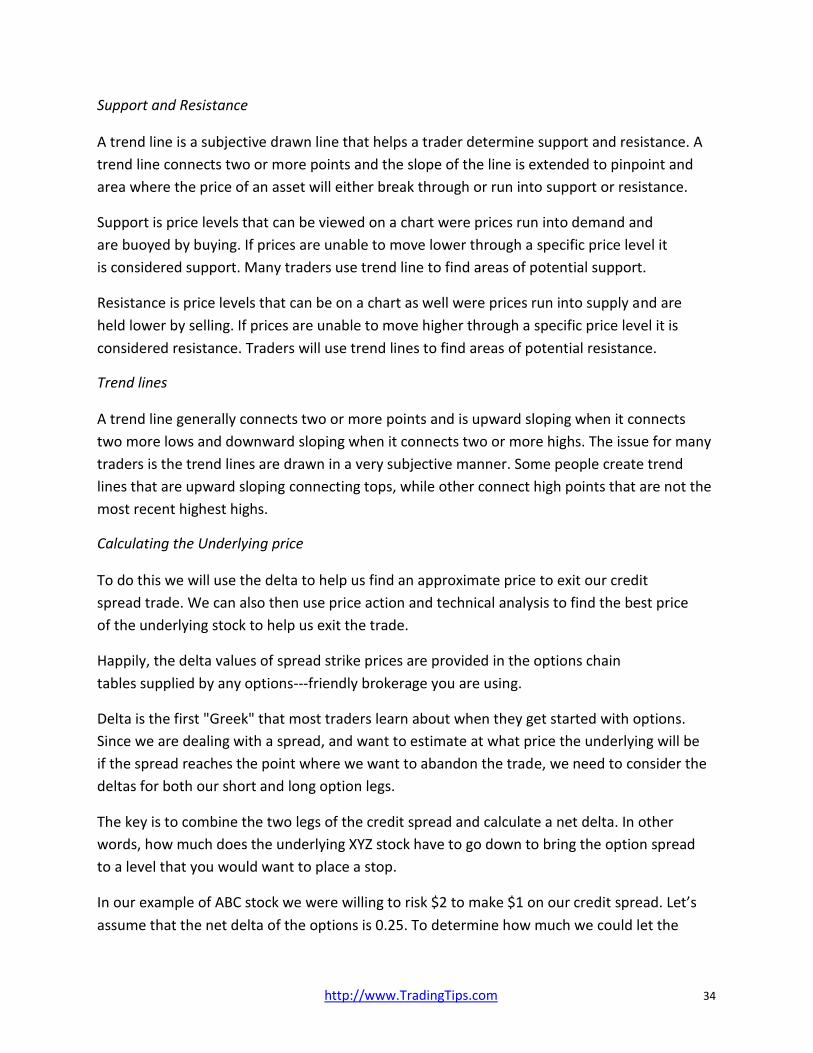
NFLX
This trade was transacted on March 31, 2014 for expiration on April 18, 2014. This trade is a
bullish put spread, and I used a couple of technical analysis tools to generate this trading idea.
Even though the price of NFLX moved against us, this trade still expired worthless, as the price
did not reach the higher strike put at $300 prior to the expiration date. I was able to keep the
45 cents we received a premium for this trade minus commissions. That equates into a profit of
(50 * 100 * 0.45) – ($12.50 + 50 * 0.15) = $2,250 - $20.00 = $2,230
http://www.TradingTips.com 37
The decision to enter this trade was based on using a combination of a technical indicator
called Bollinger bands as well as the relative strength index. These indicators are explained in
detail in the appendix.
As the NFLX traded lower in late March, it hit is Bollinger band low (2-standard deviations
below the 20-day moving average). This told us that the security had moved to the outer
end of a range around the 20-day moving average. At the same time the RSI printed in
oversold territory at 28, which told us that LNKD could quickly rebound.
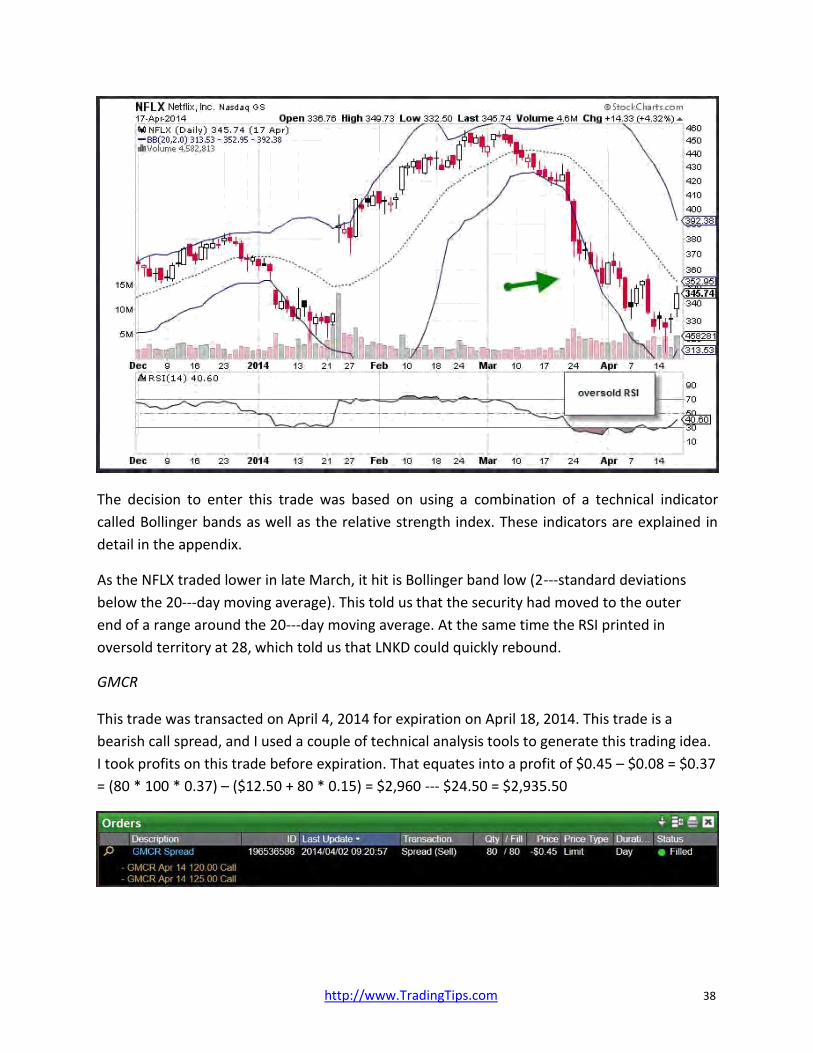
GMCR
This trade was transacted on April 4, 2014 for expiration on April 18, 2014. This trade is a
bearish call spread, and I used a couple of technical analysis tools to generate this trading idea.
I took profits on this trade before expiration. That equates into a profit of $0.45 – $0.08 = $0.37
= (80 * 100 * 0.37) – ($12.50 + 80 * 0.15) = $2,960 - $24.50 = $2,935.50
http://www.TradingTips.com 38
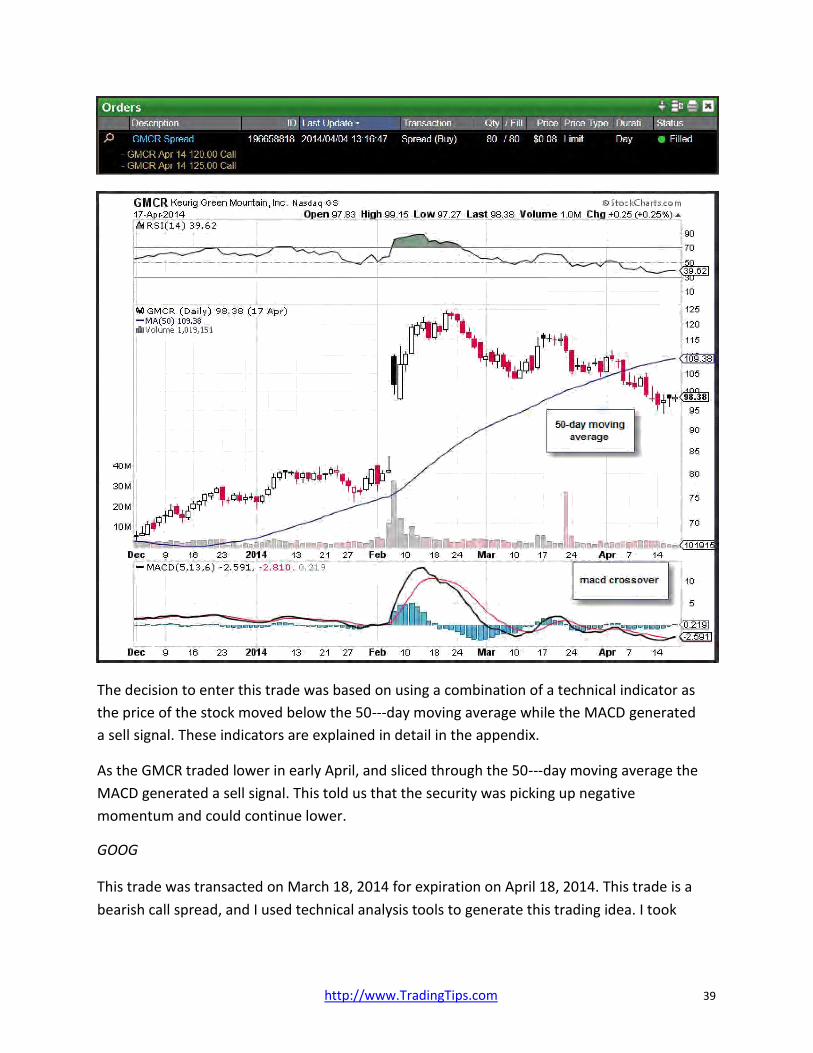
The decision to enter this trade was based on using a combination of a technical indicator as
the price of the stock moved below the 50-day moving average while the MACD generated
a sell signal. These indicators are explained in detail in the appendix.
As the GMCR traded lower in early April, and sliced through the 50-day moving average the
MACD generated a sell signal. This told us that the security was picking up negative
momentum and could continue lower.
GOOG
This trade was transacted on March 18, 2014 for expiration on April 18, 2014. This trade is a
bearish call spread, and I used technical analysis tools to generate this trading idea. I took
http://www.TradingTips.com 39

profits on this trade before expiration. That equates into a profit of $3.00 – $0.50 = $2.50= (10
* 100 * 0.2.50) – ($12.50 + 10 * 0.15) = $2,960 - $24.50 = $2,935.50
The decision to enter this trade was based on using a moving average crossover strategy.
When the 10-day moving average crossed below the 30-day moving average, a bearish
credit spread was initiated.
Important Factors to Remember
Make sure you have adequate liquidity for an option by checking both the open
interest and the volume of the option Make sure there is enough volatility to insure the premium is adequate Use the delta to estimate the likelihood of an option settling in the money Use appropriate risk management Create stop losses credit spreads that have wide strike ranges Use support and resistance to find stops for the underlying stock
http://www.TradingTips.com 40

Appendix
Bollinger bands
Bollinger bands created by John Bollinger are a statistical tool that is used by technical analysts
to gauge the future direction of a financial asset. The Bollinger band shows an investor the
distribution of a specific security over a period of time. Bollinger bands use a moving average
to define the mid-point of the range of prices and the Bollinger high and Bollinger low to
define the top and bottom of the price distribution that is being evaluated.
To calculate Bollinger bands an investor needs to define the specific mid-point that he is
planning on using. The midpoint is generally a moving average. A moving average is the
average of a specific number of prices divided by the number days that are used in the average.
For example, a 20-day moving average uses the last 20-day closes, divided by 20. An average
is considered moving, when the last price of a security is dropped of the average. For example,
for a 10-day moving average, on the 11st day, the first price is dropped from the moving
average calculation.
A standard deviation is a statistical calculation that is used to define the number of data points in a
specific range. Generally one standard deviation covers 67% of the price points relative to a mean.
2-standard deviations measures approximately 95% of the data points within a range.
A Bollinger band high uses the default of 2-standard deviations above a specific moving
average. The Bollinger band low uses the default of 2-standard deviations below a
specific moving average.
Bollinger bands are generally used as a mean reversion tool, but can also be used as a
momentum indicator. The most common practice used to generate trading ideas form
Bollinger bands is to purchase a security when it closes below a Bollinger band low, and to
take profit on the trade when it reverts back to the mean moving average. An investor can
also short a security when it closes above a Bollinger band high, and cover their short positions
when it reverts back to the mean.
Investors should consider using prudent risk management when stopping out of positions that
are initiated with Bollinger bands. Although a security is likely to revert back to its mean, it can
continue to trend for a while before it reverts back to its medium term mean.
http://www.TradingTips.com 41

Bollinger bands can be used for any time period as well as different time periods to capture a
distribution. This includes intra-day, daily, weekly, monthly, etc… as well as periods such as
10- day or 30 hourly moving averages. The standard deviation that is used to capture the
range can also be altered based on an investor’s strategy. Lower standard deviations (for
example 1 compared to 2) will generate more signal than higher standard deviations. The
greater the standard deviation the more likely the security will revert to its mean after closing
below it. Each machination of a Bollinger bands will produce different results that can be tested
by a trader to find the most efficient results.
The MACD
One of the most efficient ways to analyze a security is to evaluate current momentum.
Momentum can be viewed as the thrust of the market, similar to the trust of a car. The greater
the momentum associated with a security, the better the chance that the security continues to
move in the same direction.
One of the most popular momentum indicators is the moving average convergence
divergence indicator known as the MACD. The MACD was created by Gerald Appel, and it
focuses on momentum by analyzing the difference between two short term moving averages
and compares that difference (the spread) to a moving average of the difference.
The default for the MACD is the 12-day moving average, and the 26-day moving average,
which make up the spread and the 9-day moving average of the spread. The MACD can be
used to measure all types of time frames including daily, weekly, monthly, or intra-day
periods. The moving averages that are used can also be changed to shorter or longer periods.
For an intra-day trader, a 5-day moving average and 12-day moving average could be
used as the spread and a trader could consider using the 3-day moving average of the
spread. For longer term traders, they might consider using a 20-day moving average and a
45-day moving average and comparing that to a 12-day moving average of the difference
The RSI
The relative strength index is a technical analysis tool that was created by J. Welles Wilder.
Technical analysis is the study of past prices to assist in predicting future price movements.
There are numerous patterns and studies that are used by analysts and investors, to help
find methodologies that are predictable in nature. Each type of study can work either in
conjunction with other methods or stand-alone.
http://www.TradingTips.com 42
The RSI is an oscillator that measures momentum by creating an index between 0 and 100. The
index measures the price of a security relative to the last 14 days and is often used as an
overbought and oversold tool. The default period is generally 14 days but an investor can
change this period and customize it to any length of time, as well as, focus on weekly, monthly
of intra-day periods. For example, if a trader is day trading, using intra-day data will likely be
more effective than using weekly data.
The formula wilder created to generate an index is:
RSI = 100 – (100 / 1 + RS)
RS = Average Gain / Average Loss
The relative strength index generally fluctuates around the 50 index reading which designates
a market neutral reading. Index values above 70 are considered overbought while index
readings below 30 are considered oversold.
http://www.TradingTips.com 43