Option introduction, short sale constraints and market ...
44
Option introduction, short sale constraints and market efficiency: a new perspective Blake Phillips* JEL classification: G12, G14 Key words: short sale constraints, option listing, market efficiency *University of Alberta. Correspondence: School of Business, 2-24 Business Building, University of Alberta, Edmonton, Canada T6G 2R6, Email: [email protected]. Option introduction dates were generously provided by Stewart Mayhew and Vassil Mihov, as used in Mayhew and Mihov (2004). I would like to thank Aditya Kaul, David McLean and Vikas Mehrotra for useful comments and numerous conversations that have contributed greatly to this article. This article has also benefited from the comments of an anonymous referee and conference participants at the 2008 European Financial Management Association and 2008 Financial Management Association meetings. Any errors or omissions are the author’s alone.
Transcript of Option introduction, short sale constraints and market ...
Option introduction, short sale constraints and market efficiency: a new perspective
Blake Phillips*
JEL classification: G12, G14 Key words: short sale constraints, option listing, market efficiency *University of Alberta. Correspondence: School of Business, 2-24 Business Building, University of Alberta, Edmonton, Canada T6G 2R6, Email: [email protected]. Option introduction dates were generously provided by Stewart Mayhew and Vassil Mihov, as used in Mayhew and Mihov (2004). I would like to thank Aditya Kaul, David McLean and Vikas Mehrotra for useful comments and numerous conversations that have contributed greatly to this article. This article has also benefited from the comments of an anonymous referee and conference participants at the 2008 European Financial Management Association and 2008 Financial Management Association meetings. Any errors or omissions are the author’s alone.
2
Option introduction, short sale constraints and market efficiency: a new perspective
Abstract
This article undertakes a new investigation of the effect of option introduction on short sale
constraints. I find that post option improvement in stock price adjustment efficiency is
isolated to short sale constrained stocks responding to negative information. No significant
improvement in adjustment efficiency is found in response to positive information. The
empirical results suggest that up to 76% of the disparity in stock price efficiency between
stocks with high and low short sale constraint levels is eliminated by option introduction.
Further, I find evidence that post option improvement in efficiency is similar in relation to
market wide public and firm specific, jointly private and public information. Commonality in
efficiency improvements in relation to private and public information suggests irrational,
behavioral biases are a significant source of short sale constraint effects which options act to
mitigate.
3
“Short sellers occupy a position in the stock market like that of predators in nature: necessary
but unloved” (Sauer, 2006). Through history short sales have been both reviled and lauded by
investors. Short selling “bear raids” were widely perceived by many investors as a cause of the
1929 stock market crash (U.S. SEC, 2007). Others recognize the important contribution of short
selling to the process of price discovery. The argument for the critical role of short sales in stock
price adjustment dates back to Miller (1977). In a market where short selling is constrained, it is
difficult for pessimistic investors, who do not hold the asset, to trade on their opinions. Thus,
investors with negative value opinions are excluded from the market resulting in stock values being
established by the subset of investors with the most optimistic view of the stock. The unfounded
optimism of this subset of investors leads to an irrational, upward bias in stock prices. Diamond and
Verrecchia (1987) extended and formalized the Miller hypothesis arguing once option trading is
introduced, investors may take a synthetic short position allowing more rapid incorporation of
negative, private information into stock prices. In contrast to Miller, Diamond and Verrecchia
assume rational expectations hold, thus arguing that options move markets from semi-strong
towards strong form efficiency.
The potential effect of option introduction on short sale constraints has been examined
extensively in the finance literature, but evidence contradicting the Diamond and Verrecchia
hypothesis is seemingly as numerous as supporting evidence. For example, Jennings and Starks
(1986), Skinner (1990) and Damodaran and Lim (1991 & 1992) all document either an improvement
in stock market efficiency following option introduction or an on average higher rate of price
adjustment for optioned stocks. In contrast, Mayhew and Mihov (2005) examine nine proxies for
short sale constraints and find either no relationship or a significantly negative relationship between
short sale constraint proxies and option trading volume following option introduction. Similarly,
Bris et al. (2007) complete cross-sectional and time series tests of the effect of short sale restrictions
4
on the efficiency of 46 equity markets around the world and find that put options have no significant
effect on market efficiency in the presence of short selling restrictions.
I contribute to this ongoing debate and extend the current literature in several ways. While
numerous authors have examined the general effect of option introduction on stock price adjustment
efficiency, to my knowledge this is the first article to examine cross-sectional variation in the
change in market efficiency across short sale constraint levels. Second, utilizing an adjustment
delay measure previously unexplored in this context, I contrast the post option change in the speed
of adjustment to market and firm specific news allowing tests of the contrasting predictions of the
Miller (1977) and Diamond and Verrecchia (1987) hypotheses. Finally, post option improvements
in market efficiency can be attributed to several alternate factors beyond the reduction of short sale
constraints; such as endogenous stock characteristics (Mayhew and Mihov, 2004), increased
information collection (Damodaran and Lim, 1991) and improvement in liquidity (Fedenia and
Grammatikos, 1992). Thus, research exploring the effect of option introduction on short sale
constraints must isolate the “short sale effect” from a myriad of simultaneous and complementary
factors potentially contributing to improved market efficiency. This article is the first to test for a
direct relation between the relaxation of short sale constraints and improved price adjustment
efficiency resulting from option introduction while simultaneously controlling for endogenous stock
characteristics and alternate effects.
I conduct an event study on the effect of option introduction on short sale constraints, utilizing
1732 option introduction events from 1981-1997.1 To measure post option reduction in short sale
constraints I evaluate the change in stock price adjustment efficiency proxied by the adjustment
1 As used in Mayhew and Mihov (2004).
5
delay measures defined in Hou and Moskowitz (2005).2 The Hou and Moskowitz model assesses
the significance of lagged market returns for predicting stock returns. The greater the number of
lagged market returns that are significant for predicting stock returns, the greater the delay in
adjustment to new information.3
Based on the post option change in adjustment efficiency I test a series of predictions: First, as
short sale constraints are relaxed, post option improvement in the speed of adjustment should be
greatest for stocks with low short sale loan supply, for which short sale constraints are most likely
binding. To proxy for short sale loan supply I use institutional ownership, as institutional investors
in long positions provide the majority of shares for short sale loans (D’Avolio, 2002).4 Second, as
short sale constraints impede only negative information from being impounded in stock prices, post
option improvement in adjustment efficiency should be most pronounced in relation to negative
relative to positive news. Finally, following Diamond and Verrecchia, if option introduction moves
markets from semi-strong towards strong form efficiency, post option improvement in price
adjustment efficiency should be most pronounced for the private information component of firm
specific news relative to the public information in market wide news. In contrast, following Miller,
if a subset of investors is irrationally underestimating the significance of public negative information
then option introduction will jointly affect the speed of price adjustment to both private and public
news.5
2 The Hou and Moskowitz (2005) model is similarly used to quantify the extent of short sale constraints by Saffi and Sigurdsson (2007). 3 As discussed in more detail in Section III, I augment the original Hou and Moakowitz (2005) model with excess stock returns and negative news interaction dummies to allow a greater range of market efficiency tests. 4Institutional ownership is defined as the percentage of total shares outstanding held by institutional investors. 5 Implicit in this prediction is the assumption that the irrational optimism of the subset of investors setting prices is bound, resulting in a downward adjustment of stock prices when investors revise their value opinions. This assumption is consistent with the findings of Nagel (2005) who demonstrates underperformance of stocks with low institutional ownership (proxy for short sale constraints) as negative information withheld from stock prices is impounded at a later date.
6
I find evidence that option introduction has a significant effect on market efficiency. Only
stocks with low institutional ownership, for which short sale constraints are most likely binding,
realize a significant post option improvement in the speed of price adjustment. Consistent with the
hypothesis that the improvement in market efficiency is related to relaxation of short sale
constraints, I find that the improvement in adjustment efficiency is limited to short sale constrained
stocks responding to negative news. No significant post option improvement in stock price
efficiency is noted for short sale constrained stocks responding to positive information. To my
knowledge this is the first paper to report this result. Prior to option introduction, short sale
constrained stocks adjust to negative news 19% slower than unconstrained stocks. Following option
introduction that difference is reduced to 4%, indicating that options eliminate up to 76% of the
price efficiency disparity between short sale constrained and unconstrained stocks. These results are
robust to the control methodology developed in Danielsen et al. (2007).
I also find evidence that post option improvement in stock price adjustment is similar in relation
to market wide and firm specific information. Specifically, the difference in the change in the stock
price adjustment delay measures is statistically insignificant between the firm specific and market
wide information models. Commonality in the improvement in price adjustment efficiency for both
market wide public and firm specific, jointly private and public negative information suggests short
sale constraint effects stem from an irrational optimism bias or another behavioral source as
suggested by Miller (1977). Delayed incorporation of negative, private information into stock prices
likely also plays a role in short sale constraint effects, but is not the exclusive source, in a rational
expectations framework, as suggested by Diamond and Verrecchia (1987). Collectively these
results support the conclusion that option introduction significantly improves market efficiency,
reducing behavioral biases and moving markets towards strong form efficiency.

7
The remainder of this article is organized as follows: Section I reviews the related literature in
more detail. Section II describes the sample and Section III describes the stock price adjustment
delay measures utilized in the article. Section IV presents an analysis of the determinants of stock
price delay. Section V and VI examine the effect of option introduction on the speed of stock price
adjustment to market wide and firm specific information, respectively. Section VII presents
robustness checks and Section VIII concludes the article.
I. Related Literature
This article relates to two bodies of research: (1) the effect of option introduction on short sale
constraints and (2) the effect of options on price adjustment of the underlying stock. Subsection A
reviews the extant empirical results related to option introduction and short sale constraints.
Subsection B describes the process by which option introduction may affect the efficiency of stock
price adjustment.
A. Option Introduction and Short Sale Constraints
Empirical work testing the effect of option introduction on short sale constraints can be
characterized as following four different approaches. First, several authors have investigated the
change in short interest following option introduction. If option book makers face lower short
selling constraints than the average investor, option introduction may result in increased short
interest as option book makers hedge synthetic short positions taken by individual investors in the
option market. In support of this hypothesis, Damodaran and Lim (1992), Danielsen and Sorescu
8
(2001) and Figlewski and Webb (1993) all find short interest increases following option
introduction.
Second, Mayhew and Mihov (2005) investigate option trading volume following option
introduction. After examining nine proxies for short sale constraints, either no relationship or a
significantly negative relationship between short sale constraint proxies and option trading volume
was found. While this finding lends little support to the Diamond and Verrecchia (1987) hypothesis,
it is possible that the option market contributes to the price discovery of the underlying stock via
other mechanisms (other than trading volume). For example, Chan et al. (2002) examine the
intraday interdependence of order flows and price movements for actively traded New York Stock
Exchange (NYSE) stocks and Chicago Board Options Exchange (CBOE) traded options. Their
findings indicate that while information in the stock market is contained in both quote revisions and
in net trade volume, information in the option market is contained only in quote revisions. 6
Third, researchers have examined return behavior following option introduction. If option
introduction reduces short sale constraints, it would be expected to be predictive of negative
abnormal returns as historical negative information withheld from the market is impounded in stock
prices. Using the value weighted market index as a reference portfolio, Sorescu (2000) and
Danielsen and Sorescu (2001) find for options listed from 1980 to 1995 the underlying stock
experiences negative abnormal returns following option introduction. Mayhew and Mihov (2005)
undertake the same analysis using a control sample of non-optioned stocks which have similar
characteristics to those selected for option introduction. The control portfolio is found to exhibit
similar negative abnormal returns, suggesting that the relationship between option introduction and
negative abnormal returns may be spurious and more a result of stock characteristics at the time of
option listing.
6 Where net trading volume is defined as buyer initiated trading volume minus seller initiated trading volume.

9
Fourth, the approach of this paper and other authors has been to investigate the efficiency by
which negative and positive information is incorporated into stock prices following option
introduction.7 Most closely related to this paper, Damodaran and Lim (1992) examine stock return
processes following option introduction focusing on mean reversion and skewness. Using a
relatively small sample of 200 firms with option introduction from 1977-1984, they conduct an
event study of cumulative abnormal returns over the 20 days surrounding earnings announcements
before and after option introduction. They find that following option introduction a greater amount
of the information related to earnings announcement shocks is impounded in stock prices in the ten
days prior to earnings announcements and that prices adjust more quickly to negative earnings
shocks after option introduction. They interpret these results as supportive of the hypothesis that
easing of short sale constraints allows stock prices to adjust more rapidly to negative information.
As shown by Mayhew and Mihov (2005), a viable alternative hypothesis is that endogenous
stock characteristics common at the time of option introduction contribute to faster incorporation of
negative information into stock prices. I extend the work of Damodaran and Lim (1992) by
controlling for endogenous stock characteristics utilizing the control methodology specified by
Danielsen et al. (2007). Further, I utilize a much larger sample (1732 firms) over a greater time
frame (1981 – 1997) to test for a direct relation between improved post option price adjustment and
short sale constraints. The unique stock price adjustment model utilized in this paper allows the
comparison of stock characteristics the year before and after option introduction. Due to sample
size and methodology limitations, Damodaran and Lim (1992) use 10 years of pre option listing data
which further expose the model to potential endogeneity issues.
7 See for example Jennings and Starks (1986), Skinner (1990) and Damodaran and Lim (1991)
10
B. Option Introduction and the Speed of Stock Price Adjustment
Option introduction has the potential to improve the speed of stock price adjustment to new
information via three unique mechanisms. First, on average, option introduction reduces the bid-ask
spread of the underlying equity (Fedenia and Grammatikos, 1992), thereby reducing transaction
costs and the magnitude of disparity between stock price and the perceived value necessary to
trigger trading. Thus, smaller magnitude information events should be incorporated into stock
prices more rapidly following option introduction.
Second, the option exchange provides an alternative venue by which private information and
pessimistic opinions may be made public and contribute to price discovery of the underlying stock.
In a general context, investors with access to private information can choose to trade on either the
stock or option market. On average, Chakravarty et al. (2004) find the option market contribution to
price discovery to be approximately 17%. In the context of option introduction for a short sale
constrained stock, informed investors with negative information who wish to short the stock are
forced to trade on the option market. Thus, the expected contribution of the option market in that
context would likely be higher.
Third, as pessimistic investors take synthetic short positions on the option market, the option
book maker presumably hedges his exposure via short selling, placing downward price pressure on
the underlying stock. The obvious question becomes how the option book maker is able to hedge
his position via short sales, when the pessimistic investor is not? For several reasons, the option
book maker has access to short sale loan supply not available to the average investor.
First, transaction costs related to short selling can vary across agents depending on trading
volume and frequency. In a typical short sale contract, the short seller borrows the shares from his
broker and the proceeds of the sale guarantee the loan and generate interest. The broker returns a
portion of the interest to the short seller at the conclusion of the contract, known as the rebate rate.
11
Where loan demand exceeds loan supply, rebate rates may become negative, indicating the borrower
pays a fee to the lender for the opportunity to borrow the stock. In support of Miller’s 1977 theory,
stocks with negative rebate rates (high loan demand) tend to under perform in the future, indicating
over pricing (Jones and Lamont, 2002). Brokers vary rebate rates and share availability
preferentially across clients, with high volume customers receiving more favorable treatment (Evans
et al., 2003). Thus, short sales for low loan supply (negative rebate rate) stocks may be impossible
or prohibitively costly for the average investor relative to high volume borrowers, such as option
book makers.
Second, exchange rules require most market participants to demonstrate they are able to borrow
low rebate rate stocks prior to short selling (Evans et al., 2003). Market book makers are exempt
from this requirement by NASD rule 3370. If unable to locate shares following initiation of the
short sale, the book maker has the additional option to fail to deliver. Once the book maker fails to
deliver, one of two scenarios occur. The buyer’s broker may allow the failure to deliver to continue
as long as the short sale contract is open. In this situation the consequence of failing to deliver is
forgoing the interest on the proceeds of the sale but the short position is effectively maintained
without delivery (Evans et al., 2003). Alternatively, the buyer’s broker may insist on delivery and
file a notice of intention to buy-in, in which case the short seller has two days to deliver the shares or
the buyer purchases the shares on the short seller’s account (Evans et al., 2003). In the event of a
buy-in, the market maker must short sell again to re-establish the position, incurring execution costs
plus the difference between the buy-in and market price. Utilizing a two year database of short sale
transaction data for 1998 and 1999, Evans et al. (2003) find buy-ins occur in only 0.12% of failures
to deliver. Thus, exchange rules give option book makers a regulatory advantage which allows them
to short sell without actually borrowing stock.
12
II. Sample Description
Included in the test sample are all stocks for which an option was introduced from January 1981
through January 1997 as used in Mayhew and Mihov (2004). The original Mayhew and Mihov
dataset was provided by the Chicago Board Option Exchange (CBOE) and includes all option
introductions on the CBOE, the American, Philadelphia, Midwest and Pacific Exchanges from
January 1973 – January 1997.
As a proxy for short sale constraints I use institutional ownership measured in terms of shares
held.8 Intuitively, investors in large, long positions would be best suited to fulfill the supply side of
short sale loan transactions. In support of this hypothesis, D’Avolio (2002) documents that
institutional investors provide the majority of stock loan supply for short selling.9 Institutional
ownership data are obtained from the Shareworld 13F Filing database as maintained by Thomson
Financial. The Shareworld 13F database tracks, by quarter, the share holdings of institutional
investors based on 13F filings made with the U.S. Securities and Exchange Commission. Any
manager with more than $100 million at their discretion is required to make a quarterly filing of a
13F for every security holding in excess of $200,000 or 10,000 shares. Additionally, the Shareworld
13F database tracks ownership profiles of non-U.S. equities based on the Information Sheets and
Shareholder Reports of both Domestic and Foreign Mutual Funds. The institutions represented in
Shareworld include mutual funds, banks, insurance firms, and pension funds. At the time of dataset 8 Results are robust to an alternative specification using the number of institutional owners instead of shares held. 9 Following research by Nagel (2005), Chen et al. (2002) and others it is widely held that institutional ownership is an effective proxy for short sale constraints. Further evidence in support of the use of institutional ownership as a proxy for short sale constraints is provided by Asquith et al. (2005) who document that the percentage of shares outstanding shorted is less than the percentage of shares held by institutions in 95% of their dataset. Asquith et al. (2005) suggest an alternative short sale constraint proxy defined as the interaction of low short sale loan supply (low institutional ownership) and high short sale demand (high short interest). Due to data availability limitations I am unable to include short interest as a variable in this article. This limitation, if anything, biases against the findings of the article as stocks classified as unconstrained (moderate to high institutional ownership) are potentially constrained if short sale demand exceeds supply.

13
construction, the Shareworld database tracked 13F filings from 1980 through 2005. As stock and
return characteristics one year before and after option introduction are desired, all option
introductions prior to 1981 are excluded. Additionally, stocks for which the option delisted within
one year of introduction are also excluded (108 stocks).
Figure 1 presents mean quarterly institutional ownership for the test sample one year pre and
post option introduction. Through the four quarters preceding option introduction, mean
institutional ownership steadily increases from a level of 27% to 33% of total shares outstanding.
The average number of institutional investors holding shares in each stock experiences a similar
increase over the same timeframe.
[Insert Figure 1 approximately here]
Stocks under consideration for option listing are known only to the members of the board of the
option exchange and option introduction announcements are made public on average 3 trading days
prior to the initiation of trading (Danielsen et al., 2007). Given the timing of option introduction
announcements, the increase in institutional ownership prior to option introduction does not reflect a
desire for institutions to hold stocks that eventually have traded options. Mayhew and Mihov (2004)
document that option exchanges tend to select stocks with high volatility, trading volume and name
recognition when determining new listings. The increase in institutional ownership preceding
option introduction reflects that institutional investors are attracted to a similar set of stock
characteristics.
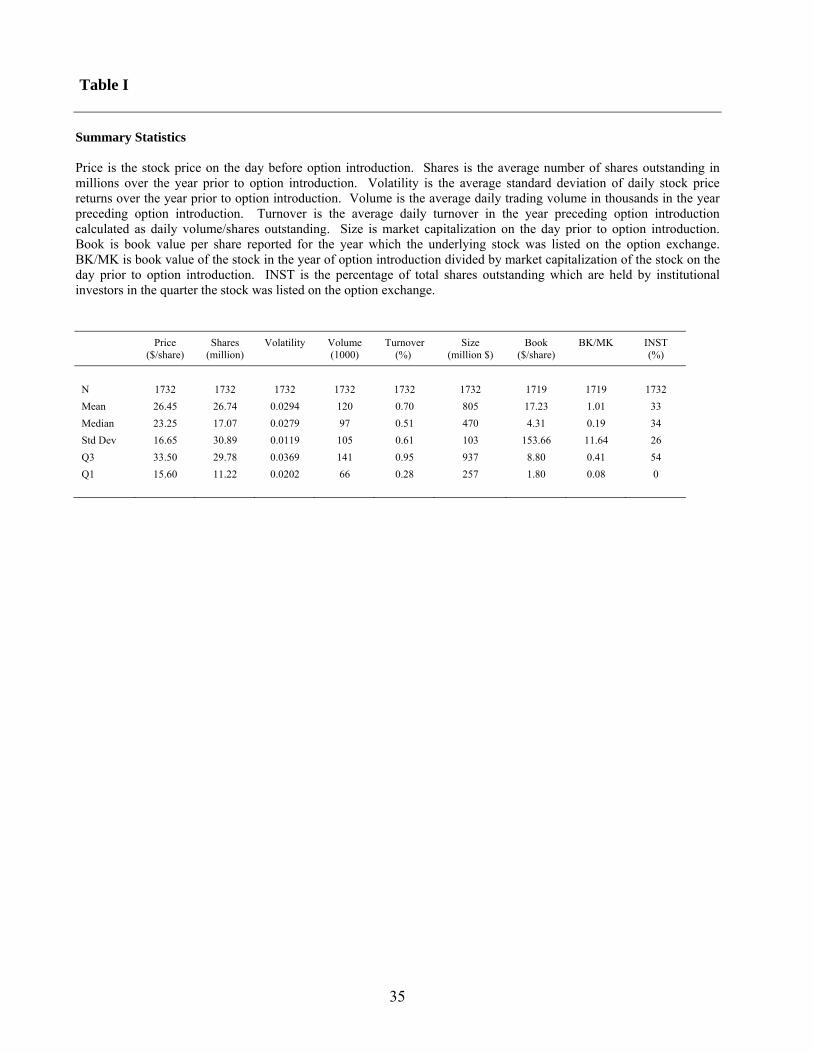
Panel A of Table I presents summary statistics for the test sample at the time of option
introduction. The mean and median stock prices at the time of option introduction are $26.45 and
14
$23.25 respectively.10 On average, stocks in the test sample trade 120,000 shares per day, which
represents a turnover of 0.7% of total shares outstanding (annualized turnover ratio of 1.75). Mean
market capitalization is $805 million but the mean is biased upwards by several high market
capitalization stocks, reflected by the median market capitalization value of $470 million. Stocks
within the sample tend to attract moderate institutional interest, with average institutional ownership
of 33% of total shares outstanding.
[Insert Table 1 approximately here]
III. Speed of Stock Price Adjustment Measures
To measure the speed which new information is impounded in stock prices I utilize the stock
price adjustment delay measures developed by Hou and Moskowitz (2005), which are derived by
comparing the coefficient and R2 values of the base market model to extended models containing
contemporaneous and lagged market returns. In this model, the market return is utilized as a proxy
for the new public information to which individual stock prices respond. 11
tjtmjjtj Rr ,,0
, εβα ++= (base model) (1)
10 Stock price, volume and shares outstanding data were obtained from the Center for Research in Security Prices database. 11 The Equal Weighted Index Return (excluding distributions), as maintained on the Center for Research in Security Prices database, was utilized as a proxy for market return.

15
∑=
− +++=5
1,,,
0,
ntjntm
njtmjjtj RRr εββα (extended market model) (2)
Here tjr , is the return of stock j on day t, tmR , is the market return on day t and ntmR −, is the market
return n days prior to day t. In the extended market model, if the stock responds immediately to new
information, 0jβ will be significantly different from zero, but none of the n
jβ will differ significantly
from zero. On the other hand, if the response is delayed 0jβ will be less significant or insignificant
and some or all of the njβ will be significantly different than zero.
Using Akaike’s and Schwarz’s information criterion (AIC and SIC respectively) the goodness
of fit of the full model is optimized with the inclusion of five lags for 77% (using AIC) and 96%
(using SIC) of the test sample stocks. Further optimization of AIC and SIC values for the remainder
of the stocks requires the inclusion of 6 or more additional lags. Five lags are selected to optimize
the AIC / SIC values for the majority of stocks in the sample.
The first delay measure, the R2 Ratio, measures the proportional difference between the
explanatory power of contemporaneous versus lagged market returns to predict stock returns.
2
2
1extended
basersq R
RD −= (3)
The faster new information is incorporated into individual stock prices, the smaller the difference
between the R2 of the full model and the base model, as lagged market returns add little by the way
of explanatory power. Thus, as the speed of stock price adjustment increases the Drsq delay measure
decreases.
The second delay measure, the Coefficient Ratio, measures the ratio of the lag weighted sum of
the lagged market return coefficients relative to the sum of all the regression coefficients. Similar to

16
the R2 Ratio delay measure, the greater the delay in stock price adjustment, the larger the lagged
regression coefficients and the larger the sumD delay measure.
∑
∑
=
=
+= 5
1
0
5
1
)()(
))((
n
njj
n
nj
sum
absabs
absnD
ββ
β (4)
The third delay measure, the Standard Error Adjusted Coefficient Ratio, augments the
Coefficient Ratio measure by weighting each coefficient by its standard error. Thus, the
significance of each coefficient is considered, whereas the raw Coefficient Ratio only considers the
magnitude of the regression coefficients.
∑
∑
=
=
+
=5
10
0
5
1
)()(
)()(
)())((
nnj
nj
j
j
nnj
nj
se
seabs
seabs
seabsn
D
ββ
ββ
ββ
(5)
To capture the speed of stock price adjustment to firm specific information the same
methodology is utilized but lagged excess stock returns are used in the place of lagged market
returns.
∑=
− +++=5
1,,,
0,
ntjntj
njtmjjtj RRr εββα (extended firm model) (6)
Here tjr , is the return of stock j on day t, tmR , is the market return on day t and ntjR −, is the return to
stock j n days prior to day t less the market return n days prior to day t. The base model of
comparison remains unchanged and the delay measures are calculated in the same manner,
contrasting the R2 and coefficient values of the base model and the extended firm model.

17
Throughout the paper I use DM to designate delay measures derived utilizing lagged market returns
and DF to designate delay measures derived utilizing lagged excess stock returns.
To allow separate quantification of the speed of adjustment to negative and positive news, I
augment the extended models with negative news interaction dummy variables.
∑ ∑= =
−−
−− +++++=
5
1,
5
1,,,
00,
0,
ntj
nntm
nj
dnjntm
njtmj
djtmjjtj RDRRDRr εββββα (extended neg market model) (8)
∑ ∑= =
−−
−− +++++=
5
1,
5
1,,,
00,
0,
ntj
nntj
nj
dnjntj
njtmj
djtmjjtj RDRRDRr εββββα (extended neg firm model) (8)
0jD is set to 1 if the contemporaneous market return is negative, otherwise it is equal to zero.
Likewise, in the extended market model each njD is equal to 1 if the market return for that specific
lag is negative, otherwise it is equal to zero. Similarly, in the extended firm model each njD is equal
to 1 if the excess stock return for that specific lag is negative, otherwise it is equal to zero. Within
the extended neg models, the njβ coefficients reflect the relation between stock returns and lagged
positive market / excess stock returns while the dnj−β coefficients reflect the incremental effects of
lagged negative market / excess stock returns.
negrsqD is calculated as the 2R Ratio of the extended neg model relative to the extended model.
2
2
1negextended
extendednegrsq R
RD−
−= (9)

18
Higher values of negrsqD reflect a greater delay in the speed of price adjustment to negative new
information. negsumD and neg
seD , which contrast the dnj−β coefficients to 0
jβ in the extended neg
model, are additional measures of the price delay related to negative news:
∑∑
∑
=
−
=
−
=
−
+++= 5
1
5
1
00
5
1
)()()()(
))((
n
dnj
n
nj
djj
n
dnj
negsum
absabsabsabs
absnD
ββββ
β (10)
∑ ∑
∑
= =−
−
−
−
=−
−
+++
=5
1
5
10
0
0
0
5
1
)()(
)()(
)()(
)()(
)())((
n ndn
j
dnj
nj
nj
dj
dj
j
j
ndn
j
dnj
negse
seabs
seabs
seabs
seabs
seabsn
D
ββ
ββ
ββ
ββ
ββ
(11)
To quantify the speed of stock price adjustment related to positive news possumD and pos
seD are
calculated as the ratio between the njβ coefficients relative to the 0
jβ coefficient in the extended neg
model. However, given that the positive and negative interaction effects have an identical effect on
R2, posrsqD is non-informative in this context.
∑
∑
=
=
+= 5
1
0
5
1
)()(
))((
n
njj
n
nj
possum
absabs
absnD
ββ
β (12)
19
∑
∑
=
=
+
=5
10
0
5
1
)()(
)()(
)())((
nnj
nj
j
j
nnj
nj
posse
seabs
seabs
seabsn
D
ββ
ββ
ββ
(13)
IV. Determinants of Stock Price Adjustment Delay
A detailed analysis of the determinants of stock price adjustment delay is completed by Hou and
Moskowitz (2005). Thus, I provide only a brief analysis to provide a sense of the characteristics of
the delay measures, demonstrate consistency of the extended delay measures with the extant
literature and to provide motivation for the control variables utilized further in the paper. Potential
determinants of stock price adjustment fall into two categories: first, adjustment may be delayed due
to microstructure factors such as a small investor base, low liquidity or limited information arrival.
As microstructure determinants of stock price adjustment efficiency I use turnover (TURN),
illiquidity (ILLIQUIDITY), market capitalization (SIZE) and the standard deviation of stock returns
(VOLATILITY). Second, stock price adjustment may be delayed due to investor inattention, thus as
proxies for investor inattention I include institutional ownership (INST), book to market (BK/MK),
number of employees (EMPLOY) and number of analysts (ANALYST).12 INST is the percentage
of total shares outstanding held in aggregate by institutional investors in the option introduction
quarter. BK/MK is book value in the year of option introduction divided by market capitalization
12 The selected determinants of stock price adjustment are similar to those used in Hou and Moskowitz (2005) and variables found to influence short sale constraint levels in Nagel (2005). They are also consistent with variables found by Mayhew and Mihov (2004) and Danielsen et al. (2007) to predict option introduction likelihood.
20
the day before option introduction.13 TURN is the mean daily turnover the year preceding option
introduction.14 ILLIQUIDITY is the average weekly Amihud Illiquidity Ratio (Amihud, 2002) the
year preceding option introduction:
d
dd Volume
rIR = (14)
where rd is the close-close weekly return and Volumed is the dollar value of aggregate weekly
volume, both in week d.15 SIZE is market capitalization the day prior to option introduction.
VOLATILITY is the standard deviation of daily stock returns over the year preceding option
introduction. ANALYST is the number of analysts which cover the stock in the year of option
introduction and EMPLOY is the number of people employed by the firm in the fiscal year end of
option introduction.16
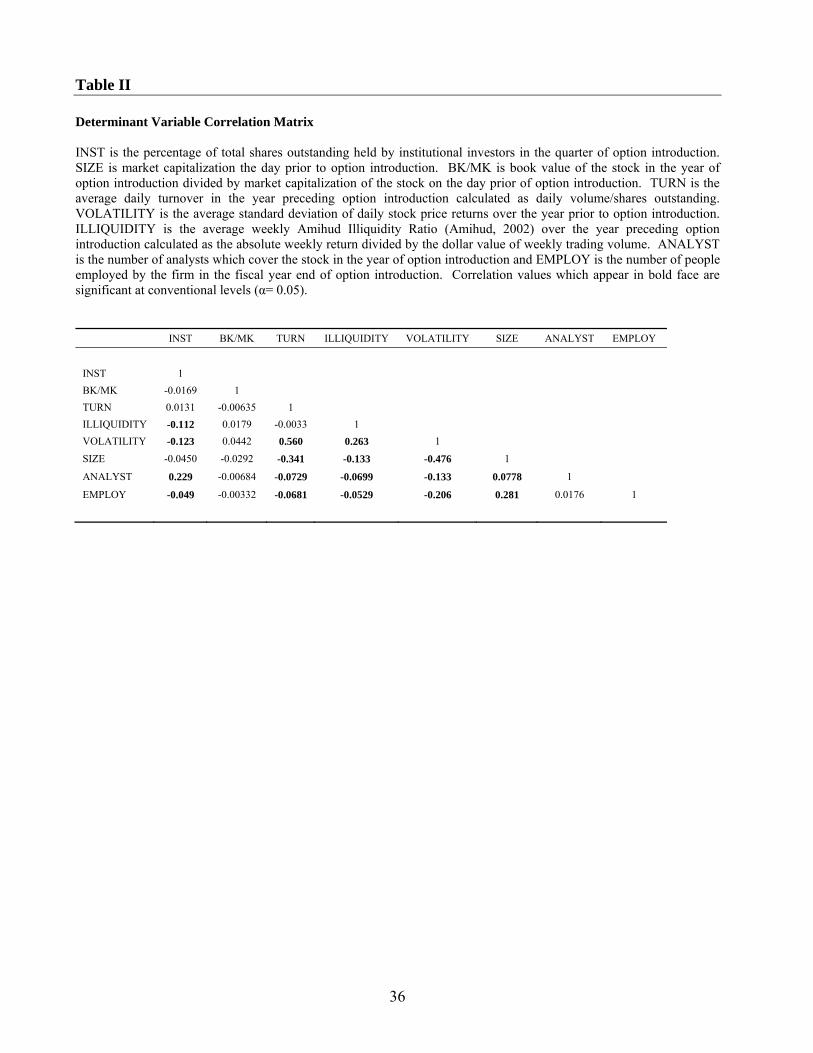
Table II presents the correlation matrix for the determinant variables of stock price adjustment
delay. Correlation levels are generally below 0.30, with the exception of the correlation between
return volatility and turnover (0.56) and between return volatility and size (-0.48). These
correlations are intuitive: high volatility stocks tend to be small (low market capitalization) with
high turnover.
13 Where book value is defined as common equity plus balance sheet deferred taxes. Book value data could not be located for 13 stocks. For those stocks, book value / market value was set to the average of the test sample. Findings are robust if those 13 stocks are excluded from the sample. 14 Where turnover is calculated as daily trading volume divided by shares outstanding. 15 Weekly returns and aggregate weekly volume are used as opposed to daily values to control for downward bias in the Amihud illiquidity measure which potentially result from thin trading. Results are robust if daily volume and return data are used instead. 16 Book value and employment data was obtained from the Compustat database. Analyst coverage data was obtained from the International Brokers Estimates System database. Employment data was unavailable for approximately 10% of the test sample, thus for those stocks the mean employment value of the sample was used.

21
[Insert Table II approximately here]
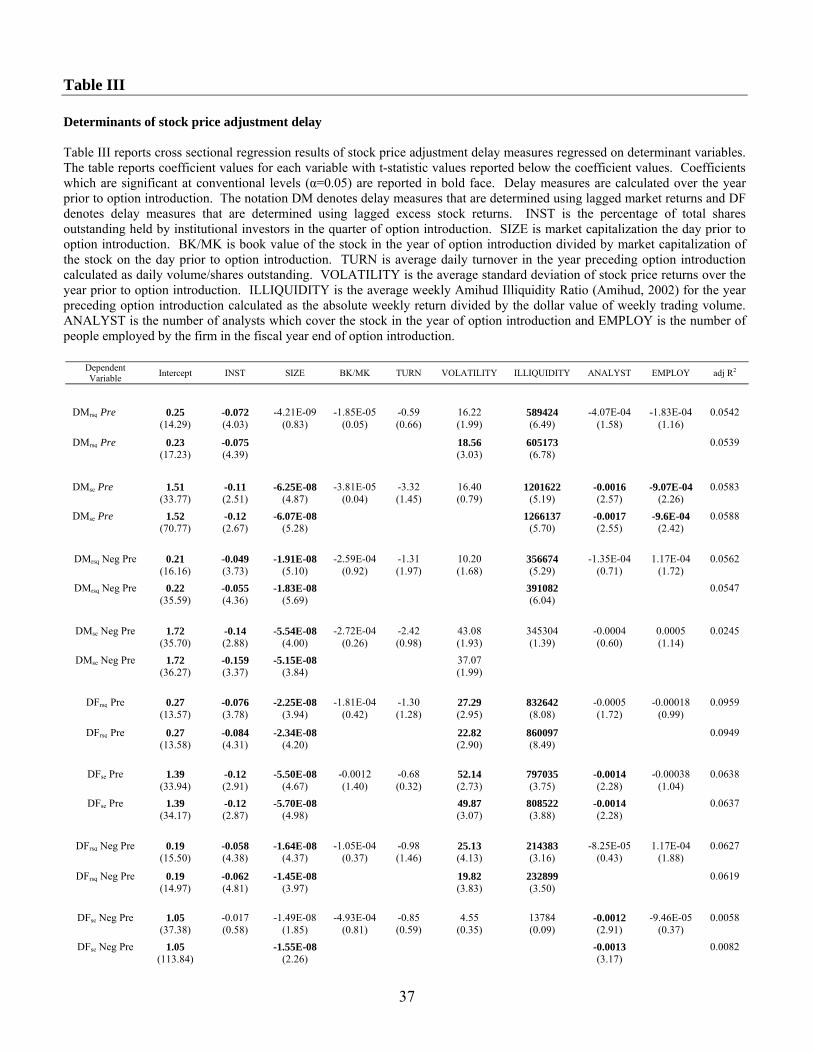
Table III reports the cross-sectional regression results of the stock price delay measures
regressed on the selected determinant variables. As the correlation between the Dsum and Dse delay
measures is in excess of 0.9 in both the pre and post option periods across the majority of models, in
the interest of brevity, only Drsq and Dse values are reported for each model throughout the article.
The Dsum values are available upon request. There is a high level of consistency in the determinant
regression results. For both the Drsq and Dse measures, in relation to market wide and firm specific
news and in relation to negative and overall news, institutional ownership, size and illiquidity are
significant determinants of stock price adjustment delay in the majority of the models. Analyst
coverage and volatility are significant in approximately half the models, while book to market,
turnover and employment are rarely significant. Hou and Moskowitz (2005) document that high
delay firms tend to be small, volatile and less visible stocks potentially overlooked or neglected by
investors. Intuitively, stocks for which prices adjust rapidly will be characterized by a large, active
investor base which is able to quickly evaluate and trade on new information and vice versa. I find
results consistent with this conjecture.
[Insert Table III approximately here]
In the pre option introduction period, across both speed of adjustment measures (Drsq and Dse), large
stocks with high institutional ownership, analyst coverage, number of employees and turnover
(negative coefficient values for INST, TURN, ANALYST, EMPLOY and SIZE) and low volatility

22
and illiquidity (positive coefficient values for VOLATILITY and ILLIQUIDITY) tend to be stocks
with high price adjustment efficiency (low Drsq and Dse values).17
V. Option Introduction and the Speed of Stock Price Adjustment to Market News
The first question of my analysis examines whether option introduction contributes to the
relaxation of short sale constraints. I first examine the post option change in market efficiency in
relation to public, market wide news proxied by daily market returns as this model construct is most
consistent with Hou and Moskowitz (2005). Results related to the change in market efficiency in
relation to firm specific news are reported in the following section.
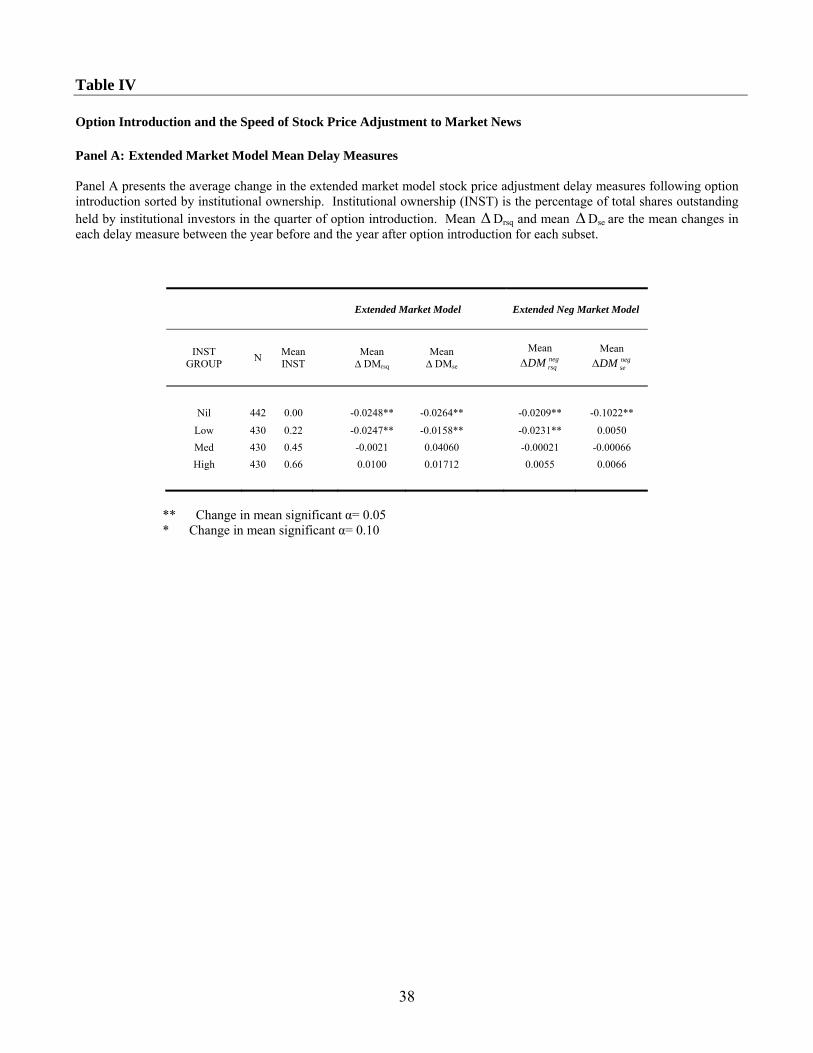
Panel A of Table IV summarizes the change in the extended market model delay measures from
the year prior to the year following option introduction, sorted by institutional ownership (proxy for
short sale loan supply). Approximately 25% of the test sample consisted of stocks with 0%
institutional ownership (Nil INST GROUP). The remaining stocks were divided into three equal
subsets (Low to High INST GROUPS) to form approximate institutional ownership quartiles.
Moving incrementally between institutional ownership quartiles, the percentage of shares
outstanding held by institutional investors increases by approximately 22%.
[Insert Panel A of Table IV approximately here]
Focusing first on the extended market model, which considers improvement in market efficiency in
relation to all market news, only stocks with low or nil institutional ownership (proxy for high short
sale constraint levels) realize a significant improvement in stock price adjustment efficiency
17 These results are unchanged if delay measures calculated over the year following option introduction are examined instead.
23
(negative ∆D). The extended neg market model, which examines the speed of stock price
adjustment to negative market news, illustrates that the noted improvement in market efficiency
occurs only for short sale constrained stocks, in response to negative new information. Collectively,
these results support the conclusion that option introduction has a significant mitigating effect on
short sale constraints. As a measure of the significance of this effect, prior to option introduction,
short sale constrained stocks (Nil INST GROUP) adjust to negative information 19% slower than
unconstrained stocks (High INST GROUP). Following option introduction that difference is
reduced to 4%, indicating option introduction eliminates 76% of the price efficiency disparity
between short sale constrained and unconstrained stocks (based on negrsqDM values).
The results in Panel A of Table IV are subject to a series of limitations. First, although the
results are robust to variation of the institutional ownership groupings, establishment of the
breakpoints between groups can inevitably be criticized as arbitrary. Second, it is possible that
institutional ownership proxies for a different stock characteristic, other than short sale loan supply,
such as stock size, liquidity or investor inattention which is related to adjustment efficiency.18 To
more formally test the effect of option introduction on short sale constraints I complete cross
sectional regressions, regressing the change in the stock price adjustment delay on institutional
ownership (proxy for short sale loan supply) and control variables. Variables found to be significant
determinants of stock price adjustment delay were selected as control variables (refer to Table III).19
To control for microstructure variables potentially also proxied by institutional ownership I include
size, volatility and illiquidity. To control for investor inattention I also include analyst coverage,
although size and illiquidity also serve as effective controls for investor inattention. Stocks
18It is noteworthy that the differential effect between positive and negative news makes it less likely that institutional ownership proxies for a different stock characteristic. 19 The results are robust to inclusion of all the variables considered in Table III.
24
potentially overlooked by investors tend to be small and illiquid with low turnover, analyst
following and institutional investor interest.20 As a final control I include the change in institutional
ownership from one year prior to one year after option introduction as an increase in institutional
investor interest could also be related to an improvement in stock price adjustment efficiency. The
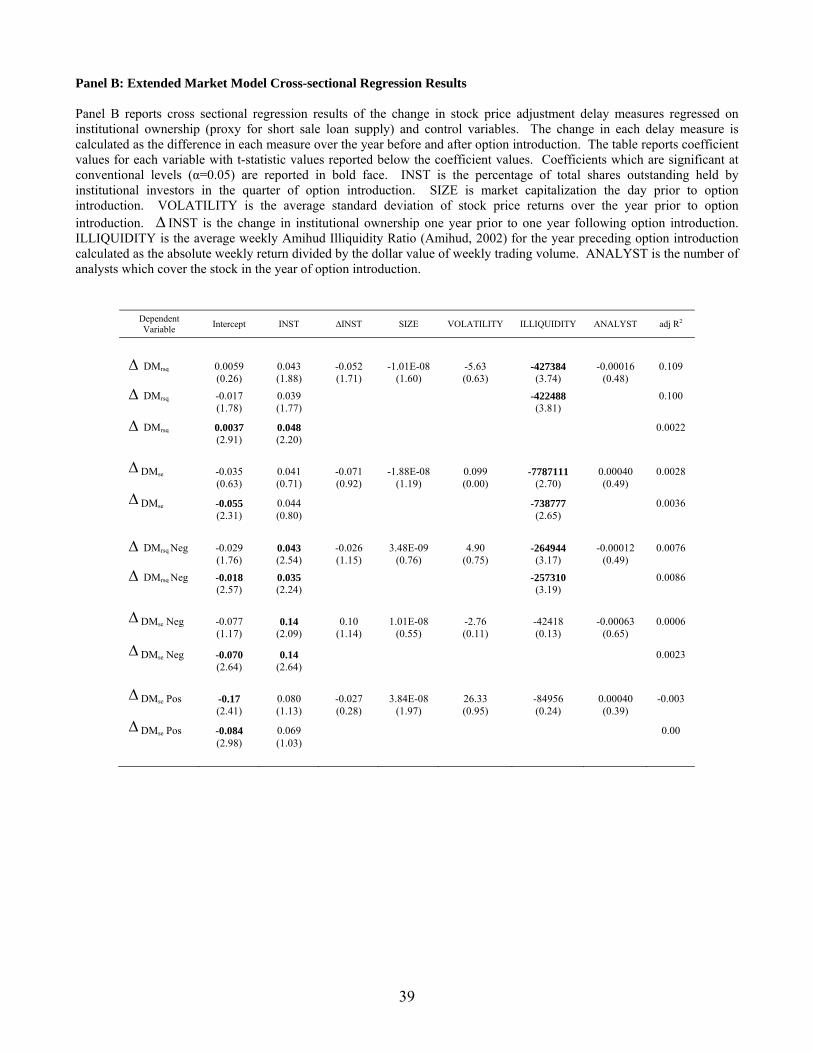
cross-sectional regression results are reported in Panel B of Table IV.
[Insert Panel B of Table IV approximately here]
As short sale constraints are relaxed, new information is expected to be incorporated into stock
prices more rapidly, resulting in a reduction in the delay measures (i.e. a negative ∆D). As short
sale constraints are most binding for low institutional ownership stocks, a positive coefficient value
is expected on INST. Further, as short sale constraints impede only the rate of incorporation of
negative information in stock prices, a significant positive coefficient value is expected on INST in
the DM Neg models while the INST coefficient in the DM Pos models is expected to be
insignificant. I find results generally consistent with these expectations. The significance of the
INST coefficient is reduced in the extended market models which jointly consider positive and
negative information. As I am primarily interested in the differential change in stock price
adjustment delay in relation to negative relative to positive news I focus on the extended neg market
model results which allow a cleaner interpretation. Focusing first on the ∆ negrsqDM measure, short
sale constrained stocks experience a significant (t-stat 2.24) improvement in the speed of stock price
adjustment to negative news following option introduction (positive coefficient value for INST
variable). This relation is mirrored in the ∆ negseDM adjustment efficiency measure (t-stat 2.64). The
20 Hou and Moskowitz (2005) also consider advertising spending and measures of remoteness (distance between the stock’s headquarters and all US airports for example) but these measures were not found to be significant determinants of stock price adjustment delay and thus are not considered.
25
relation between the change in the speed of stock price adjustment to positive information
(∆ posseDM ) and short sale constraints (proxied by institutional ownership) is insignificant at
conventional levels (t-stat 1.03). 21 The selected control variables are generally insignificant with
the exception of illiquidity. Stocks which realize post option improvement in stock price efficiency
are characterized by high relative illiquidity in the year prior to option introduction. Overall, the
results in Panel B of Table IV provide additional evidence of the significance of options to mitigate
short sale constraints.
VI. Option Introduction and the Speed of Stock Price Adjustment to Firm Specific News
The final analysis of this paper is to compare the change in the speed of stock price adjustment
following option introduction in relation to market wide and firm specific news. The distinction
between market and firm specific news is of interest as market wide news consists predominantly of
publicly available information where as firm specific news (proxied by excess stock returns)
contains both private and public information. Miller (1977) argues that short sale constraints
resulted in an irrational upward bias in prices due to trading by overly optimistic investors, thus
negative public and private information would be equally excluded from prices. Conversely,
Diamond and Verrecchia (1987) assume a rational framework in their model and argue that short
sale constraints only impede the speed of stock price adjustment to negative private news. Thus,
consistency in the change in stock price adjustment delay between market wide news and firm
specific news would be supportive of the Miller (1977) hypothesis. Alternatively, under the
21 The extended market model results are robust when replicated with the inclusion of 10 or 15 lags in the model.
26
Diamond and Verrecchia (1987) hypothesis significant improvement in stock price adjustment
should be isolated to the private information component of firm specific news.
Panel A of Table V presents the univariate analysis of the extended firm model delay measures.
The results are generally consistent with the univariate analysis of the extended market model with
the exception of reduced significance in the extended neg firm model. For the Nil institutional
ownership group the mean∆ negrsqDF measure is marginally significant at conventional levels (t
statistic value of 1.95 based on the null hypothesis that the mean = 0) and the mean∆ negseDF is not
statistically significant. When the mean delay measures of the extended firm models are compared
to the corresponding extended market models, none of the delay measures between the two models
are statistically unique (for both overall and neg models).22
These results are mirrored in the cross sectional regression tests presented in Panel B of Table V
in which the extended firm model delay measures are regressed on institutional ownership (proxy
for short sale loan supply) and control variables. Recall, a negative ∆D indicates an improvement
in the speed of stock price adjustment, thus a positive and significant INST coefficient would
indicate an improvement in adjustment efficiency for short sale constrained stocks. For all models,
with the exception of the ∆ negseDF delay measure model, the institutional ownership coefficient is
positive and significant. Further, the institutional ownership coefficient in the ∆ PosseDF model is
insignificant (t statistic 0.67) suggesting no significant post option improvement in stock price
adjustment efficiency in relation to positive firm specific news. As noted for the extended market
model, the control variables are generally insignificant with the exception of illiquidity and the
change in institutional ownership. Stocks which realize a significant post option improvement in
22 As a robustness check, the correlation between the market and excess stock returns was measured as a potential alternative source of commonality between the market and firm models is correlation between the two return series. The mean correlation coefficient across stocks between daily market and excess stock returns was 0.088, suggesting that correlation between the two return series is not a concern.

27
stock price adjustment tend to have high relative pre-option illiquidity and realize an increase in
institutional ownership in the year following option introduction relative to the year prior.
The collective results of the analysis of the effect of option introduction on short sale constraints
can be summarized as follows. First, in relation to both firm specific and market wide news, post
option improvement in the speed of stock price adjustment is isolated to low institutional ownership
stocks (short sale constraint proxy) responding to negative news. No significant effect is noted in
relation to the speed of adjustment to positive news for either firm specific or market wide
information. This result suggests options play a significant role in mitigating short sale constraints.
Second, commonality in the improvement in price adjustment efficiency for both market wide
public and firm specific jointly private and public negative information suggests short sale constraint
effects stem from an irrational optimism bias or another behavioral source as suggested by Miller
(1977). Delayed incorporation of negative private information into stock prices likely also plays a
role in short sale constraint effects but is not the exclusive source in a rational expectations
framework, as suggested by Diamond and Verrecchia (1987). Unfortunately, within the model
construct it is not possible to isolate the speed of adjustment to the private and public components of
firm specific returns to explicitly test the relative contribution of each short sale constraint effect
source to the overall effect.
VII. Robustness
Unlike stock exchanges, the decision to list an option is made at the discretion of the board of
the option exchange and not at the discretion of the firm’s board of directors. Assuming the primary
motivation of an option exchange is to maximize the long term profitability of the exchange, the
28
board of the option exchange will select stocks which are likely to generate the largest, long term
trading volume (Mayhew and Mihov, 2004). Danielsen et al. (2007) examine stock characteristics
which are predictive of option introduction and find that stocks with high market capitalization,
improving liquidity and high abnormal volatility are favored for option listing. Thus, option
exchanges may systematically select stocks which are experiencing an improvement in stock price
adjustment efficiency indirectly based on other selection criteria. This conclusion is supported by
the increase in institutional ownership noted in Figure 1, which suggests stocks undergo an increase
in investor recognition / popularity prior to option introduction.
To rule out the potential influence of endogenous stock characteristics related to option
introduction and stock price adjustment efficiency not already considered as controls in the cross-
sectional regressions, I create a control sample of non-optioned stocks matching the characteristics
of the test sample. To construct the control sample I utilize the methodology in Danielsen et al.
(2007), who estimate a Cox Proportional Hazard Model on pooled monthly observations for all
stocks classified as eligible for option listing but not yet optioned from 1993 to 2002. Danielsen et
al. (2007) consider spread, abnormal spread, volatility, abnormal volatility, volume, abnormal
volume, size and price as potential determinants of option introduction likelihood and determine that
the spread, volatility and size variables are the most significant determinants.
To develop the pool of potential control stocks, from the universe of stocks tracked by the
Center for Research in Security Prices (CRSP), I remove all stocks for which option trading was
introduced from January 1973 – January 1997. Considering the remaining universe of CRSP stocks,
each stock within the test sample is paired with a control stock matched on the following sorting
variables from Danielsen et al. (2007): SIZE is calculated as market capitalization the day prior to
option introduction, PCT SPREAD40-20 is the average daily closing percent spread from 40 to 20
trading days prior to option introduction, where closing percent spread is calculated as closing

29
spread (ask - bid) divided by the mid point between the closing bid and ask. ABSPREAD is
calculated as PCT SPREAD40-20 divided by the average daily closing percent spread from 250 to
125 trading days prior to option introduction. ABSDRET and SDRET40-20 are the standard
deviation of daily returns calculated in the same manner for the same timeframes. As it is desirable
for the control sample to match the test sample in relation to short sale constraint levels, to the list of
variable considered by Danielsen et al. (2007) I add INST, defined as the percentage of shares
outstanding held by institutional investors in the option introduction quarter. All timeframes are in
reference to the option introduction date of the test sample stock. The stock with lowest the equal
weighted, mean percent difference of each of the six sorting variables was selected for the control
sample, where percent difference was calculated as the absolute value of the difference between the
control and test variable divided by the test variable. Once selected to the control sample, that stock
was not eligible for future selection. The end result of the process is the construction of a control
sample of 1145 stocks, each matched to a specific stock in the test sample based on the equal
weighted percent difference in percent spread, abnormal percent spread, volatility, abnormal
volatility, size and institutional ownership.23 It is noteworthy that the selected sorting variables
closely match the variables found to be significant determinants of stock price adjustment delay in
Table 3 (size, volatility and illiquidity). Thus, the control sample is matched to the test sample
based on both option introduction likelihood and determinants of price adjustment efficiency.
Panel A of Table VI presents the mean values of each of the six control methodology sorting
variables for the test and control sample. The percent difference between the test and control sample
is below 15% for each of the variables with the exception of institutional ownership (23.82%) and
23 Bid and ask data were obtained from the Center for Research in Security Prices database. Bid and ask data was not available for the entire test sample, reducing the number of test stocks available for matching in the control sample to 1145 (a reduction of 34%). The general proportionality of stocks in each of the institutional ownership quartiles was not significantly altered, for example the reduction of stocks in the Nil institutional ownership group was reduced by 33% and the other groups experienced similar reductions. Thus, the proportionality of short sale constraint levels in the reduced test sample is considered equivalent to the original.
30
PCT SPREAD40-20 (30.34%). The difference in these two sorting variables suggests the control
sample is more short sale constrained and has higher liquidity than the test sample. Differences
between the control and test sample which bias towards a significant post-option change in stock
price adjustment (lower size and institutional ownership and higher volatility) are more common
than differences in variables which suggest the opposite (higher liquidity). Thus, if anything, the
differences between the control and test sample bias against the finds of this paper. As an additional
robustness check I constructed a second control sample matched to the test sample based only on
size and institutional ownership. Using the second methodology I am able to match the entire test
sample (1732 stocks) and the percent difference of SIZE and INST is reduced to 0.8% and 21.3%
respectively. As the results are fundamentally consistent between the two control samples, only
results related to the first control sample are presented.
Panel B of Table VI presents the univariate analysis of the change in delay measures for the
control sample. The institutional ownership groups (INST GROUP) are established in the same
manner as the test sample, allocating stocks with zero percent institutional ownership to the first
group and then equally allocating the remaining stocks to the three remaining groups to establish
approximate quartiles. Recall, a reduction in each delay measure reflects an improvement in stock
price adjustment efficiency. Over the timeframe of option introduction, for each of the eight delay
measures, no significant change in stock price adjustment efficiency is noted for stocks with high
short sale constraint levels (Nil and Low INST GROUP). Stocks with low short sale constraint
levels (Med and High INST GROUP) realize a significant decrease in stock price adjustment
efficiency for the majority of the price delay measures, with the exception of the ∆ negrsqDF measure
for the Med INST GROUP which reflects an improvement in adjustment efficiency. As discussed
in the next paragraph, the results related to the∆ negrsqDF measure for the Med INST GROUP are
insignificant in the multivariate analysis with the inclusion of control variables.
31
Panel C of Table VI reports the results of the multivariate analysis of the control sample, in
which the adjustment delay measures are regressed on institutional ownership and a series of control
variables. After controlling for size, volatility, illiquidity and analyst coverage, no significant
relation is noted between the change in stock price adjustment efficiency and short sale constraint
levels (proxied by institutional ownership) in relation to both positive and negative information.24
Collectively, these results reflect no significant reduction in short sale constraint levels for the
control sample over the timeframe of option introduction of the test sample.
VIII. Concluding Remarks
When short sale constraints bind, pessimistic investors who do not own the stock are constrained
from trading on their bearish value opinions resulting in negative information being withheld from
the market. Thus, stock values are potentially upward biased as prices are set by the most optimistic
subset of investors (Miller, 1977) and the speed which private, negative information is impounded in
stock prices may be delayed (Diamond and Verrecchia, 1987). Option introduction provides an
alternative venue for pessimistic investors to realize a synthetic short position, circumventing short
sale constraints. While strongly related, the Miller and the Diamond and Verrecchia hypotheses
yield opposing predictions in regard to the effect of option introduction on short sale constraints.
Miller’s hypothesis predicts both private and public negative information will impound in stock
prices more rapidly following option introduction, whereas the Diamond and Verrecchia hypothesis,
24 As the extended negative and positive delay measures provide the cleanest test of the change in stock price adjustment in relation to negative news only results for those variables are reported. Results in relation to the extend market model and extended firm model are consistent with the results presented in Panel B of Table VI and are available upon request.
32
which assumes rational expectations hold, predicts the effect will be limited to private, negative
news.
Motivated by the predictions of the Miller (1977) and the Diamond and Verrecchia (1987)
models, I test a series of predictions: first, the post option improvement in stock price adjustment
efficiency should be greatest for short sale constrained stocks. As short sale constraints impede only
negative information from being impounded in stock prices, post option improvement in stock price
efficiency should be greater in respect to negative relative to positive information. Second, if
rational expectations hold and short sale constraints only withhold private and not public negative
information from the market, option introduction should affect only firm specific and not market
wide news.
I find that option introduction significantly improves the speed of stock price adjustment to
negative news for short sale constrained stocks (proxied by institutional ownership). No significant
improvement in stock price adjustment efficiency is noted in relation to positive news. The results
suggest that up to 76% of the pre-option disparity in adjustment efficiency between high and low
short sale constrained stocks is eliminated by option introduction. Further, I find no significant
difference in post option improvement in stock price efficiency between public, market wide news
and firm specific news which includes both private and public information. This result suggests
short sale constraint effects stem from an irrational optimism bias or another behavioral source as
suggested by Miller (1977). Delayed incorporation of negative private information into stock prices
likely also plays a role in short sale constraint effects but is not the exclusive source in a rational
expectations framework, as suggested by Diamond and Verrecchia (1987). Collectively, the results
in this article provide strong evidence that option introduction reduces short sale constraints in a
significant manner, improving informational efficiency in the stock market.

33
References
Amihud, Y., 2002, Illiquidity and stock returns: cross-section and time-series effects, Journal of Financial Markets 5, 31-56. Asquith, P. Pathak, P.A. and Ritter, J.R., 2005, Short interest, institutional ownership and stock returns, Journal of Financial Economics 78, 243-276. Bris, A., Goetzmann, W.N. and Whu, N., 2007, Efficiency and the bear: short sales and markets around the world, Journal of Finance 62, 1029-1079. Chan, K., Chung, E.P. and Fong, W., 2002, The informational role of stock and option volume, Review of Financial Studies 15, 1049-1075. Chen, J., Hong, H. and Stein, J.C., 2002, Breadth of ownership and stock returns, Journal of Financial Economics 66, 171-205. Chakravarty, S., Gulen, H. and Mayhew, S., 2004, Informed trading in stock and option markets, Journal of Finance 59, 1235-1257. D’Avolio, G., 2002, The market for borrowing stock, Journal of Financial Economics 66, 271-306. Damodaran, A. and Lim, J. 1991, The effects of option listing on the underlying stocks’ return process, Journal of Banking and Finance 15, 647-664. Damodaran, A. and Lim, J., 1992, Put listing, short sales restrictions and return processes, Stern School of Business, New York University and National University of Singapore working paper. Danielsen, B., Van Ness, B. and Warr, S., 2007, Reassessing the impact of option introductions on market quality: a less restrictive test for event-date effects, Journal of Financial and Quantitative Analysis 42, 1041-1062. Danielsen, B. and Sorescu, S., 2001, Why do option introductions depress stock prices? A study of diminishing short sale constraints, Journal of Financial and Quantitative Analysis 36, 451-484. Diamond, W.D. and Verrecchia, D.E., 1987, Constraints on short-selling and asset price adjustment to private information, Journal of Financial Economics 18, 277-311. Evans, R.B., Geczy, C.C., Musto, D.K. and Reed, A., 2008, Failure is an option: Impediments to short selling and option prices, Forthcoming Review of Financial Studies. Fedenia, M. and Grammatikos, T., 1992, Options trading and the bid-ask spread of the underlying stocks, Journal of Business 65, 335-351. Figlewski, S. and Webb, G.P., 1993, Options, short sales and market completeness, Journal of Finance 48, 761-777.

34
Hou, K. and Moskowitz, T.J., 2005, Market frictions, price delay, and the cross section of expected returns, Review of Financial Studies 18, 982-1020. Jennings, R. and Starks, L., 1986, Earnings announcements, stock price adjustment, and the existence of options markets, Journal of Finance 41, 107-125. Jones, C.M. and Lamont, O.A., 2002, Short-sale constraints and stock returns, Journal of Financial Economics 66, 207-239. Mayhew, S. and Mihov, V., 2004, How do exchanges select stocks for option listing?, Journal of Finance 59, 447-463.
Mayhew, S. and Mihov, V., 2005, Short sale constraints, overvaluation and the introduction of options, Texas Christian University working paper. Miller, E.M., 1977, Risk, uncertainty, and divergence of opinion, Journal of Finance 32, 1151-1168. Nagel, S., 2005, Short sales, institutional investors and the cross-section of stock returns, Journal of Financial Economics 78, 277-309. Reed, A.V., 2003, Costly short-selling and stock price adjustment to earnings announcements, University of North Carolina working paper. Saffi, P.A.C., and Sigurdsson, K., 2007, Price efficiency and short selling, London Business School working paper. Sauer, R., 2006, Bring on the bears, New York Times, October 6, 25. Skinner, D. J., 1990, Option markets and the information content of accounting earnings releases, Journal of Accounting and Economics 13, 191-211. Sorescu, S.M., 2000, The effect of options on stock prices: 1973 to 1995, Journal of Finance 55, 487-514. U.S. Securities and Exchange Commission (SEC), 1999, SEC Concept Release: Short Sales. Release No. 34-42037, File No. S7-24-99.
35
Table I
Summary Statistics Price is the stock price on the day before option introduction. Shares is the average number of shares outstanding in millions over the year prior to option introduction. Volatility is the average standard deviation of daily stock price returns over the year prior to option introduction. Volume is the average daily trading volume in thousands in the year preceding option introduction. Turnover is the average daily turnover in the year preceding option introduction calculated as daily volume/shares outstanding. Size is market capitalization on the day prior to option introduction. Book is book value per share reported for the year which the underlying stock was listed on the option exchange. BK/MK is book value of the stock in the year of option introduction divided by market capitalization of the stock on the day prior to option introduction. INST is the percentage of total shares outstanding which are held by institutional investors in the quarter the stock was listed on the option exchange.
Price Shares Volatility Volume Turnover Size Book BK/MK INST ($/share) (million) (1000) (%) (million $) ($/share) (%)
N 1732 1732 1732 1732 1732 1732 1719 1719 1732 Mean 26.45 26.74 0.0294 120 0.70 805 17.23 1.01 33 Median 23.25 17.07 0.0279 97 0.51 470 4.31 0.19 34 Std Dev 16.65 30.89 0.0119 105 0.61 103 153.66 11.64 26 Q3 33.50 29.78 0.0369 141 0.95 937 8.80 0.41 54 Q1 15.60 11.22 0.0202 66 0.28 257 1.80 0.08 0
36
Table II Determinant Variable Correlation Matrix INST is the percentage of total shares outstanding held by institutional investors in the quarter of option introduction. SIZE is market capitalization the day prior to option introduction. BK/MK is book value of the stock in the year of option introduction divided by market capitalization of the stock on the day prior of option introduction. TURN is the average daily turnover in the year preceding option introduction calculated as daily volume/shares outstanding. VOLATILITY is the average standard deviation of daily stock price returns over the year prior to option introduction. ILLIQUIDITY is the average weekly Amihud Illiquidity Ratio (Amihud, 2002) over the year preceding option introduction calculated as the absolute weekly return divided by the dollar value of weekly trading volume. ANALYST is the number of analysts which cover the stock in the year of option introduction and EMPLOY is the number of people employed by the firm in the fiscal year end of option introduction. Correlation values which appear in bold face are significant at conventional levels (α= 0.05).
INST BK/MK TURN ILLIQUIDITY VOLATILITY SIZE ANALYST EMPLOY
INST 1 BK/MK -0.0169 1 TURN 0.0131 -0.00635 1 ILLIQUIDITY -0.112 0.0179 -0.0033 1 VOLATILITY -0.123 0.0442 0.560 0.263 1
SIZE -0.0450 -0.0292 -0.341 -0.133 -0.476 1
ANALYST 0.229 -0.00684 -0.0729 -0.0699 -0.133 0.0778 1
EMPLOY -0.049 -0.00332 -0.0681 -0.0529 -0.206 0.281 0.0176 1
37
Table III Determinants of stock price adjustment delay Table III reports cross sectional regression results of stock price adjustment delay measures regressed on determinant variables. The table reports coefficient values for each variable with t-statistic values reported below the coefficient values. Coefficients which are significant at conventional levels (α=0.05) are reported in bold face. Delay measures are calculated over the year prior to option introduction. The notation DM denotes delay measures that are determined using lagged market returns and DF denotes delay measures that are determined using lagged excess stock returns. INST is the percentage of total shares outstanding held by institutional investors in the quarter of option introduction. SIZE is market capitalization the day prior to option introduction. BK/MK is book value of the stock in the year of option introduction divided by market capitalization of the stock on the day prior to option introduction. TURN is average daily turnover in the year preceding option introduction calculated as daily volume/shares outstanding. VOLATILITY is the average standard deviation of stock price returns over the year prior to option introduction. ILLIQUIDITY is the average weekly Amihud Illiquidity Ratio (Amihud, 2002) for the year preceding option introduction calculated as the absolute weekly return divided by the dollar value of weekly trading volume. ANALYST is the number of analysts which cover the stock in the year of option introduction and EMPLOY is the number of people employed by the firm in the fiscal year end of option introduction.
Dependent Variable Intercept INST SIZE BK/MK TURN VOLATILITY ILLIQUIDITY ANALYST EMPLOY adj R2
DMrsq Pre 0.25 -0.072 -4.21E-09 -1.85E-05 -0.59 16.22 589424 -4.07E-04 -1.83E-04 0.0542 (14.29) (4.03) (0.83) (0.05) (0.66) (1.99) (6.49) (1.58) (1.16)
DMrsq Pre 0.23 -0.075 18.56 605173 0.0539 (17.23) (4.39) (3.03) (6.78) DMse Pre 1.51 -0.11 -6.25E-08 -3.81E-05 -3.32 16.40 1201622 -0.0016 -9.07E-04 0.0583
(33.77) (2.51) (4.87) (0.04) (1.45) (0.79) (5.19) (2.57) (2.26) DMse Pre 1.52 -0.12 -6.07E-08 1266137 -0.0017 -9.6E-04 0.0588
(70.77) (2.67) (5.28) (5.70) (2.55) (2.42) DMrsq Neg Pre 0.21 -0.049 -1.91E-08 -2.59E-04 -1.31 10.20 356674 -1.35E-04 1.17E-04 0.0562
(16.16) (3.73) (5.10) (0.92) (1.97) (1.68) (5.29) (0.71) (1.72) DMrsq Neg Pre 0.22 -0.055 -1.83E-08 391082 0.0547
(35.59) (4.36) (5.69) (6.04) DMse Neg Pre 1.72 -0.14 -5.54E-08 -2.72E-04 -2.42 43.08 345304 -0.0004 0.0005 0.0245
(35.70) (2.88) (4.00) (0.26) (0.98) (1.93) (1.39) (0.60) (1.14) DMse Neg Pre 1.72 -0.159 -5.15E-08 37.07
(36.27) (3.37) (3.84) (1.99)
DFrsq Pre 0.27 -0.076 -2.25E-08 -1.81E-04 -1.30 27.29 832642 -0.0005 -0.00018 0.0959 (13.57) (3.78) (3.94) (0.42) (1.28) (2.95) (8.08) (1.72) (0.99)
DFrsq Pre 0.27 -0.084 -2.34E-08 22.82 860097 0.0949 (13.58) (4.31) (4.20) (2.90) (8.49)
DFse Pre 1.39 -0.12 -5.50E-08 -0.0012 -0.68 52.14 797035 -0.0014 -0.00038 0.0638
(33.94) (2.91) (4.67) (1.40) (0.32) (2.73) (3.75) (2.28) (1.04) DFse Pre 1.39 -0.12 -5.70E-08 49.87 808522 -0.0014 0.0637
(34.17) (2.87) (4.98) (3.07) (3.88) (2.28)
DFrsq Neg Pre 0.19 -0.058 -1.64E-08 -1.05E-04 -0.98 25.13 214383 -8.25E-05 1.17E-04 0.0627 (15.50) (4.38) (4.37) (0.37) (1.46) (4.13) (3.16) (0.43) (1.88)
DFrsq Neg Pre 0.19 -0.062 -1.45E-08 19.82 232899 0.0619 (14.97) (4.81) (3.97) (3.83) (3.50)
DFse Neg Pre 1.05 -0.017 -1.49E-08 -4.93E-04 -0.85 4.55 13784 -0.0012 -9.46E-05 0.0058
(37.38) (0.58) (1.85) (0.81) (0.59) (0.35) (0.09) (2.91) (0.37) DFse Neg Pre 1.05 -1.55E-08 -0.0013 0.0082
(113.84) (2.26) (3.17)
38
Table IV Option Introduction and the Speed of Stock Price Adjustment to Market News Panel A: Extended Market Model Mean Delay Measures Panel A presents the average change in the extended market model stock price adjustment delay measures following option introduction sorted by institutional ownership. Institutional ownership (INST) is the percentage of total shares outstanding held by institutional investors in the quarter of option introduction. Mean ∆Drsq and mean ∆Dse are the mean changes in each delay measure between the year before and the year after option introduction for each subset.
Extended Market Model
Extended Neg Market Model
INST GROUP N Mean
INST
Mean ∆ DMrsq
Mean ∆ DMse
Mean negrsqDM∆
Mean negseDM∆
Nil 442 0.00 -0.0248** -0.0264** -0.0209** -0.1022**
Low 430 0.22 -0.0247** -0.0158** -0.0231** 0.0050 Med 430 0.45 -0.0021 0.04060 -0.00021 -0.00066 High 430 0.66 0.0100 0.01712 0.0055 0.0066
** Change in mean significant α= 0.05 * Change in mean significant α= 0.10
39
Panel B: Extended Market Model Cross-sectional Regression Results Panel B reports cross sectional regression results of the change in stock price adjustment delay measures regressed on institutional ownership (proxy for short sale loan supply) and control variables. The change in each delay measure is calculated as the difference in each measure over the year before and after option introduction. The table reports coefficient values for each variable with t-statistic values reported below the coefficient values. Coefficients which are significant at conventional levels (α=0.05) are reported in bold face. INST is the percentage of total shares outstanding held by institutional investors in the quarter of option introduction. SIZE is market capitalization the day prior to option introduction. VOLATILITY is the average standard deviation of stock price returns over the year prior to option introduction. ∆ INST is the change in institutional ownership one year prior to one year following option introduction. ILLIQUIDITY is the average weekly Amihud Illiquidity Ratio (Amihud, 2002) for the year preceding option introduction calculated as the absolute weekly return divided by the dollar value of weekly trading volume. ANALYST is the number of analysts which cover the stock in the year of option introduction.
Dependent Variable Intercept INST ∆INST SIZE VOLATILITY ILLIQUIDITY ANALYST adj R2
∆ DMrsq 0.0059 0.043 -0.052 -1.01E-08 -5.63 -427384 -0.00016 0.109 (0.26) (1.88) (1.71) (1.60) (0.63) (3.74) (0.48) ∆ DMrsq -0.017 0.039 -422488 0.100 (1.78) (1.77) (3.81) ∆ DMrsq 0.0037 0.048 0.0022 (2.91) (2.20) ∆ DMse -0.035 0.041 -0.071 -1.88E-08 0.099 -7787111 0.00040 0.0028 (0.63) (0.71) (0.92) (1.19) (0.00) (2.70) (0.49) ∆ DMse -0.055 0.044
-738777
0.0036
(2.31) (0.80) (2.65) ∆ DMrsq Neg -0.029 0.043 -0.026 3.48E-09 4.90 -264944 -0.00012 0.0076 (1.76) (2.54) (1.15) (0.76) (0.75) (3.17) (0.49) ∆ DMrsq Neg -0.018 0.035 -257310 0.0086 (2.57) (2.24) (3.19) ∆ DMse Neg -0.077 0.14 0.10 1.01E-08 -2.76 -42418 -0.00063 0.0006 (1.17) (2.09) (1.14) (0.55) (0.11) (0.13) (0.65) ∆ DMse Neg -0.070 0.14
0.0023
(2.64) (2.64) ∆ DMse Pos -0.17 0.080 -0.027 3.84E-08 26.33 -84956 0.00040 -0.003 (2.41) (1.13) (0.28) (1.97) (0.95) (0.24) (0.39) ∆ DMse Pos -0.084 0.069
0.00
(2.98) (1.03)

40
Table V Option Introduction and the Speed of Stock Price Adjustment to Firm Specific News Panel A: Extended Firm Model Mean Delay Measures Panel A presents the average change in the extended market model stock price adjustment delay measures following option introduction sorted by institutional ownership. Institutional ownership (INST) is the percentage of total shares outstanding held by institutional investors in the quarter of option introduction. Mean ∆Drsq and mean ∆Dse are the mean changes in each delay measure between the year before and the year after option introduction for each subset.
Extended Firm Model
Extended Neg Firm Model
INST GROUP N Mean
INST
Mean ∆ DFrsq
Mean ∆ DFse
Mean neg
rsqDF∆ Mean
negseDF∆
Nil 442 0.00 -0.0291** -0.0557** -0.0181* -0.0024
Low 430 0.22 -0.0301** -0.0355 -0.0163** -0.0231 Med 430 0.45 -0.0001 0.0240 0.00358 0.00302 High 430 0.66 0.0095 0.0272 0.0131 -0.0090
** Change in mean significant α= 0.05 * Change in mean significant α= 0.10
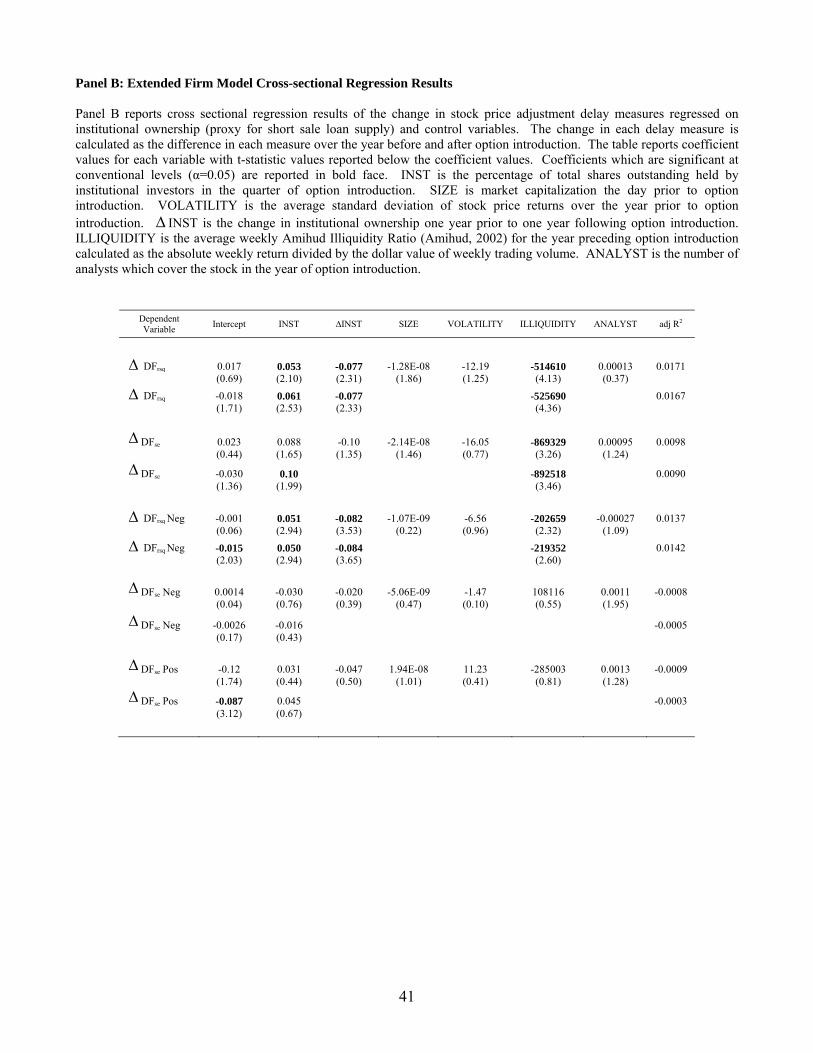
41
Panel B: Extended Firm Model Cross-sectional Regression Results Panel B reports cross sectional regression results of the change in stock price adjustment delay measures regressed on institutional ownership (proxy for short sale loan supply) and control variables. The change in each delay measure is calculated as the difference in each measure over the year before and after option introduction. The table reports coefficient values for each variable with t-statistic values reported below the coefficient values. Coefficients which are significant at conventional levels (α=0.05) are reported in bold face. INST is the percentage of total shares outstanding held by institutional investors in the quarter of option introduction. SIZE is market capitalization the day prior to option introduction. VOLATILITY is the average standard deviation of stock price returns over the year prior to option introduction. ∆ INST is the change in institutional ownership one year prior to one year following option introduction. ILLIQUIDITY is the average weekly Amihud Illiquidity Ratio (Amihud, 2002) for the year preceding option introduction calculated as the absolute weekly return divided by the dollar value of weekly trading volume. ANALYST is the number of analysts which cover the stock in the year of option introduction.
Dependent Variable Intercept INST ∆INST SIZE VOLATILITY ILLIQUIDITY ANALYST adj R2
∆ DFrsq 0.017 0.053 -0.077 -1.28E-08 -12.19 -514610 0.00013 0.0171 (0.69) (2.10) (2.31) (1.86) (1.25) (4.13) (0.37) ∆ DFrsq -0.018 0.061 -0.077 -525690 0.0167 (1.71) (2.53) (2.33) (4.36) ∆ DFse 0.023 0.088 -0.10 -2.14E-08 -16.05 -869329 0.00095 0.0098 (0.44) (1.65) (1.35) (1.46) (0.77) (3.26) (1.24) ∆ DFse -0.030 0.10
-892518
0.0090
(1.36) (1.99) (3.46) ∆ DFrsq Neg -0.001 0.051 -0.082 -1.07E-09 -6.56 -202659 -0.00027 0.0137 (0.06) (2.94) (3.53) (0.22) (0.96) (2.32) (1.09) ∆ DFrsq Neg -0.015 0.050 -0.084 -219352 0.0142 (2.03) (2.94) (3.65) (2.60) ∆ DFse Neg 0.0014 -0.030 -0.020 -5.06E-09 -1.47 108116 0.0011 -0.0008 (0.04) (0.76) (0.39) (0.47) (0.10) (0.55) (1.95) ∆ DFse Neg -0.0026 -0.016
-0.0005
(0.17) (0.43) ∆ DFse Pos -0.12 0.031 -0.047 1.94E-08 11.23 -285003 0.0013 -0.0009 (1.74) (0.44) (0.50) (1.01) (0.41) (0.81) (1.28) ∆ DFse Pos -0.087 0.045
-0.0003
(3.12) (0.67)
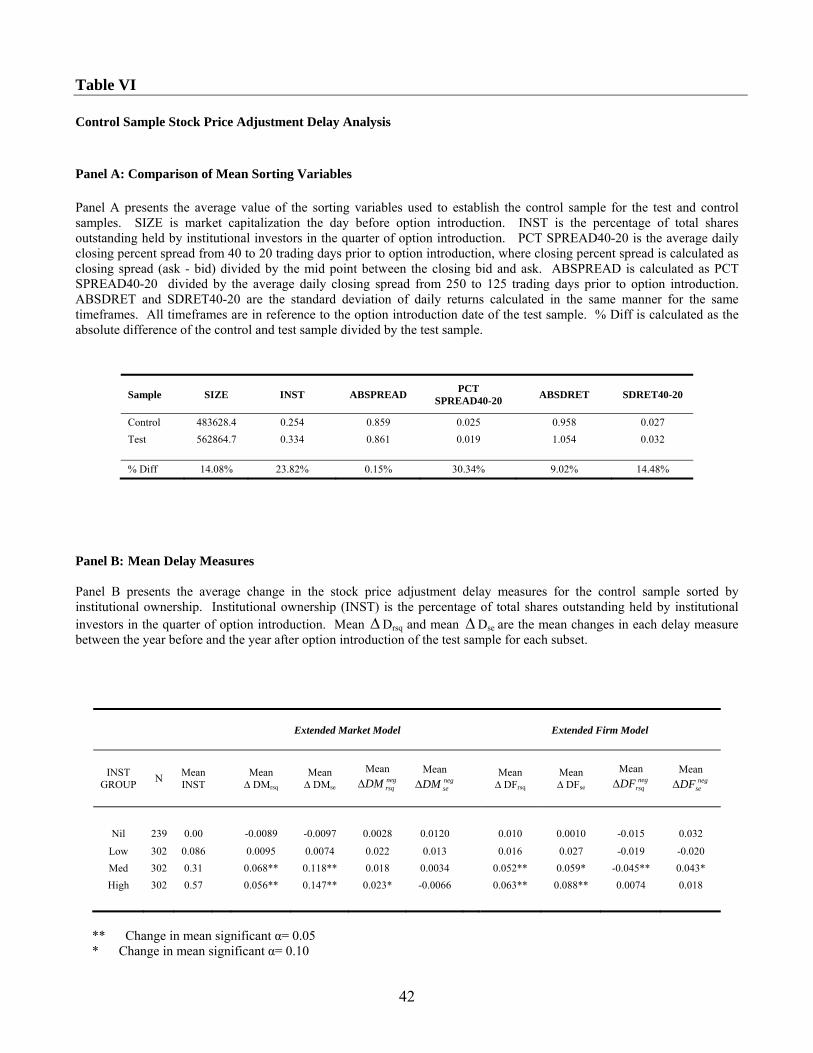
42
Table VI Control Sample Stock Price Adjustment Delay Analysis Panel A: Comparison of Mean Sorting Variables Panel A presents the average value of the sorting variables used to establish the control sample for the test and control samples. SIZE is market capitalization the day before option introduction. INST is the percentage of total shares outstanding held by institutional investors in the quarter of option introduction. PCT SPREAD40-20 is the average daily closing percent spread from 40 to 20 trading days prior to option introduction, where closing percent spread is calculated as closing spread (ask - bid) divided by the mid point between the closing bid and ask. ABSPREAD is calculated as PCT SPREAD40-20 divided by the average daily closing spread from 250 to 125 trading days prior to option introduction. ABSDRET and SDRET40-20 are the standard deviation of daily returns calculated in the same manner for the same timeframes. All timeframes are in reference to the option introduction date of the test sample. % Diff is calculated as the absolute difference of the control and test sample divided by the test sample.
Sample SIZE INST ABSPREAD PCT SPREAD40-20 ABSDRET SDRET40-20
Control 483628.4 0.254 0.859 0.025 0.958 0.027 Test 562864.7 0.334 0.861 0.019 1.054 0.032 % Diff 14.08% 23.82% 0.15% 30.34% 9.02% 14.48%
Panel B: Mean Delay Measures Panel B presents the average change in the stock price adjustment delay measures for the control sample sorted by institutional ownership. Institutional ownership (INST) is the percentage of total shares outstanding held by institutional investors in the quarter of option introduction. Mean ∆Drsq and mean ∆Dse are the mean changes in each delay measure between the year before and the year after option introduction of the test sample for each subset.
Extended Market Model
Extended Firm Model
INST GROUP N Mean
INST Mean ∆ DMrsq
Mean ∆ DMse
Mean negrsqDM∆
Mean negseDM∆ Mean
∆ DFrsq Mean ∆ DFse
Mean neg
rsqDF∆ Mean
negseDF∆
Nil 239 0.00 -0.0089 -0.0097 0.0028 0.0120 0.010 0.0010 -0.015 0.032
Low 302 0.086 0.0095 0.0074 0.022 0.013 0.016 0.027 -0.019 -0.020 Med 302 0.31 0.068** 0.118** 0.018 0.0034 0.052** 0.059* -0.045** 0.043* High 302 0.57 0.056** 0.147** 0.023* -0.0066 0.063** 0.088** 0.0074 0.018
** Change in mean significant α= 0.05 * Change in mean significant α= 0.10

43
Panel C: Control Sample Cross-sectional Regression Results Panel C reports cross sectional regression results of the change in stock price adjustment delay measures regressed on institutional ownership (proxy for short sale loan supply) and control variables. The change in each delay measure is calculated as the difference in each measure over the year before and after option introduction. The table reports coefficient values for each variable with t-statistic values reported below the coefficient values. Coefficients which are significant at conventional levels (α=0.05) are reported in bold face. INST is the percentage of total shares outstanding held by institutional investors in the quarter of option introduction. SIZE is market capitalization the day prior to option introduction. VOLATILITY is the average standard deviation of stock price returns over the year prior to option introduction. ∆ INST is the change in institutional ownership one year prior to one year following option introduction. ILLIQUIDITY is the average weekly Amihud Illiquidity Ratio (Amihud, 2002) for the year preceding option introduction calculated as the absolute weekly return divided by the dollar value of weekly trading volume. ANALYST is the number of analysts which cover the stock in the year of option introduction.
Dependent Variable Intercept INST ∆INST SIZE VOLATILITY ILLIQUIDITY ANALYST adj R2
∆ DMrsq Neg 0.035 -0.004 0.029 -2.14E-08 -0.22 -3671 0.0016 0.0068 (2.62) (0.12) (0.67) (1.79) (2.77) (0.55) (0.70) ∆ DMrsq Neg 0.026 0.012 -0.23 0.0065 (2.26) (0.39) (3.00) ∆ DMse Neg 0.042 -0.0014 -0.14 -2.44E-08 -0.18 -5132 -0.0022 0.0008 (1.73) (0.02) (1.81) (1.13) (1.28) (0.43) (0.52) ∆ DMse Neg 0.012 -0.020
-0.0008
(0.63) (0.37) ∆ DMse Pos 0.11 0.013 -0.029 -1.18E-07 -0.34 7531 -0.013 0.0063 (2.55) (0.11) (0.20) (3.00) (1.30) (0.34) (1.70) ∆ DMse Pos 0.080 -0.071
-1.14E-07
0.0060
(2.01) (0.71) (2.91) ∆ DFrsq Neg -0.039 0.026 -0.022 -8.13E-08 0.19 -4125 0.0038 0.0071 (3.26) (0.82) (0.57) (0.76) (2.66) (0.70) (1.84) ∆ DFrsq Neg -0.044 0.023 0.178 0.0040 0.0085 (4.20) (0.76) (2.64) (1.93) ∆ DFse Neg 0.035 0.048 -0.059 1.31E-09 -0.44 3741 -0.0020 0.0049 (1.48) (0.78) (0.77) (0.06) (3.12) (0.32) (0.50) ∆ DFse Neg 0.032 0.028
-0.42
0.0077
(1.59) (0.51) (3.18) ∆ DFse Pos 0.12 0.075 -0.086 -1.01E-07 -0.50 -32233 -0.010 0.0088 (2.73) (0.67) (0.62) (2.65) (1.95) (1.52) (1.29) ∆ DFse Pos 0.11 0.0009
-9.97E-08 -0.60
0.0078
(2.52) (0.01) (2.61) (2.48)
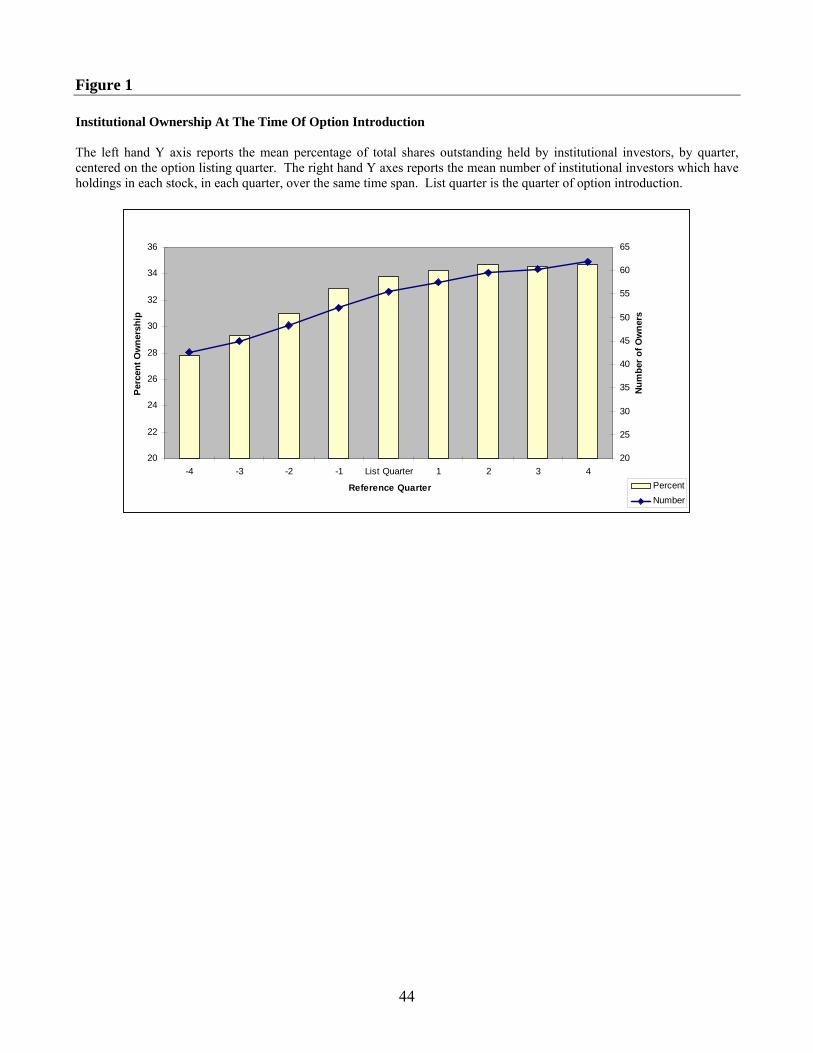
44
Figure 1 Institutional Ownership At The Time Of Option Introduction The left hand Y axis reports the mean percentage of total shares outstanding held by institutional investors, by quarter, centered on the option listing quarter. The right hand Y axes reports the mean number of institutional investors which have holdings in each stock, in each quarter, over the same time span. List quarter is the quarter of option introduction.
20
22
24
26
28
30
32
34
36
-4 -3 -2 -1 List Quarter 1 2 3 4
Reference Quarter
Perc
ent O
wne
rshi
p
20
25
30
35
40
45
50
55
60
65
Num
ber o
f Ow
ners
PercentNumber