Option 1 a. Midterm? b. 2 Sat. afternoons: Oct. 17, Nov. 7/14
67
2009. Fall 1 7-Sep-09 14-Sep-09Cancelled 2 21-Sep-09 3 28-Sep-09 4 5-Oct-09 12-Oct-09Conf. 5 Midterm 19-Oct-09 26-Oct-09Holiday 6 2-Nov-09 7 9-Nov-09 8 16-Nov-09 7 23-Nov-09 8 30-Nov-09 9 7-Dec-09 Final 14-Dec-09 21-Dec-09 28-Dec-09 4-Jan-10 Option 1 a. Midterm? b. 2 Sat. afternoons : Oct. 17, Nov. 7/14
-
Upload
keaton-coffey -
Category
Documents
-
view
17 -
download
2
description
Option 1 a. Midterm? b. 2 Sat. afternoons: Oct. 17, Nov. 7/14. Assignment 1 has been released Due date: Oct 12 th – 9pm. Submit to the course email account!. SCM centers around INVENTORY. Where to keep, how much, how to ship? How to reduce it, trade it off? - PowerPoint PPT Presentation
Transcript of Option 1 a. Midterm? b. 2 Sat. afternoons: Oct. 17, Nov. 7/14

2009. Fall1 7-Sep-09
14-Sep-09Cancelled 2 21-Sep-09
3 28-Sep-094 5-Oct-09
12-Oct-09Conf. 5 Midterm 19-Oct-09
26-Oct-09Holiday 6 2-Nov-097 9-Nov-098 16-Nov-097 23-Nov-098 30-Nov-099 7-Dec-09
Final 14-Dec-09 21-Dec-09 28-Dec-09 4-Jan-10
Option 1a. Midterm?b. 2 Sat. afternoons: Oct. 17, Nov. 7/14

• Assignment 1 has been released
• Due date: Oct 12th – 9pm.
• Submit to the course email account!

Inventory Models: Planning and
Managing Inventories in a Supply Chain
SCM centers around INVENTORY.
Where to keep, how much, how to ship?
How to reduce it, trade it off?
Inventory models provide foundation for understanding SCM concepts.
Read: 10.1 upto p281, 10.6; 12.1 -12.2.

A Macro-view of Supply Chain -- Flows A Macro-view of Supply Chain -- Flows
Consumer
Retailer
Mfg.
Mat'l Flow
VISA®
Credit Flow
Supplier
Supplier Wholesaler
Retailer
CashFlow
OrderFlowSchedules
Consumer
Retailer
Mfg.
Mat'l Flow
VISA®
Credit Flow
Supplier
Supplier Wholesaler
Retailer
CashFlow
OrderFlowSchedules
Information
After sales support
Warehouse
Web

List of Issues List of Issues
• The diversity of stock-keeping units • Functional classifications of inventories • Periodic review & continuous review models• Newsboy model

What Is Inventory?What Is Inventory?
• Stock to be sold or transformed into a more valuable state
• Stock in transit/storage - all materials in transit or in storage
Previously, inventory is flow unit!

What Is Inventory?What Is Inventory?• Stock in transit/storage - all materials in
transit or in storage
• Examples

Companies hold inventories for the following reasons:
1. Pipeline inventory
2. Seasonal inventory
3. Cycle inventory
4. Decoupling inventory/buffers
5. Safety inventory

Pipeline inventory
• An item (a flow unit) that has to spend in the process in order to be transformed from input to output
• Pipeline inventory also refers to as an item in the up-stream supply chain that is designated to coming to you
E.g., you order today, then it takes 1 wk for order preparation, then 3 wks shipping =4 wks

Zero inventory?
• If one states “we need to achieve zero inventory in our process”, how will you respond?
• By Little’s Law, Inv = flow rate * flow time

5 Reasons for inventory
1. Pipeline inventory
2. Seasonal inventory
3. Cycle inventory
4. Decoupling inventory/buffers
5. Safety inventory
1) Seasonal demandChristmas, Chinese NY, etc.
2) Seasonal supply Harvests
Economy of scale e.g., transportation,
to take adv. of quant. discounts
Central DC -> Regional DC -> Retailers HK Vendor -> US OEM (brand owner)=) To maintain independence of operations
Demand uncertainty Supply uncertainty
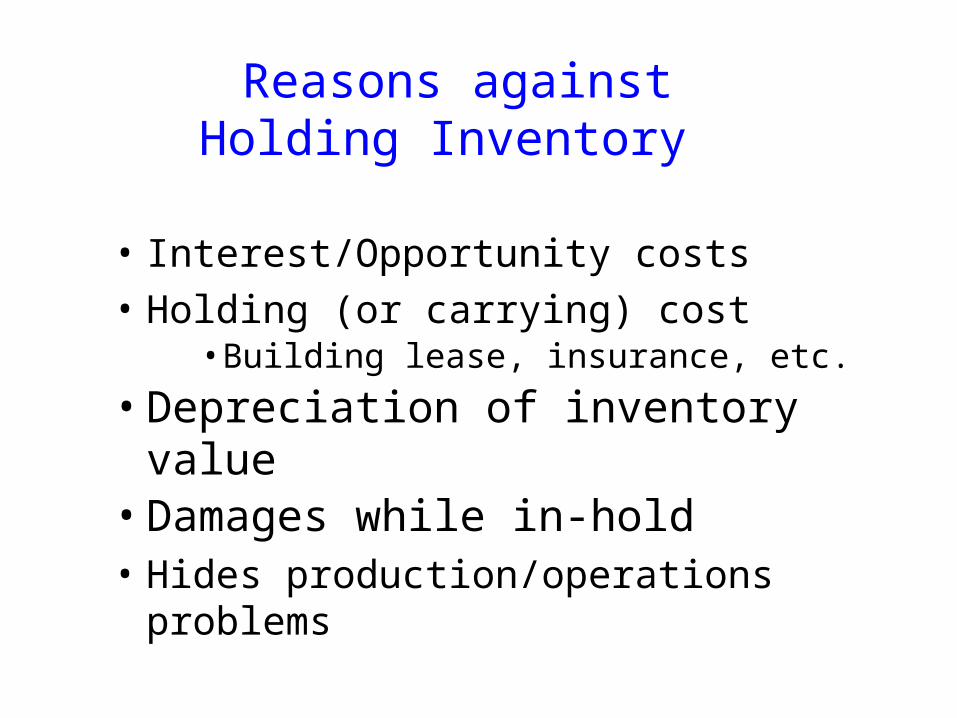
Reasons against Holding Inventory
• Interest/Opportunity costs
• Holding (or carrying) cost• Building lease, insurance, etc.
• Depreciation of inventory value• Damages while in-hold• Hides production/operations problems

Lowering Inventory Reduces Waste
Lowering Inventory Reduces Waste
ScrapScrapUnreliable Unreliable VendorsVendors
Capacity Capacity ImbalancesImbalances

Lowering Inventory Reduces Waste
Lowering Inventory Reduces Waste
ScrapScrapUnreliable Unreliable VendorsVendors
Capacity Capacity ImbalancesImbalances

Lowering Inventory Reduces Waste
Lowering Inventory Reduces Waste
ScrapScrapUnreliable Unreliable VendorsVendors
Capacity Capacity ImbalancesImbalances

Lowering Inventory Reduces Waste
Lowering Inventory Reduces Waste
ScrapScrapUnreliable Unreliable VendorsVendors
Capacity Capacity ImbalancesImbalances

Lowering Inventory Reduces Waste
Lowering Inventory Reduces Waste
ScrapScrapUnreliable Unreliable VendorsVendors
Capacity Capacity ImbalancesImbalances

Lowering Inventory Reduces Waste
Lowering Inventory Reduces Waste
ScrapScrap
Work in process inventory levelWork in process inventory level(hides problems)(hides problems)
Unreliable Unreliable VendorsVendors
Capacity Capacity ImbalancesImbalances

Lowering Inventory Reduces Waste
Lowering Inventory Reduces Waste
ScrapScrap
Work in process inventory levelWork in process inventory level(hides problems)(hides problems)
Unreliable Unreliable VendorsVendors
Capacity Capacity ImbalancesImbalances

Lowering Inventory Reduces Waste
Lowering Inventory Reduces Waste
ScrapScrap
Work in process inventory levelWork in process inventory level(hides problems)(hides problems)
Unreliable Unreliable VendorsVendors
Capacity Capacity ImbalancesImbalances

Lowering Inventory Reduces Waste
Lowering Inventory Reduces Waste
ScrapScrap
Reducing inventory revealsReducing inventory revealsproblems so they can be solved.problems so they can be solved.
Unreliable Unreliable VendorsVendors
Capacity Capacity ImbalancesImbalances
WIPWIP

Lowering Inventory Reduces Waste
Lowering Inventory Reduces Waste
ScrapScrap
Reducing inventory revealsReducing inventory revealsproblems so they can be solved.problems so they can be solved.
Unreliable Unreliable VendorsVendors
Capacity Capacity ImbalancesImbalances
WIPWIP

Lowering Inventory Reduces Waste
Lowering Inventory Reduces Waste
ScrapScrap
Reducing inventory revealsReducing inventory revealsproblems so they can be solved.problems so they can be solved.
Unreliable Unreliable VendorsVendors
Capacity Capacity ImbalancesImbalances
WIPWIP

Lowering Inventory Reduces Waste
Lowering Inventory Reduces Waste
ScrapScrap
Reducing inventory revealsReducing inventory revealsproblems so they can be solved.problems so they can be solved.
Unreliable Unreliable VendorsVendors
Capacity Capacity ImbalancesImbalances
WIPWIP
Therefore, quality is pre-requisite for low inventory. The core of JIT is of low inventory. Then, Total quality mgmt & JIT are interdependent.
“Japanese Style of Mgmt”

Japanese MgmtJapanese Mgmt
Four CEOs, one English, one French, one Japanese and one American, were on their way to an international buz conference when they were kidnaped by terrorists and taken to a secret hideout.
"You, your companies and your countries are enemies of the Revolution," screamed the terrorist leader,
"and you're going to be executed! Do you have any last requests?"
The Englishman spoke first.
"Before I die, I want to honor my contry and ……” // "That can be arranged," said the terrorist.
The Frenchman said,
"And I want to honor MY country before I die by singing " La Marseilles" to your men."
http://www.youtube.com/watch?v=-NzXGqEgq8Q&feature=related

Japanese MgmtJapanese Mgmt
The Japanese said, "Before I die, I wish to honor MY country by giving the lecture I was going to present on the Japanese style of management."
The terrorist turned finally to the American.
"What is YOUR last request?"
The American replied, "I want you to kill me right now so I don't have to listen to another lecture on the Japanese style of management!"
JIT

SKUSKU
• Managerial decisions regarding inventories ultimately made at the level of an individual item or product– SKU - specific unit of stock - item of stock that is
completely defined as to function, style, size, & colour.

The Diversity of Stock-Keeping UnitsThe Diversity of Stock-Keeping Units
• Facts – Large retailers carry about 100,00 SKUs
– A typical medium-sized MNC mfg concern keeps in inventory about 10,000 types of raw materials, parts, and finished goods
– Some large mfg companies & defence org. stock more than 500,000 distinct items
– May be perishable -- deterioration, obsolescence
– Goods also arrive by diff. transport. modes & in quant.
SKU: an item of stock that is completely specified as to function, style, size, colour.

Do forecasting manually? Manage them by managers?
ABC Classification

The ABC Classification The ABC Classification
• Close examination of multi-SKU inventory systems reveals a statistical regularity in the usage rate of diff items ($)– A class, B class, C class: 80/20 rule
• Policies based on ABC analysis– Develop class A suppliers more ...– Give tighter physical control of A items– Forecast A items more carefully
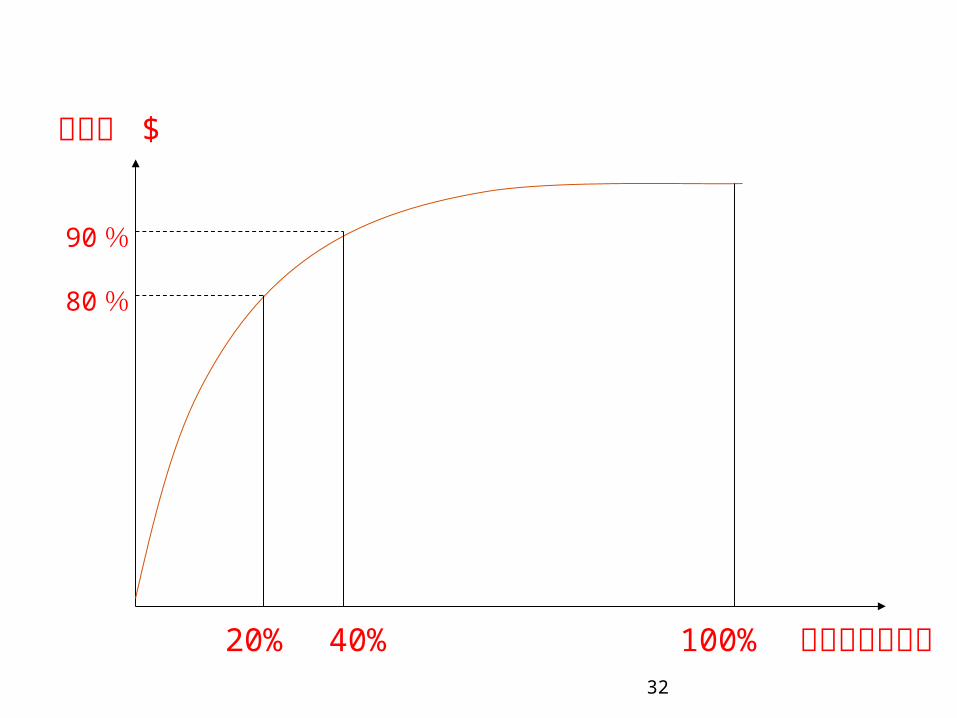
32
累积存货单元数
总销量 $
20%
80 %
40%
90 %
100%

ABC Classification Solution*ABC Classification Solution*
Stock # Vol. Cost $ Vol. % ABC
Z-206 13,000 $ 22 $286,000 79.1 A
Z-019
W-105
1,700
75
25
200
42,500
15,000
11.8
4.1
B
B
P-144 12,000 1 12,000 3.3 C
K-207 3,000 2 6,000 1.7 C
Total $361,500 100.0
Stock # Vol. Cost $ Vol. % ABC
Z-206 13,000 $ 22 $286,000 79.1 A
Z-019
W-105
1,700
75
25
200
42,500
15,000
11.8
4.1
B
B
P-144 12,000 1 12,000 3.3 C
K-207 3,000 2 6,000 1.7 C
Total $361,500 100.0
Note: Example is for illustration only; too few items.Note: Example is for illustration only; too few items.

More about 80/20 Principle More about 80/20 Principle• The 80/20 principle asserts that a minority of causes, inputs
or effort usually lead to a majority of the results, outputs or rewards.
• In business: 20% products - 80% revenue *• In society, 20% criminals - 80% value; 20% motorists -
80% accidents *• In home, 20% clothes - worn 80% time • In bars, 20% drinkers – 80% sales• IBM found 80% computer time spent executing about 20%
of routines/codes• Winner takes all: 5% families - 75% equity

More about 80/20 Principle More about 80/20 Principle
InputOutput
Causes Consequences
Effort Results
65/35, 75/25, 80/20, 90/10, 95/5, 85/10

More about 80/20 Principle More about 80/20 Principle
• “50/50 fallacy” - effort and results are not generally equally balanced
• Resources that have weak effects in any particular use are not used, or are used sparingly– If course grades depend entirely on Finals ?– 80% of work done by 20% workers– 80% total beer was drunk by 28% drinkers

37
•A typical refrigerator has its “freezer compartment” on the top and “cool store” in the lower part. So you would bend over to pick up fruits and so on.
But people 80% of time use “cold store”,, whearea only 20% of their time “freezer compartment”. The standard structure make a lot of housewives back-pains!
• One dept director could only work for 3-4 hours due to hart problems recently 。 To his surprise, he found
No thing much he missed for his work quality-wise, as compared with his work of 0-12 hours per day before.
。

• (1) 80% 的外出吃飯都前往 20% 的餐館;• (2) 80% 的生產量是源自 20% 的生產量;• (3) 80% 的病假是由 20% 的員工所佔用;• (4) 80% 的檔案使用量集中於 20% 的檔案;• (5) 80% 的討論都是出自 20% 的討論者• (6) 80% 的垃圾是源自 20% 的地方;• (7) 80% 的檔案使用量集中於 20% 的檔案;• (8) 80% 的看電視時間都花在 20% 的節目;• (9) 80% 的閱讀的書籍都是取自書架上 20% 的書籍;• (10) 80% 的看報時間都花在 20% 的版面;• (11) 80% 的電話都是來自 20% 的發話人;• (12) 80% 的教師輔導時間都被 20% 的學生所佔用;• (13) 80% 的菜是重複 20% 的菜色;• (14) 80% 上課時間只學到 20 %的…。
Time management class Time management classOne day a time mgmt expert was speaking to a group of business students. As this man stood in front of the group of high-powered overachievers he said, "Okay, time for a quiz." Then he pulled out a one-gallon, wide-mouthed mason jar and set it on a table in front of him. Then he produced about a dozen fist-sized rocks and carefully placed them, one at a time, into the jar. When the jar was filled to the top and no more rocks would fit inside, he asked, "Is this jar full?" Everyone in the class said, "Yes."

Then he said, "Really?" He reached under the table and pulled out a bucket of gravel. Then he dumped some gravel in and shook the jar causing pieces of gravel to work themselves down into the spaces between the big rocks. Then he asked the group once more, "Is the jar full?" By this time the class was onto him. "Probably not," one of them answered. "Good!" he replied.

He reached under the table and brought out a bucket of sand. He started dumping the sand in and it went into all the spaces left between the rocks and the gravel. Once more he asked the question, "Is this jar full?" "No!" the class shouted. Once again he said, "Good!" Then he grabbed a pitcher of water and began to pour it in until the jar was filled to the brim. Then he looked up at the class and asked, "What is the point of this illustration?"

One eager beaver raised his hand and said, "The point is, no matter how full your schedule is, if you try really hard, you can always fit some more things into it! – drink beers, …”
"No," the speaker replied, "that's not the point. The truth this illustration teaches us is: If you don't put the big rocks in first, you'll never get them in at all."
What’s the moral of this story?
Put the rocks in first.

43
The Long Tail
• Originated from Statistics: dinosaur’s long tail – <Wired>magazine editor, Chris Anderson,
2004 coined it: so long as storage and channel are big enough, the sales of low demand items all together can match those of the hit products
• 80-20 : minority vs. majority
• Long tail look at the 80% of trivial items

Amazon.com found among millions of books that it sold online, hundreds count for a half of its revenue, the other half from the rest of millions.

Other Inventory ClassificationsOther Inventory Classifications
Inventory

Other Inventory ClassificationsOther Inventory Classifications
Inventory
ProcessStage

Inventory ClassificationsInventory Classifications
Inventory
ProcessStage
Raw Mat'lWIP
Fin. Goods

Inventory ClassificationsInventory Classifications
Inventory
ProcessStage
Number& Value
Raw Mat'lWIP
Fin. Goods
A ItemsB ItemsC Items
AA
BBCC

Inventory ClassificationsInventory Classifications
Inventory
ProcessStage
DemandType
Number& Value
Raw Mat'lWIP
Fin. Goods
IndependentDependent
A ItemsB ItemsC Items
Independent
Dependent

Independent vs. Dependent Demand
E(1)
Independent Demand(Demand not related to other items)
Dependent Demand(Derived)

Inventory
ProcessStage
DemandType
Number& Value
Other
Raw Mat'lWIP
Fin. Goods
IndependentDependent
A ItemsB ItemsC Items
Mainten.Repair
Operating
Inventory
ProcessStage
DemandType
Number& Value
Other
Raw Mat'lWIP
Fin. Goods
IndependentDependent
A ItemsB ItemsC Items
Mainten.Repair
Operating
Inventory ClassificationsInventory Classifications

Inventories are typically measured in
three ways Average aggregate inventory value: used to accumulate used to accumulate total value of all items held in inventory on the average, total value of all items held in inventory on the average, over some time period.over some time period.
Weeks (months) of supply: computed by dividing computed by dividing average aggregate inventory held, by sales per week average aggregate inventory held, by sales per week (month) at cost.(month) at cost.
Inventory turns: computed by dividing annual sales at computed by dividing annual sales at cost, by average aggregate inventory value maintained cost, by average aggregate inventory value maintained during the year.during the year.
The last two are essentially equivalent: The last two are essentially equivalent:
Annual Inventory turns = 1 / years of supply

Flow time /cycle time:T
is the time it takes a “unit of flow” (a job) to traverse the system
Flow/Throughput rate: R
Average number of jobs that pass thru the system per unit of time
Inventory: I
The number of jobs within the system boundaries at a particular point in time
Little’s Law
I = R * T
Little’s law
Inventory (I) = Flow Rate (R) * Flow Time (T)

Examples
Berger King
• R: Throughput: 5000kg/week
• I: Inventory: 2500kg
T = I/R = 0.5 week
Berger King
• R: Throughput: 1500 customers/day (15 hrs)
• I: Inventory: 25 customers
T = I/R = 1/60 days = 15 min
Travel Insurance • Processes 10,000 claims per yr
• Average process time = 3 wks • How many in processing/wait?
(50 wks per yr)
I = 10000*3/50 = 600 jobs
Cash flow
• Nokia sells 300M$ worth phones per yr
• Average receivables = 45M$
T = 45/300 =0.15 yr = 1.8 mos

More examples
• Inventory turns: compute right from financial data
Cost of Goods sold: 25,263 mill $/yearInventory: 2,003 mill $
Cost of Goods sold: 20,000 mill $/yearInventory: 391 mill $
T = 391*365/20000 = 5.4 days
Inv. Turns: 65.5 times/yr
T=2003*395/25263
= 29 days
Inv. Turns: 12.6 times/yr

Hutchison-Whampoa’s Retailing: Cost of goods sold: US$mil 9484, Inventory: 2692, Turns= 3.52. (2007)
Park n Shop, AS Watson, 3, …

Trading: Code 494.hk (in HK$ mil)
2007/2006: Cost of inventories: 82,692/60,674
Inventory: 2,059/1,331
Inventory turns: 40/45
Li & Fung Limited (trading)
IDS

Trading: Code 8052.hk (in HK$ mil)
2007/2006: Cost of inventories: 2,059/1,678
Inventory: 110/82
Inventory turns: 18/20
Circle K, …
Li & Fung Retail

120 Days = 3 turns

Dairy Farm Int’l: 7.5 times/yr (2007)

Importance of Inventory Mgt
• Inventory x Turns = Cost of goods sold (COGS, “turnover” at cost)
• Inventory = (1 /Turns) x COGS• Earnings = Margin x COGS
An example:– Margin = 12%– Turns = 10, or (1/Turns) = 10%– Holding cost rate = 30%– Net margin rate = 9% ( =12 - 30/10 )

Two PC Makers
• PC Industry (U.S.): – Margin rate = 8%
– Inventory costs = 50%
• Dell: Turns = 50, Net margin = 7% (= 8 - 50/50) • Compaq: Turns = 10, Net margin = 3% (= 8 - 50/10) • Dell has more cash

Dell vs. Compaq
• 2Q/2000, Dell & Compaq: the same revenue. Thus, Dell earnings is at least Compaq’s 2.33 times (7/3)
• Suppose that the two companies’ P/E ratios the same. Then Dell’s market capitalization was about Compaq’s 2.33 – In fact, at the time, Dell = US$76B, Cpq = US$19B


Out of stock for Christmas Believe it or not, there is actually a product out of stock this Holiday season - Amazon’s Kindle. Oprah announced that she loves her Kindle and sales have exceeded Amazon’s expectations. The forecast is that they will not be in stock until February. The key question is how many unit sales will they lose because they are not available in the peak month of the year? Probably more than they want. Even if those sales are deferred to the next holiday season, it is a costly situation for the company. Of course, there is no way to know if they are just the victim of bad luck (or too much good luck) or bad planning, but it does illustrate that challenges of meeting highly uncertain demand.
Wall Street Journal Dec 4, 2008 - Better Scratch That Kindle Off Your List

Just read this from macintouch.com
"I know from friends in Hong Kong that there may be an iPod shortage - they tried searching for iPods at more than 4 local computer shops but they were all out of stock. -Derek Tsang"
Interesting....

Newspaper ClipsNewspaper Clips• WSJ (10/1994) about IBM:
– Oversupply of the PS/1 model in the 4 th Q of 1993 strained relations with some retail chains, which were stuck with unsold m/c
– Thru 1993-94, it struggled with high shortages in ThinkPad line, meanwhile burned by overly agg. forecasts for the ValuePoint line ( with $700 mil unsold PCs) and forced to resort to steep discounts
– Just 3 wks after announcing its new Aptiva home PC line, IBM was sold out thru year end and can’t fill all of its holiday orders (due to conservative forec.)

Newspaper Clips (cont’d)Newspaper Clips (cont’d)• Apple fared no better (Business Wk, 1996):
– when mkt boomed, Apple could not keep up. 3/4 of product shortages peaked last September with a $1 b backlog.
– Component supply was eased but Apple had the wrong mix at retail: too many low end models and too few of the powhouses were snapping up … Apple was left with $80 mil inventory write-off, while IBM, Compaq & HP had cleaned up