Optimum Sampling Density for the Prediction of AMD in an Underground Sulphide Mine" by K. Modis,...
27
Optimum Sampling Density for the Prediction of AMD in an Underground Sulphide Mine" by by K. Modis, National Technical University of Athens K. Modis, National Technical University of Athens and and K. Komnitsas, Technical University of Crete K. Komnitsas, Technical University of Crete
-
Upload
alison-patrick -
Category
Documents
-
view
214 -
download
0
Transcript of Optimum Sampling Density for the Prediction of AMD in an Underground Sulphide Mine" by K. Modis,...

Optimum Sampling Density for the Prediction of AMD in an
Underground Sulphide Mine"byby
K. Modis, National Technical University of Athens K. Modis, National Technical University of Athens
andand
K. Komnitsas, Technical University of CreteK. Komnitsas, Technical University of Crete
K. Modis- K. Komnitsas "Optimum Sampling Density for the Prediction of AMD in an Underground Sulphide Mine"
2
Summary
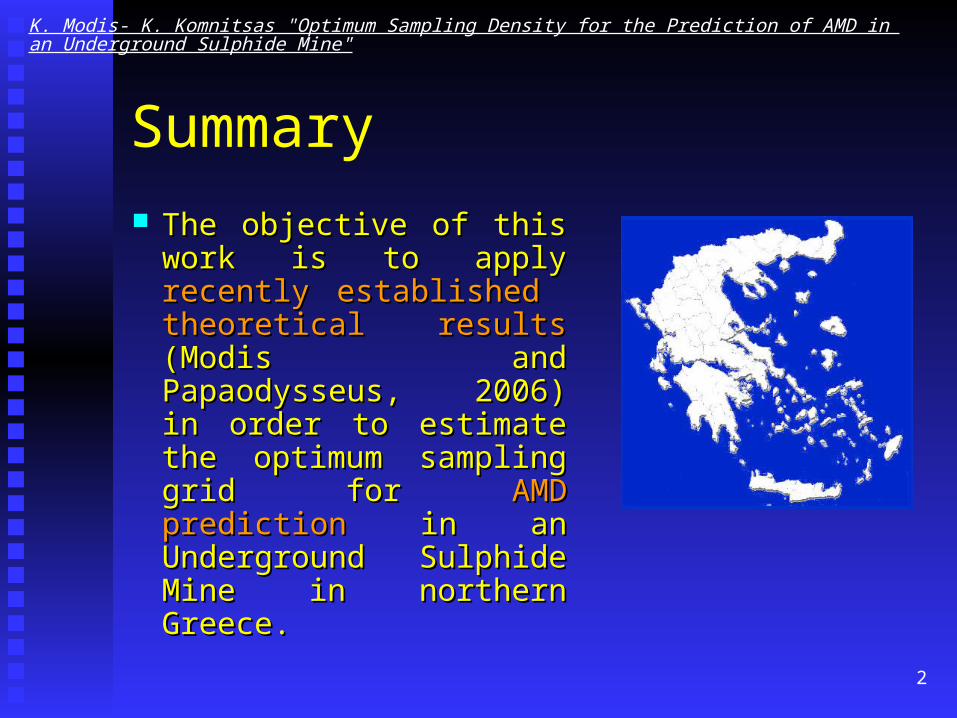
The objective of this work The objective of this work is to apply is to apply recently recently established theoretical established theoretical resultsresults (Modis and (Modis and Papaodysseus, 2006) in Papaodysseus, 2006) in order to estimate the order to estimate the optimum sampling grid optimum sampling grid for for AMD predictionAMD prediction in an in an Underground Sulphide Underground Sulphide Mine in northern Greece.Mine in northern Greece.

K. Modis- K. Komnitsas "Optimum Sampling Density for the Prediction of AMD in an Underground Sulphide Mine"
3
Introduction The theoretical results are The theoretical results are
based on the based on the sampling sampling theorem of informationtheorem of information which states that a which states that a band band limitedlimited random waveform random waveform can be reconstructed by its can be reconstructed by its samples if the sampling rate samples if the sampling rate is greater than a critical is greater than a critical value depending on the value depending on the waveform characteristics waveform characteristics
K. Modis- K. Komnitsas "Optimum Sampling Density for the Prediction of AMD in an Underground Sulphide Mine"
4
Introduction
In In simple wordssimple words, the methodology followed is an , the methodology followed is an extension of information theory applied to the extension of information theory applied to the mineral exploration practice.mineral exploration practice.
But, is it reasonable that there is a But, is it reasonable that there is a limit in limit in sampling densitysampling density, and more samples will add little , and more samples will add little to the quality of the approximation?to the quality of the approximation?

K. Modis- K. Komnitsas "Optimum Sampling Density for the Prediction of AMD in an Underground Sulphide Mine"
5
Introduction
The answer in fact is The answer in fact is YESYES!, under the condition !, under the condition that the that the frequency contentfrequency content of the study variable is of the study variable is limited. Band limitedness ensures limited. Band limitedness ensures slow variationslow variation. . And it is easier to sample a slow varying And it is easier to sample a slow varying phenomenon than a rapidly one.phenomenon than a rapidly one.
There are two important facts about our approach …There are two important facts about our approach …

K. Modis- K. Komnitsas "Optimum Sampling Density for the Prediction of AMD in an Underground Sulphide Mine"
6
Introduction
Fact 1Fact 1: : It is the first It is the first method to estimate a method to estimate a theoretical limittheoretical limit to the to the sampling density, above sampling density, above which there is no which there is no significant improvement significant improvement to the accuracy of to the accuracy of estimation.estimation.

K. Modis- K. Komnitsas "Optimum Sampling Density for the Prediction of AMD in an Underground Sulphide Mine"
7
Introduction Fact 2Fact 2:: In the case of an In the case of an
existing sampling grid, existing sampling grid, if the drill hole density if the drill hole density is close to the ideal one,is close to the ideal one, it is proved that the it is proved that the results of all results of all interpolation algorithms interpolation algorithms convergeconverge to reality. to reality.

K. Modis- K. Komnitsas "Optimum Sampling Density for the Prediction of AMD in an Underground Sulphide Mine"
8
About the theory
According to the aforementioned sampling According to the aforementioned sampling theorem, only theorem, only bandlimitedbandlimited waveforms can be waveforms can be reconstructed by their samples.reconstructed by their samples.
Modis and Papaodysseus (2006) have pointed out Modis and Papaodysseus (2006) have pointed out that earth phenomena represented by a variogram that earth phenomena represented by a variogram model model with a sillwith a sill (e.g. Spherical scheme) are (e.g. Spherical scheme) are approximatelyapproximately bandlimited. bandlimited.

K. Modis- K. Komnitsas "Optimum Sampling Density for the Prediction of AMD in an Underground Sulphide Mine"
9
About the theory
For example, the For example, the fourier transform of a fourier transform of a linear variogram/ linear variogram/ covariance model with covariance model with a sill,a sill,
(b)
1
h
γ(h)
a-a 0
1
h
R(h)
a-a
(a)
0
ωS
(ω)
0 2π/a
a
is approximately is approximately bandlimitedbandlimited

K. Modis- K. Komnitsas "Optimum Sampling Density for the Prediction of AMD in an Underground Sulphide Mine"
10
About the theory
Or, the fourier Or, the fourier transform of the transform of the spherical variogram/ spherical variogram/ covariance model with covariance model with a sill,a sill,
is also approximately is also approximately bandlimitedbandlimited
-1.5 -0.5 0.5 1.5

K. Modis- K. Komnitsas "Optimum Sampling Density for the Prediction of AMD in an Underground Sulphide Mine"
11
About the theory
In that case, it is also shown that the critical In that case, it is also shown that the critical sampling interval equals sampling interval equals half the range of half the range of influenceinfluence of the underlying variogram model. of the underlying variogram model.
According to the above, the estimation of the According to the above, the estimation of the critical sampling rate of a spatial phenomenon is critical sampling rate of a spatial phenomenon is done in two steps:done in two steps:
K. Modis- K. Komnitsas "Optimum Sampling Density for the Prediction of AMD in an Underground Sulphide Mine"
12
About the theory Step Step 1.1. At the At the
structural analysis structural analysis stage, the stage, the variogram/ variogram/ covariance modelcovariance model is is estimated. If it is a estimated. If it is a model without a sill, model without a sill, the process stops here.the process stops here.

K. Modis- K. Komnitsas "Optimum Sampling Density for the Prediction of AMD in an Underground Sulphide Mine"
13
About the theory
Step Step 2.2. At the At the estimation stage, the estimation stage, the critical sampling interval is critical sampling interval is estimated by estimated by halving the halving the range of influencerange of influence of the of the underlying variogram underlying variogram model.model.

K. Modis- K. Komnitsas "Optimum Sampling Density for the Prediction of AMD in an Underground Sulphide Mine"
14
The Stratoni sulphide deposit
The Stratoni mining The Stratoni mining area, situated in the area, situated in the north-eastern part of north-eastern part of Macedonia, Greece, is Macedonia, Greece, is the largest mixed the largest mixed sulphide mining sulphide mining operation in Greeceoperation in Greece andand will be examined will be examined as a case studyas a case study..

K. Modis- K. Komnitsas "Optimum Sampling Density for the Prediction of AMD in an Underground Sulphide Mine"
15
The Stratoni sulphide deposit
The ore is mined with The ore is mined with cut-and –fill but in the cut-and –fill but in the past, past, sub-level cavingsub-level caving was employed, and was employed, and resulted in extensive resulted in extensive cracks in the overlying cracks in the overlying strata inducive to water strata inducive to water infiltration and infiltration and acid acid generationgeneration..
300
200
100
0
Amphibolite
Marble
Aplite
Amphibolitic gneiss
Biotitic gneiss
Pyrite
0 50 100m

K. Modis- K. Komnitsas "Optimum Sampling Density for the Prediction of AMD in an Underground Sulphide Mine"
16
The Stratoni sulphide deposit
What is aimed is to predict the AMD What is aimed is to predict the AMD potential in various parts of the mine, for potential in various parts of the mine, for use especially after use especially after mine closure.mine closure.
For this purpose, we need to develop a For this purpose, we need to develop a spatial spatial NNPNNP model based on available model based on available drill hole samples.drill hole samples.
K. Modis- K. Komnitsas "Optimum Sampling Density for the Prediction of AMD in an Underground Sulphide Mine"
17
Sampling
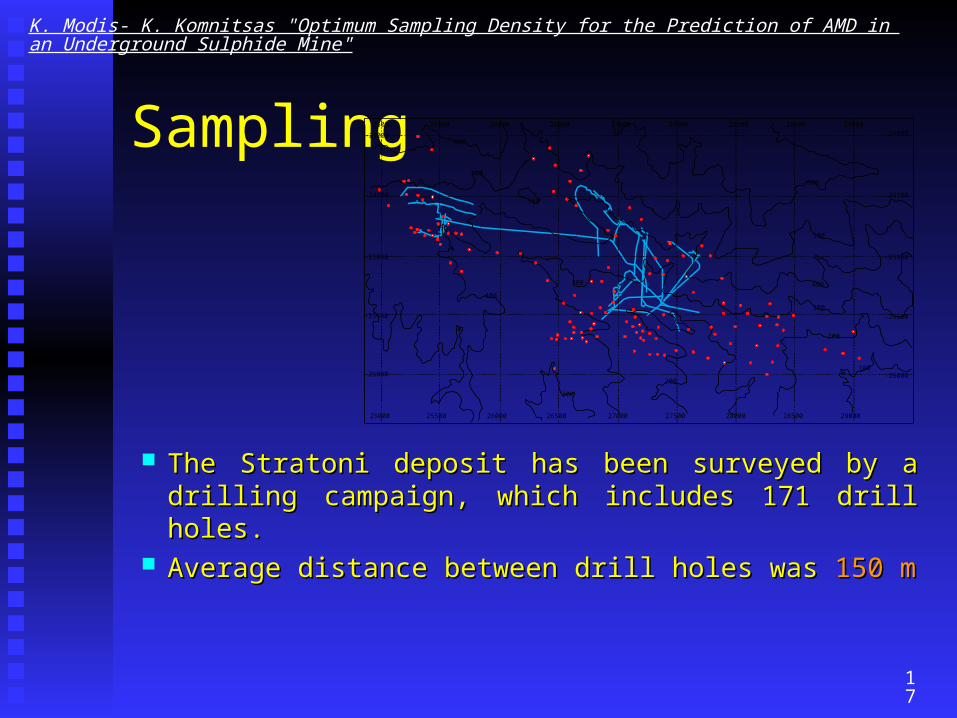
The Stratoni deposit has been surveyed by a The Stratoni deposit has been surveyed by a drilling campaign, which includes 171 drill holesdrilling campaign, which includes 171 drill holes..
Average distance between drill holes was Average distance between drill holes was 150 m150 m
25000
-24000
25500 26000 26500 27000 27500 28000 28500 29000
-24500
-25000
-25500
-26000
-24000
-24500
-25000
-25500
-26000
25000 25500 26000 26500 27000 27500 28000 28500 29000
600
500
500
400
300
300
200
100
200
300
400
500
600

K. Modis- K. Komnitsas "Optimum Sampling Density for the Prediction of AMD in an Underground Sulphide Mine"
18
Sampling
Drill hole loggings included Drill hole loggings included chemical analyses of the chemical analyses of the mineralization. NNP values mineralization. NNP values of these samples were of these samples were calculated based on their calculated based on their sulfur content from a curve sulfur content from a curve fitted to fitted to experimental dataexperimental data.. S(%)
NN
P
-1400
-1200
-1000
-800
-600
-400
-200
0
0 20 40 60
NNP
Model

K. Modis- K. Komnitsas "Optimum Sampling Density for the Prediction of AMD in an Underground Sulphide Mine"
19
Sampling
The NNP values for non- The NNP values for non- mineralized samples were mineralized samples were calculated by assigning them calculated by assigning them to a set of predefined to a set of predefined rock rock classesclasses which were which were chemically processed to chemically processed to determine their NNP.determine their NNP.
2336 - 11,6
2039 - 29,7
2576 - 20,7
1776 - 34,4
1998 - 26,8
1530 - 45,5
717 - 70,4
2290 - 15,7
2250 - 13,2
2395 - 19,9
2478 - 12,8
1885 - 35,8
2182 - 17,8
2463 - 16,8
2411 - 22,1
2417 - 17,6
2502 - 11,3
2238 - 28,3
1477 - 51,2
0,00
23,20
24,20
37,3037,60
38,50
39,70
40,30
40,90
41,50
42,8043,00
89,30
89,80
90,80
92,30
94,00
94,50
94,90
95,5095,70
98,40
98,80
100,10

K. Modis- K. Komnitsas "Optimum Sampling Density for the Prediction of AMD in an Underground Sulphide Mine"
20
Application of the theory
As previously stated, the estimation of the As previously stated, the estimation of the critical sampling rate of a spatial critical sampling rate of a spatial phenomenon is done in phenomenon is done in two stepstwo steps::

K. Modis- K. Komnitsas "Optimum Sampling Density for the Prediction of AMD in an Underground Sulphide Mine"
21
Step 1. Structural analysis
Using the data derived Using the data derived from the drilling from the drilling campaign concerning campaign concerning overall assigned overall assigned NNP NNP of each sample, the of each sample, the variogramvariogram function of function of this variable was this variable was calculated. calculated.
Distance between samples (m)
0
40000
80000
120000
0 100 200 300
XDir
XYDir
YDir
YXDir
DTHDir
Model
(Kg
CaC
O3
equi
v/ t
sam
ple)
2
64
28
2115
1895
68
22072
1660
14675
220 Numberof samples
Distance between samples (m)
0
40000
80000
120000
0 100 200 300
XDir
XYDir
YDir
YXDir
DTHDir
Model
(Kg
CaC
O3
equi
v/ t
sam
ple)
2(K
gC
aCO
3eq
uiv/
t sa
mpl
e)2
64
28
2115
1895
68
22072
1660
14675
220 Numberof samples
K. Modis- K. Komnitsas "Optimum Sampling Density for the Prediction of AMD in an Underground Sulphide Mine"
22
Step 2. Sampling rate estimation
It is clear from the previous figure that there is It is clear from the previous figure that there is a range of influence up to 90 m in NNP a range of influence up to 90 m in NNP variogram model (Spherical).variogram model (Spherical).
Using the above mentioned Using the above mentioned Modis and Modis and Papaodysseus (2006) formulaPapaodysseus (2006) formula to estimate the to estimate the optimal sampling grid we get a value of optimal sampling grid we get a value of 45 m.45 m.

K. Modis- K. Komnitsas "Optimum Sampling Density for the Prediction of AMD in an Underground Sulphide Mine"
23
Results
From the above analysis it is seen that some From the above analysis it is seen that some (small) parts of the wider mining area are (small) parts of the wider mining area are over-over-sampledsampled since drillhole distances can be as short since drillhole distances can be as short as 20 m which is shorter than the recommended as 20 m which is shorter than the recommended distance of 45 m. The rest of the area is distance of 45 m. The rest of the area is under-under-sampledsampled since no drill holes are as close as the since no drill holes are as close as the optimum distance. optimum distance.
Thus, the drill holes are distributed unevenly Thus, the drill holes are distributed unevenly indicating over-sampling in some parts and indicating over-sampling in some parts and under-sampling in others.under-sampling in others.

K. Modis- K. Komnitsas "Optimum Sampling Density for the Prediction of AMD in an Underground Sulphide Mine"
24
Conclusions
The variogram model generated by structural The variogram model generated by structural analysis of NNP spatial distribution in the mining analysis of NNP spatial distribution in the mining area under study area under study enables the establishment of a enables the establishment of a critical sampling gridcritical sampling grid; ;
in some parts of the ore body the sampling grid is in some parts of the ore body the sampling grid is denser than required.denser than required.

K. Modis- K. Komnitsas "Optimum Sampling Density for the Prediction of AMD in an Underground Sulphide Mine"
25
Conclusions
If the density of the sampling grid is close to the If the density of the sampling grid is close to the critical value, the calculation of the NNP critical value, the calculation of the NNP numerical model can be implemented by using numerical model can be implemented by using simpler interpolation algorithmssimpler interpolation algorithms, such as inverse , such as inverse distance square having equal accuracy to distance square having equal accuracy to geostatistics.geostatistics.
K. Modis- K. Komnitsas "Optimum Sampling Density for the Prediction of AMD in an Underground Sulphide Mine"
26
Conclusions
In general, the design of the drilling campaign can In general, the design of the drilling campaign can be considered as an optimization problem. be considered as an optimization problem. The The selection of the appropriate grid size can selection of the appropriate grid size can maximize the informationmaximize the information regarding the regarding the distribution of NNP values; distribution of NNP values;
it can also contribute to considerable savings in it can also contribute to considerable savings in money and time.money and time.

K. Modis- K. Komnitsas "Optimum Sampling Density for the Prediction of AMD in an Underground Sulphide Mine"
27
Thank You!Thank You!