Optimum Fleet Utilization under Congestion Management at ... · PDF fileOptimum Fleet...
46
CENTER FOR AIR TRANSPORTATION SYSTEMS RESEARCH CENTER FOR AIR TRANSPORTATION SYSTEMS RESEARCH CENTER FOR AIR TRANSPORTATION SYSTEMS RESEARCH CENTER FOR AIR TRANSPORTATION SYSTEMS RESEARCH Optimum Fleet Utilization under Congestion Management at NY LGA George L. Donohue, Ph.D. Professor Systems Engineering and Operations Research Director of the Center for Air Transportation Systems Research Volgenau School of Information Technology and Engineering NEXTOR Wye River Conference June 7, 2007 © George L. Donohue 2007
Transcript of Optimum Fleet Utilization under Congestion Management at ... · PDF fileOptimum Fleet...

CENTER FOR AIR TRANSPORTATION SYSTEMS RESEARCHCENTER FOR AIR TRANSPORTATION SYSTEMS RESEARCHCENTER FOR AIR TRANSPORTATION SYSTEMS RESEARCHCENTER FOR AIR TRANSPORTATION SYSTEMS RESEARCH
Optimum Fleet Utilization under Congestion Management at NY LGA
George L. Donohue, Ph.D.Professor Systems Engineering and Operations Research
Director of the Center for Air Transportation Systems ResearchVolgenau School of Information Technology and Engineering
NEXTOR Wye River Conference June 7, 2007
© George L. Donohue 2007

2
CATSRCATSRCATSRCATSRCreditsResearch team at GMU contributing to
these insights:• Dr. Loan Le, Ph.D. (2006)• Dr. Karla Hoffman, Prof. SEOR, CATSR• Danyi Wang, Ph.D. Candidate• Ning Xie, Ph.D. Candidate• Dr. C.H. Chen, Prof. SEOR, CATSR
RAND Corp.:• Dr. Russell Shaver, Senior Research Fellow

3
CATSRCATSRCATSRCATSROutline
• Motivation for the Study• NY LaGuardia Data• Approach• Results from Schedule Optimization and
Delay Simulation Study

4
CATSRCATSRCATSRCATSR
Annual Passenger Enplanements Predicted to be Lost: FAA Forecast to 2025
Annual Projected Enplanements Foregone Because of Airport Capacity Constraints
0
5
10
15
20
25
30
ATL
BO
S
BW
I
CLE CLT
CVG DC
A
DEN
DFW
DTW
EWR
FLL
HN
L
IAD
IAH
JFK
LAS
LAX
LGA
MC
O
MD
W
MEM M
IA
MSP
OR
D
PDX
PHL
PHX
PIT
SAN
SEA
SFO
SLC
STL
TPA
Airports
Ann
ual E
npla
nem
ents
Los
t (M
illio
ns)
202520152005
Optimistic: All Planned Airport Improvements
Occur
All available landing slots fully utilized regardless of congestion
EWR
ORDJFK
FAA 2006 TAF & 2004 Benchmark
LGA

5
CATSRCATSRCATSRCATSR
Estimated Annual Cost to US (Lost Consumer Surplus, 2005$) due to Expected Airport Capacity Limitations
$0
$2
$4
$6
$8
$10
$12
$14
$16
100% 95% 90% 85% 80%Usable NAS Capacity (%)
Ann
ual C
ost t
o U
S Ec
onom
y fr
om
Fore
gone
Enp
lane
men
ts ($
B)
CY2015, All A/PImprovements
CY2015, No A/PImprovements
CY2025, All A/PImprovements
CY2025, No A/PImprovements
FAA Assumptions on Growth in Airport Operations and Passenger E l t
Shaver 2007
Assumes:$200/segment ticketPrice Elasticity = -1
6
CATSRCATSRCATSRCATSR
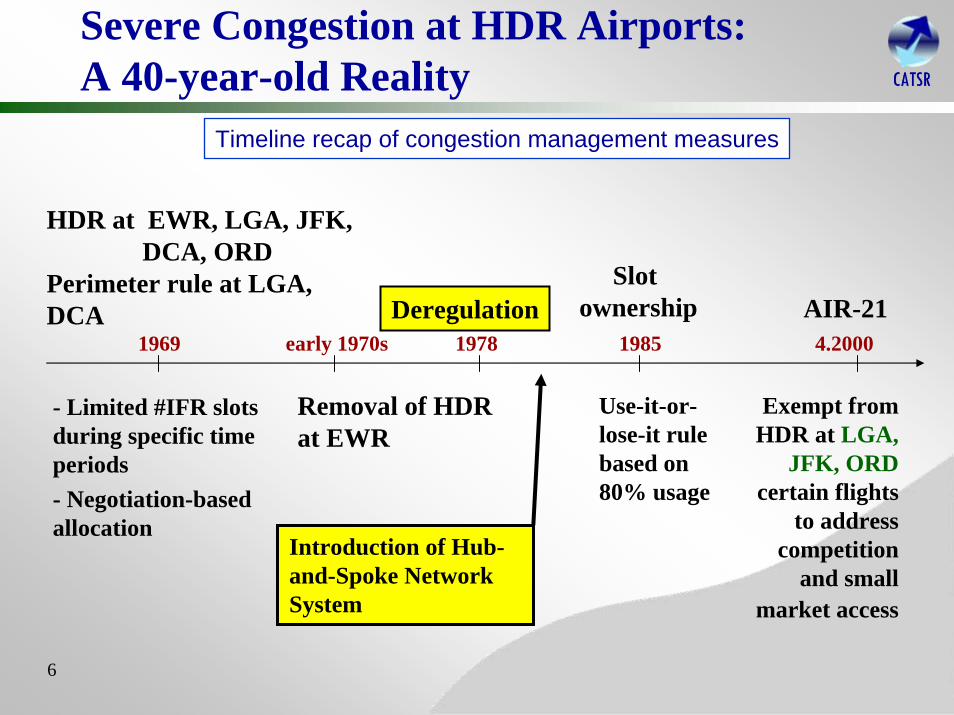
Severe Congestion at HDR Airports:A 40-year-old Reality
- Limited #IFR slots during specific time periods- Negotiation-based allocation
1969
HDR at EWR, LGA, JFK, DCA, ORD
Perimeter rule at LGA, DCA
4.2000
Exempt from HDR at LGA,
JFK, ORDcertain flights
to address competition
and small market access
AIR-211978
Deregulation
Use-it-or-lose-it rule based on 80% usage
1985
Slot ownership
Timeline recap of congestion management measures
early 1970s
Removal of HDR at EWR
Introduction of Hub-and-Spoke Network System

7
CATSRCATSRCATSRCATSR
How is the Public Best Served?Top 20 Worst Airports in the US (45-PTD)
Year
Rank Airports
Prob. Of PaxDelay >45 min Airports
Prob. Of PaxDelay >45 min Airports
Prob. Of PaxDelay >45 min Airports
Prob. Of PaxDelay >45 min
1 ORD 14% EWR 18% ORD 17% EWR 16%2 EWR 14% LGA 17% EWR 16% LGA 15%3 LGA 13% ATL 14% LGA 15% ORD 15%4 PHL 12% PHL 13% PHL 15% PHL 13%5 ATL 11% BOS 13% JFK 14% ATL 12%6 MIA 9% ORD 12% IAD 12% JFK 11%7 FLL 9% FLL 12% MIA 12% BOS 11%8 MCO 9% JFK 12% ATL 12% MIA 11%9 DFW 9% MIA 11% MDW 12% FLL 10%
10 LAS 9% SFO 11% DTW 12% IAD 10%11 BOS 9% SEA 10% DFW 12% DFW 10%12 SFO 9% IAD 10% BOS 11% SFO 10%13 IAD 9% TPA 10% DEN 11% DTW 9%14 JFK 9% MCO 10% CLT 10% MCO 9%15 CLE 9% BWI 9% IAH 10% LAS 9%16 SEA 8% PIT 9% CLE 10% CLE 9%17 TPA 8% PDX 9% PIT 10% PIT 9%18 STL 8% DTW 9% DCA 10% SEA 9%19 PDX 8% LAS 9% MEM 10% MDW 9%20 BWI 8% DCA 9% SFO 10% DCA 9%
2004 2005 2006 Average of 2004 to 2006
D. Wang, GMU PhD. In Progress

8
CATSRCATSRCATSRCATSR
EWR a NYNJ Airport with No Slot Controls:Market Acceptable Transportation Predictability (2006)
Time of Day (hour)
Del
ay p
er F
light
(min
utes
)
EWR
0 5 10 15 20-40
-20
0
20
40
60
80
45 minute Passenger Trip Delay (45-PTD) Metric that Includes Flight Load Factors, Cancellations & Missed Connections
(D. Wang GMU 2007)
35 Airport BN Model
Summer 2006 Data
(N. Xie GMU 2007)

9
CATSRCATSRCATSRCATSR
Marginal Rate IFR Rate
Calculated Capacity (Today) and Actual Throughput
Optimum Rate
0
20
40
60
80
0 20 40 60 80
Departures per Hour
Arr
ival
s pe
r Hou
r
Calculated Capacity - Today
Facility Reported Rate - EWR(arrivals, departures per hr)
Each symbol represents actual traffic during a single hour
Infrequent Most Frequent
42, 42
0
20
40
60
80
0 20 40 60 80
Departures per Hour
Arr
ival
s pe
r Hou
r
40, 40
0
20
40
60
80
0 20 40 60 80
Departures per Hour
Arr
ival
s pe
r Hou
r
33, 33
EWR :
DoT/FAA
2004 Capacity Benchmark Report
Operational Rates Inside this Envelope Satisfy FAA Safety Standards (i.e. establish Max. Number of Arrival and Departure Slots)

10
CATSRCATSRCATSRCATSR
Are Airlines Making Optimal use of these Operations? EWR Fleet Mixture
Monthly Averaged T-100 Segment Data

11
CATSRCATSRCATSRCATSRNew York LaGuardia Airport: Case StudyData (2005):
• Throughput:404,853 flights/yr
• Average flight delay:38 min
• Revenue passengers:26,671,787
• Average aircraft size:96 passenger
• Average inter-city fare: $133
12
CATSRCATSRCATSRCATSR
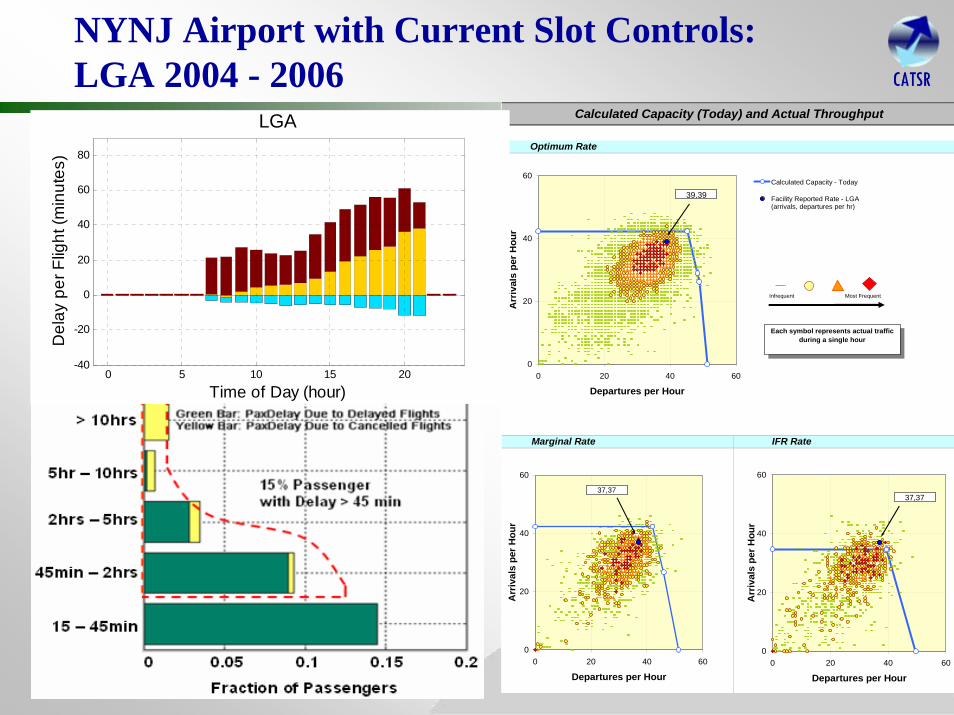
NYNJ Airport with Current Slot Controls:LGA 2004 - 2006
Marginal Rate IFR Rate
Calculated Capacity (Today) and Actual Throughput
Optimum Rate
0
20
40
60
0 20 40 60
Departures per Hour
Arr
ival
s pe
r Hou
r
Calculated Capacity - Today
Facility Reported Rate - LGA(arrivals, departures per hr)
39,39
Each symbol represents actual traffic during a single hour
Infrequent Most Frequent
0
20
40
60
0 20 40 60
Departures per Hour
Arr
ival
s pe
r Hou
r
37,37
0
20
40
60
0 20 40 60
Departures per Hour
Arr
ival
s pe
r Hou
r
37,37
Time of Day (hour)
Del
ay p
er F
light
(min
utes
)
LGA
0 5 10 15 20-40
-20
0
20
40
60
80
13
CATSRCATSRCATSRCATSR
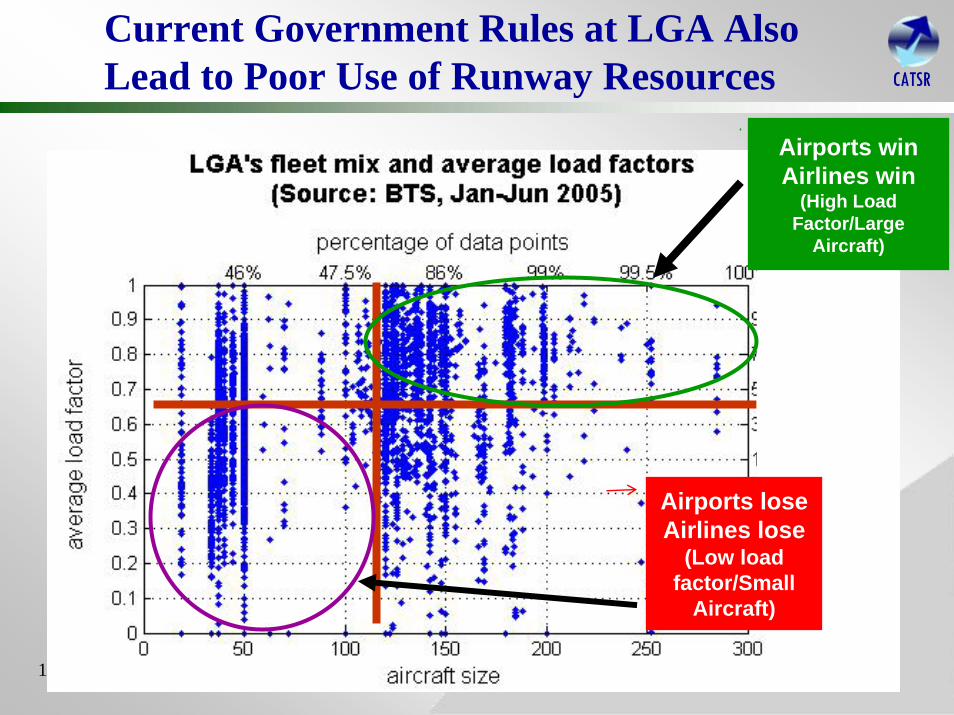
Current Government Rules at LGA AlsoLead to Poor Use of Runway Resources
• Inefficient use of resources
Airports loseAirlines lose
(Low load factor/Small
Aircraft)
Airports winAirlines win
(High Load Factor/Large
Aircraft)
14
CATSRCATSRCATSRCATSR
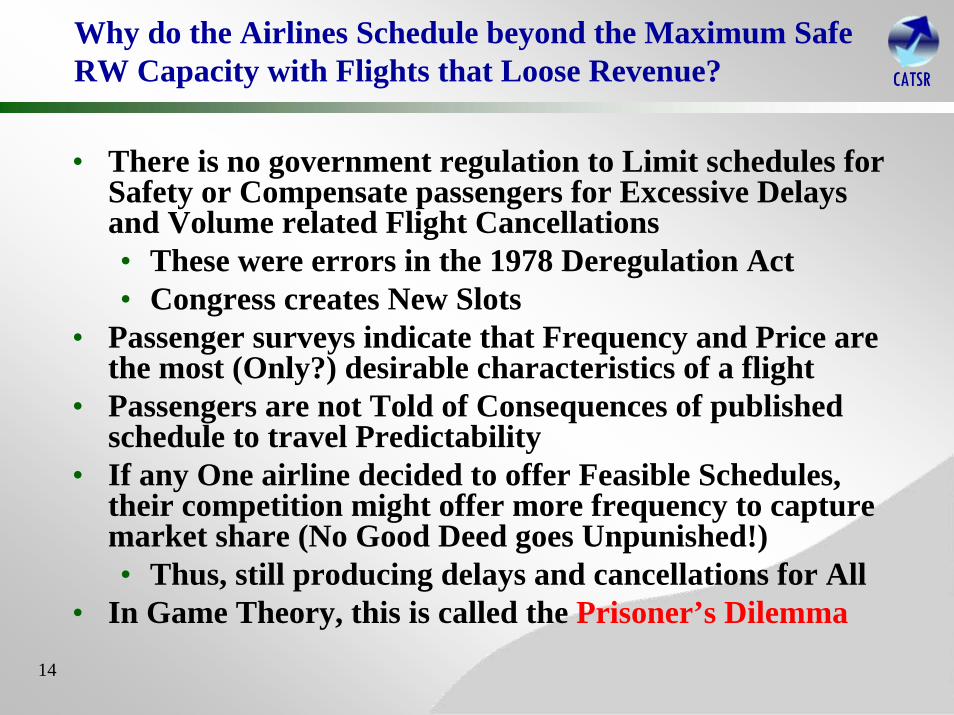
Why do the Airlines Schedule beyond the Maximum Safe RW Capacity with Flights that Loose Revenue?
• There is no government regulation to Limit schedules for Safety or Compensate passengers for Excessive Delays and Volume related Flight Cancellations• These were errors in the 1978 Deregulation Act• Congress creates New Slots
• Passenger surveys indicate that Frequency and Price are the most (Only?) desirable characteristics of a flight
• Passengers are not Told of Consequences of published schedule to travel Predictability
• If any One airline decided to offer Feasible Schedules, their competition might offer more frequency to capture market share (No Good Deed goes Unpunished!)• Thus, still producing delays and cancellations for All
• In Game Theory, this is called the Prisoner’s Dilemma

15
CATSRCATSRCATSRCATSR
• What would happen if schedules at major airports were capped by predictable runway capacity and allocated by a market mechanism?• What markets would be served?• How would airline schedules change?
– Frequency– Equipment (#seats per aircraft)
• How would passenger demand change?– At airport– On routes
• How would airfares change?– What would happen to airline profit margins?
• How would airport and network delays be altered?
A Natural Question? Is There an Optimal Allocation of Scarce Runway Resources?

16
CATSRCATSRCATSRCATSRModeling Approach and Assumptions
• A Benevolent Monopolistic Airline (e.g. Port Authority of NY&NJ) has the ability to Determine and Set an Optimum Schedule to:• Operate at Competitive Profit Margins• Maximize Passenger Throughput• Ensure an Airline Operating Profit (Max, 90%,80%)
• All Current Domestic Origin and Destination Markets are Considered• 67 Scheduled Daily Service Markets
• Current Market Price Elasticity Remains Constant• BTS T-100 segment data

17
CATSRCATSRCATSRCATSRNY LGA Has 67 Daily Markets

18
CATSRCATSRCATSRCATSR
Network Flow Optimization Problem
(Le, 2006)
Demand-Price Elasticity$
#
S1S2
DASPM, BTS databases
Delay Network Simulation
Flight schedulesFleet mixAverage fareFlight delays
Airline Competitive Scheduling: Modeling Framework
Auction 64 Ops Slots/Hr

19
CATSRCATSRCATSRCATSR
Research Results:Detailed Data at 90% of Profit Optimality
Estimated Effect of Slot Controls at LGA Using Market Mech
-120%
-100%
-80%
-60%
-40%
-20%
0%
20%
40%
60%
80%
100%
0 1 2 3 4 5 6 7 8 9 10
Arrival Rate per 15min Time Slot
Perc
ent C
hang
e fr
om C
urre
nt P
olic
y
Market Change# flts/dayMax Enpl/dayAvg AC Seat CapAvg FareAvg Flt Delay
BL U 10 9 8 7 6 5 4
LGA IMC Capacity Aircraft Size
Airfare
Markets servedFrequency of Service
Delays
Max enpl/day

20
CATSRCATSRCATSRCATSR
90% Profit Max - 64 Ops/Hr compromise: Frequency and Delay profile by time of day
21
CATSRCATSRCATSRCATSR
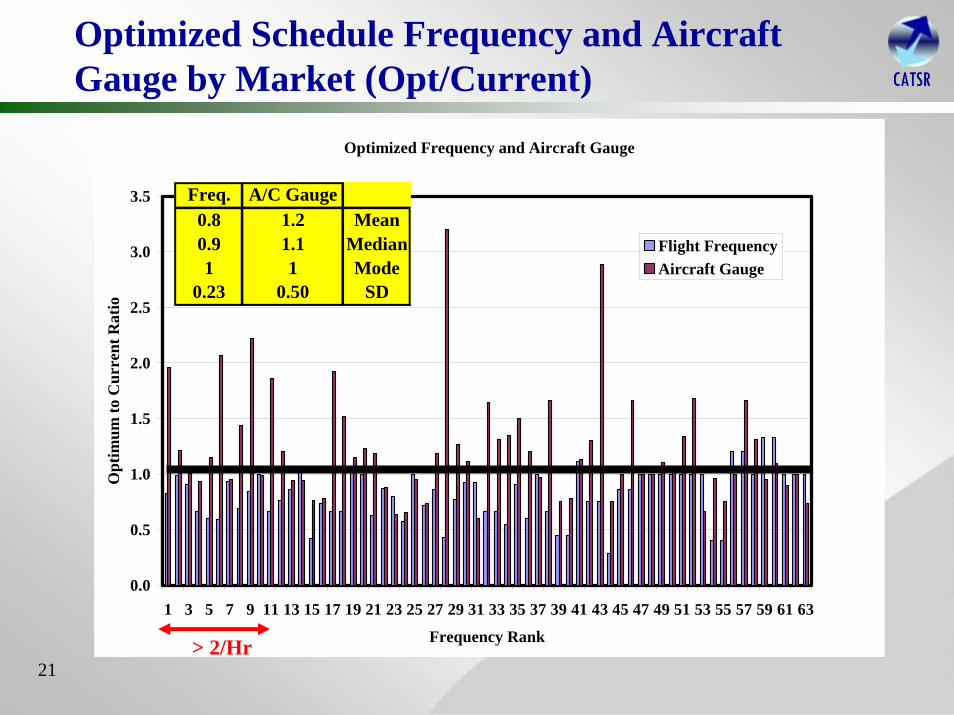
Optimized Schedule Frequency and Aircraft Gauge by Market (Opt/Current)
Optimized Frequency and Aircraft Gauge
0.0
0.5
1.0
1.5
2.0
2.5
3.0
3.5
1 3 5 7 9 11 13 15 17 19 21 23 25 27 29 31 33 35 37 39 41 43 45 47 49 51 53 55 57 59 61 63
Frequency Rank
Opt
imum
to C
urre
nt R
atio
Flight FrequencyAircraft Gauge
Freq. A/C Gauge0.8 1.2 Mean0.9 1.1 Median1 1 Mode
0.23 0.50 SD
> 2/Hr

22
CATSRCATSRCATSRCATSRModel Estimate of Aircraft Gauge Change
Estimate of Aircraft Up-Gauging
0
50
100
150
200
250
300
19 to 37 44 to 50 69 to 77 88 to110
117 to133
138 to158
166 to181
194 to225
Aircraft Seating Capacity
Num
ber
of D
aily
Flig
hts
Current Fleet Allocation 90% Optimum Fleet Allocation
Current 90% Opt %Aircraft Size Range # Flights # Flights Change
19 to 37 64 66 3%44 to 50 259 54 -79%69 to 77 90 90 0%
88 to 110 192 118 -39%117 to 133 121 86 -29%138 to 158 235 252 7%166 to 181 49 72 47%194 to 225 0 68 -
Total 1010 806 -20%

23
CATSRCATSRCATSRCATSRUnprofitable daily markets at LGA
• Three markets (13 Flights) that are not profitable to operate on a daily basis are identified to be:• Lebanon-Hanover, NH (LEB),• Roanoke Municipal, VA (ROA),• Knoxville, TN (TYS).
Runway Cap. Market seats/AC Fare Passengers RPM Yield Flights/dayunconstrained LEB 19 $153 50 $0.72 6
10,9,8,7 ROA 37 $186 77 $0.46 5 6,5,4 TYS 50 $125 85 $0.19 2

24
CATSRCATSRCATSRCATSR
•Airlines• Reduced frequency with
larger aircraft• Most Markets Retained• More Profitable (90% of
Optimum)•Passengers
• Markets served: Little change
• Airfares no change• Improved Predictability
• Airports• Increased passenger
throughput• Reduced delays (70%)
•Air Traffic Control• Reduced delays
– Demand within capacity– Reduced Prob. SRO
Airlines adapt with aircraft size and frequency to congestion constraint: Positive impacts on passengers, airports, airlines, and ATC
Research Results – Win Win

25
CATSRCATSRCATSRCATSRConclusions and Recommendations
• Airport Congestion Management will be Required to Accommodate Projected passenger growth rates
• Market Based Approaches May be able to Approximate Optimum Allocation of Scarce Runway Availability Resources
• Metropolitan “Metroplex Operation” should be Investigated to Better Understand Airport Synchronization Possibilities under Congestion Management Measures

26
CATSRCATSRCATSRCATSROpinion
• FAA Owns slots Because:• FAA computes Max Number of Safe Arrival and
Departure Combinations as a Function of:– Airport Runway Configuration, – Separation Technology – Designated Level of Safety
• Daily GDP control (and Acceptance by Airlines) is an implicit exercise of this ownership
• Slot Exemptions (or total lack of control) are an implicit reduction of the FAA’s stated safety standards• Standards should be either changed or enforced

27
CATSRCATSRCATSRCATSR
Center for Air Transportation System Research Publications and Information• Loan Thanh Le, “Demand Management at Congested
Airports: How far are we from Utopia?”, Ph. D. dissertation August 2006.
• http://catsr.ite.gmu.edu
– Other Useful Web Sites
• http://mytravelrights.com• http://gao.gov• http://www.airconsumer.ost.dot.gov

28
CATSRCATSRCATSRCATSR
BACKUP Material

29
CATSRCATSRCATSRCATSR
DCA a Conservatively Scheduled High Demand Slot Controlled Airport
Calculated Capacity (Today) and Actual Throughput
Marginal Rate IFR Rate
Optimum Rate
0
20
40
60
0 20 40 60
Departures per Hour
Arr
ival
s pe
r Hou
r
Calculated Capacity - Today
Facility Reported Rate - DCA(arrivals, departures per hr)
Each symbol represents actual traffic during a single hour
36, 36
Infrequent Most Frequent
0
20
40
60
0 20 40 60
Departures per Hour
Arr
ival
s pe
r Hou
r30, 30
0
20
40
60
0 20 40 60
Departures per Hour
Arr
ival
s pe
r Hou
r
24, 24
Time of Day (hour)
Del
ay p
er F
light
(min
utes
)
DCA
0 5 10 15 20-40
-20
0
20
40
60
80

30
CATSRCATSRCATSRCATSR
Congestion Management could Shift Hubbing Passengers to other Large Airports
ConnectingAirport Passengers
%Chicago O'Hare 59
Newark NJ 32NY LaGuardia 8
NY JFK 40Philadelphia 38
Atlanta 66Boston 15Miami 55
Washington Dulles 53Dallas/Fort Worth 60
FAA 2006 NPIAS

31
CATSRCATSRCATSRCATSR
LGA High Frequency Flights:Current and 90% of Optimum
Market Daily A/C Model Model Normalized RankFreq seats Freq seats Freq Seats
Boston Logan BOS 73 106 60 208 0.8 2.0 1Washington DC Reagen Nat DCA 69 108 68 131 1.0 1.2 2Chicago O'Hare ORD 62 138 56 139 0.9 1.0 3Atlanta Hartsfield ATL 48 156 32 145 0.7 0.9 4Fort Lauderdale Fl FLL 43 157 26 181 0.6 1.2 5Raueigh/Durham NC RDU 37 46 22 95 0.6 2.1 6Detroit Mi DTW 32 122 22 175 0.7 1.4 7Charlotte NC CLT 32 102 30 97 0.9 1.0 8Columbus OH CMH 26 46 22 102 0.8 2.2 9Dallas Ft Worth DFW 26 148 26 146 1.0 1.0 10
32
CATSRCATSRCATSRCATSR
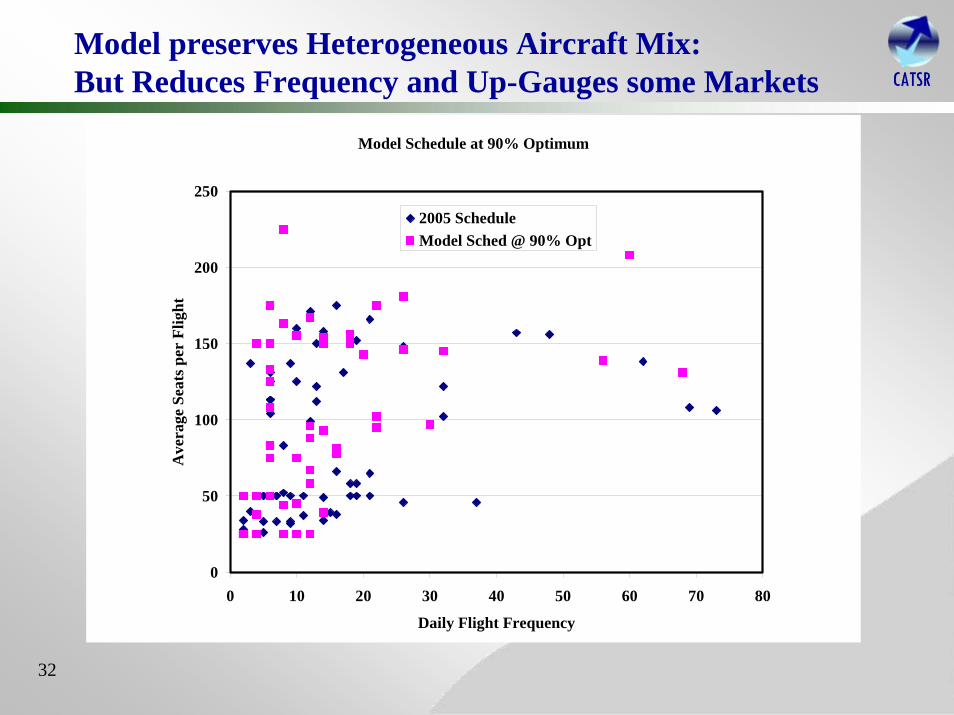
Model preserves Heterogeneous Aircraft Mix:But Reduces Frequency and Up-Gauges some Markets
Model Schedule at 90% Optimum
0
50
100
150
200
250
0 10 20 30 40 50 60 70 80
Daily Flight Frequency
Ave
rage
Sea
ts p
er F
light
2005 ScheduleModel Sched @ 90% Opt

33
CATSRCATSRCATSRCATSR
Runway Capacity is Set by Aircraft Safety Separation Standards
Airline Demand Driven by Market Access/Competition/Profitability Concerns
•High utilization rates (>80%)increase delays exponentially•Delays at major airports Impact the Entire Air Transportation Network
Network Delays Driven by Uncoordinated and Over-Scheduled Flights: e.g. LGA, EWR, JFK
1 Hr

34
CATSRCATSRCATSRCATSRJFK Fleet Mixture
35
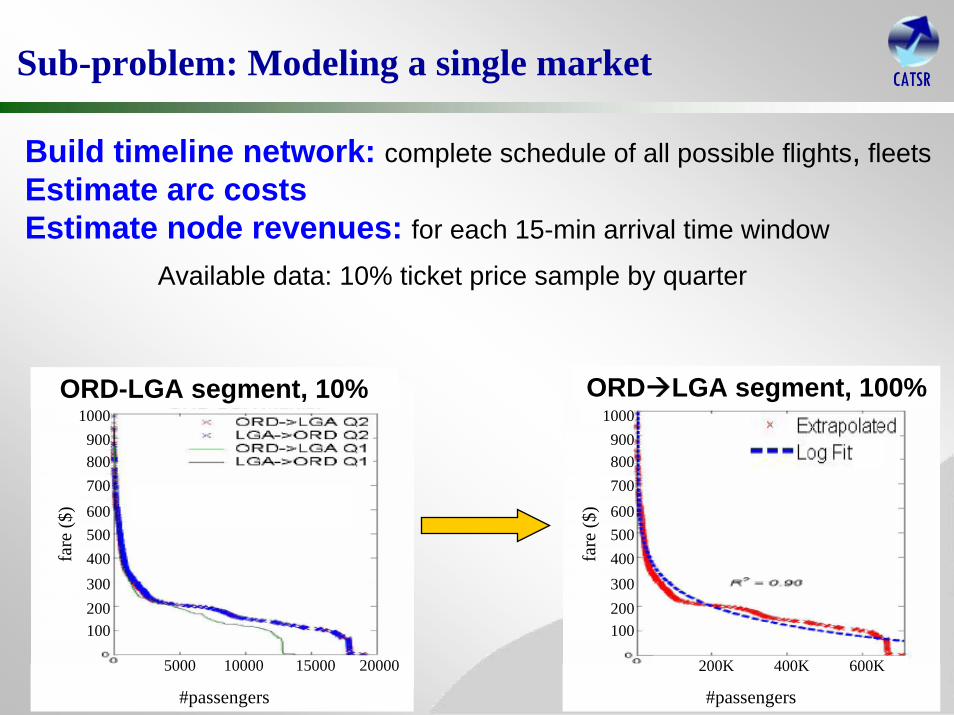
CATSRCATSRCATSRCATSRSub-problem: Modeling a single market
Build timeline network: complete schedule of all possible flights, fleetsEstimate arc costsEstimate node revenues: for each 15-min arrival time window
ORD-LGA segment, 10%
Available data: 10% ticket price sample by quarter
#passengers
5000 10000 15000 20000
1000900800700600500400300200100
fare
($)
#passengers
200K 400K 600K
ORD LGA segment, 100%1000900800700600500400300200100
fare
($)

36
CATSRCATSRCATSRCATSRSub-problem: Modeling a single market
Build timeline network: complete schedule of all possible flights, fleetsEstimate arc costsEstimate node revenues: for each 15-min arrival time window
From demand curves to revenue curves
40K
35K
30K
25K
20K
15K
10K
5K
Rev
enue
s ($)
peak to off-peak

37
CATSRCATSRCATSRCATSRGeneral solution approach
Airport’s enplanement opportunitiesmaximizing
Set packingmaster problem
Airline Profit maximizing
Multi-commodity network
subproblems
ATL
TPA
BOS
67 nonstop
dailydomesticmarkets
ORD
…
…
LGA
schedulesfleets
marginal value of allowing
an extra flight
(dual prices)

38
CATSRCATSRCATSRCATSR
Schedules exceeding airport optimum rates…
Congestion management by better scheduling

39
CATSRCATSRCATSRCATSR
…lead to excessive queuing delay
Congestion management by better scheduling

40
CATSRCATSRCATSRCATSR
ADR: Airport Departure RateAAR: Airport Arrival Rate
Facility-reported capacity: average of (ADR+AAR) over 2000-2005 period
Excess of demand and severe congestion at NY area airports: a 40-year old reality
HDR1969
1985Grandfather rights
4.2000
- LGA: 75 operations/h- AIR21 added additional exemption slots for 70-seat or less aircraft to small airports
600 requests = 50% more flights

41
CATSRCATSRCATSRCATSR
Excess of demand and severe congestion at NY area airports: a 40-year old reality
HDR1969
1985Grandfather rights
AIR214.2000
1.2001Lottery
Removal of HDR at ORD6.2002
Removal of HDR at LGA and JFKWhat’s next?
1.2007

42
CATSRCATSRCATSRCATSR
Summary of European Passenger Bill of Rights -http://news.bbc.co.uk/1/hi/business/4267095.stm
• Overbooked Flights• Passengers can now get roughly double the existing compensation if they are bumped off a
flight. – Compensation must be paid immediately. – These passengers must also be offered the choice of a refund, a flight back to their
original point of departure, or an alternative flight to continue their journey. • May also have rights to meals, refreshments, hotel accommodation if necessary even free e-
mails, faxes or telephone calls. • Cancelled Flights
• Offered a refund of your ticket, along with a free flight back to your initial point of departure, when relevant. Or, alternative transport to your final destination.
• Rights to meals, refreshments, hotel accommodation if necessary, even free e-mails or telephone calls.
– Airlines can only offer you a refund in the form of travel vouchers if you agree in writing
• Refunds may also be paid in cash, by bank transfer or cheque• If the reason for your flight's cancellation is "within the airline's control", it must pay
compensation. • Compensation for cancellations must be paid within seven days.
• Delayed Flights • Airline may be obliged to supply meals and refreshments, along with accommodation if an
overnight stay is required. • If the delay is for five hours or more, passengers are also entitled to a refund of their ticket
with a free flight back to your initial point of departure if this is relevant.

43
CATSRCATSRCATSRCATSR
Air Transportation System (ATS) is a Network with 6 Interacting Layers
Government Regulatory Control LayerPhysical Layer (i.e. Cities, Airports, Demographics)
Weather Layer (Thunderstorms, Ice Storms)
Airline Layer (Routes, Schedules, A/C size)TSA/FAA Layer (ATC Radar, Radios, Ctr’s, Unions)
Passenger/Cargo Layer (Delays, Cancellations)
•The ATS is a Public - Private Partnership with conflicting objective functions:
•Public – Commerce and safety; interest groups
•Private – Profit maximization

44
CATSRCATSRCATSRCATSR
Air Transportation is Characterized as aComplex Adaptive System (CAS)
Market Clearing
Baseline Demand
Effective Price
Effect on GDP
Fleet Revenue
Trips flown by fleet
Reference demand
Ticket price
Effective price by length of trip
Aircraft Fleets
Fleet Costs
Airline Profits
Schedule Active fleet
Offered Flights by Fleet
Flight Delays &
Cancellations
Passenger Delays
Delays
Inconvenience
Airport Capacity
Enroute Capacity
Fleet Attributes
Bengi Mezhepoglu, PhD in progress

45
CATSRCATSRCATSRCATSRResearch problems and findingsResearch problem 1:
Are current rules of slot allocation the main causes of the congestion problem?
Answer: Yes, grand-father rights, weight-based landing fees, slot exemptions
Research problem 2:Impacts on congestion, enplanement opportunities, markets served, aircraft size, flight demands ?

46
CATSRCATSRCATSRCATSRAirline response model
Model a single benevolent airlineModel the interaction of demand and supply through price
– Price elasticity of demand determine demand at each price point– Each supply curve corresponds to a fleet mix profile– Different supply levels result in different equilibriums
quantity (#seats)
fare
($)
quantity (#seats)
reve
nue
($)
E1
E2
E3
E1
E2 E3