optimizing waste flows in the osu network - The Ohio State University
42
OPTIMIZING WASTE FLOWS IN THE OSU NETWORK A Senior Honors Thesis in Industrial and Systems Engineering by Cullen Naumoff Submitted in Fulfillment Of the Requirements For Graduation with Distinction Advisors: Dr. Joseph Fiksel Dr. Jerald Brevick May 18, 2007 i
Transcript of optimizing waste flows in the osu network - The Ohio State University

OPTIMIZING WASTE FLOWS IN THE OSU NETWORK A Senior Honors Thesis in Industrial and Systems Engineering
by
Cullen Naumoff
Submitted in Fulfillment
Of the Requirements
For Graduation with Distinction
Advisors:
Dr. Joseph Fiksel
Dr. Jerald Brevick
May 18, 2007
i

Acknowledgments
Many thanks go out to those who were so helpful in completing my project. Both of my advisors,
Dr. Joseph Fiksel and Dr. Jerald Brevick, were more then helpful in providing technical and
bureaucratic insights. Thank you especially to Dr.Fiksel who was very patient with me as I
collected and learned the ropes of Eco-Flow™, all the while providing knowledgeable guidance.
Kieran Sikdar deserves many slaps on the back for all his help and countless hours. His
willingness to meet and patience is something I am deeply indebted to him for. And finally to all
those whom I harassed for data, I am also deeply appreciative. Tina Redman and Martha Hoff
received the brunt of the questioning and again I am much appreciative of their patience,
flexibility, and continued helpful nature. This project has held many learning experiences about
research, about data collection, about reports which I am also happy to have had as a capstone to
my collegiate experience.
ii

Table of Contents Acknowledgments........................................................................................................................... ii
Abstract ........................................................................................................................................... 5
Introduction..................................................................................................................................... 6
Literature Review............................................................................................................................ 7
Methods......................................................................................................................................... 10
Data Collection ..................................................................................................................... 10
Closed Loop System ............................................................................................................. 12
Operations Research ............................................................................................................. 13
Eco-Flow™ Model ............................................................................................................... 13
Data ............................................................................................................................................... 14
Results........................................................................................................................................... 23
Discussion..................................................................................................................................... 26
Recommendations......................................................................................................................... 27
References..................................................................................................................................... 29
Appendix A................................................................................................................................... 31
OSU Waste Network............................................................................................................. 31
Appendix B ................................................................................................................................... 32
Linear Programming Model.................................................................................................. 32
Appendix C ................................................................................................................................... 37
Recycling .............................................................................................................................. 37
Appendix D................................................................................................................................... 40
Dining Facilities.................................................................................................................... 40
Appendix E ................................................................................................................................... 42
Waterman Farms................................................................................................................... 42
3

List of Figures Figure 1: Overall percentage of different waste streams generated from various sources . ......... 14
Figure 2: Solid waste generated by each area of campus ............................................................ 15
Figure 3: Distribution in tons of recyclables generated from each generating source................. 17
Figure 4: Illustrates the profitability of recycling by generating sources. ................................... 18
Figure 5: Food waste generated by each of the dining facilities on campus. .............................. 19
Figure 6: Distribution of the type of recyclables generated from the residence halls. ................ 39
Figure 7: Distribution of the type of recyclables generated from the dining halls. ..................... 40
Figure 8: Distribution of the type of recyclables generated from the academic buildings. ......... 40
List of Tables Table 1: Distribution of funds at a potential composting site at Waterman Farms. ..................... 23
Table 2: Optimal waste flows through the OSU network............................................................ 24
Table 3: Illustrates processes constrained by capacity ................................................................ 25
Table 4: Overall summary of results from the OSU Eco-Flow™ model ..................................... 25
Table 5: Illustration of recycling extrapolated data ..................................................................... 38
4

Abstract The purpose of this project is to develop a comprehensive model of waste flows at The
Ohio State University to enable cost-effective waste reduction. The ultimate goal will be to
establish effective solutions that help OSU to move beyond environmental compliance, and take
pro-active steps to operate with minimum adverse impact on the environment. This project
represents an opportunity to reverse the traditional notion of waste and apply industrial ecology
concepts to explore the effectiveness of applying a systems perspective to sustainable modeling.
The model will take the form of EcoFlow™. Developed by researchers at the Center for
Resilience at OSU, EcoFlow™ models waste flows in complex networks including multiple
inputs, outputs, and decision nodes, to develop a resilient waste management system. In
application to OSU, six waste generators were analyzed as input sources that generated five
different types of waste. Flow pathways, both currently under operation and hypothetical,
provide routes for waste materials to be processed into economically valuable products or energy.
Examples of pathways analyzed in the model include recycling, composting, and the capture and
utilization of methane gas.
The application of EcoFlow™ utilizes operations research techniques, namely integer
programming. This allows for mass balance equations, capacity constraints, and both
transportation and operating costs to be integrated into the model to best optimize the objective
function. In the case of OSU, the model is programmed to maximize profits within the network.
Furthermore, each pathway will be analyzed to show the potential environmental and economic
benefits to the waste generator and the waste consumer and how this interacts with the
University’s triple bottom line, which includes economic, environmental, and social potentials.
Results provide the University with a model of their current waste system and
recommend best practices for operation. However most importantly, the OSU EcoFlow™ model
offers the University an important tool that systematically optimizes waste flow while
simultaneously creating a network that is both economically and ecologically resilient.
5

Introduction Modern day socio-economic activities have required massive amounts of material
consumption. Material flows at The Ohio State University (OSU) are no exception. The
University sends over 2000 tons of material to the landfill on an annual basis. This includes
office supplies, food scraps, packaging materials, and electronic wastes. Responsible
consumption has become an emerging theme in today’s world of over consumption and
exhaustion of raw materials.
Although OSU is not in the waste management business, it should act with accountability
in managing its waste. This paper focuses on OSU’s waste network and quantifies the flow of
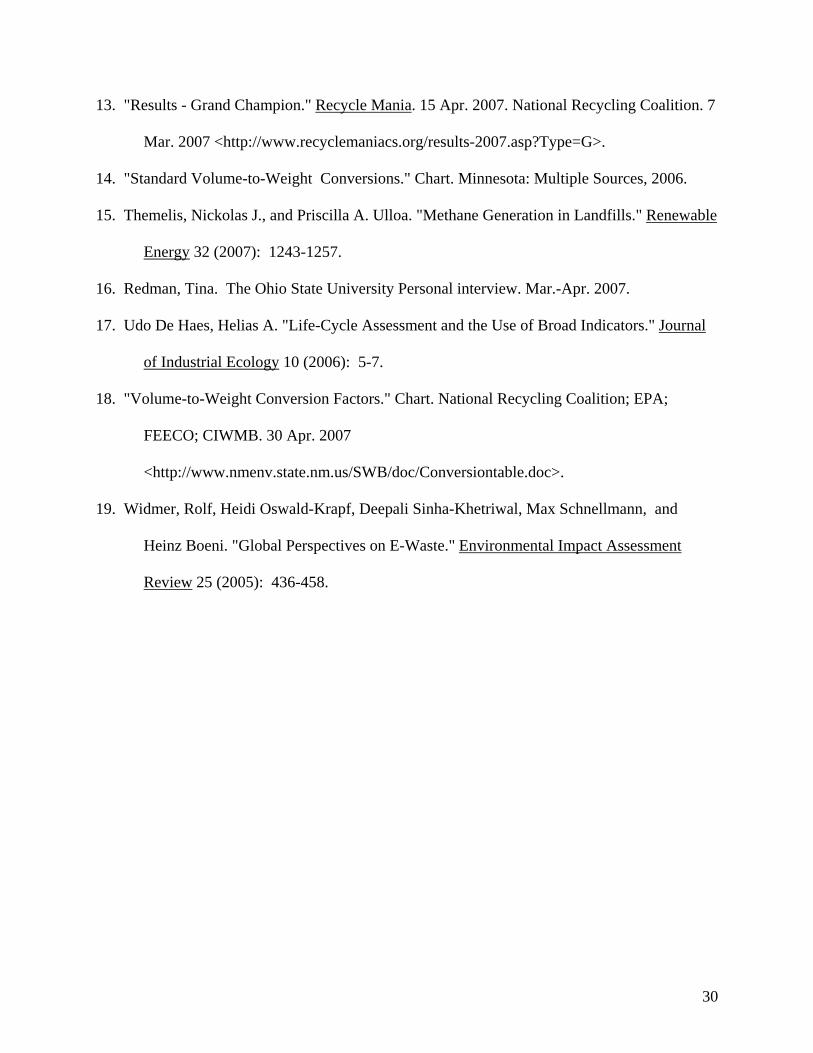
material within the network. Appendix A shows the interactions of wastes within the system and
identifies possible processes to aid in reutilizing the wastes the University generates. The scope
of this project was contained to those generating sources that OSU’s Facilities Operations and
Development (FOD) services currently. Therefore, hospital and athletic waste streams were
excluded from the study. In application to OSU, six waste generators were analyzed, including
residence halls, academic buildings, dining facilities, recreation facilities, laboratories, and
maintenance buildings, as input sources. Solid waste, recyclables, organic waste, and electronic
waste serve as the sources of waste in the network. The concept of responsible waste
management encourages OSU to redefine what is has traditionally thought of as waste. Excess
materials left from the initial utility of a product can be reused/reprocessed to become a
feedstock for another operation at OSU or in the market at large. This project highlights the
beginnings of a closed-loop system, which allows all feedstocks to be effectively utilized from
cradle to cradle.
In effort to optimize the waste flow network, it has been translated into an operations
research problem. This allows material flows to be modeled in mass balance equations to
ultimately optimize a particular objective function. Appendix B details the entire network as a
linear programming model. The main objective in this study due to the data available was to
maximize profits, namely through the closed feedback loops within the OSU network. This
approach is most closely linked with the University’s bottom line approach. However, results
that reduce energy consumption and divert material flow to the landfill can be aligned into a
triple bottom line approach which takes economic, environmental, and social factors into play.
To most effectively reach goals of triple bottom line, this project utilizes the principles of the
6

Eco-Flow™ model. This allows implementing the linear programming model into software that
solves for the optimal solution based on the intended objective function.
Utilizing a triple bottom line approach gives OSU the cutting edge advantage in
approaching business and teaching students. These values also align with those set by the Office
of Energy Services and Sustainability (ESS), newly implemented at the University. According
to the ESS business plan, they intend to promote energy, material, and fiscal accountability while
influencing generations of students to act environmentally responsible in their future behaviors.
The following project will serve as a catalyzing force to aid in accountable waste management
methods at The Ohio State University.
Literature Review Waste has traditionally been defined as “anything left over or superfluous, as excess
material or by-products, not of use for the work in hand.” In a society characterized by “mass-
production, mass-consumption, and mass-disposal”1 waste has become a routine by-product.
This by-product is regarded as a non-value added component in production. Traditional “waste”
is a result of the “cradle to grave” approach to production that has existed since the Industrial
Revolution. This exponential consumption and consequential mass landfilling has become
symbolic of success and power.
“The characteristics of waste which make them waste are not inherent, but are determined
only relatively in a given social and economic context.”2 For example, in a household, inputs are
disposed after consumption of their original utility, as households do not have the capability to
transform the material into other useable forms. Similarly, materials that no longer hold
economic value to a generator deem this material invaluable and dispose of it immediately.
According to Stephen Levine, “In a real sense, it is this lack of added value that defines
industrial waste.”3
However, the 21st century has brought pressures in the face of dwindling resources.
Citizens worldwide are beginning to rethink their traditional form of consumption. The thought
1 Moriguchi, Yuichi. "Recycling and Waste Management From the Viewpoint of Material Flow Accounting." Material Cycles Waste Management 1 (1999): 2-9. The Ohio State University, Columbus. Keyword: Material Flow Accounting., pg.2 2 Same as Above, pg.7 3 Levine, Stephen H. "Comparing Products and Production in Ecological and Industrial Systems." Journal of Industrial Ecology 7 (2003): 33-42. pg.39
7

that raw materials are inexhaustible resources is beginning to be reconsidered. In light of these
recent trends, “waste” is taking on a brand new definition. Ultimately, “materials are always
resources” according to Yuichi Moriguchi. Thus, although the original utility of a material may
be exhausted, the remaining material can become another value-added component to another
process.
Rethinking waste has sprung from the field of industrial ecology. Industrial ecology has
its origins in modeling industrial systems after natural ecosystems. Ecologically speaking, waste
does not exist in natural ecosystems. A waste produced by one species becomes nutrients for
another. The same process can be modeled in industrial systems. “One of the key themes of
industrial ecology is the shift from a linear system where materials, energy , and water are
extracted used and discarded, to a closed-loop system where materials, energy, and water are
reintroduced into the system after their initial use, for continuous reuse as input material, rather
than disposed or emitted as waste.”4
In effort to accomplish a closed loop system, industrial symbiosis becomes a key
implementation method. Industrial symbiosis refers to the development of an “industrial
ecosystem.” “Industrial symbiosis engages traditionally separate industries in a collective
approach to competitive advantage involving physical exchange of materials, energy, water,
and/or by-products. The keys to industrial symbiosis are collaboration and the synergistic
possibilities offered by geographical proximity.”5 In this scenario, a “waste” generated from one
industry can become a feedstock for another process. These wastes can include material by-
products to carbon dioxide. In the face of today’s growing concern of greenhouse gas output, the
ability to reuse these gases in a positive manner yields only beneficial results. This type of
collaboration results in a number of economic, environmental, and social benefits. These
benefits include the generation of local business opportunities including job creation, reduced
energy consumption, reduced material consumption, and stimulating community awareness.
The most well known example of an existing industrial ecopark are the industries of
Kalundborg, Denmark. These industries were not initially built with the intention of developing
as sustainable ecopark. However, in the first years of operation it became clear that
4 Kurup, Biji, William Altham, and Rene Van Berkel. "Triple Bottom Line Accounting Applied for Industrial Symbiosis." ALCAS Conference (2005): 1-14. 5 Kurup, Biji, William Altham, and Rene Van Berkel. "Triple Bottom Line Accounting Applied for Industrial Symbiosis." ALCAS Conference (2005): 1-14. pg.2
8

collaborating with one another was of course a sustainable method of operation, but ultimately
just made good business sense. This industrial ecosystem includes an oil refinery, a gyproc
factory, a pharmaceutical firm, a fish farm, a coal-fired electrical power station and the
municipality of Kalundborg. Perhaps they seem as unlikely candidates to be working together,
but the relationships have yielded strong results that has led to regulations requiring virtually all
discharges by industries be in the form of products that can serve other useful purposes.6
Unfortunately, industrial ecosystems tend to be more complex than natural ecosystems
because of the flow of money. This has created conflicts that still remain to be resolved in the
implementation of industrial ecoparks, and is perhaps that main reason that an ecopark has yet to
be built from scratch. Defining a scope and perspective of the industrial network is extremely
important. It is not uncommon for the benefits of industrial symbiosis to fall unevenly on
participating firms. Often this can create conflict among the network, and thus it is important to
clearly define the goals of the symbiosis upon initial collaboration. Furthermore, it is also
pivotal to identify “ecological rucksacks” that exist in the system that tend to be overlooked.
“Ecological rucksacks refer to the indirect material flows which do not actually enter the
economy, but which occur when providing those commodities that do enter the economy. The
term implies heavy unseen burdens.”7 It is essential the members of an industrial ecopark
address these hidden upstream problems.
The Ohio State University has an opportunity to develop its own industrial ecopark in
terms of waste management. Instead of only considering the initial use of various inputs,
processes that exist within the ecopark can prolong the life of these feedstocks. The network has
the potential to be eco-effective, in that is will benefit the University community both
environmentally and economically. As with every industrial symbiosis project, OSU must be
able to recognize and balance the benefits associated directly with the University and those that
yield beneficial results for the community at large. Ideally, OSU will embrace the roots of
industrial ecology and redefine waste as opportunity to maximize product value and performance.
6 Peck, Steven. Industrial Ecology: From Theory to Practice. Learned Societies Conference, 1996, Environmental Studies Association of Canada. 13 Dec. 2006. 7 Moriguchi, Yuichi. "Recycling and Waste Management From the Viewpoint of Material Flow Accounting." Material Cycles Waste Management 1 (1999): 2-9. The Ohio State University, Columbus. Keyword: Material Flow Accounting., pg.2
9

Methods
Data Collection
In the effort to create a model that most accurately represents the OSU waste flow system,
data from a number of resources had to be acquired. In some cases, accurate records had not
been kept in which case insights from the supervising role were required. In other scenarios,
only partial data existed in which assumptions had to be made to fill in missing links.
Methodologies behind data collection for waste generators and processes are described below.
Solid Waste
Solid waste figures were provided by the Solid Waste Management within Facilities,
Operation, and Development (FOD) at the University. In 2006, the solid waste division began
recording the pounds of solid waste collected at each facility they service including all waste
generators included in this study. Solid waste is measured while each building is being serviced
by a scale inside the truck. These weights are then recorded and tracked in an online database.
This practice began in July 2006 and thus historical records for comparison are not available. At
the time of data entry in this study, records had been logged up to February 19, 2007.
Recyclables
Collecting data on recyclable collection at OSU proves to be a challenging endeavor.
Currently, the recycling program is headed out of the newly created Office of Energy Services
and Sustainability (ESS) at OSU. Despite the current recycling program’s existence for 14 years,
there exists no data that would offer any insights into the effectiveness of the program. Thus, it
is hard to infer what areas utilize recycling bins most often or the materials recycled most.
However, in November of 2006 ESS instituted a pilot program to gather data on nine buildings
on the effectiveness of co-mingled recyclables. These nine buildings include two maintenance
buildings (1100 Kinnear Road and Central Services), six classrooms buildings (Central
Classroom, Dreese/Baker, Journalism, Psychology, and Scott Labs), and the Recreation Physical
Activity Center. In order to supplement this data, data from Recycle Mania is also included in
the study. Recycle Mania is a national contest sponsored by Students for Recycling, a student
organization on campus. For the competition, FOD performs volume-to-weight conversions for
10

all recyclables collected from the residence halls and dining facilities. Therefore, recyclable
weight data exists for 2006 from January 30 to April 7th.
Both the pilot program and Recycle Mania data exist for approximately three months
during the winter season. In effort to gather a year’s worth of data, assumptions and calculations
were made to create data equivalent to a years worth of data in 2006. See Appendix C for a
more detailed explanation on how these numbers were extrapolated.
Recyclables are currently collected in a co-mingled system at OSU. Recyclables include
aluminum, steel, glass, plastic, mixed paper, cardboard, and newspaper. Costs and profits
incurred due to the collection of recyclables were provided by the OSU Recycling Coordinator.
Organic Waste
There are currently 15 dining facilities located at The Ohio State University. Organic
waste at any of these facilities has never been attempted to be tracked. Organic waste in the
dining facilities includes food scraps of uneaten food and excess food from the kitchen
preparations. Currently, the majority of this food waste is disposed of down the disposal which
is then treated through the City of Columbus treatment facilities. Due to resource constraints,
performing a small collection experiment exclusively for this study was not feasible. Therefore,
the study relies on personal interviews of each facilities operations manager. Each operation
manager was interviewed as to how much waste is overproduced behind the line and food left
uneaten by students on a daily basis. Most estimated these figures in terms of 30 gallon garage
bags; see Appendix D for details on these volume-to-weight conversions. It was evident that
facilities that utilize make-to-order operations produce much less food waste than, for example, a
buffet line. Daily estimates were then converted into annual food waste production (appendix D.)
Discussions are currently in process at the University to begin to think about recording
organic wastes to track compostable material available.
Electronic Waste
Electronic waste at OSU has the opportunity to go in three different directions once
collected. The waste can be contracted out to Intechra, a hazardous waste disposal company.
Some of the collected waste is disposed of by Shredder, a company which decreases the volume
of the electronic waste before sending in to the landfill. The third method is to send this waste to
11

OSU Surplus where it is refurbished and sold at subsidized prices back to various entities at OSU,
including student organizations, academic departments, and individuals. Despite being in
existence for more than 10 years, cohesive records of what has entered and left Surplus do not
exist. Invoices serve as the only record that an electronic waste product had entered the facility.
Due to this, data for this study relies on the insights of the current Surplus manager.
Kurtz Brothers Anaerobic Digestor
Jeff Moore, sales and marketing manager at Kurtz Brothers, was able to provide much of
the data in regards to the anaerobic digestor system. The system is still two years out from
coming online, so much of the data he provided, including costs and output percentages, are still
to some extent theoretical in nature.
Composting at Waterman Farm
A composting pad at Waterman Farm at OSU does not currently exist. Insights into the
construction and operation of such a facility was provided by Dr. Fred Michel, a composting
specialist operating out of the OARDC OSU facility in Wooster, Ohio. He provided thoughts on
the feasibility and also resale values of compost.
Remainder of Data
The remainder of the data, mainly those associated with the new processes in the system,
were utilized from the SWACO Eco-Flow™ with the permission of Kieran Sikdar, who built the
model. This data is representative of the processes and not necessarily unique to OSU.
Closed Loop System
The foundation of the OSU network is based on a closed loop system. In this system, all
wastes that enter the system should be reused at the end of its useful life as a product for another
system within the OSU network. In this study, there are two functioning closed loop systems.
One of the loops would be considered a market loop. In this such scenario, wastes that OSU
produces travel through a variety of processes to eventually re-enter the market as a useable
product. OSU then has the opportunity to purchase these products that resulted from their waste
stream. The second loop is associated only within the OSU network. In this fashion, wastes that
12

are generated from one area are re-utilized as a feedstock in other processes at OSU. For
example, organic waste generated in the dining facilities can be composted at Waterman Farm
located on OSU’s main campus. Compost generated here can then be used as fertilizer for OSU
landscape thus sustaining a closed loop system. Utilizing a closed loop method is essential to
rethinking waste in the OSU network.
Operations Research
In order to effectively model the OSU waste network, operations research (OR)
techniques were utilized. OR techniques allowed the modeling of system interactions and
associated costs simultaneously. Specifically, the model employs linear programming methods
allowing the identification of an objective function to maximize earnings in the OSU network.
The objective function is optimized with linear constraints that include capacity, mass balance,
waste stream percentages, and operating and transportation costs.
Eco-Flow™ Model
Eco-Flow™ is an industrial ecology network model developed by researchers in the
Center for Resilience at The Ohio State University. The model utilizes linear programming
techniques to model industrial ecology networks in order to maximize profitability and waste
reduction. It allows rapid and repeatable calculations of optimal pathways for material
utilization. In this manner, various parameters can be changed to parallel the fluctuating nature
of industrial systems while still yielding an optimal solution for the network. This model will be
applied to the OSU network. Many of the processes recommended in the OSU system are part of
the Central Ohio Resource Transformation Center, the original application of Eco-Flow™.
These networks represent opportunities to “convert ordinary municipal and industrial solid
wastes into streams of marketable commodities, including plastics, metals, fuels, and carbon
dioxide.”8 Applying Eco-Flow™ to the OSU network gives the University a tool that will allow
them to utilize the optimal waste management methods over a range of varying inputs to best
enhance their triple bottom line. The triple bottom line acts as a measure to capture an expanded
spectrum of values and criteria to measure OSU’s performance in terms of economic,
environmental, and social elements.
8 Eco-Flow - Industrial Ecology Network Model., Joseph Fiksel, Columbus, OH: Center for Resilience, 2006.
13

Data The following section outlines the raw data collected and provides insight into the waste
flows in the OSU network. The primary generating sites in this study include residence halls,
academic buildings, laboratories, recreation facilities, dining facilities, and maintenance
buildings. Currently, most waste generated is treated as mixed solid waste as seen in figure 1.
However, one of the goals of this project is to eliminate misconceptions about the non-value
added status of materials traditionally thought of as waste.
0%
20%
40%
60%
80%
100%
ResidenceHalls
AcademicBuildings
Labs Recreationfacilities
DiningFacilities
MaintenanceBuildings
Distribution of Waste among Generators
Electronic WasteOrganic WasteRecyclablesSolid Waste
Figure 1: Overall percentage of different waste streams generated from various sources within scope of study.
14

Solid Waste
As seen in figure 2, most of the waste generated at the University is designated as mixed
solid waste. Currently, all food waste is considered as part of this waste, as are many recyclables.
Solid Waste per Area
2322395
1312868
72737
203041
384141 46010
Res Halls
Academic Bldg
Labs
Recreation Bldg
Dining Fac
Main. Bldg
Figure 2: Solid waste generated by each area of campus from July 1, 2006 through February 19, 2007
Figure 2 clearly indicates that residence hall are the biggest producers of solid waste,
which is to be expected as they house the largest population of continuous users (approximate
10,000 students) in comparison to all other generator sites. FOD collects solid waste from over
250 sites daily. The solid waste is then taken to Reynolds Avenue Transfer Station for a tipping
fee of $48.50/ton where Ohio State considers the waste no longer part of their system. Some of
the solid waste, namely compactor or open top boxes, are also hauled by Republic directly to the
Solid Waste Authority of Central Ohio’s (SWACO) landfill. Fees associated with Republic’s
service include $34.50 per ton of mixed solid waste, plus a haul charge of $128 and an
environmental fee of $15 per load.9 Currently, OSU Solid Waste Management Staff estimate
9 A load consists of approximately 5 tons.
15

80% of the waste is hauled to Reynolds by OSU, and the remaining 20% is taken care of by
Republic’s services.
Recyclables
Currently, recyclables make up about 19% of the OSU waste steam. In comparison to
other benchmark institutions this is a small percentage. Currently, Rutgers University recycles
an impressive 57% of their waste stream and University of Michigan follows with a 43%
recycling rate.10 Therefore, it is reasonable to assume with a more systemic recycling program
and better recycling awareness among OSU students, the amount of recyclables collected from
the waste stream could drastically increase. Presently, the Office of Energy Services and
Sustainability is working toward this goal by implementing a co-mingled system through all
University buildings. This will create a more convenient environment for students, faculty, and
staff alike to put recyclable materials in the recycling flow stream.
Figure 3 indicates that academic buildings are the largest generators of recyclables by
weight. Again, this could be assumed because as academic buildings are the largest generators
of mixed paper which carries the largest weight as a recyclable. Please see figures 6,7, and 8 in
Appendix C to acquire a break down of the type of recyclables generated from each source in the
study.
10 "Results - Grand Champion." Recycle Mania. 15 Apr. 2007. National Recycling Coalition. 7 Mar. 2007 <http://www.recyclemaniacs.org/results-2007.asp?Type=G>.
16

92.21
131.990.00
78.00
25.56
63.52
Residence HallsAcademic BuildingsLabsRecreation facilitiesDining FacilitiesMaintenance Buildings
Figure 3: Distribution in tons of recyclables generated from each generating source.
Currently, recycling is not a profitable venture for the University. The solid waste
division of FOD dedicates one collection truck to collecting recyclables and each site is collected
from every two to three days. Recyclables are then loaded into open top boxes where Rumpke, a
local recycling company, collects the boxes for a fee of $10 a ton. FOD collects cardboard
separately, which Rumpke will also remove from the OSU network paying OSU $55 per ton for
the cardboard. Figure 4 below illustrates the associated costs and savings of the current
recycling system considering waste generated by the specified sources.
17

$(1,500.00)
$(1,000.00)
$(500.00)
$-
$500.00
$1,000.00
$1,500.00
$2,000.00
1
Dol
lers
(Gai
ned) Residence Halls
Academic BuildingsLabsRecreation facilitiesDining FacilitiesMaintenance Buildings
Figure 4: Illustrates the profitability of recycling by generating sources.
When netted, the numbers in Figure 4 yield a $59.45 gain. However, taking annual
operating expenses into consideration which requires four salaries and one truck for collection
totaling $272,000.00, it becomes clear that recycling has not yet offset its price. Recycling does
however, yield a much lower collection cost than mixed solid waste disposal. Increasing the
percentage of recycled waste stream will decrease the solid waste going to the landfill and
increase the amount of material available to return to the market. In this scenario, the
applications of Eco-Flow™ are appropriate as these recycled materials can be further invested in
by the market, or even become part of a closed loop system at OSU.
18
Organic Waste
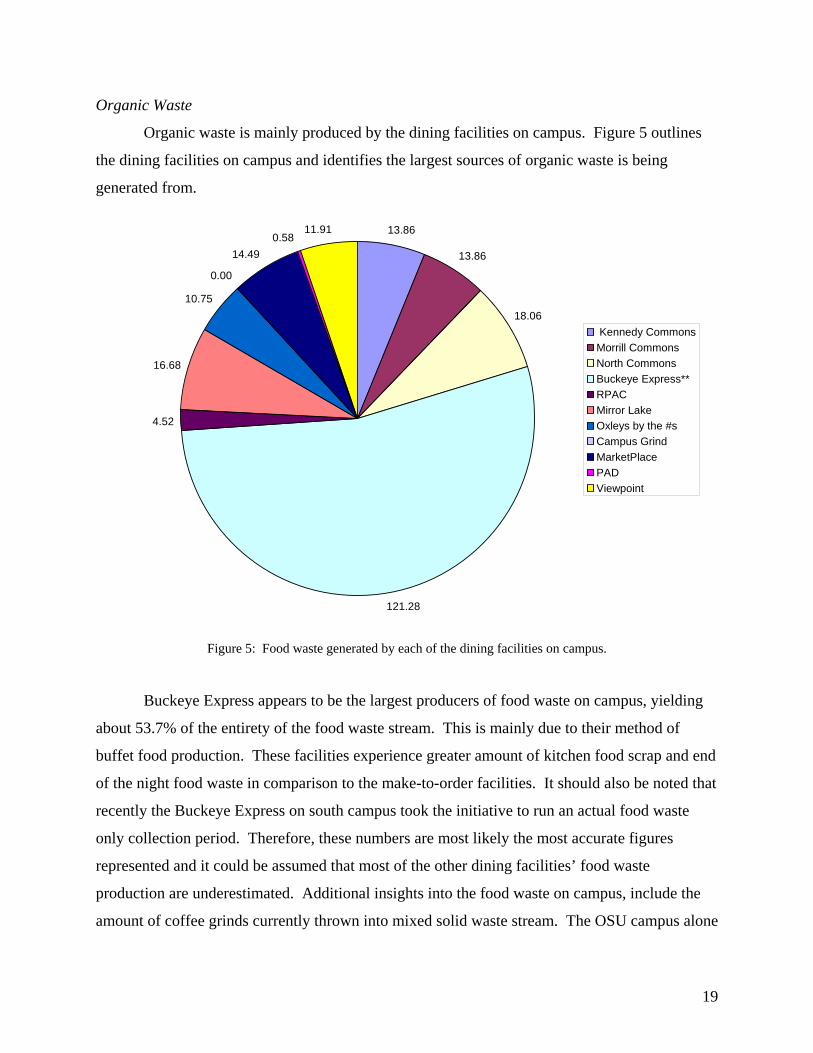
Organic waste is mainly produced by the dining facilities on campus. Figure 5 outlines
the dining facilities on campus and identifies the largest sources of organic waste is being
generated from.
13.86
13.86
18.06
121.28
4.52
16.68
10.75
0.00
14.490.58
11.91
Kennedy CommonsMorrill CommonsNorth CommonsBuckeye Express**RPACMirror LakeOxleys by the #sCampus GrindMarketPlacePADViewpoint
Figure 5: Food waste generated by each of the dining facilities on campus.
Buckeye Express appears to be the largest producers of food waste on campus, yielding
about 53.7% of the entirety of the food waste stream. This is mainly due to their method of
buffet food production. These facilities experience greater amount of kitchen food scrap and end
of the night food waste in comparison to the make-to-order facilities. It should also be noted that
recently the Buckeye Express on south campus took the initiative to run an actual food waste
only collection period. Therefore, these numbers are most likely the most accurate figures
represented and it could be assumed that most of the other dining facilities’ food waste
production are underestimated. Additional insights into the food waste on campus, include the
amount of coffee grinds currently thrown into mixed solid waste stream. The OSU campus alone
19

generates about 2.69 tons of coffee grounds annually. There is a large opportunity that exists
within the organic waste stream in which separate collection can yield profitable commodities.
The residence halls also produce a relatively significant amount of food waste. At OSU,
no studies have been performed to provide a good estimate as to the amount of food waste
discarded in each residence hall. However, other benchmark universities have established dining
and residence hall composting programs. They have had success in students collecting food
waste in their personal room than taking the food waste to a trash room equipped with a toter to
handle food waste. According to data provided by the Purdue University, approximately 13% of
residence hall waste is compostable.11 On account of this figure, an additional 150 tons will be
included as part of the OSU organic waste stream for this study’s purpose.
Two additional components of food waste that were not incorporated as part of this study
include manure (from Waterman Farm) and yard waste. There currently exists a very effective
program for yard waste. The University stockpiles grass clippings and un-reusable pallets and
brush throughout the year, which are then ground up in the spring for use in University flower
beds.
Electronic Waste
All electronic waste being discarded at the University is ideally supposed to travel
through OSU Surplus who then decides where the electronic equipment’s next destination should
be. The majority of the waste is produced by academic departments who are overhauling their
technology resources. Once at Surplus, as dictated by resource constraints and quality of
materials, management keeps refurbishable items and sends a percentage of the waste to Intechra
and Shredder. Intechra operates as a hazardous waste disposal operation that de-manufactures
and recycles 100% of retired assets that are non-functional or are too outdated to be
remarketed.12 Unfortunately, any hard data associated with electronic waste could not be
determined at the time of this study. Despite multiple attempts in various forms of
communication, a connection was never made. Therefore, numbers provided in the study are
based on educated guesses by those who work in conjunction with OSU Surplus. Fifty percent
of the electronic waste stream is given to Intechra at a cost of $100 per ton. Shredder takes 30%
11 Before the Cap and Gown: the Capstone. Purdue University. 2003. 7 May 2007 <http://www.asabe.org/Educate/Feb_2003_R/capstone.html>. 12 http://www.intechra.com/html/Recycling.html
20

of the waste stream, leaving 15% for OSU Surplus to refurbish and resell. OSU Surplus takes on
the least amount of the waste stream due to space and resource constraints. Realistically speaking,
5% of the e-waste stream will head directly to the landfill.
Kurtz Brothers Anaerobic Digestor
A regional anaerobic digestor is scheduled to begin operation in two years at the Old
Trash Burning Plant on Jackson Pike in Columbus, Ohio. Waste from area farms, restaurants,
and landscaping businesses will be digested together. OSU has a unique opportunity to partake
in this system to gain real benefits from creating profit from food waste. Other universities, that
include Ohio University, are interested in starting similar systems on their campuses. However,
anaerobic digestors are not cost effective for the relatively small amount of food waste produced
by a university campus. However, because the regional model is being developed in the
Columbus area, this allows OSU to be a prime candidate to participate in anaerobic digestion.
According to Kurtz Brothers, the products they suspect to output for the digestion process
are methane, hydrogen, carbon dioxide, trace amounts of ammonia, and topsoil amendments.
The percentages of each product are still theoretical, but from past operations about .5% of the
outputs will be gaseous in nature and 10% will be in the form of topsoil amendments. The
remainder of the material is lost in evaporation during the process. Kurtz expects to charge
customers like OSU $30 per ton for a tipping fee; this does not include transportation for the
waste.
There exists much potential for the University to reuse the waste they generated via the
outputs from the Kurtz anaerobic digestor. Due to the University providing part of the feedstock
that allow the anaerobic digestor to operate, products would be sold back to the University at
reduced costs. Hydrogen, for example, could be used to refill the Center for Automotives’s
hydrogen filling station. Carbon dioxide could be utilized in the OSU greenhouses on Carmack
Drive or in various laboratory spaces on campus. Finally, Kurtz Brothers currently has contracts
with the University to enhance athletic fields with topsoil amendments. Investments to utilize
anaerobic digestion thus have the potential to lead to contracts at reduced costs to sustain the
aesthetics and usability of the athletic fields. Further research is necessary to establish useable
feedback loops which address purity issues and monetary decisions. See Appendix A for a visual
diagram of the feedback loops that exist.
21

Composting at Waterman Farm
Waterman Farm, located on Carmack Road, has the potential to be an excellent
composting site for the University. However, it first must be equipped with composting
equipment which include a concrete composting pad and a University employee to manage the
operation. Equipment, such as a loader and tractor, are also needed but these could be scheduled
into the Farm’s operation. Assuming the Waterman composting site could handle fifty percent
of the food waste generated on campus, this would require a windrow 100 feet by 12 feet by 4
feet (please see Appendix E for detailed calculations.) Windrow composting is the production of
compost by piling organic matter, like food scraps, in long rows, or windrows. This method is
suited to producing large volumes of compost, as the routine turning of the organic matter allows
continual exposure to oxygen to increase the rate of decomposition.
As indicated by Dr. Fred Michel, associate professor in the Department of Food,
Agricultural, and Biological Engineering at The Ohio State University, the composting process
typically takes four to eight weeks in the windrow, with an additional four to eight weeks in a
storage pile to be complete. The final product yielded is about 20% of the original weight of the
feedstock, and remaining 80% is given off in carbon dioxide during the gestation period. Thus,
in Ohio State’s current operation approximately 22.5 tons of usable compost outputs would be
generated on an annual basis.
If a pilot program were to begin at the University, operations would be modeled after
composting programs at comparable institutions. Penn State University, for example, has a fully
functioning, self-sustaining compost program. It is under their recommendation that one full
time employee be hired as a dedicated organic waste collector and utilization a low-loft truck for
eight hours a day, five days a week to complete collection. Penn State recommends charging a
$55 tipping fee for campus facilities to dump their organic waste in their composting bed, and in
Columbus this would be $8 cheaper than the landfill. Furthermore, products generated are sold
back to university operations (landscaping, construction sites, turf improvements) at a reduced
price. They currently charge $16.82 per ton which is $29.91 cheaper than the market price. At
Penn State, this has been adequate to create a self-sustaining program and have additional funds
to aid in expanding the program. Table 1 shows how similar figures play out in the OSU system.
It is evident that in our current situation the composting program could not self-sustain itself
22

currently, but with proved success the program could grow to a self-sustaining operation. This
does not include the $5,509.6413 investment that would need to be made for the concrete
composting pad. Table 1: Distribution of funds at a potential composting site at Waterman Farms.
Waterman Operations Employees (1) Truck (1) Total Annual Expenditures
$ 52,000 $ 74,000 $ 126,000
Dollars Accrued Total Annual Grossings
Composted Collected (tons) 380.68
Waterman Capacity 190.34 $10,468.56
Waterman Tipping fee/ton $55.00
Compost Produced (tons) 38.07 $1,138.60
Sold to OSU operations/ton $29.91 $11,607.16
It should also be noted that adding an organic waste collection route, regardless of it
passing through Waterman or the Kurtz Brothers anaerobic digestor, would strain the current
collection capacity of FOD. Thus, it would most likely be necessary to hire an additional staff
member. This would require an additional investment of $52,000 as an annual salary. Ultimately,
the composting program must be well planned for the monetary payback period to occur in a
reasonable amount of years. Tina Redman, Recycling Coordinator at OSU, did note that if OSU
implemented sealed compactor units in dining facilities the collection frequency could be
reduced from 12 times a week to three times per week. In addition to monetary benefits gained
from implementing a composting program, it is also important to note the amount of waste
diverted from the landfill. Theoretical data shows that possibly over 350 tons of food waste
annually could be diverted from the landfill, and this number has potential to grow even larger.
Results Eco-Flow™ has been formulated with the OSU network data and linear programming
formulation. Results yield the optimal flows throughout the system to maximize profits. Table 2
shows the results of current model.
13 Windrow = 1200 square feet = .0275 acres * $200,000/acre = $5,509.64 investment in concrete pad
23

Table 2: Optimal waste flows through the OSU network.
Flow Variable Optimal
Flow
Profit or Cost Per Unit Flow
Upper Bound
Lower Bound
MSW to MRF 2170.60 -30 1E+30 27.65 MRF to Landfill 108.53 0 1E+30 553MRF to Plastics 434.12 0 1E+30 138.25 MRF to Metals 260.47 0 1E+30 230.4167MRF to Fibers 1302.36 0 1E+30 46.08333Recycle to Rumpke 432.49 -10 1E+30 71.85Cardboard to Rumpke 72.22 55 1E+30 118.1Organics to Kurtz Digestor 57.00 -30 1E+30 35.1Organics to Waterman 67.50 -55 1E+30 10.927Organics to Landfill 255.98 -63.1 10.927 1E+30Ewaste to OSU Surplus 80.42 -20 1E+30 1080Ewaste to Intechra 187.64 -100 1080 1E+30Ewaste to Shredder 80.42 -75 1E+30 1E+30Rumpke to Metals 43.25 0 1E+30 718.5Rumpke to Plastics 86.50 0 1E+30 359.25Rumpke to Paper 216.24 0 1E+30 143.7Rumpke to Cardboard 68.61 0 1E+30 124.3158Rumpke to Landfill 25.24 0 1E+30 1437Kurtz AD to AD Clean Gas 0.28 0 1E+30 7264.073Kurtz AD to Landfill 0.57 0 1E+30 3510Kurtz AD to Compost 5.70 0 1E+30 248.8AD Clean Gas to AD Gas Clean 0.28 0 1E+30 0AD Gas Clean to Methan 0.19 0 1E+30 0Landfill to FirmGreen 4000.00 0 1E+30 1E+30FirmGreen to CO2 2000.00 0 0 1E+30FirmGreen to H2 2000.00 0 0 1E+30Waterman to Landfill 3.38 -63.1 1E+30 218.54Waterman to Compost 13.50 0 1E+30 54.635Waterman to Gas 50.63 0 1E+30 14.56933OSU Surplus to Refurbish Electron. 80.42 0 1E+30 1080Shredder to Landfill 80.42 0 1E+30 1E+30Ewaste to Landfill 26.81 -63.1 1E+30 0CO2 to Methane 2000.00 0 0 1E+30CH4 Product to Methane 2000.00 0 0 0Refurbish. To OSU Academics 80.42 1000 1E+30 1080OSU Topsoil Amendments 5.70 20 1E+30 351 Compost to OSU Landscape 13.50 29.91 1E+30 19.91Paper to OSU Purchasing 108.12 75 1E+30 287.4
24

Not every arc within the network was utilized, as they were not part of the optimal
solution. The optimal flow is given in tons and some are constrained by capacity conditions.
Profit or cost per unit flow are the prices that were entered into the original formulation. Finally,
the lower and upper bounds represent the range of flow amounts that the given solution will
remain optimal. As noted in table 2, the majority of the flows have an infinite upper bound
flexibility.
Furthermore, table 3 contains the network flows constrained by the capacity constraints.
Processes that are filled to capacity yield insights into the most desirable processes for the OSU
network. The shadow price represents the unit price or cost associated with increasing constraint
value, as long as the constraint value remains within the bound limits. Table 3: Illustrates processes constrained by capacity
Constraint Identifier Optimal
Flow Shadow
Price Constraint
Value Upper Bound
Lower Bound
Novelis Capacity 0 0.00 3500000 1.E+30 3,500,000Rumpke Capacity 432 0.00 250000 1.E+30 249,568Kurtz Digestor Capacity 57 35.10 57 256 57Waterman Pad Capacity 68 10.93 67.5 256 68OSU Surplus 80 0.00 80.42 1.E+30 0
Finally, the following table (table 4) highlights the main findings that result from the
optimal solution.
Table 4: Overall summary of results from the OSU Eco-Flow™ model
OSU NETWORK PERFORMANCE SUMMARY FROM ECO-FLOW™
Waste Generated 5537.6Cost to disposal for OSU
-$119,326
Waste Landfilled 500.9
Savings within system from closed loop interactions $93,016
Waste Diverted 5036.7
Future annual waste costs OSU would pay14 $26,310
Landfill Diversion Rate 91.0%Savings in Waste Disposal15 $290,749
14 Cost to disposal ($119,326) – Savings in network ($93,016) = $26, 310 annually 15 Current disposal costs incurred by OSU ($317,059) – Future disposal costs (26,310) = $290,749 annually
25

DiscussionThe Eco-Flow™ model is a very powerful tool that allows users to take a systems
perspective of a particular network. In this particular study, only the surface potential of the
model was scratched. The model created for this study was mainly based on the economics of
the OSU network, but with appropriate data, emissions and energy can also become an integral
part of the model. This would allow OSU to not only maximize monetary returns in the system,
but also minimize emissions and energy consumption. This could be essential in OSU taking the
lead in becoming an environmentally and economically sustainable campus and community.
Furthermore, there are two levels that exist in the model. The first level is rethinking the
notion of waste in a general sense. In the OSU network, no longer should we assume that wastes
produced on campus are non-value added items; but instead, we can transform this waste into a
product or feedstock to be re-utilized back in the market. As Andrew Mangan of the US
Business Council for Sustainable Development notes, “No longer should we focus on zero-waste,
but 100% product.” In this sense, OSU would be participating in a regional venture to benefit
the greater community in sending less material to the landfill and reducing consumption of raw
material.
The second level is the closed loop that exists only in the OSU system. These closed
loops require every waste generated by OSU to be utilized as a product or feedstock directly
back at OSU. This is the ideal scenario. This allows OSU to use all resources cost effectively
and eco-effectively. Closed loops within the network create “highly industrious, astonishingly
productive and creative”16 usability of materials. The best example currently within the OSU
system is the potential that organic waste provides. Collecting over 200 tons annually from the
dining facilities will yield in the production of hydrogen and carbon dioxide gases that could
serve as the replenishment source for various labs on campus. Compost generated could provide
high quality fertilizer to OSU operations involved with landscaping. Furthermore, anaerobic
digestion yields a solid topsoil amendment product used on the many athletic fields on campus.
In this example, OSU purchases food which the campus community utilizes first. Afterwards,
scraps are then recycled in a manner that allows these original purchases to be continue to be
used in a beneficial way.
16 Chertow, Marian R. "Industrial Symbiosis: Literature and Taxonomy." Annual Review Energy Environment 25 (2000): 314-334. ARJournals. The Ohio State University, Columbus. 14 Apr. 2007. Keyword: industrial symbiosis.
26
The second feedback loop was the focus of this study and was the primary driver in
optimizing the OSU network. It is obvious that the network has not been perfected, as the
overall net profits were a negative value. However, it should be noted that if all these wastes had
instead been sent to the landfill it would have cost OSU $317,059. Therefore, even with an
imperfect system the University saves just under $300,000 in waste management costs. OSU
closed loop savings for many of the potential feedback arcs have not been included in this study
due to their theoretical nature. These additional feedbacks will therefore yield an even greater
positive value within the system. Furthermore, with the existing network over 5000 tons of waste
of diverted from the landfill on an annual basis. This is nearly ten times the amount of waste that
is currently diverted from the landfill. This result is an essential enhancement of OSU’s triple
bottom line.
Also, it is clear that processes that return profits back to the OSU system are favorable to
the optimal solution. This is best seen in the capacity results (table 3.) Processes that include
Kurtz Brother’s anaerobic digestor, composting at Waterman farm, and refurbishing electronics
at OSU Surplus are all operating at full capacity. Capacity constraints are defined by lack of
resources and space available at the University to have a fully functioning program. However, it
is evident the savings they generate offer positive benefits to the OSU network and are perhaps
worth investing in for the future to increase capacity.
It should be noted an ideal feedback loop does exist for all wastes generated at OSU.
Ultimately, OSU is not in the waste management business and thus it is not in their interest to
establish, for example, a recycling processing facility on campus. This however does create
issues in closing all OSU loops. Recyclables generated create the largest problem in this realm.
OSU does not benefit from the direct utility of recycled sheet metal or plastic from a mill. In this
scenario, a general feedback to the economic market makes more sense and simultaneously
continues to enhance OSU’s triple bottom line.
Recommendations Further data would enhance the model to show the balance of economic and
environmental benefits to OSU. For example, straight economics show it is more cost-effective
for OSU to purchase virgin paper in comparison to post-consumer recycled content material.
However, a systems perspective shows that utilizing the feedbacks within the system illustrates
27
that purchasing post-consumer recycled content paper is a more desirable decision. This would
be most effectively shown with energy and emissions data included as part of the current model
as was discussed in the Discussion section. Energy data will require intense inquiry as energy
consumed for each process as well as alternative measures (eg. producing paper from virgin
materials) must be integrated into the model. Emissions from these processes as well as
transportation could also yield key insights into the OSU network.
Additionally, feedback loops within the OSU network should continue to be analyzed.
For example, utilizing methane gas and other GHGs on campus is a real possibility. However,
logistics and prices must be investigated further before they can become an integral part of the
network. The study has proposed several of these theoretical feedback loops including providing
hydrogen to the CAR filling station and methane to perhaps generate electricity on campus.
However, additional loops must continue to be explored. Academic departments, students affairs,
and the purchasing department should also be questioned thoroughly as to evaluate all needs for
various resources across campus. The purchasing department, specifically, has a unique
potential to be an integral part of resourcefully creating additional OSU closed loops. Essentially
they control all inputs into the system which can greatly influence the outputs. Smart decisions
by the purchasing department can lead to an even more effective OSU waste management
network.
Furthermore, in this study a more comprehensive operations research solution would
have integrated the OSU feedback loops and general market feedback loops. This would most
effectively illustrate 1) the benefits to OSU, economically and ecologically, and 2) the regional
benefits created by OSU becoming more industrious with their waste.
28

References 1. Allen, Frederick W. "Material Flows Accounts." Journal of Industrial Ecology 9 (2006): 8-12.
2. Baas, L. W., and F A. Boons. "An Industrial Ecology Project in Practice: Exploring the
Boudaries of Decision-Making Levels in Regional Industrial Systems." Journal of
Cleaner Production 12 (2004): 1073-1085.
3. Before the Cap and Gown: the Capstone. Purdue University. 2003. 7 May 2007
<http://www.asabe.org/Educate/Feb_2003_R/capstone.html>.
4. Chertow, Marian R. "Industrial Symbiosis: Literature and Taxonomy." Annual Review
Energy Environment 25 (2000): 314-334. ARJournals. The Ohio State University,
Columbus. 14 Apr. 2007. Keyword: industrial symbiosis.
5. Davitt, Nadine. Penn State University. Telephone interview. 4 May 2007.
6. Eco-Flow - Industrial Ecology Network Model. Columbus, OH: Center for Resilience, 2006.
7. Hoff, Martha. The Ohio State University. E-Mail interview. Mar.-Apr. 2007.
8. Kurup, Biji, William Altham, and Rene Van Berkel. "Triple Bottom Line Accounting
Applied for Industrial Symbiosis." ALCAS Conference (2005): 1-14.
9. Levine, Stephen H. "Comparing Products and Production in Ecological and Industrial
Systems." Journal of Industrial Ecology 7 (2003): 33-42.
10. Michel, Fred. The Ohio State University – OARDC. E-Mail interview. 8 Apr. 2007.
11. Moriguchi, Yuichi. "Recycling and Waste Management From the Viewpoint of Material
Flow Accounting." Material Cycles Waste Management 1 (1999): 2-9. The Ohio State
University, Columbus. Keyword: Material Flow Accounting.
12. Peck, Steven. Industrial Ecology: From Theory to Practice. Learned Societies Conference,
1996, Environmental Studies Association of Canada. 13 Dec. 2006.
29
30
13. "Results - Grand Champion." Recycle Mania. 15 Apr. 2007. National Recycling Coalition. 7
Mar. 2007 <http://www.recyclemaniacs.org/results-2007.asp?Type=G>.
14. "Standard Volume-to-Weight Conversions." Chart. Minnesota: Multiple Sources, 2006.
15. Themelis, Nickolas J., and Priscilla A. Ulloa. "Methane Generation in Landfills." Renewable
Energy 32 (2007): 1243-1257.
16. Redman, Tina. The Ohio State University Personal interview. Mar.-Apr. 2007.
17. Udo De Haes, Helias A. "Life-Cycle Assessment and the Use of Broad Indicators." Journal
of Industrial Ecology 10 (2006): 5-7.
18. "Volume-to-Weight Conversion Factors." Chart. National Recycling Coalition; EPA;
FEECO; CIWMB. 30 Apr. 2007
<http://www.nmenv.state.nm.us/SWB/doc/Conversiontable.doc>.
19. Widmer, Rolf, Heidi Oswald-Krapf, Deepali Sinha-Khetriwal, Max Schnellmann, and
Heinz Boeni. "Global Perspectives on E-Waste." Environmental Impact Assessment
Review 25 (2005): 436-458.

31
Residence Halls#1
Academic Buildings
#2
Laboratories#3
RecreationFacilities
#4
DiningFacilities
#5
MaintenanceBuildings
#6
Organic Waste
#13
OSU ElectronicWaste
#14
Cardboard #12
Rumpke Recycling
#37
SWACO Landfill
#36FirmGreen
#39
Kurtz Digestor#32
Composting atWaterman
Farm#40
Refurbished Electronics
#58
Plastics#51
Metals#50
Paper#52
Compost#57
Methane Gas#53
CleanHarbors
#41
Waste Flow
Commodity Flow
Flow to Landfill
Process Interaction
OSU Commodity Flow
OSU Surplus#34
Cardboard#54
Business Builders
Fundraiser
#74
Beneficial to OSU –Economically and Ecologically
Academic Dept Buyback
Electronics
#76
OSU Landscape Fertilizer #75
Novelis#30
MRF#31
Intechra#33
Shredder#35
AD CleanGas#15
Ad Gas Clean#38
CO2 Prod#17
CH4 Prod#18
Hydrogen#55
Greenhouses#56
OSU Purchasing #71
CAR filling Station #73
TopSoilAmendments #77
Renewable Energy
Portfolio #72
RecyclablesPlastic
AluminumPaper #11
Plastic
Mixed SolidWaste
#10
Reynolds Transfer
#19
Fibers#59
Plastic Benches
FABE #78
OSU Waste Network
Appendix A
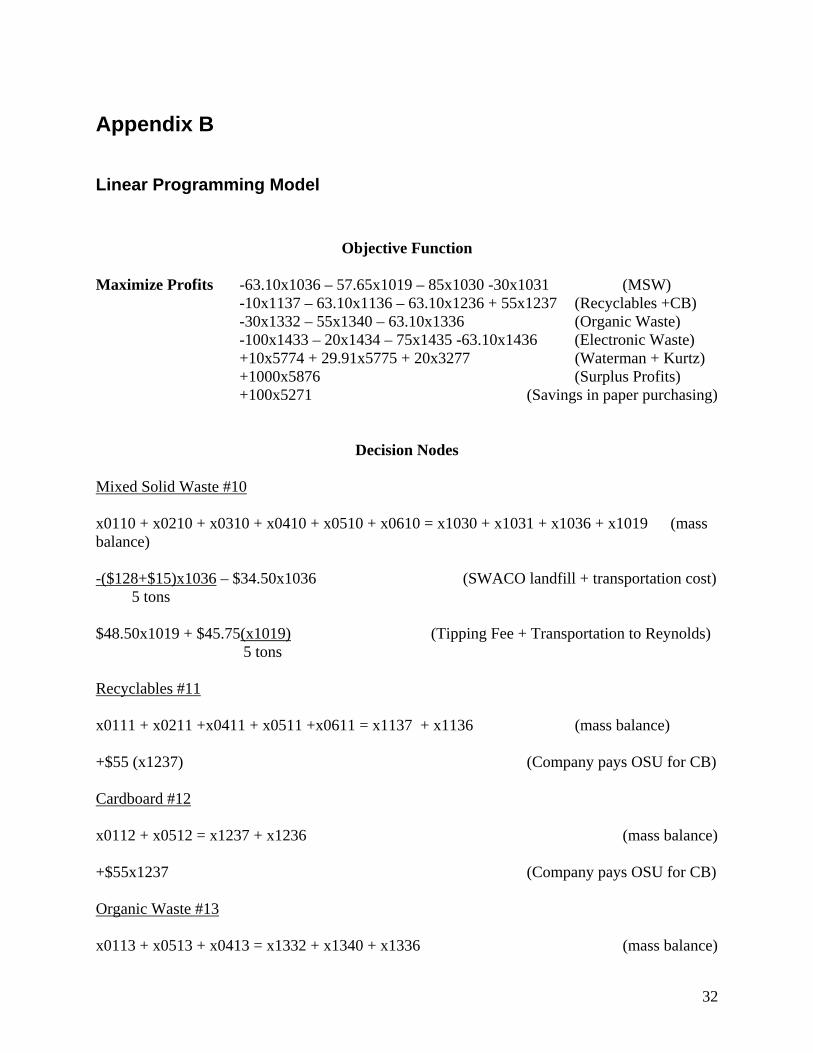
Appendix B
Linear Programming Model
Objective Function
Maximize Profits -63.10x1036 – 57.65x10¹⁹ – 85x1030 -30x1031 (MSW) -10x1137 – 63.10x1136 – 63.10x1236 + 55x1237 (Recyclables +CB) -30x1332 – 55x1340 – 63.10x1336 (Organic Waste) -100x1433 – 20x1434 – 75x1435 -63.10x1436 (Electronic Waste) +10x5774 + 29.91x5775 + 20x3277 (Waterman + Kurtz) +1000x5876 (Surplus Profits) +100x5271 (Savings in paper purchasing)
Decision Nodes Mixed Solid Waste #10 x0110 + x0210 + x0310 + x0410 + x0510 + x0610 = x1030 + x1031 + x1036 + x1019 (mass balance) -($128+$15)x1036 – $34.50x1036 (SWACO landfill + transportation cost) 5 tons $48.50x10¹⁹ + $45.75(x1019) (Tipping Fee + Transportation to Reynolds) 5 tons Recyclables #11 x0111 + x0211 +x0411 + x0511 +x0611 = x1137 + x1136 (mass balance) +$55 (x1237) (Company pays OSU for CB) Cardboard #12 x0112 + x0512 = x1237 + x1236 (mass balance) +$55x1237 (Company pays OSU for CB) Organic Waste #13 x0113 + x0513 + x0413 = x1332 + x1340 + x1336 (mass balance)
32

+$40(.2(x1340)) (profit per ton of compost at Waterman) -$30x1332 (organic waste to Kurtz Brothers) -$63x1336 (organic waste to landfill) Electronic Waste #14 x0214 = x1435 + x1434 + x1433 + x1436 (mass balance) .5x0214 = x1433 (Ewaste to Intechra) .3x0214 = x1435 (Ewaste to Shredder) .15x0214 = x1434 (Ewaste to Surplus) .05x0214 = x1436 (Ewaste to Landfill) Clean AD Gas #15 x3215 = x1538 + x1539 (mass balance) FirmGreen Gas to Products #16 x1539 = x3917 + x3918 (mass balance) CH4 Production #18 x3918 = x1855 + x1853 (mass balance) CO2 Production #17 x3917 = x1756 (mass balance) Reynolds Transfer #19 x1019 + x3019 = x1936 + x1931 (mass balance) -$48.50x10¹⁹ - $45.75(x1019/5) (tipping plus transport fee to OSU)
33

Process Nodes Novelis #30 x1030 = x3031 + x3050 + x3019 (mass balance) .12x1030 = x3050 (Metals Output) .88x1030 = x3019 (Waste Output) x1030 < 350,000 (Capacity) -$85x1030 (OSU charged per ton) MRF (WastAway) #31 .97(x1031 + x3031 + x1931) = x3136 + x3159 + x3150 + x3151 (mass balance) .12(x1031 + x3031 + x1931) = x3150 (Metals in System) .2(x1031 + x3031 + x1931) = x3151 (Plastics Output) .6(x1031 + x3031 + x1931) = x3159 (Fibers output) .05(x1031 + x3031 + x1931) = x3136 (to landfill) -$30x1031 (Tipping fee) Intechra #33 x1433 = x3341 (Intechra to Clean Harbors) -100x1433 (Cost to OSU for Intechra’s Service) OSU Surplus #34 x1434 = x3458 (Reburbished Ewaste) x3458 = x5876 (Bought back by OSU depts.)
34

$1000x5876 (Profits made) x1434 <80.42 (Surplus capacity) Shredder #35 x1435 = x3536 (Shreds to Landfill) -$75x3536 (Cost to OSU for Shredder’s Services) Recycling #37 x1137 + x1237 = x3750 + x3751 + x3752 + x3754 + x3736 + (mass balance) .5x1137 = x3752 (paper recycling) .2x1137 = x3751 (plastic recycling) .25x1137 = x3750 (metal recycling) .05x1137 + .05x1237 = x3736 (unrecyclables to landfill) .5x3752 = x5271 (recycled content to OSU paper) x1137 + x1237 <250,000 (capacity) -$10x1137 (processing cost) +$55x1237 (cardboard profit) Kurtz Digestor #32 .114832x1332 = x3215 + x3236 + x3257 (mass balance) .004832x1332 = x3215 (AD Gas Separation) .01x1332 = x3236 (AD Waste to Landfill) .1x1332 = x3277 (AD Solids to Topsoil) x1332 < 57 (Capacity: 15% of organic waste) -$30x1332 (Processing Cost for OSU)
35
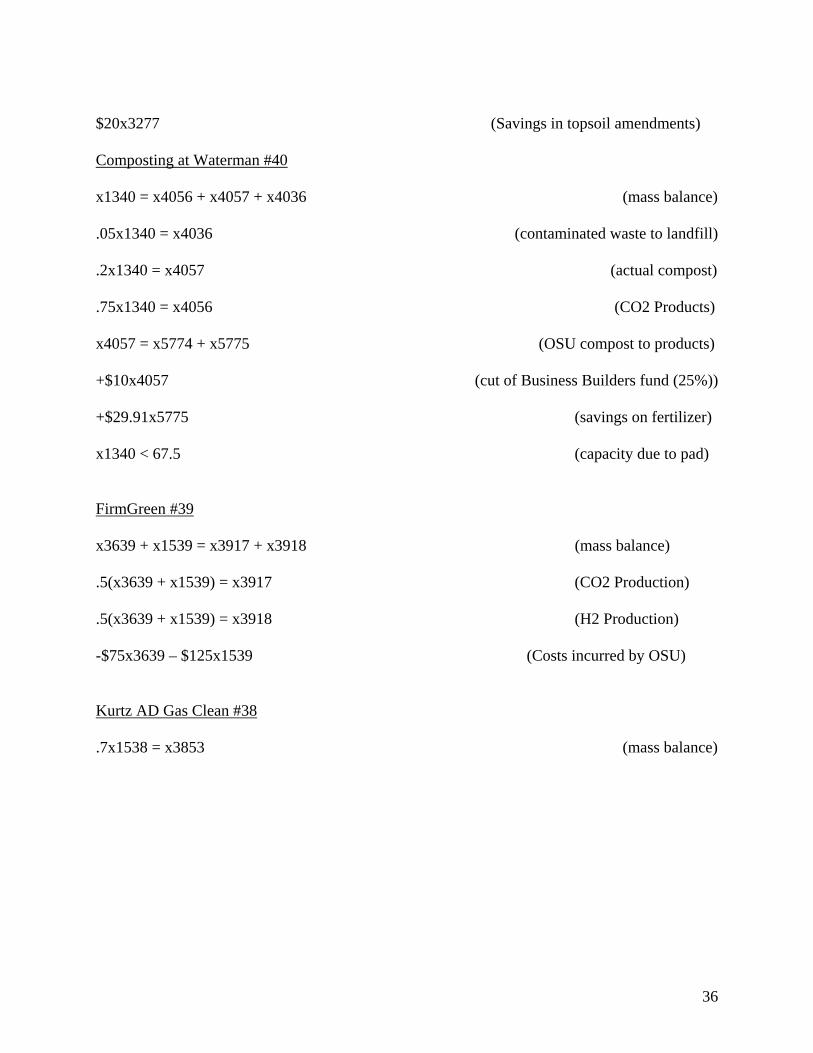
$20x3277 (Savings in topsoil amendments) Composting at Waterman #40 x1340 = x4056 + x4057 + x4036 (mass balance) .05x1340 = x4036 (contaminated waste to landfill) .2x1340 = x4057 (actual compost) .75x1340 = x4056 (CO2 Products) x4057 = x5774 + x5775 (OSU compost to products) +$10x4057 (cut of Business Builders fund (25%)) +$29.91x5775 (savings on fertilizer) x1340 < 67.5 (capacity due to pad) FirmGreen #39 x3639 + x1539 = x3917 + x3918 (mass balance) .5(x3639 + x1539) = x3917 (CO2 Production) .5(x3639 + x1539) = x3918 (H2 Production) -$75x3639 – $125x1539 (Costs incurred by OSU) Kurtz AD Gas Clean #38 .7x1538 = x3853 (mass balance)
36

Appendix C Recycling
Residence Halls numbers based on:
Total Residence Halls = 35
Annual numbers based on a three month period (January – March, Winter Quarter 2006)
Average tons recycled in period: 34.58 tons
Tons of recyclables annually: 3 quarters x 34.58 tons = 103.74
**Please note these numbers are slightly skewed as they are based only on collection data
during winter quarter.**
Dining Facilities numbers based on:
Total Dining facilities with recorded data: 3
Annual numbers based on a three month period (January – March, Winter Quarter 2006)
Average tons recycled in period: 5.75 tons
Tons of recyclables annually: (5.75 tons/3) * 5 dining facilities who collect recyclables *3
quarters in a year = 55.1
Academic Building numbers based on:
Total Academic Buildings with recorded data: 5
Annual numbers based on September 2005 – May 2006
Average tons recycled in period: 6.47 tons
Tons of recyclables annually: (6.47 tons/5 buildings) *120 academic buildings located on
campus = 131.99
Recreation Facilities numbers based on:
Total Academic Buildings with recorded data: 1 (RPAC)
Annual numbers based on pilot program data (November 2006 – February 2007)
Average tons recycled in period: 1.95
Tons of recyclables annually: (1.95 tons * 16 collection recreation facilities)/4 months * 9
months of operation = 70.2
37

Maintenance Building numbers based on:
Total Maintenance with recorded data: 2
Annual numbers based on pilot program data (November 2006 – February 2007)
Average tons recycled in period: 3.97
Tons of recyclables annually: ((3.97 tons in 2 buildings) * 8 (for 16 facilities))/4 months * 9
months of operation = 71.46
Table 5: Illustration of recycling extrapolated data
Type of Waste Inputs Tons
Cardboard (tons)
Multiplying factor
Adjusted Tons
Adjusted Cardboard
Recyclables Residence Halls 34.58 17.5 3 103.74 52.50
Academic Buildings 6.47 20.4 131.99
Labs 0.00 0 0 0.00
Recreation facilities 1.95 4 70.20
Dining Facilities 5.75 6.648 9.583333333 55.10 28.75
Maintenance
Buildings 3.97 2 71.46
Total tons
annually: 432.49 81.25
38

Types of Recyclables from each facility:
Residence Halls ('05 '06 RM data)
17%
24%
34%
22%
3%
Aluminum/Plastic
Mixed Paper
Cardboard
Newspaper
Steel
24%
Figure 6: Distribution of the type of recyclables generated from the residence halls.
Dining Halls
53%
11%
29%
5% 2%
Cardboard Aluminum/PlasticMixed PaperNewspaperSteel
39

Figure 7: Distribution of the typ enerated from the dining halls. e of recyclables g
Academic Bldgs
24%
73%
3%
Newspaper
Mixed Paper
Cans/Alum.
Figure 8: Distribution of the type of recyclables generated from the academic buildings.
Appendix D Dining Facilities
Assumed days of operation for each facility: Commons (Kennedy and Morrill): 3 quarters * 11 weeks = 33 weeks of operation * 7 days = 231 days . 1 week North: 3 quarters * 11 weeks +10 weeks of summer = 33 weeks of operation * 7 days 1 week = 301 days Mirror Lake Café: 3 quarters * 11 weeks = 33 weeks of operation * 7 days = 231 days . 1 week
40

Oxley’s by the Numbers:
s +10 weeks of summer = 33 weeks of operation * 5 days 3 quarters * 11 week = 215 days 1 week
quarters * 11 weeks +10 weeks of summer = 33 weeks of operation * 7 days
RPAC: 3 = 301 days
1 week Campus Grind: 3 quarters * 11 weeks = 33 weeks of operation * 5 days = 165 days .
days
1 week Marketplace: 3 quarters * 11 weeks +10 weeks of summer = 33 weeks of operation * 7 = 301 days
1 week Viewpoint Bistro: 3 quarters * 11 weeks = 33 weeks of operation * 5 days = 165 days .
1 week Pizza at the Drake (PAD): 3 quarters * 11 weeks = 33 weeks of operation * 7 days = 231 days .
1 week
y y ton/lbs tons/yr Dining Facilit lbs/da gal/day days/yr ft3/gal lb/ft3*
Kennedy Commons 120 231 0.133681 18 0.0005 13.86
Morrill Commons 120 231 0.0005 13.86
North Commons 120 301 0.0005 18.06
Buckeye Express** 350 231 0.0005 121.28
RPAC 30 0.0005 4.52 301
Mirror Lake 60 231 0.133681 18 0.0005 16.68
Oxleys by the #s 100 215 0.133681 18 0.0005 10.75
Campus Grind 0.0005 0.00 165 0.133681 18
MarketPlace 40 301 0.133681 18 0.0005 14.49
PAD 5 231 0.0005 0.58
Viewp nt 60 0.133681 18 0.0005 11.91oi 165
Total Annual Food Waste: 225.97
*Assumi t Volume-to-ng bread conversion from “S andard Weight Conversion Factors”
41

**There are 3 Buckeye Expresses on campus.
***Ac //www.n ate W o ntcording to http: menv.st .nm.us/S B/doc/C nversio able.doc
Appendix E
Waterman Farms Compost pad Capacity Assum feet x 12 feet x 4 feet = 4800 cubic feet 4800 ft3 x
e use of largest windrow available: 100
1 m3 = 136 cubic me s 35.31 ft3
3
ter
Average Density of Compost = 450 kg/m 450 kg/m3 * 136 cubic meters = 61200 kg * 2.2 lbs * .0005 tons = 67.32 tons 1 kg
1 lb.
**Windrow and Density data provided by Dr. Fred Michel, associate professor of Food, Agriculture, and Biological Engineering at The Ohio State University.**
Pad
12 feet * 100 feet = 1200 square feet * 1 acre * $200,000 = $5,509.64 43560 ft2 1 acre
rman Capacity Wate
Cost of Composting
42