Physical Synthesis Buffer Insertion, Gate Sizing, Wire Sizing,

Optimizing the cost efficiency for internal sizing of kraftliner paper grades
Niklas Bergvall
Degree Project in Engineering Chemistry, 30 hp
Report passed: June 2013
Supervisors:
Hanna Bellander, Smurfit Kappa Kraftliner
William Larsson, Umeå University

Foreword This degree project has been carried out at the quality department at Smurfit Kappa Krafliner
in Piteå between January and June 2013 as a completion of my education in engineering
chemistry at Umeå University.
I would like to thank my supervisor at Smurfit Kappa, Hanna Bellander, for support and
guidance during the work, as well as Marianne Tollander for assigning the project to me.
Other people that deserve acknowledgements are Rosa Johansson, Ann Hedqvist, Gösta
Karlsson, Ann-Catrin Berggren, Ann-Cristin Bäckman and all machine operators at PM1. I
would also like to thank all personnel at the quality department, which have not already been
mentioned, for their friendliness and helpfulness. Also thanks to my supervisor at Umeå
University, William Larsson, for insightful and helpful comments on the report.
Niklas Bergvall
Piteå, June 2013


Abstract Hydrophobicity is an important property for Kraftliner paper grades and is accomplished by
adding chemicals, referred to as internal sizing agents, to the stock before it enters the paper
machine. The paper’s resistance to wetting is assessed with the Cobb test for which there
exists specified rejection limits that must not be exceeded. The aim of this thesis work has
been to investigate if the cost efficiency for the internal sizing process can be improved and
suggest ways by which all specified requirements regarding hydrophobicity can be met to a
minimum expenditure. Process- and production data for years 2011 and 2012 has been
examined with both traditional and multivariate methods. Two machine trials have been
performed at paper machine 1 and, based upon these, a change of target value for Cobb
measured on the base layer is suggested which would result in estimated annual savings of 2,1
MSEK. For paper machine 2, recommended changes to the action limits for Cobb60 measured
on the top layer are provided, based on results from the data analysis. The intention of the
modifications is to reduce the risk of producing paper with too low hydrophobicity, as well as
to counteract the addition of excessive amounts of sizing agent when not necessary.


Table of Contents 1 Introduction ...................................................................................................................... 1
2 Theory ............................................................................................................................... 2
2.1 Kraftliner production at Smurfit Kappa Kraftliner, Piteå ........................................................ 2
2.2 Water absorption in paper ....................................................................................................... 4
2.3 The Cobb test ........................................................................................................................... 6
2.4 Aluminum chemistry ............................................................................................................... 7
2.5 Internal sizing ........................................................................................................................ 11
2.5.1 Rosin sizing .................................................................................................................... 12
2.5.2 Alkenyl succinic anhydride (ASA) sizing ....................................................................... 17
2.6 Factors to consider in the sizing process ............................................................................... 19
2.7 Multivariate data analysis (MVDA) ...................................................................................... 23
3 Data analysis ................................................................................................................... 24
3.1 Method................................................................................................................................... 24
3.2 Results and discussion ........................................................................................................... 25
3.2.1 Trends at PM1 ............................................................................................................... 26
3.2.2 Trends at PM2 ............................................................................................................... 29
3.2.3 Dependence of Cobb values on basis weights ............................................................... 37
3.2.4 Sizing stability ............................................................................................................... 42
3.2.5 Correlations between Cobb values ................................................................................ 44
3.2.6 Multivariate data analysis ............................................................................................. 48
4 Machine trials ................................................................................................................. 51
4.1 Machine trial 1 at PM1 .......................................................................................................... 51
4.1.1 Method ........................................................................................................................... 51
4.1.2 Results and discussion ................................................................................................... 52
4.2 Machine trial 2 at PM1 .......................................................................................................... 53
4.2.1 Method ........................................................................................................................... 54
4.2.2 Results and discussion ................................................................................................... 54
5 Conclusions ...................................................................................................................... 58
6 Recommendations for the future ................................................................................... 59
7 References ........................................................................................................................ 62
Appendix A: Coefficient plots from the multivariate data analysis
Appendix B: Machine trial 1
Appendix C: Machine trial 2


1
1 Introduction Hydrophobicity is an important property of kraftliner and for that reason sizing agents are
added to the stock during the papermaking process in order to achieve an appropriate degree
of water resistance in the final product. Two methods are used to evaluate the quality of the
paper in this aspect, Cobb60 and Cobb1800. In the testing procedure, paper is placed in
contact with water for 60 respectively 1800 seconds and the absorption of water is measured
gravimetrically. Rejection limits (maximum and minimum) for Cobb60 have been in place for
a long time, while Cobb1800 has been used as a complementary method. In “Smurfit Kappa
Paper Specifications version 4”, issued 2011-12-01, a maximum rejection limit for Cobb1800,
measured on the top layer, was introduced for Kraft grades to be implemented from January
2012. The purpose of the new requirement was to assure the hydrophobicity of the paper, in
particular for “Dangerous gods” applications. When comparing the year of 2011 with 2012,
the consumption of sizing agent at PM2 has increased with 10%, corresponding to a cost
increase of about 1 MSEK.
The current target values as well as action and reject limits for all three performed Cobb tests
are displayed in Table 1. The targets and limits for the Cobb tests are identical for both paper
mahcines at Smurfit Kappa Kraftliner in Piteå; paper machine one (PM1) and paper machine
two (PM2). Notice that no target or lower limits exist for Cobb1800. The rejection limits for
Cobb60 on the base layer, however, are only internal limits and no customer specifications
exist with any requirements for this value. This means that the rejection limits for the base
layer could be altered, provided it does not compromise the results of the other tests.
Lower
rejection limit Lower Action
Limit Target Upper Action
limit Upper
rejection limit Cobb60(Top)
(g/m2)
22 27 30 33 40
Cobb60(Base)
(g/m2)
22 27 30 33 50
Cobb1800
(g/m2) 145 155
Table 1: The targets and limits for the Cobb tests.
Not much information is available on the effect of Cobb60 on the base layer for the results of
Cobb1800 measured on the top. A reasonable assumption is that the long duration of the
Cobb1800 test might give the water enough time to penetrate through the whole top layer and
thereby also cause the hydrophobicity of the base layer to affect the result of the test. Another
factory within the Smurfit Kappa group, located in Nettingsdorfer, has reported that a target
value of 40 for Cobb on the base layer can be used while still achieving good values for
Cobb1800. However, in that case the top layer constitutes around 50% of the total paper
compared to PM1 in Piteå where the top layer makes up 20-30% of the entire sheet. Due to
this, it is uncertain if a higher target value would compromise the values of Cobb1800.
The aim of this project has been to
2
Optimize the dosage of sizing agent, so that all requirements regarding hydrophobicity
are met to a minimum expenditure.
Investigate if Cobb60 specifications (target and rejection limits) can be modified while
still maintaining the requirement for Cobb1800.
2 Theory
2.1 Kraftliner production at Smurfit Kappa
Kraftliner, Piteå Kraftliner paper grades constitute the outer surface layer of corrugated board for packaging
applications and Smurfit Kappa in Piteå is Europe’s largest producer of this sort of paper with
a yearly capacity of 700 000 tons [1]. Under normal conditions, most pulp is produced
internally and includes unbleached softwood pulp, recycled pulp and bleached birch pulp.
PM1 produces brown paper qualities and PM2 produces paper with a white top layer. Also
paper with a mottled surface is produced occasionally at PM2 but the volume is
comparatively low.
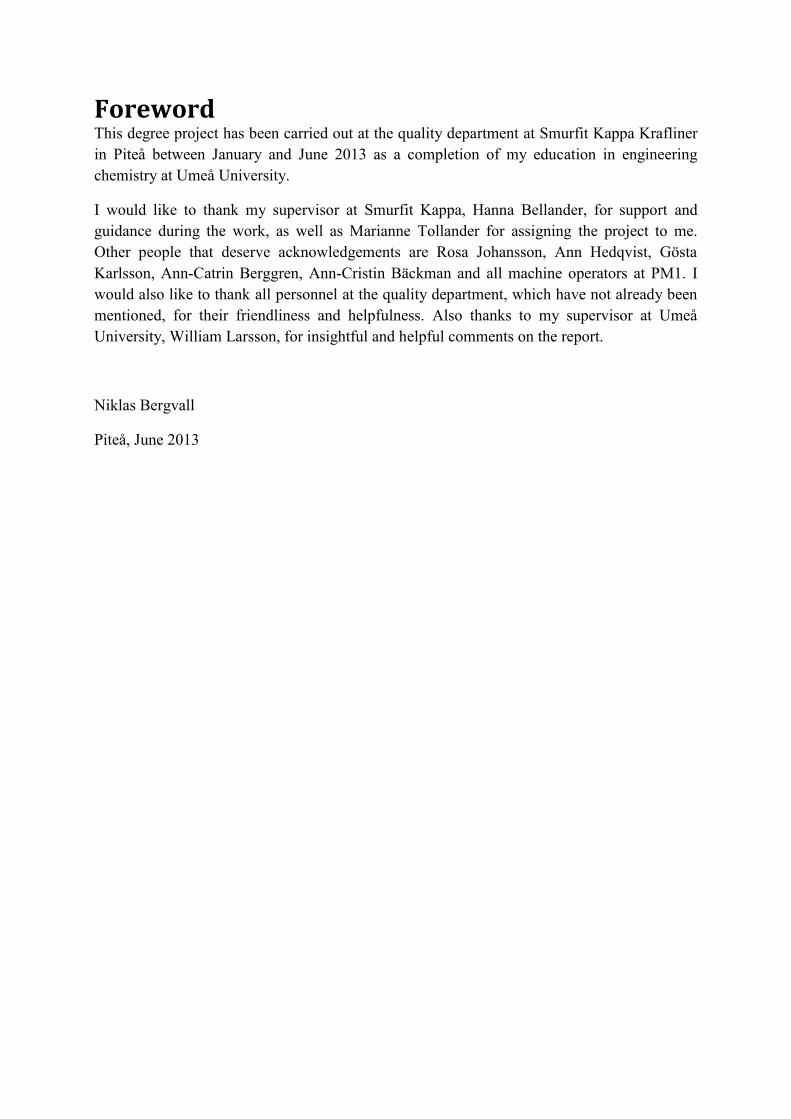
Figure 1: Flowchart of the stock preparation.
Figure 1 describes the main principle of the stock preparation procedure. The different pulps
that will form one of the two layers that constitute the whole paper sheet are mixed together
and ground in mills before reaching the machine chest. In the left part of the machine chest in
figure 1 the pulp is mixed with sulfuric acid if adjustment of pH is necessary. The mixture, at
this point referred to as thick stock, is circulated to the right part of the machine chest and
alum is sometimes added before pump 1 depending on the properties of the stock. From the
right part of the machine chest the thick stock is pumped towards the headbox of the paper
machine and is diluted with water from the wire pit along the way. Before pump 2, alum and
rosin size (if used) is added. Additional process chemicals are added to the stock before it
reaches the headbox. The flow chart presented in figure 1 only shows the main principle of
the stock preparation and the process varies somewhat between paper machines and also
3
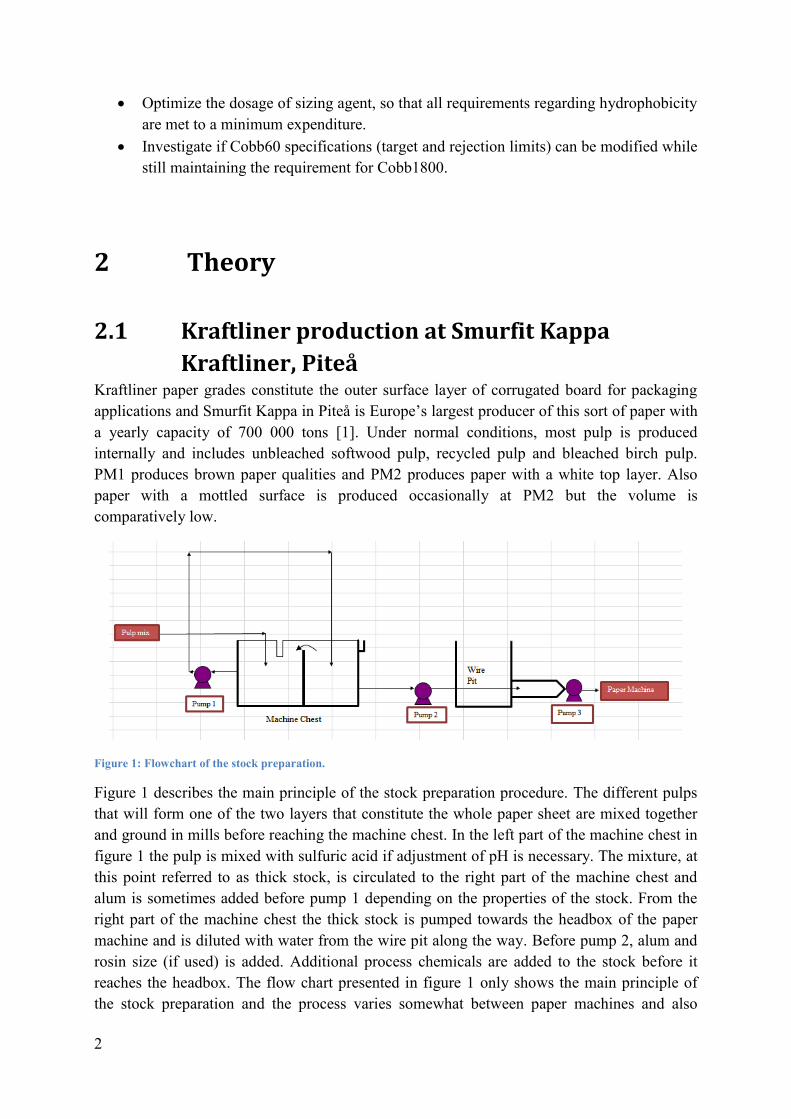
between base and top layer on a paper machine. Stock treatment steps such as screening and
beating have been omitted. The composition of the stocks and the usage of some important
chemical additives as well as typical pH-values for the machine chests are summarized in
table 2 for the top and base layer on both paper machines. It should be noted that the usage of
recycled fiber on the base layer of PM2 is quite rare and normally, no recycled fibers at all are
used. If alum is indicated by “early and late”, addition is made both before pump 1 and 2 in
figure 1.
PM1 Base PM1 Top PM2 Base PM2 Top
Pulp
composition
Recycled
(25-50%)
Unbleached
Softwood
(30-60%)
Broke (10-30%)
Unbleached Softwood
(100%)
Recycled (0-10%)
Unbleached Softwood
(60-80%)
Broke (10-40%)
Bleached Birch
(100%)
Sheet
distribution
70-80% 20-30% Increases with basis
weight
Around 75 g/m2
Sizing Agent ASA Rosin Rosin Rosin
Alum Early and late Early and late Early and late Late
Filler (Clay) No No No Yes
Typical pH
(machine chest)
6,3 5,3 5,3 5,6
Table 2: Summary of important factors for the top and base layer on both paper machines.
Once the stock reaches the headbox, the solids content has been decreased from 3-4% in the
machine chest to less than 1% and is called thin stock. The headbox distributes the fiber
suspension onto the forming section of the paper machine. Since the produced sheets of paper
are made up of two separate layers, the stocks to each one have an individual preparation
procedure before entering the paper machine and also the forming sections are separate. The
wire transporting the stock is made up of a thin mesh that allows water to pass through but
have openings small enough that fibers will be retained to a high degree. The water passing
through the mesh enters the wire pit and is used over again (after treatment) in the dilution of
the thick stock, a process which is referred to as the short water circuit. Before reaching the
press section the two layers that will constitute the whole paper are merged on top of each
other. The objective with the press section is to increase the dry content of the paper web,
which is accomplished by passing it through a series of two closely spaced rolls constituting a
press nip. After the pressing section, the paper enters the drying section, which passes the
paper over several steam-heated cylinders to cause evaporation of the remaining water. The
finished paper leaving the drying section has a dry content of around 90% and is collected in
large paper rells called tambours.
PM1 produces paper of the main quality grade “Royal Brown” which is made with basis
weights ranging from 115 g/m2 to 300 g/m
2. At PM2 there are two main quality grades that
dominate; “Royal White” and “Royal 2000”. The former is produced of basis weights from
115 to 240 g/m2 and contain around 7% clay as filler, while Royal 2000 is produced of basis
weights between 115 and 175 g/m2 with roughly 3% clay. All main qualities can also have
special sub-qualities such as extra strong or extra sized paper in addition to the standard
product. The basis weights are adjusted by varying the speed at which the paper machines are

4
run; at high basis weights the machine speeds are slower and at lower basis weights the
machines run faster. The approximate speed intervals are 400-950 m/min for PM1 and 500-
900 m/min for PM2. A difference between the two paper machines is that, at PM1 the base
layer is formed on the bottom former and the top layer is formed the top former, whereas for
PM2 the applies.
2.2 Water absorption in paper For a solid, smooth surface that is partially covered with a liquid there exist three interfacial
energies; between solid and liquid (γSL), solid and vapor (γSV) and between liquid and vapor
(γLV). If the following inequality holds
the total surface energy will be minimized if the liquid spreads on the solid surface and thus
minimizes the high-energy interfacial area between solid and vapor. If the inequality is not
true, the liquid will not spread unhindered on the solid. In this case, if a drop is placed on the
solid surface, it will adopt a characteristic contact angle (θ) between the solid and liquid [2].
Figure 2: Contact angle between solid and liquid.
Provided the system is in equilibrium, that the surface is completely smooth and that the solid
phase is not swelling, the following relationship exists (Young´s equation):
The contact angle is a measure of the spreading ability of the liquid on the solid and indicates
how much the solid and liquid attract each other compared to the liquid´s attraction to itself
[3]. High contact angles are realized when there is a low attraction between the solid and
liquid (high ) whereas lower contact angles occur when there is a high attraction between
solid and liquid (low ). Paper that has not been sized in any way is hydrophilic (and
therefore have a high surface energy), meaning that it readily absorbs water and has a contact
angle close to zero. Sizing of the paper makes it more hydrophobic, thus preventing
absorption of water and causes water drops that are placed on its surface to attain larger
contact angles.
A paper surface can, very schematically, be described as a series of air-filled capillaries as
illustrated in figure 3. If a water drop is placed on the paper, the water can either fill the pores

5
(capillaries) between the fibers or absorb into the fibers. Fibers are naturally very hygroscopic
and a process where water transfers into the fibers, via the vapor phase or diffusion inside the
fibers, starts directly when water is put in contact with the paper. Although impossible to fully
prevent, diffusion inside fibers is quite slow. A potentially faster absorption mechanism,
affected to a larger degree by sizing, is the penetration of water into the pores between fibers
[3]. Figure 3 shows the difference between paper that is sized (right part) and paper that is not
(left part).
Figure 3: Schematic picture of a water drop on paper that is hydrophobic (right) and paper that is not hydrophobic
(left) [3].
When a liquid meets a porous structure such as paper, the liquid´s meniscus becomes curved
due to intermolecular forces between the liquid and solid [4]. The surface tension causes a
pressure difference that can be expressed by Young-Laplace´s equation. Assuming a
cylindrical capillary with constant radius r, and that the liquid forms a finite contact angle θ,
with the capillary wall, the capillary pressure PC, can be written
where denotes the surface tension of the liquid. According to this equation, a contact angle
smaller than 90º causes the capillary pressure to be positive and wetting of the capillary wall
will occur as well as sorption. The opposite is true for contact angles larger than 90º. This
phenomenon is illustrated in figure 4.
Figure 4: Capillary forces when contact angle is smaller than 90º (left) and larger than 90º (right)
The capillary pressure is balanced by resistance to flow according to Poisseuille´s equation:
6
In this equation, is the depth of penetration, is the rate of penetration (dl/dt) and η is the
viscosity of the liquid. Realizing that the capillary pressure plus a possible external pressure
PE, is equal to the resistance to flow at equilibrium we get
The solution to this differential equation is called the Lucas-Washburn equation and shows
that the depth of penetration is proportional to the square root of time.
√
√
The Lucas-Washburn equation is valid only for a single capillary or several identical parallel
capillaries that are not connected with each other. This, of course, is not true for paper where
the pores consist of a complicated system of connected cavities and channels of different
sizes. Moreover, the pore radius will increase due to swelling of the fibers when contacted
with water and the contact angle will change as a result of molecular processes in the wetting
zone [2]. Despite this, the equation can still allow for qualitative conclusions. To obtain a
paper with low capillary absorption of water, two things are necessary; small pore radius (low
r) and a low surface energy of the fibers, leading to large contact angles. A fiber naturally has
a high surface energy due to the many hydrophilic groups on its surface but attachment of
chemicals with low surface energy (such as ones containing hydrocarbon chains) will cause
water to form large contact angles with the fibers and thus prevent capillary sorption. It
should be realized that lowering the surface energy of the fibers only will have a small effect
on the water-repellency if the pores are large.
There are several tests available to assess the hydrophobic properties of paper. Among these,
the results can vary widely and have poor correlation [4]. The reason for this is that absorption
of liquid in paper is a complicated process involving phenomena such as swelling and
diffusion plus structural and surface-chemical effects. Nevertheless, several methods are used
as industrial standards and are often included in the specification for a paper grade. For
Kraftliner grades, the Cobb test is used to assess the product´s hydrophobicity and the
procedure for such a test will be described in next section.
2.3 The Cobb test The Cobb test measures the water absorption of paper when it is put in contact with water and
the correct execution is defined by the Tappi test method T-441 om-09 [5]. To perform the
test, a sheet of paper of appropriate size is prepared and weighed to an accuracy of 1mg
before placed on the base plate of a device according to figure 5. The ring is mounted on top

7
of the paper and clamped in place to portion off a surface of 100cm2, whereupon 100 ml of
distilled water is poured onto the paper. For a Cobb60 test the paper is left in contact with the
water for 45 seconds before the water is removed and the ring quickly unclamped. The paper
is put on top of a dry blotting paper on a solid surface with the test-side pointing upwards. 60
seconds after the commencement of the test another blotting paper is put on top of the test
piece and excess water is removed by using a specific hand roller with a smooth metal surface
and a weight of 10 kg. Two rollings should be used (forward and back) without any applied
pressure. The test paper is weighed again and the water absorption is calculated as the weight
difference of the paper before and after the test and reported in units of g/m2. Thus, a low
value means that the paper can be considered more hydrophobic than a paper with a high
value. The Cobb1800 test is performed in the same manner as Cobb60 except that the time is
1800 seconds in total. The only other modification is that blotting papers are weighed in along
with the test paper and mounted on the bottom of the device in order to absorb water that
might penetrate the whole test paper.
Figure 5: The instrument used for the Cobb test [5].
2.4 Aluminum chemistry Alum (Al2(SO4)3x14H2O) is a chemical that is widely used in the papermaking process and is
very relevant for sizing, especially when using rosin, as will be discussed in section 2.5.1.
The high charge (3+) and small radius of the aluminum ions gives it properties that are
suitable for the retention and fixation of rosin in the paper [2]. Aluminum coordinates strongly
to the ligands H2O, OH-, SO4
2- and R-COO
- and forms octahedral complexes with six
ligands. Aluminum can also form polynuclear complexes that arise by a process referred to as
olation, wherein hydroxyl bridges are formed as in figure 6.

8
Figure 6: General principle for the formation of polynuclear aluminum complexes through olation.
In aqueous solutions, aluminum acts as a weak acid and hydrolyzes according to the general
formula [Al(H2O)6] 3+
↔ [Al(H2O)6-x(OH)x] 3-x
+ xH+ and hence, addition of alum buffers the
pH to acidic levels, which practically restricts its usefulness for papermaking in the alkaline
region.
Figure 7: Distribution of hydrolyzed Al(III) as a function of pH. Al(III) = 10-4 M [6].
In figure 7, the speciation of aluminum species as a function of pH from the work of Rubin
and Hayden is shown [6]. At strongly acidic pH (<4) the main form of aluminum is the
hexahydrate cation, [(Al(H2O)6]3+
, while [Al(H2O)5(OH)]
2+ form to a slight extent as the pH
is increased. In the figure, the water ligands have been omitted. At a narrow pH interval
around 5, the dominant species was found to be the octomeric complex [Al8(OH)20]
4+. Several
complexes with similar size were indicated but the mentioned one fitted the experimental data
best. The polynuclear aluminum species is in equilibrium with Al(OH)3, which starts to
precipitate when the concentration of [Al8(OH)20]
4+ is at its maximum level. The precipitate
is the main aluminum species up to slightly alkaline pH where aluminate ions, [Al(OH)4]-,
start to form due to the high concentration of hydroxyl ions. More recent research has
provided evidence for a more complicated polymerization behavior of aluminum [7].
Apparently there exists a wide variety of polynuclear complexes and the concentration of
them as well as their size is largely dependent on pH. This is illustrated in figure 8.

9
Figure 8: Distribution of aluminum species as a function of pH. [AlCl3]= 1,5 x 10⁻⁴ [7].
At pH 3, mainly small species are present whereas at pH 5, larger, but still soluble multivalent
complexes form. Raising the pH even more causes the large complexes to decompose to
smaller species or form flocs of Al(OH)3 (denoted as Alu in the figure). From figure 8 it is
clear that the large complexes (Al11-Al21) have a peak around pH 5 which agrees somewhat
with the results in figure 7, although there is no distinct polymeric specie. The possibility for
aluminum to form polynuclear complexes have proven important for papermaking chemistry
because the increase in size and decrease in electrical charge density that results, causes them
to be less soluble in water but still have a high affinity for the carboxylic groups on cellulose
due to their cationic nature [8].
Arnson (1980) studied the adsorption of aluminum onto cellulosic fibers and found that the
two most influential factors were pH and the concentration of aluminum [9]. The results are
illustrated well by figure 9. There is a sharp increase in adsorption that coincides with the pH
where polynuclear complexes start to form (here again represented by [Al8(OH)20]4+
). As the
concentration of aluminum is increased, the formation of these species start at a lower pH and
the adsorption also starts at more acidic levels. The degree to which the polynuclear
compound forms also increases with the concentration of aluminum.

10
Figure 9: The adsorption of aluminum as a function of pH. The lower part of the figure depicts the distribution of
aluminum species for reference [9].
The results in figure 9 were achieved with AlCl3 as source of aluminum. However, the
adsorption of aluminum on cellulose when using Al2(SO4)3 was also investigated in the same
study. It was found that the behavior was equal, with a sharp increase in adsorption, but the
increase occurred at a slightly lower pH (0,2-0,3 units). Interestingly, a higher total adsorption
of aluminum from the sulfate salt than the chloride salt was observed. Sulfate ions, as
mentioned earlier, form strong complexes with aluminum which causes them to be
incorporated into the complexes where they can function as bridging ligands between
aluminum ions and thus compete with hydroxyl ions. The exchange of hydroxyl ions for
sulfate ions decreases the positive charges of the species that adsorb on cellulose fibers in the
papermaking furnish. Due to this it is assumed that there is less electrostatic repulsion
between the adsorbed and the unadsorbed aluminum complex which lead to greater total
adsorption [10]. As a comparison, the AlCl3 system has a much greater ability to recharge the
fibers and thus decreases the extent of further deposition of aluminum species, leading to a
lesser adsorption, as illustrated by figure 10.

11
Figure 10: A comparison between the adsorption of aluminum for AlCl3 and Al2(SO4)3. [Al] = 1,5 x 10⁻⁴. [9]
The steep increase in adsorption that occurs can be explained by the deposition of colloidal
polynuclear species onto the components of the furnish [4]. At a pH above 5 the colloidal
polynuclear complexes diminishes and insoluble aluminum hydroxide stay deposited on the
fibers. The cationic charge of the deposited aluminum species decreases with time and the rate
at which it does is enhanced at higher pH due to the bonding of OH- ions to the cationic sites
[11]. A weak cationic charge makes it less suitable for retaining anionic components [12] and
consequently there is a balance that needs to be considered between the adsorption of
aluminum onto fibers and the decreasing charge when deciding upon an optimal pH for
application of alum. Another factor to keep in mind is that a too high pH when using alum can
lead to problems with deposits of Al(OH)3 [13].
In summary, the adsorption of aluminum onto cellulosic fibers depends largely on the
polynuclear species that are formed within a narrow pH interval. The precise location of this
interval is hard to determine for a real papermaking scenario since there are many influencing
factors, including the aluminum concentration and the presence of counterions.
2.5 Internal sizing The procedure of adding chemical additives during the papermaking process to provide the
paper with hydrophobic properties is referred to as sizing. Internal sizing is by far the most
common method to make paper water-repellant and implies that the sizing agents are
introduced at the wet-end of the paper machine [4]. Surface sizing is another option but will
not be covered here since it is not utilized in the production of Kraftliner in Piteå.
Six conditions need to be fulfilled for an internal sizing agent to be effective [14]. The sizing
agent must:
12
1. Include a hydrophobic part, such as a long alkyl group.
2. Become well dispersed after addition to the stock.
3. Remain in its active form for a sufficiently long period of time.
4. Be retained in the paper.
5. Become well distributed in the paper by the time it has been dried.
6. Anchor and orient itself to provide a stable and efficient sizing.
Sizing of paper is a complex subject and there are several factors affecting the choice of
sizing agent, including which type of paper that is produced and its end-usage, the pH at the
wet-end and the use of fillers [13]. There are also numerous aspects to consider in order to
implement the sizing agent in an optimal way, such as amount, point of addition, pH and
possible interactions with other components of the furnish.
Traditionally, sizing has been achieved with rosin under acidic conditions and it is still today
a widely used method. There are several advantages associated with rosin sizing, including a
relatively cheap price, natural occurrence, ease of operation due to a gradual response curve
and compatibility with other wet-end additives [14,15]. However, there are also some
drawbacks with rosin sizing; the acidic conditions can cause yellowing and embrittlement of
the paper with time, risk corrosion to the paper machine and do not agree well with calcium
carbonate as filler [4]. Because of these disadvantages, many mills have changed to neutral or
alkaline papermaking conditions and new sizing agents that work well within this pH region
have been developed. Currently there are three main types of sizing agents that dominate in
the paper industry; rosin, alkenyl succinic anhydride (ASA) and alkyl ketene dimer (AKD).
As shown in table 1, rosin is used as sizing agent for both layers at PM2 and the top layer at
PM1, whereas ASA is used for sizing the surface layer at PM1. The main reason for using
ASA in the base of PM1 is the extensive use of recycled pulp in that case. Large quantities of
paper is today produced with calcium carbonate as filler, which of course ends up in the
recycled pulp and complicate the usage of the rosin sizing system [4]. A great advantage of
having acidic conditions where unbleached softwood is used is that naturally occurring
extractives can be beneficial for the sizing. This will be discussed further in the coming
sections.
Since rosin and ASA are utilized at Smurfit Kappa in Piteå, they will be discussed in the
coming sections whereas sizing with AKD will not be covered. Section 2.6 provides a range
of factors to consider when sizing paper.
2.5.1 Rosin sizing Rosin is a complex mixture of closely related materials found in softwoods and can constitute
as much as 1-2% of the dry mass of wood from a pine tree [14]. The rosin mixture contains
around 87-90% of diterpene acids, normally just called rosin acids [4]. Of the rosin acids,
seven isomers of abietic acid are most abundant. The commercial sizing agents available
today are so-called partially fortified rosins where additional carboxyl groups have been
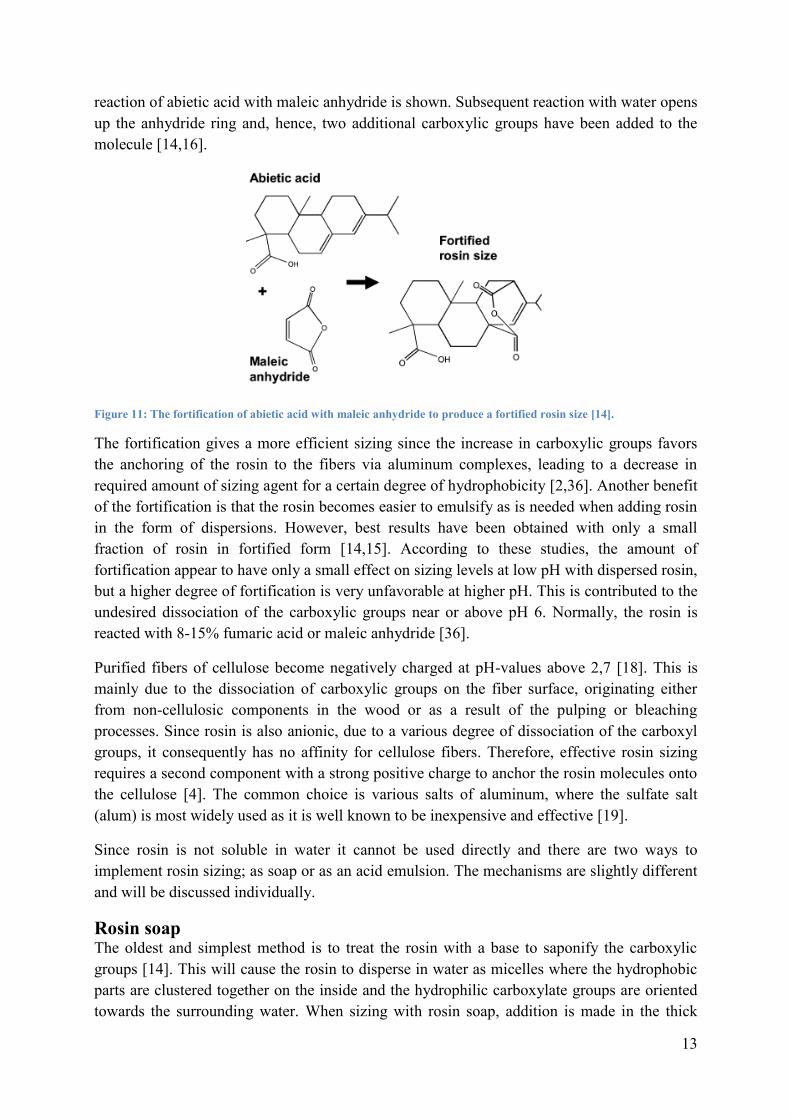
introduced by a Diels-Alder reaction with maleic anhydride or fumaric acid. In figure 11, the
13
reaction of abietic acid with maleic anhydride is shown. Subsequent reaction with water opens
up the anhydride ring and, hence, two additional carboxylic groups have been added to the
molecule [14,16].
Figure 11: The fortification of abietic acid with maleic anhydride to produce a fortified rosin size [14].
The fortification gives a more efficient sizing since the increase in carboxylic groups favors
the anchoring of the rosin to the fibers via aluminum complexes, leading to a decrease in
required amount of sizing agent for a certain degree of hydrophobicity [2,36]. Another benefit
of the fortification is that the rosin becomes easier to emulsify as is needed when adding rosin
in the form of dispersions. However, best results have been obtained with only a small
fraction of rosin in fortified form [14,15]. According to these studies, the amount of
fortification appear to have only a small effect on sizing levels at low pH with dispersed rosin,
but a higher degree of fortification is very unfavorable at higher pH. This is contributed to the
undesired dissociation of the carboxylic groups near or above pH 6. Normally, the rosin is
reacted with 8-15% fumaric acid or maleic anhydride [36].
Purified fibers of cellulose become negatively charged at pH-values above 2,7 [18]. This is
mainly due to the dissociation of carboxylic groups on the fiber surface, originating either
from non-cellulosic components in the wood or as a result of the pulping or bleaching
processes. Since rosin is also anionic, due to a various degree of dissociation of the carboxyl
groups, it consequently has no affinity for cellulose fibers. Therefore, effective rosin sizing
requires a second component with a strong positive charge to anchor the rosin molecules onto
the cellulose [4]. The common choice is various salts of aluminum, where the sulfate salt
(alum) is most widely used as it is well known to be inexpensive and effective [19].
Since rosin is not soluble in water it cannot be used directly and there are two ways to
implement rosin sizing; as soap or as an acid emulsion. The mechanisms are slightly different
and will be discussed individually.
Rosin soap
The oldest and simplest method is to treat the rosin with a base to saponify the carboxylic
groups [14]. This will cause the rosin to disperse in water as micelles where the hydrophobic
parts are clustered together on the inside and the hydrophilic carboxylate groups are oriented
towards the surrounding water. When sizing with rosin soap, addition is made in the thick

14
stock along with alum, which yields precipitation of colloidal particles of aluminum resinates
[2]. The reactions taking place between aluminum and rosin molecules are shown below (1-3)
with the abbreviation HAb meaning abietic acid, which is here used to represent the rosin [4].
(1)
(2)
(3)
The products formed in reaction 1-3 are insoluble in water and aggregate to form a precipitate
which is positively charged at acidic pH. This precipitate becomes attached onto the cellulosic
fibers, as well as other anionic components of the furnish, by electrostatic interaction and
provide hydrophobicity to the paper. The chemical composition corresponds approximately to
a mix of di-resinates and rosin acid [13]. The melting temperature of the precipitate is
relatively high and no modification takes place in the drying section of the paper machine.
Since the reactions 1-3 are dependent on soluble aluminum species, sizing with rosin soap
requires an acidic pH. Literature suggests that best results have been achieved within a pH
range of 3,8 and 4,5 [14] where and
are the dominating
species, while others mean that a pH up to 5 is working well with soap sizes [2,13,19].
However, it seems that the required content of rosin for a certain degree of sizing increases
with higher pH [2]. The exact pH range is of course dependent on the papermaking system as
a whole and may vary considerably from case to case.
For the effect of sizing with rosin in soap form, the particle size is critical and a finely
dispersed precipitate is preferred. However, agglomeration always takes place to some extent
and is increased with high concentration of soap, high electrolyte concentration, high
temperature and contact time. Electrolytes can also interfere with the retention of the
precipitate on fibers by decreasing the electrostatic attraction between fibers and precipitate
[2].
Rosin dispersions To emulsify rosin acid, it is treated with high shear equipment, heated above its melting point
and stabilized with either cationic or anionic starch or polymer which yields submicron
particles of free rosin acid with a surface layer of stabilizer. Because only a fraction of the
rosin acid molecules are located on the surface of the dispersed particles and since the free
rosin acid is sparingly soluble in water, there is no opportunity for direct reaction with alum as
in the case with soap. Instead, the alum and rosin acid particles must be retained in their
original forms on the fibers during the forming and pressing section of the paper machine.
The rosin acid dispersion particles have a softening temperature of around 60º C which causes
them to spread over the fiber surfaces in the drying section of the paper machine. Upon
spreading, the rosin molecules can react with deposited aluminum species on the fibers and
form aluminum resinates, which provide the paper with a hydrophobic character [2,4,13,20].
15
Aluminum species adsorbs on the fiber surfaces, mainly at the carboxylated sites [19] where
they can function as cationic sites for retention of rosin particles that are stabilized with
anionic dispersants. In the case of cationic dispersions the rosin acid particles become self-
retaining on the anionically charged fibers, which decreases the demand for alum compared to
anionic emulsions [13,20,21,36]. However, the presence of some alum is critical even though
self-retaining cationic dispersions are used and no sizing will develop without the addition of
alum since no aluminum resinates will form to anchor and orient the rosin. Cationic
dispersion have also in many cases been shown to be more efficient compared to anionic
dispersions [20,21,36].
The better coverage of the fibers with sizing agent arising from the lower melting point of
rosin acid compared to the precipitate that forms in soap sizing is believed to account for the
increased sizing efficiency observed from dispersed rosin compared to soap rosin [4,13].
Another advantage with dispersed rosin compared to sizing with rosin soap is that it tends to
give stronger paper [2,3]. This is thought to be because in the case of saponified rosin, the
hydrophobic part is already present during the forming of the paper, which might negatively
affect the establishment of fiber-fiber bonds and thus the strength properties of the final
product.
As described in section 2.4, the adsorption of aluminum species increases drastically at a
certain point around pH 5, when the pH is raised. At the same time, the cationic charge of the
adsorbed aluminum species decreases with increasing pH, making it less suitable for retention
of rosin particles when the paper is formed, since hydroxyl ions will compete with rosin for
complexation with the aluminum. Al(OH)3 that form at a pH between 5 and 6 are also less
reactive towards the free rosin acid than the polymeric species and therefore have a negative
impact on the formation of aluminum resinates, which reduces the sizing efficiency [21].
Hence, the pH must be optimized in such a way that aluminum species adsorb on the
cellulosic fibers but still have a sufficient cationic charge, and that a large fraction is present
in the form of polymeric species.
Aside from the aluminum chemistry, there are a couple reasons why rosin sizing is
problematic at neutral or alkaline pH [2]. The formation of rosin soap is one, which is
enhanced at higher pH and can result in overturning and thereby loss of sizing. One key
reason for using neutral-alkaline papermaking conditions is that it enables the use of CaCO3
as filler or facilitates the usage of recycled paper containing CaCO3. Since pH is buffered to
7,5-8,5 by the carbonate [4,21], it is not appropriate to use with rosin/alum sizing. Acidic pH
causes the CaCO3 to dissolve and can along with alum lead to deposit problems of CaSO4 as
well as high levels of Ca2+
in the white water which can be detrimental [4]. Carbon dioxide is
also formed from the carbonate, which produces foam [21].
Literature often suggests ranges wherein conventional sizing with dispersed rosin and alum
work well, without specifying any clear conditions. Examples of ranges are a pH between 4,5
and 5,5 [19], 4,2-5,0 [2], 4,6-5,5 [4], 4,2-5,5 [24] or around 5 [25]. Despite the issues related
to rosin sizing at neutral-alkaline pH, a lot of research has been undertaken to make it work in
a satisfactory way. One simple process modification that can be used is to minimize the time

16
that the aluminum spend in an unfavorable environment by setting the addition point as late as
possible. The higher the pH in the headbox pH and the higher the stock temperature, the later
the addition point should be [13,21]. A method that has shown very good results is to premix
the rosin dispersion with aluminum compounds before addition to the stock, preferably at low
temperature and low concentration [15,22,32,38]. The positive effect of premixing was
greater at high water hardness levels [15,38]. In one case it has been proposed that premixing
alum with dispersed rosin can lead to a slight optimum at pH 6, followed by a decrease in
efficiency at higher pH [18].
Substitutions for alum have also been proposed, one promising being polyaluminum chloride
(PAC). PAC can be prepared by partial neutralization of aluminum chloride under rather
specific conditions, which results in a mixture where polymeric materials dominate, especially
the species with the composition Al13O4(OH)24+7
[2,13]. The difference between PAC and
alum is that addition of PAC does not depress pH to the same extent as an equal amount of
alum would since it is partially neutralized and also, PAC has a greater cationic charge at high
pH levels which makes it more reactive with rosin [4,13]. It has been shown that good results
with rosin sizing can be achieved at a pH just over 7 by premixing dispersed rosin with PAC
[15,32].
Another way of facilitating rosin sizing at higher pH is to use cationic polymers or starches
for the preparation of the rosin acid emulsions and thereby decrease the dependence on proper
aluminum species for retention of the sizing agent in the wet-end and consequently, the pH
becomes less critical [13,19,21,22]. Even though cationic dispersions have been used, it has in
some cases been shown that the sizing degree decreases at pH 6 relative to pH 5 [16,17].
Some cationic dispersion products show a weak dependency on pH above 4,5 with a small
optimum at pH 5,5 [20] or pH 6 [21], followed by a rather steep decrease in efficiency. Other
sources suggest that, for a setup with cationically dispersed rosin, a pH over 6 is doable,
provided the correct application, such as late addition point or premixing, but does not
comment on the optimum pH [13,24].
Other investigated options for rosin sizing in the neutral range concern the usage of cationic
polymers for retention of anionic dispersion particles. Polymers have been used either
exclusively or in conjunction with alum [15,18,25]. It has been shown that the sizing response
can decline quite rapidly above pH 5, but that this decline can be reduced by using cationic
polymers along with alum [18]. One study showed that by using a dual-retention system of
alum plus polymers, the retention of both rosin size and alum in the paper could be greatly
improved at a pH of 7,5, which led to an improved sizing [25]. It was also shown that the
addition of polymers could inhibit the hydrolysis of alum species at a pH of 7,5 and enhance
the proportion of cationic aluminum complexes, which is thought to be due to coordination
reactions between aluminum and polymers that compete with reactions involving OH-. In the
same study, paper was sized with polymers exclusively and the result was a critical decrease
in sizing degree, even though the retention of rosin size was high, which indicate that
polymers cannot orient the rosin molecules as efficiently as alum. Other studies have also
shown good results with various forms of polymers along with alum [15].

17
It is obviously very hard to exactly specify an optimal pH for the implementation of dispersed
rosin sizes because it depends on a lot of factors, including the type of dispersion
(anionic/cationic), addition procedure and the retention system. It seems, based on the
literature review on the subject, that rosin sizing works best up to a pH of about 5,5 but can be
used successfully at higher pH, although it places greater demands on the correct application.
One important factor to consider in rosin sizing is the amount of aluminum species added. As
previously noted, the demand of alum is lower for cationic than for anionic rosin dispersions
since alum is not needed for retention of rosin particles in the wet-end. However, some alum
is still needed for the reaction in the drying section. Too low addition of alum can
compromise the sizing result whereas too much alum increases the risk of deposition
problems, especially at higher pH where Al(OH)3 is formed [13]. One source suggests that a
normal alum:rosin mass ratio is between 1:1 and 2:1 [33]. Studies on premixing of anionic
rosin size with alum have shown that an optimal ratio between alum and size is 1,5 on a
weight-to-weight basis [22,38]. One study compared the sizing effect of anionic and cationic
rosin with a fixed addition level of size (0,35%) and three addition levels of alum (0,25; 1,0
and 1,8%) [20]. The anionic size suffered critically at the lowest addition level of alum, while
the cationic size maintained its performance with only 0,25% alum added. Obviously, the
addition levels of alum can vary from case to case, which is a probable explanation why many
books on sizing and papermaking refrain from commenting the ratio between rosin and alum,
although some indications to a reasonable application have been given here.
For reference, the rosin size product currently being used at Smurfit Kappa in Piteå is fortified
with fumaric acid and dispersed with cationic polyamine. The product also contains a small
amount of alum in the supplied mixture (alum:rosin around 1:5).
2.5.2 Alkenyl succinic anhydride (ASA) sizing ASA was first developed for paper sizing in 1974 and became widely used during the 1980s,
particularly in the USA [14]. The production of ASA is carried out by reacting maleic
anhydride with an isomerized mixture of alkenes consisting of 14-20 carbon atoms. Too short
alkenes result in a less effective sizing agent whereas too long chains give a product that is
solid at room temperature and less suitable for emulsification [18]. ASA has a high chemical
reactivity due to the anhydride group and provide hydrophobicity to paper by forming ester
bonds with hydroxyl groups on the cellulose as in figure 12. Because of its high reactivity it is
also readily hydrolyzed when contacted with water, whereupon a dicarboxylic acid is formed
(figure 12).

18
Figure 12: The reactions of ASA [14].
The formation of ester bonds is critical for the development of sizing effect and such a
reaction is not possible for the hydrolyzed form of ASA [19], which is one reason that the
hydrolysis reaction is highly unwanted. Another reason is that the hydrolyzate can form sticky
deposits with calcium that can impair the runnability of the paper machine [4,19]. ASA that
end up in the white water will become hydrolyzed to a very high degree and because of this,
high first pass retention is a requirement for good results. It should be noted that it has been
challenging to quantify the amount of ester bond formation and some studies report that the
largest fraction of ASA retained in paper is actually in the form of loosely bound dicarboxylic
acid. To explain the necessity of unhydrolyzed ASA for good sizing to develop, it has been
proposed that only the original form of ASA can efficiently distribute onto fiber surfaces. The
somewhat conflicting literature available on the subject has been excellently reviewed by
Hubbe [19].
It is often recommended to use alum, or some other source of aluminum, in conjunction with
ASA. One reason for this is that the formation of sticky calcium salts with the hydrolyzate,
which always form to some extent, can be prevented by using aluminum compounds and
thereby promote the formation of non-sticky aluminum salts instead [2,13,19]. It has also
been shown that alum boosts the efficiency of ASA sizing [19,26,27]. The dicarboxylic acid
that form due to the hydrolysis of ASA can have a desizing effect because it is loosely bound
to the fibers and can overturn in contact with water and thereby expose the carboxylic groups
to the water phase. It has been shown that the positive effect of alum on sizing with ASA can
be attributed to the fact that aluminum can attach the dicarboxylic acid to the fibers, similarly
to the mechanism with rosin, which in that case prevents the ASA from overturning and can
instead add to the sizing of the paper [28]. Addition of alum in the range of 0,5% based on dry
pulp is often recommended when sizing with ASA [4,36].
Since ASA is not soluble in water it needs to be emulsified before addition to the
papermaking system. To minimize the contact time with water the dispersion is normally
prepared on-site just before addition to the stock and the addition point is chosen as late as
possible [13,36]. The dispersion is commonly prepared with high shear equipment, using
cationic starch or polymer as emulsifiers [19]. Another function of the starch or polymer,
aside from stabilizing the emulsion, is to help attach the dispersion droplets to negatively
charged components in the stock. The droplets remain deposited until the drying section
19
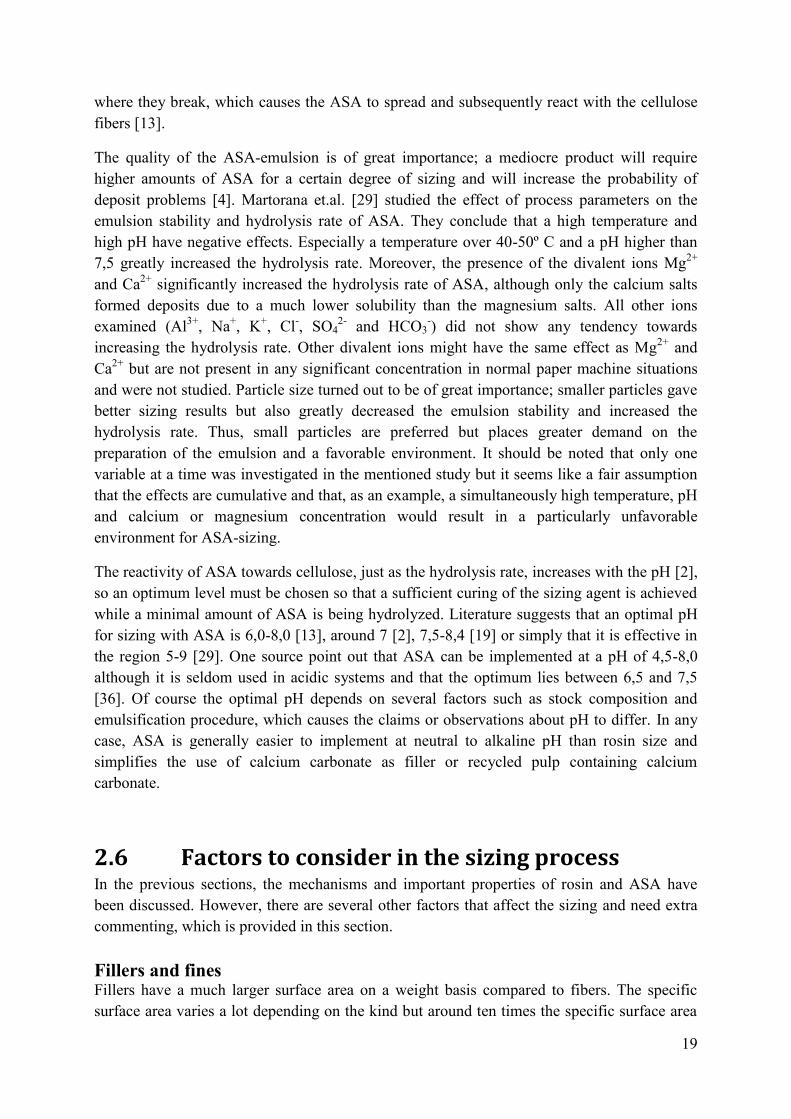
where they break, which causes the ASA to spread and subsequently react with the cellulose
fibers [13].
The quality of the ASA-emulsion is of great importance; a mediocre product will require
higher amounts of ASA for a certain degree of sizing and will increase the probability of
deposit problems [4]. Martorana et.al. [29] studied the effect of process parameters on the
emulsion stability and hydrolysis rate of ASA. They conclude that a high temperature and
high pH have negative effects. Especially a temperature over 40-50º C and a pH higher than
7,5 greatly increased the hydrolysis rate. Moreover, the presence of the divalent ions Mg2+
and Ca2+
significantly increased the hydrolysis rate of ASA, although only the calcium salts
formed deposits due to a much lower solubility than the magnesium salts. All other ions
examined (Al3+
, Na+, K
+, Cl
-, SO4
2- and HCO3
-) did not show any tendency towards
increasing the hydrolysis rate. Other divalent ions might have the same effect as Mg2+
and
Ca2+
but are not present in any significant concentration in normal paper machine situations
and were not studied. Particle size turned out to be of great importance; smaller particles gave
better sizing results but also greatly decreased the emulsion stability and increased the
hydrolysis rate. Thus, small particles are preferred but places greater demand on the
preparation of the emulsion and a favorable environment. It should be noted that only one
variable at a time was investigated in the mentioned study but it seems like a fair assumption
that the effects are cumulative and that, as an example, a simultaneously high temperature, pH
and calcium or magnesium concentration would result in a particularly unfavorable
environment for ASA-sizing.
The reactivity of ASA towards cellulose, just as the hydrolysis rate, increases with the pH [2],
so an optimum level must be chosen so that a sufficient curing of the sizing agent is achieved
while a minimal amount of ASA is being hydrolyzed. Literature suggests that an optimal pH
for sizing with ASA is 6,0-8,0 [13], around 7 [2], 7,5-8,4 [19] or simply that it is effective in
the region 5-9 [29]. One source point out that ASA can be implemented at a pH of 4,5-8,0
although it is seldom used in acidic systems and that the optimum lies between 6,5 and 7,5
[36]. Of course the optimal pH depends on several factors such as stock composition and
emulsification procedure, which causes the claims or observations about pH to differ. In any
case, ASA is generally easier to implement at neutral to alkaline pH than rosin size and
simplifies the use of calcium carbonate as filler or recycled pulp containing calcium
carbonate.
2.6 Factors to consider in the sizing process In the previous sections, the mechanisms and important properties of rosin and ASA have
been discussed. However, there are several other factors that affect the sizing and need extra
commenting, which is provided in this section.
Fillers and fines Fillers have a much larger surface area on a weight basis compared to fibers. The specific
surface area varies a lot depending on the kind but around ten times the specific surface area

20
of fibers is common. Clay, which is the choice of filler at Smurfit Kappa in Piteå, has a
specific surface area of 8-10 m2/g whereas the specific surface area of a fiber is normally
within 1-1,5 m2/g [13]. Most fillers, just like fibers, attain an anionic charge in the
papermaking system. Due to their anionic charge and large surface areas, a great proportion of
the size particles will get attached to the filler particles in the wet-end instead of the fibers and
since the filler particles are retained in the paper to a lesser degree than fibers during the
formation section, the result is that some sizing agent is lost to the white water. Moreover,
filler particles cannot be efficiently sized since there are no reactive sites that ASA can
covalently bind to when spreading occur in the drying section and aluminum resinate cannot
be efficiently anchored to them due to the lack of carboxylic groups [2]. Hence, the effect of
fillers is that the required amount of sizing agent to achieve good hydrophobicity increases as
the total surface area increases [2,4,13,33]. Fines are very small fiber fractions and the amount
depends mainly on the extent of refining of the stock, where a more refined stock and
recycled pulp generally has more fines than virgin pulp [34,36]. A typical surface area for a
fines particle is 6-8 m2/g [13,33] and, obviously, the size demand is going to increase with the
amount of fines for the same reason as for fillers. Fines, just like fillers, are retained in the
paper to a lower degree than fibers, leading to loss of size particles that are attached to them
[4,33,36].
Anionic Trash The term anionic trash is used to describe the unwanted fine particle materials that are present
in the papermaking system and which tend to have a high surface area and to be negatively
charged. Anionic trash can be of various origins such as carbon black or adhesives from inks
of recycled paper, soluble lignin or bleach residues [13]. In the case of sizing with ASA or
dispersed cationic rosin, a large fraction of the cationic emulsion droplets will be retained on
the anionic trash materials due to their large surface area and negative charge [35]. These
particles are in turn retained in the paper to a lower extent because of their small size, which
leads to loss of sizing agent to the white water [33]. High levels of anionic trash will consume
added aluminum species, which can be especially detrimental to rosin sizing [13], but also
ASA sizing will suffer [40]. Due to this, it is often recommended to first add a sufficient
amount of alum to ensure that alum added later on will be available for retention and reaction
with the rosin [4,36]. However, cationic polymers are generally more effective at neutralizing
the anionic trash due to a higher cationic charge, especially at neutral-alkaline pH. Addition of
alum or cationic polymers before the addition of sizing agent causes flocculation of the
anionic trash and thus decreases the surface area of the particles while at the same time
decreasing the anionic charge [13,35].
Electrolytes Electrolytes such as Mg
2+, Ca
2+ and Na
+ can compete with aluminum and form salts of rosin
that do not provide any hydrophobic properties to the paper. These cations do not form
polymeric species as aluminum does and are less cationic than Al3+
or its polymeric forms and
are therefore harder to retain on the fibers [13]. A high melting temperature of the unwanted
salts inhibits spreading in the drying section which prevents adequate sizing effect to develop.
Agglomeration of rosin particles is also more probable as the repellency between them

21
decrease with higher electrolyte content [36]. As discussed earlier, Mg2+
and Ca2+
increases
the hydrolysis rate of ASA and therefore interfere with the sizing.
Extractives Especially in unbleached softwood pulps there are various residual amounts of natural rosins
available that can contribute to the sizing of paper, provided the pH is not too high and that
alum is available to anchor the rosin to the fibers [2,13,19]. The implication of this is that a
too high pH can result in a considerably loss of sizing effect from the naturally occurring
rosin in the pulp. Johnson [13] suggests that the positive contribution is lost at a pH above 5,0
since the rosin is not modified in any way (dispersed or fortified). A positive effect can also
be achieved with ASA, provided alum is used in conjunction and that the pH is not too high.
In general, hardwood pulps are harder to size than softwood pulps, and bleached pulp is
harder to size than unbleached pulp, due to lowered levels of beneficial extractives [20,21,36].
Stock temperature A high stock temperature has already been concluded to have a negative effect on ASA sizing
by increasing the hydrolysis rate, although the extent to which it affects the sizing was not
discussed. In one study, handsheets were made at pulp temperatures of 20, 40 and 60º C, with
the result that the sizing decreased by over 40% at 60º C compared to 20º C [41]. The
decrease in sizing between 40 and 60º C were nearly 30%.
High temperature, is also unfavorable for rosin sizing [12,13,16,17]. One cause of this is that
hydroxylation of cationic aluminum compounds with OH- is enhanced at higher temperatures,
leading to a decreased cationic charge of the aluminum species adsorbed on the pulp fibers
and in turn less retention of rosin size in the paper [12]. Since a high pH also decreases the
cationic charge on aluminum species, a simultaneously high stock temperature and pH can be
especially unfavorable for rosin sizing. Agglomeration of rosin particles can also be increased
at higher temperatures, leading to a poor size distribution and consequently a lesser degree of
hydrophobicity [13,15,19]. In general, rosin sizing under hot temperatures work better with a
dispersed size than soap size because they are less dependent on alum chemistry.
Additionally, cationic dispersions require less alum for retention than anionic dispersions do
and can therefore handle high stock temperatures better [13].
Drying temperature Another factor that is important for the sizing is the drying procedure. For sizing with
dispersed rosin, high moisture and temperature in the early parts of the drying section of the
paper machine should be avoided since the water removal as steam can disrupt size
precipitation and cause agglomeration of precipitates instead of spreading. A more optimal
drying profile is to slowly increase the temperature until the middle of the drying section and
then cool towards the end. A similar drying regime is also recommended for sizing with ASA.
A simultaneously high moisture and temperature causes ASA to hydrolyze and react at similar
rates and greatly reduces the efficiency. An optimal drying should first reduce the moisture
somewhat before a temperature sufficiently high to break the emulsified ASA-particles is
reached, whereupon spreading can occur. Too high moisture content after the press section
can also prevent full sizing from being achieved due to similar reasons. [13]
22
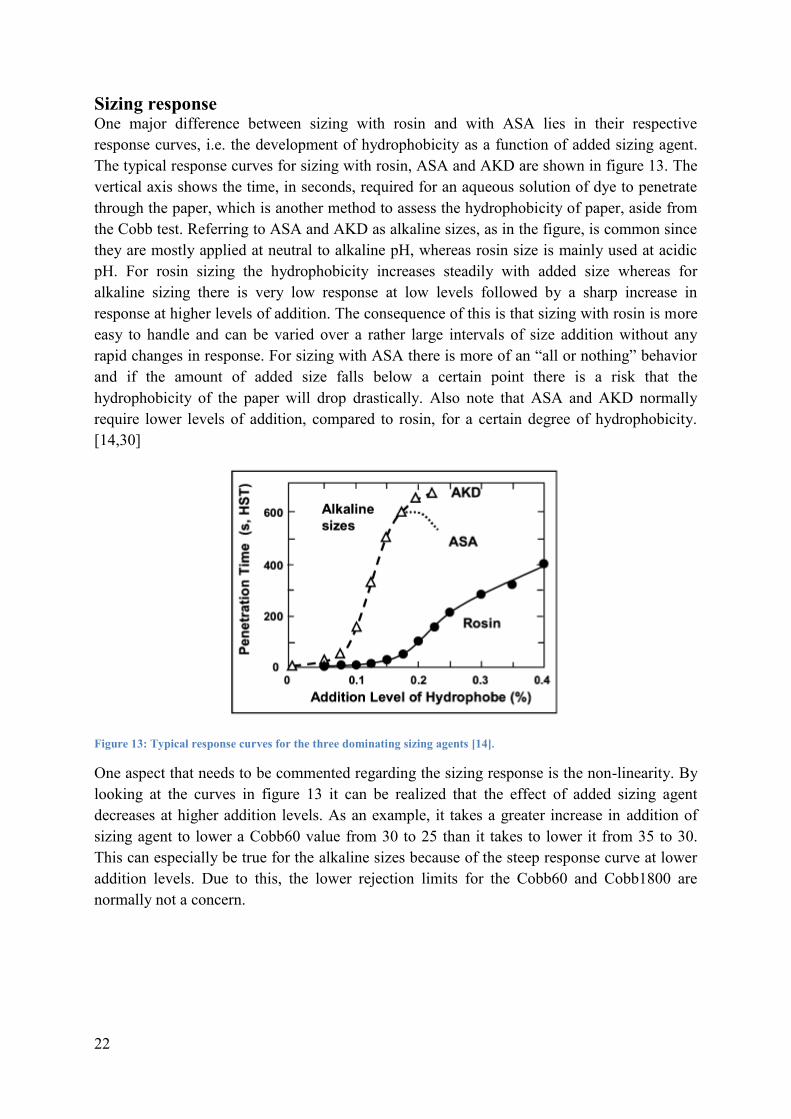
Sizing response One major difference between sizing with rosin and with ASA lies in their respective
response curves, i.e. the development of hydrophobicity as a function of added sizing agent.
The typical response curves for sizing with rosin, ASA and AKD are shown in figure 13. The
vertical axis shows the time, in seconds, required for an aqueous solution of dye to penetrate
through the paper, which is another method to assess the hydrophobicity of paper, aside from
the Cobb test. Referring to ASA and AKD as alkaline sizes, as in the figure, is common since
they are mostly applied at neutral to alkaline pH, whereas rosin size is mainly used at acidic
pH. For rosin sizing the hydrophobicity increases steadily with added size whereas for
alkaline sizing there is very low response at low levels followed by a sharp increase in
response at higher levels of addition. The consequence of this is that sizing with rosin is more
easy to handle and can be varied over a rather large intervals of size addition without any
rapid changes in response. For sizing with ASA there is more of an “all or nothing” behavior
and if the amount of added size falls below a certain point there is a risk that the
hydrophobicity of the paper will drop drastically. Also note that ASA and AKD normally
require lower levels of addition, compared to rosin, for a certain degree of hydrophobicity.
[14,30]
Figure 13: Typical response curves for the three dominating sizing agents [14].
One aspect that needs to be commented regarding the sizing response is the non-linearity. By
looking at the curves in figure 13 it can be realized that the effect of added sizing agent
decreases at higher addition levels. As an example, it takes a greater increase in addition of
sizing agent to lower a Cobb60 value from 30 to 25 than it takes to lower it from 35 to 30.
This can especially be true for the alkaline sizes because of the steep response curve at lower
addition levels. Due to this, the lower rejection limits for the Cobb60 and Cobb1800 are
normally not a concern.

23
2.7 Multivariate data analysis (MVDA) In the papermaking process there are numerous variables that affect the final quality of the
paper, including the amount of added chemicals, pH, temperatures, pulp quality and paper
machine settings among others. These factors can in turn be related to each other in various
ways. In such cases, multivariate analysis can be an appropriate approach since it can simplify
the interpretation and help to extract useful information from a large amount of data in an
efficient way. In this work, the software Simca (version 13.0) was used and some background
on important features and interpretation of results is given in this section.
The main objective of the multivariate data analysis was to investigate what process factors
that affect the hydrophobicity of the paper and, based on this, suggest ways that might
improve the sizing efficiency and thereby decrease the costs. PLS (projection to latent
structures by means of partial least squares) is a method that is suitable when one wants to
relate two data matrices, one X-matrix(factors) and one Y-matrix(responses), to each other.
The relationship between each response and its relevant variables can be summarized in
coefficient plots where regression coefficients are displayed with bars. An example of such a
plot is shown in figure 14. The size of a coefficient represents the change in a response when
a factor is changed by one standard deviation (when scaling to unit variance is used), while
the other factors are maintained at their averages. Hence, these coefficients express how
strong the connection is between the factors and the responses. The statistical significance for
each coefficient is indicated with a 95% confidence interval and if this interval spans zero, the
factor is deemed to have an insignificant effect.
Figure 14: Example of a coefficient plot from Simca.
The R2 and Q2 values are extensively used in multivariate modeling with Simca to assess the
performance of the models. R2 is the fraction of the variation that can be explained by the
model and is indicated by a number between 0 and 1, where higher values mean a better
model. Q2 is a measure of the predictive ability of the model and is calculated by cross
validation. In this validation method a model is constructed with a fraction of the data

24
removed, whereupon the model tries to predict the missing data. The predictions are
compared to the actual data and the process is repeated several times until all data elements
have been kept out once. Also Q2 varies between 0 and 1, and a value closer to 1 is indicative
of a model with good predictive ability, i.e. small difference between predicted and actual
values. [31]
3 Data analysis
3.1 Method Data for tambours produced during the years 2011 and 2012 were analyzed in regards to
Cobb60 and Cobb1800, size consumption and other related factors. For PM1, the qualities
1000-1007 (Royal Brown) were included and for PM2, the qualities 3100-3107 (Royal White)
and 5100-5107 (Royal 2000) were included. Royal mottled were not part of the analysis due
to low production volumes. Extra sized paper, generally called solid quality, and rejected
tambours were excluded from the analysis.
Testing of the paper is normally performed at the autoline lab directly after the completion of
a tambour. Cobb60 on both the top and base layer is normally tested every second tambour
and Cobb1800 on the top layer is performed every fourth tambour. However, if the test values
are above or below their respective action limits (table 1), every tambour is tested. Hence,
Cobb values are not available for all tambours.
Collection of data In the database AKL4, data is stored for each tambour that is produced at Smurfit Kappa in
Piteå, including all existing test results for the tambour, quality grade and basis weight as well
as the content of various pulps and chemicals. The contents of all relevant chemicals in the
paper were collected and recalculated to mass-percentage of respective layer of the paper.
This was done by taking the added weight of a chemical per tambour and dividing it by the
mass of pulps added to the relevant layer of the sheet (given as mass of pulp with a dry weight
of 90%, which is approximately equal to the dry weight of finished paper). The results of all
Cobb tests as well as the basis weights and quality classifications were also collected from the
AKL4 database. The content of alum was given as amount of supplied product and these
values were adjusted to dry weight of aluminum (4,3%), which is the number used when
calculating addition quotes in the control program.
The rosin size is delivered to the factory with a dry content around 44% and is diluted with
water on-site. The target value for the dry content of the diluted rosin was 3,9% during the
evaluated time period but the actual dry content is analyzed on a weekly basis and varied
quite a lot. Since this target value is used as a fixed value to calculate the added rosin per
tambour in the AKL4 database, the values were adjusted with the help of data from the tests
of the actual dry content. If, for example, the dry content of the rosin size was tested and

25
found to be 4%, the content of rosin size in all tambours until the next test point were
multiplied with the correction factor 4/3,9 = 1,026. All values given in this report regarding
rosin size are given as added dry product per ton of the concerned layer of the paper, unless
otherwise stated.
Data for continuously measured variables (pH, temperature and conductivity) were collected
from the system WinMOPS as one value every hour. Each tambour was matched with a value
of these variables based on the finishing time of the tambour rounded to the closest whole
hour.
The same procedure was used for both paper machines, resulting in two separate datasets with
the finishing time of the tambours along the first column and the variable names in the first
row. Filtration was performed in excel regarding quality codes and also other obviously
incorrect values for certain variables were removed.
Analysis with Simca The filtered datasets were used in Simca (version 13.0) with all variables mean-centered and
scaled to unit variance. To improve the created models, further removal of tambours with
largely deviating or clearly incorrect values, such as extremely low pH or very high content of
chemicals, were made. One PLS model was created for the base layer and one PLS model for
the top layer on respective paper machine and the relationships between each separate Cobb
value and its relevant variables were summarized in coefficient plots.
Cusum-plots were created with Simca to investigate long time-trends for variables and
responses. There are two lines for such a plot; high Cusum and low Cusum. For each point on
the x-axis, the cumulative sum of deviations from a target value is displayed as y-value. If the
sum becomes negative, the value for high Cusum is set to zero. Low Cusum works identically
except it cannot take on values above zero. Hence, if there is a period with many consecutive
values above or below the target it will be readily seen as a sloping curve. The change may
not be as easily detected in a regular time series plot due to lots of noise. A Cusum-chart can
be interpreted as if there is a constant positive slope the values are steadily above the target
and the sharper the slope, the farther away the values are from the target. Common is to use
an average value as target, which is the case for all Cusum-plots presented in this report.
Analysis with MS Excel MS Excel was used to perform regular analyses, including calculation of averages with
confidence intervals, testing differences in averages for statistical significance and
examination of trends for different basis weights and quality grades.
3.2 Results and discussion In the first two sections (3.2.1 and 3.2.2), trends in size consumption and Cobb values at PM1
and PM2 are treated separately. This is followed by section 3.2.3 to 3.2.5, where some
specific trends and observations are examined for both PM1 and PM2. Finally, the results
from the multivariate data analysis are presented and discussed in section 3.2.6.

26
3.2.1 Trends at PM1 For PM1 the average content of ASA in the base layer decreased with 8% comparing the year
2012 with 2011, as can be seen in table 3. The numbers are presented as dry content of ASA
in the paper and the averages are given with the limits for a 95% confidence interval. The
difference between the two years is significant according to a t-test (p<0,05), even though
there is a large variation in the addition level of ASA. A similar comparison is not relevant for
the top layer since shifts have been made between sizing with ASA and rosin.
ASA added to base layer (kg/ton)
Average 2011 1,18±0,45
Average 2012 1,08±0,52
Change 2012 vs. 2011 -8%
Table 3: The average addition of ASA to the base layer of produced paper the year 2011 compared to 2012.
Figure 15 shows how the addition of ASA to the paper has varied over the investigated time
period by a Cusum-chart. There is a clear trend at the end of 2012 towards lower dosage of
ASA that contributes to the overall decrease in ASA-consumption 2012.
Figure 15: Cusum-plot of the content of ASA in the base layer.
Interestingly, the content of ASA appears to be connected to the amount of alum added at the
late addition point. Figure 16 shows a Cusum-plot for the content of alum (from the late
dosage point) in the paper. Especially at the end of 2012 there seems to be an inverse
relationship between ASA and alum, where a higher dosage of alum coincides with a lower
addition of ASA.

27
Figure 16: Cusum-plot of the content of alum (from the late addition point) in the base layer.
At Smurfit Kappa in Piteå the addition of alum is expressed in the form of kg aluminum per
ton produced paper, whereas in scientific literature the addition level is usually stated as the
amount of alum, with chemical formula Al2(SO4)3x14H2O, expressed in per-cent. According
to the datasheet of the utilized alum product, the weight-% of aluminum is 4,23% and the
weight-% of Al2(SO4)3x14H2O is 46,6%. Therefore, to achieve values of the alum addition
that are comparable with literature, the numbers given as kg aluminum per ton paper should
be multiplied with 11 (=46,6/4,23) and divided by 10 to get the values in%. The added
amount of alum (Al2(SO4)3x14H2O) to the base layer during the investigated time period has
been of the magnitude 0,38% (0,35 kg Al/ton), of which about 0,14% (0,13 kg Al/ton) has
normally been added to the mixing chest for the base layer (where the three pulp types are
blended before reaching the machine chest). This early addition of alum is more likely to be
used as flocculation agent for anionic trash and fines and might not contribute to sizing to the
same degree as alum added later on. The sometimes recommended addition of alum when
sizing with ASA is 0,5% (section 2.5.2), which assumes that none of this will be neutralized
by anionic trash. Note that, at the point in figure 16 where there is a rapid increase of the
Cusum (around 2012-09-03), the late alum addition was drastically increased from about
0,18 kg Al/ton (0,2%) to 0,22 kg Al/ton (0,24%), where it remained for the rest of the year.
The average addition of ASA the 30 days prior to the change was 0,12 kg/ton and for the next
30 days the average addition was 0,09 kg/ton, which is a decrease by 25%. Of course there
could be other factors, aside from the alum addition, that are involved in this change but none
have been found. It is also worth mentioning that there were no major changes to
Cobb60(Base) during the late part of 2012. The coincidences described here are interesting
and should be examined further. Some additional discussion on the subject is given in
conjunction with the multivariate data analysis in section 3.2.6.

28
The Cobb values from the two-year period are normally distributed as can be seen in figure 17
for Cobb60 on the base layer and Cobb1800. Notice that there are very few tambours with
values over the upper action limits (33 and 145) for neither of the two displayed Cobb values.
Figure 17: The distribution of Cobb values for Cobb60 at the base layer (left) and Cobb1800 (right).
In table 4, the averages for all Cobb values are presented for year 2011 and 2012 separately
with limits for 95% confidence intervals. There are only small changes comparing the years,
even though there is a significant difference in average for Cobb1800 and Cobb60(Base)
according to a t-test (p<0,05). The significant differences despite the overlapping confidence
intervals are largely due to the great number of values upon which the averages are based
(several thousands). Based on figure 17 and the values in table 4, it is clear that there is a large
margin to the upper rejection limits for all measured Cobb values. However, since the natural
rosins are the primary source for the achieved sizing effect on the top layer, the low values are
not due to an overdosing of sizing agent. For reference, the amount of added rosin size to the
top layer is often maintained around 0,1 kg/ton.
Cobb1800 COBB60(Top) COBB60(Base) Average 2011 128,1±10,3 27,7±3,3 28,7±4,5 Average 2012 127,0±9,5 27,6±3,2 28,8±4,7 t-test (p-value) 0,000 0,136 0,047
Table 4: Average Cobb values 2012 and 2011.
Interesting to note is that there appear to be more variation in the values of Cobb60 on the
base layer than on the top layer. The confidence interval is also larger than for the base layer
at PM2 as will be seen in section 3.2.2. This could be either from the usage of ASA which has
a sharper response curve than rosin, as described in section 2.6, or it could be a consequence
of the extensive usage of recycled pulp which might vary more in quality compared to virgin
pulp.
0
200
400
600
800
1000
1200
1400
1600
1800
20002
0
22
.5 25
27
.5 30
32
.5 35
37
.5 40
42
.5 45
47
.5 50
Fre
qu
en
cy
Cobb60(Base)
0
50
100
150
200
250
300
350
11
0
11
4
11
8
12
2
12
6
13
0
13
4
13
8
14
2
14
6
15
0
15
4
Fre
qu
en
cy
Cobb1800

29
3.2.2 Trends at PM2 The average content of rosin size in the top layer for PM2 was found to have increased with
10% the year 2012 compared to 2011 (table 5). The trend was nearly identical, with an
increase in average rosin size addition of about 10%, for both main qualities produced at
PM2; Royal White and Royal 2000. The average addition of alum decreased with 8%, partly
due to concerns about spots originating from alum. The averages in table 5 are given with
limits for 95% confidence intervals. Note that the alum addition is given as kg Al/ton paper
and to achieve values of the alum addition that are comparable with literature the numbers in
table 5 should be multiplied with 11, as discussed in the previous section. The average amount
of alum, expressed as Al2(SO4)3x14H2O, then becomes 3,58 kg/ton (0,358%) for 2012, which
gives the average alum:rosin ratio of 1,5:1. Since the rosin size product is of the cationic sort
and also contains some additional alum, this ratio might be somewhat on the high side,
especially since the rosin size product contains additional alum (about on fifth of the rosin
content).
Rosin size addition to top layer
(kg/ton) Aluminum added to top layer
(kg/ton)
Average 2011 2,17±1,0 0,355±0,08
Average 2012 2,38±1,0 0,325±0,11
Change 2012 vs.2011 +10% -8% Table 5: The average content of rosin size and alum in the top layer of produced paper the year 2011 and 2012.
At the base layer of PM2, dosage of rosin size is generally very low when compared to the top
layer due to the presence of natural rosin in the unbleached softwood pulp. The average
content of rosin size in the base layer during the years 2011 and 2012 was 0,07 kg/ton and the
trend curve is characterized by very low addition levels with occasional peaks. Due to this, a
comparison of the average between the two years is not relevant or of interest.
The trend towards higher dosage of rosin size in the top layer can be clarified by the Cusum-
plot in figure 18 below. Around the transition from year 2011 to 2012 there seems to be a shift
towards higher content of rosin size in the paper.

30
Figure 18: Cusum-plot of the rosin size content in the top layer.
Figure 19 shows the Cusum-plot for the content of alum in the top layer of the paper.
Interestingly, the period where the consumption of rosin size have been high (according to
figure 18) coincides rather well with lower than normal dosages of alum. In early 2011 there
is also a period characterized by low rosin size dosage but high alum content. This might be
an indication that a lower alum dosage actually could cause a greater need for rosin size;
however, this is very speculative. For the sake of comparison, the ratio between added alum
and rosin size was somewhere around 0,9:1 in august 2012. If a lowered dosage of alum does
not negatively affect the sizing, some savings could be made by decreasing the usage of alum.
Additionally it could reduce the risk of spots of aluminum hydroxide forming in the paper.
However, since alum is a cheap product compared to rosin size, adding high amounts is not as
critical and if it has even a small positive effect on the sizing (decreases the demand of rosin
size) it is probably economical. The dosage of rosin size is rarely manipulated, which means
that the ratio between rosin and alum can vary quite a lot. A better strategy would perhaps be
to determine an appropriate ratio and adjust the dosage of alum along with the rosin size.
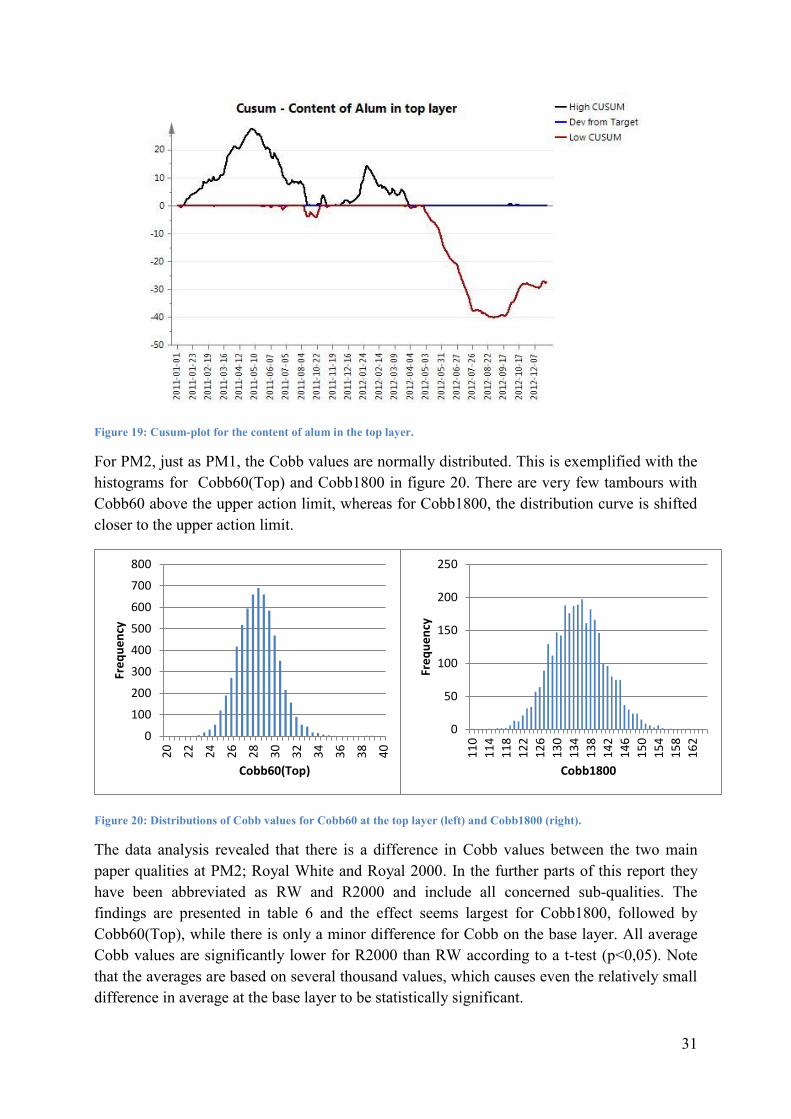
31
Figure 19: Cusum-plot for the content of alum in the top layer.
For PM2, just as PM1, the Cobb values are normally distributed. This is exemplified with the
histograms for Cobb60(Top) and Cobb1800 in figure 20. There are very few tambours with
Cobb60 above the upper action limit, whereas for Cobb1800, the distribution curve is shifted
closer to the upper action limit.
Figure 20: Distributions of Cobb values for Cobb60 at the top layer (left) and Cobb1800 (right).
The data analysis revealed that there is a difference in Cobb values between the two main
paper qualities at PM2; Royal White and Royal 2000. In the further parts of this report they
have been abbreviated as RW and R2000 and include all concerned sub-qualities. The
findings are presented in table 6 and the effect seems largest for Cobb1800, followed by
Cobb60(Top), while there is only a minor difference for Cobb on the base layer. All average
Cobb values are significantly lower for R2000 than RW according to a t-test (p<0,05). Note
that the averages are based on several thousand values, which causes even the relatively small
difference in average at the base layer to be statistically significant.
0
50
100
150
200
250
11
0
11
4
11
8
12
2
12
6
13
0
13
4
13
8
14
2
14
6
15
0
15
4
15
8
16
2
Fre
qu
en
cy
Cobb1800
0
100
200
300
400
500
600
700
800
20
22
24
26
28
30
32
34
36
38
40
Fre
qu
en
cy
Cobb60(Top)

32
Cobb1800 COBB60(Top) COBB60(Base) RW 138,0±10,8 28,7±3,4 27,6±3,7 R2000 131,3±12,0 27,7±3,4 27,3±3,3
Table 6: Average Cobb values for the two main qualities RW and R2000 during the years 2011-2012.
Since there is a clear difference in Cobb values between RW and R2000, yearly differences
between the two main qualities should be compared individually, as in figure 21. From the
figure it is evident that all Cobb values have decreased 2012 compared to 2011 regardless of
the quality. All differences in average between the two years are statistically significant
according to t-tests (p<0,05). The upper action and rejection limits have been marked with
blue and red lines respectively.
Figure 21: The average Cobb values with 95% confidence intervals.
Notice in the figure above that the confidence interval for Cobb1800 of RW is quite close to
the upper rejection limit year 2011 and contain the action limit with large margin. Probably,
the addition of rosin size has had to be increased due to high Cobb1800 values for RW, which
in turn has also caused the average of Cobb1800 for R2000 to decrease. Along with the higher
addition levels of rosin size to achieve good values for Cobb1800, the Cobb60 values on the
top layer have decreased as well for both qualities. Since the increased content of rosin size in
the top layer of the paper is consistent with lowered Cobb values year 2012 compared to
2011, it appears that the increased rosin size consumption is not an effect of some underlying
problem that counteracts the sizing procedure. By looking at the Cusum-charts of
Cobb60(Top) and Cobb1800 in figure 22-23, it is clear that there is a transition to lower
139.5
29.2 28.1
133.6
28.3 27.7
136.8
28.3 27.1
129.7
27.1 27.1
0.0
10.0
20.0
30.0
40.0
50.0
60.0
70.0
80.0
90.0
100.0
110.0
120.0
130.0
140.0
150.0
160.0
Cobb1800 Cobb60(Top) Cobb60(Base) Cobb1800 Cobb60(Top) Cobb60(Base)
RW R2000
2011
2012
Red line = Rejection limit
Blue line = Action limit

33
values around the end of 2011 and the beginning of 2012, i.e. the same time the new
specifications for Cobb1800 were realised.
Figure 22: Cusum of Cobb60(Top).
Figure 23: Cusum of Cobb1800.
Notice in table 6 and figure 21 that the difference between RW and R2000 is smaller for the
base layer compared to the top layer and for 2012 there is actually no difference at all between
the two qualities. The primary alteration between the two main qualities is that RW contains
more clay as filler in the white the top layer (7%) than R2000 do (2-3%). Because the
difference in Cobb60 is less pronounced at the base layer compared to the top layer and since
fillers are known to increase the demand for sizing agent due to their high surface areas
(section 2.6) it seems reasonable that the additional filler content in paper of RW is
responsible for the higher Cobb values on the top layer. Of interest is also that RW has had a
higher average content of rosin size in the top layer than R2000 during the investigated time
period. This is shown in figure 24, with averages displayed separately for all basis weights.
The figure also shows that there is no correlation between the basis weight and the dosage of

34
rosin size except that tambours with basis weight 240 g/m2 for RW seem to contain more
rosin size than the others. Hence, despite having more sizing agent, RW has higher Cobb1800
and Cobb60 on the top, clearly indicating that the paper containing more filler takes more
sizing agent to reach a certain degree of hydrophobicity
Figure 24: The average content of rosin size in the top layer at PM2 for different basis weights.
The difference in demand of sizing agent between the two qualities can be problematic when
shifts between them are made. If the production is changed from RW to R2000 and the dosage
of sizing agent is maintained at the same level (which is normally the case) it commonly
result in lowered values for Cobb1800 and Cobb60(Top). Since there is no lower action limit
for Cobb1800, the addition of rosin size will not be decreased due to low values for this test,
although if Cobb60 on the top fall below 27, dosage will be reduced. If production is changed
from R2000 to RW on the other hand, the result can be an increase in both Cobb values
measured on the top layer. Figure 25a-c displays how Cobb1800, Cobb60(Top) and the
content of rosin size in the paper varied in conjunction with a change of quality in the
beginning of May 2013. At the time point marked by a green vertical line (left line) the
production was changed from RW to R2000 and the shift is followed by an increase in both
Cobb1800 and Cobb60(Top). Some tambours after the change has been made; one tambour is
produced with a Cobb1800 very close to the rejection limit. This time point has been marked
with a red vertical line (right line) in all figures. Notice that at this point the dosage of rosin
size is still at the base line and is drastically increased in response to the high value of
Cobb1800. Fluctuations in both addition level of rosin size and Cobb values follow upon this.
One note is that Cobb1800 was higher than 145 for the last tambour that this test was
performed on prior to the one indicated by the red line. The dosage of sizing agent should
have been increased in response to this but this clearly was not the case.
2
2.1
2.2
2.3
2.4
2.5
2.6
2.7
2.8
110 130 150 170 190 210 230 250
Ave
rage
ro
sin
siz
e c
on
ten
t (k
g/to
n)
Basis weight (g/m2)
Rosin size (kg/ton) added to the top layer vs. Basis weight
RW
R2000

35
Figure 25a-c: The variation of Cobb1800, Cobb60(Top) and the addition of rosin size to the paper from an episode in
early May 2013. The time point for a shift from RW to R2000 is marked with a green vertical line (left line) in the
figures. The red vertical line (right line) indicates the time point where a tambour was produced with high Cobb1800.
It is obvious that controlling Cobb1800 can be hard. Cobb60(Top) had values between 31 and
32 prior to producing the tambour with high Cobb1800 in the example above. Since these
2
2.2
2.4
2.6
2.8
3
3.2
3.4
20
13
-05
-02
20
13
-05
-03
20
13
-05
-04
20
13
-05
-05
20
13
-05
-06
20
13
-05
-07
Ad
dit
ion
of
rosi
n s
ize
(kg
/to
n)
Rosin size(kg/ton)
120125130135140145150155160
20
13
-05
-02
20
13
-05
-03
20
13
-05
-04
20
13
-05
-05
20
13
-05
-06
20
13
-05
-07
Co
bb
18
00
Cobb1800
Action limit
24
25
2627
28
29
30
31
32
33
20
13
-05
-02
20
13
-05
-03
20
13
-05
-04
20
13
-05
-05
20
13
-05
-06
20
13
-05
-07
Co
bb
60
(To
p)
Cobb60(Top) Action limit
Rejection limit

36
values are below the upper action limit, the dosage of rosin size remained unchanged. Despite
Cobb60 values being in the appropriate range, Cobb1800 reached a too high level. Actually,
the tambour with high Cobb1800 had a value of 154 while Cobb60(Top) was only 30,4,
which indicate that this shorter test can be a rather poor predictor for the longer test.
Moreover, Cobb1800 seem to be at higher risk than Cobb60 on the top of achieving values
above the action limit for RW. This can also be seen in the confidence intervals for the two
tests. For RW the confidence intervals for Cobb60(Top) and Cobb1800 were 28,3±3,2 and
136,8±9,8 respectively during year 2012. The upper limit of the confidence interval for
Cobb60(Top) is 31,5 and hence does not span the upper action limit (33). For Cobb1800 on
the other hand, the upper confidence limit is 146,6 which does include the action limit (145).
The connection between Cobb60(Top) and Cobb1800 is discussed further in section 3.2.5.
Since it appears possible to achieve higher values of Cobb60(Top) and Cobb1800 for R2000
on an average basis, an interesting question is how much the consumption of rosin size could
be reduced if these Cobb values were maintained at higher levels. In figure 26 the average
addition of rosin size to the top layers for R2000 and RW is shown for different ranges of
Cobb60(Top). For R2000, the average rosin size consumption appears to decrease quite
linearly as the values for Cobb60 on the top layer increase. The same is true for RW, although
there is a deviation from the linear relationship at the lower range of Cobb60(Top), where it
seems like an increasingly high addition of rosin size is needed to reach these low values. If
trendlines are added to the values for R2000 and the linear part of RW (the two lowest ranges
omitted), the slopes of the lines becomes very similar (-0,09 and -0,093 respectively).
Moreover, if the rosin size addition is plotted against Cobb60(Top) for all available values
during 2011 and 2012 and trendlines are fitted, the slopes also attain similar values for both
R2000 and RW (-0,093 and -0,108 respectively). This means that the consumption of rosin
size statistically decreases by approximately 0,09 kg/ton for each unit that the average for
Cobb60(Top) is increased, for both R2000 and RW. However, the average rosin size addition
associated with a certain range of Cobb60(Top) is about 0,5 kg/ton higher for RW (except for
the range 24-25).
0
0.5
1
1.5
2
2.5
3
3.5
4
24-25 25-26 26-27 27-28 28-29 29-30 30-31 31-32 32-33
Ave
rage
ad
dit
ion
of
rosi
n s
ize
(kg
/to
n)
Cobb60(Top)
Average addition of rosin size (kg/ton) vs. Cobb60(Top)
R2000
RW
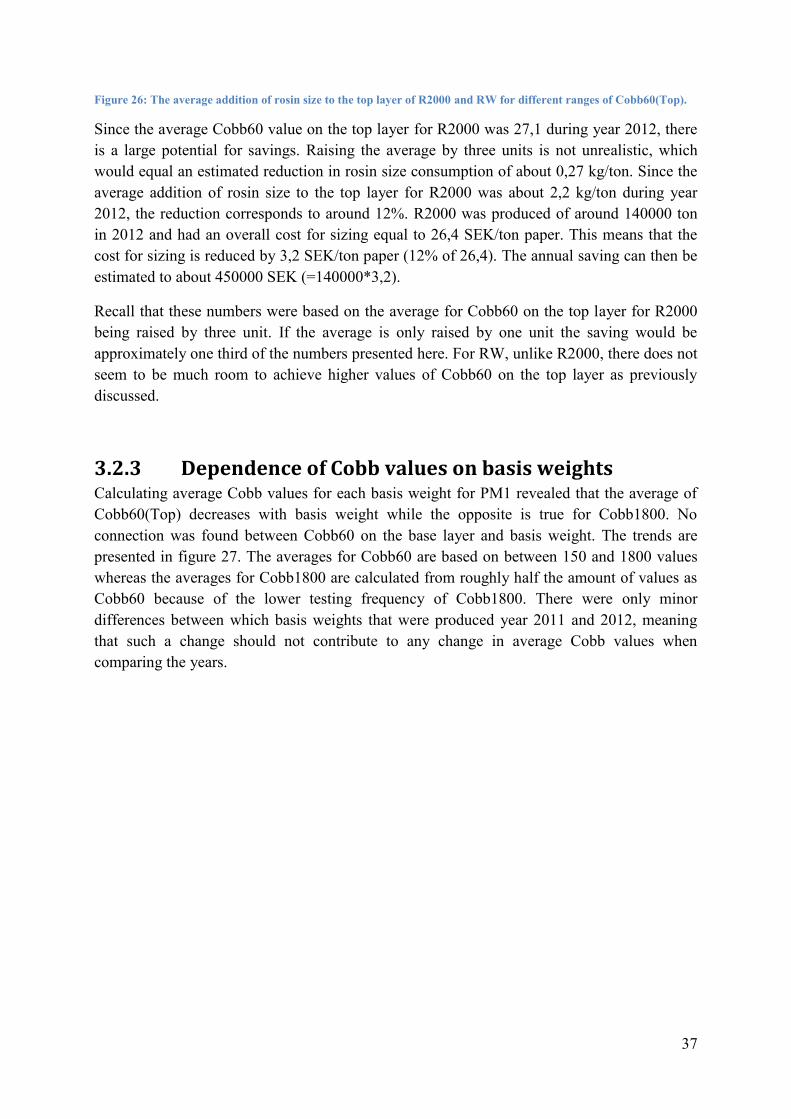
37
Figure 26: The average addition of rosin size to the top layer of R2000 and RW for different ranges of Cobb60(Top).
Since the average Cobb60 value on the top layer for R2000 was 27,1 during year 2012, there
is a large potential for savings. Raising the average by three units is not unrealistic, which
would equal an estimated reduction in rosin size consumption of about 0,27 kg/ton. Since the
average addition of rosin size to the top layer for R2000 was about 2,2 kg/ton during year
2012, the reduction corresponds to around 12%. R2000 was produced of around 140000 ton
in 2012 and had an overall cost for sizing equal to 26,4 SEK/ton paper. This means that the
cost for sizing is reduced by 3,2 SEK/ton paper (12% of 26,4). The annual saving can then be
estimated to about 450000 SEK (=140000*3,2).
Recall that these numbers were based on the average for Cobb60 on the top layer for R2000
being raised by three unit. If the average is only raised by one unit the saving would be
approximately one third of the numbers presented here. For RW, unlike R2000, there does not
seem to be much room to achieve higher values of Cobb60 on the top layer as previously
discussed.
3.2.3 Dependence of Cobb values on basis weights Calculating average Cobb values for each basis weight for PM1 revealed that the average of
Cobb60(Top) decreases with basis weight while the opposite is true for Cobb1800. No
connection was found between Cobb60 on the base layer and basis weight. The trends are
presented in figure 27. The averages for Cobb60 are based on between 150 and 1800 values
whereas the averages for Cobb1800 are calculated from roughly half the amount of values as
Cobb60 because of the lower testing frequency of Cobb1800. There were only minor
differences between which basis weights that were produced year 2011 and 2012, meaning
that such a change should not contribute to any change in average Cobb values when
comparing the years.

38
Figure 27: Relationship between average Cobb values and basis weights at PM1. Values for Cobb60 are displayed on
the left vertical axis and values for Cobb1800 are displayed on the right vertical axis.
No indications of the spread of the values are displayed along with the averages in this
section, for neither PM1 nor PM2, but the spreads are similar to those presented in table 4 and
6 respectively. However, for the Cobb values that seem to depend on basis weights to some
extent (Cobb1800 and Cobb60(Top) at PM1 and Cobb60(Base) at PM2), the spread for a
single basis weight is generally slightly reduced compared to the spread when all basis
weights are included. This is expected since the basis weight apparently contributes to some
of the overall variation seen in these Cobb values.
Although there is no apparent connection between Cobb60(Base) and basis weight, the
average content of ASA in the base layer were found to decrease somewhat with higher basis
weights (figure 28). Interesting is that the proportion of recycled pulp in the base layer
increases with basis weight and this type of pulp is normally harder to size compared to virgin
pulp but, despite this, the average addition of ASA decreases.
Figure 28: The average content of ASA in the base layer for different basis weights.
125
126
127
128
129
130
131
25
25.5
26
26.5
27
27.5
28
28.5
29
29.5
30
100 125 150 175 200 225 250 275 300
Co
bb
18
00
Co
bb
60
Basis weight (g/m2)
Average Cobb values vs. Basis weights at PM1
Cobb60(Top)
COBB60(Base)
Cobb1800
1
1.1
1.2
1.3
110 140 170 200 230 260 290
ASA
(kg
/to
n)
Basis weight (g/m2)
ASA vs. Basis weight
39
The results of a comparison between average Cobb values and basis weights at PM2 are
presented in figure 29. The averages of Cobb60 for R2000 are based on 250 to 1600 values,
whereas the averages for Cobb1800 are calculated from around half this number of values.
For RW, the number of values is similar, except for the highest basis weight (240) for which
only 18 values of Cobb60 were available. There were only small differences between the two
investigated years, regarding the production volumes of each basis weight, so a change in an
average Cobb value between the years cannot be contributed to different basis weights being
produced.
For Cobb60(Top), the averages are always higher for RW than R2000, regardless of basis
weight, and there seems to be a rather weak trend to lower values at higher basis weights, for
both qualities. Also for Cobb1800 the averages for RW are always clearly higher than for
R2000 but there is no apparent connection with basis weights. Cobb60 on the base layer
decreases considerably with increasing basis weights while there is no obvious difference
between the two qualities. The average for RW of the highest basis weight is very low,
considering that the lower rejection limit is 22, and this can be a problem since there is no
easy way to raise the values because the dosage of sizing agent cannot be noticeably reduced
due to already low addition levels.

40
Figure 29: The three Cobb values versus basis weight at PM2.
The lower average content of ASA in the base layer for higher basis weight can mean that the
required amount of sizing agent to reach a certain degree of sizing is lower for higher basis
weights. The top layer on PM1 differ from the base layer in that the sizing primarily relies on
the natural rosins in the pulp and dosage of sizing agent is seldom manipulated by the
operators in response to the results of the Cobb tests. This causes the effect of increased basis
weight to be seen as higher hydrophobicity instead of lowered size consumption. The same
130
135
140
145
150
110 130 150 170 190 210 230 250
Co
bb
18
00
Basis weight (g/m2)
Cobb1800 vs. Basis weight
RW
R2000
22
24
26
28
30
110 130 150 170 190 210 230 250
Co
bb
60
(To
p)
Basis weight (g/m2)
Cobb60(Top) vs. Basis weight
RW
R2000
22
24
26
28
30
110 130 150 170 190 210 230 250
Co
bb
60
(Bas
e)
Basis weight (g/m2)
Cobb60(Base) vs. Basis weight
RW
R2000

41
reasoning applies to the base layer of PM2, where Cobb decreases considerably with basis
weight.
A setting that varies with the basis weight is the speed at which the paper machines are run, as
mentioned in section 2.1. At higher speeds there is an increased turbulence and shear that can
result in decreased retention and consequently less sizing efficiency [37]. As the basis weight
is increased, the paper machine speed is decreased which could help to explain the decrease of
the Cobb60 values with higher basis weights, or in the case of the base layer at PM1, a
lowered dosage of sizing agent. However, it has also been shown that the retention of fines in
the paper can be improved at higher basis weight regardless of changes in machine speeds
[39].
The behavior of Cobb1800 is hard to explain; on PM1 the trend is the opposite of
Cobb60(Top) and there is no similar tendency for Cobb1800 on PM1 and PM2. However, it
should not be that surprising that the behaviors of Cobb1800 are dissimilar on the both paper
machines because at PM2 the basis weight of top layer is fixed around 75 g/m2 whereas the
basis weight of the top layer at PM1 is increased at higher total basis weight. There are two
ways to think about the proportions of base and top layer versus Cobb1800; the first option is
to assume that a thicker top layer causes less water to reach the base layer (or at a later point
in time), having the effect that the hydrophobicity of the base layer will affect Cobb1800 to a
lesser degree. The other option is to assume that a thicker base layer causes its hydrophobicity
to be more important regardless of the thickness of the top layer. If the latter is true it could
help to explain why Cobb1800 increases with basis weight at PM1 while Cobb60 decreases.
In figure 27 it can be seen that Cobb60(Base) tend to be higher than Cobb60(Top) at higher
basis weights. If the importance of the hydrophobicity of the base layer becomes more
important at higher basis, and the base layer has a higher value of Cobb60 than the top layer,
it could be a driving force for increased Cobb1800 at higher basis weights. However, as will
be discussed in section 3.2.5, the former assumption, that less water reaches the base layer, is
more probable.
As discussed in section 2.2, the pore width is an important factor for the capillary absorption
of water in paper. In figure 30 the average porosities for the individual basis weights,
determined by a Bendtsen test, have been plotted against the basis weights for both PM1 and
PM2. There appear to be an increase in porosity for PM1 and a decrease in porosity for PM2
at higher basis weights, although the connections are not perfectly linear. This could possibly
contribute to the increase in Cobb1800 at PM1 for higher basis weights. However, if tambours
of one basis weight are sorted out, there is a weak negative correlation between the porosity
and the Cobb values, which does not seem logical. For the produced paper, the porosity is
tested by measuring how easy air flows through it (Bendtsen test). A higher porosity is
consistent with lower density, as expected, but does not actually tell anything about the size of
the pores; many small pores could yield the same test result as fewer large pores but the
absorption of water between the two cases could differ.

42
Figure 30: Average porosity at different basis weights for PM1 and PM2.
Overall, Cobb1800 is difficult to analyze since both the top and base layer must be
considered, as well as other parameters, and no clear explanation to the behavior versus basis
weight can be provided, although some factors have been discussed here. A plausible
explanation for the decreasing Cobb60 values seems to be that that the machine speed varies,
which lead to variation in retention of sizing agent, but there is also some support that higher
basis weights by itself is associated with better retention.
3.2.4 Sizing stability As previously stated, tambours are tested at the autoline lab directly after being finished.
Paper samples from each tambour are also saved and stored in an archive. To assess the
stability of the sizing, sampled paper from one tambour each day is selected and retested
regarding Cobb60 on both the top and base layer at the paper lab around one week after it has
been produced. The paper is stored in normal indoor environment but conditioned at the
specified temperature and humidity before the testing. At the retest, the paper in most cases
absorbs more water than at the initial test. However, if the difference in Cobb60 between the
retest after one week and the initial test is plotted as time series, there seem to be a periodic
behavior. The bar diagrams in figures 31 illustrate this, with the retest after one week denoted
as test 2 and the initial test called test 1. Note that around 2011-09-01 there is no data due to a
planned maintenance stop lasting for a couple of weeks. No retests were taken before spring
2010 so there is no available data before that time point but an equal pattern is observable for
the second half of 2010.
160
180
200
220
240
260
280
300
110 140 170 200 230 260 290 320
Po
rosi
ty
Basis weight (g/m2)
Porosity vs. Basis weight
PM1
PM2

43
Figure 31: Difference between Cobb60 at initial test and the retest after one week.
There is no noticeable periodic behavior for the initial tests and the behaviors seen in figure
31 can therefore be attributed to a pattern for the retest where the results vary periodically.
Since the appearance of all the plots are similar for the top and the base layer on both paper
machines it is unlikely that there is any issue with the process that leads to loss of sizing,
especially since different sizing agents are used. The periodic behavior with lower retest
values during the warm summer months (July to September) might have something to do with
variations in the climate in which the paper is stored before the retest. The reason why the
hydrophobicity generally decreases is however unclear. In the case of rosin size, a reduced
water resistance can occur if there is insufficient alum in the paper, which results in loosely
bound rosin size. This in combination with moisture can cause loss of sizing although it is
rarely observed [13]. As there is higher content of moisture in the air during the summer, the
paper should, if anything, be more susceptible to lose sizing during this time but the case is
apparently the opposite. For ASA, loss of sizing can occur due to reorientation of unbound
hydrolyzed ASA but this phenomenon can be prevented by the appropriate usage of alum
[28]. The same study also showed that the rate at which sizing decreased was enhanced at
-5
-3
-1
1
3
5
7
92
01
1-0
1-0
1
20
11
-03
-01
20
11
-05
-01
20
11
-07
-01
20
11
-09
-01
20
11
-11
-01
20
12
-01
-01
20
12
-03
-01
20
12
-05
-01
20
12
-07
-01
20
12
-09
-01
20
12
-11
-01
Test
2 -
Te
st 1
Test 2 - Test 1 for COBB60(Base) at PM1
-5
-3
-1
1
3
5
7
9
20
11
-01
-01
20
11
-03
-01
20
11
-05
-01
20
11
-07
-01
20
11
-09
-01
20
11
-11
-01
20
12
-01
-01
20
12
-03
-01
20
12
-05
-01
20
12
-07
-01
20
12
-09
-01
20
12
-11
-01
Test
2 -
Te
st 1
Test 2 - Test 1 for COBB60(Top) at PM1
-5
-3
-1
1
3
5
7
9
20
11
-01
-01
20
11
-03
-01
20
11
-05
-01
20
11
-07
-01
20
11
-09
-01
20
11
-11
-01
20
12
-01
-01
20
12
-03
-01
20
12
-05
-01
20
12
-07
-01
20
12
-09
-01
20
12
-11
-01Te
st 2
- T
est
1
Test 2 - Test 1 for Cobb60(Base) at PM2
-5
-3
-1
1
3
5
7
9
20
11
-01
-01
20
11
-03
-01
20
11
-05
-01
20
11
-07
-01
20
11
-09
-01
20
11
-11
-01
20
12
-01
-01
20
12
-03
-01
20
12
-05
-01
20
12
-07
-01
20
12
-09
-01
20
12
-11
-01Te
st 2
- T
est
1
Test 2 - Test 1 for COBB60(Top) at PM2

44
higher temperatures and humid conditions. Hence, also loss of sizing with ASA should
theoretically (if anything) be higher during the summer.
It should be noted that paper with high Cobb values from the initial tests on average increases
less compared to paper with low values at the initial tests. Due to this, the apparent loss of
sizing should not be that much of a concern.
3.2.5 Correlations between Cobb values The correlations between the three Cobb values can be seen in table 7 for both PM1 and PM2.
No relationship should be expected between Cobb60 on the top layer and base layer whereas a
connection between Cobb60(Top) top and Cobb1800 would seem reasonable since they are
both measured on the top layer. The value of Cobb60 on the top layer provides a measurement
of the rate at which the paper absorb water during the first minute of contact with water and
could hypothetically serve as a predictor for what the results of a Cobb1800 test would be,
even though the latter test is much longer. Moreover, a high content of sizing agent in the top
layer is associated with low values of both Cobb60(Top) and Cobb1800 (discussed further in
section 3.2.6), which should cause the two test to be at least somewhat correlated with each
other.
Correlation PM1 PM2
Cobb60(Top) and Cobb1800 0,16 0,56
Cobb60(Base) and Cobb1800 0,12 0,12
Cobb60(Top) and Cobb60(Base) 0,27 0,33 Table 7: The correlation between Cobb values for both PM1 and PM2.
For PM1 the correlation between Cobb60(Top) and Cobb1800 is much lower than for PM2,
while all other correlations agree very well for the two paper machines. Considering the
dependence of Cobb1800 and Cobb60(Top) on the basis weight for PM1, where the trends are
really the opposite, the low correlation between these two Cobb values is not that surprising.
However, if the correlation is investigated separately for each basis weight there is a different
result, which can be seen in figure 32. The correlation coefficients between Cobb1800 and
Cobb60(Top) becomes a lot higher and also seem to increase slightly with basis weight. It
could be that, since the thickness of the top layer increases at higher basis weights on PM1, it
prevents water from reaching the base layer at an early stage and consequently give it less
time to absorb there. This would mean that the hydrophobicity of the top layer becomes more
determining for the results of Cobb1800 as the basis weight is increased, which is why the
correlation coefficient becomes larger. No obvious difference is seen for Cobb60 on the base
layer versus basis weights. For PM2 the correlations were found to be uniform over the basis
weight range and without any difference between RW and R2000.
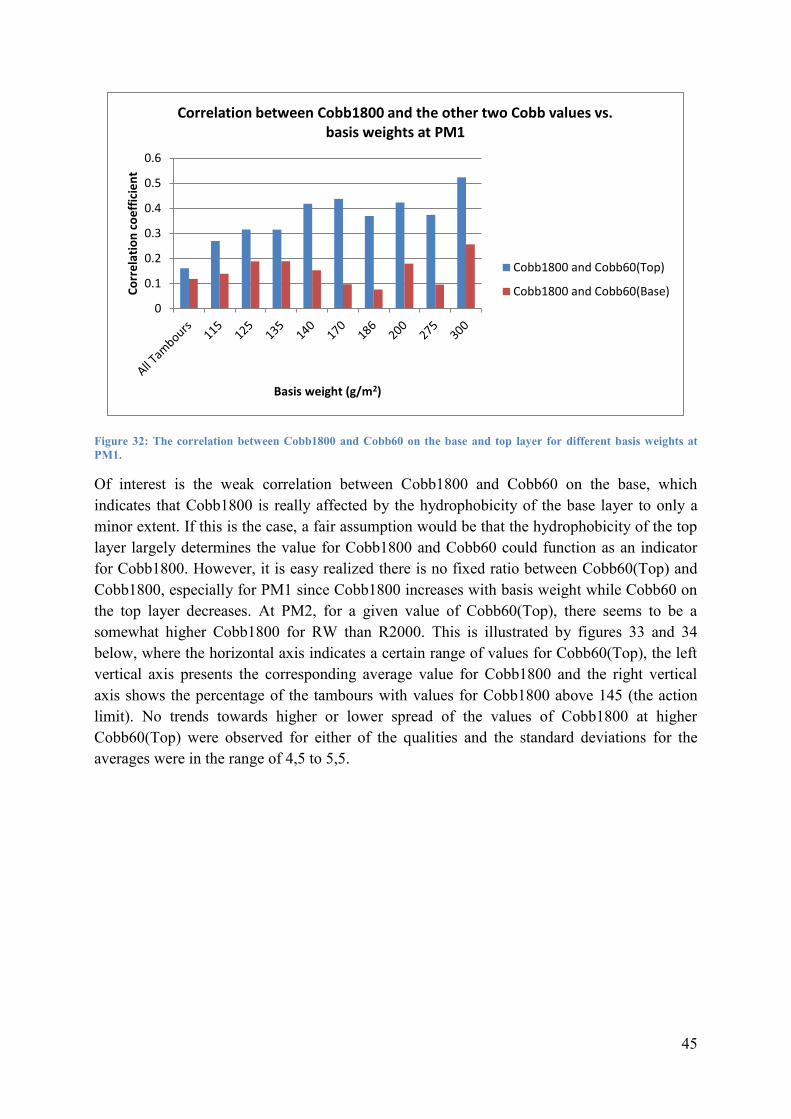
45
Figure 32: The correlation between Cobb1800 and Cobb60 on the base and top layer for different basis weights at
PM1.
Of interest is the weak correlation between Cobb1800 and Cobb60 on the base, which
indicates that Cobb1800 is really affected by the hydrophobicity of the base layer to only a
minor extent. If this is the case, a fair assumption would be that the hydrophobicity of the top
layer largely determines the value for Cobb1800 and Cobb60 could function as an indicator
for Cobb1800. However, it is easy realized there is no fixed ratio between Cobb60(Top) and
Cobb1800, especially for PM1 since Cobb1800 increases with basis weight while Cobb60 on
the top layer decreases. At PM2, for a given value of Cobb60(Top), there seems to be a
somewhat higher Cobb1800 for RW than R2000. This is illustrated by figures 33 and 34
below, where the horizontal axis indicates a certain range of values for Cobb60(Top), the left
vertical axis presents the corresponding average value for Cobb1800 and the right vertical
axis shows the percentage of the tambours with values for Cobb1800 above 145 (the action
limit). No trends towards higher or lower spread of the values of Cobb1800 at higher
Cobb60(Top) were observed for either of the qualities and the standard deviations for the
averages were in the range of 4,5 to 5,5.
0
0.1
0.2
0.3
0.4
0.5
0.6
Co
rre
lati
on
co
eff
icie
nt
Basis weight (g/m2)
Correlation between Cobb1800 and the other two Cobb values vs. basis weights at PM1
Cobb1800 and Cobb60(Top)
Cobb1800 and Cobb60(Base)

46
Figure 33: The average Cobb1800 (left vertical axis) and the percentage of tambours with Cobb1800 above 145 (right
vertical axis) for a given range of Cobb60(Top) for Royal White.
Figure 34: The average Cobb1800 (left vertical axis) and the percentage of tambours with Cobb1800 above 145 (right
vertical axis) for a given range of Cobb60(Top) for Royal 2000.
For a certain Cobb60 value on the top, the average Cobb1800 is around four to eigth units
higher for RW compared to R2000. For both qualities, the average Cobb1800 seems to
increase linearly as Cobb60(Top) rises, with exception for the highest range of R2000. The
chance that a tambour attains a Cobb1800 above 145 is also enhanced at higher Cobb60, at
0
10
20
30
40
50
126
128
130
132
134
136
138
140
142
144
146
148
25
-26
26
-27
27
-28
28
-29
29
-30
30
-31
31
-32
32
-33
33
-34
% o
f ta
mb
ou
rs w
ith
Co
bb
18
00
> 1
45
Co
bb
18
00
Cobb60(Top)
Royal White
Cobb1800
% Cobb1800 > 145
0
10
20
30
40
50
126
128
130
132
134
136
138
140
142
144
146
148
25
-26
26
-27
27
-28
28
-29
29
-30
30
-31
31
-32
32
-33
33
-34
% o
f ta
mb
ou
rs w
ith
Co
bb
18
00
> 1
45
Co
bb
18
00
Cobb60(Top)
Royal 2000
Cobb1800
% Cobb1800 > 145

47
least for RW. There are very few tambours produced of quality R2000 with Cobb60(Top)
over 32; for the range 32-33, only six tambours have also been tested for Cobb1800 and, for
the highest range, only three. Because of this, the values for the top ranges are based on very
little data. This is also true for the top range for RW, with just 7 tambours. By considering
figures 33 and 34, the question can be raised whether it is appropriate to have the same target
value of Cobb60 on the top layer for both RW and R2000. There seems to be very low risk to
produce tambours with Cobb1800 above 145 for R2000, even if Cobb60(Top) is high. In
contrast, the probability that Cobb1800 is over 145 for RW is about 20% even in the range of
Cobb60 equal to 30-31.
An important question is what an appropriate range for Cobb1800 might be. If a standard
deviation of 5 for Cobb1800 is assumed (which seems to be normal), the statistical risk that a
tambour will be rejected can be calculated for a specific average of Cobb1800. With an
average of 136,8 (as for RW during 2012) the risk of attaining a value above 155 is 0,014%,
which mean that, statistically, one tambour of about 7000 will be rejected. To achieve a risk
of producing rejected tambours of less than one in ten thousand, which is a risk that might be
acceptable, the average of Cobb1800 corresponds to 136,6. This means that, although the
Cobb1800 values for RW are quite high, there is still a very low risk of attaining values over
155. The implication of this reasoning is that the level of Cobb1800 for RW is quite realistic
and not excessively high. In contrast, the Cobb1800 values for R2000 can be considered far
too low with an average four units below that of RW during 2012. In figures 33 and 34 it can
be seen that an average for Cobb1800 around 136,5 corresponds to values of Cobb60(Top) in
the range 27-28 for RW and somewhere between 30 and 32 for R2000, which is a large
difference. It appears that, for RW, values of Cobb60 on the top layer perhaps need to be
lower than 30 to be sufficiently safe that rejected tambours regarding Cobb1800 are not
produced. Low values for Cobb60 on the top layer are by no means a guarantee for low
values of also Cobb1800 because there is a large spread. But according to figure 33, the
probability of producing tambours with high Cobb1800, as well as the average Cobb1800,
will be reduced if Cobb60(Top) is maintained at a lower level.
The knowledge of the difference between the two paper qualities is something that possibly
could be exploited and modifying the target values and action limits for the Cobb values
seems like a plausible way to reduce the expense of sizing. One option is to apply a lower
action limit for Cobb1800. If properly chosen, it could have the effect that the addition of
sizing agent is lowered due to low values of Cobb1800, even though Cobb60(Top) is above
27, and result in lower consumption of rosin size. A weakness of this approach is that
Cobb1800 is tested so seldom and takes long time to provide feedback, so it is a rough guide
to use for the dosage of sizing agent. Another possibility is to raise the target value and action
limits of Cobb60(Top) for R2000 since higher values are clearly manageable without
compromising Cobb1800. On the other hand, a decreased target value and upper action limit
of Cobb60(Top) for RW could be beneficial because values up to 33, and above, appear to
cause excessive risk of producing tambours with high Cobb1800.

48
3.2.6 Multivariate data analysis Two PLS-models were fitted for both paper machines; one for the top layer and one for the
base layer. The variation among a response that can be explained by the model (R2Y) and the
variation that can be predicted by the model (Q2) are listed for each response (Cobb value) in
table 8.
Response R2Y Q2
PM1 Cobb60(Top) 0,3 0,3
PM1 Cobb1800 0,19 0,18
PM1 Cobb60(Base) 0,3 0,3
PM2 Cobb60(Top) 0,32 0,31
PM2 Cobb1800 0,37 0,37
PM2 Cobb60(Base) 0,45 0,45
Table 8: Cumulative R2Y and Q2 for all Cobb values.
Evidently, the models are poor at explaining and predicting variation in the Cobb values and
especially PM1 have very low values for R2Y and Q2. Reasons that might cause bad
performance of the models might be that there is low reproducibility of the Cobb tests,
missing and/or inaccessible variables or simply that there are too much noise in the signals of
the variables [31].
Despite the poor models, they can give indications to whether a change in a variable is
positively or negatively correlated to a change in a Cobb value. Table 9 summarizes how
variables are associated to the Cobb values according to the models. A plus means that a high
value of the variable contributes to a high Cobb, while the opposite is true for a minus.
Factors that did not show any, or very low, correlation to neither of the Cobb values were
excluded from the models and are not discussed here. These include BMA (colloidal silica),
defoamer and starch. The original coefficient plots whereupon this summary is based can be
found in appendix A.
PM1 PM1 PM1 PM2 PM2 PM2
Cobb60(Top) Cobb1800 Cobb60(Base) Cobb60(Top) Cobb1800 Cobb60(Base)
Sizing agent - - - - - - - - 0
Alum (Total) - - (-) 0 0 -
pH -
Machine chest
(+) (+) - + (+) (+)
pH -
White water
+ + 0 0 0 0
H2SO4 (+) 0 - + + -
Temperature -
Headbox
0 + + + + +
PAM - 0 - X X 0
Conductivity + + 0 + (+) X
Basis weight - - ++ - - - (-) - -
Table 9: Summary of the effects of variables on Cobb values. 0 = no significant effect; ++ or - - = strong effect; (+) or
(-) = weak effect; X = not used or missing.

49
The amount of added sizing agent has a strong negative correlation to Cobb values in the
cases where they are used to a high degree (i.e the base layer at PM1 and the top layer at
PM2) and are weaker or insignificant otherwise.
Alum has no correlation at all to Cobb on the top layer of PM2, whereas in the other cases
alum contributes to good sizing. As previously mentioned, the rosin size product is
cationically dispersed with polyamine which is known to decrease the demand for alum. This
as well as the fact that the supplied product already contains some alum could cause the
amount of added alum to be of less importance, which could explain why the coefficient for
alum is insignificant at the top layer of PM2 (i.e. the only place where rosin size is dosed at
high levels). Moreover, the ratio of alum to rosin has been quite high, as previously discussed,
and it might be that a small decrease does not negatively affect the sizing.
Alum is only weakly associated with Cobb60 for the base layer of PM1, where ASA is used.
In section 3.2.2 it was discussed that there appeared to be a relationship between the addition
level of ASA and alum at the late dosage point. Presented in table 9, is the total addition of
alum (early plus late), but if the late addition is used as a separate variable in the model for
Cobb60(Base) at PM1, there is only an insignificant effect. However, an alternative approach
is to use the content of ASA instead of the Cobb value as the response variable. Doing so, the
late alum addition becomes more influential and is the second most important variable. This is
an indication that a higher content of alum, added at the later dosage point, might decrease the
required amount of ASA to achieve good sizing. If this is the case, adding more alum would
be beneficial since ASA is a much more expensive product. Interesting would be to examine
if the late addition of alum really is affecting the demand for ASA to any meaningful degree
and if an addition level even higher than at the end of 2012 is beneficial. Note that using rosin
size as the response variable was tested for the top layer of PM2 but did not make any
difference for the effect of alum (or any other variables).
pH in either the machine chest or the white water has an effect on all Cobb values, although
generally small. In all cases where rosin is the sizing agent, a high pH is correlated to higher
Cobb and for the base layer of PM1, where ASA is used, the opposite is true. Most sources
suggest that rosin size works best at a pH up to 5,5 although a product similar to the one
currently used at Smurfit Kappa in Piteå can function well at a higher pH but places greater
demand on proper application. The pH at the top layer of PM2 has been around 5,6 which
seem to be in the right range but a slight lowering could, according to the models, possibly
yield some benefits. If spots or precipitates of aluminum hydroxide are an issue, a lower pH
can reduce the problems (as will of course a decreased usage of alum). In the cases where the
natural rosins are relied on to a high extent, a lowered pH could make the self-sizing effect
stronger since this type of sizing is more affected by pH. Sizing with ASA seem to benefit
from a slightly higher pH according to the literature. The average pH in the machine chest
during 2011 and 2012 has been 6,3 and most literature suggest a somewhat higher optimum
pH for sizing with ASA.
Since H2SO4 is used to adjust pH continually, a high added amount indicates that the pH has
been high and a plus sign can be interpreted as a high pH causing higher Cobb. If the addition
50
of H2SO4 is interpreted in this way it is compatible with the results for the pH, except for
Cobb on the base layer of PM2 where the two have opposite signs and Cobb1800 on PM1
where the amount of H2SO4 is insignificant.
The temperature of the stock is in agreement with the theory (except for Cobb60(Top) at
PM2) in that higher temperature is negative for the sizing effect.
PAM (Polyacrylamide), where it is utilized, is in some cases associated to better
hydrophobicity and is insignificant in others. Since it is used as a retention aid it would be
expected to be positive for the sizing if it causes more sizing agent to actually be retained in
the paper. Anionic trash can also be flocculated with the usage of PAM and thus prevents it
from interfering with the sizing.
The conductivity functions as a measure of the content of ions in the furnish. For reasons
discussed in section 2.6, the presence of electrolytes can have a negative effect on the sizing
process. According to the models, a high conductivity of the stock is associated to higher
Cobb values except for the base layer of PM1. No data were available for the base layer of
PM2 for a large portion of the investigated time period and was omitted.
The effects of basis weights on the Cobb values according to the models are in good
agreement with the results presented in section 3.2.3. Note that high basis weights have a
strong influence towards lower values of Cobb60(Base) at PM1 even though the average
Cobb values do not differ between basis weights. Instead the content of sizing agent in the
paper decreased, as previously discussed, and it is probably that effect which is reflected by
the PLS-model. Actually, the basis weight is the most influential variable for all Cobb values
(except at the top layer of PM2) and removal of this factor from these models decreases the
R2Y and Q2 greatly. For the top layer of PM2, the models are greatly influenced by the main
quality of the paper and removal of this variable from the PLS-model decreases the R2Y and
Q2 to less than half. Thus it seems that the basis weight and the main quality are the factors
that essentially provide the models with the largest part of the explaining and predictive
ability, while the other factors only make small contributions in comparison. Overall, the
effects of the factors used in the models can be explained theoretically, even though the
effects are not always consistent for the different Cobb values and are often small.
Although not displayed in table 9, a greater amount of recycled pulp in the base layer was
associated with higher Cobb60(Base) for both PM1 and PM2, while the opposite was true for
softwood pulp and broke.

51
4 Machine trials
4.1 Machine trial 1 at PM1 The purpose of the first machine trial was to investigate how Cobb1800 is affected by the
hydrophobicity of the base layer and if the specifications for Cobb1800 can be met despite
higher values of Cobb60(Base). Since there exists no customer specification regarding
Cobb60(Base), only an internal rejection limit at 50 g/m2, a modification of this value would
be possible without altering the specified quality of the paper. As discussed in section 3.2.5
there is only a very weak correlation between Cobb1800 and Cobb60(Base), implying that the
effect of the base layer’s hydrophobicity is of minor importance for the test with long
duration. If fulfillment of the Cobb1800 specifications would be possible despite higher
Cobb60 on the base layer, lower amounts of ASA could be added to the paper, which would
lead to economical savings.
4.1.1 Method The machine trial was performed 2013-04-15 between about 7:00 and 17:00. Addition of
ASA to the base layer was decreased for every tambour produced from an initial level of
0,9 kg ASA/ton paper. Cobb60 on both the top and base layer as well as Cobb1800 were
tested at the autoline lab for every produced tambour. The goal was to reach a Cobb60(Base)
of 40, provided Cobb1800 did not increase too much. Once the lowest level of addition was
reached, the dosage was gradually increased back to regular levels. The trial was performed
for paper with the relatively low basis weight of 135 g/m2 since Cobb1800 tend to increase
with higher basis weights as described earlier and the risk of obtaining a value of Cobb1800
above the rejection limit was a concern. All factors except the addition of ASA were kept as
constant as possible during the trial. The settings of the most important factors can be found in
appendix B.
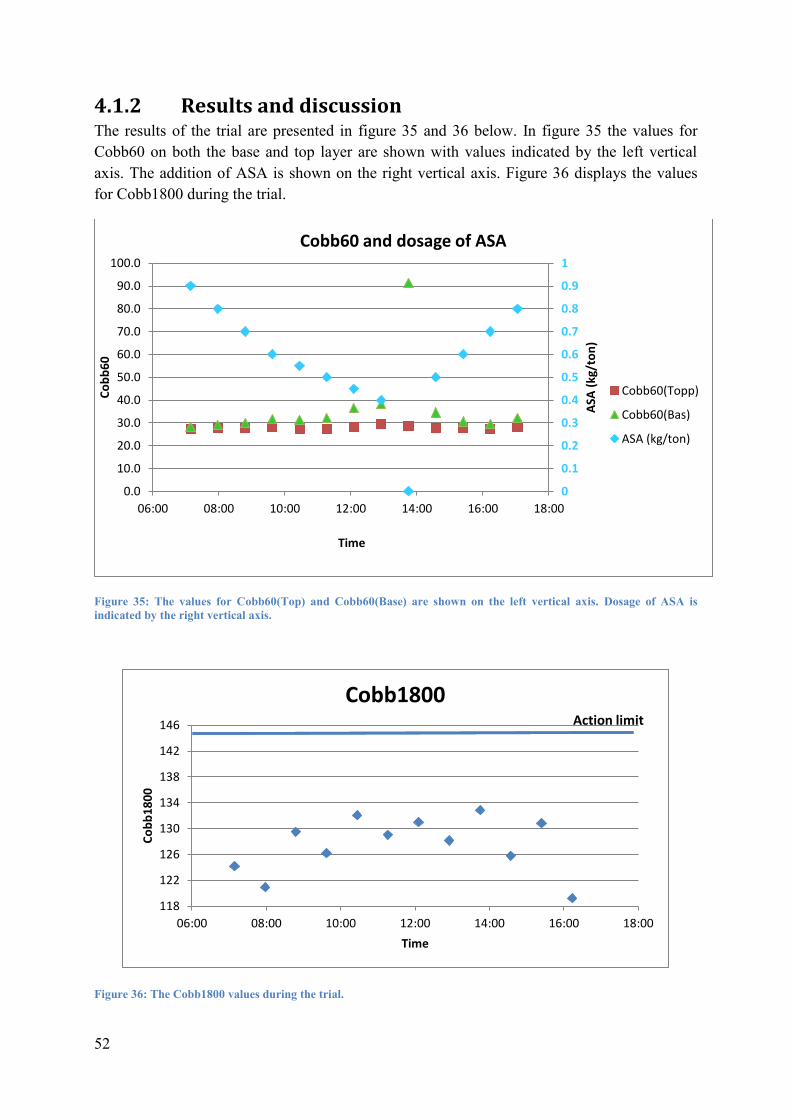
52
4.1.2 Results and discussion The results of the trial are presented in figure 35 and 36 below. In figure 35 the values for
Cobb60 on both the base and top layer are shown with values indicated by the left vertical
axis. The addition of ASA is shown on the right vertical axis. Figure 36 displays the values
for Cobb1800 during the trial.
Figure 35: The values for Cobb60(Top) and Cobb60(Base) are shown on the left vertical axis. Dosage of ASA is
indicated by the right vertical axis.
Figure 36: The Cobb1800 values during the trial.
0
0.1
0.2
0.3
0.4
0.5
0.6
0.7
0.8
0.9
1
0.0
10.0
20.0
30.0
40.0
50.0
60.0
70.0
80.0
90.0
100.0
06:00 08:00 10:00 12:00 14:00 16:00 18:00
ASA
(kg
/to
n)
Co
bb
60
Time
Cobb60 and dosage of ASA
Cobb60(Topp)
Cobb60(Bas)
ASA (kg/ton)
118
122
126
130
134
138
142
146
06:00 08:00 10:00 12:00 14:00 16:00 18:00
Co
bb
18
00
Time
Cobb1800 Action limit

53
Before the trial was initiated, the dosage of ASA was 0,9 kg/ton and it was decreased by
0,1 kg/ton for every tambour until 0,6 kg/ton was reached and after that smaller steps were
taken to be on the safe side. From tambour five to nine, the dosage of ASA was decreased
when the Cobb1800 test on the previous tambour had been completed, leaving a little over ten
minutes until the current tambour was finished. Since the dosage point is very late in the
system and the fact that ASA is very reactive and is rapidly hydrolyzed if not retained in the
paper, this time was considered adequate for a full effect of the decrease to be seen. When the
dosage of ASA was decreased to 0,35 kg/ton it caused an alarm for low flow to set off and the
pump for the ASA size stopped due to this. There was no addition of ASA to the pulp for the
remainder of the tambour but the problem was fixed shortly afterwards by resetting an alarm
at the site of the pump in question. (Note that the equipment belonged to an external company
and was set up for a long term trial with the ASA size in question and the issue with the pump
had never been encountered before). The absence of ASA dosage at the end of tambour nine
caused the hydrophobicity of the base layer to be very poor, as expected. But, interestingly,
the Cobb1800 value only increased to a very minor extent. The level of Cobb60(Top)
remained relatively constant during the experiment and any effect on Cobb1800 from varying
hydrophobicity of the top layer can practically be neglected. Cobb1800 seem to fluctuate
somewhat, although a slight increase was seen when Cobb on the base was at its highest level,
but the change is in comparison very small. The results of the trial undoubtedly suggest that
Cobb60 on the base layer can be raised significantly without compromising Cobb1800.
Another interesting observation from the trial was that the addition of ASA could be lowered
quite substantially before the hydrophobicity on the base layer started to drop. As discussed in
section 2.6, the response curve for sizing with ASA can be rather sharp. This effect can be
seen when lowering the dosage from 0,5 to 0,4 kg ASA/ton which resulted in a quicker
increase in the values of Cobb60(Base) than previously. The supplier of the ASA size used in
this trial had suggested not to add less than 0,6 kg/ton since lower dosages might decrease the
hydrophobicity quickly. This seems to be accurate, although with some safety margin.
4.2 Machine trial 2 at PM1 Based on the results of the first machine trial, a follow-up study was of interest. Since trial 1
was very short, it is hard to draw any clear conclusion about whether a higher value for
Cobb60 on the base layer can be implemented as a long-term solution. Of interest in the
second machine trial was:
How will Cobb1800 be affected by higher values for Cobb60(Base) in a longer
perspective and by different basis weight and operating conditions?
Is it possible to maintain a higher value without great variations?

54
How much can the addition of ASA be decreased by allowing higher values for
Cobb60(Base)?
4.2.1 Method The second trial was performed between 2013-05-22 7:00 and 2013-05-28 14:00. During this
period the target value for Cobb60 on the base layer was changed from 30 to 35 g/m2 and the
machine operators were instructed to adjust the dosage of ASA to maintain this value. At the
beginning of the trial the dosage of ASA was decreased stepwise to reach the target of 35.
During this initial phase of the trial, testing of Cobb60(Base) was performed at the autoline
lab for every produced tambour and Cobb1800 was tested every second tambour. When the
values of Cobb60(Base) had stabilized at an appropriate level, the normal testing frequency
was resumed. Royal Brown with basis weights between 115 and 225 g/m2 was produced
during the machine trial. Note that the sizing agent used was not the same as in trial 1. An
unplanned production stop occurred during the trial between 2013-05-26 08:00 and
2013-05-24 12:00.
4.2.2 Results and discussion The results of the whole trial are presented in three figures below. Note that some tambours
have been included before and after the trial. The variations of all three Cobb values during
the trial are shown in figure 37, while the variation of Cobb60 of the base layer is displayed
along with the addition level of ASA in figure 38. Figure 39 presents the proportions of pulps
used in the production of paper during the trial. Data about basis weights for the tambours in
the trial as well as values for chemical dosages, pH, temperature and conductivity can be
found in appendix C.

55
Figure 37: Cobb values during the trial. Cobb60 is shown on the left vertical axis and Cobb1800 is shown on the right
vertical axis. The green horizontal lines denote the target value and rejection limit for Cobb60(Base). The upper green
line also represents the action limit for Cobb1800.
Figure 38: Cobb60(Base) and dosage of ASA during the trial. Values for Cobb60 are shown on the left vertical axis
and the added amount of ASA is shown on the right vertical axis. The green horizontal lines denote the target value
and rejection limit for Cobb60(Base).
115
120
125
130
135
140
145
25
30
35
40
45
50
20
13
-05
-22
20
13
-05
-23
20
13
-05
-24
20
13
-05
-25
20
13
-05
-26
20
13
-05
-27
20
13
-05
-28
20
13
-05
-29
Co
bb
18
00
Co
bb
60
Cobb values
Cobb60(Top)
Cobb60(Base)
Cobb1800
0
0.2
0.4
0.6
0.8
1
1.2
1.4
25
30
35
40
45
50
41
41
6
41
41
7
41
41
8
41
41
9
41
42
0
41
42
1
41
42
2
41
42
3
ASA
(kg
/to
n)
Co
bb
60
Cobb60(Base) and dosage of ASA
Cobb60(Base)
ASA (kg/ton)

56
Figure 39: The proportion of pulps used in the base layer during the trial.
When the trial started the addition of ASA had been stable at 1,2 kg/ton for some time. The
dosage of ASA was lowered until the addition level of 0,75 kg/ton was reached and since the
value of Cobb60 on the base layer was about 34 for the first tambour at this level, no further
decrease in dosage was made. For the following two tambours the Cobb60 value increased
considerably, despite no change in ASA addition. Notice the rapid change in Cobb60(Base) in
the left parts of the plots in figures 37 and 38, which was unexpected since there should
normally not be any delay in response to a change in dosage of ASA due to its reactive nature.
Following this high value, the dosage of ASA was increased and eventually Cobb60 on the
base layer stabilized around 38 with 1 kg/ton of ASA being added. The seemingly high level
of Cobb60(Base) despite relatively high dosage of ASA are hard to explain because there
were no major changes made to the process during the first phase of the trial. After the
Cobb60 values had stabilized testing was resumed at normal frequency.
From figure 37 it is evident that Cobb1800 remained at stable levels, around or below 130, for
most parts of the trial even though several tambour with high Cobb60 on the base layer were
produced. One exception is a tambour around 2013-05-26, which had a Cobb1800 of nearly
140. This high value is somewhat strange since the tambours both before and afterwards had
values around 125 and no change in the process seems to have occurred. One possibility is
that it is simply an incorrect value. Some tambours with slightly higher Cobb1800 were also
produced in the early parts of the trial when Cobb60(Base) had some very high values.
However, notice that one of the tambours with Cobb1800 around 137 was produced before
the trial started and Cobb60 on the base layer was only about 28. Even if some tambours are
produced with values of Cobb1800 up to 140 it is not critical since there is still some margin
to the action limit and a large margin to the rejection limit. One notion is in place; it is not
0
10
20
30
40
50
60
70
41
41
6
41
41
7
41
41
8
41
41
9
41
42
0
41
42
1
41
42
2
41
42
3
%
Pulp compositions
Recycled Pulp (%)
Broke (%)
Softwood Pulp (%)

57
known how Cobb1800 would be affected by high values for Cobb60(Base) if Cobb60(Top)
would attain higher values than those achieved in trial 1 and 2. During both trials, Cobb60 on
the top layer was stable just below 30 but it is possible that a higher value would cause the
hydrophobicity of the base layer to become more critical. In any case, the most economical
solution to such a problem is probably to add more sizing agent to the top layer rather than the
base layer.
After the initial phase of the trial and the production stop, the addition of ASA was greatly
reduced (figure 38) and reached a lowest value of 0,35 kg/ton around 2013-05-26. By looking
at the pulp compositions in figure 39 it is clear that this very low dosage of ASA coincides
with a significantly decreased use of recycled pulp and, consequently, an increased use of
softwood pulp. These are not normal conditions; the basis weights being produced at that time
were 125 and 135 g/m2 and usually about one third of the base layer is made up of recycled
pulp for these basis weights. The known fact that recycled pulp is harder to size than virgin
pulp has been discussed previously and this is undoubtedly the main contribution to the very
low levels of ASA required to achieve sizing at that time point.
The last stage of the trial is characterized by a constant addition level of ASA at 0,7 kg/ton
and a more normal pulp composition. During this period, Cobb60(Base) was in most cases
slightly below 35 but several tambours had values above 40 with the highest one being 43,5.
Perhaps the dosage of sizing agent should have been increased at an earlier point in response
to the high values but this was not the case for unknown reasons. Notice that Cobb60 on the
base layer does not decrease immediately as the dosage of ASA is increased at the end of the
trial (figure 38). The third tambour with an ASA addition of 1 kg/ton had a Cobb60(Base) of
42. The behavior is similar to that in the beginning of the trial where a response to the lowered
dosage was not observed directly but rather for the following tambours.
It is obvious that the Cobb60 value on the base layer varied quite a lot at the lower sizing
levels achieved in this trial and no clear explanations can be found in the variation of other
variables. One factor that might have affected the results is that the addition of BMA
(colloidal silica) to the base layer was reduced from 0,7 kg/ton in the beginning to around 0,4
at the end, due to delivery issues. Since BMA is used as a retention agent, it is not
unreasonable that the reduction could have led to lower, or more fluctuating, retention of ASA
in the paper and in turn higher variation in Cobb60 on the base layer. However, this cannot
explain the large variation in Cobb60(Base) during the initial phase of the trial. The addition
level of BMA versus tambour number can be viewed in appendix C. Aside from the
proportions of pulps used in the base layer and the change in dosage of BMA there were very
few changes made to the process. During the previous trial, which was performed with
another ASA product, there were no similar large fluctuations in the values of Cobb60(Base)
but that trial was too short to draw any conclusions about whether one or the other ASA
product has a more stable performance.
Since the ASA product used in trial 1 was different from the one in trial 2, a direct
comparison of addition levels between the two machine trials is not possible. However, the
sizing agent used in the second trial is identical to the one used during 2011 and 2012. For

58
2012 the average addition of ASA was 1,08 kg/ton but varied rather much. In figure 38 it can
be seen that the addition level of ASA was 1,2 kg/ton both before the start and after the end of
the trial. Based on this, 1,1 kg ASA per ton paper seems to be a realistic assumption for the
size consumption if the target value for Cobb60(Base) is kept at 30 g/m2. In the end of the
machine trial with target value 35, ASA dosage was stable at 0,7 kg/ton but yielded some high
values for Cobb on the base layer so a fair assumption might be that 0,8 kg/ton is a reasonable
level of ASA dosage that should be able to achieve on an average basis. These assumptions
give an estimated reduction in ASA consumption of 0,3 / 1,1 = 27%. The price of the ASA
product (including the polymer for dispersion) was 25,84 SEK/kg in April 2013, so the
savings per ton produced paper equals 7,75 SEK (=0,3*25,84) . The production of paper at
PM1 in year 2012 was about 350 000 tons (omitting Royal Mottled and solid quality) of
which the base layer constituted about 78% on average. Using this number, the annual savings
approximates to 2,1 MSEK (=7,75*350000*0,78).
If a target value of 35 for Cobb60 on the base layer would be implemented permanently there
are some alternative approaches. One option is simply to change the target to 35 and adjust
the action limits to 32 and 38 (from 27 and 33). Another alternative is to also raise the
rejection limit from 50 to 55 so that the risk of producing rejected tambours is decreased.
Recall that the rejection limits for Cobb60(Base) are only internal and a change is possible
without altering the specified quality of the paper. During the trial, the values of
Cobb60(Base) were occasionally high but still had some margin to 50. Moreover, the dosage
of ASA should have been increased at that point, which would have led to lower values. The
very high values attained in the beginning of the trial could have been a result of a too fast
lowering of size addition since there appeared to be a delay in response to changes in ASA
dosage during the trial. A rejection limit of 50 would most likely be possible, although a
raised rejection limit could be advisable (at least to begin with) to ensure that no rejected
tambours are produced. One option could be to set a lowest recommended dose since a too
low addition of ASA might increase the likelihood of rapid changes in the Cobb values on the
base layer. A last option is of course to set the target value somewhere between 30 and 35,
which is sort of a compromise.
5 Conclusions From the data analysis and the machine trials at PM1 it can be concluded that
At PM1, very few tambours with Cobb values above the upper action limits have been
produced during the years 2011 and 2012.
There were no noticeable differences in average Cobb values between year 2011 and
2012 at PM1.
For both RW and R2000 at PM2, the average addition of rosin size to the paper
increased with 10% year 2012 compared to 2011.
All average Cobb values at PM2 decreased 2012 compared to 2011 for both RW and
R2000. This decrease, and the increase in rosin size consumption, appears to be

59
mainly because of high values of Cobb1800 for RW, which became an issue when the
new specifications for Cobb1800 were implemented in the beginning of 2012.
RW has had higher averages of Cobb1800 and Cobb60(Top), as well as higher
average rosin size addition to the paper, compared to R2000. A probable explanation
to why RW appears harder to size is that it contains a higher amount of filler than
R2000.
For a certain range of values for Cobbb60(Top), RW appears to give higher values of
Cobb1800 compared to R2000.
The rosin size consumption for R2000 can be decreased by approximately 0,09 kg/ton
for each unit that Cobb60(Top) is increased, on an average basis. If the average is
raised from about 27 (year 2012) to 30, the estimated annual savings are about
450000 SEK.
Achieving low values for Cobb60 on both the base and top layer seems somewhat
easier for higher basis weights. The average of Cobb1800 increases with basis weight
at PM1 but is unaffected at PM2.
The results for the Cobb60 tests at both the base and top layer are generally higher
when the paper is retested one week after it has been produced, compared to at the
initial test.
There is a low correlation between Cobb60 on the base layer and Cobb1800 for both
PM1 and PM2.
The multivariate models were poor at explaining and predicting the results of the Cobb
tests. The difference between RW and R2000 dominated the model for the top layer of
PM2, whereas the basis weight was the most important variable for all other models
(aside from the size addition).
Based on the two machine trials at PM1, the hydrophobicity of the base layer,
measured as Cobb60, seems to be of minor importance for Cobb1800 and a higher
target value for Cobb60(Base) should be possible to implement without compromising
Cobb1800 at PM1.
If the target value for Cobb60(Base) at PM1 is raised from 30 to 35 g/m2, it would
lead to estimated annual savings of 2,1 MSEK from the decreased ASA consumption.
6 Recommendations for the future Suggested changes for PM1 are presented in table 10. The target value for Cobb60(Base) has
been raised from 30 to 35 and the lower and upper rejection limits have been adjusted so that
they are three units above and below the target, as in the original setup. The upper rejection
limit has been left unchanged but one option is to raise it to 55 and thereby decrease the risk
that produced paper will attain values above this limit. If a change of rejection limits is
approved it might be an advisable approach, since there were some rather large fluctuations in
Cobb60(Base) during the second machine trial.

60
PM1 Lower
rejection limit Lower Action
Limit Target Upper Action
limit Upper
rejection limit Cobb60(Top) 22 27 30 33 40 Cobb60(Base) 22 32 35 38 50 Cobb1800 145 155 Table 10: Recommended targets and limits for Cobb at PM1. Red values have been modified.
By the time of completion of this work, a decision had been made to permanently use the
ASA that was used in machine trial 1, in the base layer at PM1. Therefore it is advisable to
perform a trial with raised target value for Cobb60(Base), using the new ASA size, since there
might be differences in performance between the two products. Such a trial should be
performed for a longer period than machine trial 2 presented in this work, to provide a solid
foundation upon which a decision can be made whether the target value should be
permanently raised and whether the upper rejection limits should be raised as well.
For RW at PM2, Cobb1800 has normally been closer to its upper action limit than
Cobb60(Top) and there are indications that a value for Cobb60 on the top layer up to 33 for
RW might cause excessive risk of Cobb1800 reaching too high levels. For R2000, both
Cobb60(Top) and Cobb1800 have generally been low, meaning that unnecessarily high
amounts of rosin size is often added to paper of this quality. New recommended targets and
action limits for the Cobb values at PM2 are shown in table 11. The target values, as well as
the upper and lower action limits for Cobb60(Top) have been modified and are slightly
different between the two main qualities. Blue values represent RW and green values
represent R2000. All black values are maintained as in the original specification.
PM2 Lower
rejection limit Lower Action
Limit Target Upper Action
limit Upper
rejection limit Cobb60(Top) 22 26 28 29 31 32 34 40 Cobb60(Base) 22 27 30 33 50 Cobb1800 145 155 Table 11: Recommended targets and limits for Cobb at PM2. Blue values are for Royal White and green values are
for Royal 2000.
The slightly raised lower action limit for R2000 is intended to result in a decreased
consumption of rosin size. Too low levels for Cobb60 on the top layer just means that
excessive amounts of sizing agent is being used and the risk that R2000 will attain high values
of Cobb1800 appears insignificant. The change might seem small but, by considering that the
average value for Cobb60(Top) for R2000 during year 2012 was 27,1, it can be realized that a
majority of the produced tambours have had values below 28 and such a small modification
can give a relatively large impact. Estimated savings from achieving higher values of
Cobb60(Top) for R2000 have been discussed in this report (section 3.2.2) but depend largely
on to which extent this Cobb value can be raised. How much the average of Cobb60 on the
top layer will increase if the target value and action limits for R2000 are raised as suggested is
very hard to say, more than that it should increase by at least one unit. Recall that one unit
corresponds to around 150000 SEK/year

61
The target value and action limits for Cobb60(Top) for RW have been decreased to reduce the
risk that Cobb1800 will attain too high values. Having a value of Cobb60 on the top layer
below 32 is by no means a guarantee that Cobb1800 will be below 145 but the likelihood of
attaining high Cobb1800 values are certainly reduced at lower levels for Cobb60(Top). The
recommended change should not lead to any significant increase in consumption of rosin size
for RW since the new target value is still higher than the average for Cobb60 on the top layer
during 2012 (28,3). The change is rather an adaption to what the level of Cobb60(Top) is
likely to be when the upper action limit for Cobb1800 is considered.
A positive effect of the different upper action limits for the two discussed qualities is that, if
production is shifted from R2000 to RW and Cobb60 on the top layer has been relatively
high, the dosage of rosin size will have to be increased directly. This should help to avoid
situations where the Cobb values on the top layer increases too much due to the quality
change and hopefully the issue will be prevented before it arises. The new target values and
action limits for Cobb60 on the top layer at PM2 should preferably not be implemented in a
permanent fashion right away. A trial period with the suggested changes is advised to evaluate
if the new targets and action limits are appropriate and function as intended.
No target values or lower action limits for Cobb1800 have been recommended for neither
PM1 nor PM2 since achieving values close to the target for both Cobb60(Top) and Cobb1800
could possibly be conflicting goals at times. Moreover, the low testing frequency makes it
unsuitable to use as a guide for how much sizing agent that should be added. A better
approach, which has been used in the recommendation above, is to set the values for Cobb60
on the base and top layer so that Cobb1800 is likely to remain within an appropriate range,
but without adding unnecessarily high amounts of sizing agents.
At PM1 it should also be investigated how the sizing with ASA at the base layer is affected by
the late dosage of alum. In section 3.2.1 it was discussed that a higher dosage of alum at the
late addition point seemed to coincide rather well with a decreased dosage of ASA. If the
consumption of ASA could be reduced by adding more alum there are some potential saving
to be made.
Also at PM2 an optimal dosage of alum at PM2 should be determined by some form of trial.
If a high addition level of alum increases the efficiency of the rosin sizing it could be
economical too add more alum. On the other hand, if the rosin sizing does not seem to be
affected, some savings could be made by reducing the alum dosage.

62
7 References [1] Smurfit Kappa Group. Smurfit Kappa Kraftliner [cited 2013 May 13]. Available from:
http://www.smurfitkappa.com/vhome/se/kraftliner/Sidor/Default.aspx
[2] Ek, M. Gellerstedt, G. Henriksson, G. (eds.). Pulp and Paper chemistry and
technology Book 3: Paper Chemistry and Technology. Stockholm:
Universitetsservice; 2007
[3] Fellers, C. Norman, B. Pappersteknik. 3rd
ed. Stockholm: TABS; 1998
[4] Neimo, L. Papermaking Science and Technology Book 4: Papermaking Chemistry.
Helsinki: Fapet Oy; 1999.
[5] Tappi. Test method T441 om-09: Water absorptiveness of sized (non-bibulous) paper,
paperboard, and corrugated fiberboard (Cobb test). 2009. Available from:
http://www.tappi.org/Downloads/unsorted/UNTITLED---0104T441pdf.aspx
[6] Rubin, A.J. Hayden, P.L. Studies on the hydrolysis and precipitation of aluminum(III).
State of Ohio: The Ohio state university; 1973.
[7] Zhao, H. Liu, H. Qu, J. Effect of pH on the aluminum salts hydrolysis during
coagulation process: Formation and decomposition of polymeric aluminum species.
Journal of Colloid and Interface Science. 2009; 330:105-112.
[8] Subrahmanyam, S. Biermann, C.J. Generalized rosin soap sizing with coordinating
elements. Tappi Journal. 1992; 75(3): 223-228.
[9] Arnson, T.A. The adsorption of complex aluminum species by cellulosic fibers from
dilute solution of aluminum chloride and aluminum sulfate [dissertation]. Appleton,
Wisconsin: Lawrence University; 1980.
[10] Crow, R.D. The influence of aluminum salts on the adsorption of cationic
polyelectrolyte by cellulosic fibers [dissertation]. Appleton, Wisconsin: Lawrence
University; 1985.
[11] Ito, K. Isogai, A. Onabe, F. Retention behavior of size and aluminum components on
rosin-ester size/alum systems. Journal of wood science. 1999; 45:46-52.
[12] Okuda, T. Ozaki, Y. Isogai, A. Influence of paper stock temperature on aluminum
sulfate/rosin sizing. Appita Journal. 2009; 62(5):365-370.
[13] Johnson, D. Sizing in Acid, Neutral and Alkaline Conditions. In: Thorn, I. Au, C.O.
(eds.). Applications of Wet-end Paper Chemistry, 2nd
ed. Springer; 2009.
[14] Hubbe, M.A. Acidic and alkaline sizings for printing, writing, and drawing papers.
The book and paper group annual 23. 2004; 139-151.
[15] Zou, Y. Hsieh, J.S. Wang, T.S. Mehnert, E. Kokoszka, J. Rosin sizing under neutral-
alkaline papermaking conditions. Tappi Journal. 2004; 3(7):E41-59.
[16] Nitzman, A.F. Royappa, A.T. Sizing variations of dispersed rosin sizes with
fortification, hardness, pH, and temperature. Tappi Journal. 2003; 2(4):8-11.
[17] Zhang, H. Nitzman, A.F. Royappa, A.T. Statistical modeling and sizing determination
guides for dispersed rosin sizes. Tappi Journal. 2004; 3(9):3-8.
[18] Roberts, J.C. (ed.). Paper Chemistry, 2nd
ed. Glasgow: Chapman & Hall; 1996.
[19] Hubbe, M.A. Paper´s resistance to wetting – a review of internal sizing chemicals and
their effects. BioResources. 2006; 2(1):106-145.
63
[20] Ehrhardt, S.M. Gast, J.C. Cationic dispersed rosin sizes. Tappi procedings of the 1988
papermakers conference. Atlanta, GA: Tappi press. 1988;181-187.
[21] Lauzon, R.V. New cationic dispersed rosin size – field trials and successes. Tappi
procedings of the 1997 engineering and papermakers conference. Atlanta, GA: Tappi
press. 1997;819-836.
[22] Zou, Y. Hsieh, J.S. Wang, T.S. Mehnert, E. Kokoszka, J. The mechanism of
premixing rosin sizes for neutral-alkaline papermaking. Tappi Journal. 2004; 3(9):16-
18.
[23] Liu. W. Chen, Z. Duan, H. Sizing behavior of cationic dispersed rosin-ester on
cellulose fibers. Nordic pulp and paper research journal. 2006; 21(5):586-590.
[24] Gess, J.M. Wilson, P.H. Troubleshooting the papermaking process. Atlanta, GA:
Tappi press. 2001.
[25] Wang, F. Tanaka, H. Mechanisms of neutral-alkaline paper sizing with usual rosin
size using alum-polymer dual retention aid system. Journal of pulp and paper science.
2001; 27(1):8-13.
[26] Chen, Q. Ni, Y. He, Z. Using cationic polymers to improve alkenyl succinic anhydride
(ASA) sizing efficiency in high-yield pulp containing furnish. BioResources. 2012;
7(3): 3948-3959.
[27] Isogai, A. Retention behavior of alkenyl succinic anhydride size on handsheets. Sen’i
Gakkaishi. 2000; 56(7):328-333.
[28] Martorana, E. Hoffmann, J. Kleemann, S. Post-curing and size reversion – An
extended mechanism of ASA sizing. International Munich paper symposium, Munich
2011.
[29] Martorana, E. Belle, J. Kleemann, S. ASA sizing – control of particle size, stability
and hydrolysis. PTS Symposium Applied Interface Chemistry, Munich 2010.
[30] Crouse, B. Wimer, D. Alkaline papermaking: an overview. Atlanta, Gerogia: Institute
of paper science and technology; 1990.
[31] Eriksson, L. Johansson, E. Kettaneh-Wold, N. Trygg, J. Wikström, C. Wold, S. Multi-
and megavariate data analysis - Part 1: Basic principles and applications. 2nd
ed.
Umeå: Umetrics; 2006.
[32] Hamzeh, Y. Ekhtera, M.H. Hubbe, M.A. Izadyar, S. Pourtahmasi, K. Effects of
process variables on poly-aluminum chloride (PAC)-rosin sizing performance under
neutral papermaking conditions. Ind. Eng. Chem. Res. 2008; 47(13): 4302-4307.
[33] Holik, H. (ed.). Handbook of paper and board. 2nd
ed. Germany: Wiley-VCH; 2013.
[34] Hubbe, M.A. Venditti, R.A. Rojas, O.J. What happens to cellulosic fibers during
papermaking and recycling? A review. BioResources. 2007; 2(4): 739-788.
[35] Li, H. Ni, Y. Sain, M. The presence of dissolved and colloidal substances in BCTMP
and their effect on sizing. Journal of pulp and paper science. 2002; 28(2): 45-49.
[36] Bajpai, P. Emerging technologies in sizing. United Kingdom: Pira international ltd.
2005.
[37] Springer, A.M. Noe, J.S. Wegner T.H. Fundamental strategy for control of retention
and drainage on a modern paper machine. Tappi procedings of the 1987 papermakers
conference. Atlanta, GA: Tappi press. 1987; 137-140.

64
[38] Katz, G. House, L.W. Alexander, D.E. Sowers, S.L. Marton, J. Internal paper sizing
improvements. U.S. pat. 6540877; 2003.
[39] Vaughn, J.W. Shands, J.A. Genco, J.M. Bousfield, D.W. An investigation of the
relationship between drainage velocity and sheet structure during rapid filtration of
fibrous suspensions. Tappi engineering process and product quality conference. 1999;
3: 1173-1180.
[40] Chen, Q. Ni, Y. He, Z. Using cationic polymers to improve alkenyl succinic anhydride
(ASA) sizing efficiency in high-yield pulp containing furnish. BioResources. 2012;
7(3): 3948-3959.

Appendix A: Coefficient plots from the
multivariate data analysis
In this appendix the coefficient plots based on the multivariate analysis are presented for each
Cobb value in figures 40-45.
Figure 40: Coefficient plot for Cobb60(Base) at PM1.
Figure 41: Coefficient plot for Cobb60(Top) at PM1.

Figure 42: Coefficient plot for Cobb1800 at PM1.
Figure 43: Coefficient plot for Cobb60(Base) at PM2.

Figure 44: Coefficient plot for Cobb60(Top) at PM2.
Figure 45: Coefficient plot for Cobb1800 at PM2.
Appendix B: Machine trial 1 The values for important variables during trial 1 are presented in the table below. The
chemical additions are the setting used, pH, temperature and conductivity are actual values
and the composition of the paper sheet was calculated with data from the database AKL4.

Variable Setting
Rosin size(Top) 0,12 kg/ton
Alum(Top)-early 0,12 kg/ton
Alum(Top)-late 0,2 kg/ton
Alum(Base)-early 0,15 kg/ton
Alum(Base)-late 0,2 kg/ton
PAM(Base) 0,15 kg/ton
PAM(Top) 0,15 kg/ton
BMA(colloidal silica)(Base) 0,75 kg/ton
pH - machine chest(Top) 5,3
pH - wire pit(Top) 5,7
pH - machine chest(Base) 5,9
pH - wire pit(Base) 7,0
Temperature – Headbox 53 ºC
Conductivity 2,6 mS/cm
Recycled pulp in base layer 38%
Softwood pulp in base layer 45%
Broke in base layer 17%
Proportion of top layer 22% Tabell 12: The settings of variables during trial 1.
Appendix C: Machine trial 2 The settings for some variables are shown in table 13. Figure 46 displays the variation in
addition of BMA (colloidal silica).
Variable Setting
Rosin size(Top) 0,15 kg/ton
Alum(Base)-early 0,15 kg/ton
Alum(Base)-late 0,22 kg/ton
PAM(Base) 0,15 kg/ton
BMA(Base) 0,4-0,7 kg/ton
pH - machine chest(Top) 5,3
pH - wire pit(Top) 4,8-5,4
pH - machine chest(Base) 6,4
pH - wire pit(Base) 6,8-7,2
Temperature – Headbox 53–56 ºC
Conductivity 2,4–3,0 mS/cm
Proportion of top layer 25-35% Table 13: The settings of variables during trial 2.

Figure 46: The addition of BMA to paper during trial 2.
0.3
0.35
0.4
0.45
0.5
0.55
0.6
0.65
0.7
0.75
0 20 40 60 80 100 120 140 160 180
BM
A (
kg/t
on
)
Tambour number
BMA

Department of Chemistry
S-901 87 Umeå, Sweden
Telephone +46 90 786 50 00
Text telephone +46 90 786 59 00
www.umu.se