Optimizing Preventive Maintenance - NFMT Ranking / Review as needed Determine failure modes for...
29
Presented by Kate Kerrigan; [email protected] Operations Director, Allied Reliability Group Optimizing Preventive Maintenance 1
Transcript of Optimizing Preventive Maintenance - NFMT Ranking / Review as needed Determine failure modes for...

Presented by Kate Kerrigan; [email protected] Operations Director, Allied Reliability Group
Optimizing
Preventive
Maintenance
1

My Deliverable
• Preventive Maintenance (PM) programs are often the base of every organization’s reliability plans. However, too often they become the repository of desperate measures to placate the organization and half formed root cause analyses. A proactive PM program must be under systemic evaluation to continue to give the results organizations demand.
• I will show you how to evaluate your current PMs to ensure that they are producing proactive, valuable results. In addition, I will show you a systemic evaluation method that you can begin using today to keep your program fresh and in tune with your organization’s changing needs and expectations. 2

Definitions
• Preventive/Routine Maintenance
– Time Based Replacement
– Condition Based
– Sensory
• Criticality
– Equipment relative importance
– Used for allocating assets
3

The I-P-F Curve
4
P: Potential Failure (Defect)
F: Functional
Failure
P-F Interval
I : Installation
I-P Interval
Proactive Standards CBM/PdM Tasks Reactive
Maintenance
Time
Fu
ncti
on
ali
ty

Equipment Health Strategies
• Run to failure
• Time based replacement
• Instrument inspection
– Non-Destructive Testing (NDT)
– PdM/CBM tools and gauges
• Conditional Trending
• Constant Monitoring (Alarms)
5
Routine Maintenance
(PM)

Misconceptions About PM
1. PM systems are all the same. You can just copy the system from the manual or from your old job and it will work.
– PM systems must be designed for the actual equipment as set up, age of the equipment, product, type of service, hours of operation, skill of operators, and many other factors.
2. PM is extra work on top of existing workloads and it costs more money. – PM increases uptime, reduces energy usage, reduces unplanned events, reduces airfreight bills, etc.
There are hundreds of ways PM saves the organization resources. – The only time it is in addition to the existing workload is at the startup when you put a PM system into
place. You will have to spend extra to fund monies not invested into the equipment in the past (pay for past sins).
3. With good forms and descriptions, unskilled people can do PM tasks. – Unskilled (in maintenance) people can do some of the PM tasks successfully with good training and clear
forms. For greatest return on investment, skilled people must be in the loop. TLC activities (such as lubrication, cleaning, or tightening bolts) can certainly be done by trained but not maintenance employees. Generally, inspection benefits greatly from experienced eyes and hands.
4. PM will eliminate breakdown. – The equipment must be able to do the job. PM cannot make a 5 hp motor do the work of a 10 hp motor.
Even with the most advanced PM, there will still be breakdowns from abuse, misapplication, or accident. – Some failure modes do not currently lend themselves to PM approaches (such as some electronics
failures). 6

Process Elements
• PM Policy
• Assets
• Equipment Maintenance Plans (EMP)
• Preventive Maintenance Optimization
7

PM Policy
Purpose: • To prevent unscheduled breakdowns while maintaining
lowest cost – To identify and correct defects before
• They effect performance • They cause subsequent degradation
– To cost effectively maintain the facility • Safety / Environmental (Regulatory) • Competitive in market place
Advocate: • Individual assigned to ensure effectiveness of PM program • Has authority and budget to execute PM program
8

Process Elements
• PM Policy
• Assets
• Equipment Maintenance Plans (EMP)
• Preventive Maintenance Optimization
9

Assets
• Do you know what you have?
• Are they all still there?
• Has criticality been defined?
• Is there a seasonal criticality?
10

11
Equipment Criticality
• Not all equipment is equal
– Standardize Criticality
– Write it down
– Re-assess when business changes
• Determine necessary results
• Maintain to those results

Process Elements
• PM Policy
• Assets
• Equipment Maintenance Plans
• Preventive Maintenance Optimization
12

Equipment Maintenance Plans
• Failure modes – FMEA/RCM – Root Cause Analysis: must go to Systemic and Latent roots – Anecdotal information – OEM/Industry recommendation
• Criteria for Action/Task – Random or life cycle failure – Accessibility to equipment or component – Equipment Health Strategy – Effect of failure
• Frequency – <1/2 Failure (P-F) timeline
13

Current PMs (Example)
• Create 52 Week Load Report • Balance work load
14
Dept Asset Criticality PM/Tasks Frequency # People
Duration Hours /Year
Yearly Materials
100 B123 950 Sample Oil M 1 0.25 3 $ x.xx 100 B123 950 Change Filter SA 2 1 4 $ xx.xx
100 B123 950 Check Vibration
M 1 0.25 3
100 B126 980 Change Oil Q 1 1 4 $ xx.xx
100 B126 980 Sample Oil M 1 0.25 3 $ x.xx 100 B126 980 Check Oil Y 1 0.5 0.5 $ x.xx
100 B126 980 Check Vibration
M 1 0.25 3
100 B127 700 Inspect Filter W 1 0.25 13
100 B127 700 Change Oil Q 1 1 4 $ xx.xx

Equipment Maintenance Data
• 52 Week PM plan
• Failure data (MTBF)
– By individual equipment
– By equipment class
• Resource utilization by equipment
– Labor
– Materials
– Utilities 15

Inspection frequency: Outage
• PMs designed to identify shut down overhaul work should be performed at least 1.5 times before the normal lead time of parts to be ordered.
• For instance, if it takes 3 months to get new parts, and outage is at a specific date, equipment inspection PMs should be performed at least 4.5 months before the outage is scheduled.
• This means these ‘inspection’ PMs need to be in the system.
16

Process Elements
• PM Policy
• Assets
• Equipment Maintenance Plans
• Preventive Maintenance Optimization
17

PM Optimization: Task Evaluation
• Does it prevent a failure?
• Does the failure need to be prevented?
• Is there a better way to do it?
18

PM Evaluation – Existing System
19
PM Task Action Recommendation
# of Tasks % of Tasks Man-Hours
Represented % Man-Hours
Non-Value Added (Delete)
1,640 8% 6,661 8%
Replace with CBM/PdM
6,437 32% 28,222 32%
Reengineer 5,200 26% 26,221 30%
No Modifications Required
6,723 34% 26,192 30%
Totals 20,000 100% 87,296 100%
Source: Allied Reliability Group Assessment at a Steel Mill

PM Review / Refresh
• Intervals for Preventive Maintenance tasks are reviewed frequently and adjusted to optimize costs and equipment needs.
• Review 20% of equipment each year: – Review at least 10% of top critical equipment
– Review 10% of less critical equipment
• This would result in 2% of PMs reviewed each month with 2 months grace for shutdowns and vacations.
20

Review PMs Yearly
• If alterations are necessary, do content first then frequency of PM
• PM Content
• PM Frequency / Efficiency
21
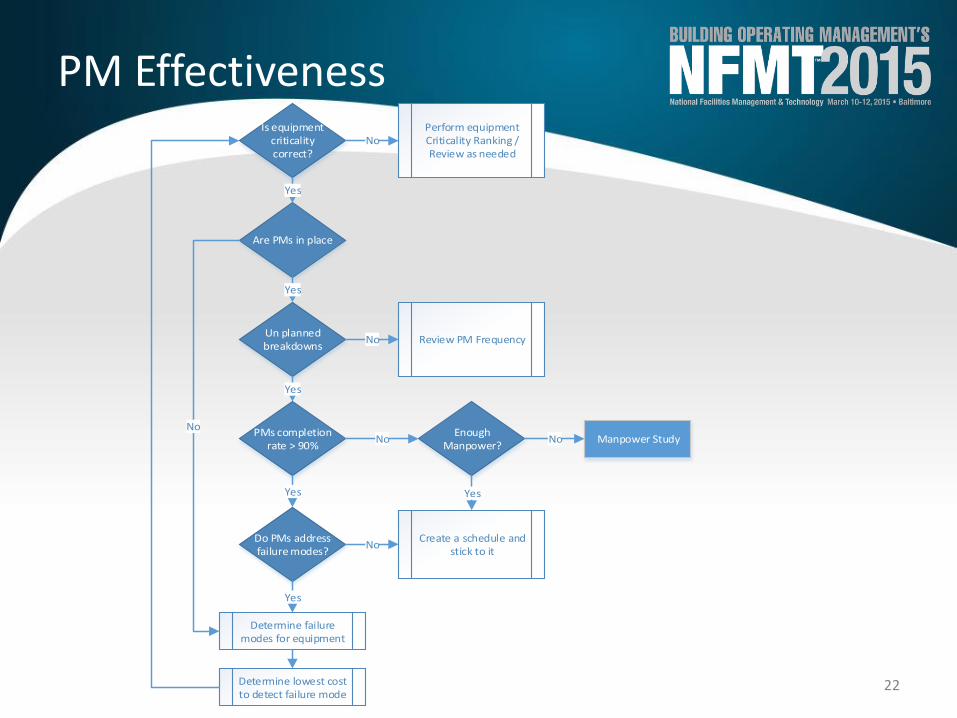
PM Effectiveness
Manpower StudyEnough
Manpower?
Un planned breakdowns
PMs completion rate > 90%
Are PMs in place
Is equipment criticality correct?
Do PMs address failure modes?
Review PM Frequency
Perform equipment Criticality Ranking / Review as needed
Determine failure modes for equipment
Create a schedule and stick to it
Determine lowest cost to detect failure mode
No
Yes
Yes
No
Yes
No No
Yes
Yes
Yes
No
No
22

Time Investment
• Criticality: 30-100 assets/hour
• Current 52 week plan: 2 hours
• Current resource utilization: 4 hours
• Breakdown / MTBF: 8 hours
• PM Optimization review: Method Dependent
– Individual PM: Time to perform it
23

Asset Investment
• Condition Monitoring
– Real Time
– Tools (MCA, Ultrasound, Infrared, Vibration, …)
• Accessibility Improvements
24

Payback Opportunities
• Reduced material costs
• Improved equipment life (delay capital)
• Reduced labor
– Contract Labor
– Overtime
• Reduced energy cost
• Reduced MRO inventory
25

Total Cost of Maintenance
26 Maintenance Effort
Co
st
Cost of Proactive Maintenance
Cost of Downtime for Proactive Maintenance
Cost of Emergency Maintenance
Cost of Emergency Downtime
Total Cost of Maintenance

Optimizing Preventive Maintenance
Questions / Comments?
27

Poor Root Cause Analyses
Defect: Flight attendant cold at altitude. Action: Ground checks OK. Defect: 3 roaches in cabin. Action: 1 roach killed, 1 wounded, 1 got away. Defect: Weather radar went ape! Action: Opened radar, let out ape, cleaned up mess! Defect: Left inside main tire almost needs replacement. Action: Almost replaced left inside main tire.
Defect: Something loose in cockpit. Action: Something tightened in cockpit. Defect: Evidence of leak on right main landing gear. Action: Evidence removed. Defect: DME volume unbelievably loud. Action: DME volume set to more believable level. Defect: Test flight OK, except auto-land very rough. Action: Auto-land not installed on this aircraft. 28

Bearing L10 Life
Source: http://machinedesign.com/bearings/meaning-bearing-life
Relative effects of contamination and lubrication condition on bearing life with different load levels
29