Optimizing Photo Composition - Contrastly is the arrangement of visual elements in the image frame,...
13
Optimizing Photo Composition Ligang Liu Renjie Zhejiang University, China Chen Lior Wolf Daniel Cohen-Or Tel-Aviv University, Israel Technical Report Jan. 2010
-
Upload
hoangthien -
Category
Documents
-
view
218 -
download
1
Transcript of Optimizing Photo Composition - Contrastly is the arrangement of visual elements in the image frame,...

Optimizing Photo Composition
Ligang Liu Renjie Zhejiang University, China
Chen Lior Wolf Daniel Cohen-Or Tel-Aviv University, Israel
Technical Report
Jan. 2010
Optimizing Photo Composition
Ligang Liu∗ Renjie Chen†
Zhejiang Unviersity, ChinaLior Wolf‡ Daniel Cohen-Or§
Tel-Aviv University, Israel
(a) (b) (c) (d)
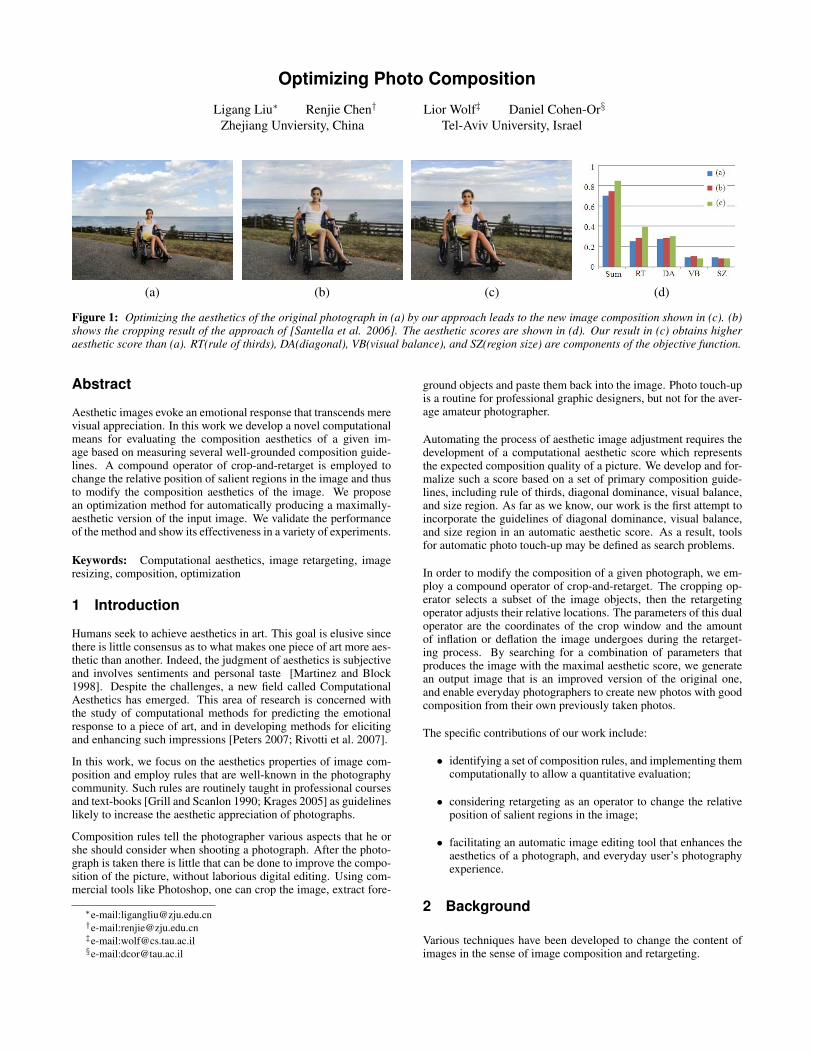
Figure 1: Optimizing the aesthetics of the original photograph in (a) by our approach leads to the new image composition shown in (c). (b)shows the cropping result of the approach of [Santella et al. 2006]. The aesthetic scores are shown in (d). Our result in (c) obtains higheraesthetic score than (a). RT(rule of thirds), DA(diagonal), VB(visual balance), and SZ(region size) are components of the objective function.
Abstract
Aesthetic images evoke an emotional response that transcends merevisual appreciation. In this work we develop a novel computationalmeans for evaluating the composition aesthetics of a given im-age based on measuring several well-grounded composition guide-lines. A compound operator of crop-and-retarget is employed tochange the relative position of salient regions in the image and thusto modify the composition aesthetics of the image. We proposean optimization method for automatically producing a maximally-aesthetic version of the input image. We validate the performanceof the method and show its effectiveness in a variety of experiments.
Keywords: Computational aesthetics, image retargeting, imageresizing, composition, optimization
1 Introduction
Humans seek to achieve aesthetics in art. This goal is elusive sincethere is little consensus as to what makes one piece of art more aes-thetic than another. Indeed, the judgment of aesthetics is subjectiveand involves sentiments and personal taste [Martinez and Block1998]. Despite the challenges, a new field called ComputationalAesthetics has emerged. This area of research is concerned withthe study of computational methods for predicting the emotionalresponse to a piece of art, and in developing methods for elicitingand enhancing such impressions [Peters 2007; Rivotti et al. 2007].
In this work, we focus on the aesthetics properties of image com-position and employ rules that are well-known in the photographycommunity. Such rules are routinely taught in professional coursesand text-books [Grill and Scanlon 1990; Krages 2005] as guidelineslikely to increase the aesthetic appreciation of photographs.
Composition rules tell the photographer various aspects that he orshe should consider when shooting a photograph. After the photo-graph is taken there is little that can be done to improve the compo-sition of the picture, without laborious digital editing. Using com-mercial tools like Photoshop, one can crop the image, extract fore-
∗e-mail:[email protected]†e-mail:[email protected]‡e-mail:[email protected]§e-mail:[email protected]
ground objects and paste them back into the image. Photo touch-upis a routine for professional graphic designers, but not for the aver-age amateur photographer.
Automating the process of aesthetic image adjustment requires thedevelopment of a computational aesthetic score which representsthe expected composition quality of a picture. We develop and for-malize such a score based on a set of primary composition guide-lines, including rule of thirds, diagonal dominance, visual balance,and size region. As far as we know, our work is the first attempt toincorporate the guidelines of diagonal dominance, visual balance,and size region in an automatic aesthetic score. As a result, toolsfor automatic photo touch-up may be defined as search problems.
In order to modify the composition of a given photograph, we em-ploy a compound operator of crop-and-retarget. The cropping op-erator selects a subset of the image objects, then the retargetingoperator adjusts their relative locations. The parameters of this dualoperator are the coordinates of the crop window and the amountof inflation or deflation the image undergoes during the retarget-ing process. By searching for a combination of parameters thatproduces the image with the maximal aesthetic score, we generatean output image that is an improved version of the original one,and enable everyday photographers to create new photos with goodcomposition from their own previously taken photos.
The specific contributions of our work include:
• identifying a set of composition rules, and implementing themcomputationally to allow a quantitative evaluation;
• considering retargeting as an operator to change the relativeposition of salient regions in the image;
• facilitating an automatic image editing tool that enhances theaesthetics of a photograph, and everyday user’s photographyexperience.
2 Background
Various techniques have been developed to change the content ofimages in the sense of image composition and retargeting.

2.1 Image composition and aesthetics
Composition is the arrangement of visual elements in the imageframe, which is an essential aspect in the creation of a vast vari-ety of artistic work. In their daily work, professional photographersbring to bear a wealth of photo composition knowledge and tech-niques [Martinez and Block 1998]. No absolute rules exist that en-sure good composition in every photograph; rather, there are onlysome heuristic principles that provide a means of achieving an eye-pleasing composition when applied properly. Some of these princi-ples include: rule of thirds, shapes and lines, amputation avoidance,visual balance, and diagonal dominance [Krages 2005].
There has been several attempts to allow automatic images crop-ping or capturing based on the visual quality of the output. Simpletechniques from traditional artistic composition have been appliedto the artistic rendering of interactive 3D scenes [Kowalski et al.2001]. The work of Suh et al. [2003] develop a set of fully au-tomated image cropping techniques using a visual salience modelbased on low-level contrast measures [Itti et al. 1998] and an image-based face detection system. [Gooch et al. 2001] uses the rules ofthirds and fifths to place silhouette edges of 3D models in view se-lection. [Byers et al. 2004] positions the features of interest in anautomatic robot camera using the rule of thirds. [Lok et al. 2004]considers some balance heuristic to arrange images and text objectsin a window. Zhang et al. [2005] propose 14 templates that utilizecomposition rules to crop photos by using face detection results.Santella et al. [2006] present an interactive method based on eyetracking for cropping photographs. Instead of improving aesthet-ics, Wang and Cohen [2006] propose an algorithm for composingforeground elements onto a new background by integrating mat-ting and compositing into a single optimization process. Recently,a quality classifier that assesses the composition quality of imagesis statistically built using large photo collections available on web-sites [Nishiyama et al. 2009]. The cropped region with the highestquality score is then found by applying the quality classifier to thecropping candidates.
Other attempts to improve image aesthetics modify aspects otherthan image composition. For example, Cohen-Or et al. [2006],seek to enhance the harmony among the colors of a given image;Leyvand et al. [Leyvand et al. 2008] enhance the attractiveness ofdigital faces based on a training set.
2.2 Image retargeting
Image retargeting deals with displaying images on small screenssuch as cell phone displays. The goal of retargeting is to pro-vide effective small images by preserving the recognizability ofimportant image features during downsizing. Please refer [Shamirand Sorkine 2009] for a recent insightful survey on the problem ofcontent-aware retargeting of images or videos.
Setlur et al. [2005] segment an image into regions and identifies im-portant regions. Then, important regions are cut and pasted on theresized background, where missing background regions are filledusing inpainting. In our work, we extract salient regions similartly,and use them as primitives in the aesthetic objective function.
The relative distance and distributions of salient objects around theimage play a crucial rule in its aesthetics. We therefore employ non-homogenous warping techniques to alter the compositions of thegiven images. One of the first systems to allow such warpings sub-ject to region-preserving constraints was by Gal et al. [2006], whopresent a mapping that preserves the shape of important features byconstraining their deformation to be a similarity transformation.
Avidan and Shamir [2007] propose a content-aware approach where
a seam-carving operator changes the size of an image by gracefullycarving-out pixels in unimportant parts of the image. The seam-carving operator is extended to video retargeting and media retar-geting [Rubinstein et al. 2008; Rubinstein et al. 2009]. The work ofWolf et al. [2007] presents a retargeting solution for video, in whichthe warping is computed as a solution for a linear set of equations.Wang et al. [2008] propose an optimized scale-and-stretch approachfor resizing images. Recently, some patch based methods are pro-posed to edit images by allowing modifications of the relative posi-tion of objects [Cho et al. 2008; Simakov et al. 2008; Barnes et al.2009].
Restricted to still images, the work of Wolf et al. proposes an al-ternative to the work of Avidan and Shamir. While both methodsare efficient and effective, we choose to use the method of Wolf etal. since it seems to produce less artifacts due to its continuous na-ture. Similarly to Avidan and Shamir’s Seam Carving method, themethod of Wolf et al. [2007] takes as input a saliency map F and anew image width Wnew. The treatment of vertical warping is doneindependently and in an analog manner. The method then solvesa system of equations where the new location xi,j of each pixel(i, j) along the x axis is an unknown. The location of the leftmostcolumn of pixels in the new image is set to be 1, and the rightmostcolumn is constrained to beWnew. Two types of equations are usedto constrain the remaining pixels:
Fi,j(xi,j − xi−1,j) = Fi,j (1)W (xi,j − xi,j+1) = 0 (2)
The first type of equations encourages pixels to be warped at a dis-tance of one pixel apart from their neighbors to the left, and thesecond type encourages pixels to be warped by the same amount oftheir neighboring pixel below. The system of equations is solved ina least squares manner, and according to the saliency map F andthe weight W , some of the constraints get priority over others. Inparticular, salient pixels keep their space, while less salient pixelsare “squished”. The end result is a warping which is smooth, andwhich more often than not produces images that seem natural.
3 Overview
Increasing the aesthetics of a given image is a twofold problem:how to modify the image and how to measure its new aesthetics.The answer to the latter question is the core of our method. InSection 4 we describe the specific image properties we measure,and how these are computed algorithmically.
As for the first problem, our method employs a compound operatoras means to modify a given image: it non-homogeneously retargetsa cropped part of the image into a target frame having differentdimensions than the original image. Then the results are remappedhomogeneously to the dimensions of the original image. This multi-stage operator modifies the proportion, the interrelation among thegeometric entities, and the composition of the image.
The parameters of the above recomposition operator constitute a6D space. The cropping frame has four degrees of freedom and thetarget frame two. To reduce the dimensionality of the search space,we limit the crop and target frames to have the same aspect-ratioas the input image, reducing the number of parameters to four: xand y position of the cropping frame, its width, and the amount ofretargeting, see Figure 2.
To further reduce the search space, we limit the size of the cropand target frames to be no less than 75% of the original frame size.In Section 5 we show that this reduced search space is effectiveenough to improve the aesthetics of a given image without causinga dramatic change to the semantics of the original image.
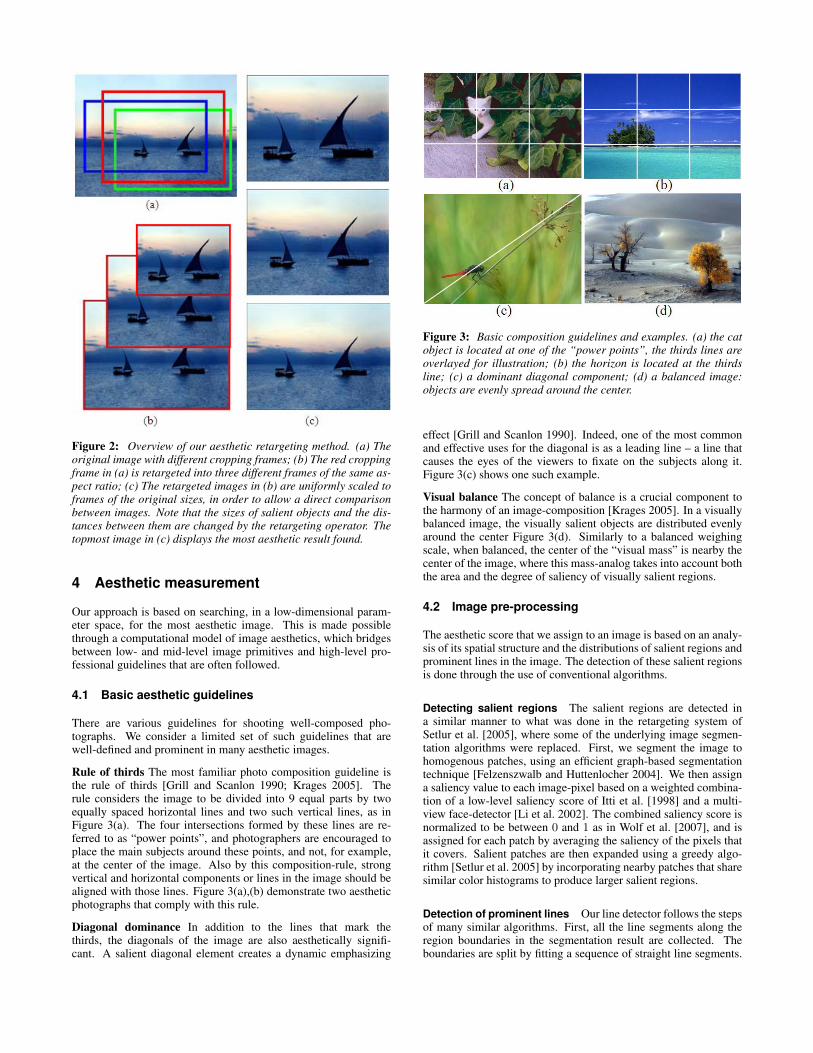
Figure 2: Overview of our aesthetic retargeting method. (a) Theoriginal image with different cropping frames; (b) The red croppingframe in (a) is retargeted into three different frames of the same as-pect ratio; (c) The retargeted images in (b) are uniformly scaled toframes of the original sizes, in order to allow a direct comparisonbetween images. Note that the sizes of salient objects and the dis-tances between them are changed by the retargeting operator. Thetopmost image in (c) displays the most aesthetic result found.
4 Aesthetic measurement
Our approach is based on searching, in a low-dimensional param-eter space, for the most aesthetic image. This is made possiblethrough a computational model of image aesthetics, which bridgesbetween low- and mid-level image primitives and high-level pro-fessional guidelines that are often followed.
4.1 Basic aesthetic guidelines
There are various guidelines for shooting well-composed pho-tographs. We consider a limited set of such guidelines that arewell-defined and prominent in many aesthetic images.
Rule of thirds The most familiar photo composition guideline isthe rule of thirds [Grill and Scanlon 1990; Krages 2005]. Therule considers the image to be divided into 9 equal parts by twoequally spaced horizontal lines and two such vertical lines, as inFigure 3(a). The four intersections formed by these lines are re-ferred to as “power points”, and photographers are encouraged toplace the main subjects around these points, and not, for example,at the center of the image. Also by this composition-rule, strongvertical and horizontal components or lines in the image should bealigned with those lines. Figure 3(a),(b) demonstrate two aestheticphotographs that comply with this rule.
Diagonal dominance In addition to the lines that mark thethirds, the diagonals of the image are also aesthetically signifi-cant. A salient diagonal element creates a dynamic emphasizing
Figure 3: Basic composition guidelines and examples. (a) the catobject is located at one of the “power points”, the thirds lines areoverlayed for illustration; (b) the horizon is located at the thirdsline; (c) a dominant diagonal component; (d) a balanced image:objects are evenly spread around the center.
effect [Grill and Scanlon 1990]. Indeed, one of the most commonand effective uses for the diagonal is as a leading line – a line thatcauses the eyes of the viewers to fixate on the subjects along it.Figure 3(c) shows one such example.
Visual balance The concept of balance is a crucial component tothe harmony of an image-composition [Krages 2005]. In a visuallybalanced image, the visually salient objects are distributed evenlyaround the center Figure 3(d). Similarly to a balanced weighingscale, when balanced, the center of the “visual mass” is nearby thecenter of the image, where this mass-analog takes into account boththe area and the degree of saliency of visually salient regions.
4.2 Image pre-processing
The aesthetic score that we assign to an image is based on an analy-sis of its spatial structure and the distributions of salient regions andprominent lines in the image. The detection of these salient regionsis done through the use of conventional algorithms.
Detecting salient regions The salient regions are detected ina similar manner to what was done in the retargeting system ofSetlur et al. [2005], where some of the underlying image segmen-tation algorithms were replaced. First, we segment the image tohomogenous patches, using an efficient graph-based segmentationtechnique [Felzenszwalb and Huttenlocher 2004]. We then assigna saliency value to each image-pixel based on a weighted combina-tion of a low-level saliency score of Itti et al. [1998] and a multi-view face-detector [Li et al. 2002]. The combined saliency score isnormalized to be between 0 and 1 as in Wolf et al. [2007], and isassigned for each patch by averaging the saliency of the pixels thatit covers. Salient patches are then expanded using a greedy algo-rithm [Setlur et al. 2005] by incorporating nearby patches that sharesimilar color histograms to produce larger salient regions.
Detection of prominent lines Our line detector follows the stepsof many similar algorithms. First, all the line segments along theregion boundaries in the segmentation result are collected. Theboundaries are split by fitting a sequence of straight line segments.

Figure 4: Detection of salient regions and prominent lines in im-ages. The red line has higher saliency value than the green andblue ones. The darker the regions are, the larger the salience valueare.
Then, out of the infinite straight lines that contain the line segments,the one straight line with the largest support is selected. This mostsupported line is refined based on the participating segments, andtrimmed according to the support. The supporting segments areremoved, and the process repeats.
In addition to the line detector, we also fit lines to elongated salientregions that may exist in the image. For each detected salient re-gions Si in the image, we examine the covariance matrix of thecoordinates of all its pixels. If the ratio of the first and the secondeigenvalue of this 2× 2 matrix is larger than a threshold (θr = 3),we fit a line segment to the pixels of the region Si. This line seg-ment is added to the list of detected lines, and all pixels from Si
that lie on this segment are considered its support.
Each detected line L is assigned a saliency value I(L) = (s1 +s2+ s3)/3, where s1 is the total length of the projections of all linesegments that support L, s2 is proportional to the length of L, s3is the median value of the norm of the gradient (computed by theSobel operator) of the pixels along the line L, and all three valuesare normalized to be no more than one. The higher the value ofI(L) is, the more important the prominent line L is in the image.Those with very low saliency values are discarded. Figure 4 depictsexamples of salient regions and prominent line detections.
4.3 Aesthetic measurement computation
Given the salient regions, prominent lines, and the computedsaliency map, we define a score that evaluate the aesthetics of theimage based on the four above-mentioned criteria.
The symbols used in our paper are listed in Table 1. The set X ofapproximately diagonal lines contains the indices of all lines thatform a similar angle with the horizon or the vertical as either Q1
or Q2 (we use a threshold of 10 degrees). X denotes the set of allother lines. I(Si) and I(Li) are explained in Section 4.2.
The normalized Manhattan distance dM is used to measure dis-tances between 2D points in our system. It is defined asdM ((x1, y1), (x2, y2)) = |x1 − x2| /w + |y1 − y2| /h, wheredL(L,M), the distance measure between two line segments L andM , is defined as the average dM distance between all points on
Symbol Meaningw, h The width and height of the imageC Center of the image frameRi, i = 1, 2, 3, 4 Four third lines of the frameGi, i = 1, 2, 3, 4 Four power points of the frameQ1, Q2 Two diagonal lines of the frameSi, i = 1, 2, · · · , n Salient regions detected in the imageC(Si), A(Si), I(Si) Center, area and saliency value of region Si
r(Si) Region size – area ratio of Si with respect to the imageM(Si) = A(Si)I(Si) “Mass” of salient region Si
Li, i = 1, 2, · · · ,m Prominent lines detected in the imageX Indices of approximately diagonal image lineX Indices of non-diagonal linesI(Li) Saliency value of prominent line Li
dM Normalized Manhattan distancedLM Mean points on line distance to line
Table 1: Symbols used in the paper.
the segment L and the closest points on M . Since the Manhattandistance is used, the closest point tends to the horizonal or verticalprojection, and a closed form formula is easily obtained.
Rule of thirds (RT) The score of this rule has two parts:
ERT = γpointEpoint + γlineEline (3)
where the point scoreEpoint measures how close the salient regionslie to the power points, Eline measures how close the prominentlines lie to the third lines, γpoint, γline are weights.
The point score of all salient regions is calculated as:
Epoint =1∑
iM(Si)
∑iM(Si)e
−D2(Si)
2σ1 (4)
where D(Si) = minj=1,2,3,4
dM (C(Si), Gj) is the minimal distance
from the subject center to the four power pointsGj , and σ1 = 0.17.
The line score is calculated as:
Eline =1∑
i∈X I(Li)
∑i∈X
I(Li)e−D2R
(Li)
2σ2 (5)
where DR(Li) = minj=1,2,3,4
dL(Li, Rj) is the minimum line dis-
tance between Li and the third lines, and σ2 = 0.17.
In our experience the line based rule of thirds is a better aestheticpredictor than its point-based counterpart and we set the weights inEq. 3 above as γpoint =
13, γline = 2
3.
Diagonal dominance (DA) The diagonal dominance score is com-puted similarly to the line based rule of thirds above:
EDA =1∑
i∈X I(Li)
∑i∈X
I(Li)e−D2Q
(Li)
2σ2 (6)
where DQ(Li) = min(dL(Li, Q1), dL(Li, Q2)).
Visual balance (VB) An arrangement is considered balanced if the“center of mass” which incorporates all salient regions is nearby theimage center C. The visual balance score is therefore (σ3 = 0.2):
EV B = e−d2VB2σ3 (7)
where dV B = dM
(C, 1∑
iM(Si)
∑iM(Si)C(Si)
).

Figure 5: Salient-regions sizes. (a) All the cropping frames havethe same maximal scores of Ea if the house object is placed on thepower-points of the frames. (b) The histogram of the sizes of salientregions in a versatile set of over 200 professional images.
Aesthetic score function (RZ) The aesthetic score function is de-fined as a combination of the above aesthetic measurement scores:
Ea =ωRTERT + ωDAEDA + ωV BEV B
ωRT + ωDA + ωV B(8)
where ωRT = 1 and ωV B = 0.3 are fixed weights. ωDA is 1 ifthere are detected diagonal lines in the image, zero otherwise.
Salient-regions sizes While combining the three aesthetic guide-lines is superior to using just one rule (e.g., the rule of thirds), itturns out that this combined score is not restrictive enough. Con-sidering a simple example that contains only one salient object,this object can be placed on the power-points of the image (ruleof thirds) at any scale, see Figure 5(a). That is, there are manycropping frames that have equal highest scores. We now introducethe region size score that plays an important rule in stabilizing theoptimization problem by eliminating much of this freedom.
The region size score’s main function is to determine the most visu-ally appealing scale. It is based on an observation that region sizesin professional photographs are distributed unevenly. Refer to Fig-ure 5(b), which shows the histogram of the sizes of automaticallydetected salient regions in a database of more than 200 professionalimages we collected for this study. Although the images were takenfrom various sources, and the set of images is very diverse, the un-derlying distribution is three-modal, and has three dominant peaksthat correspond to small regions, medium sized regions, and largeregions. In our search for the most pleasing retargeted image, weencourage region of sizes that adhere to this distribution.
Let r(Si) be the fraction of the image size Si captures. The sizesof salient regions in aesthetic images are mostly distributed aroundthe values: r1 = 0.1, r2 = 0.56, and r3 = 0.82, corresponding tosmall, medium and large regions. The size score encourages regionsto distribute similarly:
ESZ =∑
imax
j=1,2,3e−
(r(Si)−rj)2
2τj (9)
where τ1 = 0.07, τ2 = 0.2, τ3 = 0.16 were evaluated by fitting amixture of Gaussians to the histogram of Figure 5(b).
Combined aesthetic score function The combined score functionis defined as a combination of Ea and ESZ :
E = (1− ωSZ)Ea + ωSZESZ (10)
where ωSZ = 0.08. All the weights used in the score function arechosen empirically on a separate set of images, and are fixed for allexperiments.
Image Sum RT DA VB SZ(a) 0.85 0.62 0.00 0.10 0.13(b) 0.86 0.64 0.00 0.09 0.13(c) 0.90 0.32 0.36 0.12 0.10(d) 0.93 0.61 0.00 0.17 0.13
Table 2: The aesthetic scores for the images in Figure 3.
Figure 6: The change in the objective function as the crop windowmoves from left to right in the image of Figure 1(a). The x-axisdepicts the shift in the window location, and the y-axis the resultingscore. For this visualization, the y coordinate and the width of thecropping window are fixed, as is the amount of retargeting.
We use our aesthetic score function to calculate the scores of theimages in Figure 3. The scores are shown in Table 2. Here, and inthe diagrams throughout this paper, the values RT(rule of thirds),DA(diagonal dominance), VB(visual balance) and SZ(region size)correspond to the energy functions (ERT , EDA, EV B and ESZ )weighed as in Eq. 10.
4.4 Optimization
The cropping frames in the original image are searched over a 3Dspace which consists of the location (x, y) and the width w ofthe composition rectangle, keeping the aspect ratio of the origi-nal image. Then, the cropping frames are retargeted into the tar-get frames by the non-homogenous warping technique [Wolf et al.2007], where the amount of retargeting in both axes constitutesa fourth parameter. Figure 6 illustrates how the various aestheticscores change as a function of one of these four parameters.
The optimization process consists on finding in the 4D parameterspace the parameter vector that maximizes the aesthetic score givenin Eq. 10. In our system, we seek the optimal solution using parti-cle swarm optimization (PSO) [Kennedy and Eberhart 1995]. PSOis an evolutionary optimization method starting from many randominitialization seeds, where at each iteration a set of solutions ex-ist, the scores of each solution is calculated, and the solutions areupdated by shifting them toward the maximal current solution.
5 Results, Validation and Discussion
Figures 7 and 8 show examples of aesthetic composition. Pleaserefer to the supplementary material and video for additional results.
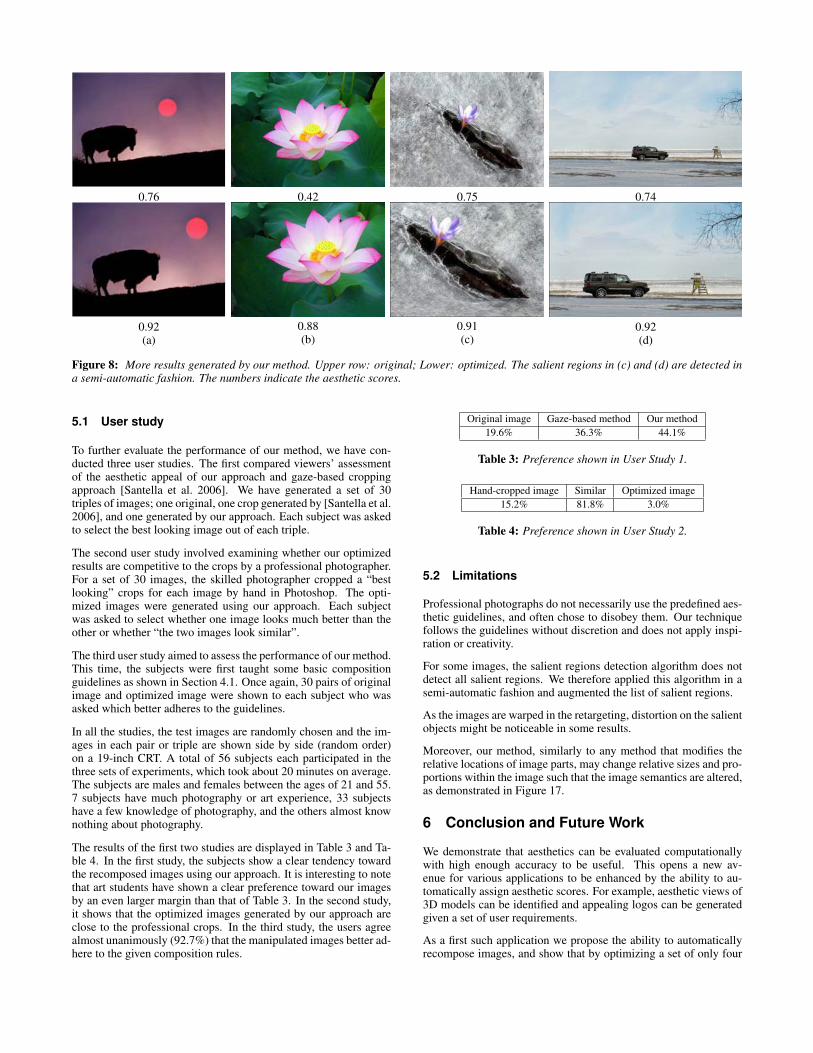
The visual balance contributes much to the improvement in Fig-ures 8(a) and (d). The rule of thirds and the diagonal rule are, asexpected, anticorrelated. This is much more so in the output images
(a) (b) (c) (d)
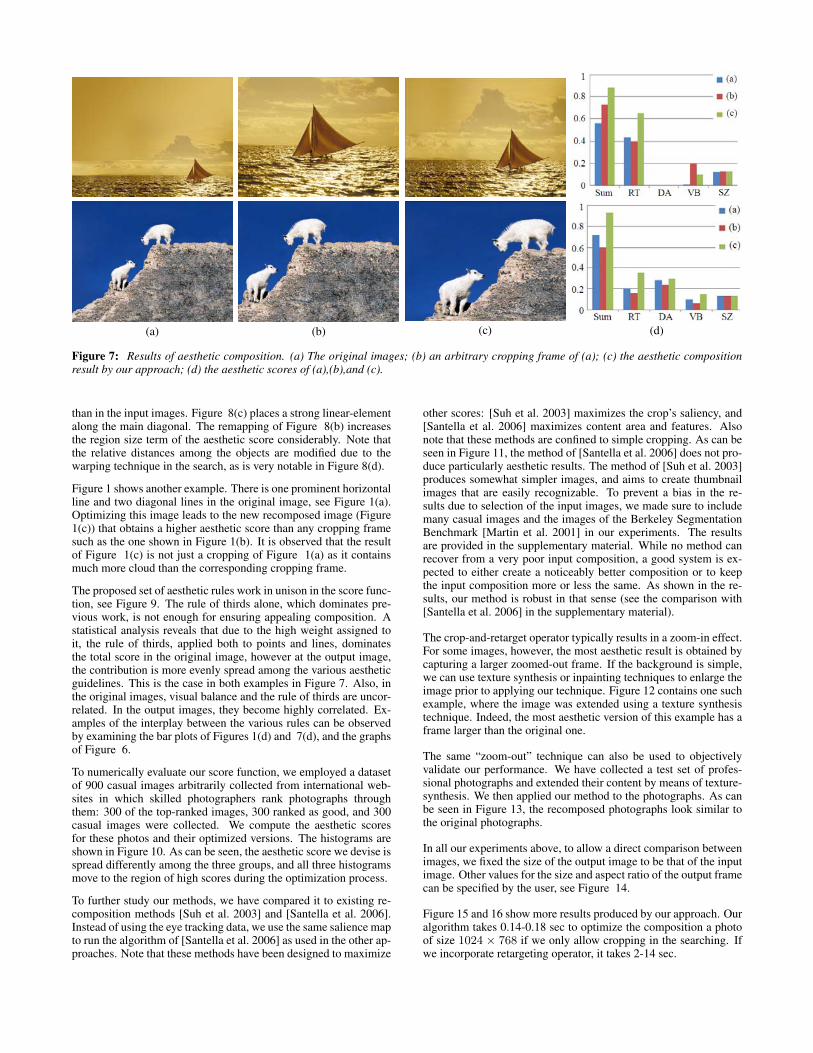
Figure 7: Results of aesthetic composition. (a) The original images; (b) an arbitrary cropping frame of (a); (c) the aesthetic compositionresult by our approach; (d) the aesthetic scores of (a),(b),and (c).
than in the input images. Figure 8(c) places a strong linear-elementalong the main diagonal. The remapping of Figure 8(b) increasesthe region size term of the aesthetic score considerably. Note thatthe relative distances among the objects are modified due to thewarping technique in the search, as is very notable in Figure 8(d).
Figure 1 shows another example. There is one prominent horizontalline and two diagonal lines in the original image, see Figure 1(a).Optimizing this image leads to the new recomposed image (Figure1(c)) that obtains a higher aesthetic score than any cropping framesuch as the one shown in Figure 1(b). It is observed that the resultof Figure 1(c) is not just a cropping of Figure 1(a) as it containsmuch more cloud than the corresponding cropping frame.
The proposed set of aesthetic rules work in unison in the score func-tion, see Figure 9. The rule of thirds alone, which dominates pre-vious work, is not enough for ensuring appealing composition. Astatistical analysis reveals that due to the high weight assigned toit, the rule of thirds, applied both to points and lines, dominatesthe total score in the original image, however at the output image,the contribution is more evenly spread among the various aestheticguidelines. This is the case in both examples in Figure 7. Also, inthe original images, visual balance and the rule of thirds are uncor-related. In the output images, they become highly correlated. Ex-amples of the interplay between the various rules can be observedby examining the bar plots of Figures 1(d) and 7(d), and the graphsof Figure 6.
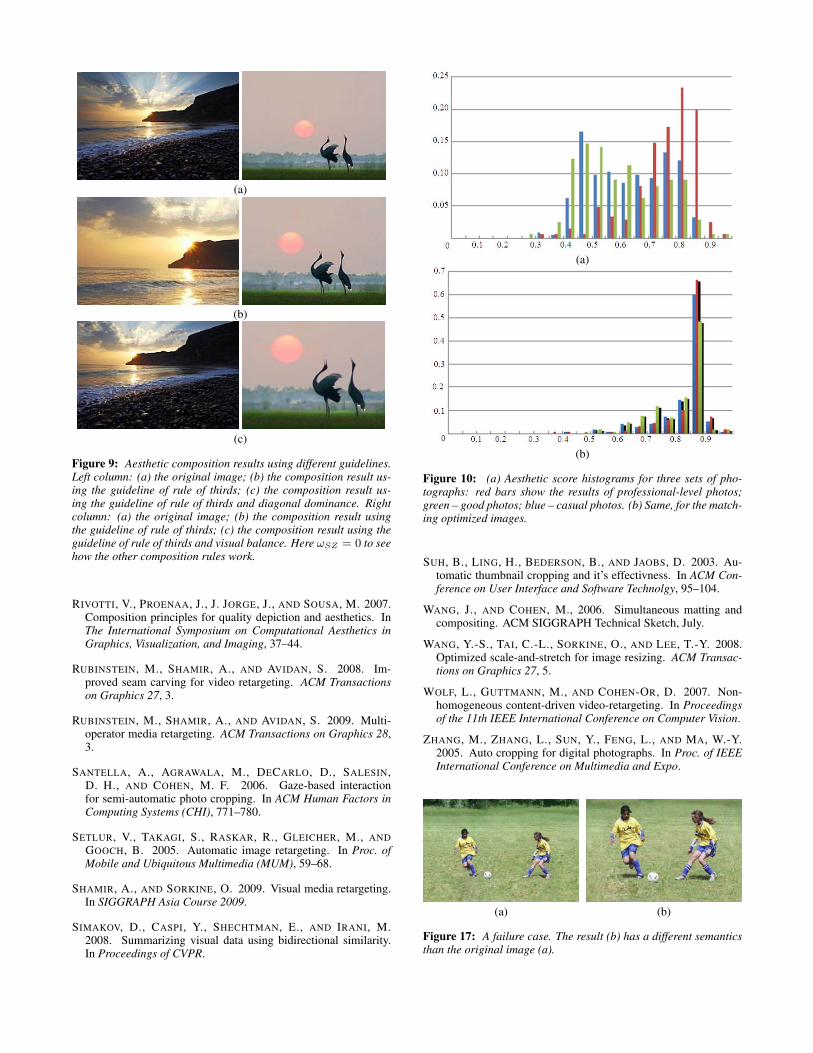
To numerically evaluate our score function, we employed a datasetof 900 casual images arbitrarily collected from international web-sites in which skilled photographers rank photographs throughthem: 300 of the top-ranked images, 300 ranked as good, and 300casual images were collected. We compute the aesthetic scoresfor these photos and their optimized versions. The histograms areshown in Figure 10. As can be seen, the aesthetic score we devise isspread differently among the three groups, and all three histogramsmove to the region of high scores during the optimization process.
To further study our methods, we have compared it to existing re-composition methods [Suh et al. 2003] and [Santella et al. 2006].Instead of using the eye tracking data, we use the same salience mapto run the algorithm of [Santella et al. 2006] as used in the other ap-proaches. Note that these methods have been designed to maximize
other scores: [Suh et al. 2003] maximizes the crop’s saliency, and[Santella et al. 2006] maximizes content area and features. Alsonote that these methods are confined to simple cropping. As can beseen in Figure 11, the method of [Santella et al. 2006] does not pro-duce particularly aesthetic results. The method of [Suh et al. 2003]produces somewhat simpler images, and aims to create thumbnailimages that are easily recognizable. To prevent a bias in the re-sults due to selection of the input images, we made sure to includemany casual images and the images of the Berkeley SegmentationBenchmark [Martin et al. 2001] in our experiments. The resultsare provided in the supplementary material. While no method canrecover from a very poor input composition, a good system is ex-pected to either create a noticeably better composition or to keepthe input composition more or less the same. As shown in the re-sults, our method is robust in that sense (see the comparison with[Santella et al. 2006] in the supplementary material).
The crop-and-retarget operator typically results in a zoom-in effect.For some images, however, the most aesthetic result is obtained bycapturing a larger zoomed-out frame. If the background is simple,we can use texture synthesis or inpainting techniques to enlarge theimage prior to applying our technique. Figure 12 contains one suchexample, where the image was extended using a texture synthesistechnique. Indeed, the most aesthetic version of this example has aframe larger than the original one.
The same “zoom-out” technique can also be used to objectivelyvalidate our performance. We have collected a test set of profes-sional photographs and extended their content by means of texture-synthesis. We then applied our method to the photographs. As canbe seen in Figure 13, the recomposed photographs look similar tothe original photographs.
In all our experiments above, to allow a direct comparison betweenimages, we fixed the size of the output image to be that of the inputimage. Other values for the size and aspect ratio of the output framecan be specified by the user, see Figure 14.
Figure 15 and 16 show more results produced by our approach. Ouralgorithm takes 0.14-0.18 sec to optimize the composition a photoof size 1024 × 768 if we only allow cropping in the searching. Ifwe incorporate retargeting operator, it takes 2-14 sec.
0.76
0.92(a)
0.42
0.88(b)
0.75
0.91(c)
0.74
0.92(d)
Figure 8: More results generated by our method. Upper row: original; Lower: optimized. The salient regions in (c) and (d) are detected ina semi-automatic fashion. The numbers indicate the aesthetic scores.
5.1 User study
To further evaluate the performance of our method, we have con-ducted three user studies. The first compared viewers’ assessmentof the aesthetic appeal of our approach and gaze-based croppingapproach [Santella et al. 2006]. We have generated a set of 30triples of images; one original, one crop generated by [Santella et al.2006], and one generated by our approach. Each subject was askedto select the best looking image out of each triple.
The second user study involved examining whether our optimizedresults are competitive to the crops by a professional photographer.For a set of 30 images, the skilled photographer cropped a “bestlooking” crops for each image by hand in Photoshop. The opti-mized images were generated using our approach. Each subjectwas asked to select whether one image looks much better than theother or whether “the two images look similar”.
The third user study aimed to assess the performance of our method.This time, the subjects were first taught some basic compositionguidelines as shown in Section 4.1. Once again, 30 pairs of originalimage and optimized image were shown to each subject who wasasked which better adheres to the guidelines.
In all the studies, the test images are randomly chosen and the im-ages in each pair or triple are shown side by side (random order)on a 19-inch CRT. A total of 56 subjects each participated in thethree sets of experiments, which took about 20 minutes on average.The subjects are males and females between the ages of 21 and 55.7 subjects have much photography or art experience, 33 subjectshave a few knowledge of photography, and the others almost knownothing about photography.
The results of the first two studies are displayed in Table 3 and Ta-ble 4. In the first study, the subjects show a clear tendency towardthe recomposed images using our approach. It is interesting to notethat art students have shown a clear preference toward our imagesby an even larger margin than that of Table 3. In the second study,it shows that the optimized images generated by our approach areclose to the professional crops. In the third study, the users agreealmost unanimously (92.7%) that the manipulated images better ad-here to the given composition rules.
Original image Gaze-based method Our method19.6% 36.3% 44.1%
Table 3: Preference shown in User Study 1.
Hand-cropped image Similar Optimized image15.2% 81.8% 3.0%
Table 4: Preference shown in User Study 2.
5.2 Limitations
Professional photographs do not necessarily use the predefined aes-thetic guidelines, and often chose to disobey them. Our techniquefollows the guidelines without discretion and does not apply inspi-ration or creativity.
For some images, the salient regions detection algorithm does notdetect all salient regions. We therefore applied this algorithm in asemi-automatic fashion and augmented the list of salient regions.
As the images are warped in the retargeting, distortion on the salientobjects might be noticeable in some results.
Moreover, our method, similarly to any method that modifies therelative locations of image parts, may change relative sizes and pro-portions within the image such that the image semantics are altered,as demonstrated in Figure 17.
6 Conclusion and Future Work
We demonstrate that aesthetics can be evaluated computationallywith high enough accuracy to be useful. This opens a new av-enue for various applications to be enhanced by the ability to au-tomatically assign aesthetic scores. For example, aesthetic views of3D models can be identified and appealing logos can be generatedgiven a set of user requirements.
As a first such application we propose the ability to automaticallyrecompose images, and show that by optimizing a set of only four

(a) (b) (c) (d)
Figure 11: Comparison with the previous approaches. (a) The original images; (b) the results of our approach; (c) the results of Santella etal.’s approach [2006]; (d) the results of Suh et al.’s [2003]. Note that line-based information plays a crucial role in photo composition andignoring it leads to inferior results.
(a) (b) (c) (d)
Figure 12: For some images, the best aesthetic results are obtained by zooming out. While zooming out is not possible for all images, forsome images texture-synthesis enables such an effect. (a) The original image; (b) Enlarged image by applying a texture synthesis technique;(c) the result generated by applying our technique on (b); (d) the aesthetic scores of (a),(b), and (c), respectively.
parameters we are able to generate recomposed images that are no-tably more aesthetic. Future efforts for the recomposing applica-tion, can focus on improving the aesthetic score. We would liketo explore the possibility of improving the salient-region detectionmethod by means of computational-learning, and to add color basedconsiderations to the score enabling the automatic augmentation ofthe colors in the image. Aesthetics perception is also influenced bythe structure of the underlying scene, and we would like to exploreadding this and semantic information to the analysis.
Project page. The demo and supplementary materials can bedownloaded at the project page:http://www.math.zju.edu.cn/ligangliu/CAGD/Projects/Composition
Acknowledgement. Thanks to the Webshots, Photo.net,Flickr.com, and PhotoVillage users for sharing their imageswhich were used in this paper. Thank Jacqueline Roberts(www.jacquelineroberts.net) for permitting us to use her photo inFigure 13 (a). We are thankful to anonymous reviewers for valuablefeedback. We thank Binbin Lin, Lei Zhang, Zhonggui Chen, WeiZhu, Yin Xu, Tao Ju, and Ross Sowell for helpful discussion andfor assisting in searching the images and making the video. Thiswork is supported by the joint grant of the National Natural Science
Foundation of China and Microsoft Research Asia (60776799) andthe 973 National Key Basic Research Foundation of China (No.2009CB320801), and also by grants from the Israel Science Foun-dation founded by the Israel Academy of Sciences and Humanities.
References
AVIDAN, S., AND SHAMIR, A. 2007. Seam carving for content-aware image resizing. ACM Transactions on Graphics 26, 3.
BARNES, C., SHECHTMAN, E., FINKELSTEIN, A., AND GOLD-MAN, D. B. 2009. Patchmatch: A randomized correspondencealgorithm for structural image editing. ACM Transactions onGraphics 28, 3.
BYERS, Z., DIXON, M., SMART, W. D., AND GRIMM, C. 2004.Say cheese! experiences with a robot photographer. AI Magazine25, 3, 37–46.
CHO, T. S., BUTMAN, M., AVIDAN, S., AND FREEMAN, W. T.2008. The patch transform and its applications to image editing.In Proceedings of CVPR.

(a) (b) (c)
Figure 13: Three validation examples. Upper left: the original professional photographs; Bottom: the extended images by Photoshop;Upper right: optimized images from the extended images. Note that the recomposed images are typically similar to the original images,which means that our method is able to identify the the aesthetic quality of the original image.
Figure 14: The requirement for the output image to have the same dimensions as the original one is merely to allow comparison. Here weshow how an image (a) can be aesthetically-recomposed to the original size (b) and to a wider image size (c). The various aesthetic scoresare depicted in (d).
COHEN-OR, D., SORKINE, O., GAL, R., LEYVAND, T., ANDXU, Y.-Q. 2006. Color harmonization. ACM Transactions onGraphics 25, 3, 624–630.
FELZENSZWALB, P. F., AND HUTTENLOCHER, D. P. 2004. Effi-cient graph-based image segmentation. International Journal ofComputer Vision 59, 2, 167–181.
GAL, R., SORKINE, O., AND COHEN-OR, D. 2006. Feature-aware texturing. In Eurographics Symp. on Rendering, 297–303.
GOOCH, B., REINHARD, E., MOULDING, C., AND SHIRLEY, P.2001. Artistic composition for image creation. In Proc. of the12th Eurographics workshop on Rendering Technique, 83–88.
GRILL, T., AND SCANLON, M. 1990. Photographic Composition.Watson-Guptill.
ITTI, L., KOCH, C., AND NIEBUR, E. 1998. A model of saliency-based visual attention for rapid scene analysis. IEEE Trans. onPattern Analysis and Machine Intelligence 20, 1254–1259.
KENNEDY, J., AND EBERHART, R. 1995. Particle swarm opti-mization. In Proc. IEEE Conf. on Neural Networks, 1942–1948.
KOWALSKI, M. A., HUGHES, J. F., RUBIN, C. B., AND OHYA, J.2001. User-guided composition effects for art-based rendering.In Proc. of the Symposium on Interactive 3D graphics, 99–102.
KRAGES, B. 2005. Photography: The Art of Composition. All-worth Press.
LEYVAND, T., COHEN-OR, D., DROR, G., AND LISCHINSKI, D.2008. Data-driven enhancement of facial attractiveness. ACMTrans. Graph. 27, 3.
LI, S., ZHU, L., ZHANG, Z., BLAKE, A., ZHANG, H., ANDSHUM, H. 2002. Statistical learning of multi-view face detec-tion. In 7th European Conference on Computer Vision, 67–81.
LOK, S., FEINER, S., AND NGAI, G. 2004. Evaluation of visualbalance for automated layout. Intelligent User Interfaces, 101–8.
MARTIN, D., FOWLKES, C., TAL, D., AND MALIK, J. 2001. Adatabase of human segmented natural images and its applicationto evaluating segmentation algorithms and measuring ecologi-cal statistics. In International Conference on Computer Vision,vol. 2, 416–423.
MARTINEZ, B., AND BLOCK, J. 1998. Visual Forces, an Intro-duction to Design. Prentice-Hall, New York.
NISHIYAMA, M., OKABE, T., SATO, Y., AND SATO, I. 2009.Sensation-based photo cropping. In Proc. ACM InternationalConference on Multimedia.
PETERS, G. 2007. Aesthetic primitives of images for visualization.In 11th Int. Conf on Information Visualization, 316–325.
(a)
(b)
(c)
Figure 9: Aesthetic composition results using different guidelines.Left column: (a) the original image; (b) the composition result us-ing the guideline of rule of thirds; (c) the composition result us-ing the guideline of rule of thirds and diagonal dominance. Rightcolumn: (a) the original image; (b) the composition result usingthe guideline of rule of thirds; (c) the composition result using theguideline of rule of thirds and visual balance. Here ωSZ = 0 to seehow the other composition rules work.
RIVOTTI, V., PROENAA, J., J. JORGE, J., AND SOUSA, M. 2007.Composition principles for quality depiction and aesthetics. InThe International Symposium on Computational Aesthetics inGraphics, Visualization, and Imaging, 37–44.
RUBINSTEIN, M., SHAMIR, A., AND AVIDAN, S. 2008. Im-proved seam carving for video retargeting. ACM Transactionson Graphics 27, 3.
RUBINSTEIN, M., SHAMIR, A., AND AVIDAN, S. 2009. Multi-operator media retargeting. ACM Transactions on Graphics 28,3.
SANTELLA, A., AGRAWALA, M., DECARLO, D., SALESIN,D. H., AND COHEN, M. F. 2006. Gaze-based interactionfor semi-automatic photo cropping. In ACM Human Factors inComputing Systems (CHI), 771–780.
SETLUR, V., TAKAGI, S., RASKAR, R., GLEICHER, M., ANDGOOCH, B. 2005. Automatic image retargeting. In Proc. ofMobile and Ubiquitous Multimedia (MUM), 59–68.
SHAMIR, A., AND SORKINE, O. 2009. Visual media retargeting.In SIGGRAPH Asia Course 2009.
SIMAKOV, D., CASPI, Y., SHECHTMAN, E., AND IRANI, M.2008. Summarizing visual data using bidirectional similarity.In Proceedings of CVPR.
(a)
(b)
Figure 10: (a) Aesthetic score histograms for three sets of pho-tographs: red bars show the results of professional-level photos;green – good photos; blue – casual photos. (b) Same, for the match-ing optimized images.
SUH, B., LING, H., BEDERSON, B., AND JAOBS, D. 2003. Au-tomatic thumbnail cropping and it’s effectivness. In ACM Con-ference on User Interface and Software Technolgy, 95–104.
WANG, J., AND COHEN, M., 2006. Simultaneous matting andcompositing. ACM SIGGRAPH Technical Sketch, July.
WANG, Y.-S., TAI, C.-L., SORKINE, O., AND LEE, T.-Y. 2008.Optimized scale-and-stretch for image resizing. ACM Transac-tions on Graphics 27, 5.
WOLF, L., GUTTMANN, M., AND COHEN-OR, D. 2007. Non-homogeneous content-driven video-retargeting. In Proceedingsof the 11th IEEE International Conference on Computer Vision.
ZHANG, M., ZHANG, L., SUN, Y., FENG, L., AND MA, W.-Y.2005. Auto cropping for digital photographs. In Proc. of IEEEInternational Conference on Multimedia and Expo.
(a) (b)
Figure 17: A failure case. The result (b) has a different semanticsthan the original image (a).

Figure 15: More results produced by our algorithm. Left: input photos; Right: optimized results.

Figure 16: Optimized results on casual photos produced by our algorithm. Left: input photos; Right: optimized results.