
Optimizing pension asset allocation and risk management ...
16
Optimizing pension asset allocation and risk management using Treasury futures Vanguard Research October 2020 Valerie Dion, CFA, FSA, Senior Investment Consultant, Vanguard Institutional Advisory Services Brett Dutton, CFA, FSA, EA, Head of Pension Strategy, Vanguard Institutional Advisory Services ■ Defined benefit pension sponsors should consider the impact of investment returns and risks on funding status. For private-sector pensions in the United States, the two main drivers of funding status risk are interest rate risk and market risk. ■ Using derivatives contracts, such as U.S. Treasury futures, in a pension portfolio allows for these two main risk drivers to be managed independently of each other. ■ With the ability to independently control these risks, plan sponsors should consider establishing an explicit interest rate hedge ratio target to mitigate uncompensated interest rate risk, even as they potentially maintain material market risk exposure, in order to improve the plan’s expected risk/return trade-off. ■ Incorporating Treasury futures or other derivatives into a pension portfolio can increase operational complexity for the typical pension investor. Working with an experienced implementation partner can help make management of a Treasury futures allocation seamless for a plan sponsor. For institutional and sophisticated investors only. Not for public distribution.
Transcript of Optimizing pension asset allocation and risk management ...

Optimizing pension asset allocation and risk management using Treasury futures
Vanguard Research October 2020
Valerie Dion, CFA, FSA, Senior Investment Consultant, Vanguard Institutional Advisory ServicesBrett Dutton, CFA, FSA, EA, Head of Pension Strategy, Vanguard Institutional Advisory Services
■ Defined benefit pension sponsors should consider the impact of investment returns andrisks on funding status. For private-sector pensions in the United States, the two maindrivers of funding status risk are interest rate risk and market risk.
■ Using derivatives contracts, such as U.S. Treasury futures, in a pension portfolio allowsfor these two main risk drivers to be managed independently of each other.
■ With the ability to independently control these risks, plan sponsors should considerestablishing an explicit interest rate hedge ratio target to mitigate uncompensated interestrate risk, even as they potentially maintain material market risk exposure, in order toimprove the plan’s expected risk/return trade-off.
■ Incorporating Treasury futures or other derivatives into a pension portfolio can increaseoperational complexity for the typical pension investor. Working with an experiencedimplementation partner can help make management of a Treasury futures allocationseamless for a plan sponsor.
For institutional and sophisticated investors only. Not for public distribution.

2
IMPORTANT: The projections and other information generated by the VCMM regarding the likelihood of various investment outcomes are hypothetical in nature, do not reflect actual investment results, and are not guarantees of future results. Distribution of return outcomes from the VCMM are derived from 10,000 simulations for each modeled asset class. Simulations are as of March 31, 2020. Results from the model may vary with each use and over time. For more information, see the Appendix section “About the Vanguard Capital Markets Model.”
Key drivers of pension funding status risk
In selecting a strategic asset allocation, Vanguard urges sponsors of defined benefit pension plans to evaluate potential strategies from an asset/liability perspective (Wolfram and Dutton, 2018). That is, they should balance the desire for portfolio returns in excess of liability growth with the desire for a reduced risk of downside volatility in the plan’s funding status relative to the liability (i.e., reduced funding status volatility). Funding status volatility could lead to deteriorating or unstable financial reporting metrics, higher contribution requirements1 or Pension Benefit Guaranty Corporation premiums over the long term, or other consequences.
A typical plan’s funding status risk consists of two primary drivers:
• Interest rate risk2—the mismatch in sensitivity tointerest rates between the plan’s assets and theliability. This can be mitigated by investing a portionof the portfolio in liability-hedging assets.3
• Market risk—the potential for declining values in theplan’s return-seeking assets4 (which may includepublic equity as well as diversifying assets such ascommodities, listed real estate, high-yield fixedincome, or private investments).
Today, many pension plans have less interest rate sensitivity in their assets than in their liability. For these plans, sharp rises in interest rates will improve funding status, while flat or declining interest rates will likely reduce funding status.
Managing funding status risk through strategic asset allocation
A plan’s strategic asset allocation (including the targeted split between return-seeking and liability-hedging assets) is a primary way that the plan sponsor manages the funding status risk/reward trade-off (Clinger and Gannon, 2020). Consider, for example, the hypothetical MNO Pension Plan, a frozen plan sponsored by MNO Corporation that is 80% funded (asset value $80 million and liability value $100 million, based on U.S. generally accepted accounting principles).5 The MNO Pension Plan currently has a 50%/50% split between return-seeking and liability-hedging assets.
1 Various funding reliefs enacted since the global financial crisis have made short-term contributions less related to the marked-to-market funding status. We believe that the relationship remains over the long run.
2 Interest rate risk can be broken down further into such factors as risk due to general interest rate changes, credit spread changes, and yield curve shape changes. This analysis does not explicitly consider strategies for hedging credit spread risk. For additional discussion on various components of interest rate risk, see Gannon and Dutton (2019).
3 Liability-hedging assets are investments whose primary objective is to increase the correlation of returns between the plan’s assets and its liabilities. Liability-hedging asset classes are likely to include domestic investment-grade fixed income (both credit and Treasury bonds).
4 Return-seeking assets are investments whose primary objective is to generate a return that exceeds interest on the plan’s liability over the long term, thereby helping to cover the cost of benefit accruals, if any, and/or improve the plan’s funding ratio and decrease long-term expected required contributions.
5 The analysis throughout this paper also applies to open or closed plans, along with plans that have a higher or lower funding status.
For institutional and sophisticated investors only. Not for public distribution.

3
6 Surplus Value at Risk (VaR) is a model-based estimate of the potential one-year loss in plan surplus (or increase in plan deficit) at a 95th percentile adverse outcome.7 The interest rate hedge ratio is the estimated percentage of a pension liability’s interest rate sensitivity that is offset by the plan’s asset allocation. Generally speaking,
increasing the hedge ratio reduces the interest rate component of funding status risk.
Figure 1 illustrates the risk/return trade-off associated with MNO’s current asset allocation, as well as a more conservative 40%/60% split between return-seeking and liability-hedging assets (“Portfolio A”). Figure 1 shows the expected impact of these investment strategies on MNO’s overall funding status risk (represented by
Surplus Value at Risk6). It also decomposes the surplus risk into market risk, interest rate risk, and credit spread risk. Figure 1 also includes median projected long-term portfolio return and funding status sensitivity to interest rate changes (represented by the interest rate hedge ratio7).
Figure 1. Impact of asset allocation on funding status risk and return
Value at Risk (VaR) ($ millions) Market Interest rate Credit spread Diversification Total VaR
Current (50%/50%) 13.3 8.0 12.7 –19.1 14.9
Portfolio A (40%/60%) 10.6 6.4 11.7 –16.3 12.4
13.3 10.6
14.912.4
8.06.4
12.7
–16.3
–19.111.7
Current Portfolio A
Return-seeking allocation 50% 40%
Liability-hedging allocation 50% 60%
Surplus VaR ($ millions) 14.9 12.4
Due to market risk 13.3 10.6
Due to interest rate risk 8.0 6.4
Due to credit spread risk 12.7 11.7
Due to risk diversification –19.1 –16.3
Median annualized forward-looking return
10-year 5.3% 4.7%
30-year 6.4% 5.8%
Interest rate hedge ratio 53% 62%
Notes: Measurement date is March 31, 2020. Credit spread risk in the MSCI BarraOne model is elevated at this measurement date because of the unusually high level of credit spread volatility in March 2020. In typical market environments, credit spread risk is lower in magnitude than interest rate risk. Risk diversification is negative because downside risks are not fully correlated and therefore the total VaR is lower than the sum of the factor-driven VaR. See Figure A1 in the Appendix for characteristics of specific portfolios and liabilities modeled, as well as additional information about the Vanguard Capital Markets Model and the MSCI BarraOne model.Sources: Vanguard and MSCI BarraOne.
For institutional and sophisticated investors only. Not for public distribution.

4
According to the model we used, Portfolio A is expected to have $2.5 million less downside risk than the current portfolio over a one-year time horizon. This is attributable both to a reduction in market risk (from its lower allocation to return-seeking assets) and a reduction in interest rate and credit spread risks (from its greater allocation to liability-hedging assets, resulting in a higher interest rate hedge ratio). Generally speaking,8 market risk and interest rate risk are inextricably linked in the liability-driven asset allocation process. Portfolio A, with a higher allocation to liability-hedging assets than the MNO Pension Plan’s current portfolio, mitigates both market risk and interest rate risk, but reduces long-term expected returns.
In the example above, the interest rate hedge ratio, as is frequently the case, is an output of the asset allocation process. A plan sponsor assesses its investment objectives and risk tolerance and selects an asset allocation (return-seeking/liability-hedging split) appropriate for those objectives and constraints.
However, it’s no secret that forecasting movements in interest rates has historically been essentially impossible (Davis et al., 2010). As they can’t forecast these movements, the vast majority of U.S. corporate pension sponsors that do not fully hedge their liabilities are exposed to potential downside risk (if rates fall, or even if they rise less than what’s priced into the market)—without the expectation of long-term positive surplus return as compensation for bearing that risk. This is an uncompensated risk. Minimizing that risk, rather than betting on the next move in interest rates, may be in the plan sponsor’s best interest as a fiduciary.
Managing interest rate and market risks independently through Treasury futures9 contracts
Rather than allowing the interest rate hedge ratio to be an output of the asset allocation decision—and thus depending primarily on the amount of assets available to hedge the liability—plan sponsors may benefit from incorporating the hedge ratio as an input by explicitly setting an interest rate hedge ratio target during the asset allocation process. This allows for a more robust approach to managing interest rate risk and overall funding status risk.
As discussed, pension plan sponsors who do not fully hedge their liability’s interest rate risk are making a bet on the future direction, magnitude, and speed of change in interest rates, relative to what is already priced into the market. For a plan sponsor to minimize the impact of interest rate risk and avoid an unintentional bet on the direction of interest rates, the interest rate hedge ratio target should be set between the plan’s funding ratio and 100%:
• If the sponsor’s objective is to maintain the currentamount of unfunded or overfunded liability, theinterest rate hedge ratio target should be set at100%. This way, for every $100 increase in theliability because of changing interest rates, theinvestment portfolio is expected to gain $100.
• If the sponsor’s objective is instead to maintainthe current funding ratio of the plan, the interestrate hedge ratio target should be set at the currentfunding ratio (e.g., 80% in the previously describedexample with the MNO Plan). This way, for every$100 increase in the liability because of changinginterest rates, the investment portfolio is expectedto gain $80.
8 At this point in the narrative, we assume that the plan sponsor is not considering the use of leveraged exposures through Treasury futures or other derivatives. This concept will be introduced later in the paper.
9 For additional background on Treasury futures, see CME Group (2017).
For institutional and sophisticated investors only. Not for public distribution.

5
For sponsors whose plans are underfunded or that want to retain meaningful exposure to return-seeking assets, there is a challenge in setting an explicit interest rate hedge ratio within the guidelines on the previous page. In these situations, the amount of capital available for hedging is constrained and, therefore, so is the maximum interest rate hedge ratio that can be attained with the physical liability-hedging portfolio.
Using derivative contracts, plan sponsors can strategically target a desired interest rate hedge ratio, independent of the allocation between return-seeking assets and liability-hedging assets. Specifically, incorporating derivatives in a pension portfolio gives a plan sponsor an additional dimension—the ability to manage the main risk drivers independently of each other—in determining its strategic asset allocation and independently targeting appropriate levels of exposure to those risks.
Note that this paper will focus specifically on using one type of derivative contract—Treasury futures—as a tool to manage pension funding status risk. Other derivative contracts (e.g., interest rate swaps, swaptions, total return swaps, or equity index futures) could also be used for similar purposes but are not directly addressed in this paper. Within the universe of derivatives, we see Treasury futures as a good first choice for managing risk due to their standardized nature, historical liquidity, and modest transaction costs. Sometimes, these other types of contracts might be more appropriate—depending on market conditions, the structure of the plan’s liability, the sponsor’s objectives, and the level of comfort with various types of derivatives.
To illustrate the potential use of Treasury futures, let’s return to the 80%-funded MNO Pension Plan. MNO Corporation would like to establish an explicit interest rate hedge ratio target of at least 80% and would like to maintain or increase the portfolio’s current long-term asset return expectation, in hopes of improving the plan’s funding status and decreasing future contribution requirements through investment returns.
For institutional and sophisticated investors only. Not for public distribution.

6
Figure 2 builds on Figure 1 by showing two additional asset allocation strategies (Portfolios B and C), which use a Treasury futures overlay to focus on the objective of achieving an 80% interest rate hedge ratio and maintaining or increasing the long-term asset return expectation. We next discuss each portfolio in detail:
The current portfolio for the MNO Pension Plan has an interest rate hedge ratio of 53%, which is an output of the current asset allocation decision. Without modifying the allocation between return-seeking and liability-hedging assets, the plan cannot easily achieve an 80% interest rate hedge ratio with only physical liability-hedging assets.10
10 The duration of the liability for the MNO Plan is 12.2 years. Achieving an 80% interest rate hedge ratio in this scenario would require a liability-hedging portfolio with a duration of 24.4 years. This could likely be achieved only in the physical fixed income market with a portfolio of mostly Treasury STRIPS, which may not be optimal for several reasons, including unwinding the credit spread hedge, liquidity, yield, and key rate duration mismatch concerns.
Figure 2. Impact of Treasury futures overlays on funding status risk and return
Current Portfolio APortfolio B
(equal return)Portfolio C (equal risk)
Return-seeking allocation 50% 40% 50% 63%
Liability-hedging allocation 50% 60% 50% 37%
Surplus VaR ($ millions) 14.9 12.4 12.7 15.0
Due to market risk 13.3 10.6 13.3 16.7
Due to interest rate risk 8.0 6.4 3.7 3.6
Due to credit spread risk 12.7 11.7 12.7 13.7
Due to risk diversification –19.1 –16.3 –17.0 –19.0
Median annualized forward-looking return
10-year 5.3% 4.7% 5.2% 6.0%
30-year 6.4% 5.8% 6.3% 7.0%
Total interest rate hedge ratio 53% 62% 80% 80%
Due to physical hedging assets 53% 62% 47% 32%
Due to Treasury futures — — 33% 48%
Notes: Measurement date is March 31, 2020. Credit spread risk in the MSCI BarraOne model is elevated at this measurement date because of the unusually high level of credit spread volatility in March 2020. In typical market environments, credit spread risk is lower in magnitude than interest rate risk. Risk diversification is negative because downside risks are not 100% correlated and therefore the total VaR is lower than the sum of the factor-driven VaR. See the Appendix for characteristics of specific portfolios and liabilities modeled, as well as additional information regarding MSCI BarraOne and Vanguard Capital Markets Models.Sources: Vanguard and MSCI BarraOne.
For institutional and sophisticated investors only. Not for public distribution.

7
Figure 3 takes a deeper look at the funding status interest rate risk for the current portfolio. It shows the Dollar Value of a Basis Point (DV01) profile11 of the liability-hedging assets versus the pension liability. This chart illustrates the interest rate sensitivity at various points on the maturity spectrum. The 53% interest hedge ratio can be calculated by dividing the total DV01 exposure for the liability-hedging portfolio by the total DV01 exposure for the pension liability. Note that since this portfolio doesn’t incorporate derivatives, there is no synthetic liability hedge.
Portfolio A from Figure 2 is the derisking strategy contemplated earlier in this paper—a rebalancing of physical assets to 40% return-seeking/60% liability-hedging to reduce both market risk and interest rate risk. With this approach, the interest rate hedge ratio (62%) is higher but, as noted, it is still an output from balancing the funding status risk/reward trade-off, rather than an explicit input into the asset allocation process.
Portfolio B (equal return) targets an interest rate hedge ratio of 80%, reducing the plan’s exposure to uncompensated interest rate risk. The exposure to return-seeking assets remains at 50% as in the current investment portfolio, helping to maintain a similar level of long-term expected return. The expected impact of this portfolio is:
• Lower funding status risk than the current portfolio,with reduced exposure to interest rate risk and equalexposure to market risk.
• Similar long-term expected portfolio return as thecurrent portfolio.
• Similar funding status risk as Portfolio A, with a higherlong-term expected portfolio return.
11 DV01 is similar to duration, but expressed differently. Specifically, it is the expected impact on the plan (in dollar terms) of a 1-basis-point (0.01%) parallel decline in interest rates.
Figure 3. Interest rate hedge for MNO Pension Plan’s current portfolio
Current DV01 ($ thousands) 1–2 years 3 years 5 years 7 years 10 years 15 years 20 years 25+ years Total
Physical liability hedge 0.4 0.6 1.2 2.1 5.2 8.9 13.1 32.9 64.4
Synthetic liability hedge 0.0 0.0 0.0 0.0 0.0 0.0 0.0 0.0 0.0
Total liability hedge 0.4 0.6 1.2 2.1 5.2 8.9 13.1 32.9 64.4
Pension liability 1.5 2.4 4.8 8.3 16.7 23.2 21.8 42.9 121.8
Net –1.1 –1.8 –3.7 –6.3 –11.5 –14.4 –8.6 –10.0 –57.4
Interest rate hedge ratio = 64.4 / 121.8 = 53% Sources: Vanguard, Bloomberg, and BlackRock Aladdin.
0
10
20
30
40
50
For institutional and sophisticated investors only. Not for public distribution.

8
The additional interest rate hedging achieved by the Treasury futures (the synthetic liability hedge) in Portfolio B can be seen in the DV01 profile in Figure 4.
Like Portfolio B, Portfolio C (equal risk) also incorporates Treasury futures to target an 80% interest rate hedge ratio. However, unlike Portfolio B, Portfolio C maintains a level of overall downside risk similar to the current portfolio’s by increasing the exposure to return-seeking assets to 63% (versus 50% in the current portfolio). The expected impact of this portfolio is:
• Funding status risk similar to the current portfolio’s,with reduced exposure to interest rate risk andincreased exposure to market risk.
• A higher long-term projected portfolio return than thecurrent portfolio, because of the higher allocation toreturn-seeking assets.
While Portfolios B and C target the same hedge ratio, the synthetic contribution to the hedge from Treasury futures is larger, as can be seen in the DV01 profile shown in Figure 5. This increased synthetic hedge is what allows for a greater allocation to return-seeking assets and, thus, greater expected return.
Incorporating Treasury futures in the MNO Pension Plan portfolio allows MNO Corporation to independently target a strategic interest rate hedge ratio and an allocation to return-seeking assets. Compared with the current portfolio, Portfolios B and C illustrate two potential benefits of this additional tool in the asset allocation process. Portfolio B reduces the overall funding status risk while maintaining long-term projected returns, and Portfolio C maintains the same overall funding status risk while increasing long-term projected returns. Figure 6 summarizes the surplus risk and long-term return expectation of the portfolios considered.
Figure 4. Interest rate hedge for Portfolio B
Current DV01 ($ thousands) 1–2 years 3 years 5 years 7 years 10 years 15 years 20 years 25+ years Total
Physical liability hedge 0.4 0.6 1.1 1.9 4.8 8.2 11.7 28.4 57.0
Synthetic liability hedge 0.7 1.1 2.3 4.0 7.4 11.1 3.0 10.7 40.3
Total liability hedge 1.1 1.6 3.4 5.9 12.2 19.4 14.6 39.0 97.3
Pension liability 1.5 2.4 4.8 8.3 16.7 23.2 21.8 42.9 121.8
Net –0.4 –0.8 –1.4 –2.4 –4.5 –3.9 –7.1 –3.9 –24.5
Interest rate hedge ratio = 97.3 / 121.8 = 80% Sources: Vanguard, Bloomberg, and BlackRock Aladdin.
0
10
20
30
40
50
($ t
ho
usa
nd
s)
For institutional and sophisticated investors only. Not for public distribution.

9
Figure 5. Interest rate hedge for Portfolio C
Current DV01 ($ thousands) 1–2 years 3 years 5 years 7 years 10 years 15 years 20 years 25+ years Total
Physical liability hedge 0.3 0.4 0.8 1.3 3.4 5.9 7.9 18.6 38.6
Synthetic liability hedge 0.9 1.3 2.9 4.9 9.4 15.1 4.6 19.7 58.8
Total liability hedge 1.2 1.7 3.7 6.3 12.8 20.9 12.5 38.2 97.3
Pension liability 1.5 2.4 4.8 8.3 16.7 23.2 21.8 42.9 121.8
Net –0.4 –0.7 –1.2 –2.0 –3.9 –2.3 –9.3 –4.7 –24.5
Interest rate hedge ratio = 97.3 / 121.8 = 80% Sources: Vanguard, Bloomberg, and BlackRock Aladdin.
0
10
20
30
40
50
($ t
ho
usa
nd
s)
Med
ian
an
nu
aliz
ed f
orw
ard
-lo
oki
ng
retu
rn (1
0 ye
ars)
Surplus Value at Risk (VaR), $ million
4.0
4.5
5.0
5.5
6.0
6.5%
11 12 151413 16
A
B Current
C
Med
ian
an
nu
aliz
ed f
orw
ard
-lo
oki
ng
re
turn
(10
year
s)
Surplus VaR ($ millions)
4.0
4.5
5.0
5.5
6.0
6.5%
11 12 151413 16
A
B Current
C
Surplus VaR ($ millions)
10-year medianprojected return
Current 14.9 5.3%
Portfolio A (lower risk, no derivatives)
12.4 4.7%
Portfolio B (equal return) 12.7 5.2%
Portfolio C (equal risk) 15.0 6.0%
Sources: Vanguard and MSCI BarraOne.
Figure 6. Risk/return comparison summary
For institutional and sophisticated investors only. Not for public distribution.

10
Pension sponsor considerations
For many plan sponsors, the investment rationale outlined in the previous section for including Treasury futures in a pension portfolio holds a conceptual appeal. Nevertheless, concerns might arise about the practical implementation of a Treasury futures position. Plan sponsors’ concerns are typically related to the perceived complexity and risk associated with derivatives. We further detail the most common concerns expressed by plan sponsors considering an allocation to Treasury futures, and we provide our perspective on how those concerns can best be addressed or mitigated.
Leverage and interest rate risk
On a standalone basis, Treasury futures (and other derivative instruments) are leveraged investments, implying that the magnitude of investment returns may be very large relative to the initial amount of margin posted. In some cases, the investment loss may be larger than the initial amount invested. For Treasury futures, this type of investment loss will occur if interest rates rise sharply relative to the magnitude and direction of rate movements already priced into the Treasury yield curve.
Plan sponsors should consider this leverage through an asset-liability lens. Today, most pension liabilities contain a large implied short position on the Treasury market—i.e., pension liabilities will decline if interest rates risesharply (Wolfram and Dutton, 2018). A plan sponsor thatdoes not fully hedge this risk in the investment portfolioimplicitly elects to hold a leveraged interest rate positionin the plan’s surplus or deficit.
From an asset/liability perspective, if an allocation to Treasury futures loses value, the plan’s liability value is likely decreasing as well. Investing in Treasury futures to increase the interest rate hedge ratio creates leverage from an asset-only standpoint and could lead to losses greater than the amount initially invested, but actually reduces or neutralizes the leveraged risk in the plan’s funding surplus or deficit.
Liquidity
While trading activity for some more esoteric derivatives contracts might be challenging in times of crisis, the Treasury futures market is quite liquid, with high trading volume. It has historically proven to maintain liquidity through extreme market events, including the 2008–09 global financial crisis and the 2020 pandemic-related volatility (CME Group, 2020).12
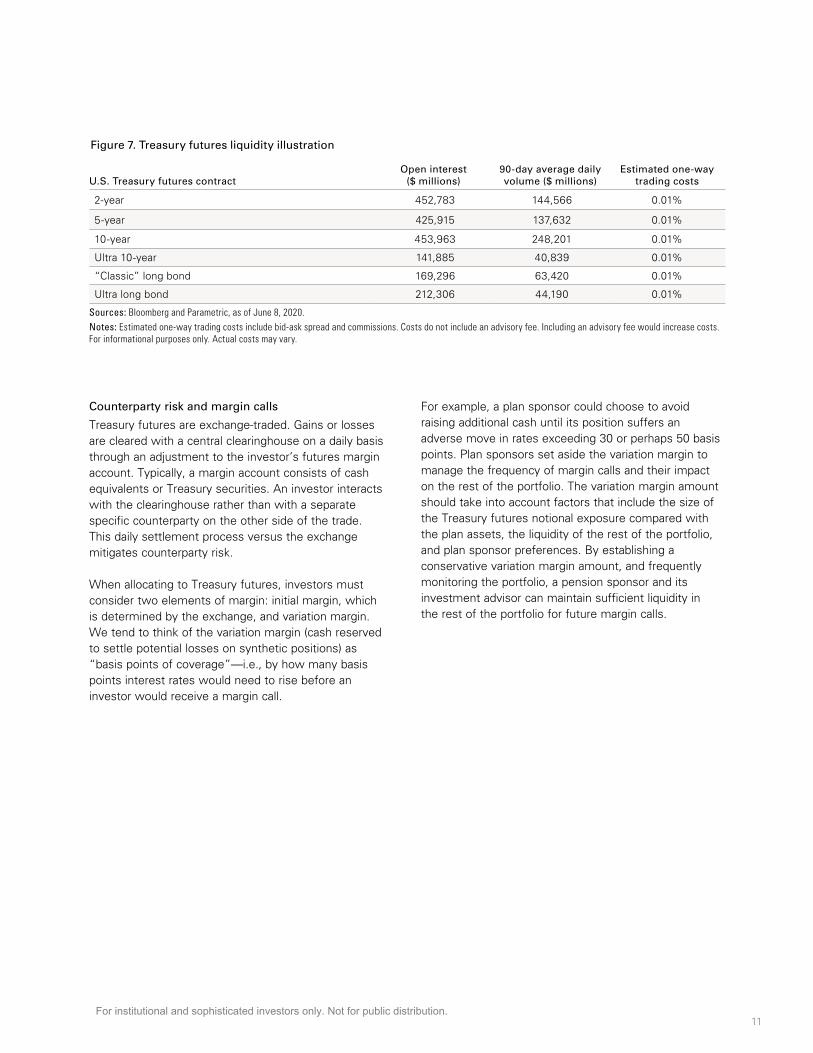
To manage a liability-hedging portfolio, trading would occur when the portfolio is initially constructed, for periodic true-up, and when it is rolled (i.e., when current positions are closed approximately one month before contract expiration and new open positions are established to maintain the desired exposure). As Figure 7 indicates, Treasury futures contracts are quite liquid, with the 10-year U.S. Treasury having the most liquidity. Trading costs for Treasury futures are estimated as 1 basis point (0.01%) one way, and 2–3 basis points annually, including quarterly rolls.
While historical liquidity is no guarantee of future liquidity, for most liability-driven investment portfolios, liquidity considerations are not expected to affect the management of a derivatives overlay program.
12 In addition, refer to Figure A2 in the Appendix for March 2020 trading volume versus average trading volume.
For institutional and sophisticated investors only. Not for public distribution.
11
Counterparty risk and margin calls
Treasury futures are exchange-traded. Gains or losses are cleared with a central clearinghouse on a daily basis through an adjustment to the investor’s futures margin account. Typically, a margin account consists of cash equivalents or Treasury securities. An investor interacts with the clearinghouse rather than with a separate specific counterparty on the other side of the trade. This daily settlement process versus the exchange mitigates counterparty risk.
When allocating to Treasury futures, investors must consider two elements of margin: initial margin, which is determined by the exchange, and variation margin. We tend to think of the variation margin (cash reserved to settle potential losses on synthetic positions) as “basis points of coverage”—i.e., by how many basis points interest rates would need to rise before an investor would receive a margin call.
For example, a plan sponsor could choose to avoid raising additional cash until its position suffers an adverse move in rates exceeding 30 or perhaps 50 basis points. Plan sponsors set aside the variation margin to manage the frequency of margin calls and their impact on the rest of the portfolio. The variation margin amount should take into account factors that include the size of the Treasury futures notional exposure compared with the plan assets, the liquidity of the rest of the portfolio, and plan sponsor preferences. By establishing a conservative variation margin amount, and frequently monitoring the portfolio, a pension sponsor and its investment advisor can maintain sufficient liquidity in the rest of the portfolio for future margin calls.
Figure 7. Treasury futures liquidity illustration
U.S. Treasury futures contractOpen interest
($ millions)90-day average dailyvolume ($ millions)
Estimated one-way trading costs
2-year 452,783 144,566 0.01%
5-year 425,915 137,632 0.01%
10-year 453,963 248,201 0.01%
Ultra 10-year 141,885 40,839 0.01%
“Classic” long bond 169,296 63,420 0.01%
Ultra long bond 212,306 44,190 0.01%
Sources: Bloomberg and Parametric, as of June 8, 2020.Notes: Estimated one-way trading costs include bid-ask spread and commissions. Costs do not include an advisory fee. Including an advisory fee would increase costs. For informational purposes only. Actual costs may vary.
For institutional and sophisticated investors only. Not for public distribution.

12
Conclusion
Treasury futures provide an additional lever for a defined benefit pension plan sponsor to use when establishing a strategic investment allocation. The inclusion of leverage allows the plan sponsor to mitigate uncompensated interest rate risk independently from the size of the return-seeking asset allocation. This adds flexibility to tailor a strategy to the sponsor’s objectives, managing both the funding status risk/reward and the drivers of funding status risk.
While the implementation of Treasury futures increases the operational complexity of most pension plans, the benefit of the added flexibility could outweigh that added complexity. Partnering with an experienced derivatives manager, outsourced chief investment officer, or investment consultant shifts operational complexity away from plan sponsors while providing a powerful risk management resource.
References
Clinger, Justin, and Jim Gannon, 2020. Risk Management for Pensions: Does the Risk You’re Taking Align With Your Stated Risk Tolerance? Valley Forge, Pa.: The Vanguard Group.
CME Group, 2017. Understanding Treasury Futures. November; available at https://www.cmegroup.com/education/files/understanding-treasury-futures.pdf.
CME Group, 2020. Holistic Liquidity Measures During Covid-19: Supply, Demand, and Market Conditions. Available at https://www.cmegroup.com/campaigns/holistic-liquidity-measures-during-covid-19-supply-demand-and-market-conditions.html.
Davis, Joseph H., Roger Aliaga-Díaz, Donald G. Bennyhoff, Andrew J. Patterson, and Yan Zilbering, 2010. Deficits, the Fed, and Rising Interest Rates: Implications and Considerations for Bond Investors. Valley Forge, Pa.: The Vanguard Group.
Gannon, Jim, and Brett Dutton, 2019. Focus on the Main Thing: Maximizing Capital Efficiency in Liability-Hedging Fixed Income. Valley Forge, Pa.: The Vanguard Group.
Wolfram, Joseph M., and Brett B. Dutton, 2018. Pension Derisking: Start With the End in Mind. Valley Forge, Pa.: The Vanguard Group.
For institutional and sophisticated investors only. Not for public distribution.

13
Appendix
Figure A1. Characteristics of portfolio models
Portfolio detailsCurrent Portfolio A Portfolio B Portfolio C
Return-seeking allocation 50% 40% 50% 63%
U.S. equity 30% 24% 30% 38%
International equity 20% 16% 20% 25%
Liability-hedging allocation 50% 60% 50% 37%
Long credit A–AAA 30% 40% 30% 23%
Long U.S. Treasury 20% 20% 15% 8%
Cash (futures collateral) 0% 0% 5% 6%
Futures allocation (notional value, $ millions) 38.2 51.3
2-year 2.7 3.2
5-year 5.1 6.0
10-year 3.6 4.1
Ultra 10-year 7.7 9.1
Treasury bond 11.6 15.1
Ultra Treasury bond 7.5 13.8
Liability details
Measurement date March 31, 2020
Present value $100 million
Discount rate 2.8% (using Vanguard Pension Discount Curve)
Duration 12.2 years
Note: Our daily proprietary Vanguard Pension Discount Curve consists of 60 spot rates (i.e., zero coupon yields), with maturities ranging from 0.5 to 30 years, and can be used to discount a pension plan’s projected cash flows and calculate a daily liability estimate.Source: Vanguard.
Figure A2. March 2020 Treasury futures trading volume
U.S. Treasury futures contractYTD average daily
volume ($m)March daily average
volume ($m)March/YTD daily average volume
2-year 137,723 195,802 142%
5-year 130,151 187,454 144%
10-year 243,438 307,089 126%
Ultra 10-year 38,555 54,974 143%
“Classic” long bond 61,771 80,429 130%
Ultra long bond 41,377 52,465 127%
Sources: Bloomberg and Parametric, as of June 8, 2020.
For institutional and sophisticated investors only. Not for public distribution.
14
About the Vanguard Capital Markets Model
IMPORTANT: The projections and other information generated by the Vanguard Capital Markets Model® (VCMM) regarding the likelihood of various investment outcomes are hypothetical in nature, do not reflect actual investment results, and are not guarantees of future results. VCMM results will vary with each use and over time.
The VCMM projections are based on a statistical analysis of historical data. Future returns may behave differently from the historical patterns captured in the VCMM. More important, the VCMM may be underestimating extreme negative scenarios unobserved in the historical period on which the model estimation is based.
The Vanguard Capital Markets Model® is a proprietary financial simulation tool developed and maintained by Vanguard’s primary investment research and advice teams. The model forecasts distributions of future returns for a wide array of broad asset classes. Those asset classes include U.S. and international equity
markets, several maturities of the U.S. Treasury and corporate fixed income markets, international fixed income markets, U.S. money markets, commodities, and certain alternative investment strategies. The theoretical and empirical foundation for the Vanguard Capital Markets Model is that the returns of various asset classes reflect the compensation investors require for bearing different types of systematic risk (beta). At the core of the model are estimates of the dynamic statistical relationship between risk factors and asset returns, obtained from statistical analysis based on available monthly financial and economic data from as early as 1960. Using a system of estimated equations, the model then applies a Monte Carlo simulation method to project the estimated interrelation-ships among risk factors and asset classes as well as uncertainty and randomness over time. The model generates a large set of simulated outcomes for each asset class over several time horizons. Forecasts are obtained by computing measures of central tendency in these simulations. Results produced by the tool will vary with each use and over time.
For institutional and sophisticated investors only. Not for public distribution.

15
MSCI BarraOne information
The MSCI Barra models are intended to help investors understand sources of risk and return within securities and portfolios of securities. The models pertain to risks present in the equity, fixed income, currency, commodity, and other alternative markets. As a predictive model, it may not achieve this intended purpose, especially over shorter-term periods. The model may not account for all risks actually present, and may incorrectly infer the magnitude of the risks and the degree that they will influence security returns in the future. The model is continually updated based on MSCI Barra’s ongoing research. The model itself is not to be construed as advice of which securities to own or the degree of return that will be earned by any security in the future. The model may be applied in the course of providing advice by Vanguard Investment Advisers, Inc. In this report, it is intended to ease communication related to the sources of risk and return within a portfolio of securities from a variety of asset classes.
The model uses standard deviation of investment returns to define risk. The model presents a consistent, integrated framework, which means that it seeks to distinguish various sources of risk so that the sources are mutually exclusive, but together present a clear composition of risk. These risk sources are style factors, industry factors, and a security-specific component. Each risk factor may include multiple sub-factors. Factors
and sub-factors are associated with specific types of fundamental data (e.g., data from financial reports) and market or common data (e.g., data that is common to all securities in an industry or represent the return patterns of securities, in general). The model uses only data that are available for a broad universe of securities, are applicable across industries, and have a strong link to academic research that establishes strong predictive power for explaining return patterns.
Security style and industry factor exposures are calculated using the data described above. The returns attributable to each factor are estimated via cross-sectional regression (i.e., across all securities) of security returns against their exposures to the risk factors. Beyond a single security (i.e., when considering a portfolio of securities), the model must account for the relationship of risk factors to each other. The model uses a time series of the returns for each factor to calculate the variability of each factor return, and then computes the covariance and correlation of each factor to all other factors. The model weights more recent history in the factor return time series to give more importance to more recent events.
A security’s specific, or residual, return is its return less the return attributed to all the risk factors. The model also calculates the risk associated with that residual return through its variability.
For institutional and sophisticated investors only. Not for public distribution.

Connect with Vanguard® > vanguardmexico.com
All investing is subject to risk, including the possible loss of the money you invest. Futures trading is speculative in nature and involves substantial risk of loss. Futures are not suitable for all investors.
CFA® is a registered trademark owned by CFA Institute.© 2020 The Vanguard Group, Inc. All rights reserved. Vanguard Marketing Corporation, Distributor.
ISGOPAA 102020
Important Information
VIGM, S.A. de C.V. Asesor en Inversiones Independiente (“Vanguard Mexico”) registration number: 30119-001-(14831)-19/09/2018. The registration of Vanguard Mexico before the Comisión Nacional Bancaria y de Valores (“CNBV”) as an Asesor en Inversiones Independiente is not a certification of Vanguard Mexico’s compliance with regulation applicable to Advisory Investment Services (Servicios de Inversión Asesorados) nor a certification on the accuracy of the information provided herein. The supervision scope of the CNBV is limited to Advisory Investment Services only and not all services provided by Vanguard Mexico.
This material is solely for informational purposes and does not constitute an offer or solicitation to sell or a solicitation of an offer to buy any security, nor shall any such securities be offered or sold to any person, in any jurisdiction in which an offer, solicitation, purchase or sale would be unlawful under the securities law of that jurisdiction. Reliance upon information in this material is at the sole discretion of the reader.
Securities information provided in this document must be reviewed together with the offering information of each of the securities which may be found on Vanguard’s website: https://www.vanguardmexico.com/web/cf/mexicoinstitutional/en/home or www.vanguard.com
Vanguard Mexico may recommend products of The Vanguard Group Inc. and its affiliates and such affiliates and their clients may maintain positions in the securities recommended by Vanguard Mexico.
ETF Shares can be bought and sold only through a broker and cannot be redeemed with the issuing fund other than in very large aggregations. Investing in ETFs entails stockbroker commission and a bid-offer spread which should be considered fully before investing. The market price of ETF Shares may be more or less than net asset value.
All investments are subject to risk, including the possible loss of the money you invest. Investments in bond funds are subject to interest rate, credit, and inflation risk. Governmental backing of securities apply only to the underlying securities and does not prevent share-price fluctuations. High-yield bonds generally have medium- and lower-range credit quality ratings and are therefore subject to a higher level of credit risk than bonds with higher credit quality ratings. There is no guarantee that any forecasts made will come to pass. Past performance is no guarantee of future results.
Prices of mid- and small-cap stocks often fluctuate more than those of large-company stocks. Funds that concentrate on a relatively narrow market sector face the risk of higher share-price volatility. Stocks of companies are subject to national and regional political and economic risks and to the risk of currency fluctuations, these risks are especially high in emerging markets. Changes in exchange rates may have an adverse effect on the value, price or income of a fund.
The information contained in this material derived from third-party sources is deemed reliable, however Vanguard Mexico and The Vanguard Group Inc. are not responsible and do not guarantee the completeness or accuracy of such information.
This document should not be considered as an investment recommendation, a recommendation can only be provided by Vanguard Mexico upon completion of the relevant profiling and legal processes.
This document is for educational purposes only and does not take into consideration your background and specific circumstances nor any other investment profiling circumstances that could be material for taking an investment decision. We recommend to obtain professional advice based on your individual circumstances before taking an investment decision.
For institutional and sophisticated investors only. Not for public distribution.