Optimizing Outreach and Application Assistance Services in ...
24
ACHIEVING ACCESS TO HEALTH FOR ALL COLORADANS May 2013 Optimizing Outreach and Application Assistance Services in Community-based Organizations: Evaluation Findings from The Colorado Trust’s Outreach and Enrollment for Children and Youth Grant Strategy EVALUATION BY DEBORAH S. MAIN, PHD, KATHERINE E. FEDDE, MS, JENNIFER L. WALTZ AND CATIA CHAVEZ, MPH
Transcript of Optimizing Outreach and Application Assistance Services in ...

ACHIEVING ACCESS TO HEALTH FOR ALL COLORADANS May 2013
Optimizing Outreach and Application Assistance Services in Community-based Organizations: Evaluation Findings from The Colorado Trust’s Outreach and Enrollment for Children and Youth Grant Strategy
EVALUATION
BY DEBORAH S. MAIN, PHD, KATHERINE E. FEDDE, MS, JENNIFER L. WALTZ AND CATIA CHAVEZ, MPH

2
EVALUATION Optimizing Outreach and Application Assistance Services in Community-based Organizations
KEY FINDINGS
This report discusses findings from the evaluation of The Colorado Trust’s three-year, $3.3 million grant strategy (2009-2011) to help expand enrollment of children and youth in public health insurance programs in Colorado. These findings focus on how 12 community-based organizations, with little previous experience in providing application assistance to families to enroll children and youth in public health insurance, offered targeted outreach and application assistance services. These findings provide new insights into the time, effort and outcomes associated with implementing outreach and application assistance services, reinforcing and expanding upon previous literature demonstrating the promise and potential pitfalls of this approach. Key findings include:
ENSURE APPROPRIATE PLANNING AND START-UP TIME. Community-based organizations (CBOs) new to providing application assistance services need time to hire and train outreach workers, plan these new services and identify relevant community partners. The vast majority of CBOs in the evaluation averaged two to three months before their services were up and running.
ORGANIZATIONAL FIT IS KEY TO ENROLLMENT SUCCESS. CBOs that were the most successful in enrolling children had strong alignment between their outreach and application assistance services and the organization’s overall mission. Though most CBOs had little to no experience with public health insurance outreach and enrollment, the most successful CBOs continually integrated this service into the organization’s body of general services, rather than having it operate as a stand-alone project. As CBOs became clear about the outreach and application assistance strategies that best fit their organizational missions and structures, and the clients they serve or could reach, there was a clear pay-off in terms of enrolling low-income children, youth and families in public health insurance. Collectively, these community-based organizations were able to reach and enroll a larger percentage of Hispanic/Latino populations (63%) compared to state (34%) and Denver County (49%) estimates, a population believed to be among the most difficult to reach, with the highest percentage of eligible but not enrolled (EBNE) population.1
EMPHASIZE IN-REACH RATHER THAN OUTREACH STRATEGIES. The majority of CBOs in the evaluation (nine of 12) used strategies within their organizations to identify and enroll EBNE children (i.e. in-reach) rather than outside of their organizations. Among the most successful strategies were those to identify EBNE through existing data systems, lists and referrals within the organization, or target and market application assistance services to a specific population with high EBNE. Organizations that focused internally, rather than on outreach, spent more time developing the capacity of their staff, streamlined processes and developed an organizational awareness and commitment for outreach and application assistance services – work that laid important groundwork for sustaining these programs once funding ended.
FOCUS ON APPLICATION ASSISTANCE. One of the hypotheses of the grant strategy was that CBOs would provide services across the outreach, enrollment and utilization continuum. However, the evaluation found that outreach workers spent a majority of their time and effort helping clients complete an application for enrolling in public health insurance. On average, they spent nearly 90 minutes helping clients/households complete applications. In contrast, post-submission assistance received considerably less attention, with significantly less time and effort devoted to carefully monitoring and reminding clients about redetermination or helping them use their health insurance. CBOs that are new to outreach and enrollment should likely focus their initial services on application assistance.

3
The Colorado Trust
THE COLORADO TRUSTThe Colorado Trust is a grantmaking foundation dedicated to achieving access to health for all Coloradans.
THE AUTHORSDeborah S. Main, PhD, Katherine E. Fedde, MS, Jennifer L. Waltz, BA and Catia Chavez, MPH
The authors are affiliated with the Department of Health and Behavioral Sciences at the University of Colorado Denver. The University of Colorado Denver is a diverse teaching and learning community that creates, discovers and applies knowledge to improve the health and well-being of Colorado and the world.
LETTER FROM THE COLORADO TRUSTIn Colorado, there are nearly 90,000 uninsured children who were eligible for but not enrolled in public health insurance programs such as Medicaid or Child Health Plan Plus (CHP+).2 These children are often the most hard-to-reach, yet consistently overlooked. They remain at significant risk for experiencing health problems, many of which are preventable, due to the absence of available health insurance. Studies have shown that compared to insured children, uninsured children are five-times more likely to have an unmet need for medical care, they are three-times more likely not to get a needed prescription drug, and less likely to receive essential preventive services such as immunizations, dental and vision care.3 These data represent a significant problem which many advocates, policymakers and community-based organizations have sought to ameliorate.
To help begin reaching and enrolling these traditionally hard-to-reach populations of eligible but not enrolled children (EBNE), in 2009 The Colorado Trust launched a three-year, $3.3 million grant strategy, Expanding Outreach and Enrollment for Children and Youth. The purpose of the strategy was to “go where the kids are” and support new outreach and application assistance programs within community-based organizations (CBOs), most of which had never provided public health insurance assistance, but which had established access to EBNE children and youth. Nineteen CBOs in Colorado were funded and they ranged in variety, including homeless and housing organizations, youth development agencies and community health clinics.
To better understand the effectiveness of these CBOs taking on this new role, The Trust funded the University of Colorado Denver to conduct a comprehensive evaluation of the grant strategy. Focusing on 12 of the 19 grantee organizations, the evaluation sought to learn more about:
� Reach: Which populations do CBOs reach and not reach? � Implementation: What outreach and application assistance strategies are CBOs using? � Effectiveness: What is the impact of these CBO models and strategies on enrollment, renewal of
enrollment and use of benefits?
Notably, the evaluation also focused on teasing out the organizational characteristics important to implementing and sustaining an effective outreach and application assistance program.
This report provides an in-depth description and analysis of the results of this three-year effort. The report highlights the challenges that existed as the CBOs waded into uncharted territory and the new opportunities that lie ahead as health care systems adapt to an evolving environment. More so however, this report represents the culmination of the untold dedication that advocates and community organizations in Colorado have poured into serving EBNE children and youth. In the end, we hope that the findings in this report can serve as a platform for robust conversations and actions to ensure that eligibility truly equals enrollment.
Sincerely,
Phillip ChungAssistant Director of Research, Evaluation & Strategic Learning
4
EVALUATION Optimizing Outreach and Application Assistance Services in Community-based Organizations
KEY FINDINGS ....................................................................................................................................................2
INTRODUCTION .................................................................................................................................................5
BACKGROUND OF GRANT STRATEGY ...........................................................................................................6
EVALUATION PURPOSE ....................................................................................................................................6
EVALUATION SCOPE AND METHODS ............................................................................................................6
EVALUATION FINDINGS....................................................................................................................................7
RECOMMENDATIONS AND CONCLUSION .................................................................................................20
APPENDIX A - FULL DESCRIPTION OF EVALUATION METHODS .............................................................22
LIST OF FIGURES AND TABLES .....................................................................................................................23
ENDNOTES ........................................................................................................................................................23
TABLE OF CONTENTS

5
The Colorado Trust
INTRODUCTIONDespite widespread national and state efforts to ensure that all low-income children are enrolled in public health insurance, this goal has not yet been fully met. In 2011, estimates indicated that nearly 90,000 uninsured low-income children in Colorado were eligible for public health insurance programs but did not enroll.2 Recent improvements to expand outreach and simplify enrollment processes are promising, as is the Affordable Care Act’s focus on broadening the Medicaid and Children’s Health Insurance Program (CHIP) umbrella of eligibility.4 However, these large scale changes will place considerable demand on existing enrollment systems and require better ways of reaching and enrolling the eligible but not enrolled (EBNE) population. Involving community-based organizations (CBOs) in the provision of enrollment assistance services is among the most commonly recommended solutions for addressing imminent challenges of eligibility expansion.5-8 Well run and respected CBOs have a special place in local communities by engendering a sense of familiarity, comfort and trust; by reaching eligible families who would otherwise not seek enrollment, either because they are unaware they are eligible, don’t know or understand how public health insurance works, are confused by the application process, or mistrust government programs. CBOs are uniquely poised with direct access to families through a variety of means and can serve as “trusted hands.”
A growing number of programs and evaluations have reinforced the unique role and contributions of CBOs.1,9-12 CBOs have established relationships with, and a deep understanding of, the families and communities they serve. Importantly, they are uniquely situated to provide culturally appropriate services to a variety of traditionally hard-to-reach populations, including communities of color, non-English speaking families, immigrants and homeless or transient families.
With planned national expansion of public health insurance made possible by the Affordable Care Act, CBOs have an opportunity to play a more prominent role as a trusted hand for enrolling children and youth.4 It is important and timely to learn more about the opportunities and challenges CBOs face in doing this important work, and to identify the best practices of those that are most successful in providing enrollment services to a variety of hard-to-reach EBNE populations.
A trusted-hand approach to outreach and enrollment assistance combines a trusted community organization that has established relationships with the families it serves, as well as a clear understanding of the families’ needs, with a comprehensive approach to enrollment that assists families through the entire lifecycle of a public insurance application – from eligibility assessment to enrollment, renewal and utilization of benefits.9

6
EVALUATION Optimizing Outreach and Application Assistance Services in Community-based Organizations
BACKGROUND OF GRANT STRATEGY
EVALUATION PURPOSE
EVALUATION SCOPE AND METHODS
To help realize its vision of achieving access to health for all Coloradans, The Colorado Trust (The Trust) designed a three-year, $3.3 million grant strategy (2009-2011) to help expand enrollment of children and youth in the Child Health Plan Plus (CHP+) and Medicaid public health insurance programs. In 2009, The Trust funded 19 CBOs with established access to children to provide comprehensive outreach and application assistance services in community-based settings throughout the state using outreach workers (OWs). The rationale behind this strategy was to “go where the kids are” and in turn support new outreach and enrollment programs within CBOs that were well positioned in the community to reach and assist EBNE children and youth. To support grantee organizations, The Trust provided technical assistance through the creation of a Community Outreach Specialist position within the Colorado Department of Health Care Policy and Financing (HCPF). The role of the outreach specialist was to serve as a primary point of contact within HCPF for Trust grantees; provide grantees with training and technical assistance regarding the completion and processing of Medicaid and CHP+ applications; help grantees trouble-shoot enrollment difficulties; and standardize the technical assistance and training that HCPF offered for any Colorado CBO wishing to become a Certified Application Assistance Site (CAAS) or Presumptive Eligibility (PE) site.
Prompted by a desire to understand the role and effectiveness of these CBOs in providing these new services, and to fill in the gaps in evidence about the effectiveness and costs of such an approach, The Trust partnered with an evaluation team from the University of Colorado Denver to conduct a comprehensive, multi-year evaluation (2009-2012) of its grant program. The primary goals of this evaluation were to understand the reach, implementation and effect of outreach and enrollment delivered by outreach workers within a range of community-based organizations.
The purpose of this evaluation report is to provide a comprehensive description of the outreach and enrollment strategies used by 12 CBOs in Colorado; the time, effort and cost required to identify and assist their clients; and, the effectiveness of these efforts in terms of enrolling children, youth and their families in public health insurance. Finally, this report describes the characteristics of CBOs that were most successful (i.e., “exemplary”) in enrolling diverse low-income children and families in public health insurance in a cost-efficient and sustainable way, and identify best practices for optimizing the success of outreach and application assistance services in community-based settings.
The primary evaluation questions were:
� REACH: Which populations do CBOs reach and not reach?
� IMPLEMENTATION: What outreach and application assistance strategies are CBOs using?
� EFFECTIVENESS: What is the impact of these CBO models and strategies on enrollment, renewal of enrollment and use of benefits?
A total of 12 of the 19 Trust-funded CBOs participated in this multi-year evaluation, which included a combination of site visits, interviews with outreach workers and administrators, and client-level quantitative information on those assisted, enrolled, and who used health insurance during and six months beyond the three-year funding period. These 12 CBOs represented a range of different types of community-based organizations – variation that allowed the evaluators to study how CBOs with different organizational missions and client populations designed and implemented outreach and application assistance programs to fit their settings.

7
The Colorado Trust
Specific areas of data collection included:Client-level Information. The evaluation team developed a customized client-tracking database, the Client Assistance Tool (CAT), which required all outreach workers to enter information on the instances in which they assisted clients with public health insurance, including enrollment, retention and utilization. These CAT data were then linked to state enrollment and utilization data provided by HCPF at both the application level (households) and client level.
Cost of Outreach and Application Assistance Services. Using a combination of telephone interviews and a review of grantee financial reports, the evaluation team collected basic information about each grantee’s project costs and resources – including whether they spent more than they were granted by The Trust, and what, if any, other resources (e.g., volunteers, other grant funds) were used to support their outreach and application assistance program.
Sustainability. Six months after the three-year Trust grant program ended, the evaluation team conducted interviews with CBO administrators to determine the extent to which they continued to offer outreach and application assistance services within their organizations, whether they received any additional funding for services since Trust funding ended and how their services had changed post-grant.
Integration of Mixed Methods to Identify Exemplary Community-based Organizations. Findings from the cost study and sustainability study were used to identify the most successful CBOs (i.e., "exemplary"), defined as those most able to enroll a substantial number of children and youth in public health insurance at low cost-per-client and to sustain their outreach and application assistance services after funding ended. Cost and sustainability data were used to identify exemplary sites, then the evaluation team used extensive data from site visits, interviews, check-in calls and evaluation team summary documents to conduct a more in-depth qualitative analysis.
(See Appendix A for additional description of the evaluation methodology.)
EVALUATION FINDINGSDescription of Community-based Organizations and Their ClientsAs shown in the following table, the 12 grantees participating in the evaluation were primarily based in the Denver metropolitan area. A majority of these grantees (11 of 12) had never provided outreach and application assistance services before receiving funding from The Trust.
TABLE 1: EVALUATION SITES
Grantee Name Location CBO Type or Description
American Diabetes Association Denver Application assistance at Mexican Consulate
Boys & Girls Clubs of Metro Denver, Inc. Denver Boys & Girls Club
Boys & Girls Clubs of Pueblo County Pueblo Boys & Girls Club
Chaffee County Department of Health and Human Services
Salida Integrated model
Colorado Coalition for the Homeless Denver Housing and homeless services
Denver Children's Advocacy Center Denver Counseling services
Denver Public Schools Denver Schools
Hope Communities Denver Housing and homeless services
Inner City Health Center Denver Community clinic
La Clínica Tepeyac Denver Community clinic
The Gathering Place Denver Housing and homeless services
YMCA of the Pikes Peak Region Colorado Springs Recreational organization

8
EVALUATION Optimizing Outreach and Application Assistance Services in Community-based Organizations
These 12 grantees represent a range of different types of CBOs – variation that allowed the evaluation team to study how CBOs with different organizational missions and client populations designed and implemented outreach and application assistance programs to fit their settings. The following section describes the clients the 12 selected CBOs were able to reach with their programs.
REACH: Which populations do CBOs reach and not reach?Race, Ethnicity, Primary Language Spoken The 12 CBOs assisted a total of 6,242 clients from 3,202 households with public health insurance outreach and enrollment-related efforts over the course of the grant period (between January 2009 and December 2011). As shown in Figure 1, the 12 CBOs reached a diverse population of clients, with 63% Hispanic, 20% white, 5% black, 2% Asian and 3% multi-race/other.
Of particular interest, outreach workers from the 12 CBOs reached a much higher percentage of clients who identified as Hispanic when comparing these data to summary data on the race and ethnicity of the overall Colorado Medicaid/CHP+ enrollee population (for 2011) and for Denver County (see Figures 2 and 3).
These same patterns of difference hold for the primary language spoken in the household: 50% of clients assisted by grantees spoke Spanish as their primary language, compared to state and Denver County percentages of 16% and 29%, respectively. These demographic data varied considerably by grantee, with some serving mostly Hispanic populations, a large percentage of which preferred Spanish as their primary language; a few sites assisting mostly white, English-speaking clients; and, for one site, 42% of households served spoke a primary language other than English or Spanish, due to the large refugee population in the area. That grantees reached clients from a significantly higher percentage of Spanish-speaking households demonstrates the value of CBO assistance providers who target non-native English speakers, as this population comprises a large part of those EBNE who might not otherwise be reached.13
Demographic information on client race, ethnicity and preferred language however does not adequately capture the social contextual circumstances faced by many clients served by these 12 sites; for example, their socioeconomic status; levels of homelessness and transiency; immigration and refugee status; levels of experienced violence and abuse; and mental health status Together, these and other social
Hispanic
White
Black
Asian
Other
Not identi ed
63%
20%
5%
2%
3% 7%
Hispanic
White
Black
Asian
Other Not identi�ed
FIGURE 1. GRANTEE CLIENT RACE/ETHNICITY
28%
7%
2%
3%
22% Hispanic
White
Black
Asian
Other
Not identi ed
34% Hispanic
White
Black
Asian
Other
Not identi�ed
FIGURE 2. COLORADO 2011 MEDICAID/CHP+ ENROLLEE RACE/ETHNICITY
10%
14%
3%
6%
18%
Hispanic
White
Black
Asian
Other
Not identi ed
49%
FIGURE 3. DENVER COUNTY 2011 MEDICAID/CHP+ ENROLLEE RACE/ETHNICITY

9
The Colorado Trust
circumstances can profoundly influence whether clients are aware of, interested in, eligible for and/or able to apply for public health insurance; and whether these CBOs are in the best position to provide the resources, information and support for getting their eligible clients insured.14 Later, this report presents findings that illustrate the time and effort required to serve clients with these diverse needs and backgrounds.
IMPLEMENTATION: What outreach and application assistance strategies are CBOs using? The diversity of the 12 grantees’ settings, missions and populations they serve resulted in their using wide-ranging approaches to outreach and application assistance. However, there were a few common strategies used by sites to reach, assist and help enroll children and families in public health insurance.
In-reach Strategies Versus Outreach Although nearly all sites engaged in some form of outreach into the community to raise awareness of their services, promote their programs, and identify and help enroll new clients (e.g., attending health fairs, community events, parent events at schools), the large majority of grantees – nine of 12 – focused most of their time and energy on in-reach strategies, working within their own organizations to identify and enroll EBNE children.
Of the three CBOs spending more of their efforts on outreach in the community, one site enrolled more than 95% of clients from outside of the organization via community outreach events and referrals from other CBOs (e.g., libraries, churches, food banks, child care) as well as from other grantee sites that refer to this organization for Presumptive Eligibility (PE) enrollment, which grants public health insurance access to eligible clients as soon as they apply. Another CBO was a county agency that intentionally designed its program to reach out to, link with and assist other CAAS (Certified Application Assistance Site) community partners. The third site had difficulty finding EBNE children within their organization, so the OW spent much of her time promoting their program externally to community CAAS or MA (Medical Assistance) sites and providing financial assistance to cover document costs.
Most grantees spent a majority of their efforts identifying EBNE children from their existing clientele (e.g., drop-in and recreational sites added questions to intake forms or member surveys to ask about health insurance and whether they wanted to be contacted by a representative from the CBO to assist with a public health insurance application). One site added application assistance services to their existing menu of public assistance resources and information they offer at the Mexican Consulate, keeping regular weekday hours and offering a clear mechanism for appointments and walk-ins for clients interested in enrolling in public health insurance. A handful of these CBOs routinely culled billing or other client lists to identify clients who were EBNE, after which they contacted and screened potentially eligible clients. Others included information about public health insurance and eligibility in packets routinely sent to parents (e.g., in back-to-school packets). And some OWs educated members of their organization who helped promote application assistance services, identify potentially eligible clients and make referrals.
Financial Incentives/Reimbursement for Clients About half of the CBOs used some of their grant funds to cover costs for obtaining missing client identity documents (e.g., birth certificates); one of these sites used funds to offer clients a $50 incentive to complete an application or cover document costs. Interestingly, one site marketed these reimbursement services to other enrollment sites in their community, a strategy that turned out to be their primary contribution in helping the community enroll children and families in public health insurance.
Collaboration/Partnerships with Other CBOs As the 12 CBOs became clearer over time about their own strategies for assisting clients with outreach and enrollment (since most had never offered public health application assistance services before), their collaborations with other community-based partners also became more solidified. Many sites focused primarily on in-reach strategies, for example, established linkages with other CBOs to which they could refer their clients for services they were unable to provide such as PE. Another site was able to successfully leverage an existing partnership with a CBO that served a similar population so that together they were able to offer a wider range of coordinated services to their clients. Finally, a few sites established relationships with other CBOs as a means to institute a referral process. For example, one site provided extensive support (e.g., training, technical assistance, policy updates) to several community-based CAAS partners to assist clients with applications. With Trust-funded CBOs serving as the final step in this enrollment process, they received PE applications completed by their partners and submitted them
10
EVALUATION Optimizing Outreach and Application Assistance Services in Community-based Organizations
to the state for processing. This community-based referral system was designed to improve coordination and reduce redundancies; it did, however, seem to increase the number of days it took to submit an application for processing.
Outreach Worker Time and Effort Spent on Enrollment Assistance An essential feature of the evaluation was the ability to capture client- and household-level data about when, how often and for how long OWs assisted clients across the "life cycle" of an application. These data encompassed the process of helping clients determine their eligibility; obtaining necessary documents, completing and submitting applications; working with clients after an application is submitted if an application is denied or returned as incomplete; helping clients find providers and use their health insurance; and helping clients redetermine their eligibility and renew their insurance so they have continuous coverage. First, metrics for the time and effort taken by outreach workers working with clients during different stages of the application process is briefly described. Then, information, both in terms of overall averages and medians, are presented to illustrate the considerable variability of time and effort across the 12 diverse CBOs – information that, in its quantitative form, is not widely described in the literature.
Overall, OWs across the 12 CBOs spent an average of 97 minutes per household providing some type of assistance (median = 80 minutes); time with clients varied considerably however by grantee. In examining when and what application assistance is provided to clients/households, a more consistent pattern emerges. Nearly all interactions with new clients (95%) involved assisting with a new application, 4% for redetermination/reenrollment, and 1% on an existing application. This high number of new clients seeking application assistance within these 12 CBOs is not surprising given that this was the first foray for most into the realm of application assistance; however, it does indicate how they spent their time when they first met clients: completing and submitting applications.
Pre-submission Assistance As shown in Table 2, of the total time the OWs spent with clients 84% was spent helping them complete an application.
On average, OWs spent just under one and a half hours completing an application, with time varying considerably across different CBOs. Figure 4, at the top of page 11, illustrates the vast differences across the CBOs in terms of how much time they spent helping clients complete and submit an application.
Those CBOs that took the most time completing applications did so for a variety of reasons: the types of the populations they served, whether identity documents were easily available and/or document costs were covered for clients (like ordering new birth certificates), or whether application assistance involved multiple organizations, thus requiring referrals before final processing.
The number of client contacts (e.g., face-to-face, phone) taken by OWs to complete an application also varied considerably across organizations, ranging from an average of one contact with clients to just over five, with an average of three contacts per client. Finally, CAT data indicate that it took approximately eight days on average from the time an OW began working with a client on an application to when it was submitted; the average number of days varied by grantees, ranging from three to 17.
Pre-submission Assistance Mean Median Range
Percentage of Total Time Spent Completing*
84% – –
Percentage of Total Contacts Spent Completing Initial Application
70% – –
Minutes to Complete Initial Application
89 70 2 - 965
Number of Contacts to Complete Initial Application
2.3 1 1 - 14
Days to Complete Initial Application
8.2 3 1 - 95
*completing an application includes submitting it
TABLE 2: OUTREACH WORKER TIME AND EFFORT METRICS
11
The Colorado Trust
Post-submission Assistance Another important phase in application assistance occurs after an application has been submitted for processing. In analyzing multiple sources of quantitative and qualitative data, it is clear that among the 12 CBOs participating in the evaluation, all placed less of an emphasis on assisting clients during this post-submission period. Of clients/households assisted by these CBOs, 30% received some type of assistance after submitting their applications. Figure 5 illustrates the considerable variability among grantees in assistance they provided to clients post-submission (from 3% to 58%). Of note, when assistance was provided post-submission, both the number of client contacts and minutes spent assisting them were much lower than pre-submission: 45 minutes on average (versus 89 minutes pre-submission).
EFFECTIVENESS: What is the impact of these CBO models and strategies on enrollment, renewal of enrollment and use of benefits? Through interviews with OWs and administrators, a key finding was that delivering outreach and application assistance services within CBOs requires considerable planning, time and effort. An important question relevant to the evaluation is whether the strategy of situating outreach and enrollment services within CBOs results in more applications and increased enrollment of children and youth in
30%
22% 21%
57%
30%
39%
19%
4%
34%
58%
3%
10%
45%
0%
10%
20%
30%
40%
50%
60%
70%
Households Receiving Post-Submission Assistance Figure 5
Percent of Households Receiving Post-submission Assistance
OVERALLAVERAGE
GRANTEES
89
40
69 74
160
113 107 109
35
63 60
76 66
0
20
40
60
80
100
120
140
160
180
Average Assistance Minutes to Complete an Application Figure 4
Average Assistance Time to Complete an Application
OVERALLAVERAGE
GRANTEES
MIN
UT
ES

12
EVALUATION Optimizing Outreach and Application Assistance Services in Community-based Organizations
public health insurance. Because the evaluation team designed a tool that tracked clients after assistance and the submission of an application, it is possible to describe what happened to an application once it reached the state, including whether children and youth were enrolled and used public health insurance.
Application Status One important indicator of the success of application assistance efforts relates to the status of a submitted application, whether approved (for either Medicaid or CHP+), pending, denied, etc. (One of the limitations of this indicator is that it is at the household level, not individual. If only one person out of a household is approved, the application status will show approved for everyone in the household.) Out of 3,042 total households linked with HCPF state-level data, 74% had an initial application approved; 17% were pending; and 9% were denied. Out of the 17% that were initially pending (511 households), 61% ended up approved and 36% ended up denied or discontinued (3%, or 13 households, were still pending when monthly HCPF data linking/tracking ended). (See Figure 6)
Follow-up assistance provided by OWs, specific to pending, denied and discontinued applications resulted in an overall approval rate of 85% and denial rate of 15%. These high approval rates could be due to a large percentage of the population the grantee serves being eligible and/or that careful eligibility requirement screening was done before beginning the application process. Higher pending rates could be indicative of missing documents or other forms of incomplete applications being submitted. The denial rates, ranging from 6% to 17%, mostly hover around 10%.
Enrollment Rate Initial status of an application offers only an early indication of an application: enrollment rate is a better estimate of the percentage of clients assisted who ended up enrolled in either CHP+ or Medicaid. This measure is different from initial status in that it is at the individual level and reflects changes in the status of an application when a client initially denied gets approved. Of the 12 grantees participating in this evaluation, the overall enrollment rate was 93% (note that this rate is higher than the approval rate previously discussed, because many clients whose application initially was denied were at a later point approved, (or they reapplied at some later point during the evaluation tracking and were approved). As shown in Figure 7, enrollment rates were high across all grantees, ranging from 82% to 98%. Higher enrollment rates could be an indication of a population served that is more likely to be eligible, and/or more careful eligibility screening processes.
74% 68% 71% 69%
77% 74% 78% 76% 74%
83%
61%
49%
80%
Initial Application Status
Approved
Denied
Pending
0%
20%
40%
60%
80%
100%
Figure 6
Initial Application Status
GRANTEESOVERALLAVERAGE
13
The Colorado Trust
Insurance Type Overall, 66% of the 6,242 clients assisted were enrolled in Medicaid and 20% in CHP+ (see Figure 8); 14% were either denied or were unable to be linked with the state’s public health insurance database. These percentages vary considerably across sites, depending on the income level of the populations they serve. Out of just the enrolled client population, the rate was 77% Medicaid, 23% CHP+.
Enrollment and Utilization The 12 CBOs assisted a total of 6,242 clients and 3,202 households over the course of the period in which enrollment was tracked (between March 2010 and July 2012), with a total of 5,584 of those enrolled in Medicaid or CHP+ as shown in figure 9 on page 14.
66% 67%
46% 44%
87%
50%
70% 68% 70% 65%
51%
70% 63%
0%
20%
40%
60%
80%
100%
Initial Insurance Type
Medicaid
CHP+
Neither
Figure 8
Initial Insurance Type
GRANTEESOVERALLAVERAGE
93% 90% 85% 83%
95% 98% 98%
93% 96% 96%
82%
87% 92%
0%
10%
20%
30%
40%
50%
60%
70%
80%
90%
100%
Enrollment Rate
Figure 7Enrollment Rate
GRANTEESOVERALLAVERAGE

14
EVALUATION Optimizing Outreach and Application Assistance Services in Community-based Organizations
The number of clients enrolled in public health insurance varied considerably from one CBO to the next (Figure 10 shows the number of enrolled clients at each CBO), ranging from a low of 29 enrolled clients to a high of 1,100.
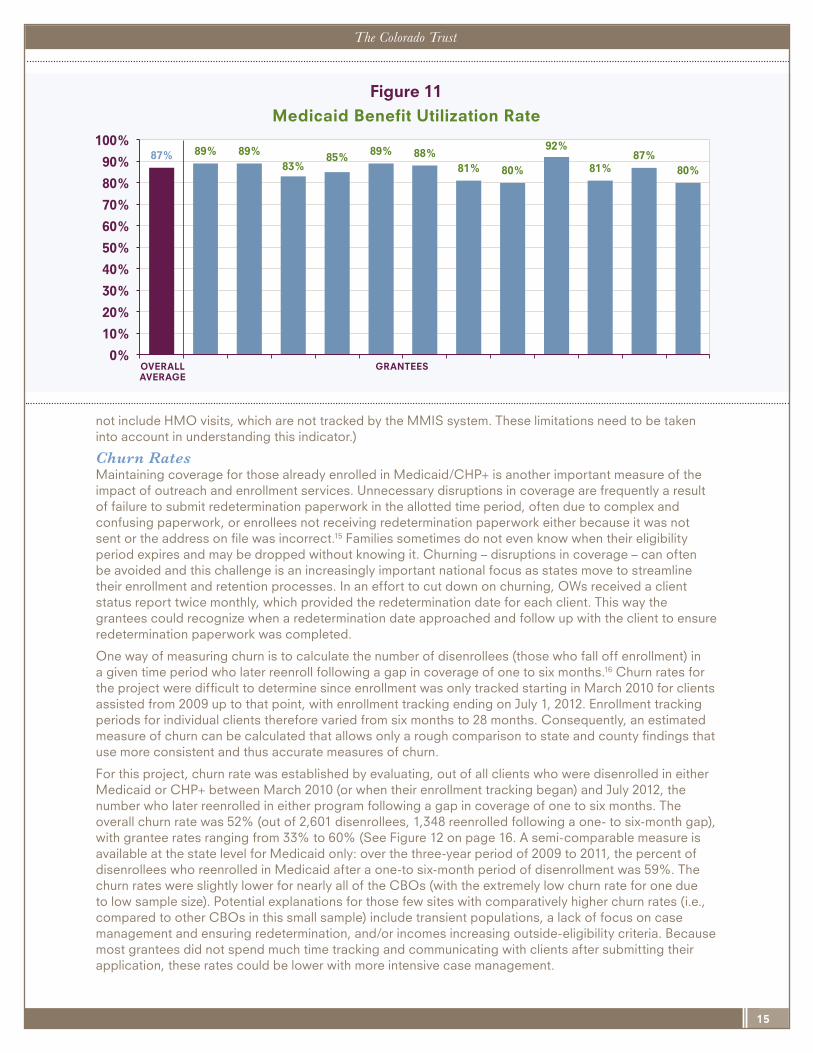
Medicaid Benefit Utilization Rate An important indicator of the effectiveness of outreach and enrollment services within CBOs is that more children, youth and their families were able to use public health insurance.
Out of the 4,873 total clients who were enrolled in Medicaid (between initial grantee assistance and July 1, 2012), 4,217 or 87% utilized their Medicaid benefits at least once between January 1, 2009 and July 1, 2012 as shown in Figure 11 on page 15. (Note: This only pertains to EPSDT (Early Periodic Screening, Diagnosis and Treatment), dental, physician, inpatient hospital and outpatient hospital visits, and does
2,660
3,615 4,082
4,684 5,061
5,517 5,584
0
1,000
2,000
3,000
4,000
5,000
6,000
Clients Enrolled in Medicaid or CHP+ (Post-Assistance)
Figure 9
Number of Clients Enrolled in Medicaid or CHP+ (Post-assistance)
1,100
50 29
623
496
678
923
118
841
239 154
333
0
200
400
600
800
1,000
1,200
Clients Enrolled in Medicaid or CHP+ July 2012
Figure 10
Number of Clients Enrolled in Medicaid/CHP+ thru July 2012(Post-assistance)
GRANTEES
15
The Colorado Trust
not include HMO visits, which are not tracked by the MMIS system. These limitations need to be taken into account in understanding this indicator.)
Churn Rates Maintaining coverage for those already enrolled in Medicaid/CHP+ is another important measure of the impact of outreach and enrollment services. Unnecessary disruptions in coverage are frequently a result of failure to submit redetermination paperwork in the allotted time period, often due to complex and confusing paperwork, or enrollees not receiving redetermination paperwork either because it was not sent or the address on file was incorrect.15 Families sometimes do not even know when their eligibility period expires and may be dropped without knowing it. Churning – disruptions in coverage – can often be avoided and this challenge is an increasingly important national focus as states move to streamline their enrollment and retention processes. In an effort to cut down on churning, OWs received a client status report twice monthly, which provided the redetermination date for each client. This way the grantees could recognize when a redetermination date approached and follow up with the client to ensure redetermination paperwork was completed.
One way of measuring churn is to calculate the number of disenrollees (those who fall off enrollment) in a given time period who later reenroll following a gap in coverage of one to six months.16 Churn rates for the project were difficult to determine since enrollment was only tracked starting in March 2010 for clients assisted from 2009 up to that point, with enrollment tracking ending on July 1, 2012. Enrollment tracking periods for individual clients therefore varied from six months to 28 months. Consequently, an estimated measure of churn can be calculated that allows only a rough comparison to state and county findings that use more consistent and thus accurate measures of churn.
For this project, churn rate was established by evaluating, out of all clients who were disenrolled in either Medicaid or CHP+ between March 2010 (or when their enrollment tracking began) and July 2012, the number who later reenrolled in either program following a gap in coverage of one to six months. The overall churn rate was 52% (out of 2,601 disenrollees, 1,348 reenrolled following a one- to six-month gap), with grantee rates ranging from 33% to 60% (See Figure 12 on page 16. A semi-comparable measure is available at the state level for Medicaid only: over the three-year period of 2009 to 2011, the percent of disenrollees who reenrolled in Medicaid after a one-to six-month period of disenrollment was 59%. The churn rates were slightly lower for nearly all of the CBOs (with the extremely low churn rate for one due to low sample size). Potential explanations for those few sites with comparatively higher churn rates (i.e., compared to other CBOs in this small sample) include transient populations, a lack of focus on case management and ensuring redetermination, and/or incomes increasing outside-eligibility criteria. Because most grantees did not spend much time tracking and communicating with clients after submitting their application, these rates could be lower with more intensive case management.
87% 89% 89% 83%
85% 89% 88% 81% 80%
92%
81% 87%
80%
0%
10%
20%
30%
40%
50%
60%
70%
80%
90%
100%
Medicaid Bene�t Utilization Rate
Figure 11
Medicaid Benefit Utilization Rate
OVERALLAVERAGE
GRANTEES

16
EVALUATION Optimizing Outreach and Application Assistance Services in Community-based Organizations
IDENTIFYING EXEMPLARY COMMUNITY-BASED ORGANIZATIONS: Cost-Per-Client and Sustainability as Metrics of Success Because a multitude of factors influenced the design and implementation of outreach and enrollment services within these 12 CBOs, it was difficult to come up with metrics that allow site-by-site comparisons of program impacts. For example, these 12 CBOs:
� Received different amounts and years of funding
� Had different missions with varying organizational structures
� Served different client populations
� Anticipated different enrollment numbers
� Faced different pressures as a result of the struggling economy
� Had different histories and reputations within their communities
� Had different levels of turnover among outreach workers, administrators and other staff
Although, “clusters” of types of organizations (e.g., drop-in and recreation centers, health care centers, housing) were initially developed in analyzing the data, there was substantial variability within these categories to make them less useful for our purposes. Instead, a cost analysis was conducted to provide metrics that combined funding, assistance, enrollment and utilization. Further, a combination of cost metrics with data about program sustainability were used to identify the most successful CBOs able to help enroll children, youth and their families in public health insurance in a cost-efficient and sustainable way. Cost analysis and sustainability findings are summarized below.
Cost Analysis Results For this evaluation, cost-per-client enrolled is considered the metric that best reflects the primary goals and efforts of the 12 participating CBOs – to help enroll children, youth and their families in public health insurance. As well, secondary metrics of cost-per-client were linked to assistance and utilization for information purposes. Finally, cost-per-client estimates were integrated in order to account for CBO start-up of outreach and enrollment services, typical costs of a program once it is up and running.
The cost-per-client enrolled varied considerably across the 12 CBOs, with three CBOs clearly standing out (i.e., as outliers) due to their extraordinarily high cost-per-client enrolled, ranging from $1,162 to $7,862. These numbers are in stark contrast to the lowest cost-per-client CBOs, with the lowest two at $117 and $119-per-client enrolled and two others coming in just below $300-per-client enrolled ($244, $294). Cost-per-client enrolled estimates of these four “top” CBOs compare favorably to the $280-per-
52% 53%
46%
33%
46%
56% 60%
49% 48% 51%
43%
52% 49%
0%
10%
20%
30%
40%
50%
60%
70%
Churn Rate Figure 12
Churn Rate
OVERALLAVERAGE
GRANTEES
17
The Colorado Trust
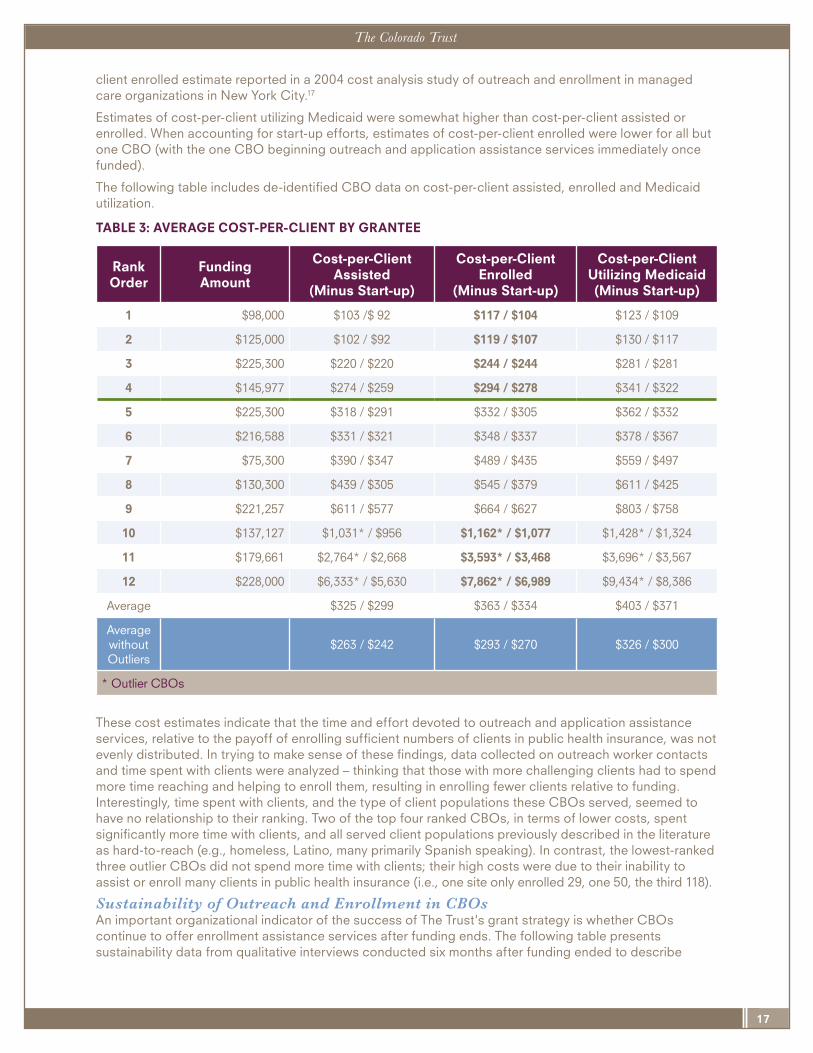
client enrolled estimate reported in a 2004 cost analysis study of outreach and enrollment in managed care organizations in New York City.17
Estimates of cost-per-client utilizing Medicaid were somewhat higher than cost-per-client assisted or enrolled. When accounting for start-up efforts, estimates of cost-per-client enrolled were lower for all but one CBO (with the one CBO beginning outreach and application assistance services immediately once funded).
The following table includes de-identified CBO data on cost-per-client assisted, enrolled and Medicaid utilization.
TABLE 3: AVERAGE COST-PER-CLIENT BY GRANTEE
These cost estimates indicate that the time and effort devoted to outreach and application assistance services, relative to the payoff of enrolling sufficient numbers of clients in public health insurance, was not evenly distributed. In trying to make sense of these findings, data collected on outreach worker contacts and time spent with clients were analyzed – thinking that those with more challenging clients had to spend more time reaching and helping to enroll them, resulting in enrolling fewer clients relative to funding. Interestingly, time spent with clients, and the type of client populations these CBOs served, seemed to have no relationship to their ranking. Two of the top four ranked CBOs, in terms of lower costs, spent significantly more time with clients, and all served client populations previously described in the literature as hard-to-reach (e.g., homeless, Latino, many primarily Spanish speaking). In contrast, the lowest-ranked three outlier CBOs did not spend more time with clients; their high costs were due to their inability to assist or enroll many clients in public health insurance (i.e., one site only enrolled 29, one 50, the third 118).
Sustainability of Outreach and Enrollment in CBOs An important organizational indicator of the success of The Trust's grant strategy is whether CBOs continue to offer enrollment assistance services after funding ends. The following table presents sustainability data from qualitative interviews conducted six months after funding ended to describe
RankOrder
FundingAmount
Cost-per-ClientAssisted
(Minus Start-up)
Cost-per-ClientEnrolled
(Minus Start-up)
Cost-per-ClientUtilizing Medicaid(Minus Start-up)
1 $98,000 $103 /$ 92 $117 / $104 $123 / $109
2 $125,000 $102 / $92 $119 / $107 $130 / $117
3 $225,300 $220 / $220 $244 / $244 $281 / $281
4 $145,977 $274 / $259 $294 / $278 $341 / $322
5 $225,300 $318 / $291 $332 / $305 $362 / $332
6 $216,588 $331 / $321 $348 / $337 $378 / $367
7 $75,300 $390 / $347 $489 / $435 $559 / $497
8 $130,300 $439 / $305 $545 / $379 $611 / $425
9 $221,257 $611 / $577 $664 / $627 $803 / $758
10 $137,127 $1,031* / $956 $1,162* / $1,077 $1,428* / $1,324
11 $179,661 $2,764* / $2,668 $3,593* / $3,468 $3,696* / $3,567
12 $228,000 $6,333* / $5,630 $7,862* / $6,989 $9,434* / $8,386
Average $325 / $299 $363 / $334 $403 / $371
Average without Outliers
$263 / $242 $293 / $270 $326 / $300
* Outlier CBOs

18
EVALUATION Optimizing Outreach and Application Assistance Services in Community-based Organizations
whether these organizations continued to sustain their outreach and enrollment services, what parts they were able to sustain or dropped and why, and whether they’ve received additional funding. Of the 12 CBOs, eight continued their outreach and enrollment services, sometimes in a different form. Of the four CBOs not continuing outreach and enrollment services, all had the highest cost-per-client-enrolled estimates.
TABLE 4: GRANTEE PROGRAM SUSTAINABILITY
Best Practices of Outreach and Enrollment Services A critical question from these cost and sustainability findings: What differentiates those CBOs able to deliver outreach and enrollment services most efficiently – those that are able to continue to provide these services once funding goes away? Through in-depth analysis of quantitative and qualitative data,
RankOrder
of CBOs
Cost-per-Client
Enrolled
Sustained Outreach & Enrollment Services?
Summer 2012 Status(Six months after funding ended)
1 $117 YesNo new funding; no changes to program; still Presumptive Eligibility (PE) site; planning on expanding their outreach efforts, expansion of outreach and application assistance services a high priority for organization.
2 $119 YesNew grant to continue their outreach and application assistance services; they hoped to hire another OW in another year or so, but this was not definite.
3 $244 YesSame program model after funding; more aggressive with outreach. Not fully dependent on external funding due to federal Medicaid reimbursement; still seeking more funding for expansion.
4 $294 Yes
Shifting outreach and application assistance to an integrated general service throughout the organization (trained case managers responsible for other services); no additional funding. Still do PE; integrated model works better for clients.
5 $332 YesContinuing to provide application assistance and PE; no new funding yet to support outreach and enrollment services; not doing as much outreach and OW focused on other priorities.
6 $348 YesRolling outreach and application assistance into county services; less time devoted to partnerships; scaled-down application assistance services, PE and outreach; planning for ACA and exploring navigator model.
7 $489 Yes
Only aspect of outreach and application assistance cut was client incentives; outreach and enrollment is now a general service (rather than defined, stand-alone program); will maintain Certified Application Assistance (CAAS) status.
8 $545 YesContinuing all aspects of outreach and application assistance services with slightly enhanced outreach efforts.
9 $664 NoOutreach and application assistance services on the back burner; not seeking more funding.
10 $1,162 No Periodic use of student interns, not enough EBNE to fund a paid OW.
11 $3,593 NoStopped active outreach; maintaining CAAS credentials, but only providing services on an ad hoc basis.
12 $7,862 NoNo outreach and application assistance services; no funding for birth certificates (their primary service); referring application assistance elsewhere.

19
The Colorado Trust
the evaluation team identified characteristics that distinguished the four most exemplary CBOs able to implement and sustain outreach and application assistance services within their organizations from the other grantee organizations. Worth noting is that the type of organization did not account for any differences: the four exemplary CBOs were each a different type of organization – school-based, health care, homeless services and a local chapter of a national nonprofit targeting prevention and management of diabetes.
� Organizational Fit and Integration The four CBOs most successful in providing these services were able to see clearly the organizational need and benefits of providing outreach and application assistance services; they viewed implementing and sustaining this new service as a way to improve their ability to accomplish their core mission – to meet the needs of clients and other community partners. They understood the synergy of public health insurance with other client needs they were already addressing; over time, outreach and application assistance was viewed as an integral part of what the organization provides to its clients, not an add-on that can go away when funding ends. They focused on continually streamlining processes and integrating outreach and enrollment services as part of their general service line (not a stand-alone program) – one grantee noted, “it is a part of what we do.”
� Commitment to Addressing Needs of Clients The more successful CBOs had a clear understanding of their clients before funding and sought Trust funds to address an important client need: health insurance. Consequently, these CBOs were able to fairly swiftly leverage their Trust grants to reach and enroll clients in public health insurance. They spent less time having to identify their clients who were EBNE; usually, they were able to help enroll clients who walked through the door and would immediately benefit from outreach and application assistance services. This access to EBNE populations resulted in having steady streams of clients in need of their services. Finally, exemplary CBOs and their outreach workers continued to identify gaps in and improve delivery of these services to meet the needs of their client populations. This included expanding their level of assistance (e.g., becoming certified to process PE) so that their clients would not have to add one more step in wading through the enrollment maze.12,18
� More In-reach, Less Outreach Although all CBOs participating in the evaluation spent a majority of time reaching and assisting clients from within their organizations, the four exemplary sites seemed to do this efficiently and systematically. They built in systems for identifying EBNE, improved coordination and communication within the organization about new strategies and processes for outreach and application assistance, and continually focused on better ways of meeting the needs of their clients and organizational partners. In the end, that these organizations focused on in-reach (more than outreach), resulted in their spending more time developing the capacity of their staff, streamlined processes and developed an organizational awareness and commitment for outreach and application assistance services – work that laid important groundwork for sustaining these programs once funding ended.
� Reaching Traditionally Challenging-to-Reach Populations Although the four most effective organizations are very different from one another, a consistent theme across all was their ability to reach and enroll client populations traditionally defined as hard-to-reach and enroll: Hispanic/Latino, Spanish-speaking, African-American and homeless populations.1 Each organization used different strategies for working with these populations, with two in particular spending a significant amount of time helping clients enroll in public health insurance. Although each organization seemed to have figured out their own approach and style for working with the different populations they serve, what they all seem to share is a consistent presence in the community and a trusted status with their clients.
Taken together, these findings reinforce the strong potential of CBOs in reaching and enrolling children and families in public health insurance. However, it was clear that CBOs in the evaluation were not equally able to provide outreach and enrollment services in an efficient and sustainable way. For example, estimates of average costs for enrolling clients in public health insurance ranged from $117 to $7,862 (typical cost-per-client enrolled about $300); the four organizations with the highest costs were also the only organizations that discontinued outreach and enrollment services once Trust funding ended. Those community-based organizations considered "exemplary" in this evaluation (as
20
EVALUATION Optimizing Outreach and Application Assistance Services in Community-based Organizations
defined by low cost-per-child enrolled and sustaining services six months after funding) shared key things in common:
� They focused primarily on internal strategies targeting their own client populations. This not only allowed them to work with clients with whom they had developed close relationships (within a setting that was familiar), but to deliver these services more efficiently, particularly for those sites already working with low-income populations with sufficient numbers of EBNE.
� They planned and implemented outreach and enrollment services that closely aligned and supported their organizational mission. These new services were viewed as an essential part of the organization and were integrated into existing organizational structures and processes to enhance efficiency and sustainability.
CBOs that struggled the most did not anticipate or adapt well to challenges they faced in finding children, youth and families who were eligible but not enrolled. This included outreach efforts, where less successful CBOs: (1) did not understand how to reach populations eligible for and in need of public health insurance, (2) had not made strong connections with other CBOs that might be serving these populations or (3) became frustrated with early efforts and didn’t persist in their efforts to find better ways to reach EBNE clients. Offering new outreach and application assistance services turned out not to be a good organizational fit; they were not well integrated with other “health” programs offered by the organization (and not well known or understood by the larger organization). In short, outreach and application assistance services were not an organizational priority.
Because of their trusted status, CBOs have tremendous potential to serve an essential and expanded role within the umbrella of enrollment assistance services made likely by the Affordable Care Act. As states and communities consider how best to address the growing demand for public health insurance, a few recommendations seem important and timely. The following recommendations are aimed at a) public and private funders, including foundations and government agencies and b) community-based organizations considering implementing public health insurance outreach and enrollment services.
For Public and Private Funders:1. Increase support for community-based organizations to have a key role in the
Affordable Care Act. As health care reform continues to unfold, communities will be a primary locus of activity. In turn, CBOs can play a major role in supporting the varied needs of newly eligible populations, specifically as it relates to outreach and enrollment. As a previous study notes, newly eligible groups, such as moderate income families and immigrant and mixed citizenship status families previously ineligible for public health insurance will require assistance from a broad spectrum of community partners.19 Hence, the more “points of entry” a community can provide to enroll the newly eligible, the more likely children and families will have access to health insurance.
2. Identify the appropriate role that community-based organizations can play within the continuum of public health insurance outreach, enrollment and benefit utilization. This report’s findings suggest that not all CBOs are well positioned to provide outreach and application assistance services effectively and efficiently. Public and private funders should identify the appropriate role that CBOs, especially those that are new to public health insurance outreach and enrollment, can play and then provide the corresponding training and support. For example, CBOs, while effective in identifying and enrolling EBNE children may be ill-suited in connecting them with health care services.
3. Provide capacity-building support to community-based organizations. Ongoing education, training and support are essential in a CBOs ability to implement an effective outreach and enrollment service. Key areas of support to consider include education on changes in screening and enrollment policies, best practice approaches to collaborating with county agencies and other CBOs, cultural and language competency, better access to information technology and electronic data tracking systems.
RECOMMENDATIONS AND CONCLUSION
21
The Colorado Trust
For Community-based Organizations:1. Ensure organizational “fit.” Organizational “tailoring” of outreach and application assistance
services is essential to ensuring that services “fit” well within the CBO. This “fit” should complement the mission of the organization, the client populations they serve and populations in the community they can potentially reach. Specifically, CBOs may want to conduct a comprehensive needs assessment, carefully considering whether the organization has ready access to “target populations” that include sufficient numbers of EBNE.
2. Ensure appropriate planning and start-up time. CBOs new to providing application assistance services need time to hire and train outreach workers, plan these new services and identify relevant community partners. The vast majority of CBOs in the evaluation averaged two to three months before their services were up and running.
3. At the outset, focus more on in-reach not outreach strategies. External outreach activities should be strategically planned and monitored to ensure that these efforts do not detract from the core work of the organization and the clients it serves. Similar to findings of a previous study,20 many CBOs found that outreach was not an effective method for enrolling new clients; some saw its value more for making connections with other CBOs, raising visibility and marketing the organization more generally.
4. Focus on application assistance. Despite well-intentioned efforts to facilitate the use of health care services, CBOs, in large part did not fulfill this function. However, CBOs succeeded when focused largely on application assistance (i.e., getting EBNE children enrolled in public health insurance).
As these recommendations suggest, maximizing the unique role that CBOs can play in identifying and assisting EBNE populations requires interventions at multiple levels. Funders – be they from philanthropy or government – should pay simultaneous attention to the broader health care reform implementation environment that outreach and enrollment services operate in and the tangible organizational supports needed to facilitate a successful outreach and enrollment program. Likewise, CBOs should pay considerable attention to the organizational conditions and strategies that foster an effective and sustainable outreach and enrollment program. Taken together, addressing these parallel opportunities will help optimize the role of CBOs as trusted hands.
22
EVALUATION Optimizing Outreach and Application Assistance Services in Community-based Organizations
Evaluation Scope and Methods A total of 12 of the 19 funded CBOs participated in this multi-year evaluation (2009-2012), which included a combination of site visits, interviews with outreach workers and administrators, and client-level quantitative information on those assisted, enrolled and who used health insurance during and six months beyond the three-year funding period. The evaluation excluded CBOs with already-established outreach and application assistance services in place (5 CBOs) and those unable to collect and/or provide the evaluation team with client-level information (2 CBOs).
Client-level Information To obtain client-level information, the evaluation team developed a customized client-tracking database, the Client Assistance Tool (CAT), which required all outreach workers to enter information on the instances in which they assisted clients with public health insurance, including enrollment, retention and utilization. These CAT data were then linked to state enrollment and utilization data provided by the Colorado Department of Health Care Policy and Financing at both the application level (households) and client level. As a result, the experience of each applicant – from first contact with a CBO outreach worker through enrollment, utilization, redetermination and beyond – was captured and shared with outreach workers to help them track their enrollment efforts as well as used by the evaluation team to provide quantitative data on assistance, enrollment, utilization and retention to examine program effectiveness.21
Cost of Outreach and Application Assistance Services The evaluation team also collected information on the cost of outreach and application assistance services within the 12 CBOs. Subsequently, a simple approach for collecting and analyzing cost data for the three-year funding period was developed. Using a combination of telephone interviews and a review of grantee financial reports, the evaluation team collected basic information about each grantee’s project costs and resources – including whether they spent more than what they were granted by The Trust and what, if any, other resources (e.g., volunteers, other grant funds) were used to support their outreach and application assistance program. These supplementary data were combined with CAT data and corresponding state enrollment and utilization data to calculate cost per client:
� Assisted
� Enrolled
� Utilizing Medicaid services
Primary calculations were based on how much The Trust ultimately awarded each grantee, with the simplest calculation using the actual funding amount as the basis of the cost-per-client ratio. The funding amounts originally awarded to grantees ranged from a low of $75,300 for three years to a high of $228,000 for three years, with varying funding amounts in between; one CBO was funded a year into the initiative and received $125,000 for two years. However, because most grantees were developing new programs and did not begin assisting clients for several months, evaluators included another estimate based on their funding minus estimated start-up costs (in 2009 only). The start-up, or program development period, is based on the number of program months prior to the first client record entered into the CAT. Then, the cost of start-up was determined by prorating the first-year funding award by month and multiplying it by the number of planning months. For example, if a grantee received $12,000 for the first year and entered their first client record in the CAT in April, their planning period was January to March and their start-up costs were $3,000. While this method for determining start-up costs is simple, sound and consistent across all grantee sites, it is not necessarily representative of actual dollars spent for planning the program.
Sustainability Finally, the evaluation team collected data on the sustainability of outreach and application assistance services within the 12 CBOs. Six months after the three-year Trust grant program ended, the evaluation team conducted interviews with CBO administrators to determine the extent to which they continued to
APPENDIX A
Note: Enrollment and utilization data are only for those clients who could be linked to their state records. It is possible that some clients were enrolled, but the evaluators were unable to link to their records due to missing or erroneously entered identifying data. Enrollment data includes CHP+ and Medicaid enrollees, but utilization data is Medicaid enrollees only.
23
The Colorado Trust
offer services within their organizations, whether they received any additional funding for outreach and application assistance services after their Trust funding ended and how their services had changed post-grant.
Integration of Mixed Methods to Identify Exemplary Community-based Organizations Findings from the cost study and sustainability study were used to identify the most successful CBOs (i.e., "exemplary"), defined as those most able to enroll a substantial number of children and youth in public health insurance at low cost per client and to sustain their outreach and application assistance services after funding ended. Cost and sustainability data were used to identify exemplary sites, and then the evaluation team used extensive data from site visits, interviews, check-in calls and evaluation team summary documents to conduct an in-depth qualitative analysis. Through analysis of the most successful sites, a set of characteristics of CBOs (not determined a priori) and their client populations were identified that potentially help explain their high performance; features were then examined in a third step of analysis, applying a constant comparative method22,23 to the less successful sites for confirming or disconfirming findings and further hypothesis generation. Finally, verification and comparative methods were used throughout the analysis to enhance the credibility of findings.
Figures Figure 1: Grantee Client Race/Ethnicity
Figure 2: Colorado 2011 Medicaid/CHP+ Enrollee Race/Ethnicity
Figure 3: Denver County 2011 Medicaid/CHP+ Enrollee Race/Ethnicity
Figure 4: Average Assistance Time to Complete an Application
Figure 5: Percent of Households Receiving Post-submission Assistance
Figure 6: Initial Application Status
Figure 7: Enrollment Rate
Figure 8: Initial Insurance Type
Figure 9: Number of Clients Enrolled in Medicaid or CHP+ (Post-assistance)
Figure 10: Number of Clients Enrolled in Medicaid or CHP+ thru July ’12 (Post-assistance)
Figure 11: Medicaid Benefit Utilization Rate
Figure 12: Churn Rate
TablesTable 1: Evaluation Sites
Table 2: Outreach Worker Time and Effort Metrics
Table 3: Average Cost-Per-Client by Grantee
Table 4: Grantee Program Sustainability
1 Teare, CA. Trusted Voice: Leveraging the Local Experience of Community-Based Organizations in Implementing the Affordable Care Act. California Coverage of Health Initiatives; April 2011.
2 Colorado Health Institute. Colorado Children’s Health Insurance Status: 2013 Update. March 2013.
3 InsureKidsNow.gov page. http://www.insurekidsnow.gov/qa/index.html#Health_Insurance_Important. Accessed on January 25, 2013.
4 U.S. Government Accountability Office. Children’s Health Insurance: Opportunities Exist for Improved Access to Affordable Insurance. June 2012.
5 Courtot B, Klein A, Howell E, Benatar S. Performing Outreach with Limited Resources: CKF Grantees’ Successes and Challenges over Three Years. Mathematica Policy Research, Inc., The Urban Institute, Health Management Associates; September 2009.
LIST OF FIGURES AND TABLES
ENDNOTES

Endnotes, continued6 Dorn S, Hill I, Hogan S. The Secrets of Massachusetts’ Success: Why 97 Percent of State Residents Have Health Coverage. State Health
Access Reform Evaluation (SHARE)/Robert Wood Johnson Foundation; November 2009.
7 Madala D. Bridging the Enrollment Gap: The Importance of Providing In-Person Assistance. Enroll America Best Practices Institute; August 2012.
8 Williams SR, Rosenbach ML. Evolution of state outreach efforts under SCHIP. Health Care Financ Rev. Summer 2007;28(4):95-107.
9 Chung P, Cavender T, Main D. Trusted Hands: The Role of Community-Based Organizations in Enrolling Children in Public Health Insurance Programs. The Colorado Trust; February 2010.
10 USC Division of Community Health. Reaching Out and Reaching In: Understanding Efforts to Identify and Enroll Uninsured Children into Health Insurance Programs. Covering California’s Kids, The California Endowment; January 2006.
11 Courtot B, Klein A, Howell E, Benatar S. Performing Outreach with Limited Resources: CKF Grantees’ Successes and Challenges over Three Years. Mathematica Policy Research, Inc., The Urban Institute, Health Management Associates; September 2009.
12 Moody S, Arenales S. A Case Management Approach to Medicaid and CHP+ Enrollment: Recommendations for Colorado’s Investment in Medicaid and CHP+ Outreach. Covering Kids and Families; August 2008.
13 Hudson JL, Welden TM. Children’s eligibility and coverage: recent trends and a look ahead. Health Affairs. September 2007;26(5):618-629.
14 World Health Organization, Commission on Social Determinants of Health. Closing the gap in a generation: Health equity through action on the social determinants of health. Final report of the Commission on Social Determinants of Health; 2008.
15 Summer L, Mann C. Instability Of Public Health Insurance Coverage For Children And Families: Causes, Consequences, And Remedies. The Commonwealth Fund, publication no. 935; 2006.
16 Trenholm C, Harrington M, Snyder A, Weiss A. Using Data to Drive State Improvement in Enrollment and Retention Performance. Maximizing Enrollment, Robert Wood Johnson Foundation; November 2011.
17 Fairbrother G, Dutton MJ, Bachrach D, Newell K, Boozang P, Cooper R. Costs of enrolling children in Medicaid and SCHIP. Health Affairs. January 2004;23(1):237-243.
18 Colorado Covering Kids and Families. Colorado’s Maze to Enrollment in Medicaid and CHP+: Progress Made and Opportunities for Improvement. June 2012.
19 The Kaiser Commission on Medicaid and the Uninsured. Key Issues to Consider for Outreach and Enrollment Efforts under Health Reform. The Henry J. Kaiser Family Foundation; February 2012.
20 Velonis A, Main D. The Effectiveness of Boosting Public Health Insurance Enrollment Through Community Events. The Colorado Trust; November 2010.
21 Waltz J, Fedde K, Main D. Closing the Gap: How Improving Information Flow Can Help Community-Based Organizations Keep Uninsured Kids from Falling Through the Cracks. The Colorado Trust; January 2012.
22 Glaser BG, Strauss A. The Discovery of Grounded Theory: Strategies for Qualitative Research. Chicago, IL: Aldine Publishing Co; 1967.
23 Lincoln YS, Guba EG. Naturalistic Inquiry. Thousand Oaks, CA: Sage Publications; 1985.
“The Colorado Trust” is registered as a trademark in the U.S. Patent and Trademark Office. Copyright May 2013. The Colorado Trust. All rights reserved. The Colorado Trust is pleased to have organizations or individuals share its materials with others. To request permission to excerpt from this publication, either in print or electronically, please contact Christie McElhinney, Vice President of Communications & Public Affairs, [email protected].
PHONE 303-837-1200 TOLL FREE 888-847-9140 FAX 303-839-9034
1600 SHERMAN STREET DENVER, CO 80203-1604
WWW.COLORADOTRUST.ORG