Optimizing Nitrogen Fertilizer Through Use of Optical Sensors
25
Optimizing Nitrogen Fertilizer Through Use of Optical Sensors Brian Arnall Oklahoma State University [email protected]
-
Upload
mackenzie-payne -
Category
Documents
-
view
39 -
download
2
description
Optimizing Nitrogen Fertilizer Through Use of Optical Sensors. Brian Arnall Oklahoma State University [email protected]. Why Change. Notill = More Organic Matter Organic Matter is a Major Driver of N Cycle New crops, new rooting structure Higher Yields?. - PowerPoint PPT Presentation
Transcript of Optimizing Nitrogen Fertilizer Through Use of Optical Sensors

Optimizing Nitrogen Fertilizer Through Use of Optical
Sensors
Brian ArnallOklahoma State University

Why Change
• Notill = More Organic Matter• Organic Matter is a Major Driver of N Cycle• New crops, new rooting structure• Higher Yields?

Sensor Based Nitrogen Rate Calculator?What is needed for a
Yield Prediction ModelResponse IndexNitrogen Removal
The calculation looks like:N Rate = {(Potential Yield Farmer Practice * RI)- YPFP}* N in Grain/NUE
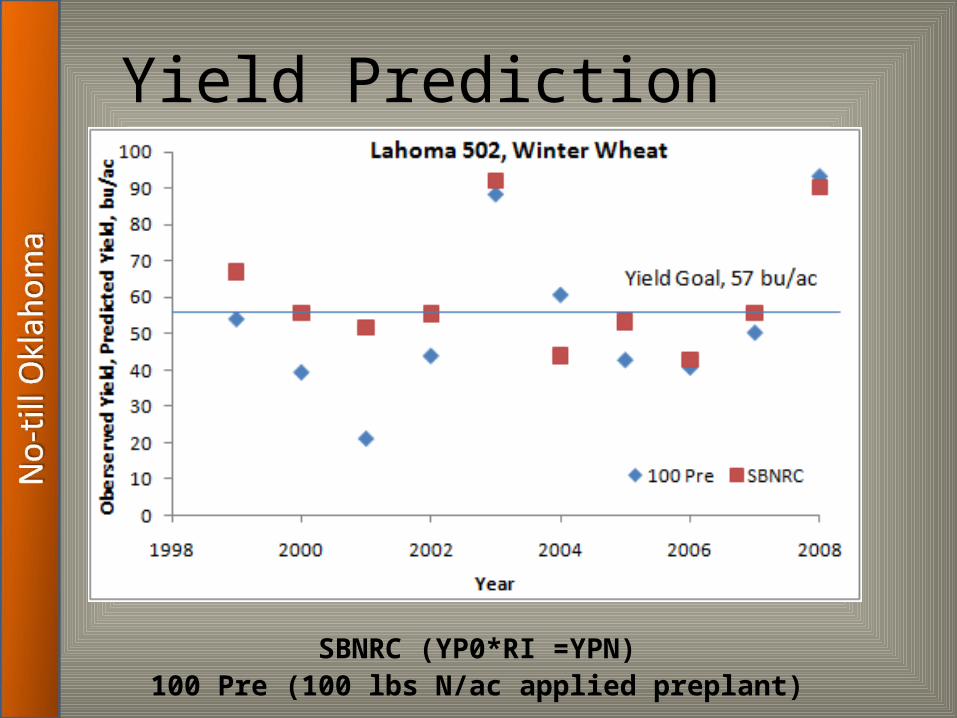
SBNRC (YP0*RI =YPN)100 Pre (100 lbs N/ac applied preplant)
Yield Prediction
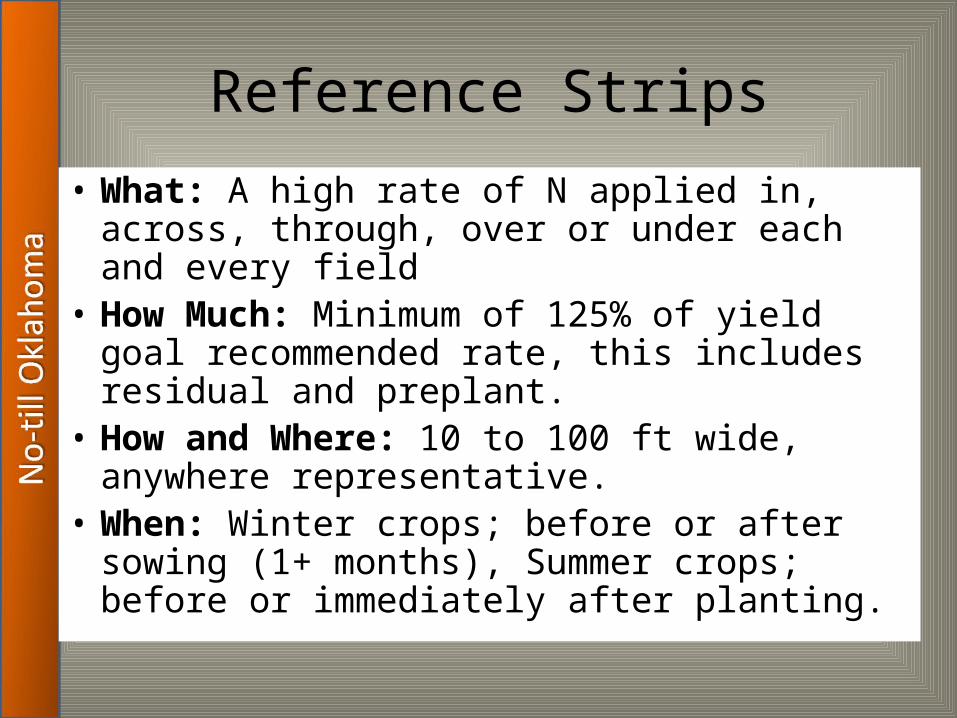
Reference Strips
• What: A high rate of N applied in, across, through, over or under each and every field
• How Much: Minimum of 125% of yield goal recommended rate, this includes residual and preplant.
• How and Where: 10 to 100 ft wide, anywhere representative.
• When: Winter crops; before or after sowing (1+ months), Summer crops; before or immediately after planting.

Reference Strips
•Are Very Visual..•BMP?•Risk Aversion?•Sales and Service?

Optical Sensors
• Numerical describe the crops BIOMASS.• DOES NOT really WORK WITH OUT A
REFERENCE..........• Multiple options
– Companies – Resolution

Optical Sensors

Sensors and No-till
• There is no cookie cutter recipe• No Text Book• Learn from others Mistakes• Adopt to your farm, soil, machinery,
management and mindset. • Do not go 100% the first year, but put out
100% of the strips. • Art
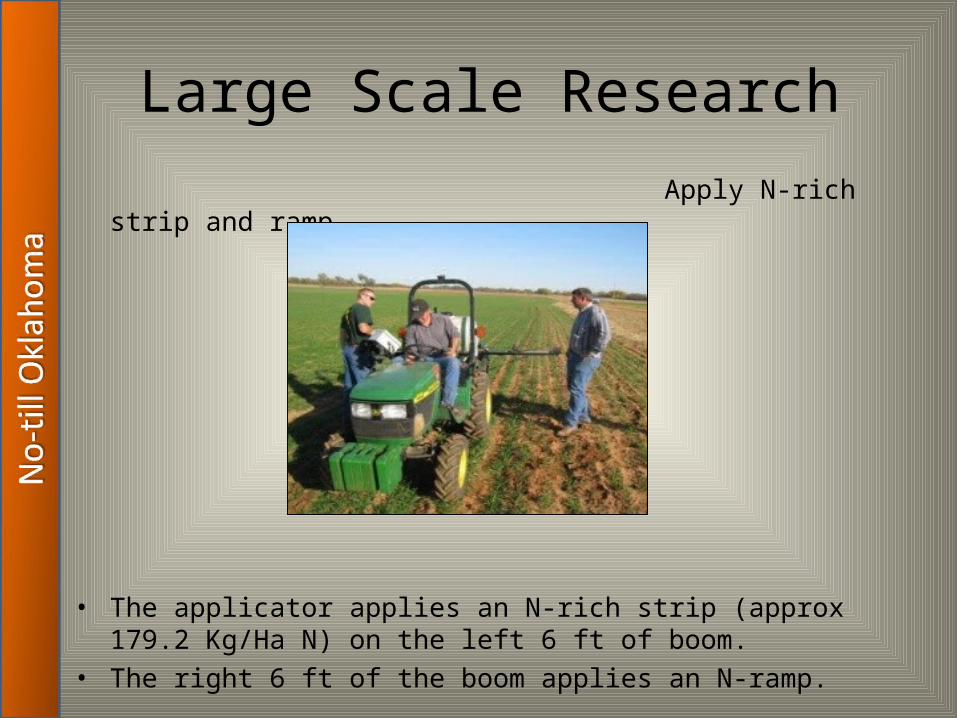
Large Scale Research Apply N-rich strip and ramp
• The applicator applies an N-rich strip (approx 179.2 Kg/Ha N) on the left 6 ft of boom.
• The right 6 ft of the boom applies an N-ramp.

Sensing
• Sense the strips prior to hollow stem

Applying top-dress

Harvest

Results
LeonardOttawa Comin-till Corn
0
3948
0102030405060
Lbs N
/ac
Leonard
Check
Farmer Practice
SBNRC
18 24 26
010203040506070
Bu/a
c
Leonard
Check
Farmer Practice
SBNRC
FP= $98.18SBNRC= $106.11Difference= $7.93
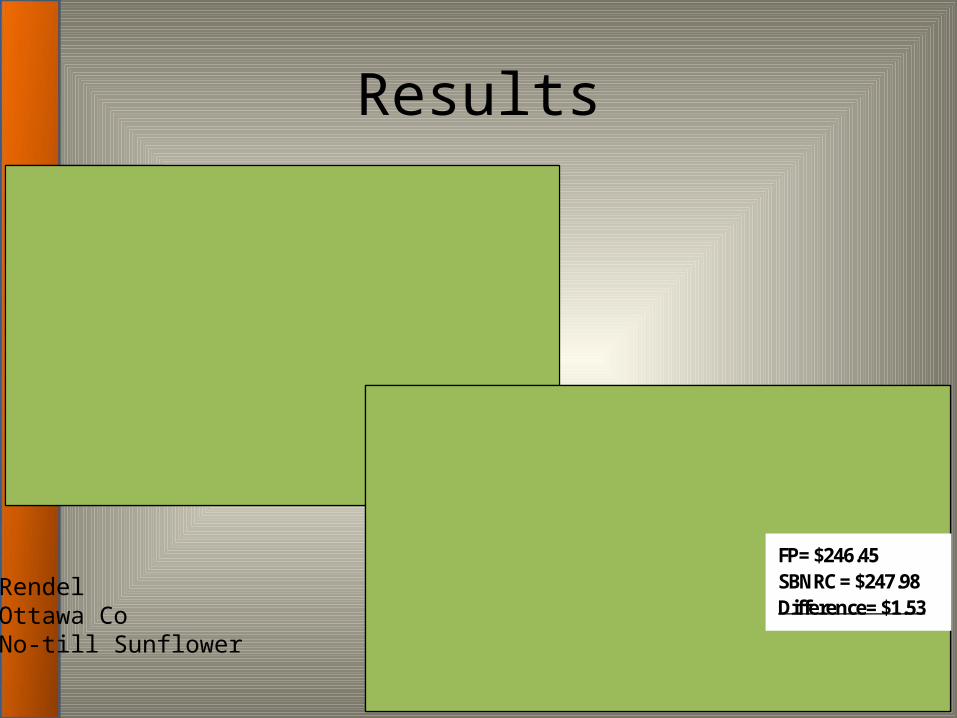
Results
RendelOttawa CoNo-till Sunflower
0
36
49
010
203040
5060
Lbs N
/ac
Rendel
Check
Farmer Practice
SBNRC
38
53 55
010203040506070
Bu/a
c
Rendel
Check
Farmer Practice
SBNRC
FP= $246.45SBNRC = $247.98Difference= $1.53

Results
0
84
39
0
20
40
60
80
100
Lbs N
/ac
Johnson
Check
Farmer Practice
SBNRC
19
3933
010203040506070
Bu/a
c
Johnson
Check
Farmer Practice
SBNRC
FP= $155.42SBNRC = $146.54Difference= $8.88
JohnsonOttawa CoNo-till SoybeanSown Nov.

Results
0
60
24
0102030405060
Lbs N
/ac
Red Barn
Check
Farmer Practice
SBNRC
4352
44
0
10
20
30
40
50
60
70Bu
/ac
Red Barn
Check
Farmer Practice
SBNRC
FP= $229.96SBNRC = $209.99Difference= $20.03
Red BarnBarber Co. KsCont Wheat

Results
0
60
70
102030405060
Lbs/
ac
Linley
Check
Farmer Practice
SBNRC
59 59 61
0
10
20
30
40
50
60
70Bu
/ac
Linley
Check
Farmer Practice
SBNRC
FP= $263.90SBNRC = $300.27Difference= $36.37
LinleyBarber Co. KsCont Wheat

Results
0
60
38
0
10
20
30
40
50
60
Lbs N
/ac
Sipel
Check
Farmer Practice
SBNRC
55
6662
0
10
20
30
40
50
60
70Bu
/ac
Sipel
Check
Farmer Practice
SBNRC
FP= $302.51SBNRC = $289.86Difference= $12.65
SipelBarber Co. KsCont Wheat

Results
0
33
59
0102030405060
Lbs N
/ac
Mach
Check
Farmer Practice
SBNRC
2429
37
010203040506070
Bu/A
c
Mach
Check
Farmer Practice
SBNRC
FP= $129.9SBNRC = $155.15Difference= $25.25
MachCanadian CoCont Wheat

Results
0
28
59
010
203040
5060
Lbs N
/ac
Bornemann
Check
Farmer Practice
SBNRC
31
4248
010203040506070
Bu/a
c
Bornemann
Check
Farmer Practice
SBNRC
FP= $202.83SBNRC = $208.21Difference= $5.38
BornemannCanadian CoCont Wheat

ResultsCheck Farmer Practice SBNRC
SiteLbs of
topdressBushel/
AcProfit/
AcLbs of
topdressBushel/
AcProfit/
AcLbs of
topdressBushel/
AcProfit/
Ac
Leonard 1 0 18 91.05 39 24 98.18 48 26 106.11
Rendel 2 0 38 191.03 36 53 246.45 49 55 247.98
Johnson 3 0 19 94.38 84 39 155.43 39 33 146.54
Red Barn 4 0 43 214.93 60 52 229.96 24 44 209.99
Linely 5 0 59 293.77 60 59 263.90 7 61 300.27
Sipel 6 0 55 276.14 60 66 302.51 38 62 289.86
Mach 7 0 24 118.33 33 29 129.90 59 37 155.15
Borne 8 0 31 152.99 28 42 196.29 59 48 209.78
Averages 36 179.08 50 46 202.83 40 46 208.21
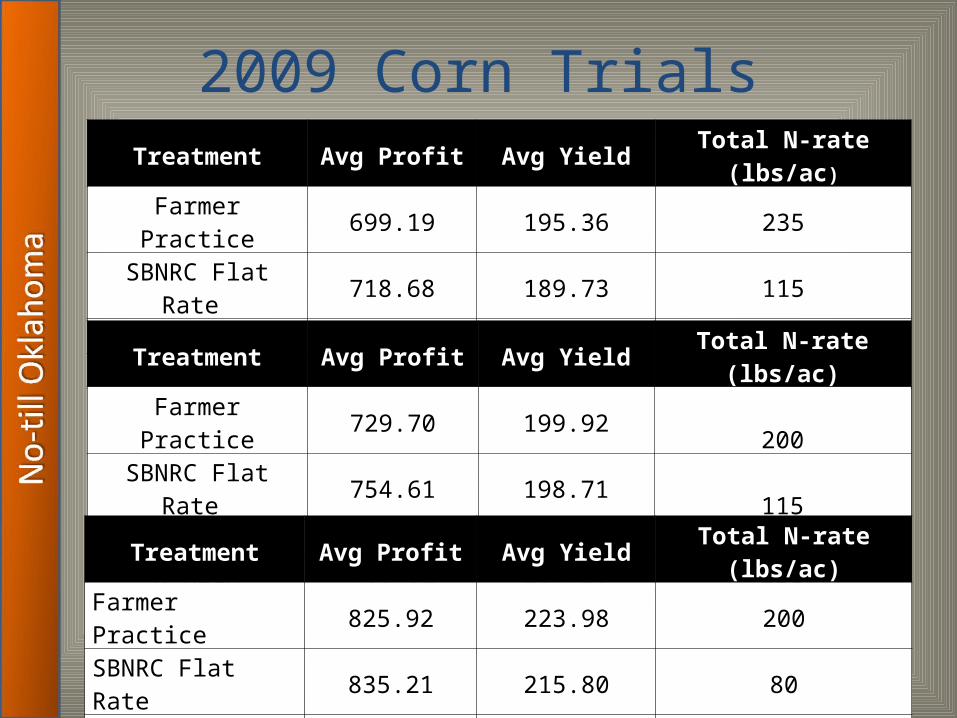
Treatment Avg Profit Avg Yield Total N-rate (lbs/ac)
Farmer Practice 699.19 195.36 235SBNRC Flat Rate 718.68 189.73 115
RT-200 VRT 731.59 190.14 82.7N-Rich 688.53 208.88 420
Treatment Avg Profit Avg Yield Total N-rate (lbs/ac)Farmer Practice 729.70 199.92 200SBNRC Flat Rate 754.61 198.71 115
RT-200 VRT 769.43 201.13 100.4N-Rich 706.52 207.26 350
Treatment Avg Profit Avg Yield Total N-rate (lbs/ac)
Farmer Practice 825.92 223.98 200
SBNRC Flat Rate 835.21 215.80 80
RT-200 VRT 785.40 201.62 60.2
N-Rich 777.23 224.93 350
2009 Corn Trials

Sensor Based N Fertilizer Recommendation Summary 2006-2008
Location Year Sensor Yield Actual Yield Soil Test Rec. Sensor Rec. Actual N Resp. Soil Diff. Sensor Diff.Belleville 2006 95 96 40 0 0 40 0Manhattan 2006 160 155 60 33 33 27 0Partridge 2006 48 32 42 57 55 -13 2Tribune 2006 130 128 30 24 15 15 9Manhattan 2007 111 109 130 98 105 25 -7Partridge 2007 77 70 40 15 20 20 -5Tribune 2007 71 79 54 0 0 54 0Manhattan 2008 151 128 77 45 45 32 0Ottawa 2008 58 64 56 55 60 -4 -5Partridge 2008 140 123 41 30 15 26 15Average 104.1 98.4 57 35.7 34.8 22.2 0.9