Optimizing insulation-thermal mass wall layer distribution ...
8
HAL Id: hal-00905291 https://hal-mines-paristech.archives-ouvertes.fr/hal-00905291 Submitted on 18 Nov 2013 HAL is a multi-disciplinary open access archive for the deposit and dissemination of sci- entific research documents, whether they are pub- lished or not. The documents may come from teaching and research institutions in France or abroad, or from public or private research centers. L’archive ouverte pluridisciplinaire HAL, est destinée au dépôt et à la diffusion de documents scientifiques de niveau recherche, publiés ou non, émanant des établissements d’enseignement et de recherche français ou étrangers, des laboratoires publics ou privés. Optimizing insulation-thermal mass wall layer distribution from maximum time lag and minimum decrement factor point of view Mohamad Ibrahim, Patrick Achard, Etienne Wurtz, Pascal Henry Biwole To cite this version: Mohamad Ibrahim, Patrick Achard, Etienne Wurtz, Pascal Henry Biwole. Optimizing insulation- thermal mass wall layer distribution from maximum time lag and minimum decrement factor point of view. 13th Conference of the International Building Performance Simulation Association, Aug 2013, Chambery, France. pp.870-876. hal-00905291
Transcript of Optimizing insulation-thermal mass wall layer distribution ...
HAL Id: hal-00905291https://hal-mines-paristech.archives-ouvertes.fr/hal-00905291
Submitted on 18 Nov 2013
HAL is a multi-disciplinary open accessarchive for the deposit and dissemination of sci-entific research documents, whether they are pub-lished or not. The documents may come fromteaching and research institutions in France orabroad, or from public or private research centers.
L’archive ouverte pluridisciplinaire HAL, estdestinée au dépôt et à la diffusion de documentsscientifiques de niveau recherche, publiés ou non,émanant des établissements d’enseignement et derecherche français ou étrangers, des laboratoirespublics ou privés.
Optimizing insulation-thermal mass wall layerdistribution from maximum time lag and minimum
decrement factor point of viewMohamad Ibrahim, Patrick Achard, Etienne Wurtz, Pascal Henry Biwole
To cite this version:Mohamad Ibrahim, Patrick Achard, Etienne Wurtz, Pascal Henry Biwole. Optimizing insulation-thermal mass wall layer distribution from maximum time lag and minimum decrement factor point ofview. 13th Conference of the International Building Performance Simulation Association, Aug 2013,Chambery, France. pp.870-876. �hal-00905291�
OPTIMIZING INSULATION-THERMAL MASS WALL LAYER DISTRIBUTION FROM MAXIMUM TIME LAG AND MINIMUM DECREMENT FACTOR POINT OF VIEW
Mohamad Ibrahim1, Patrick Achard1, Etienne Wurtz2, Pascal Henry Biwole3
1 MINES ParisTech, PERSEE - Centre Procédés, Energies Renouvelables et Systèmes Energétiques, CNRS FRE 2861, BP 207, 1 rue Claude Daunesse 06904 Sophia Antipolis Cedex, France
2 CEA-INES, LEB - Building Energy Lab, 50 av. du Lac L´eman, 73377 Le Bourget du Lac, France 3 Department of Mathematics and Interactions, University of Nice Sophia-Antipolis, Nice, France
ABSTRACT Different wall construction configurations lead to different wall thermal behaviour which affects energy consumption and thermal comfort of the room. In this study, the thermal time constant, the time lag, and the decrement factor are calculated for different wall configurations in order to investigate the best insulation/thermal mass layer distribution in external walls. First, this is done for just a wall by developing a numerical model to solve the one dimensional heat transfer equation in a multilayered wall subjected to convective boundary conditions. Second, this is done for a full-scale house using the whole building energy simulation program EnergyPlus. Also, the performance of traditional insulation is compared to that of a newly developed insulating coating, based on super-insulating silica aerogels, from maximum time lag and minimum decrement factor point of view. Results showed that placing a layer of insulation at the middle of the wall and another one at the outer wall surface or using a five layered wall: 1- three layers of insulation placed at the inside, middle, and outside and 2- three layers of thermal mass separated by two layers of insulation are the best configurations. Also, the insulating coating showed a better performance with an increase in time lag of about 1 hour and decrease in decrement factor of about 5%.
INTRODUCTION In France, the building sector accounts for about 43% of the total energy use and 25% of carbon dioxide emissions[1]. France has already adopted the objective of reducing its energy consumption and greenhouse gas emissions by a factor of four to five by the year 2050 as a part of its national strategy for sustainable development, introduced in June 2003, and it’s Climate Plan, introduced in July 2004. The new thermal regulations (RT 2012) limits the primary energy consumption for new buildings to 50 kWh/m2 per year (this includes heating, cooling, lighting, water heating, and ventilation), and also requires a better thermal comfort through limiting overheating
during summer season; thus, it is crucial to find solutions to reduce energy consumption and enhance thermal comfort. Super-insulating materials, such as silica aerogels and vacuum insulation are one of the promising techniques to be used in building envelopes to obtain the desired objectives.
Energy consumption reduction is not our only concern. Occupants’ thermal comfort is also a major issue to be considered and optimized. Thermal insulation decreases the heating load in winter; however, it may lead to overheating in the summer period. Also, the position and distribution of thermal insulation will affect the dynamic thermal performance of the building’s envelope and interior environment. Thermal inertia of the building has a great influence on the indoor environment. A massive layer near the inside space can absorb the day heat energy and release it in a later time of the day. This energy absorption dampens the daily outside temperature fluctuations and decreases the peak load of the space. Insulation, due to its low thermal capacitance, responds rapidly to any change of the outside driving forces making it a good solution for short periods and intermittent air-conditioning. These phenomena are related to important parameters: thermal time constant, time lag, and decrement factor. The time required for heat wave to propagate through a wall from the outside to the inside is defined as the time lag. The decreasing ratio of its amplitude during this process is called the decrement factor.
Tsilingiris [2] developed a numerical simulation model to estimate the thermal time constant for several wall structures. It was shown that as thickness of the massive layers increase the thermal time constant increases. For the same thickness of concrete layers, as the insulation layer is moved from outer wall surface to the inner one, the time constant decreases. Asan [3-5] estimated the time lags and decrement factor for different building materials by solving the one-dimensional heat transfer equation numerically using Crank-Nickolson scheme, and
2
imposing a periodic boundary condition at the outside environment. Three groups of materials were used. The first has low thermal conductivity and low heat capacity, the second has high thermal conductivity and high thermal mass, and the third has moderate thermal conductivity and high thermal capacity. Kontoleon et. al. [6] investigated the influence of wall orientation and solar absorptivity on time lag and decrement factor for the cooling season in Greece for several insulated wall configurations. Kaska and Yumrutas [7, 8] calculated time lag and decrement factor values for eight types of walls and two types of flat roofs using an experimental set up. Ulgen [9] investigated the effects of a wall’s thermo-physical properties on time lag and decrement factor both experimentally and theoretically. Sun et al. [10] scrutinized experimentally and numerically how these two parameters are influenced by the outside temperature.
Within the Parex.it project, an innovative insulating coating based on super-insulating materials silica aerogels has been developed (Fig. 1) possessing a very low thermal conductivity relative to other available coatings. Its thermal conductivity, density, and specific heat are 0.035 W/(m.K), 300 J/(kg.K), and 1100 kg/m3, respectively.
Adding this coating to the building facades will decrease the energy load of the space; also, it will change the thermal behavior of the whole structure. A first objective of this study is to know the best wall configuration of thermal resistive and capacitive layers through determining the thermal time constant, the time lag, and the decrement factor (all these terms are defined in the next section). All these configurations have the same total R-value; however, the outside to inside layers of the wall are different. The best configuration is the one that ensures a minimum decrement factor and maximum time lag. A second objective is to compare the performance of traditional insulation with that of Parex.it coating from maximum time lag and minimum decrement factor point of view.
WALL THERMAL TIME CONSTANT, TIME LAG, AND DECREMENT FACTOR
Thermal Time Constant
Thermal time constant is derived from its notion in physics. It is the time taken by an output response signal to reach 63% of its steady state value due to a step change in the input signal.
Consider a wall separating the indoor and outdoor environments. If the outdoor and indoor air temperatures are kept constant, the system will reach a steady state where the temperatures through the wall will change no more. Any step temperature change of the outside air temperature causes a transient change in the wall temperatures till reaching new steady state values.
Owing to a step change in the outdoor air temperature, the developed transient inside wall surface temperature decreases or increases exponentially till reaching steady state, this can be expressed in equation (1),
𝑇(L, t) = 𝑇𝑠𝑠 + (𝑇(𝐿, 0) − 𝑇𝑠𝑠)𝑒−𝑡/𝜏 , if 𝑇(L, t) is decreasing with time (1-a)
𝑇(L, t) = 𝑇𝑠𝑠 − (𝑇𝑠𝑠 − 𝑇(𝐿, 0))𝑒−𝑡/𝜏 , if 𝑇(L, t) is increasing with time (1-b)
where 𝑇(𝐿, 𝑡), 𝑇(𝐿, 0),𝑇𝑠𝑠 , 𝑡 𝑎𝑛𝑑 𝜏 are the inner wall surface temperature at any time t, the initial inner wall surface temperature at time to, the steady state value, time, and the time constant respectively.
For t = 𝜏, we have:
𝑇(𝐿, 𝜏) = 𝑇𝑠𝑠 + (𝑇(𝐿, 0) − 𝑇𝑠𝑠)𝑒−1 , if 𝑇(𝐿, 𝜏) is decreasing with time (2-a)
𝑇(𝐿, 𝜏) = 𝑇𝑠𝑠 − (𝑇𝑠𝑠 − 𝑇(𝐿, 0))𝑒−1 , if 𝑇(𝐿, 𝜏) is increasing with time (2-b)
When the solution of T is obtained, we can find the time constant using equation (2).
Time lag and decrement factor
As illustrated in Figure 2, time lag is the time it takes for the heat wave to propagate from the outer surface to the inner surface of the wall and the decrement factor is the decreasing ratio of its amplitude. These are calculated as follows:
time lag ,∅ = 𝑡𝑖𝑛 ,𝑚𝑎𝑥 − 𝑡𝑜𝑢𝑡 ,𝑚𝑎𝑥 (3)
Fig. 1: The innovative insulating coating

3
𝑑𝑒𝑐 𝑓𝑎𝑐𝑡𝑜𝑟, 𝑓 = 𝐴1𝐴2
= 𝑇𝑖𝑛 ,𝑚𝑎𝑥 − 𝑇𝑖𝑛 ,𝑚𝑖𝑛𝑇𝑜𝑢𝑡 ,𝑚𝑎𝑥 − 𝑇𝑜𝑢𝑡 ,𝑚𝑖𝑛 (4)
where tin,max and tout,max represent the time in hours when inside and outside surface temperatures are at their maximums, respectively; Tin,max ,Tin,min ,Tout,maxand Tout,min are the maximum and minimum inner wall surface temperatures and maximum and minimum outer wall surface temperatures, respectively.
Fig. 2: Time lag and decrement factor
METHODOLOGY First the time constant, time lag, and decrement factor will be calculated for just a wall using a wall model developed in MATLAB® [11] and second these will be calculated for a house using EnergyPlus [12], a whole building energy simulation program.
Study on a Wall The transient one-dimensional heat conduction equation in a multilayered wall consisting of N parallel layers (Fig. 3) is given by equation (5):
𝜌𝑖𝑐𝑖𝜕𝑇𝑖(𝑡, 𝑥)
𝜕𝑡 = 𝑘𝑖𝜕2𝑇𝑖(𝑡, 𝑥)
𝜕𝑥2 (5)
where: i represents the ith layer within the wall, t and x are the time and spacial coordinates, 𝑇𝑖 is the temperature, k, 𝜌, and c are the thermal conductivity, density, and thermal capacity respectively.
Fig. 3: Discretised multi-layer wall
The boundary conditions at the outdoor and indoor surfaces of wall are:
ℎ𝑐∞ [𝑇∞(t) − 𝑇(0, 𝑡)] = −𝑘 𝜕𝑇(0, 𝑡)𝜕𝑥 (6)
ℎ𝑐𝑎 [𝑇(𝐿, 𝑡) − 𝑇𝑎(t)] = −𝑘 𝜕𝑇(𝐿, 𝑡)𝜕𝑥 (7)
where ℎ𝑐∞ 𝑎𝑛𝑑 ℎ𝑐𝑎 are the convective heat transfer coefficients at the outdoor surface and the indoor surface of wall, respectively.
𝑇∞(𝑡),𝑇(0, 𝑡),𝑇𝑎(𝑡) , 𝑎𝑛𝑑 𝑇(𝐿, 𝑡) are the ambient air, outside wall surface temperature, room air, and inner wall surface temperature respectively.
The outside air temperature is assumed to vary as a sinusoidal function during a 24-h period and is calculated using equation (8):
T∞ = T∞ ,max − T∞ ,min2 sin(2πt
P − π2)
+ T∞ ,max + T∞ ,min2 (8)
where P is the period, 𝑇∞ ,𝑚𝑎𝑥 and 𝑇∞ ,𝑚𝑖𝑛 are the maximum and minimum outdoor air temperatures, respectively.
Numerical Solution: The solution of the one-dimensional heat conduction equation (5) is derived numerically using the implicit finite volume method. The code is developed using MATLAB®. The composite wall of M layers is discretized into a number of nodes. The result is a set of linear algebraic equations which can be written in a matrix form,
𝐴 ∗ 𝑇 = 𝑏 (9)
where A is a tri-diagonal highly sparse matrix.
The matrix function “ \ ” (mldivide) in MATLAB® is used to solve the above equation. A time step of 1 min is considered. Starting from an arbitrary chosen initial values for the wall temperatures, the daily cycle of the outside environmental conditions is repeated on several consecutive days until a steady periodic solution is obtained during which quasi steady-state solutions are developed.
Study on a whole Building Time lag and decrement factor are now calculated for a full-scale house using the whole building energy simulation program EnergyPlus. Figure 4 shows the geometry of the house which represents a typical French house. The south wall has the largest glazing area of 32% of the total opaque area; the west, east

4
and north glazed areas are 13%, 4.5%, and 3% respectively.
Fig. 4: Full-scale house case study
WALL CONFIGURATIONS Table 1 shows the 8 different wall configurations being studied. All the wall structures considered in this study have the same total R-value; so, what changes are the number and thickness of insulation and thermal mass layers as well as the position of insulation within the wall. For example, in case 1, we have 5 cm thermal insulation placed at the outer wall surface; however, in case 2, it is placed at the inner side. Case 3 has 2 insulation layers one at the outside and one at the inside; for the total R-value to be kept constant, each of these insulation layers has thickness of 2.5cm.
Table 1: Wall layer configurations
case outside layer layer 2 layer 3 layer 4 layer 5
1 insulation mass 2 mass insulation
3 insulation mass insulation 4 mass insulation mass
5 insulation mass insulation mass 6 mass insulation mass insulation
7 insulation mass insulation mass insulation 8 mass insulation mass insulation mass
RESULTS
Wall Model
The wall being studied consists of thermal resistive and capacitive layers. The resistive layer could be traditional insulation or Parex.it coating and the capacitive layer is concrete. Table 2 shows the characteristics of these materials.
Table 2: Thermal characteristics of the different materials used insulation concrete Coating
Thermal conductivity (W/m.K)
0.044 2 0.035
Density (kg/m3) 12 2000 300 Specific heat (J/kg K) 840 1000 1100
To calculate the wall thermal time constant, the indoor air temperature is kept constant at 20°C; however, the outdoor air temperature undergoes a step change in temperature. This gives rise to a transient behavior of the inner wall surface temperature until reaching steady state. Plotting this latter would allow us to determine the time constant.
Figure 5 shows the time constant for the different wall structures. We find that the best configuration that results in maximum wall thermal time constant is the one having two insulation layers placed at the inner and outer wall surfaces, followed by the case where three insulation layers are placed one at the inner surface, one at the outer surface, and one at the middle of the wall separated by two capacitive layers. The worst among all is the one where insulation is placed as one layer at the inside surface of the wall.
Comparing case 1 (outside insulation – thermal mass) with case 2 (thermal mass – inside insulation), we see that placing a massive layer near the indoor environment leads to larger time constant; 19.55 for case 1 while 9.33 for case 2. This illustrates the effect of heat storage near the indoors which delays the outside heat wave to propagate towards the inside space.
Fig. 5: Time Constant for the different wall configurations
Figure 6 shows the variation of the inside wall surface temperature for the different cases after the outside air temperature undergoes a step change from 10°C to 0°C.
0
10
20
30
40
time
cons
tant
(h)
Time Constant for the different wall configurations
R = Insulation C = Thermal mass
R = Insulation
C = ThermalMass

5
Fig. 6: inside wall surface temperature for the different cases
Now, instead of using the traditional insulation, we will use Parex.it coating. Figure 6 compares the time constant for the different wall configurations when using traditional thermal insulation with that when using Parex.it coating. Note that for the wall R-value to be kept constant, the thickness of Parex.it coating is altered so the thermal resistance of the insulation will be equal to that of the coating; thus, instead of 5 cm insulation, we use 5.68 cm coating.
The results of figure 7 show that Parex.it coating performs better for all the cases with an increase in the time constant of about 1.5 hours. This is due to the higher thermal capacitance found in the coating.
Fig. 7: Comparison of the Time Constant for traditional Insulation and Parex.it Coating
To calculate the time lag ∅ and decrement factor f, the outside air temperature is allowed to vary as a sinusoidal function throughout the day using equation (8), where 𝑇∞,𝑚𝑎𝑥 , 𝑇∞,𝑚𝑖𝑛 , and 𝑃 are taken as 10,
0, and 24 respectively. The indoor air temperature is kept constant at 20°C. Figure 8 shows a plot of ∅ and f for the different wall configuration cases when using traditional insulation.
Fig. 8: Time lag and decrement factor for the different wall configuration cases
The best wall structure is the one that has maximum time lag and minimum decrement factor. Of all, cases 5 and 7 (RCRCR) give this result. So placing three insulation layers, one at the inside surface, one at the outside surface, and one at the middle or placing two insulation layers one at the outer surface and one at the middle has the best performance. Case 8 (CRCRC) also gives a very good performance. The worst of all is the case where insulation is placed at the inner wall surface.
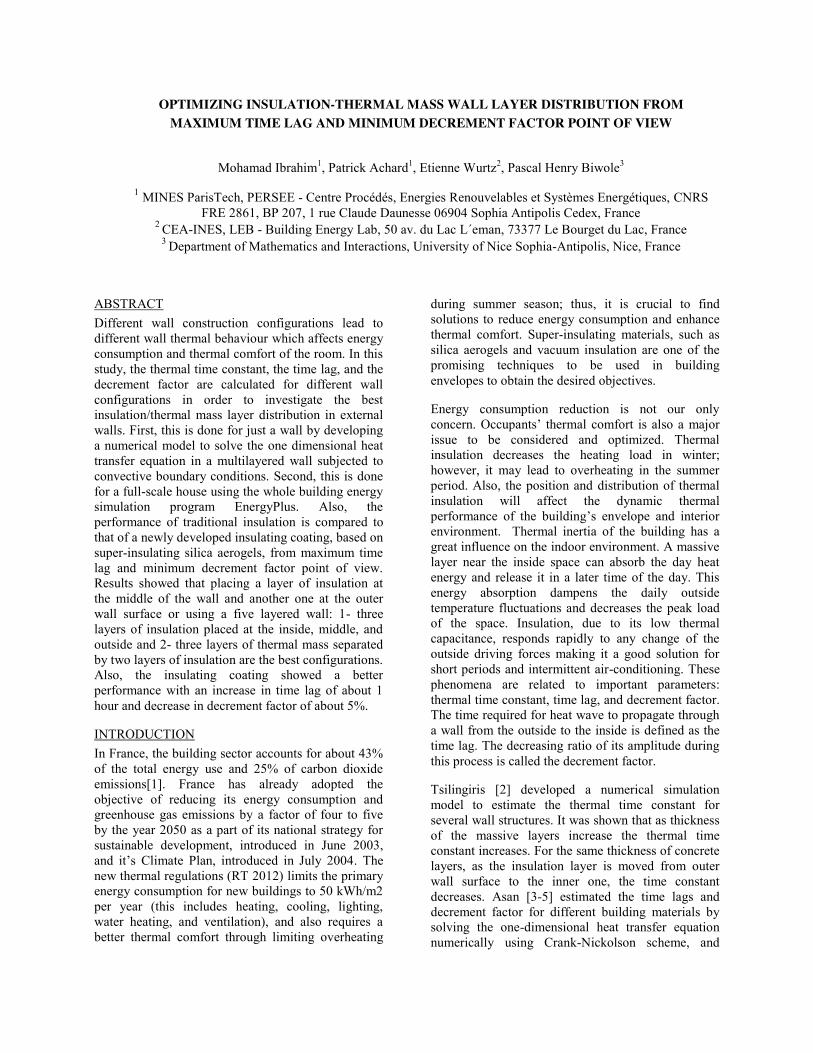
The inner wall surface temperature is plotted for cases: “1” (insulation is placed outside), “2” (insulation is placed inside), and “3” (insulation is placed inside and outside) (Fig. 9). This figure shows how the peak temperature is lower for the case where insulation is outside and is also more delayed. Furthermore, the fluctuation in the temperatures throughout the day is decreased which has a positive effect on thermal comfort. Splitting the insulation layer into two and placing one at the inside and one at the outside (case 3) will also improve the performance.
05
101520253035
time
cons
tant
(h)
Comparison of the Time Constant for the different wall configurations between
Traditional Insulation and Parex Coating Insulation
Parex Coating
0
0.04
0.08
0.12
0.16
0
2
4
6
8
10
12
Dec
rem
ent F
acto
r
Tim
e La
g (h
)
Time LagDecrement Factor
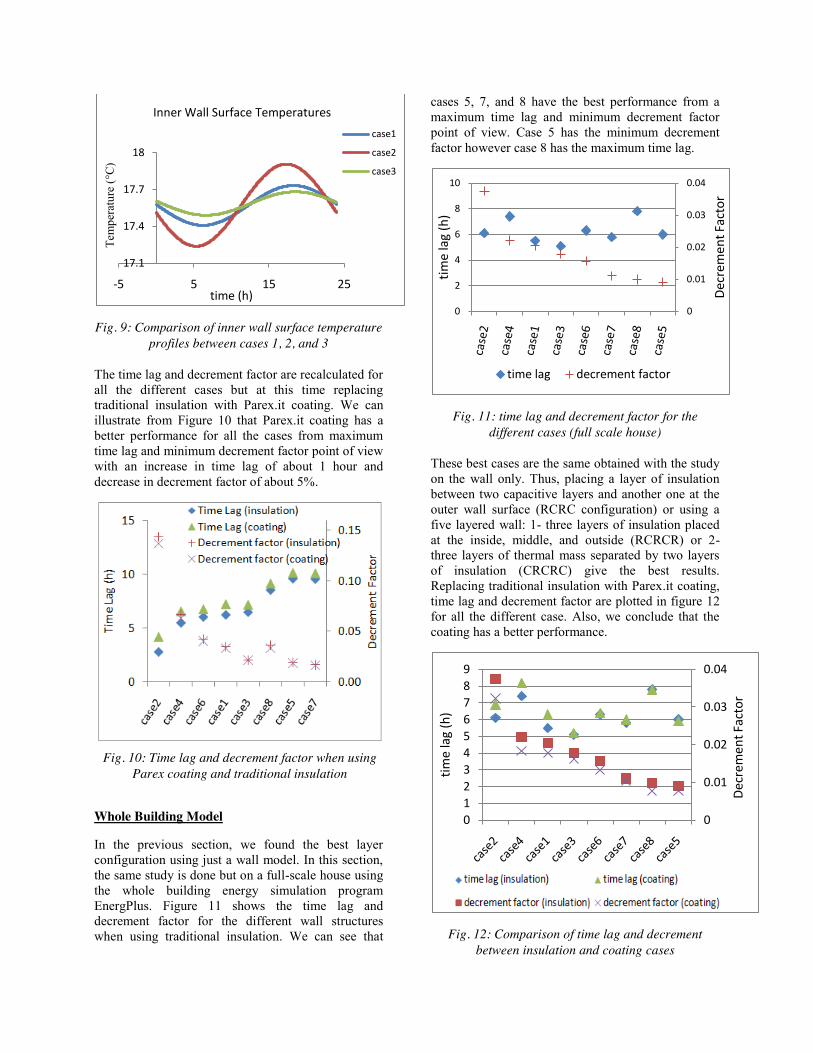
Fig. 9: Comparison of inner wall surface temperature profiles between cases 1, 2, and 3
The time lag and decrement factor are recalculated for all the different cases but at this time replacing traditional insulation with Parex.it coating. We can illustrate from Figure 10 that Parex.it coating has a better performance for all the cases from maximum time lag and minimum decrement factor point of view with an increase in time lag of about 1 hour and decrease in decrement factor of about 5%.
Whole Building Model
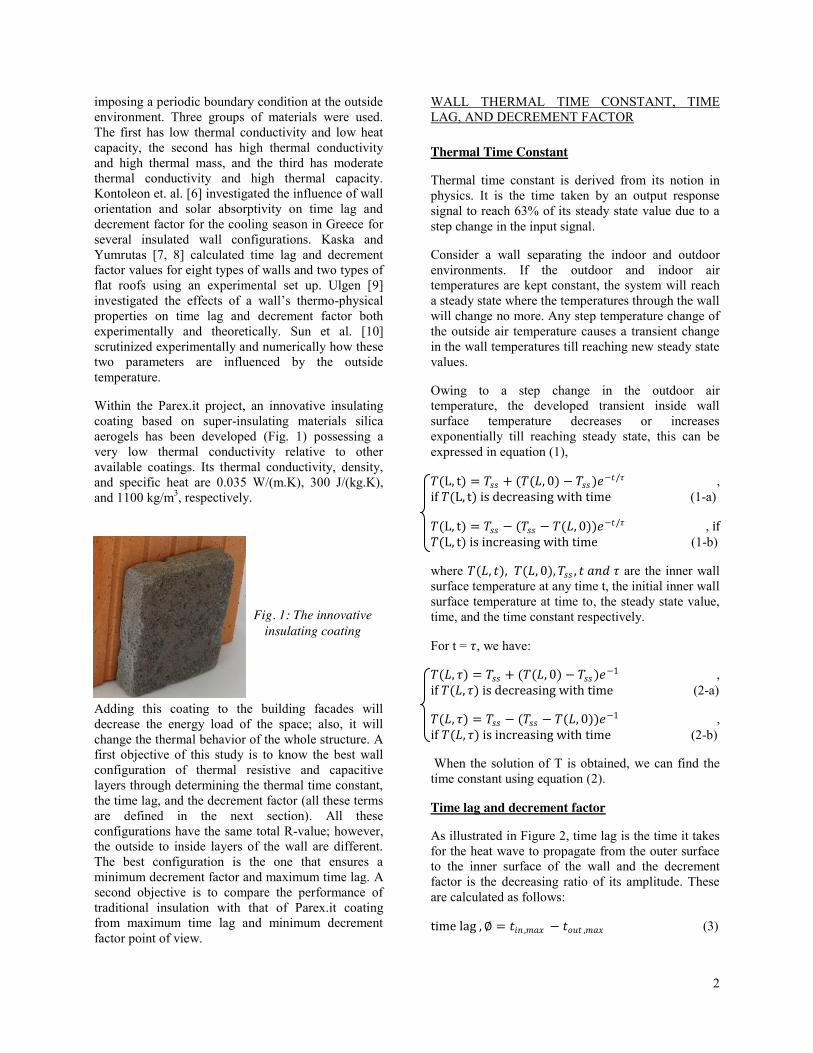
In the previous section, we found the best layer configuration using just a wall model. In this section, the same study is done but on a full-scale house using the whole building energy simulation program EnergPlus. Figure 11 shows the time lag and decrement factor for the different wall structures when using traditional insulation. We can see that
cases 5, 7, and 8 have the best performance from a maximum time lag and minimum decrement factor point of view. Case 5 has the minimum decrement factor however case 8 has the maximum time lag.
Fig. 11: time lag and decrement factor for the different cases (full scale house)
These best cases are the same obtained with the study on the wall only. Thus, placing a layer of insulation between two capacitive layers and another one at the outer wall surface (RCRC configuration) or using a five layered wall: 1- three layers of insulation placed at the inside, middle, and outside (RCRCR) or 2- three layers of thermal mass separated by two layers of insulation (CRCRC) give the best results. Replacing traditional insulation with Parex.it coating, time lag and decrement factor are plotted in figure 12 for all the different case. Also, we conclude that the coating has a better performance.
Fig. 12: Comparison of time lag and decrement between insulation and coating cases
17.1
17.4
17.7
18
-5 5 15 25
Tem
pera
ture
(°C
)
time (h)
Inner Wall Surface Temperaturescase1
case2
case3
0
0.01
0.02
0.03
0.04
0
2
4
6
8
10
Decr
emen
t Fac
tor
time
lag
(h)
time lag decrement factor
0
0.01
0.02
0.03
0.04
0123456789
Decr
emen
t Fac
tor
time
lag
(h)
time lag (insulation)time lag (coating)decrement factor (insulation)
Fig. 10: Time lag and decrement factor when using Parex coating and traditional insulation

CONCLUSION In this study, we calculated the time lag and decrement factor for different multilayered wall configurations consisting of insulation and thermal mass layers. All these wall configurations have the same total thermal resistance; however, the number and position of thermal insulation differ. Then, the same study was done but replacing traditional insulation with Parex.it coating. Results showed that a ‘4’ layered structure: layer of insulation between two capacitive layers and another one at the outer wall surface or ‘5’ layered wall: 1- three layers of insulation placed at the inside, middle, and outside or 2- three layers of thermal mass separated by two layers of insulation give the best results. Also, Parex.it coating showed a better performance than traditional insulation from maximum time lag and decrement factor.
NOMENCLATURE ∅: time lag (s) 𝑓: decrement factor T: temperature (K) 𝜌: density (kg/m3) c: specific heat (J/kg.K) k: thermal conductivity (W/m.K) x: special coordinate (m) t: time (s) k: thermal conductivity (W/m.K) 𝜏: thermal time constant (s) L: wall length (m) h: heat transfer coefficient (W/m .K)
subscripts ∞: outdoor a : indoor ss: steady state
REFERENCES [1] Energy conservation in buildings and community systems, International Energy Agency, ECBCS news 2011 issue 54. www.ecbcs.org
[2] P.T. Tsilingiris, On the thermal time constant of structural walls. Applied Thermal Engineering 24 (2004) 743–757
[3] H. Asan, Y.S. Sancaktar, Effects of wall’s thermophysical properties on time lag and decrement factor, Energy and Buildings 28 (1998) 159–166.
[4] H. Asan, Effects of wall’s insulation thickness and position on time lag and decrement factor. Energy and Buildings 28 (1998) 299–305.
[5] H. Asan, Investigation of wall’s optimum insulation position from maximum time lag and minimum decrement factor point of view. Energy and Buildings 32 (2000) 197–203.
[6] K.J. Kontoleon, E.A. Eumorfopoulou, The influence of wall orientation and exterior surface solar absorptivity on time lag and decrement factor in the Greek region. Renewable Energy 33 (2008) 1652–1664.
[7] Ö. Kaska, R. Yumrutas, Comparison of experimental and theoretical results for the transient heat flow through multilayer walls and flat roofs, Energy 33 (2008) 1816–1823.
[8] Ö. Kaska, R. Yumrutas, Experimental investigation for total equivalent temperature difference (TETD) values of building walls and flat roofs. Energy Conversion and Management 50 (2009) 2818–2825.
[9] K. Ulgen, Experimental and theoretical investigation of effects of wall’s thermo- physical properties on time lag and decrement factor. Energy and Buildings 34 (2002) 273–278.
[10] C. Sun, S. Shu, G. Ding, X. Zhang, X. Hu, Investigation of time lags and decrement factors for different building outside temperatures. Energy and Buildings 61 (2013) 1–7
[11] MATLAB, R2011. The MathWorks,Inc./http://www.mathworks.com/academia/S.
[12] EnergyPlus v 7.0. U.S. Department of Energy ; Energy Efficiency and Renewable Energy. http://apps1.eere.energy.gov/buildings/energyplus/