Optimizing Hydraulic Fracturing Treatment Integrating Geomechanical...
24
Chapter 52 Optimizing Hydraulic Fracturing Treatment Integrating Geomechanical Analysis and Reservoir Simulation for a Fractured Tight Gas Reservoir, Tarim Basin, China Feng Gui, Khalil Rahman, Daniel Moos, George Vassilellis, Chao Li, Qing Liu, Fuxiang Zhang, Jianxin Peng, Xuefang Yuan and Guoqing Zou Additional information is available at the end of the chapter http://dx.doi.org/10.5772/56384 Abstract A comprehensive geomechanical study was carried out to optimize stimulation for a frac‐ tured tight gas reservoir in the northwest Tarim Basin. Conventional gel fracturing and acid‐ izing operations carried out in the field previously failed to yield the expected productivity. The objective of this study was to assess the effectiveness of slickwater or low-viscosity stim‐ ulation of natural fractures by shear slippage, creating a conductive, complex fracture net‐ work. This type of stimulation is proven to successfully exploit shale gas resources in many fields in the United States. A field-scale geomechanical model was built using core, well log, drilling data and experien‐ ces characterizing the in-situ stress, pore pressure and rock mechanical properties in both overburden and reservoir sections. Borehole image data collected in three offset wells were used to characterize the in-situ natural fracture system in the reservoir. The pressure re‐ quired to stimulate the natural fracture systems by shear slippage in the current stress field was predicted. The injection of low-viscosity slickwater was simulated and the resulting shape of the stimulated reservoir volume was predicted using a dual-porosity, dual-permea‐ bility finite-difference flow simulator with anisotropic, pressure-sensitive reservoir proper‐ ties. A hydraulic fracturing design and evaluation simulator was used to model the geometry and conductivity of the principal hydraulic fracture filled with proppant. Fracture growth in the presence of the lithology-based stress contrast and rock properties was com‐ puted, taking into account leakage of the injected fluid into the stimulated reservoir volume © 2013 Gui et al.; licensee InTech. This is an open access article distributed under the terms of the Creative Commons Attribution License (http://creativecommons.org/licenses/by/3.0), which permits unrestricted use, distribution, and reproduction in any medium, provided the original work is properly cited.
Transcript of Optimizing Hydraulic Fracturing Treatment Integrating Geomechanical...
Chapter 52
Optimizing Hydraulic Fracturing Treatment IntegratingGeomechanical Analysis and Reservoir Simulation for aFractured Tight Gas Reservoir, Tarim Basin, China
Feng Gui, Khalil Rahman, Daniel Moos,George Vassilellis, Chao Li, Qing Liu, Fuxiang Zhang,Jianxin Peng, Xuefang Yuan and Guoqing Zou
Additional information is available at the end of the chapter
http://dx.doi.org/10.5772/56384
Abstract
A comprehensive geomechanical study was carried out to optimize stimulation for a frac‐tured tight gas reservoir in the northwest Tarim Basin. Conventional gel fracturing and acid‐izing operations carried out in the field previously failed to yield the expected productivity.The objective of this study was to assess the effectiveness of slickwater or low-viscosity stim‐ulation of natural fractures by shear slippage, creating a conductive, complex fracture net‐work. This type of stimulation is proven to successfully exploit shale gas resources in manyfields in the United States.
A field-scale geomechanical model was built using core, well log, drilling data and experien‐ces characterizing the in-situ stress, pore pressure and rock mechanical properties in bothoverburden and reservoir sections. Borehole image data collected in three offset wells wereused to characterize the in-situ natural fracture system in the reservoir. The pressure re‐quired to stimulate the natural fracture systems by shear slippage in the current stress fieldwas predicted. The injection of low-viscosity slickwater was simulated and the resultingshape of the stimulated reservoir volume was predicted using a dual-porosity, dual-permea‐bility finite-difference flow simulator with anisotropic, pressure-sensitive reservoir proper‐ties. A hydraulic fracturing design and evaluation simulator was used to model thegeometry and conductivity of the principal hydraulic fracture filled with proppant. Fracturegrowth in the presence of the lithology-based stress contrast and rock properties was com‐puted, taking into account leakage of the injected fluid into the stimulated reservoir volume
© 2013 Gui et al.; licensee InTech. This is an open access article distributed under the terms of the CreativeCommons Attribution License (http://creativecommons.org/licenses/by/3.0), which permits unrestricted use,distribution, and reproduction in any medium, provided the original work is properly cited.
predicted previously by reservoir simulation. It was found that four-stage fracturing wasnecessary to cover the entire reservoir thickness. Post-stimulation gas production was thenpredicted using the geometry and conductivity of the four propped fractures and the en‐hanced permeability in the simulated volume due to shear slippage of natural fractures, us‐ing a dual-porosity, dual-permeability reservoir simulator.
For the purpose of comparison, a conventional gel fracturing treatment was also designedfor the same well. It was found that two-stage gel fracturing was sufficient to cover thewhole reservoir thickness. The gas production profile including these two propped fractureswas also estimated using the reservoir simulator.
The modeling comparison shows that the average gas flow rate after slickwater or low-vis‐cosity treatment could be as much as three times greater than the rate after gel fracturing. Itwas therefore decided to conduct the slickwater treatment in the well. Due to some opera‐tional complexities, the full stage 1 slickwater treatment could not be executed in the bottomzone and treatments in the other three zones have not been completed. However, the post-treatment production test results are very promising. The lessons learned in the planning,design, execution and production stages are expected to be a valuable guide for future treat‐ments in the same field and elsewhere.
1. Introduction
Following the success in exploiting shale gas resources by multi-stage hydraulic fracturingwith slickwaters or low-viscosity fluid (i.e., linear gel) in horizontal wells in North America,there has been a lot of interest in applying this technique to other regions and other types oftight reservoirs. This is due in part to the fact that conventional gel fracturing treatments havebeen less successful in some naturally fractured reservoirs due to excessive unexpected fluidloss and proppant bridging in natural fractures, leading often to premature screen-outs.Additionally, the high-viscosity gel left inside the natural fractures causes the loss of virginpermeability of the reservoir in the case of inefficient gel breaking.
However, the challenge for doing this is that the physical mechanism responsible for this kindof stimulation is yet to be fully understood and a standard work flow for design and evaluationis yet to be developed. Furthermore, industry so far mainly relies on performance analogs toimprove understanding of each shale play, and thus it usually takes years to advance up thelearning curve for determining which factors best affect well production [1].
Currently, the general opinion on the mechanism leading to the success of waterfrac in shalegas reservoirs is that a complex fracture network is created by stimulation of pre-existingnatural fractures. Although it is difficult to observe the processes acting during stimulation,microseismic imaging has enabled us to understand that both simple, planar fractures andcomplex fracture networks can be created in hydraulic fracture stimulations under differentsettings [2]. Fracture complexity is thought to be enhanced when pre-existing fractures areoriented at an angle to the maximum stress direction, or when both horizontal stresses and
Effective and Sustainable Hydraulic Fracturing1016
horizontal stress anisotropy are low, because these combinations of stress and natural fracturesallow fractures in multiple orientations to be stimulated [3]. The result of stimulation thereforedepends both on the geometry of the pre-existing fracture systems and on the in-situ stressstate. It is now generally accepted that stimulation in shale gas reservoirs occurs through acombination of shear slip and opening of pre-existing (closed) fractures and the creation ofnew hydraulic (tensile) fractures [4-6]. In wells that are drilled along the minimum horizontalstress (Shmin) direction, stimulation generally creates a primary radial hydraulic fracture that isperpendicular to Shmin. Then, pressure changes caused by fluid diffusion into the surroundingrock and the modified near-fracture stress field induced by fracture opening cause shear slipon pre-existing natural fractures. If the horizontal stress difference is small enough, newhydraulic fractures perpendicular to the main fracture can open. Each slip or oblique openingevent radiates seismic energy, which, if the event is large enough, can be detected usingdownhole or surface geophones.
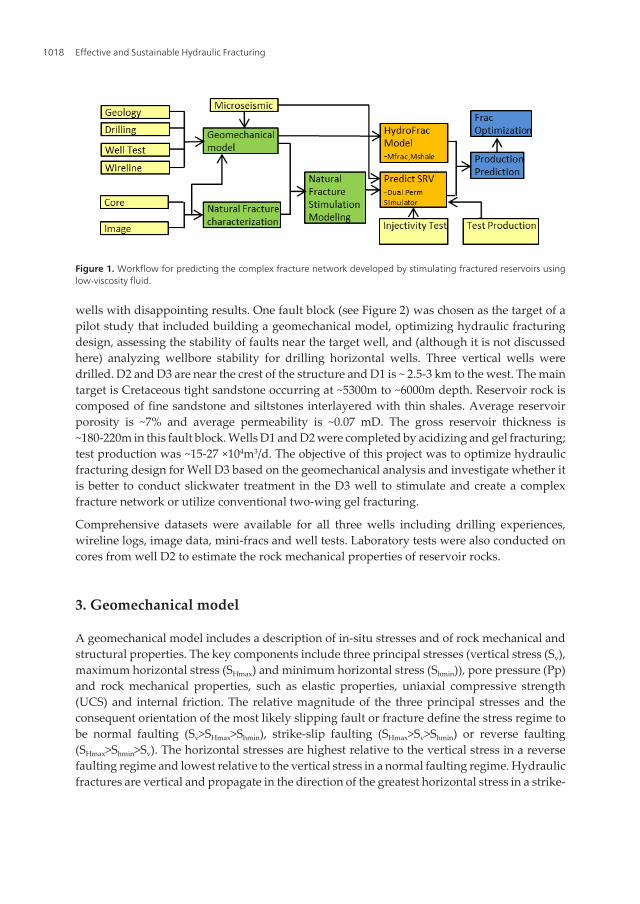
Founded on the idea that productivity enhancement due to stimulation results not just fromcreation of new hydraulic fractures but also from the effect of the stimulation on pre-existingfractures (joints and small faults), a new workflow dubbed “shale engineering”, was estab‐lished by combining surface and downhole seismic, petro-physical, microseismic, stimulation,and production data [7, 8]. In this new workflow (Figure 1), the change in flow properties ofnatural fractures is predicted using a comprehensive geomechanical model based on theconcept of critically stressed fractures [9-11]. Existing reservoir simulation tools can then beused to model the hysteresis of fracture flow properties that result from the microseismicallydetectable shear slip, which is critical to the permanent enhancement in flow properties andincreased access to the reservoir that results from stimulation. The primary hydraulic fracturecreated and propped during the stimulation can be modeled using conventional commercialhydraulic fracture models by taking into account fluid leaked into natural fractures in thesurrounding region. The propped conductivity is estimated using laboratory-based proppantconductivity data adjusted for the proppant concentration in the fracture. The propped mainfracture model and the reservoir model with stimulated natural fracture properties can thenbe integrated into production simulators to predict production after the slickwater hydraulicfracturing treatment. When available, microseismic data can be used to help define the networkof stimulated natural fractures that comprises the stimulated reservoir volume (SRV).
Although this new workflow was developed based on experiences in shale gas reservoirs, webelieve it can also be applied to any unconventional reservoir requiring stimulation that haspre-existing natural fractures. Both Coal Bed Methane (CBM) and fractured tight gas reservoirsare examples of where this approach could be applied. In this paper, we will illustrate theworkflow using the results of a study conducted in a fractured tight gas reservoir in the KuqaDepression, Tarim Basin.
2. Project background
The project discussed in this paper was initiated to investigate various methods and practicesto improve the economics of the field. Conventional gel fracturing had been tested in a few
Optimizing Hydraulic Fracturing Treatment Integrating Geomechanical Analysis and Reservoir Simulation for…http://dx.doi.org/10.5772/56384
1017
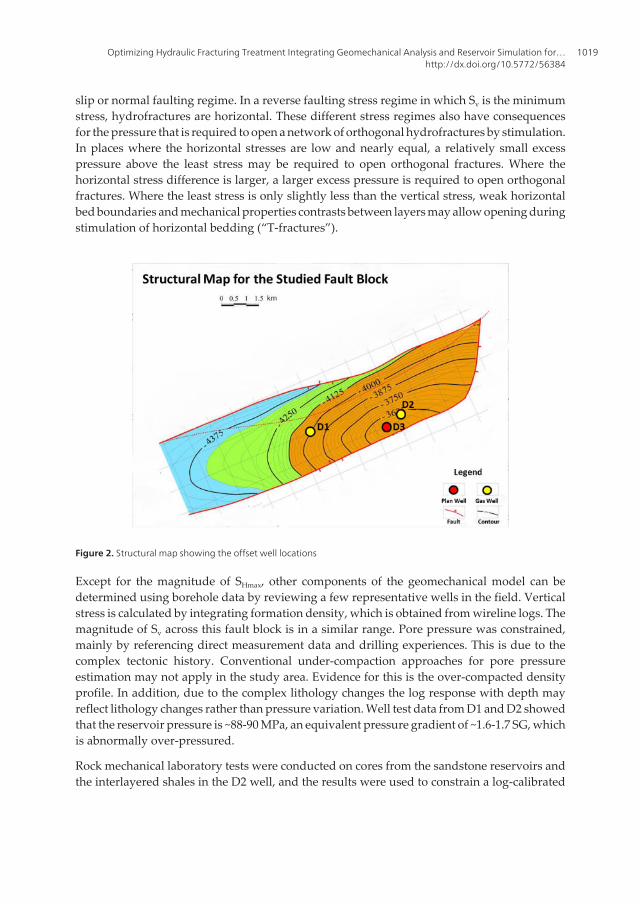
wells with disappointing results. One fault block (see Figure 2) was chosen as the target of apilot study that included building a geomechanical model, optimizing hydraulic fracturingdesign, assessing the stability of faults near the target well, and (although it is not discussedhere) analyzing wellbore stability for drilling horizontal wells. Three vertical wells weredrilled. D2 and D3 are near the crest of the structure and D1 is ~ 2.5-3 km to the west. The maintarget is Cretaceous tight sandstone occurring at ~5300m to ~6000m depth. Reservoir rock iscomposed of fine sandstone and siltstones interlayered with thin shales. Average reservoirporosity is ~7% and average permeability is ~0.07 mD. The gross reservoir thickness is~180-220m in this fault block. Wells D1 and D2 were completed by acidizing and gel fracturing;test production was ~15-27 ×104m3/d. The objective of this project was to optimize hydraulicfracturing design for Well D3 based on the geomechanical analysis and investigate whether itis better to conduct slickwater treatment in the D3 well to stimulate and create a complexfracture network or utilize conventional two-wing gel fracturing.
Comprehensive datasets were available for all three wells including drilling experiences,wireline logs, image data, mini-fracs and well tests. Laboratory tests were also conducted oncores from well D2 to estimate the rock mechanical properties of reservoir rocks.
3. Geomechanical model
A geomechanical model includes a description of in-situ stresses and of rock mechanical andstructural properties. The key components include three principal stresses (vertical stress (Sv),maximum horizontal stress (SHmax) and minimum horizontal stress (Shmin)), pore pressure (Pp)and rock mechanical properties, such as elastic properties, uniaxial compressive strength(UCS) and internal friction. The relative magnitude of the three principal stresses and theconsequent orientation of the most likely slipping fault or fracture define the stress regime tobe normal faulting (Sv>SHmax>Shmin), strike-slip faulting (SHmax>Sv>Shmin) or reverse faulting(SHmax>Shmin>Sv). The horizontal stresses are highest relative to the vertical stress in a reversefaulting regime and lowest relative to the vertical stress in a normal faulting regime. Hydraulicfractures are vertical and propagate in the direction of the greatest horizontal stress in a strike-
Figure 1. Workflow for predicting the complex fracture network developed by stimulating fractured reservoirs usinglow-viscosity fluid.
Effective and Sustainable Hydraulic Fracturing1018
slip or normal faulting regime. In a reverse faulting stress regime in which Sv is the minimumstress, hydrofractures are horizontal. These different stress regimes also have consequencesfor the pressure that is required to open a network of orthogonal hydrofractures by stimulation.In places where the horizontal stresses are low and nearly equal, a relatively small excesspressure above the least stress may be required to open orthogonal fractures. Where thehorizontal stress difference is larger, a larger excess pressure is required to open orthogonalfractures. Where the least stress is only slightly less than the vertical stress, weak horizontalbed boundaries and mechanical properties contrasts between layers may allow opening duringstimulation of horizontal bedding (“T-fractures”).
Figure 2. Structural map showing the offset well locations
Except for the magnitude of SHmax, other components of the geomechanical model can bedetermined using borehole data by reviewing a few representative wells in the field. Verticalstress is calculated by integrating formation density, which is obtained from wireline logs. Themagnitude of Sv across this fault block is in a similar range. Pore pressure was constrained,mainly by referencing direct measurement data and drilling experiences. This is due to thecomplex tectonic history. Conventional under-compaction approaches for pore pressureestimation may not apply in the study area. Evidence for this is the over-compacted densityprofile. In addition, due to the complex lithology changes the log response with depth mayreflect lithology changes rather than pressure variation. Well test data from D1 and D2 showedthat the reservoir pressure is ~88-90 MPa, an equivalent pressure gradient of ~1.6-1.7 SG, whichis abnormally over-pressured.
Rock mechanical laboratory tests were conducted on cores from the sandstone reservoirs andthe interlayered shales in the D2 well, and the results were used to constrain a log-calibrated
Optimizing Hydraulic Fracturing Treatment Integrating Geomechanical Analysis and Reservoir Simulation for…http://dx.doi.org/10.5772/56384
1019

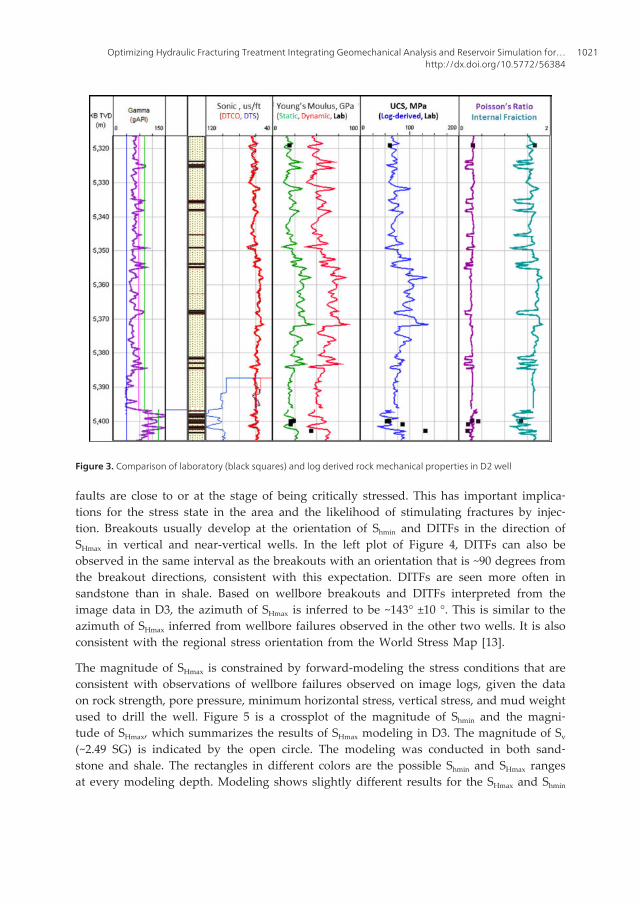
range of UCS and other rock mechanical parameters. Figure 3 shows the match between log-derived rock strength profiles and laboratory test results in D2. Dynamic Young’s moduluswas calculated from compressional and shear velocities and density and calibrated to staticvalues using laboratory test results. The relationship between dynamic and static Poisson’sRatio was not obvious; the dynamic Poisson’s Ratio computed from Vp/Vs matched reasonablywell with the laboratory results, so it was used directly in the modeling. Young’s Modulus-based empirical relationships were used to estimate the UCS for both sandstone and inter-layered shales.
Minimum horizontal stress (Shmin) at depth can be directly estimated from extended leak-off tests (XLOT), leak-off tests (LOT) or mini-frac tests. No extended leak-off tests wereconducted in the field. LOTs and leak-off points from two reliable LOTs were used toconstrain the upper limit of Shmin (~2.09 SG EMW at ~4000 m TVD). One mini-frac test wasconducted in the sandstone reservoir in D2, with the interpreted fracture closure pres‐sure (closest estimation to Shmin) ~2.064 ppg EMW at ~5400 m TVD. Because LOTs areusually conducted in shaly formations while mini-frac tests are usually carried out insandstone reservoirs, the LOTs and mini-frac tests are used to construct separate Shmin
profiles in shales and sandstones, respectively using the effective stress ratio method (Shmin-Pp/Sv-Pp). The effective stress ratio from LOT is ~0.725 and from mini-frac test is ~0.48,which indicates there is a dramatic stress difference between sandstones and shales (stresscontrast). The contrast between different lithology significantly influences hydraulicfracturing design. The relative lower stress in sandstones indicates that a hydraulic fractureshould be easily created in the tight sandstone, however, the interlayered shales whichhave higher stress act as frac barriers and pinch points, thereby complicating fracturepropagation and the final fracture geometry and conductivity.
The azimuth and magnitude of maximum horizontal stress (SHmax) can be constrained throughthe analysis of wellbore failures such as breakouts and tensile cracks observed on wellboreimages or multi-arm caliper data. Wellbore failure analysis allows constraining of the orien‐tation and magnitude of the SHmax because stress-induced wellbore failures occur due to thestress concentration acting around the wellbore once is drilled. The presence, orientation, andseverity of failure are a function of the in-situ stress fields, wellbore orientation, wellbore andformation pressures and rock strength [12]. High-resolution electrical wireline image logs wereavailable in all three study wells. Both breakouts and drilling-induced tensile fractures (DITFs)were observed in the reservoir sections in D2 and D3 wells. Only DITFs were observed in wellD1, which could be due to the higher mud weights used during drilling and the poor qualityof the image data in lower part of the reservoir.
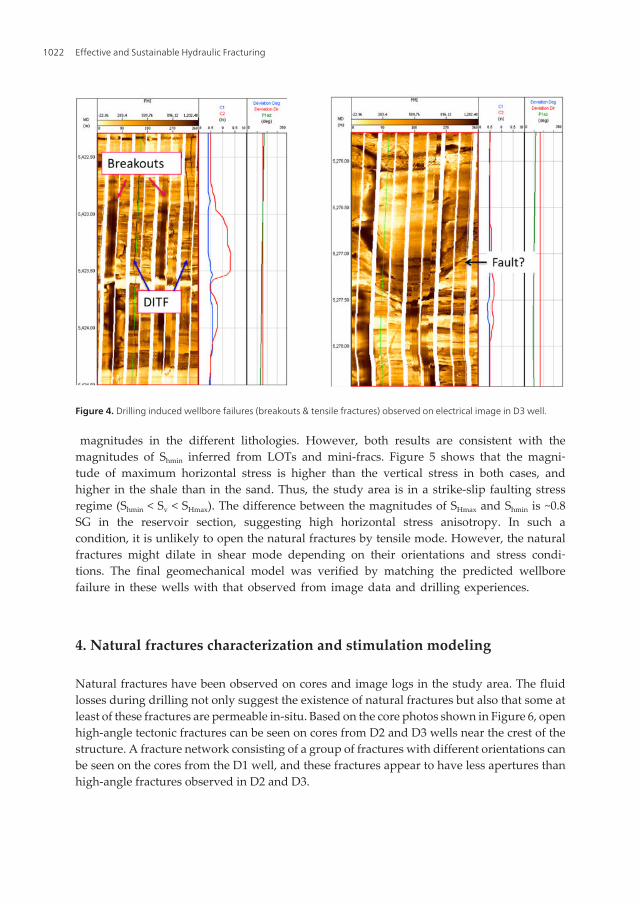
Figure 4 shows examples of the breakouts seen in the D3 well. The example shows thetypical appearance of breakouts observed on images. Here, the average apparent break‐out width is ~30-40 degree. The breakouts mostly occur in shales and more breakouts areobserved in the lower part of reservoir where the formations become more shaly. Theorientation of breakouts is quite consistent with depth and across the block. However, smallfluctuations of breakout orientation can be observed locally while intercepting small faults(an example can be seen in the right plot in Figure 4). This may indicate that some of these
Effective and Sustainable Hydraulic Fracturing1020
faults are close to or at the stage of being critically stressed. This has important implica‐tions for the stress state in the area and the likelihood of stimulating fractures by injec‐tion. Breakouts usually develop at the orientation of Shmin and DITFs in the direction ofSHmax in vertical and near-vertical wells. In the left plot of Figure 4, DITFs can also beobserved in the same interval as the breakouts with an orientation that is ~90 degrees fromthe breakout directions, consistent with this expectation. DITFs are seen more often insandstone than in shale. Based on wellbore breakouts and DITFs interpreted from theimage data in D3, the azimuth of SHmax is inferred to be ~143° ±10 °. This is similar to theazimuth of SHmax inferred from wellbore failures observed in the other two wells. It is alsoconsistent with the regional stress orientation from the World Stress Map [13].
The magnitude of SHmax is constrained by forward-modeling the stress conditions that areconsistent with observations of wellbore failures observed on image logs, given the dataon rock strength, pore pressure, minimum horizontal stress, vertical stress, and mud weightused to drill the well. Figure 5 is a crossplot of the magnitude of Shmin and the magni‐tude of SHmax, which summarizes the results of SHmax modeling in D3. The magnitude of Sv
(~2.49 SG) is indicated by the open circle. The modeling was conducted in both sand‐stone and shale. The rectangles in different colors are the possible Shmin and SHmax rangesat every modeling depth. Modeling shows slightly different results for the SHmax and Shmin
Figure 3. Comparison of laboratory (black squares) and log derived rock mechanical properties in D2 well
Optimizing Hydraulic Fracturing Treatment Integrating Geomechanical Analysis and Reservoir Simulation for…http://dx.doi.org/10.5772/56384
1021
magnitudes in the different lithologies. However, both results are consistent with themagnitudes of Shmin inferred from LOTs and mini-fracs. Figure 5 shows that the magni‐tude of maximum horizontal stress is higher than the vertical stress in both cases, andhigher in the shale than in the sand. Thus, the study area is in a strike-slip faulting stressregime (Shmin < Sv < SHmax). The difference between the magnitudes of SHmax and Shmin is ~0.8SG in the reservoir section, suggesting high horizontal stress anisotropy. In such acondition, it is unlikely to open the natural fractures by tensile mode. However, the naturalfractures might dilate in shear mode depending on their orientations and stress condi‐tions. The final geomechanical model was verified by matching the predicted wellborefailure in these wells with that observed from image data and drilling experiences.
4. Natural fractures characterization and stimulation modeling
Natural fractures have been observed on cores and image logs in the study area. The fluidlosses during drilling not only suggest the existence of natural fractures but also that some atleast of these fractures are permeable in-situ. Based on the core photos shown in Figure 6, openhigh-angle tectonic fractures can be seen on cores from D2 and D3 wells near the crest of thestructure. A fracture network consisting of a group of fractures with different orientations canbe seen on the cores from the D1 well, and these fractures appear to have less apertures thanhigh-angle fractures observed in D2 and D3.
Figure 4. Drilling induced wellbore failures (breakouts & tensile fractures) observed on electrical image in D3 well.
Effective and Sustainable Hydraulic Fracturing1022
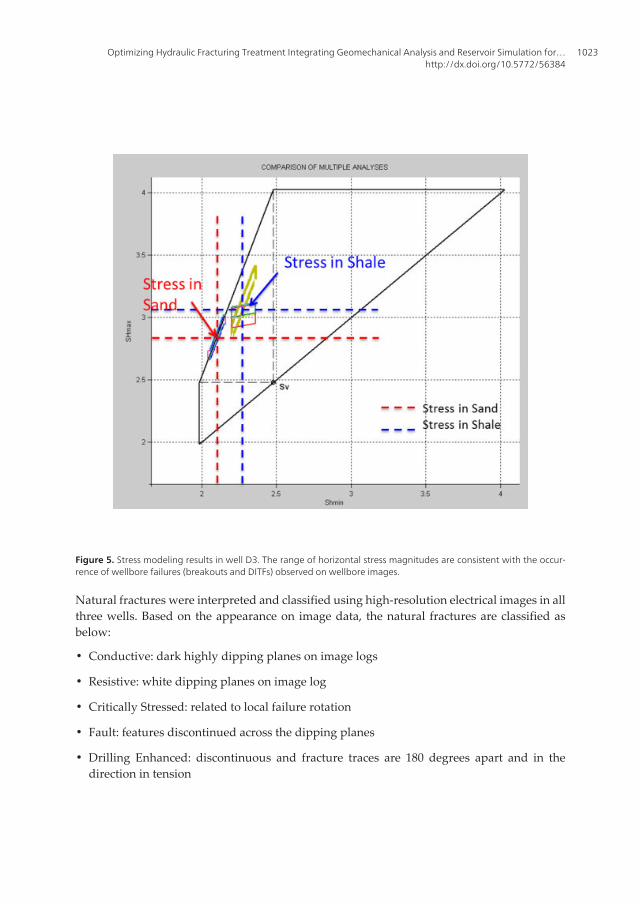
Figure 5. Stress modeling results in well D3. The range of horizontal stress magnitudes are consistent with the occur‐rence of wellbore failures (breakouts and DITFs) observed on wellbore images.
Natural fractures were interpreted and classified using high-resolution electrical images in allthree wells. Based on the appearance on image data, the natural fractures are classified asbelow:
• Conductive: dark highly dipping planes on image logs
• Resistive: white dipping planes on image log
• Critically Stressed: related to local failure rotation
• Fault: features discontinued across the dipping planes
• Drilling Enhanced: discontinuous and fracture traces are 180 degrees apart and in thedirection in tension
Optimizing Hydraulic Fracturing Treatment Integrating Geomechanical Analysis and Reservoir Simulation for…http://dx.doi.org/10.5772/56384
1023

D1 D2 D3
Figure 6. Core photos showing the natural fractures observed in three offset wells
Figure 7 shows a few examples of natural fractures observed on the electrical images. The ploton the left shows some examples of high-angle and low-angle conductive fractures that appearto be continuous dark lines on the images. Flexible sinusoids can be fit to the fracture tracesand fracture orientation can be determined. The plot on the right shows an example of drillingenhanced natural fractures for which the fracture trace is discontinuous. The fact that parts ofthese fractures can be detected on the electrical image is due to fluid penetration into thefracture at the orientation around where the rock at the borehole wall is in tension duringdrilling. The classification of the natural fractures indicates the relative strength of thefractures. For example, the resistive fractures are closed and mineralized. Active faults orcritically stressed natural fractures might be open and conductive, even under the originalconditions. During stimulation, these fractures are the most easily stimulated. However, it isimportant to note that the classification of natural fractures is purely based on their appearanceon the electrical images, and cannot be used directly to quantify permeability or other flowproperties.
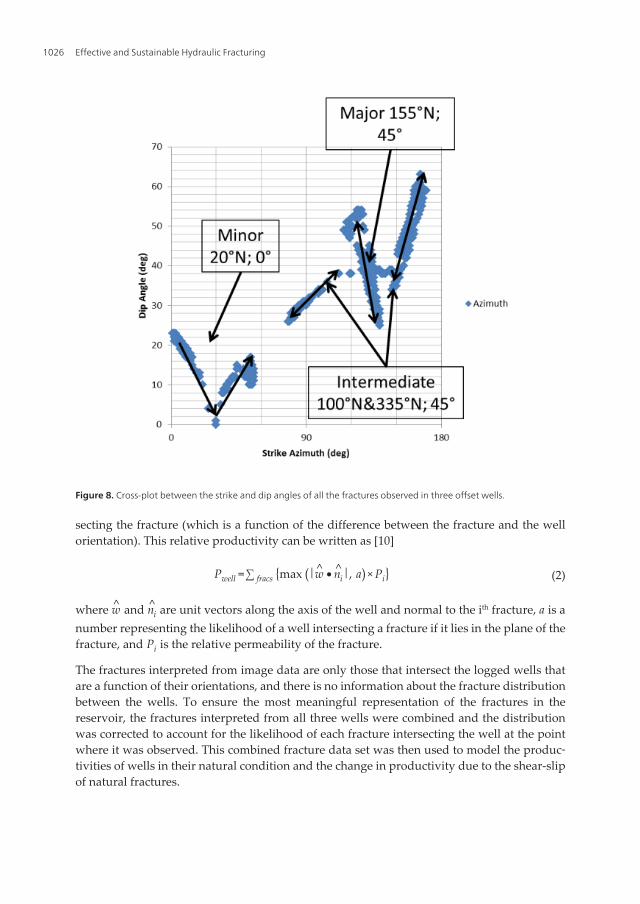
Figure 8 shows the fractures orientations on a crossplot of the strike and dip angles of allfractures observed in the three wells. The natural fractures observed can be divided into threegroups. The first group is low-angle fractures (dip<20 °), which could be related to beddings.The second group is the major fractures seen in this block that have intermediate dip angles(~25-55°) and strike at an azimuth of ~155°N. The third group consists of fractures with strikesof ~355°N and ~100°N and dip angles ~ 35°-65° and 25°-35°, respectively. Because of their widerange of orientations and cross-cutting relationship, these three groups of fractures could bestimulated to form a well-connected grid with a major fracture azimuth (~155°N) aligned withthe direction of maximum horizontal stress (~143°N). This direction is nearly perpendicular tothe faults, defining the shape of fault block (see Figure 2). Because the structural trends andthe stresses are aligned, it enabled us to create a reservoir model with a grid that is consistentwith both.
Effective and Sustainable Hydraulic Fracturing1024
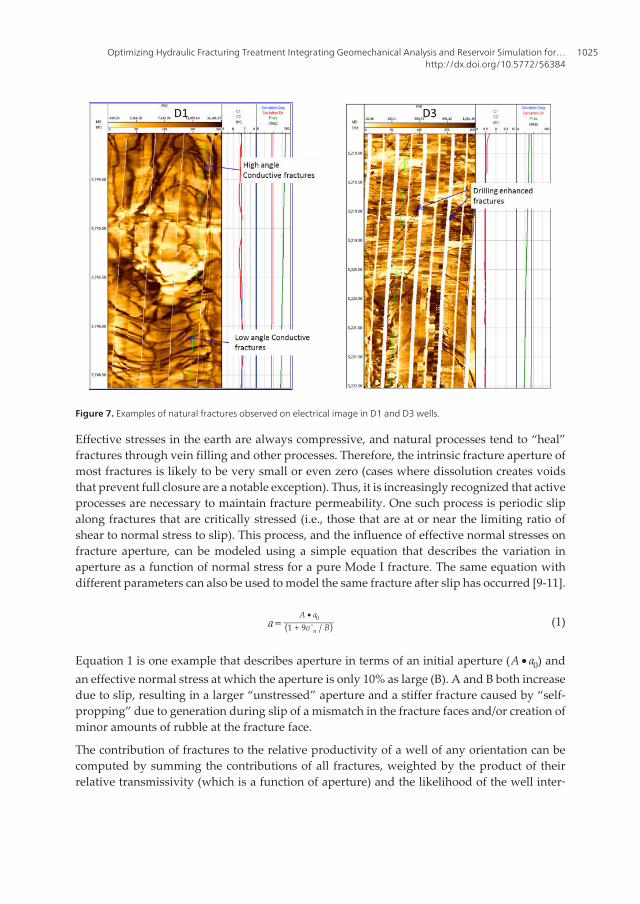
Figure 7. Examples of natural fractures observed on electrical image in D1 and D3 wells.
Effective stresses in the earth are always compressive, and natural processes tend to “heal”fractures through vein filling and other processes. Therefore, the intrinsic fracture aperture ofmost fractures is likely to be very small or even zero (cases where dissolution creates voidsthat prevent full closure are a notable exception). Thus, it is increasingly recognized that activeprocesses are necessary to maintain fracture permeability. One such process is periodic slipalong fractures that are critically stressed (i.e., those that are at or near the limiting ratio ofshear to normal stress to slip). This process, and the influence of effective normal stresses onfracture aperture, can be modeled using a simple equation that describes the variation inaperture as a function of normal stress for a pure Mode I fracture. The same equation withdifferent parameters can also be used to model the same fracture after slip has occurred [9-11].
a=A ∙ a0
(1 + 9σ 'n / B) (1)
Equation 1 is one example that describes aperture in terms of an initial aperture (A∙a0) andan effective normal stress at which the aperture is only 10% as large (B). A and B both increasedue to slip, resulting in a larger “unstressed” aperture and a stiffer fracture caused by “self-propping” due to generation during slip of a mismatch in the fracture faces and/or creation ofminor amounts of rubble at the fracture face.
The contribution of fractures to the relative productivity of a well of any orientation can becomputed by summing the contributions of all fractures, weighted by the product of theirrelative transmissivity (which is a function of aperture) and the likelihood of the well inter‐
Optimizing Hydraulic Fracturing Treatment Integrating Geomechanical Analysis and Reservoir Simulation for…http://dx.doi.org/10.5772/56384
1025
secting the fracture (which is a function of the difference between the fracture and the wellorientation). This relative productivity can be written as [10]
Pwell =∑ fracs {max (|w ∙ni^ |, a)×Pi} (2)
where w and ni^ are unit vectors along the axis of the well and normal to the ith fracture, a is a
number representing the likelihood of a well intersecting a fracture if it lies in the plane of thefracture, and Pi is the relative permeability of the fracture.
The fractures interpreted from image data are only those that intersect the logged wells thatare a function of their orientations, and there is no information about the fracture distributionbetween the wells. To ensure the most meaningful representation of the fractures in thereservoir, the fractures interpreted from all three wells were combined and the distributionwas corrected to account for the likelihood of each fracture intersecting the well at the pointwhere it was observed. This combined fracture data set was then used to model the produc‐tivities of wells in their natural condition and the change in productivity due to the shear-slipof natural fractures.
Figure 8. Cross-plot between the strike and dip angles of all the fractures observed in three offset wells.
Effective and Sustainable Hydraulic Fracturing1026

Figure 9 shows relative productivity for wells of all orientations based on the fracturesobserved in all three wells. Natural fractures are shown as poles to the fracture surfaces (blackdots). Different apertures and strengths were assumed for the different types of fractures basedon their classifications described above (Table 1). The plot on the left shows the relativeproductivity under pre-stimulation conditions, while the plot on the right shows the relativeproductivity calculated using equation 2 after the fractures were stimulated with a pressure20 MPa above the original reservoir pressure. It can be seen that the maximum productivityincreases by a factor of 5 if all fractures see the same 20-MPa pressure increase, which isobviously not the case during real stimulation. Superimposed on Figure 9 are the computedoptimal orientations of wells based on the fracture and stress analysis (green circles). If noneof the fractures is critically stressed, then the best orientation to drill a well is perpendicularto the largest population of natural fractures. If some fractures have enhanced permeabilitybecause they are critically stressed, the optimal orientation shifts in the direction of the greatestconcentration of critically stressed fractures. Figure 9 shows there are some fractures alreadynear or being critically stressed, even under ambient condition (left plot), and the maximumproductivity is achieved by drilling highly deviated wells with ~20 °N hole azimuth. Theoptimum wellbore orientation after ~ 20-MPa stimulation is nearly horizontal and in thedirection of ~228 °N.
Fracture classificationFracture cohesion
(MPa)Sliding Friction a0
A B (MPa)
Un-stimulated Stimulated Un-stimulated Stimulated
Conductive 5 0.6 10 0.18 0.18 10 100
Resistive 5 0.6 10 0.1 0.18 1 100
Faults 0 0.6 30 0.18 0.18 100 100
Drilling enhanced 0 0.6 10 0.1 0.18 10 100
Critically Stressed 1 0.2 10 0.1 0.2 10 100
Table 1. Model parameters to calculate relative productivities for different types of natural fractures
Figure 10 shows the general effect of reservoir flow properties changes due to the naturalfracture stimulation for studied fault block. Again, all the fractures interpreted from imagelogs in the three wells are used for modeling. Cross-plots between relative productivity (flowrate/pressure) vs. reservoir pressure are shown for three different cases: under originalconditions, after 30-MPa and after 50-MPa stimulation. The blue curves show productivitychanges during stimulation when the pressure is increasing, the green curves show theproductivity changes during flowback and production. Modeling ends at ~20-MPa depletion.The relative productivity at ~20-MPa depletion increases five-fold after the 30-MPa stimulation(productivity increases from ~4 to ~20). There is no obvious improvement in the relativeproductivity of natural fractures for 50-MPa stimulation (bottom left) compared to 30-MPastimulation. The bottom-right plot shows the number of stimulated natural fractures underdifferent pressure conditions. It is clear that nearly all of the natural fractures are stimulatedwhile the pressure increases to ~130 MPa (40-Ma stimulation), which explains why there is
Optimizing Hydraulic Fracturing Treatment Integrating Geomechanical Analysis and Reservoir Simulation for…http://dx.doi.org/10.5772/56384
1027
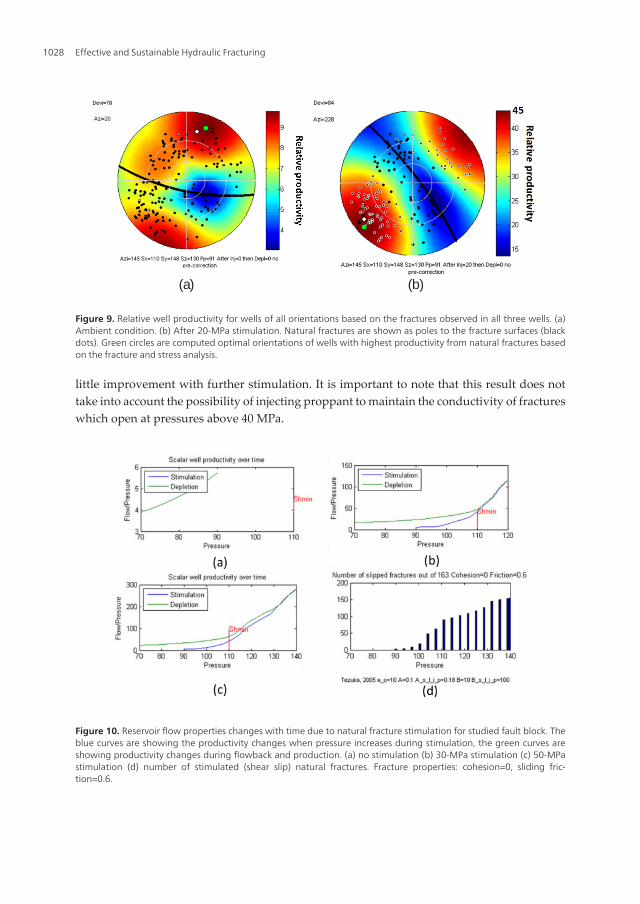
little improvement with further stimulation. It is important to note that this result does nottake into account the possibility of injecting proppant to maintain the conductivity of fractureswhich open at pressures above 40 MPa.
Figure 10. Reservoir flow properties changes with time due to natural fracture stimulation for studied fault block. Theblue curves are showing the productivity changes when pressure increases during stimulation, the green curves areshowing productivity changes during flowback and production. (a) no stimulation (b) 30-MPa stimulation (c) 50-MPastimulation (d) number of stimulated (shear slip) natural fractures. Fracture properties: cohesion=0, sliding fric‐tion=0.6.
(a) (b)
Figure 9. Relative well productivity for wells of all orientations based on the fractures observed in all three wells. (a)Ambient condition. (b) After 20-MPa stimulation. Natural fractures are shown as poles to the fracture surfaces (blackdots). Green circles are computed optimal orientations of wells with highest productivity from natural fractures basedon the fracture and stress analysis.
Effective and Sustainable Hydraulic Fracturing1028
The above relative productivity modeling of natural fractures shows the conductivity ofnatural fractures increases significantly if the stimulation pressure is at or above the minimumhorizontal stress. This is because many of the natural fractures are non-optimally oriented.Assuming a connected fracture network exists, the conductivity increase could be a factor offive for the stimulated fracture network while stimulation pressure is ~130MPa or higher(assuming the pressure reaches all fractures).
5. Predicting the shape of the stimulated reservoir volume
Fracture stimulation modeling showed that the shear slip of natural fractures could be effectivein improving reservoir properties. Next, we need to reproduce the affected productive volumein the reservoir using the “shear stimulation” concept to enable more accurate productionprediction. At the present no commercial simulator can fully model this process in 3D,although some research simulators have been developed. It was decided to use two differentcommercial models to simulate both fracture network stimulation created by low-viscosityfrac fluid and the growth of the main hydraulic fracture. A commercial dual-porosity, dual-permeability simulator is used to simulate the flow property changes of natural fractures dueto the shear slip. A commercial hydraulic fracturing design and evaluation simulator is usedto model the geometry and conductivity of the principal hydraulic fracture filled withproppant. The modeling in two separate simulators is coupled by the fluid volume used forstimulation. The fluid volume leaked off in the shear-dilated natural fracture network wasestimated in the dual-permeability, dual-porosity flow simulator. By adjusting the pressure-dependent leak-off coefficient, the fluid volume leaked off in the hydraulic fracturing simu‐lator was matched with the fluid volume leaked into natural fractures networks estimated bythe flow simulator. The prediction of the stimulated reservoir volume is discussed in the restof this section and the hydraulic fracturing design will be discussed in next section.
To predict the extent and properties of the stimulated volume by a dual-permeability, dual-porosity simulator, a finely gridded model (Model A) was created based on the originalreservoir model. The main function of this model is to simulate the change in flow propertiesin every single frac stage during and immediately after injection. The model is initialized withaverage known reservoir characteristics such as matrix porosity and permeability, fracturepermeability and initial pressure, characterized from core and log analysis. Although differentcases have been tested in the study, only one of the most realistic cases will be discussed here:the average matrix porosity used in the initial model is ~7.4%, matrix permeability is 0.07 mDin all directions, and the initial fracture permeability is ~ 0.2 mD. The initial fracture permea‐bility is set close to the lower bound of fracture permeability based on core and log analysis.The orientations of the principal flow directions were chosen to correspond to the principaldirections of the fracture sets and of bedding, which also approximately corresponded to theprincipal stress directions.
The relative magnitudes of the permeability enhancements in different directions wereconstrained by the geomechanical analysis. A set of permeability-pressure tables for differentdirections were then used to describe the hysteretic rock behavior that results from shearfracture activation. Although the fracture properties during stimulation can be estimated as
Optimizing Hydraulic Fracturing Treatment Integrating Geomechanical Analysis and Reservoir Simulation for…http://dx.doi.org/10.5772/56384
1029
described in the previous section, it is better to calibrate and constrain the permeability-pressure relationship based on real lab or in-situ tests, e.g., using a pre-stimulation injectivitytest [4]. The injectivity test should ideally be conducted in the open hole using slow injectionto evaluate the potential natural fractures being stimulated, as permeability changes couldthen be interpreted based on the flow-rate/pressure changes along with the reservoir pressure.Because the D3 well has already been cased it was impossible to conduct such a test in the fieldbefore the actual treatment is carried out. Consequently, it was decided to produce a perme‐ability-pressure table based on experience from shale gas reservoirs. Based on this table, onfracture density in different directions and on the stress anisotropy, a composite transmissi‐bility multiplier was produced for the prediction of properties and extent of the stimulatedreservoir volume. Transmissibility multipliers were different for each of the I, J and K direc‐tions; those directions were aligned as discussed above with the primary structural fabric andstresses. The propagation of the pressure and fluid front in these directions can be controlledby modifying these multipliers.
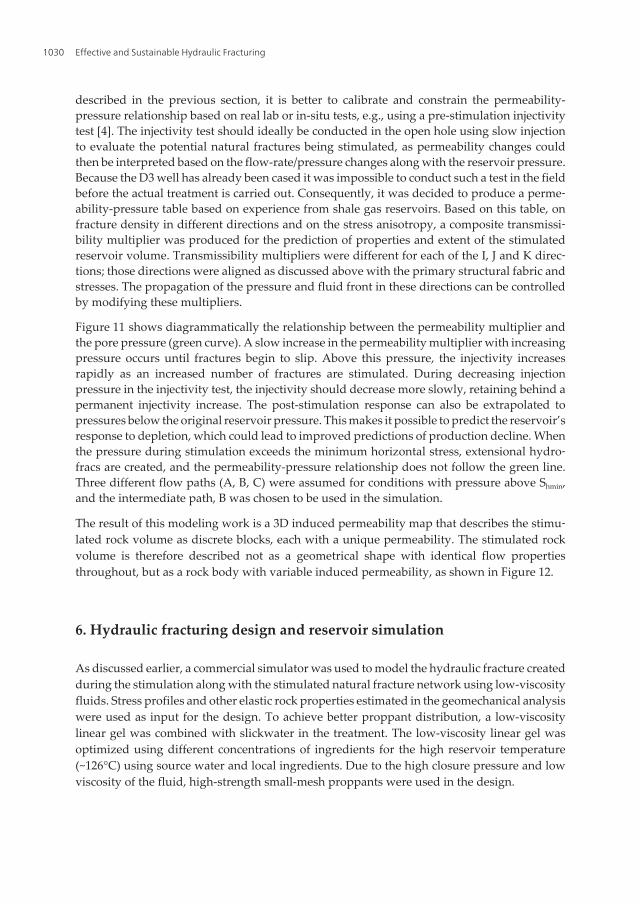
Figure 11 shows diagrammatically the relationship between the permeability multiplier andthe pore pressure (green curve). A slow increase in the permeability multiplier with increasingpressure occurs until fractures begin to slip. Above this pressure, the injectivity increasesrapidly as an increased number of fractures are stimulated. During decreasing injectionpressure in the injectivity test, the injectivity should decrease more slowly, retaining behind apermanent injectivity increase. The post-stimulation response can also be extrapolated topressures below the original reservoir pressure. This makes it possible to predict the reservoir’sresponse to depletion, which could lead to improved predictions of production decline. Whenthe pressure during stimulation exceeds the minimum horizontal stress, extensional hydro‐fracs are created, and the permeability-pressure relationship does not follow the green line.Three different flow paths (A, B, C) were assumed for conditions with pressure above Shmin,and the intermediate path, B was chosen to be used in the simulation.
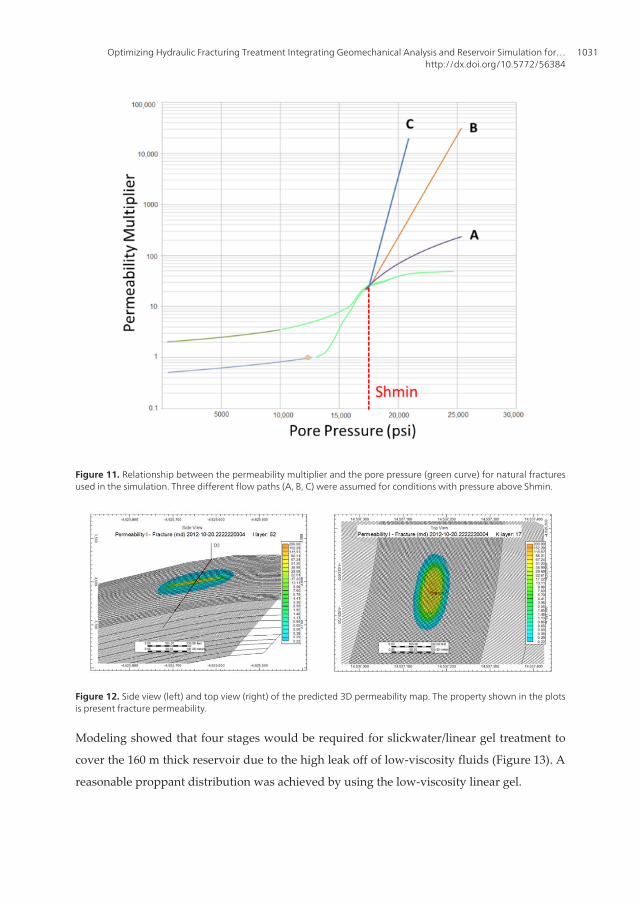
The result of this modeling work is a 3D induced permeability map that describes the stimu‐lated rock volume as discrete blocks, each with a unique permeability. The stimulated rockvolume is therefore described not as a geometrical shape with identical flow propertiesthroughout, but as a rock body with variable induced permeability, as shown in Figure 12.
6. Hydraulic fracturing design and reservoir simulation
As discussed earlier, a commercial simulator was used to model the hydraulic fracture createdduring the stimulation along with the stimulated natural fracture network using low-viscosityfluids. Stress profiles and other elastic rock properties estimated in the geomechanical analysiswere used as input for the design. To achieve better proppant distribution, a low-viscositylinear gel was combined with slickwater in the treatment. The low-viscosity linear gel wasoptimized using different concentrations of ingredients for the high reservoir temperature(~126°C) using source water and local ingredients. Due to the high closure pressure and lowviscosity of the fluid, high-strength small-mesh proppants were used in the design.
Effective and Sustainable Hydraulic Fracturing1030
Modeling showed that four stages would be required for slickwater/linear gel treatment to
cover the 160 m thick reservoir due to the high leak off of low-viscosity fluids (Figure 13). A
reasonable proppant distribution was achieved by using the low-viscosity linear gel.
Figure 11. Relationship between the permeability multiplier and the pore pressure (green curve) for natural fracturesused in the simulation. Three different flow paths (A, B, C) were assumed for conditions with pressure above Shmin.
Figure 12. Side view (left) and top view (right) of the predicted 3D permeability map. The property shown in the plotsis present fracture permeability.
Optimizing Hydraulic Fracturing Treatment Integrating Geomechanical Analysis and Reservoir Simulation for…http://dx.doi.org/10.5772/56384
1031
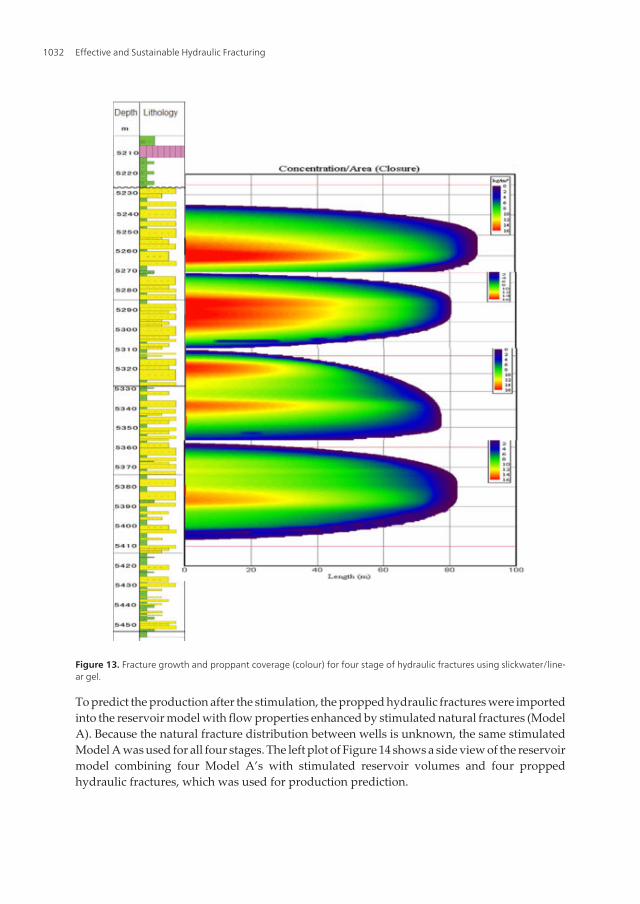
Figure 13. Fracture growth and proppant coverage (colour) for four stage of hydraulic fractures using slickwater/line‐ar gel.
To predict the production after the stimulation, the propped hydraulic fractures were importedinto the reservoir model with flow properties enhanced by stimulated natural fractures (ModelA). Because the natural fracture distribution between wells is unknown, the same stimulatedModel A was used for all four stages. The left plot of Figure 14 shows a side view of the reservoirmodel combining four Model A’s with stimulated reservoir volumes and four proppedhydraulic fractures, which was used for production prediction.
Effective and Sustainable Hydraulic Fracturing1032
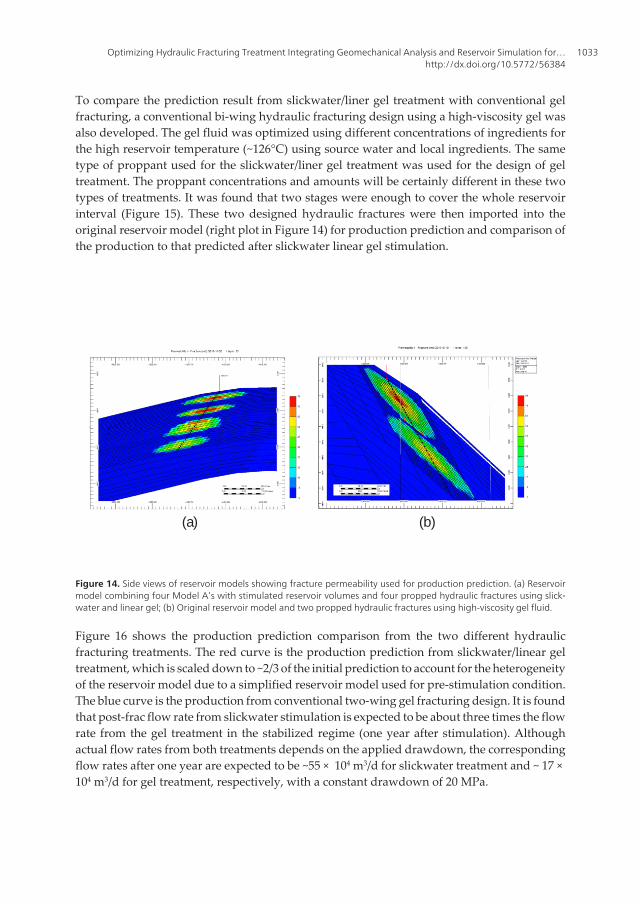
To compare the prediction result from slickwater/liner gel treatment with conventional gelfracturing, a conventional bi-wing hydraulic fracturing design using a high-viscosity gel wasalso developed. The gel fluid was optimized using different concentrations of ingredients forthe high reservoir temperature (~126°C) using source water and local ingredients. The sametype of proppant used for the slickwater/liner gel treatment was used for the design of geltreatment. The proppant concentrations and amounts will be certainly different in these twotypes of treatments. It was found that two stages were enough to cover the whole reservoirinterval (Figure 15). These two designed hydraulic fractures were then imported into theoriginal reservoir model (right plot in Figure 14) for production prediction and comparison ofthe production to that predicted after slickwater linear gel stimulation.
(a) (b)
Figure 14. Side views of reservoir models showing fracture permeability used for production prediction. (a) Reservoirmodel combining four Model A’s with stimulated reservoir volumes and four propped hydraulic fractures using slick‐water and linear gel; (b) Original reservoir model and two propped hydraulic fractures using high-viscosity gel fluid.
Figure 16 shows the production prediction comparison from the two different hydraulicfracturing treatments. The red curve is the production prediction from slickwater/linear geltreatment, which is scaled down to ~2/3 of the initial prediction to account for the heterogeneityof the reservoir model due to a simplified reservoir model used for pre-stimulation condition.The blue curve is the production from conventional two-wing gel fracturing design. It is foundthat post-frac flow rate from slickwater stimulation is expected to be about three times the flowrate from the gel treatment in the stabilized regime (one year after stimulation). Althoughactual flow rates from both treatments depends on the applied drawdown, the correspondingflow rates after one year are expected to be ~55 × 104 m3/d for slickwater treatment and ~ 17 ×104 m3/d for gel treatment, respectively, with a constant drawdown of 20 MPa.
Optimizing Hydraulic Fracturing Treatment Integrating Geomechanical Analysis and Reservoir Simulation for…http://dx.doi.org/10.5772/56384
1033
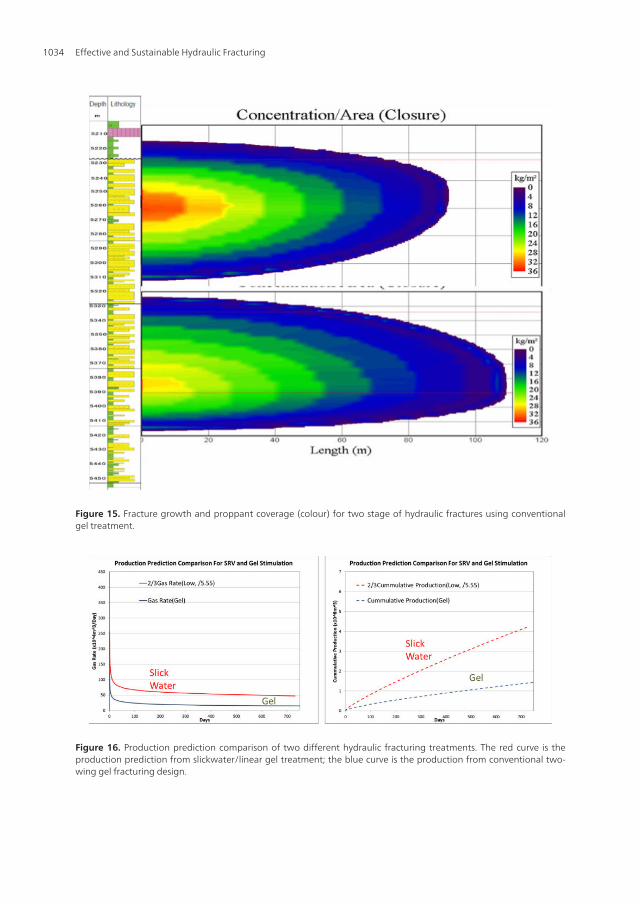
Figure 16. Production prediction comparison of two different hydraulic fracturing treatments. The red curve is theproduction prediction from slickwater/linear gel treatment; the blue curve is the production from conventional two-wing gel fracturing design.
Figure 15. Fracture growth and proppant coverage (colour) for two stage of hydraulic fractures using conventionalgel treatment.
Effective and Sustainable Hydraulic Fracturing1034

7. Injectivity test and stage 1 treatment
It was decided to test the slickwater/liner gel treatment in D3 well after the study was com‐pleted. A pre-stimulation injectivity test was performed through perforations prior to Stage 1and after the mini-frac test (Figure 17). Interestingly, the test showed the opposite behaviorfrom what one would expect if the stimulation enhances reservoir permeability. Later-stageinjectivity (during step-down) is lower than early stage injectivity (during step-up), rather thanhigher. Although there might be other reasons affect the test result, i.e., the un-stable injectionduring the whole test, it is believed the main reason was lack of access to natural fractures inthe tested interval and the high closure pressure because the test was conducted in a cased andperforated hole and after a mini-frac.
(a) (b)
Figure 17. Pre-stimulation injectivity test pressure curve (a) and injectivity interpretation (b).
The Stage 1 treatment was conducted using slickwater and linear gel after the injectivity test.However, a screen out was experienced at the end of the execution and tubing leakage wasdiscovered afterwards. Treatments in the other three zones had not occurred at the date ofwriting this paper. The stage 1 production test is still very promising, and it has been decidedto continue slickwater/linear gel treatment in other three stages after the tubing problem isfixed.
8. Discussion and conclusion
In this paper we have outlined a new workflow for simulation of a complex fracture networkcreated by stimulation using low-viscosity fluids in a fractured tight sandstone reservoir. Theworkflow is based on critically stressed fracture theory. This process of natural fracturestimulation is believed to be the underlying reason for the success in shale gas reservoirstimulation. The results suggested that there would be significantly higher production fromthis approach compared to conventional two-wing gel fracturing.
Optimizing Hydraulic Fracturing Treatment Integrating Geomechanical Analysis and Reservoir Simulation for…http://dx.doi.org/10.5772/56384
1035
There are, however, some uncertainties in the modeling of the natural fracture stimulation forthis fractured tight gas reservoir.
1. The pressure-permeability relationship used in modeling the permeability enhancementby slickwater stimulation is taken from a shale gas field. It is unclear whether the datafrom the analogue field drilled through mudstones will be applicable to the modeledfractured tight sandstone reservoir. Post-stimulation production simulation, or a pre-stimulation injectivity test in nearby wells in open hole could help to better constrain thisrelationship, hence improve the accuracy of the prediction.
2. Due to the lack of knowledge of fracture distribution between wells, the fracturesinterpreted from all three offset wells were used to predict the stimulation behavior ofnatural fractures, and it was assumed that a similar fracture distribution would be foundin all formations. In reality, the fracture distribution is likely to be different, dependingamong other things on the lithology and structural location. For example, it is alreadynoticed that there are fewer fractures in the lower part of the reservoir than in the upperpart in the D3 well. Intervals with dense fracture networks are more likely to benefit fromslickwater treatment compared to formations with no or very sparse fractures. A 3Ddescription of the fracture distribution is always preferred.
3. Micro-seismic imaging is not available in the study area. No wells are close enough towork as a monitoring well and surface monitoring is also impossible due to the great depthof the reservoir. The lack of microseismic data made it impossible to calibrate the predic‐tion of the shape of SRV.
The main uncertainty in gel frac productivity estimation comes from the propped fractureconductivity estimation. This conductivity is based on proppant testing in the laboratory. Theproppant inside fractures involves clogging, crashing and embedment over the productionperiod. There is no analytical method available to model these long-term effects on proppedfracture conductivity. An approximate conductivity damage factor has been used in this studyto consider these effects.
Although there are still some shortcomings with the workflow, it can assist in the assessmentof development concepts and the evaluation of stimulation enhancement options. Theanisotropy in the slickwater treatment can be reasonably well-predicted and applied into theproduction simulation, which provides a more robust prediction than a simple isotropy model.The new workflow can be used in naturally fractured shale gas, tight gas/oil and CBMreservoirs.
Acknowledgements
The authors wish to thank PetroChina Tarim Oil Company for providing us with the data andfor permission to publish this paper, and Baker Hughes internal support to carry out the work.
Effective and Sustainable Hydraulic Fracturing1036
Author details
Feng Gui1*, Khalil Rahman1, Daniel Moos2, George Vassilellis3, Chao Li3, Qing Liu4,Fuxiang Zhang5, Jianxin Peng5, Xuefang Yuan5 and Guoqing Zou5
*Address all correspondence to: [email protected]
1 Baker Hughes, Perth, Australia
2 Baker Hughes, Menlo Park, USA
3 Gaffney, Cline &Associates, Houston, USA
4 Baker Hughes, Beijing, China
5 PetroChina Tarim Oil Company, Korla, China
References
[1] Modeland, N, Buller, D, & Chong, K. K. Stimulation’s influence on production in theHaynesville Shale: a playwide examination of fracture-treatment variables that showeffect on production. In: proceedings of Canadian Unconventional Resources Confer‐ence, CSUG/SPE November (2011). Calgary, Alberta, Canada., 148940, 15-17.
[2] Maxwell, S. C, Pope, T, Cipolla, C, et al. Understanding hydraulic fracture variabilitythrough integrating microseismicity and seismic reservoir characterization. In: pro‐ceedings of SPE North American Unconventional Gas Conference and Exhibition,SPE June (2011). Woodlands, Texas, USA., 144207, 14-16.
[3] Sayers, C. and Le Calvez, J., (2010). Characterization of microseismic data in gasshales using the radius of Gyration tensor, SEG Expanded Abstract.
[4] Moos, D. Improving Shale Gas Production Using Geomechanics, Exploration & Pro‐duction- Oil & Gas Review (2011). , 9(2), 84-88.
[5] Zoback, M. D, Kohli, A, Das, I, & Mcclure, M. The importance of slow slip on faultsduring hydraulic fracturing stimulation of shale gas reservoirs. In: proceedings ofSPE Americas Unconventional Resources Conference, SPE June (2012). Pittsburgh,Pennsylvania, USA., 155476, 5-7.
[6] Mullen, M, & Enderlin, M. Is that frac job really breaking new rock or just pumpingdown a pre-existing plane of weakness?- the integration of geomechanics and hy‐draulic-fracture diagnostics. In: proceedings of 44th US Rock Mechanics Symposiumand 5th US-Canada Rock Mechanics Symposium, ARMA 10-285, 27-30 June (2010).Salt Lake City, UT, USA.
Optimizing Hydraulic Fracturing Treatment Integrating Geomechanical Analysis and Reservoir Simulation for…http://dx.doi.org/10.5772/56384
1037

[7] Moos, D, Vassilellis, G, & Cade, R. Predicting shale reservoir response to stimulationin the Upper Devonian of West Virginia. In: proceedings of SPE Annual TechnicalConference and Exhibition, SPE-145849, 30 October-2 November (2011). Denver, Col‐orado, USA.
[8] Vassilellis, G. D, Li, C, Moos, D, et al. Shale engineering application: the MAL-145Project in West Virginia. In: proceedings of Canadian Unconventional ResourcesConference, CSUG/SPE-November (2011). Calgary, Alberta, Canada., 146912, 15-17.
[9] Barton, C, Zoback, M. D, & Moos, D. Fluid Flow Along Potentially Active Faults inCrystalline Rock, Geology(1988). , 23(8), 683-686.
[10] Moos, D, & Barton, C. A. Modeling uncertainty in the permeability of stress-sensitivefractures. In: proceedings of 42nd US Rock Mechanics Symposium and 2nd U.S.-Can‐ada Rock Mechanics Symposium, ARMA June- 2 July (2008). San Francisco, USA.,08-312.
[11] Hossain, M. M, Rahman, M. K, & Rahman, S. S. A Shear Dilation Stimulation Modelfor Production Enhancement From Naturally Fractured Reservoirs, SPE 78355, SPEJournal; June , 2002-183.
[12] Moos, D, & Zoback, M. D. Utilization of Observations of Well Bore Failure to Con‐strain the Orientation and Magnitude of Crustal Stresses: Application to Continental,Deep Sea Drilling Project and Ocean Drilling Program Boreholes, Journal of Geo‐physical Research (1990). , 95, 9-305.
[13] Heidbach, O, Tingay, M, Barth, A, Reinecker, J, Kurfe, D, & Müller, B. The WorldStress Map database release (2008). doi:10.1594/GFZ.WSM.Rel2008.http://www.world-stress-map.org
Effective and Sustainable Hydraulic Fracturing1038