Optimization projects examples VKrasojevic
15
Examples of Supply Chain Optimization projects Initiated and Managed by Vladimir Krasojevic Due to confidentiality only projects older than 5 years included
-
Upload
vladimir-krasojevic -
Category
Documents
-
view
283 -
download
2
Transcript of Optimization projects examples VKrasojevic
Examples of Supply Chain Optimization projects Initiated and Managed by Vladimir Krasojevic
Due to confidentiality only projects older than 5 years included
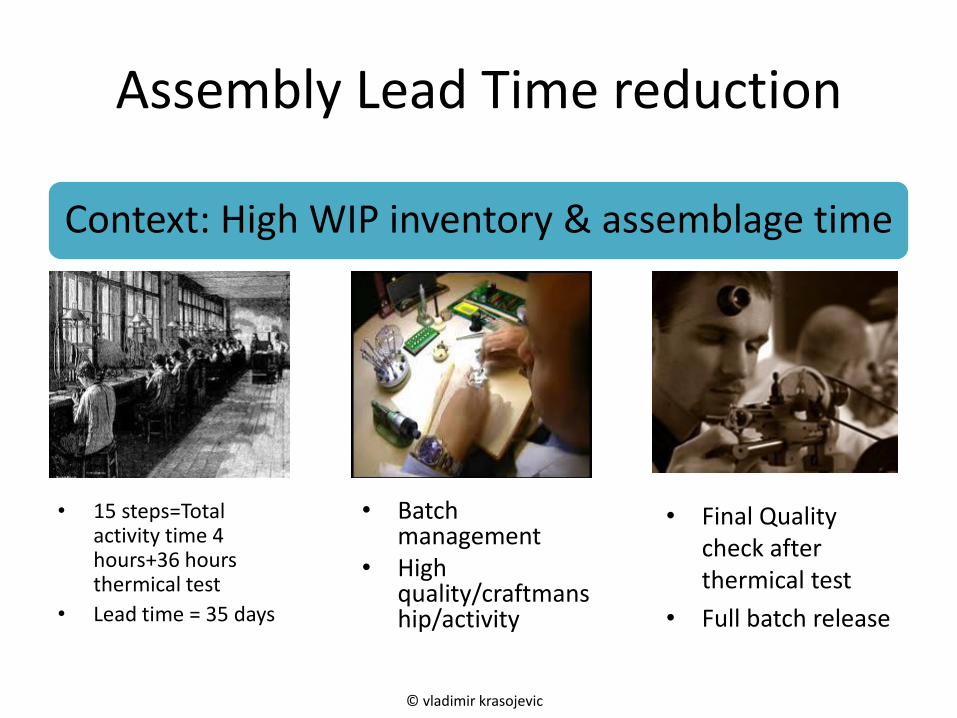
Assembly Lead Time reduction
Context: High WIP inventory & assemblage time
• 15 steps=Total activity time 4 hours+36 hours thermical test
• Lead time = 35 days
• Batch management
• High quality/craftmanship/activity
• Final Quality check after thermical test
• Full batch release
© vladimir krasojevic
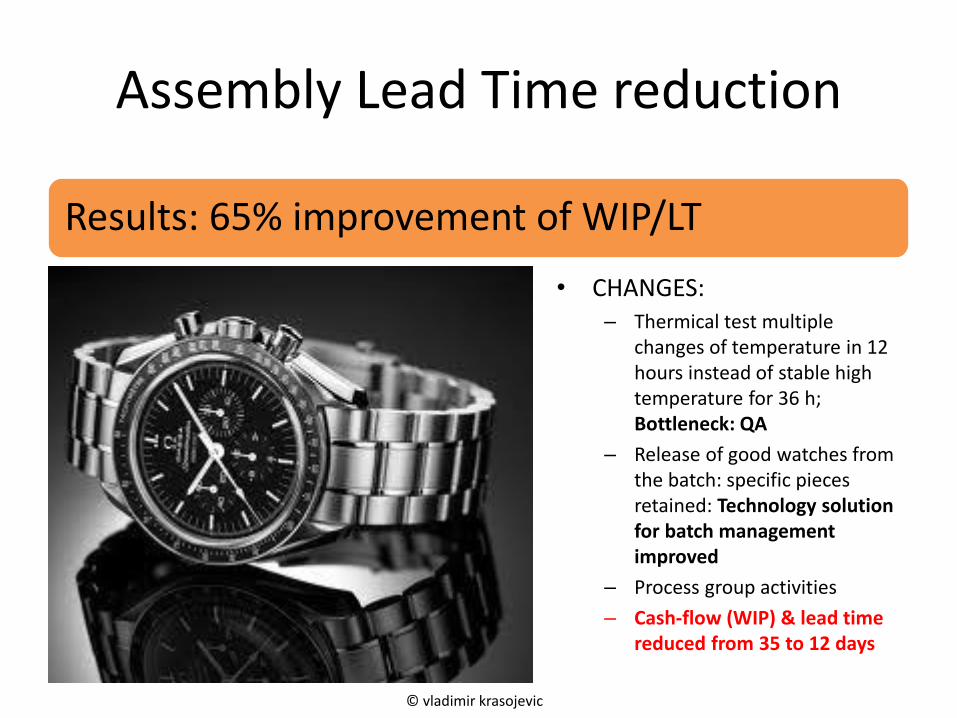
Assembly Lead Time reduction
Results: 65% improvement of WIP/LT
• CHANGES: – Thermical test multiple
changes of temperature in 12 hours instead of stable high temperature for 36 h; Bottleneck: QA
– Release of good watches from the batch: specific pieces retained: Technology solution for batch management improved
– Process group activities
– Cash-flow (WIP) & lead time reduced from 35 to 12 days
© vladimir krasojevic
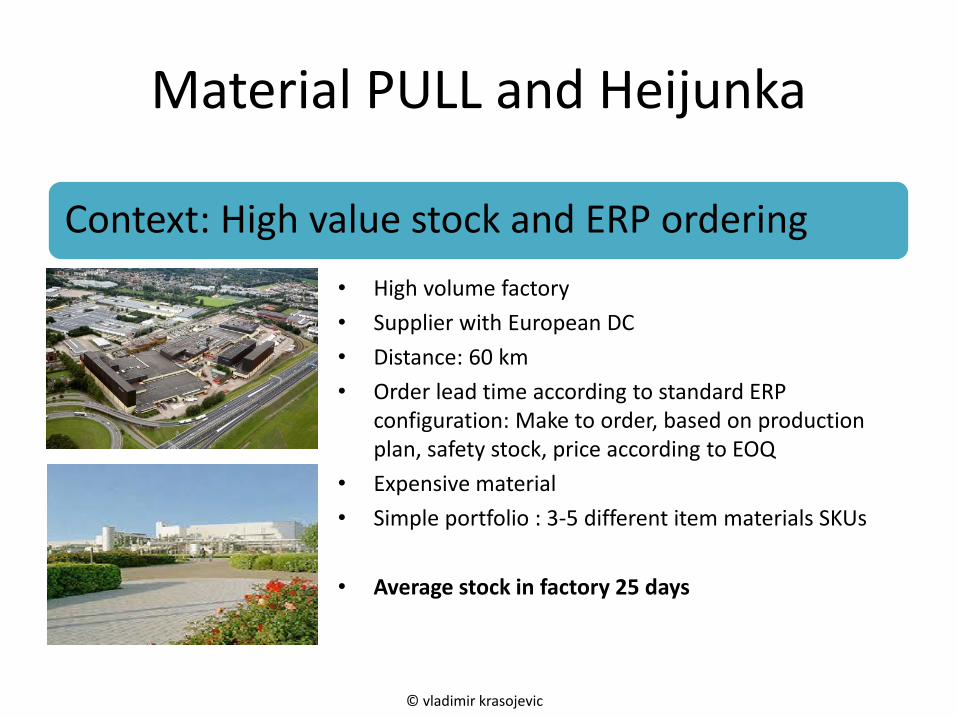
Material PULL and Heijunka
• High volume factory
• Supplier with European DC
• Distance: 60 km
• Order lead time according to standard ERP configuration: Make to order, based on production plan, safety stock, price according to EOQ
• Expensive material
• Simple portfolio : 3-5 different item materials SKUs
• Average stock in factory 25 days
Context: High value stock and ERP ordering
© vladimir krasojevic
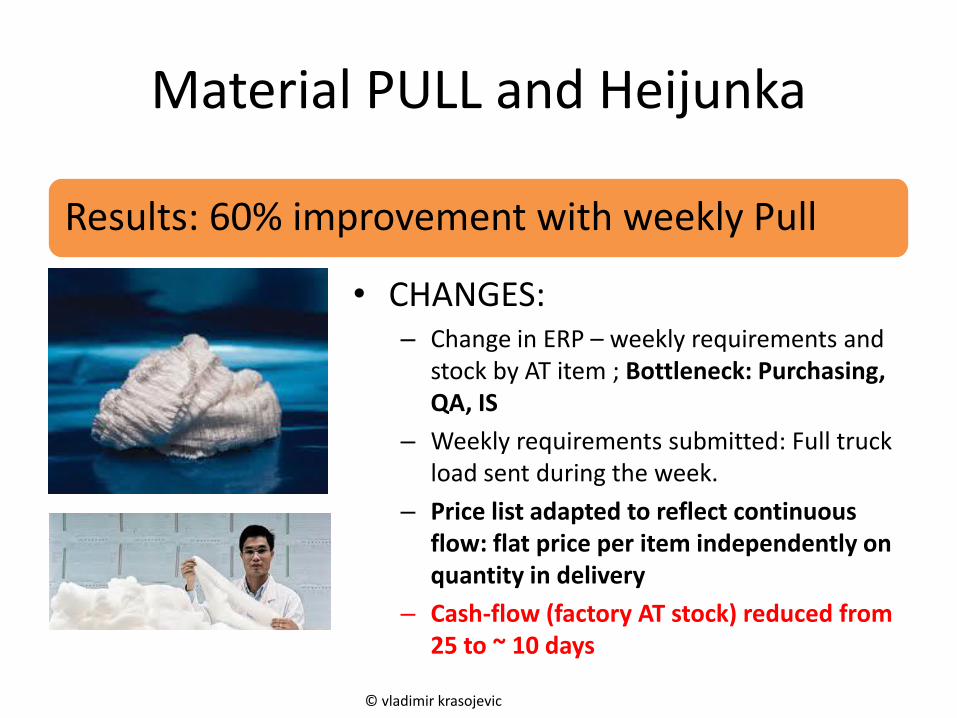
Material PULL and Heijunka
Results: 60% improvement with weekly Pull
• CHANGES: – Change in ERP – weekly requirements and
stock by AT item ; Bottleneck: Purchasing, QA, IS
– Weekly requirements submitted: Full truck load sent during the week.
– Price list adapted to reflect continuous flow: flat price per item independently on quantity in delivery
– Cash-flow (factory AT stock) reduced from 25 to ~ 10 days
© vladimir krasojevic
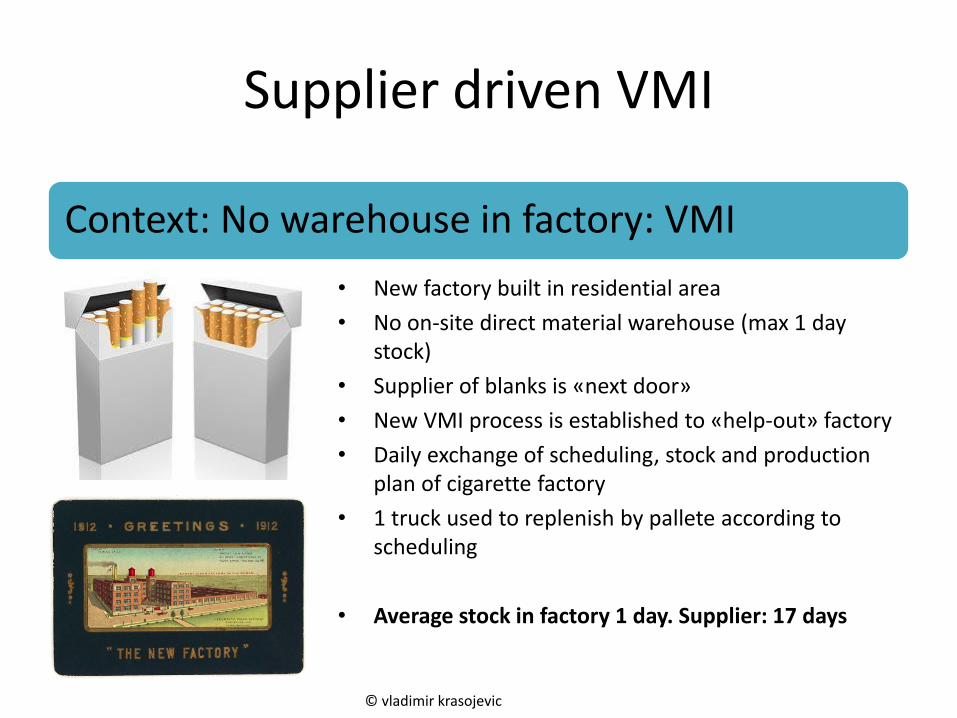
Supplier driven VMI
Context: No warehouse in factory: VMI
• New factory built in residential area
• No on-site direct material warehouse (max 1 day stock)
• Supplier of blanks is «next door»
• New VMI process is established to «help-out» factory
• Daily exchange of scheduling, stock and production plan of cigarette factory
• 1 truck used to replenish by pallete according to scheduling
• Average stock in factory 1 day. Supplier: 17 days
© vladimir krasojevic
Supplier driven VMI
Results: 97% (60%) less vs. other factories
• CHANGES: – Daily exchange of stock and
scheduling in EXCEL; Bottleneck: IS integration
– Expert (informal) rules for printing at supplier(slow movers 25 days, fast movers 3 days).
– Commitment & price through daily orders: no remuneration for Supplier stock (recompensated by lower paper stock)
– Cash-flow (factory blanks stock) 1 instead of 45 days (18 with supplier)
© vladimir krasojevic
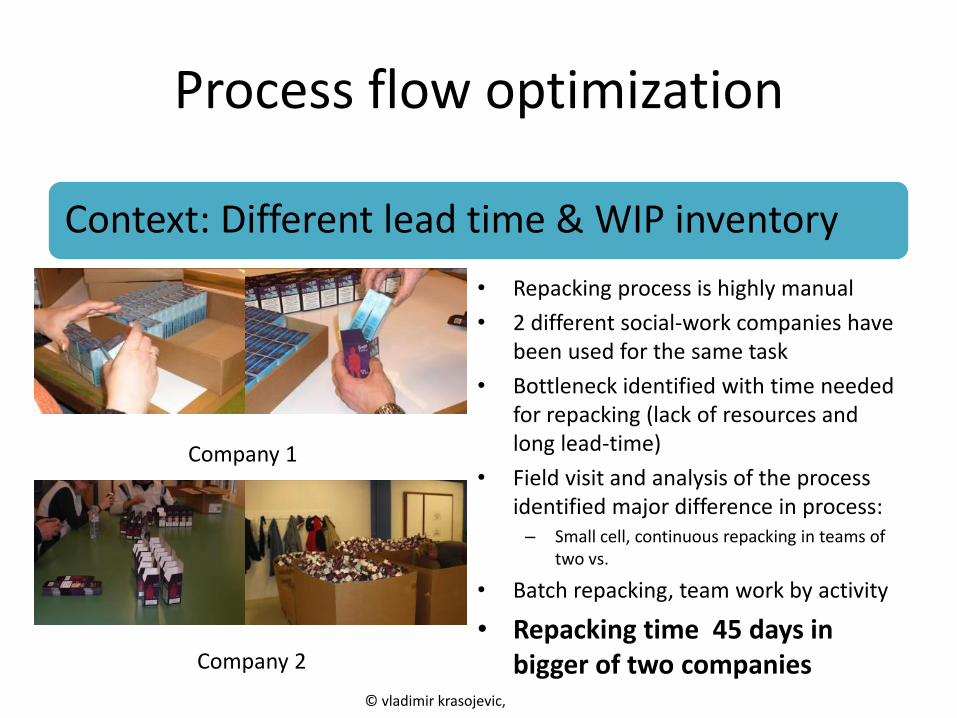
Process flow optimization
Context: Different lead time & WIP inventory
• Repacking process is highly manual
• 2 different social-work companies have been used for the same task
• Bottleneck identified with time needed for repacking (lack of resources and long lead-time)
• Field visit and analysis of the process identified major difference in process: – Small cell, continuous repacking in teams of
two vs.
• Batch repacking, team work by activity
• Repacking time 45 days in bigger of two companies
Company 1
Company 2
© vladimir krasojevic,
Process flow optimization
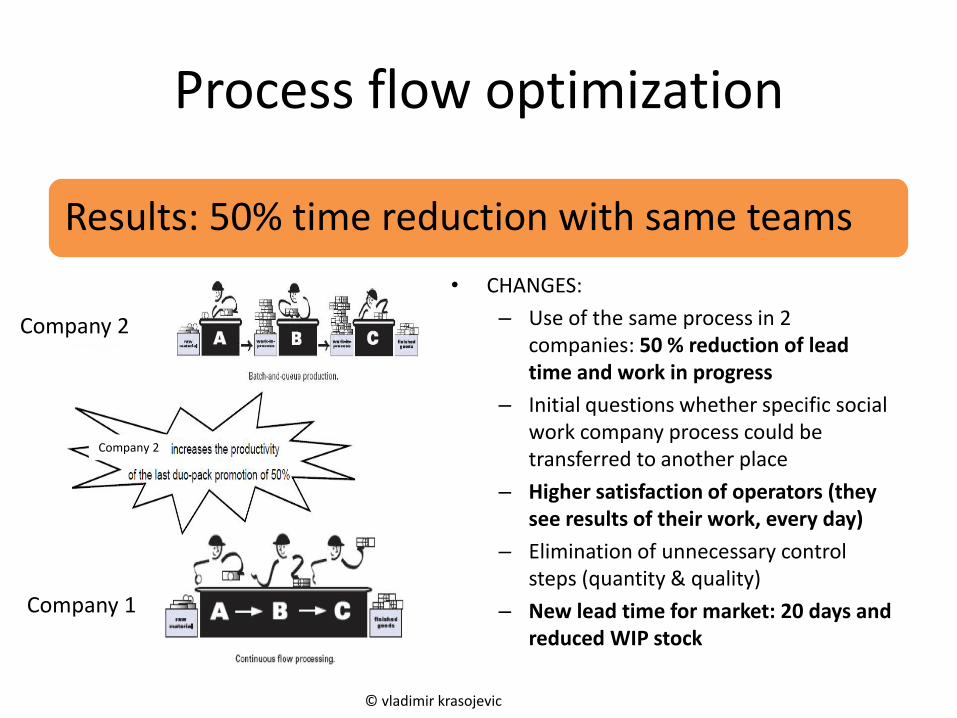
Results: 50% time reduction with same teams
• CHANGES:
– Use of the same process in 2 companies: 50 % reduction of lead time and work in progress
– Initial questions whether specific social work company process could be transferred to another place
– Higher satisfaction of operators (they see results of their work, every day)
– Elimination of unnecessary control steps (quantity & quality)
– New lead time for market: 20 days and reduced WIP stock
Company 1
Company 2
Company 2
© vladimir krasojevic
Cost-to-serve optimization
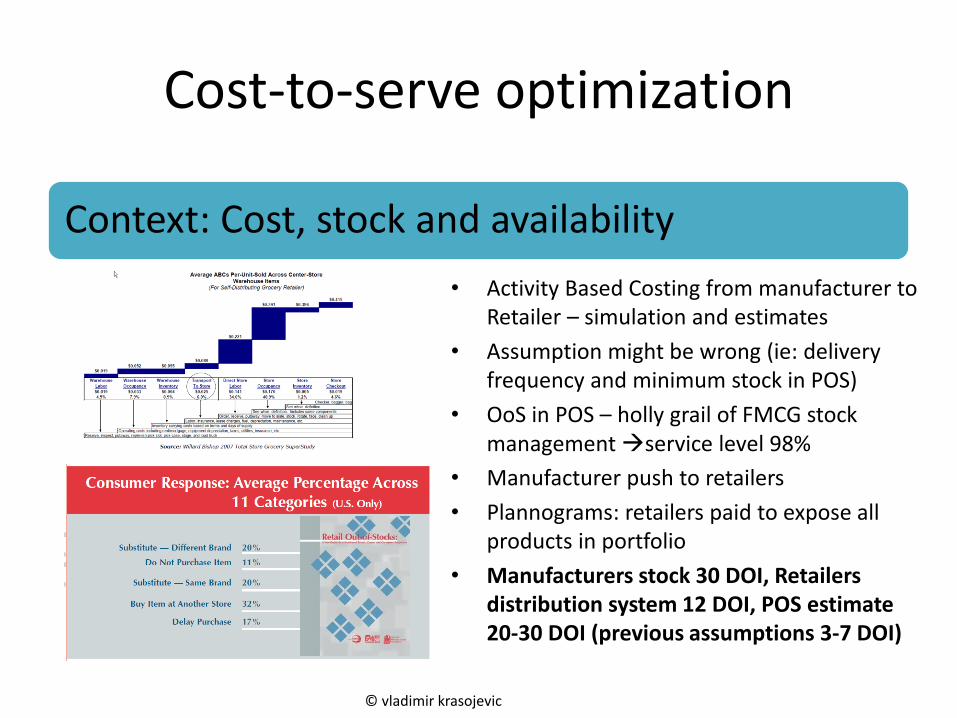
Context: Cost, stock and availability
• Activity Based Costing from manufacturer to Retailer – simulation and estimates
• Assumption might be wrong (ie: delivery frequency and minimum stock in POS)
• OoS in POS – holly grail of FMCG stock management service level 98%
• Manufacturer push to retailers
• Plannograms: retailers paid to expose all products in portfolio
• Manufacturers stock 30 DOI, Retailers distribution system 12 DOI, POS estimate 20-30 DOI (previous assumptions 3-7 DOI)
© vladimir krasojevic
Cost-to-serve optimization
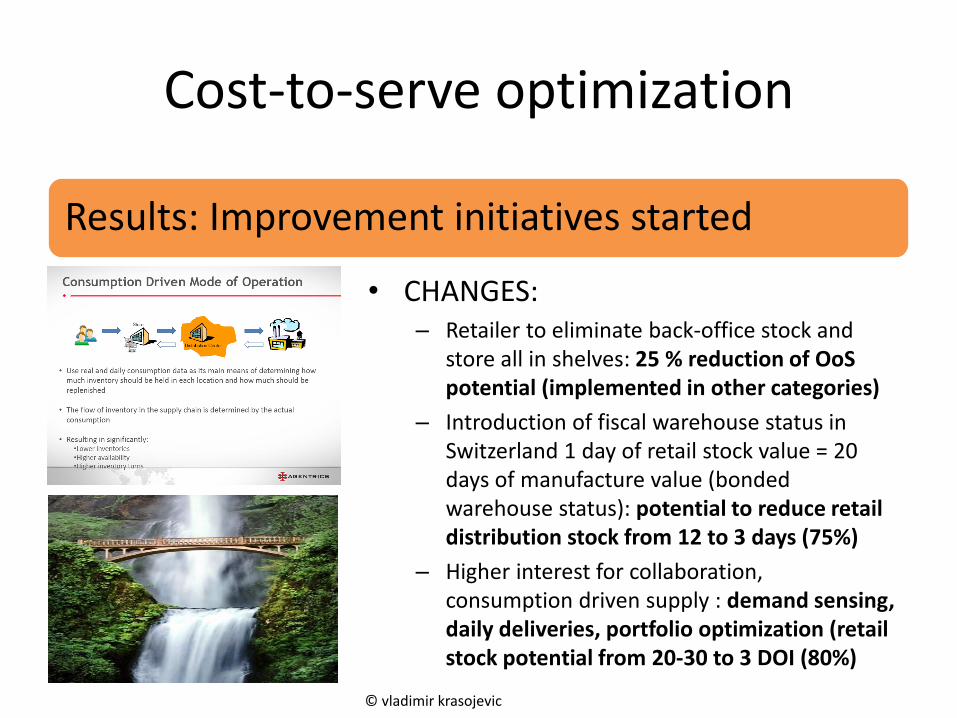
Results: Improvement initiatives started
• CHANGES: – Retailer to eliminate back-office stock and
store all in shelves: 25 % reduction of OoS potential (implemented in other categories)
– Introduction of fiscal warehouse status in Switzerland 1 day of retail stock value = 20 days of manufacture value (bonded warehouse status): potential to reduce retail distribution stock from 12 to 3 days (75%)
– Higher interest for collaboration, consumption driven supply : demand sensing, daily deliveries, portfolio optimization (retail stock potential from 20-30 to 3 DOI (80%)
© vladimir krasojevic
Replenishment and Stock Optimization
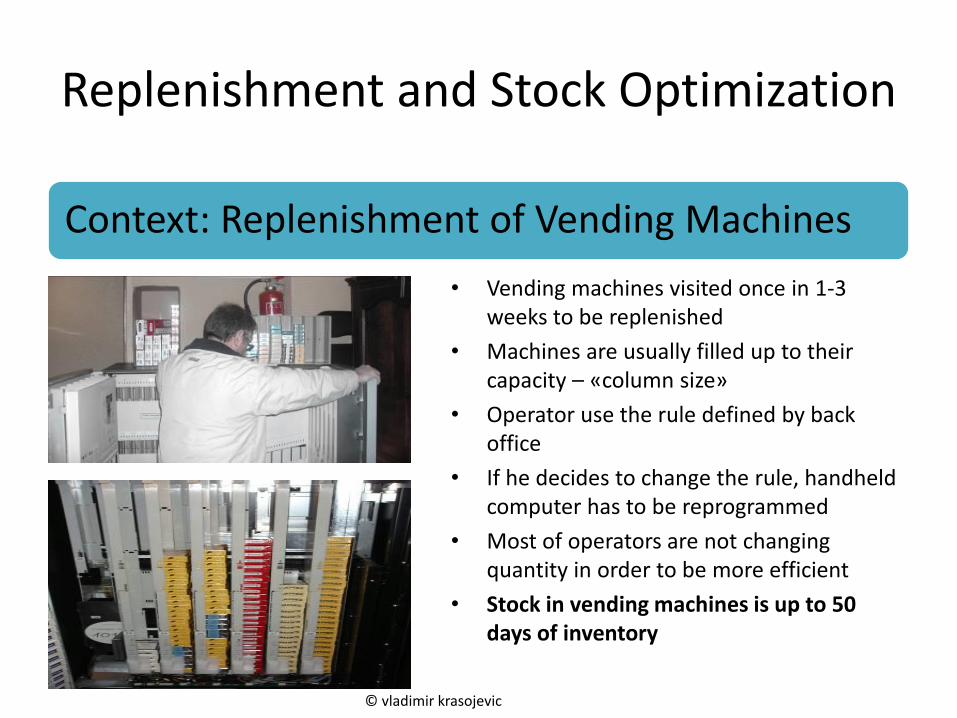
Context: Replenishment of Vending Machines
• Vending machines visited once in 1-3 weeks to be replenished
• Machines are usually filled up to their capacity – «column size»
• Operator use the rule defined by back office
• If he decides to change the rule, handheld computer has to be reprogrammed
• Most of operators are not changing quantity in order to be more efficient
• Stock in vending machines is up to 50 days of inventory
© vladimir krasojevic
Replenishment and Stock Optimization
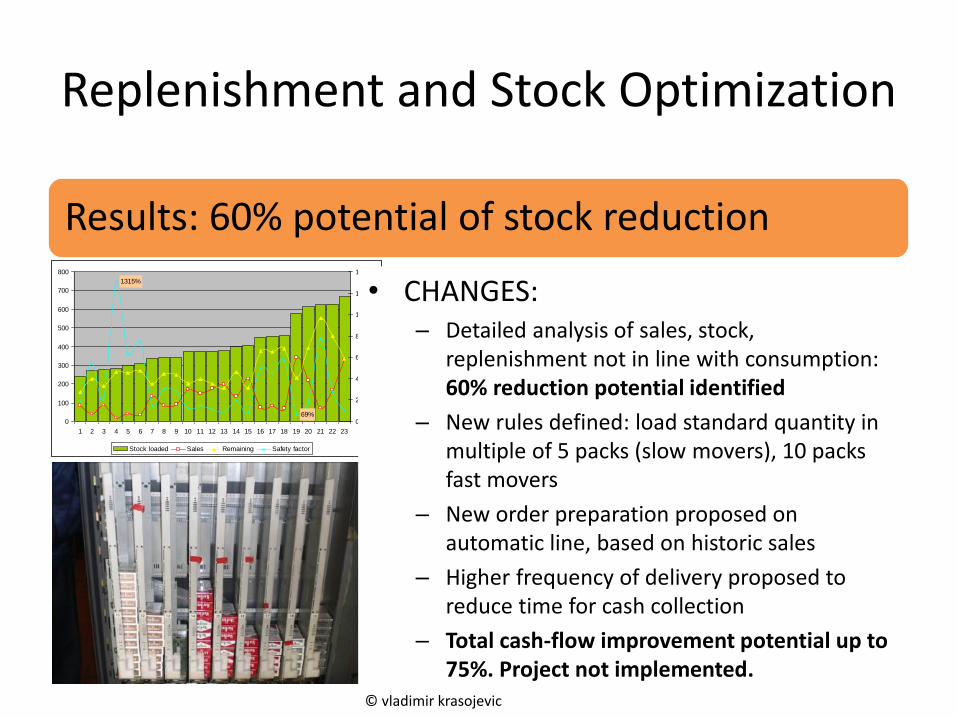
Results: 60% potential of stock reduction
69%
1315%
0
100
200
300
400
500
600
700
800
1 2 3 4 5 6 7 8 9 10 11 12 13 14 15 16 17 18 19 20 21 22 23
0%
200%
400%
600%
800%
1000%
1200%
1400%
Stock loaded Sales Remaining Safety factor
• CHANGES: – Detailed analysis of sales, stock,
replenishment not in line with consumption: 60% reduction potential identified
– New rules defined: load standard quantity in multiple of 5 packs (slow movers), 10 packs fast movers
– New order preparation proposed on automatic line, based on historic sales
– Higher frequency of delivery proposed to reduce time for cash collection
– Total cash-flow improvement potential up to 75%. Project not implemented.
© vladimir krasojevic
Direct Store Deliveries Optimization
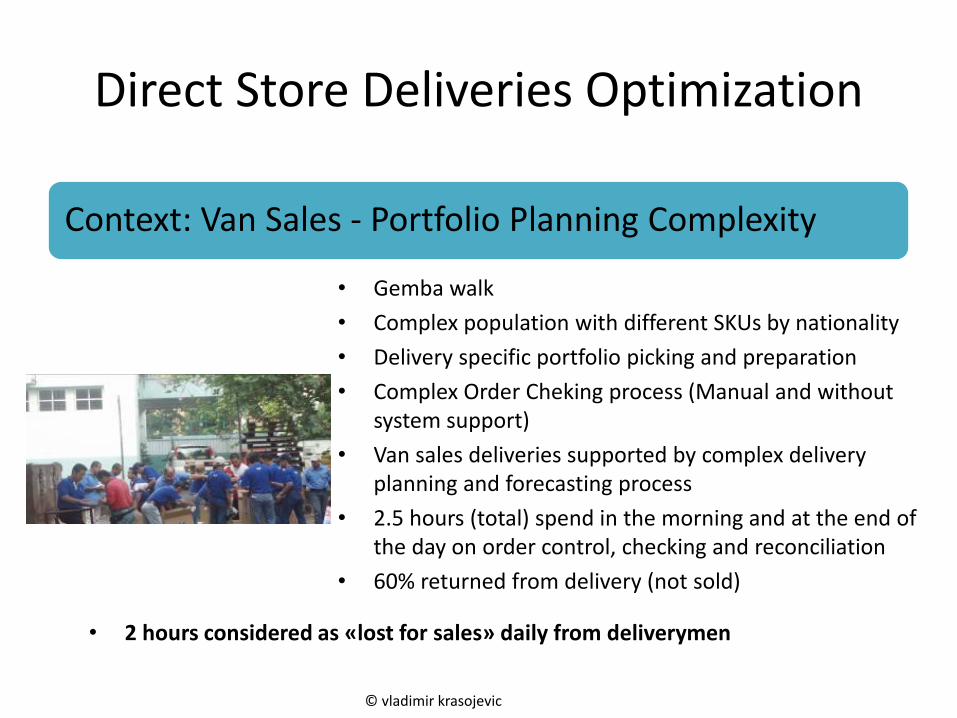
Context: Van Sales - Portfolio Planning Complexity
• Gemba walk
• Complex population with different SKUs by nationality
• Delivery specific portfolio picking and preparation
• Complex Order Cheking process (Manual and without system support)
• Van sales deliveries supported by complex delivery planning and forecasting process
• 2.5 hours (total) spend in the morning and at the end of the day on order control, checking and reconciliation
• 60% returned from delivery (not sold)
© vladimir krasojevic
• 2 hours considered as «lost for sales» daily from deliverymen
Direct Store Deliveries Optimization
Results: 2 hours more for sales, better FA, low return
• CHANGES: – Standard portfolio for every
delivery
– Every load identical: Heijunka
– Forecast on returned vs loaded to understand optimal portfolio
– 2 hours eliminated as non-value added and used for extra sales (25% productivity improvement)
– Returned goods non delivered 50% reduction
– Extra sales (not claimed)
© vladimir krasojevic