
optimization of working capital for construction projects
6
International Research Journal of Engineering and Technology (IRJET) e-ISSN: 2395 -0056 Volume: 02 Issue: 03 | June-2015 www.irjet.net p-ISSN: 2395-0072 © 2015, IRJET.NET- All Rights Reserved Page 942 OPTIMIZATION OF WORKING CAPITAL FOR CONSTRUCTION PROJECTS - BY USING KARL PEARSON’S CO-RELATION CO-EFFICIENT METHOD Sagar Pulli 1 , S.S. Jain 2 1 Sagar G. Pulli, Civil Engineering Department, Sinhgad Warje, Pune, India 2 Asst.Prof. S.S. Jain, Civil Engineering Department, Sinhgad Vadgao, Pune, India ---------------------------------------------------------------------***--------------------------------------------------------------------- Abstract - Construction industry growth has been evident in almost all the developing national economies in the recent past, thus, encouraging for considerable growth in the small, medium and large construction companies, necessitating better management of their current assets and current liabilities. The present research is made at identifying the factors influencing working capital for construction projects. It consists of method to find optimum working capital. It also consists of a comprehensive review of literature available on the subject, collection of financial data of the ongoing construction project sites. The theory includes effective description of all ingredients taken for calculation of Working Capital for the said Project. Analyzing these factors is very much useful during the project execution stage to control, monitor and improve the performance of the construction project sites. The factors identified from the previous researches and personal findings are; outstanding’s, total stock, vendor credits, capital charges, head office overheads, and certified invoice and the relationships among these sites. The Analytical part of the paper includes the calculation of Working Capital by use of Formal Method like – (WORKING CAPITAL=CURRENT ASSETS – CURRENT LIABILITIES) to obtain the result for the working capital for the Project. A working capital model has been prepared which is useful to predict and anticipate the working capital requirements at the company level. For the further part of Optimization of Working Capital we will use the Mathematical modeling by Using Karl Pearson’s Co-relation Co-efficient Method in order to reduce the Working Capital required for the said project. Key Words: Working Capital(WC), Current Assets (CA), Current Liabilities (CL), Karl Pearson’s Co- relation Co-efficient Method, Backward Path by Using Karl Pearson’s Co-relation Co-efficient Method etc. 1. INTRODUCTION The working capital meets the short-term financial requirements of a business enterprise. It is a trading capital, not retained in the business in a particular form for longer than a year. The money invested in it changes form and substance during the normal course of business operations. The need for maintaining an adequate working capital can hardly be questioned. Just as circulation of blood is very necessary in the human body to maintain life, the flow of funds is very necessary to maintain business. If it becomes weak, the business can hardly prosper and survive. Working capital starvation is generally credited as a major cause of small business failure in many developed and developing countries. High working capital ratios often mean that too much money is tied up in receivables and inventories. Typically, the knee-jerk reaction to this problem is to apply the “big squeeze” by aggressively collecting receivables, ruthlessl y delaying payments to suppliers and cutting inventories across the board. But that only attacks the symptoms of working capital issues, not the root causes. A more effective approach is to fundamentally rethink and streamline key processes across the value chain. This will not only free up cash but lead to significant cost reductions at the same time. Working capital, also referred to as net working capital (NWC), is an absolute measure of a company’s current operative capital employed and is defined as: (Net) Working capital = Current assets – Current liabilities Current assets are assets which are expected to be sold or otherwise used within one fiscal year. Typically, current assets include cash, cash equivalents, accounts receivable, inventory, prepaid accounts which will be used within a year, and short-term investments.
Transcript of optimization of working capital for construction projects

International Research Journal of Engineering and Technology (IRJET) e-ISSN: 2395 -0056
Volume: 02 Issue: 03 | June-2015 www.irjet.net p-ISSN: 2395-0072
© 2015, IRJET.NET- All Rights Reserved Page 942
OPTIMIZATION OF WORKING CAPITAL FOR CONSTRUCTION PROJECTS
- BY USING KARL PEARSON’S CO-RELATION CO-EFFICIENT METHOD
Sagar Pulli1, S.S. Jain2
1 Sagar G. Pulli, Civil Engineering Department, Sinhgad Warje, Pune, India 2 Asst.Prof. S.S. Jain, Civil Engineering Department, Sinhgad Vadgao, Pune, India
---------------------------------------------------------------------***---------------------------------------------------------------------Abstract - Construction industry growth has been
evident in almost all the developing national economies
in the recent past, thus, encouraging for considerable
growth in the small, medium and large construction
companies, necessitating better management of their
current assets and current liabilities. The present
research is made at identifying the factors influencing
working capital for construction projects. It consists of
method to find optimum working capital. It also
consists of a comprehensive review of literature
available on the subject, collection of financial data of
the ongoing construction project sites.
The theory includes effective description of all
ingredients taken for calculation of Working Capital for
the said Project. Analyzing these factors is very much
useful during the project execution stage to control,
monitor and improve the performance of the
construction project sites. The factors identified from
the previous researches and personal findings are;
outstanding’s, total stock, vendor credits, capital
charges, head office overheads, and certified invoice
and the relationships among these sites.
The Analytical part of the paper includes the
calculation of Working Capital by use of Formal Method
like – (WORKING CAPITAL=CURRENT ASSETS –
CURRENT LIABILITIES) to obtain the result for the
working capital for the Project. A working capital
model has been prepared which is useful to predict and
anticipate the working capital requirements at the
company level. For the further part of Optimization of
Working Capital we will use the Mathematical modeling
by Using Karl Pearson’s Co-relation Co-efficient Method
in order to reduce the Working Capital required for the
said project.
Key Words: Working Capital(WC), Current Assets
(CA), Current Liabilities (CL), Karl Pearson’s Co-
relation Co-efficient Method, Backward Path by Using
Karl Pearson’s Co-relation Co-efficient Method etc.
1. INTRODUCTION The working capital meets the short-term financial requirements of a business enterprise. It is a trading capital, not retained in the business in a particular form for longer than a year. The money invested in it changes form and substance during the normal course of business operations. The need for maintaining an adequate working capital can hardly be questioned. Just as circulation of blood is very necessary in the human body to maintain life, the flow of funds is very necessary to maintain business. If it becomes weak, the business can hardly prosper and survive. Working capital starvation is generally credited as a major cause of small business failure in many developed and developing countries.
High working capital ratios often mean that too much money is tied up in receivables and inventories. Typically, the knee-jerk reaction to this problem is to apply the “big squeeze” by aggressively collecting receivables, ruthlessly delaying payments to suppliers and cutting inventories across the board. But that only attacks the symptoms of working capital issues, not the root causes. A more effective approach is to fundamentally rethink and streamline key processes across the value chain. This will not only free up cash but lead to significant cost reductions at the same time. Working capital, also referred to as net working capital (NWC), is an absolute measure of a company’s current operative capital employed and is defined as: (Net) Working capital = Current assets – Current liabilities Current assets are assets which are expected to be sold or otherwise used within one fiscal year. Typically, current assets include cash, cash equivalents, accounts receivable, inventory, prepaid accounts which will be used within a year, and short-term investments.

International Research Journal of Engineering and Technology (IRJET) e-ISSN: 2395 -0056
Volume: 02 Issue: 03 | June-2015 www.irjet.net p-ISSN: 2395-0072
© 2015, IRJET.NET- All Rights Reserved Page 943
Current liabilities are considered as liabilities of the business that are to be settled in cash within the fiscal year. Current liabilities include accounts payable for goods, services or supplies, short-term loans, long-term loans with maturity within one year, dividends and interest payable, or accrued liabilities such as accrued taxes.
2. LITERATURE REVIEW: Companies must be as concerned with minimizing cash on the balance sheet as they are with reducing accounts receivable and minimizing excess inventory. In today’s low interest rate environment, it is impossible for idle cash to earn more than the cost of raising it. Therefore, unused cash has a negative impact on the balance sheet. Additionally, cash on the balance sheet increases a firm’s asset base.[4](R. Navon (1996)) 2.1 WORKING CAPITAL CYCLE: Cash flows in a cycle into, around and out of a business. It is the business's life blood and every manager's primary task is to help keep it flowing and to use the cash flow to generate profits. If a business is operating profitably, then it should, in theory, generate cash surpluses. If it doesn't generate surpluses, the business will eventually run out of cash and expire. There are two elements in the business cycle that absorb cash - Inventory (stocks and work-in-progress) and Receivables (debtors owing you money). The main sources of cash are Payables (your creditors) and Equity and Loans [1] (Fred (2002)).
Fig1. Working Capital Cycle The challenge is to determine the right amount of cash. Unpredictable cash flows, like those related to invoice-based commercial activity, weaken even the best cash forecast. The more uncertainty a company faces in its cash flow, the bigger the cash cushion it requires, and the less efficient its use of cash. Therefore, measuring cash-flow
uncertainty provides a basis for pinpointing the cash needed to satisfy working capital requirements. 2.2 FACTORS OF WORKING CAPITAL Current assets and current liabilities include three accounts which are of special importance. These accounts represent the areas of the business where managers have the most direct impact. The ingredients of working capital are as below:-
i. CAPITAL CHARGES (CC): The mean amount that has been paid as the interest charges on the current assets and the fixed assets for all the project sites. This is the amount which is mostly contributing for the working capital requirements, it can be controlled by efficiently optimizing the current assets involved in the projects sites, though the interest rates charged by the banks remains uncontrolled.
ii. OUTSTANDINGS (OUT): The outstandings are found to be less in the initial stages of the project than the final stages. Hence, outstandings contribute more to the working capital requirements of the projects sites and to optimize the working capital, the management’s goal shall be to achieve zero outstandings.
iii. STOCK (STO): This is an important element in the operating cycle of the working capital where the cash has been tied up as material for the production of the goods, hence this factor has to be controlled by the contractors by reducing the duration of being in the form of material and by adopting certain efficient inventory management practices like just in time etc.
iv. VENDOR CREDITS (VC): This is nothing but the current liabilities falling within 12 month period. This data is collected to mark the performance and ability of the organizations in convincing the creditors. [2] Hassim et al (2003) stated that if the credit period exceeds the duration between beginning of project and the first payment, there would be no effect of the material cost on the working capital requirement. So credit period given to the suppliers has effect on the working capital and proper care shall be taken in making the terms of payment to the suppliers.
v. CERTIFIED INVOICE (CI): The mean invoice certified for all the project sites is affecting the funds that have been employed and has significant influence on the capital requirements, and it has been observed that only industrial projects are performing well in achieving full certification of the invoice raised with a very less deviation. To optimize working capital, the management should achieve hundred percent certification (100%), so that the amount certified

International Research Journal of Engineering and Technology (IRJET) e-ISSN: 2395 -0056
Volume: 02 Issue: 03 | June-2015 www.irjet.net p-ISSN: 2395-0072
© 2015, IRJET.NET- All Rights Reserved Page 944
will be paid in a month, else the capital charges on the investment have to be beard by the construction firms.
vi. HEAD OFFICE OVERHEADS (HOH): These are the expenses incurred by the operating local office and the headquarters of the companies. Hence certain steps have to be taken by the firms to cut down these overhead costs without harming the corporate value of the firm. 2.3 METHODOLOGY There are various methods for analysis of the variables and constraints of the working capital in present scenario. But for the Optimum Working capital calculation we will be using the following method for analysis part as mentioned below:- 2.3.1 KARL PEARSON’S CORRELATION COEFFICIENT METHOD Karl Pearson’s Product-Moment Correlation Coefficient or simply Pearson’s Correlation Coefficient for short, is one of the important methods used in Statistics to measure Correlation between two variables. Karl Pearson was a British mathematician, statistician, lawyer and a eugenicist. He established the discipline of mathematical statistics. He founded the world’s first statistics department in the University of London in the year 1911. He along with his colleagues Weldon and Galton founded the journal “Biometrika” whose object was the development of statistical theory. The Correlation between two variables X and Y, which are measured using Pearson’s Coefficient, give the values between +1 and -1. When measured in population the Pearson’s Coefficient is designated the value of “r”. But, when studying a sample, it is designated the letter r. It is therefore sometimes called Pearson’s r. Pearson’s coefficient reflects the linear relationship between two variables. As mentioned above if the correlation coefficient is +1 then there is a perfect positive linear relationship between variables, and if it is -1 then there is a perfect negative linear relationship between the variables and 0 denotes that there is no relationship between the two variables. The degrees -1, +1 and 0 are theoretical results and are not generally found in normal circumstances. That means the results cannot be more than -1, +1. These are the upper and the lower limits. The correlation coefficient r (also called Pearson's product moment correlation after Karl Pearson) is calculated by
Where, X -Variable X for Calculating the Co-relation X’- Mean of variables of X Y- Variable Y for Calculating the Co-relation Y’- Mean of variables of Y N- No. of Observations Assumptions: • linear relationship between x and y • continuous random variables • both variables must be normally distributed • x and y must be independent of each other 3. CASE-STUDY
3.1 INTRODUCTION Now for the Purpose of case study we will consider details of Projects that was completed in Solapur (Godhubai VIDI Gharkul Mass Housing )and Hyderabad ( Mass Housing under JNNURM scheme):- Table No 1- Site Details for Case Study
Sr.No. Description Of Item
Site 1 (in Lakhs)
Site 2 (in Lakhs)
1 Total Work Done in Rs.Lakhs
554.71 294.42
3 VC of WD 10.26 7.24
4 OUT of WD 39.22 31.71
5 STO of WD 0.00 3.09
6 CC of WD 14.09 17.67
7 CI of WD 554.71 287.44
8 HOH of WD 0.17 5.71
10 Contract Type BOT BOT
11 Location Hyderabad Solapur 3.2 WORKING CAPITAL FOR PROJECT Working capital, also known as net working capital or NWC, is a financial metric which represents operating liquidity available to a business. Along with fixed assets such as plant and equipment, working capital is considered a part of operating capital. It is calculated as current assets minus current liabilities. If current assets are less than current liabilities, an entity has a working capital deficiency, also called a working capital deficit. Working Capital = Current Assets − Current Liabilities A company can be endowed with assets and profitability but short of liquidity if its assets cannot readily be
International Research Journal of Engineering and Technology (IRJET) e-ISSN: 2395 -0056
Volume: 02 Issue: 03 | June-2015 www.irjet.net p-ISSN: 2395-0072
© 2015, IRJET.NET- All Rights Reserved Page 945
converted into cash. Positive working capital is required to ensure that a firm is able to continue its operations and that it has sufficient funds to satisfy both maturing short-term debt and upcoming operational expenses. The management of working capital involves managing inventories, accounts receivable and payable and cash.
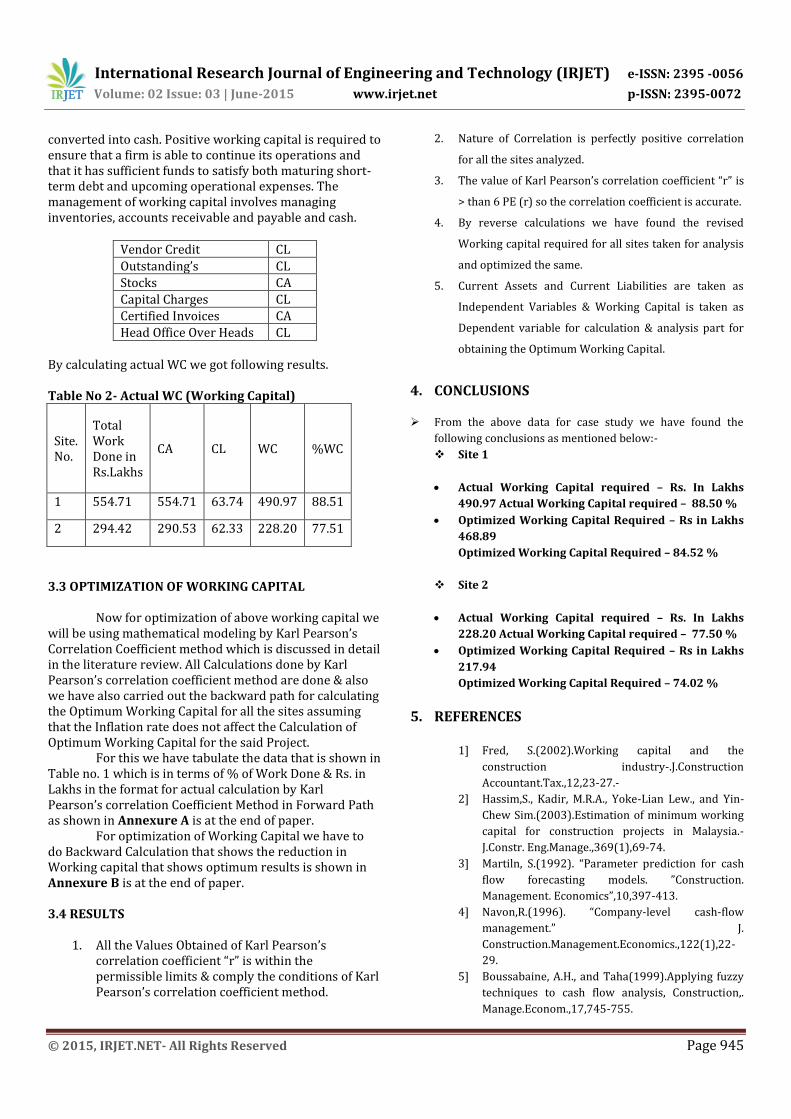
Vendor Credit CL
Outstanding’s CL
Stocks CA
Capital Charges CL
Certified Invoices CA
Head Office Over Heads CL By calculating actual WC we got following results. Table No 2- Actual WC (Working Capital)
Site. No.
Total Work Done in Rs.Lakhs
CA CL WC %WC
1 554.71 554.71 63.74 490.97 88.51
2 294.42 290.53 62.33 228.20 77.51
3.3 OPTIMIZATION OF WORKING CAPITAL
Now for optimization of above working capital we will be using mathematical modeling by Karl Pearson’s Correlation Coefficient method which is discussed in detail in the literature review. All Calculations done by Karl Pearson’s correlation coefficient method are done & also we have also carried out the backward path for calculating the Optimum Working Capital for all the sites assuming that the Inflation rate does not affect the Calculation of Optimum Working Capital for the said Project.
For this we have tabulate the data that is shown in Table no. 1 which is in terms of % of Work Done & Rs. in Lakhs in the format for actual calculation by Karl Pearson’s correlation Coefficient Method in Forward Path as shown in Annexure A is at the end of paper.
For optimization of Working Capital we have to do Backward Calculation that shows the reduction in Working capital that shows optimum results is shown in Annexure B is at the end of paper.
3.4 RESULTS
1. All the Values Obtained of Karl Pearson’s correlation coefficient “r” is within the permissible limits & comply the conditions of Karl Pearson’s correlation coefficient method.
2. Nature of Correlation is perfectly positive correlation
for all the sites analyzed.
3. The value of Karl Pearson’s correlation coefficient “r” is
> than 6 PE (r) so the correlation coefficient is accurate.
4. By reverse calculations we have found the revised
Working capital required for all sites taken for analysis
and optimized the same.
5. Current Assets and Current Liabilities are taken as
Independent Variables & Working Capital is taken as
Dependent variable for calculation & analysis part for
obtaining the Optimum Working Capital.
4. CONCLUSIONS
From the above data for case study we have found the
following conclusions as mentioned below:-
Site 1
Actual Working Capital required – Rs. In Lakhs
490.97 Actual Working Capital required – 88.50 %
Optimized Working Capital Required – Rs in Lakhs
468.89
Optimized Working Capital Required – 84.52 %
Site 2
Actual Working Capital required – Rs. In Lakhs
228.20 Actual Working Capital required – 77.50 %
Optimized Working Capital Required – Rs in Lakhs
217.94
Optimized Working Capital Required – 74.02 %
5. REFERENCES
1] Fred, S.(2002).Working capital and the
construction industry-.J.Construction
Accountant.Tax.,12,23-27.-
2] Hassim,S., Kadir, M.R.A., Yoke-Lian Lew., and Yin-
Chew Sim.(2003).Estimation of minimum working
capital for construction projects in Malaysia.-
J.Constr. Eng.Manage.,369(1),69-74.
3] Martiln, S.(1992). “Parameter prediction for cash
flow forecasting models. ”Construction.
Management. Economics”,10,397-413.
4] Navon,R.(1996). “Company-level cash-flow
management.” J.
Construction.Management.Economics.,122(1),22-
29.
5] Boussabaine, A.H., and Taha(1999).Applying fuzzy
techniques to cash flow analysis, Construction,.
Manage.Econom.,17,745-755.

International Research Journal of Engineering and Technology (IRJET) e-ISSN: 2395 -0056
Volume: 02 Issue: 03 | June-2015 www.irjet.net p-ISSN: 2395-0072
© 2015, IRJET.NET- All Rights Reserved Page 946
6] Kenley, R., and Wilson, O.D.(1989). “A construction
project net cash flow model” 7,3-18.
ANNEXURE A
KARL PEARSON'S CORRELATION COEEFICIENT METHOD:
Site No.
X (Curre
nt Assets
)
Y (Curre
nt Liabilit
ies)
x=(X-X’)
y=(Y-Y’)
x2 y2 xy Sqrt(su
m x2 sum y2)
(Karl Pearson's
coeff. correlation) r = Sum xy / Sqrt(sum x2
sum y2)
Result
Probable Error
PE(r)= 0.6745*
(1-r2)/sqrtN
6*PE(r )
Conclusion
1 554.71 63.74 132.09 0.70 17447.29 0.50 92.95
19893.5 0.915
Nature of Correlation is Perfectly
positive correlation
0.078 0.466
The value of r is > than 6 PE
(r) so the correlation
coefficient is accurate. 2 290.53 62.33 290.53 62.33 84409.81 3884.8 18108.5
Total: 845.2 126.0 101857.09 18201.54 3885.36
X': 422.62 Y': 63.03
SqrtN: 1.4142 r2: 0.837 1- r2: 0.16
ANNEXURE B
KARL PEARSON'S CORRELATION COEEFICIENT METHOD FOR OPTIMISATION OF WORKING CAPITAL
BACKWARD PATH FOR OPTIMUM WORKING CAPITAL CALCULATION
Site.No.
Total Work
Done in Rs.Lakhs
6*PE(r ) PE® =r/6
Revised r from
Probable Error
PE(r)= 0.6745*
(1-r2)/sqrtN
% deviation from
Original r & revised r
% Deviation per row
Original WC
Optimized WC
1 554.71
0.915 0.152 0.825 8.995 4.497
490.97 468.89
2 294.42 228.20 217.94

International Research Journal of Engineering and Technology (IRJET) e-ISSN: 2395 -0056
Volume: 02 Issue: 03 | June-2015 www.irjet.net p-ISSN: 2395-0072
© 2015, IRJET.NET- All Rights Reserved Page 947
BIOGRAPHIES 1 Mr. Sagar G. Pulli
2 Mrs. Suman S. Jain
Pursuing ME (Construction and Management) in Sinhgad School Of Engineering Warje
Pune.
Completed BE (Civil) from Sveri’s COE Pandharpur, Solapur.
One Year of site experience (as an Site engineer).
Working as an Associate Professor in Civil Department, Sinhgad College of Engineering,
Pune.
Completed BE, ME (Geotechnical) from COE, Pune. She has industrial experience of 6
yrs and 16 years in teaching.
Has published around 30+ technical papers in national / international journals,
conferences.
Guided no. of UG students for projects and ME students.
Membership of scientific /professional societies include LMIGS, LMISTE, LM1CI, MIE,
LMISET. Presently also the organizing secretary of IGS, Pune Chapter.
Successfully carried out several consultancy projects in Geotechnical Engineering and
also has completed a research project funded by BCUD, University of Pune.