
Optimization of Structured Adsorbents for Gas Separation Processes
184
DOCTORAL THESIS Optimization of Structured Adsorbents for Gas Separation Processes Fateme Rezaei
Transcript of Optimization of Structured Adsorbents for Gas Separation Processes

DOCTORA L T H E S I S
Department of Civil, Environmental and Natural Resources EngineeringDivision of Chemical Engineering
Optimization of Structured
Adsorbents for Gas Separation Processes
Fateme Rezaei
ISSN: 1402-1544 ISBN 978-91-7439-233-3
Luleå University of Technology 2011
Fateme R
ezaei Optim
ization of Structured Adsorbents for G
as Separation Processes
ISSN: 1402-1544 ISBN 978-91-7439-XXX-X Se i listan och fyll i siffror där kryssen är

Optimization of Structured Adsorbents for Gas Separation
Processes
Fateme Rezaei
Department of Chemical Engineering Monash University
Melbourne, Australia
Chemical Technology Luleå University of Technology
Luleå, Sweden

Printed by Universitetstryckeriet, Luleå 2011
ISSN: 1402-1544 ISBN 978-91-7439-233-3
Luleå 2011
www.ltu.se

iii

iv
ABSTRACT
Conventional gas separation processes using packed beds of beads or granules suffer from high pressure drop and mass transfer resistance when higher throughputs are required, leading to lower productivity and recovery and higher power consumption. This restricts the adsorption processes using traditional adsorbents in the form of beads or granules to low throughputs and makes such processes less attractive compared to other processes such as distillation for large volume production and high productivity. Such problems could be reduced if structured adsorbents are developed and replace the traditional beds of beads or granules.
Although much research has been devoted to the development of structured adsorbents over the last decade, there is still a need to increase the understanding of structured adsorbents. Therefore, this work aimed to increase the fundamental understanding of structured adsorbents using two different approaches; a general approach by which numerical models were developed to predict the performance of structured adsorbents with different geometries in pressure/vacuum swing adsorption (PSA/VSA) processes. The effects of parameters such as porosity, density and surface area, on the performance of structured adsorbents with different geometries were evaluated. Comparisons based on mass and heat transfer, adsorbent loading and pressure drop characteristics of PSA systems for CO2/N2 separation were carried out. The obtained results demonstrate the potential advantage of structured adsorbents in rapid cycle adsorption processes. The even flow distribution, very low mass and heat transfer resistances and low pressure drop in combination with considerable adsorption capacity in the best structured adsorbents indicate that these novel configurations are promising adsorbents for advanced PSA/VSA applications.
The second approach was to evaluate the performance of zeolite coated monoliths prepared and tested experimentally by numerical modelling. The effects of wall porosity, channel width distribution and zeolite film thickness on the dynamic behavior of the adsorbents were examined. The model indicated that the film thickness could be increased up to about 10 μm to increase adsorption capacity without increasing the dispersion in the system further. In addition, it was shown that employment of monoliths with lower wall porosity would lead to better performance of the structured adsorbents.
v

vi

CONTENTS
Part I xiii
CHAPTER 1- INTRODUCTION....................................................................................... 1 1.1 Adsorption process and porous adsorbents........................................................... 1 1.2 Adsorptive gas separation ..................................................................................... 3 1.3 Criteria for the evaluation of adsorbents............................................................... 6 1.4 Novel adsorbent configurations ............................................................................ 9 1.5 Scope of the present work................................................................................... 12
CHAPTER 2- NUMERICAL SIMULATION ................................................................. 14 2.1 General characteristics of structured adsorbents, Papers B & F......................... 14 2.2 Zeolite coated monolith performance, Papers C & E ........................................ 21 2.3 VSA separation performance, Paper D.............................................................. 23 2.4 Cyclic adsorption simulation, Paper F ............................................................... 24
CHAPTER 3- RESULTS AND DISCUSSION ............................................................... 26 3.1 General characteristics of structured adsorbents, Papers B & F........................ 26 3.2 Zeolite coated monoliths performance, Papers C - E ........................................ 31 3.3 Cyclic adsorption simulation, Paper F ............................................................... 37
CHAPTER 4- CONCLUSIONS....................................................................................... 40 4.1 Conclusions........................................................................................................ 40
CHAPTER 5- FUTURE WORK ...................................................................................... 42 5.1 Future work........................................................................................................ 42
REFERENCES 43
Part II 49
PAPER A 51 PAPER B 67PAPER C 79 PAPER D 93 PAPER E 105 PAPER F 135
vii

viii

ACKNOWLEDGMENTS
This study was carried out at the Department of Chemical Engineering, Monash University (Australia) and at Chemical Technology, Luleå University of Technology (Sweden) from March 2008 to March 2011. Financial supports from Monash Research Graduate School (MRGS) and Chemical Technology (LTU) are very much appreciated.
I would like to take this opportunity to express my utmost gratitude to my supervisor at Monash, Prof. Paul Webley, for his invaluable guidance throughout the course of this study. It is only with his patience and guidance that I have been able to complete this process, and I am grateful for all of the opportunities that he has provided me. I also would like to acknowledge Prof. Jonas Hedlund, my supervisor at LTU for his invaluable support and advice. His guidance and advice throughout the project have been very indispensable for completion of this thesis. My appreciation goes especially to Dr. Mattias Grahn, my co-supervisor at LTU for his help and support during my stay in Luleå.
Special thanks also go to my friends and colleagues at the Department of Chemical Engineering at both Monash and LTU Universities who helped me throughout this period. Many thanks go to Lilyanne Price from Monash University for her help in all administrative chores. Sincere thanks also to Dr. Alessandra Mosca; we have been working together since March 2009 and coming up with several publications.
Of course, none of this would be possible without the continual support of my husband Ali. There is no reasonable way I can describe how he has helped me over the last few years. He has been a great source of love, motivation, and encouragement and I will be forever grateful for his help.
Finally, my greatest appreciation will always go to my loving family for their sacrifices, love, patience and supports. More especially my mother for her unending support from distances far away from me, this dissertation would not have been possible without her love and encouragement during this tedious journey.
And at long last, I would like to dedicate this thesis to my late father who never lived long enough to see me through to the end of this study. You will always be the source of my inspiration and a part of me. May your soul rest in peace and I will always love you.
ix

x
LIST OF PAPERS This doctoral thesis is based on the work reported in the following papers:
PAPER A Structured adsorbents in gas separation processesF.Rezaei, P. Webley Separation and Purification Technology 70 (2010) 243 - 256
PAPER B Optimum structured adsorbents for gas separation processesF.Rezaei, P. Webley Chemical Engineering Science 64 (2009) 5182 - 5191
PAPER C Structured zeolite NaX coatings on ceramic cordierite monolith supports for PSA applicationsA. Mosca, J. Hedlund, P. A. Webley, M. Grahn, F. Rezaei Microporous and Mesoporous Materials 130 (2010) 38 - 48
PAPER D Comparison of traditional and structured adsorbents for CO2 separation by vacuum-swing adsorption F. Rezaei, A. Mosca, P. Webley, J. Hedlund, P. Xiao Industrial & Engineering Chemistry Research 49 (2010) 4832 - 4841
PAPER E The effect of wall porosity and zeolite film thickness on the dynamic behavior of adsorbents in the form of coated monoliths F. Rezaei, A. Mosca, J. Hedlund, P. Webley, M. Grahn, J. MouzonSubmitted to Separation and Purification Technology
PAPER F Thermal management of structured adsorbents in CO2 capture processF. Rezaei, M. Grahn Submitted to Environmental Science & Technology and under revision
Conferences presentations not included in the thesis:
Thermal management of structured adsorbents in gas separation processes Fateme Rezaei, Paul Webley
xi

Oral presentation at the AIChE09 Annual Meeting, Nashville, Tennessee, USA, November 8-13, 2009
Engineered gas adsorbents, optimum structure and performance Fateme Rezaei, Jonas Hedlund, Paul Webley Poster presentation at the AIChE10 Annual Meeting, Salt Lake City, Utah, USA, November 7-12, 2010
Other works not included in the thesis:
Innovative process for the synthesis of vanadyl pyrophosphate as a highly selective catalyst for n-butane oxidationA.A. Rownaghi, Taufiq-Yap, F. RezaeiChemical Engineering Journal 165 (2010) 328 - 335
High surface area vanadium phosphate catalyst for n-butane oxidationA.A. Rownaghi, Taufiq-Yap, F. Rezaei Industrial Engineering Chemistry Research 48 (2009) 7517 - 7528
Influence of Rare-Earth and Bimetallic Promoters on Various VPO Catalysts for Partial Oxidation of n-ButaneA.A. Rownaghi, Taufiq-Yap, F. RezaeiCatalysis Letters 130 (2009) 504 - 516
Solvothermal synthesis of vanadium phosphate catalysts for n-butane oxidationA.A. Rownaghi, Taufiq-Yap, F. RezaeiChemical Engineering Journal 155 (2009) 514 - 522
My contribution to the papers included in the thesis:
PAPER A. All the literature review and most of the evaluation and writing PAPER B. All the simulation work and most of the evaluation and writing PAPER C. Contribution to simulation part, its evaluation and writingPAPER D. All the simulation work and approximately 2/3 of the evaluation and writing PAPER E. Some of the sample characterization work, all the simulation work and most of the evaluation and writingPAPER F. All the simulation work and most of the evaluation and writing
xii

Part I
xiii

xiv

CHAPTER 1
Introduction
1.1 Adsorption process and porous adsorbents Adsorption is a process in which a component (adsorbate) is attached to a surface (adsorbent). Adsorption depends on the existence of a force field at the surface of a solid, which reduces the potential energy of an adsorbed molecule below that of the ambient fluid phase. Depending on the nature of the surface forces there are two broad classes of adsorption: physical adsorption and chemisorption. Physical adsorption is caused mainly by van der Waals forces and electrostatic forces between adsorbate molecules and the surface atoms of the adsorbent [1]. The forces involved in chemisorption are much stronger and involve a substantial degree of electron transfer or electron sharing, as in the formation of a chemical bond. Generally, adsorbents are characterized first by surface properties such as surface area and polarity. The most common commercial adsorbents in gas separation processes include activated carbon, zeolites and molecular sieves, silica gel and activated alumina. Separation processes utilizing adsorption may be cost and energy effective alternatives to other separation processes such as distillation and absorption, particularly at low to moderate throughput. Adsorption separation processes have become a common and efficient unit operation for the separation of multi-component gas mixtures in the chemical industry [2].
1.1.1 Zeolites: structure, properties and application Zeolites are a group of crystalline porous materials with a diversity of structure, porosity and chemical composition. Generally the framework is comprised of silicon, aluminium and oxygen and cations and water and/or other molecules may be present in the pores [3]. A general formula for zeolites is: Mx/n[(AlO2)x(SiO2)y].wH2O (1.1)
where M is a cation of valence n, y/x is the silicon/aluminium ratio (Si/Al), and w is the number of water molecules. Zeolites occur naturally as minerals, and are mined in many parts of the world. Zeolites can also be prepared synthetically. All known zeolite frameworks have been assigned a three letter code and today there are over 190 known framework structures [4]. Zeolites find various applications in adsorption processes, heterogeneous catalysis, ion exchange and most recently heat pumps. Zeolites are one of the main components in detergents (zeolite A), where the ion-exchange properties are used to soften the water. In this work, zeolite X with FAU framework was studied. The

2 INTRODUCTION FAU framework has a three-dimensional pore system with pores running perpendicular to each other, as shown in Figure 1.1. Two zeolites have the same FAU framework, namely zeolite X and zeolite Y, and the difference between these two zeolites is only the Si/Al ratio, which varies between 1 and 1.5 for zeolite X, and between 1.5 and 5.6 for zeolite Y [3, 5].
Figure 1.1: The FAU framework.
Zeolite X is mainly used for O2 enrichment from air and air dehumidification by adsorption, while the main application of zeolite Y is catalytic cracking in the FCC process. Zeolite NaX is the most common adsorbent for CO2 capture [3]. In Figure 1.2, the CO2 equilibrium isotherm on NaX at 298K is shown [6]. The isotherm shows that CO2 is favourably adsorbed by NaX zeolite. The isotherm has a very steep slope at low pressures, and high loading is reached at high pressures, which illustrates the suitability of this kind of zeolite for CO2 separations.
0
0.5
1
1.5
2
2.5
3
3.5
4
4.5
0 20 40 60 80 100 120
Pressure(KPa)
Loading(gmol/
Linear region and approx. slopeLinear region and approx. slope
Load
ing
(gm
ol/k
g)
Pressure (kPa)
1201008060400 200
0.5
1
1.5
2
2.5
3
3.5
4
4.5
Figure 1.2: Adsorption isotherm for CO2 on NaX zeolite at 298K [6].
1.2 ADSORPTIVE GAS SEPARATION 3
1.2 Adsorptive gas separation The most common applications for adsorption-based gas separation include air separation, H2 purification, CO2 removal, dehumidification of gas streams, hydrocarbon separation and natural gas upgrading. Basically, there are three different types of physical mechanisms through which the separation of a gas mixture can be accomplished by adsorption: equilibrium, kinetic, and steric mechanisms [2]. The equilibrium mechanism is based on differences in the strength of attraction of the adsorbate to the adsorbent; the kinetic mechanism is based on the differences in the rates of adsorption and/or transport of adsorbate on and through an adsorbent; the steric effect derives from the molecular sieving property and is based on the incompatibility between the size or shape of the pores in the adsorbent and those of the adsorbate gas molecules. Currently, the most common gas separations used at large scales in the industry are based on the equilibrium mechanism.
1.2.1 Cyclic adsorption processes Adsorption/desorption is mainly performed by periodic variation of pressure or temperature of the adsorber column, as shown in Figure 1.3.
Pressure swing adsorption (PSA) is the most widely used technology for bulk gas separation. It was invented by Skarstrom in 1959 for separation of oxygen and nitrogen from air using a four step cycle [7]. The PSA process is mainly based on exploiting the difference in working capacity exhibited by an adsorbate-adsorbent system when step changes in the operating pressure are applied. In many PSA processes, the desired product is the less adsorbed component, and the more adsorbed component is discarded with no concern of purity. Over the last 30 years, there have been rapid growth in the development of PSA technology, leading to the advent of new configurations such as rapid PSA or piston-driven PSA systems, with cycle times much shorter (less than 20 sec.) than the conventional systems (120-1200 sec.) [8].
Temperature swing adsorption (TSA) has been a widely used technology for the removal and recovery of trace amount of pollutants such as volatile organic compounds (VOCs) from gaseous streams. The process is based on adsorption at low temperature and desorption at high temperature. TSA cycle times are usually quite long (several hours to several days), which results in high energy consumption and large adsorbent inventories. Therefore, TSA systems are not good candidates for bulk separation applications. TSA is however preferred to PSA in the case of strongly adsorbed species, for which a variation of pressure is not efficient to regenerate the adsorbent [7].

4 INTRODUCTION
Thigh
Tlow
PhighPlow
Pressure
Ads
orba
te L
oadi
ng
Figure 1.3: Schematic representation of cyclic adsorption-based separation.
In cyclic processes such as PSA and TSA, reducing cycle time is the primary means of achieving more production from a given quantity of material. However, as cycle time is reduced, cyclic processes usually face the problem of decreasing working capacity per cycle for the component of interest, decreasing product recovery and increasing pressure drop. The extent to which cycle time reduces working capacity and recovery and increases pressure drop is dependent on the structure of the adsorbent [9].
1.2.2 Conventional and novel adsorbents Conventional gas separation systems are using adsorbents in the form of beads or granules. However, mass transfer and pressure drop drawbacks associated with conventional packed beds impose limitations in operating the process at optimum conditions in terms of energy consumption and overall system efficiency and do not allow operating the process at short cycle times (more than a few cycles per minute). Reducing particle size is the most obvious way to decrease mass transfer resistance (which is proportional to the square of particle size) and the trend over the last few decades has been a reduction of particle size from 2-3 mm to less than 0.7 mm. Combating the accompanying increase in pressure drop with reduction in particle size has led to bed geometries of a “pancake” nature i.e. height/diameter ratios considerably less than one. However, considerable gas maldistribution and channelling not to mention potential fluidization of packed beds becomes issues to tackle. An alternate approach to simply reducing particle size is to develop non-particulate, novel adsorbent structures.
The use of traditional adsorbent materials in the form of beads or granules in gas separation processes is compromised when an efficient process with high performance and low energy demand is required. Novel adsorbent geometries should satisfy a number

1.3 CRITERIA FOR THE EVALUATION OF ADSORBENTS 5
of requirements in order to be considered as suitable candidates for replacement of pellet/bead configurations. In particular, such structures should display good mass transfer kinetics with large external and solid mass transfer coefficients. Furthermore, the structured adsorbents must exhibit sufficient volume working capacity (loading per unit system volume) as well as sufficiently low voidage for minimizing the size of the adsorber. In addition, the structures should result in low pressure drop, even flow distribution and no fluidization.
Figure 1.4 illustrates some possible novel adsorbent structures as well as conventional beaded adsorbents. In this Figure, beads and granules are shown as examples of common adsorbent configurations currently used in industry; while activated carbon monoliths (black monoliths in the Figure), cordierite monoliths, activated carbon fabric and corrugated paper monoliths represent novel structures in adsorption-based separation processes.
Figure 1.4: Illustration of a variety of adsorbent structures including (left to right): ceramic and carbon adsorbent monoliths, corrugated paper monoliths (centre), fabric adsorbent and conventional beaded adsorbents.
1.3 Criteria for the evaluation of adsorbents 1.3.1 Volumetric working capacity and adsorbent loading Volumetric working capacity is defined here as moles of gas processed per unit volume per cycle. This is the product of the working capacity (moles of gas adsorbed/desorbed per unit mass of adsorbent including binder, support, etc.) and the density of the composite adsorbent. The throughput attainable in a given volume of vessel in a cyclic adsorption system may be expressed as:
WC* ) (mole/s.mthroughput B3 (1.2)
6 INTRODUCTION where WC is the working capacity (moles/kgadsorbent/cycle), B is the bulk adsorbent density (kgadsorbent/m3) and is the cycle time (s/cycle). Although structured adsorbents are developed with the aim of operation at shorter cycle times (lower ), any development which simultaneously reduces adsorbent density ( B) is detrimental to throughput. Thus although structured adsorbents may have remarkable advantages over adsorbent pellets such as superior mass transfer kinetics (due to shorter diffusion path) and effective heat transfer in all directions, as well as more uniform temperature distribution, their throughput may be lower, if the adsorbent loading on a mass or volume basis is small compared to adsorbent materials in the form of pellets/beads.
It is worth mentioning that high adsorbent loading may not always be a desirable parameter in all adsorptive processes if other features are compromised. For instance, in some adsorptive systems, mass and heat transfer processes dominate system performance (e.g. removing moisture from air) and hence reducing the characteristic diffusion length is more important than adsorbent loading. In terms of equation 1.2, high B may compromise WC and hence an optimum throughput may exist.
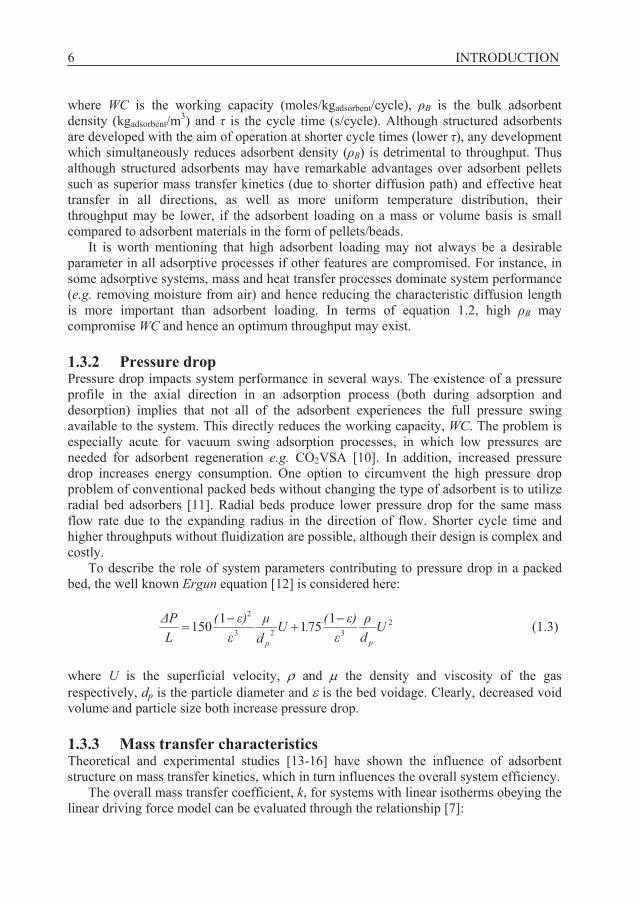
1.3.2 Pressure drop Pressure drop impacts system performance in several ways. The existence of a pressure profile in the axial direction in an adsorption process (both during adsorption and desorption) implies that not all of the adsorbent experiences the full pressure swing available to the system. This directly reduces the working capacity, WC. The problem is especially acute for vacuum swing adsorption processes, in which low pressures are needed for adsorbent regeneration e.g. CO2VSA [10]. In addition, increased pressure drop increases energy consumption. One option to circumvent the high pressure drop problem of conventional packed beds without changing the type of adsorbent is to utilize radial bed adsorbers [11]. Radial beds produce lower pressure drop for the same mass flow rate due to the expanding radius in the direction of flow. Shorter cycle time and higher throughputs without fluidization are possible, although their design is complex and costly.
To describe the role of system parameters contributing to pressure drop in a packed bed, the well known Ergun equation [12] is considered here:
2323
2 17511150 Ud
)(.Ud
)(LP
pp
(1.3)
where U is the superficial velocity, and the density and viscosity of the gas respectively, dp is the particle diameter and is the bed voidage. Clearly, decreased void volume and particle size both increase pressure drop.
1.3.3 Mass transfer characteristics Theoretical and experimental studies [13-16] have shown the influence of adsorbent structure on mass transfer kinetics, which in turn influences the overall system efficiency.
The overall mass transfer coefficient, k, for systems with linear isotherms obeying the linear driving force model can be evaluated through the relationship [7]:

1.3 CRITERIA FOR THE EVALUATION OF ADSORBENTS 7
2
22 115153
1UD
KDr
DR
kR
kKL
c
c
pp
p
f
p (1.4)
where K is the equilibrium constant, kf is the external film coefficient, Rp and rc are particle and crystal radii respectively, Dp and Dc are pore and intracrystalline diffusivity respectively and DL is axial dispersion. The relative importance of internal and external resistances is expressed by the mass Biot number kfL/D where L is a characteristic dimension (particle diameter) and D the internal diffusion coefficient. Generally speaking, micropore diffusion resistance dominates over film and macropore resistances if [7]:
KrDRD
cc
pp 11//
2
2
and 15
p
p
kRD
The opposite situation holds for macropore diffusion.
For pellet adsorbents, the external film resistance is seldom limiting the overall mass transfer and can usually be neglected ((Bi)m >>1) [2]. However, external film diffusion may be important for structured adsorbents and should be considered when modelling and designing these systems.
The contribution of axial dispersion to k for pellets, is usually small (similar to external diffusion) and can justifiably be neglected. The plug flow assumption is therefore adequate.
It should be noted that the binder in adsorbent structures may influence the mass transfer. In certain applications such as dehumidification processes, wherein the diffusivity of the adsorbate molecule (water) through the binder layer is high, the binder material does not reduce the overall kinetics of the process. In contrast, in processes such as air separations, the binder serves as a kinetic barrier to adsorbate molecules.
1.3.4 Thermal management Novel adsorbent structures should be optimized with respect to heat transfer. Since adsorption is exothermic and desorption endothermic, a thermal swing accompanies the pressure swing and is usually reducing the overall system performance (reducing capacity on adsorption and increasing it on desorption), sometimes by as much as 30% for traditional adsorbents [17]. Efficient transfer of heat to and from the adsorbent can significantly improve system performance and a structured adsorbent may offer opportunities to accomplish this. As a first estimate, the temperature swing at a point in the bed is given by [8]:
sC
HWCT * (1.5)
where WC is the working capacity, H is the heat of adsorption and Cs is the solid specific heat (kJ/kg). To reduce the effect of this temperature swing for packed beds, several approaches have been attempted including insertion of heat transfer devices into the packed bed [18], or use of metallic compounds or phase change materials to either increase Cs or absorb the heat of adsorption [19].

8 INTRODUCTION
This is a fertile area for future research since not only can adsorbent structure manage heat more effectively in a passive mode, but they may in fact offer opportunities for “active” thermal management (in processes such as Electrical Swing Adsorption).
1.3.5 Trade-off between properties The design of adsorbent structures involves, inevitably a trade-off between a number of parameters which govern the overall adsorbent performance. Adsorbents with high working capacity and fast kinetics would be ideal for cyclic separation processes, however these requirements can hardly be combined for traditional adsorbents [9].
In the case of beads there is always a trade-off between pressure drop and mass/heat transport characteristics, smaller pellets display better mass/heat kinetics, while the pressure drop is dramatically increased. External surface area per unit volume of adsorbent is one of the most important characteristics governing the performance of adsorbents but higher surface area is usually associated with lower adsorbent density. For laminate, cloth and monolith structures, in order to maintain a sufficient surface area and hence improved kinetic properties, the wall thickness and spacing should be kept small. Thinner wall thickness means shorter diffusion path but on the other hand, lower adsorbent loading associated with thinner walls will result in insufficient adsorbent density. The same argument is valid for adsorbent voidage. High voidage may be associated with faster kinetics, however, the bed density is low, which gives rise to lower working capacity. Small spacing between adjacent sheets or small channels increases the pressure drop as well. Such trade-off behaviours should always be taken into consideration when dealing with adsorbent structure [20].
1.4 Novel adsorbent configurations A large variety of novel structured adsorbents have been studied by scientists and some has also been commercialized over the last 10 years. The structures are categorized here as monoliths, laminates, foams, fabric structures and other configurations. Alternatively, a film may be grown on the monoliths, laminates or foams to form an active adsorbent. Although decreased void volume also increases pressure drop for structured adsorbents however, it is easier in parallel channel adsorbents to control to obtain satisfactory performance. In addition, the tortuosity of the channels in a monolith or laminate structures is 1, compared with 2-3 for a packed bed of granules [21]. Therefore the pressure drop in a packed bed is larger than in a monolith structure for equal voidage. Furthermore, the system geometry in laminates and monoliths can be optimized to achieve lower head loss. This is achieved by decreasing cell density or wall thickness in monoliths and increasing sheet spacing and decreasing wall thickness in laminates. Generally, parallel channels exhibit better performance with respect to pressure drop; however they must be carefully designed to avoid too much loss of adsorbent loading and large diffusion paths (wall thickness) [13].
1.4 NOVEL ADSORBENT CONFIGURATIONS 9
1.4.1 Monolithic adsorbents In recent years, monolithic adsorbents have received considerable attention for use in adsorption systems [22-24]. Monoliths are structured materials composed of parallel channels with a variety of cross sectional shapes that usually display very low pressure drop. Such structures have been widely used as a catalyst support in various applications including catalytic combustion, biochemical and electrochemical reactors, automotive catalytic convertors, etc. [25].
Early attempts in the use of monolithic adsorbent structures for separation process were mostly related to elimination of VOCs from air [26, 27]. MAST Carbon, a developer of materials of activated carbon, produces a variety of activated carbon monoliths for a range of applications including (but not limited to) VOC removal.
The geometric parameters of monoliths which influence the processing requirements are defined in terms of cell density, cell spacing or wall thickness. The cell density of monoliths is defined as the number of cells per unit of cross-sectional area and expressed as cells per square inch (cpsi). For constant gas viscosity, monolith length, and open frontal area, the pressure drop of monolith adsorbents increases with increasing cell density. On the other hand, for constant cell density, the pressure drop decreases with decreasing wall thickness. Thus monoliths are one of the most efficient methods available to pack high external adsorbent surface area into a fixed volume while still maintaining low pressure drop. However, although the unique structure of monoliths significantly reduces many of the common problems of conventional adsorbents (i.e. fluidization, high pressure drop, etc.), these structures may display low loading of active adsorbent material. In addition, not all the adsorbent material present in the monolith wall may be accessible to the adsorbate molecules passing through the channels [28]. The active adsorbent material may be directly extruded in the form of a structured monolith (commonly done for carbon monoliths in which case the entire monolith is active adsorbent) or an active film may be deposited on the monolithic structures by various methods, namely, dip-coating, wash-coating, and slip-coating [29]. Alternatively, a film may be grown by hydrothermal treatment on the walls of porous ceramic cordierite monolith as explored by our research group [22, 23, 30-32]. The zeolite film grown by this method is dense and uniform and the mass transfer resistance is dependent of film thickness.
Monoliths have two major resistances to mass transfer; external film resistance, and
pore diffusion within the monolith walls or alternatively, in the film grown on the monolith. The characteristic diffusion length can be shortened by employing a thinner adsorbent wall. Alternatively, a thin film of active material on a monolith support can also mitigate the problem related to diffusion length as explored by our research group. The low pressure drop of monoliths and laminates must be exploited by using long beds to give sufficient residence times. High cell density is advantageous since it results in high adsorbent loading and short diffusion lengths.
1.4.2 Laminate adsorbents Laminate structures can be considered a simpler form of monoliths in which the channels are replaced by 1D slits. As with monoliths, laminates can potentially exhibit significantly better performance than a packed bed. The practical difficulties involved in reproducibly making such structures are not trivial however. The tolerances between
10 INTRODUCTION sheets should be tight (< 5%) to avoid flow maldistribution and the spacing should be small and uniform [13]. As a result of this difficult manufacturing process, the use of laminate adsorbents in separation processes is not common. There are a few patents which describe the use of adsorbent materials in the form of laminate sheets in adsorptive gas separation applications [20, 33-35].
In laminate structures, the pressure drop per unit length may be controlled by altering the space between adjacent sheets. Like monolithic structures, thin sheets with small spacing increases pressure drop but also increases adsorbent loading and decreases mass transfer resistance. Spacing can be achieved using different approaches such as corrugating the laminates or making ridges on the sheets. The spaces between adjacent layers could be also created using external spacing devices such as mesh or grid. Care must be taken to ensure that the spacer does not contribute to higher pressure drop nor obstruct the gas flow through the adsorbent.
Like monoliths, laminate adsorbents suffer from the problem of low adsorbent density due to several factors. A binder is usually present in the adsorbent matrix in addition to the presence of an external support. These non-adsorbent components directly reduce the volume loading of the adsorbent. This is in contrast to fabrics or self-supporting adsorbents that have higher adsorbent density. Laminate sheets can be packed into corrugated layers to increase adsorbent loading (and surface area) [36]. 1.4.3 Foam structures Ceramic foams have many attractive features as catalyst supports, however, reports on their utilization in adsorptive gas separation applications is scarce. These types of adsorbents may have substantial benefits over other adsorbent configurations. They offer high geometric surface area resulting in an increase in the rate of external mass transfer and due to their inherent large porosity, these structures are capable of maintaining a lower pressure drop than a packed bed of pellets/beads [37]. However, it is argued that such structures may not be suitable candidates in cyclic adsorption processes such as PSA or partial PSA processes because of the adsorbent’s high tortuosity and porosity which decrease separation performance [38].
Due to the inherent high porosity of foam adsorbents, the amount of active material may not be adequate to exhibit the same volume activity as a packed bed of pellets, however, this problem could be reduced through adjusting the amount of adsorbent coating on the foam. As with monolith adsorbents, the flow friction and hence the pressure drop is decreased due to the larger flow channels and presence of large number of voids, which allows the radial mixing of flow. This is the advantage (high bed porosity) of foam adsorbents over monolithic structures in which laminar flow does not allow radial mixing. Typically, higher voidage in the bed is favoured for operation at high velocities (i.e. high cycle frequency in cyclic operations) where pressure drop become crucial [38].
There has been extensive research on preparation of zeolite foams using polymeric templates [38, 39], but despite the promising advantages offered by foam structures, the employment of zeolitic foams in gas separation processes have not been studied yet. Yoon et al. [39] prepared zeolite foams using a polymeric template capable of releasing an amine to crystallize zeolite or zeotype materials. The template and the final adsorbent had a sponge structure. According to the authors, since there is no blocking problem due

1.4 NOVEL ADSORBENT CONFIGURATIONS 11
to a binding agent and since the zeolite is formed in the form of a thin layer in the foam, gas can freely move inside the zeolite foam and the accessibility of the zeolite should be high. Moreover, due to the presence of macropores which are spatially connected to each other and are large enough for molecules to freely enter and leave, the pressure drop should be low.
In another work reported by Buciuman and Kraushaar-Czarnetzki [40], ceramic foams were partially coated with nano particles of MFI zeolites (100-650 nm) by a dipping technique without the addition of binder materials. However, the practical application of such zeolite coated ceramic foam was not investigated. 1.4.4 Fabric structures Adsorbent fabrics present advantageous features for gas separation application. The use of adsorbent fabrics in adsorption processes was first reported in the early 1980s when Bailey et al. [41] described the application of charcoal cloth in adsorptive filters for air purification process. Golden, et al. [9] reports the use of adsorbent fabrics with average pore diameter from 12-15 Å in rapid PSA systems for CO2 capturing and H2 recovery. Sawad, et al. [38] demonstrated coating activated carbon powder onto a fabric, cloth or felt made from activated carbon fibres. Since these adsorbents are comprised entirely of active material of thin fibres, high adsorbent loadings and rapid mass transfer may be provided. Adsorbent fabric can be prepared in various configurations in such a way that it still maintains the benefits of the fabric. The preferred configurations are parallel sheets and spiral wound structures. Additional advantages potentially offered by flexible adsorbent fabrics are lower attrition rates and higher mechanical strength [9]. There is often no requirement for external support or spacers [20]. The heat transport characteristics of fabric adsorbents could be enhanced by employing materials with high thermal conductivity (by coating or impregnation techniques or weaving). Self-supporting cloths offer low resistance to gas flow and of course eliminate fluidization issues [41].
1.4.5 Other structures In the case of traditional pellets used in adsorptive gas separation, recent advances have been achieved for preparation of binderless pellets by converting the binder material to an active adsorbent in order to maximize the density of the active adsorbent material. Attempts have been made to improve the fabrication process of beads/pellets; synthesizing of particles with controllable physical properties and well-ordered structures with uniform pore size distribution are among them. However, the most important drawback with high pressure drop remains a large challenge which motivates the use of other structures [38].
Monolithic carbon discs combined with aluminium fins, are among other configurations that have recently gained interest in adsorption applications such as heat pumps, adsorption refrigerators, etc. [42-44].
Another class of structured materials is zeolite coated alumina beads, steel, quartz or glass; these kinds of structures have been evaluated as catalysts. For example, Öhrman et al. [45] reported the application of MFI coated alumina beads for para-xylene isomerization and triisopropylbenzene cracking.

12 INTRODUCTION 1.5 Scope of the present work In this work, the performance of structured adsorbents was numerically evaluated to increase the fundamental understanding of these materials in gas separation processes. Two different approaches were used:
The general approach: to evaluate the general characteristics of structured adsorbents in gas separation systems by numerical modelling.
The specific approach: to prepare and evaluate the performance of zeolite coated monoliths in CO2 adsorption processes by combining breakthrough experiments and numerical modelling.
CHAPTER 2
Numerical simulation
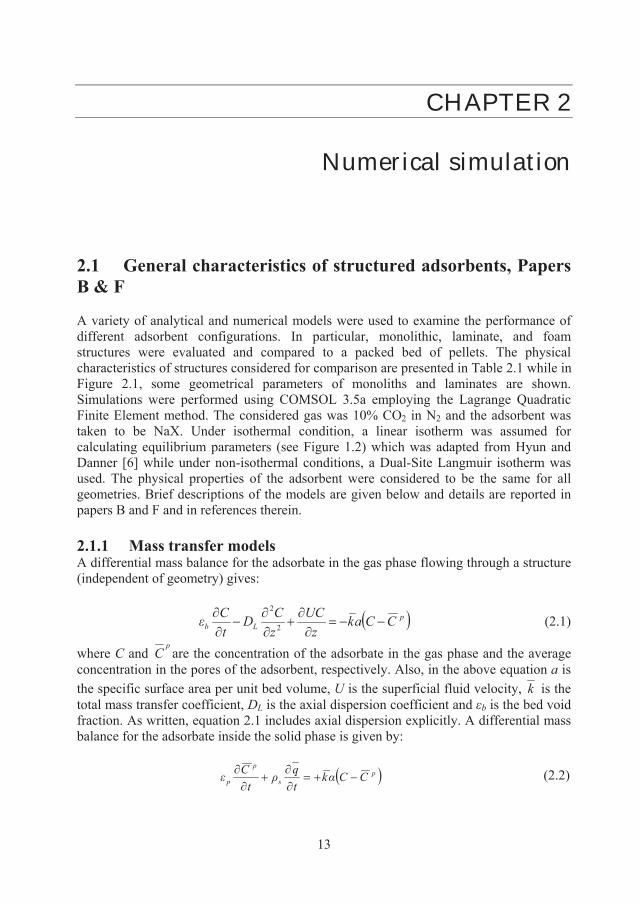
2.1 General characteristics of structured adsorbents, Papers B & F A variety of analytical and numerical models were used to examine the performance of different adsorbent configurations. In particular, monolithic, laminate, and foam structures were evaluated and compared to a packed bed of pellets. The physical characteristics of structures considered for comparison are presented in Table 2.1 while in Figure 2.1, some geometrical parameters of monoliths and laminates are shown. Simulations were performed using COMSOL 3.5a employing the Lagrange Quadratic Finite Element method. The considered gas was 10% CO2 in N2 and the adsorbent was taken to be NaX. Under isothermal condition, a linear isotherm was assumed for calculating equilibrium parameters (see Figure 1.2) which was adapted from Hyun and Danner [6] while under non-isothermal conditions, a Dual-Site Langmuir isotherm was used. The physical properties of the adsorbent were considered to be the same for all geometries. Brief descriptions of the models are given below and details are reported in papers B and F and in references therein.
2.1.1 Mass transfer models A differential mass balance for the adsorbate in the gas phase flowing through a structure (independent of geometry) gives:
pLb CCak
zUC
zCD
tC
2
2
(2.1)
where C and p
C are the concentration of the adsorbate in the gas phase and the average concentration in the pores of the adsorbent, respectively. Also, in the above equation a is the specific surface area per unit bed volume, U is the superficial fluid velocity, k is the total mass transfer coefficient, DL is the axial dispersion coefficient and b is the bed void fraction. As written, equation 2.1 includes axial dispersion explicitly. A differential mass balance for the adsorbate inside the solid phase is given by:
ps
p
p CCktq
tC (2.2)
13
14 NUMERICAL SIMULATION
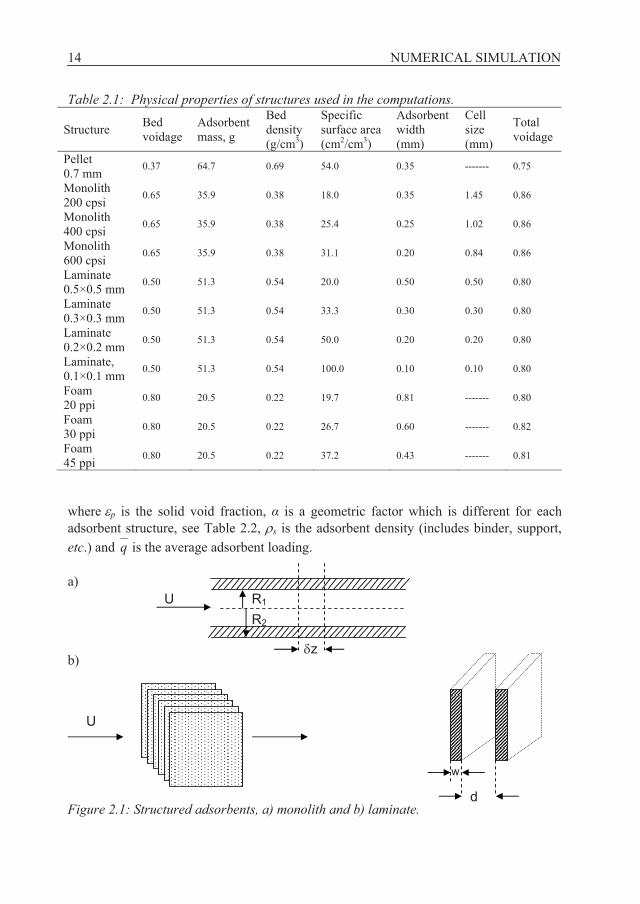
Table 2.1: Physical properties of structures used in the computations.
Structure Bed voidage
Adsorbent mass, g
Bed density (g/cm3)
Specific surface area (cm2/cm3)
Adsorbent width (mm)
Cell size (mm)
Total voidage
Pellet 0.7 mm 0.37 64.7 0.69 54.0 0.35 ------- 0.75
Monolith 200 cpsi 0.65 35.9 0.38 18.0 0.35 1.45 0.86
Monolith 400 cpsi 0.65 35.9 0.38 25.4 0.25 1.02 0.86
Monolith 600 cpsi 0.65 35.9 0.38 31.1 0.20 0.84 0.86
Laminate 0.5×0.5 mm 0.50 51.3 0.54 20.0 0.50 0.50 0.80
Laminate 0.3×0.3 mm 0.50 51.3 0.54 33.3 0.30 0.30 0.80
Laminate 0.2×0.2 mm 0.50 51.3 0.54 50.0 0.20 0.20 0.80
Laminate, 0.1×0.1 mm 0.50 51.3 0.54 100.0 0.10 0.10 0.80
Foam 20 ppi 0.80 20.5 0.22 19.7 0.81 ------- 0.80
Foam 30 ppi 0.80 20.5 0.22 26.7 0.60 ------- 0.82
Foam 45 ppi 0.80 20.5 0.22 37.2 0.43 ------- 0.81
where p is the solid void fraction, is a geometric factor which is different for each adsorbent structure, see Table 2.2, s is the adsorbent density (includes binder, support, etc.) and q is the average adsorbent loading.
R1
R2
U
z
a)
b)
d
w
U
Figure 2.1: Structured adsorbents, a) monolith and b) laminate.
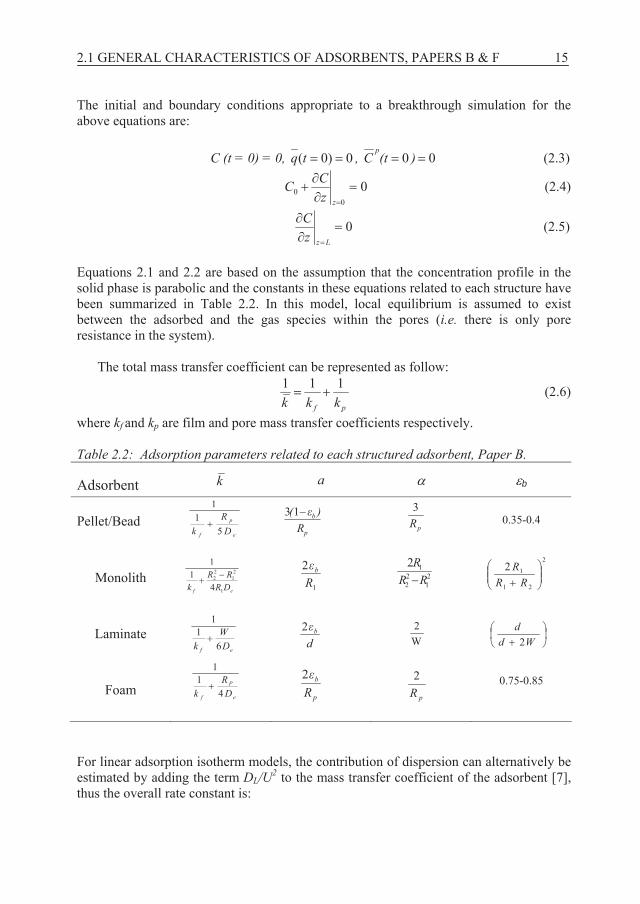
2.1 GENERAL CHARACTERISTICS OF ADSORBENTS, PAPERS B & F 15 The initial and boundary conditions appropriate to a breakthrough simulation for the above equations are: C (t = 0) = 0, 0)0(tq , 00 )(tC
p (2.3)
00
0zz
CC (2.4)
0Lzz
C (2.5)
Equations 2.1 and 2.2 are based on the assumption that the concentration profile in the solid phase is parabolic and the constants in these equations related to each structure have been summarized in Table 2.2. In this model, local equilibrium is assumed to exist between the adsorbed and the gas species within the pores (i.e. there is only pore resistance in the system).
The total mass transfer coefficient can be represented as follow:
pf kkk
111 (2.6)
where kf and kp are film and pore mass transfer coefficients respectively. Table 2.2: Adsorption parameters related to each structured adsorbent, Paper B.
Adsorbent k a b
Pellet/Bead 0.35-0.4
Monolith
Laminate
Foam 0.75-0.85
e
p
f DR
k 51
1
pR3
p
b
R)(13
21
22
12RR
R 2
21
12RR
R
ef DRRR
k 1
21
22
41
1
1
2R
b
ef DW
k 61
1
db2
W2
Wdd2
e
P
f DR
k 41
1
p
b
R2
pR2
For linear adsorption isotherm models, the contribution of dispersion can alternatively be estimated by adding the term DL/U2 to the mass transfer coefficient of the adsorbent [7], thus the overall rate constant is:
16 NUMERICAL SIMULATION
2
11UD
kkL
fermass_transoverall
(2.7)
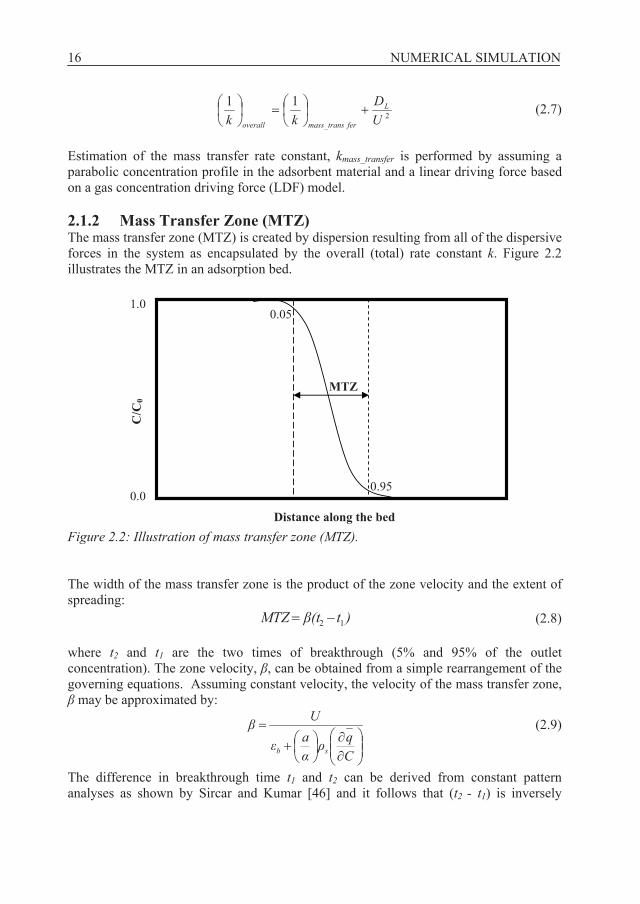
Estimation of the mass transfer rate constant, kmass_transfer is performed by assuming a parabolic concentration profile in the adsorbent material and a linear driving force based on a gas concentration driving force (LDF) model. 2.1.2 Mass Transfer Zone (MTZ) The mass transfer zone (MTZ) is created by dispersion resulting from all of the dispersive forces in the system as encapsulated by the overall (total) rate constant k. Figure 2.2 illustrates the MTZ in an adsorption bed.
0.95
0.05
MTZ
1.0
C/C
0
0.0
Distance along the bed Figure 2.2: Illustration of mass transfer zone (MTZ). The width of the mass transfer zone is the product of the zone velocity and the extent of spreading: )t(tMTZ 12 (2.8) where t2 and t1 are the two times of breakthrough (5% and 95% of the outlet concentration). The zone velocity, , can be obtained from a simple rearrangement of the governing equations. Assuming constant velocity, the velocity of the mass transfer zone, may be approximated by:
Cqa
U
sb
(2.9)
The difference in breakthrough time t1 and t2 can be derived from constant pattern analyses as shown by Sircar and Kumar [46] and it follows that (t2 - t1) is inversely

2.1 GENERAL CHARACTERISTICS OF ADSORBENTS, PAPERS B & F 17 proportional to the total rate constant, k , for constant pattern conditions i.e. (t2-t1) 1/( k ). Combining these equations gives proportionality for the mass transfer zone:
Cqkak
U MTZsb
(2.10)
This equation shows the major dependency of the MTZ on superficial velocity, U, and rate constant as well as geometric factors a and . 2.1.3 Pressure drop The pressure drop for pellets was estimated using the Ergun equation [12]:
2323
2 17511150 Ud
)(.Ud
)(LP
pp
(2.11)
where, and are density and viscosity of the flowing gas. For monolithic and laminate structures, the Hagen-Poiseuille equation [47] was applied:
UdL
P
bp2
32 (2.12)
The pressure drop in the foam adsorbents was calculated from equations recently proposed by Richardson et al. [48] in which the authors, based on the work of Gibson and Ashby [49] considered that the cellular medium is formed by uniform tri-dimensional cells.
23
23
221 11 U)s(U)(s
LP (2.13)
where 1 and 2 and s can be calculated using following expressions: (2.14) 098207430
1 1973 ..p )(d
(2.15) 07158075230
2 1368 ..p )(d
50
50
119710197912.
p
.
)(d])(.[.s (2.16)
2.1.4 Specific productivity In a gas separation process, the goal is usually to maximize specific productivity i.e. to be able to maximize throughput in a given amount of adsorbent [50]. It is therefore necessary to consider an appropriate combination of process parameters to demonstrate
18 NUMERICAL SIMULATION
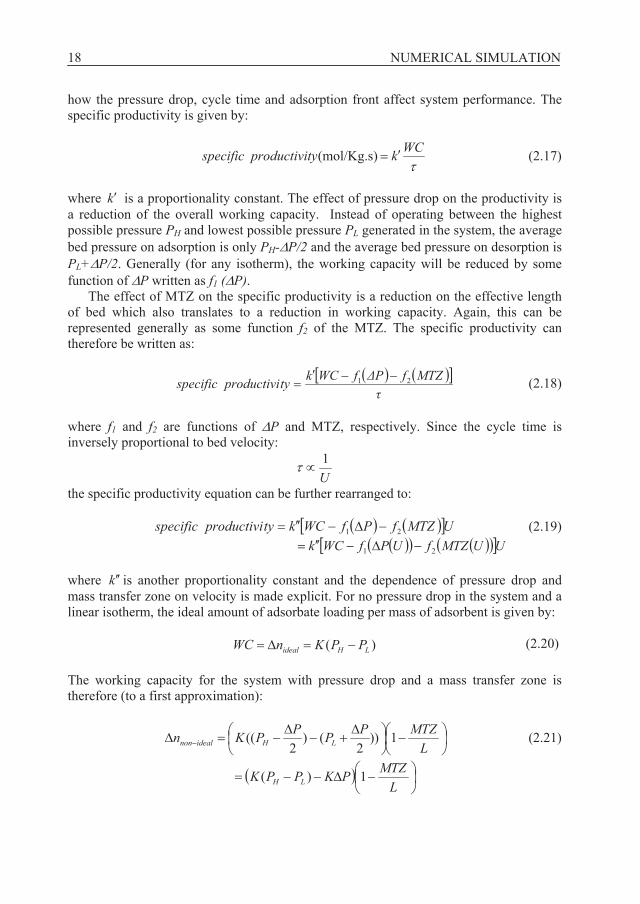
how the pressure drop, cycle time and adsorption front affect system performance. The specific productivity is given by:
WCktyproductivispecific (mol/Kg.s) (2.17)
where is a proportionality constant. The effect of pressure drop on the productivity is a reduction of the overall working capacity. Instead of operating between the highest possible pressure PH and lowest possible pressure PL generated in the system, the average bed pressure on adsorption is only PH- P/2 and the average bed pressure on desorption is PL+ P/2. Generally (for any isotherm), the working capacity will be reduced by some function of P written as f1 ( P).
k
The effect of MTZ on the specific productivity is a reduction on the effective length of bed which also translates to a reduction in working capacity. Again, this can be represented generally as some function f2 of the MTZ. The specific productivity can therefore be written as:
MTZfPfWCktyproductivispecific 21 (2.18)
where f1 and f2 are functions of P and MTZ, respectively. Since the cycle time is inversely proportional to bed velocity:
U1
the specific productivity equation can be further rearranged to: UMTZfPfWCktyproductivispecific 21 (2.19)
UUMTZfUPfWCk 21 where is another proportionality constant and the dependence of pressure drop and mass transfer zone on velocity is made explicit. For no pressure drop in the system and a linear isotherm, the ideal amount of adsorbate loading per mass of adsorbent is given by:
k
(2.20)
)( LHideal PPKnWC
The working capacity for the system with pressure drop and a mass transfer zone is therefore (to a first approximation):
L
MTZPPPPKn LHidealnon 1))2
()2
(( (2.21)
L
MTZPKPPK LH 1)(

2.1 GENERAL CHARACTERISTICS OF ADSORBENTS, PAPERS B & F 19
L
MTZPKnn idealidealnon 1 (2.22)
The specific productivity of the adsorbent system can hence be represented by the following correlation:
UL
MTZPKnktyproductivispecific ideal 1)( (2.23)
Equation 2.23 indicates that specific productivity is proportional to the superficial velocity and inversely proportional to MTZ and P. Therefore any factor affecting the MTZ and P may influence the specific productivity. Specifically, the trade-off in specific productivity as a function of velocity is clear. 2.1.5 Heat transfer models A one dimensional mathematical model was developed to simulate the column behavior in terms of temperature profiles under two different non-isothermal conditions: adiabatic and non-adiabatic [51]. For a non-isothermal system, a differential energy balance for the adsorbate in the gas phase flowing through the bed gives:
)-T(TRh)T-a(Th)(
z)(UTC
zT
tTC wb
wb
wb
b
bbpgg
bL
bpgg
212
2
(2.24)
where Cpg is bulk heat capacity, h is heat transfer coefficient between the gas and solid phases, hw is heat transfer coefficient between the gas and adsorber wall, L is thermal axial dispersion coefficient, Rw is adsorber wall radius and Tb and T are respectively, bulk and adsorbent temperatures. A differential heat balance for the adsorbate inside the solid phase is given by:
TThtqH)()(
tTC bsppss 1 (2.25)
where - H is the isosteric heat of adsorption. Linear driving force model (LDF) was used for estimating the rate of adsorption. The temperature-dependent Dual-Site Langmuir isotherm equation was considered to represent adsorption equilibrium:
jjii
ii
jjii
iii PdPd
PdmPbPb
Pbmq11
21 (2.26)
where temperature dependent parameters bi and di are given by:
TR
HddTR
Hbb iii
iii
20
10 exp;exp (2.27)

20 NUMERICAL SIMULATION
Concerning the heat transfer through the column wall, the following equation was used to describe the energy balance in the column wall:
0)()( 21w outwwwwbwww
pw TTUaTThat
TC (2.28)
where aw1 and aw2 are wall internal and logarithmic specific surface areas respectively, Uw is global heat transfer coefficient and Tout is ambient temperature. The aw1 and aw2 are calculated using the following expressions:
)(1
wwww tdt
wda
w
wwww
w
dtdtd
aln)(
12 (2.29)
in which tw and dw are respectively column wall thickness and internal column wall diameter. The initial and boundary conditions applied to above equations are: Tb (t = 0) = 0, 0)0(tq , 00 )(tT (2.30) Tb (z = 0) = T0 (2.31)
0Lz
b
zT (2.32)
Applying the analogy with mass transfer, the heat transfer coefficients corresponding to each structure were calculated using the appropriate correlations; the details are given in papers B and F.
2.2 Zeolite coated monolith performance, Papers C & E The goal of the work described in paper C was to prepare zeolite coated monoliths and evaluate their adsorption performance by breakthrough experiments. The mass transfer coefficient k and the effective diffusivity De in the zeolite adsorbents were estimated from breakthrough data. The analytical solution for the breakthrough front by Klinkenberg was used [7, 52]:
)(erfccc
81
81
21
0
(2.33)
= b
b
vkKz 1 (2.34)
= k(t – z/v) (2.35) where c/c0 is the dimensionless concentration and and are dimensionless bed length and time, respectively. The Klinkenberg solution is valid for isothermal plug flow
2.2 ZEOLITE COATED MONOLITH PERFORMANCE, PAPERS C & E 21 systems in which a single trace component with linear adsorption isotherm is adsorbed. The mass transfer coefficient k in the model was fitted to experimental data by minimizing the sum S of squared residuals:
2
1 exp0mod0
n
i elcc
ccS (2.36)
where n is the number of data points. In paper E, gas transport in the monolith adsorbent was modelled considering a single
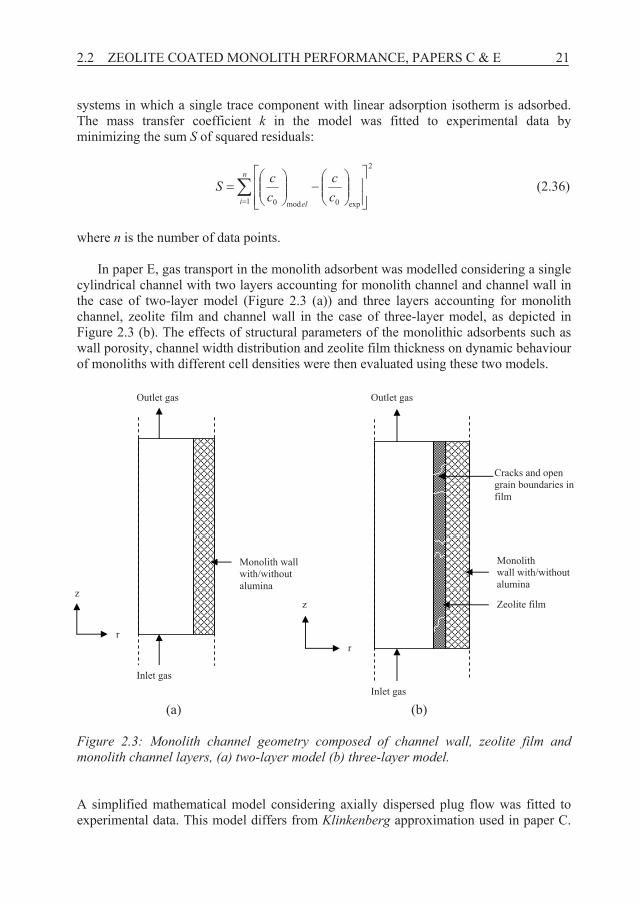
cylindrical channel with two layers accounting for monolith channel and channel wall in the case of two-layer model (Figure 2.3 (a)) and three layers accounting for monolith channel, zeolite film and channel wall in the case of three-layer model, as depicted in Figure 2.3 (b). The effects of structural parameters of the monolithic adsorbents such as wall porosity, channel width distribution and zeolite film thickness on dynamic behaviour of monoliths with different cell densities were then evaluated using these two models.
(a) (b)
Monolith wall with/without alumina
Inlet gas
Outlet gas
Monolith wall with/without alumina
Zeolite film
Cracks and open grain boundaries in film
r
z
Outlet gas
Inlet gas
r
z
Figure 2.3: Monolith channel geometry composed of channel wall, zeolite film and monolith channel layers, (a) two-layer model (b) three-layer model. A simplified mathematical model considering axially dispersed plug flow was fitted to experimental data. This model differs from Klinkenberg approximation used in paper C.

22 NUMERICAL SIMULATION
The set of conservation equations describing adsorptive behaviour of coated monoliths are as follows. The component mass balance in the gas phase is given by:
tq
zCU
zCD
tC
sb
bL
12
2
(2.37)
The component mass balance in the solid phase, i.e. the zeolite and/or alumina particles, is expressed by:
qqktq
i * (2.38)
in this particular model, ki is expressed by 23
i
ii l
Dk where li is diffusion length. In the
two-layer model (Figure 2.3(a)), a modified version of equation (2.38) was used for adsorbate mass balance in monolith wall to account for gas uptake due to pore filling in the voids of the monolith wall and was taken as:
CCaktq
p (2.39)
Cwhere is adsorbate concentration in the pores of monolith wall and a is the pore
he goal of the work described in paper D was to prepare zeolite coated monoliths and
volume of the monolith wall (cm3/gmonolith). The initial and boundary conditions appropriate to a breakthrough simulation for the above equations are given by equations 2.3-2.5. 2.3 VSA separation performance, Paper D Tevaluate their adsorption performance experimentally by breakthrough experiments. The mass transfer coefficients for the monoliths determined from breakthrough data were used to evaluate the VSA separation performance of the monoliths by modelling. A three-step VSA cycle of adsorption/desorption/re-pressurization was considered for evaluating system performance for structured adsorbents and conventional adsorbents in the form of beads (see Figure 2.4). Simulations of a three-step VSA cycle with a packed bed of conventional adsorbents and the structured adsorbents were performed using the adsorption simulator MINSA, (Monash Integrator for Numerical Simulation of Adsorption) which numerically solves the coupled partial differential equations of mass and energy balances using the finite volume method with flux limiters as described previously [53, 54]. The linear driving force (LDF) model was employed to model mass transfer. The experimentally recorded adsorption isotherms for CO2 and N2 over a range of temperatures were fitted to a Dual-Site Langmuir isotherm. The fitted parameters were calculated according to the equations 2.26 and 2.27.

2.4 CYCLIC ADSORPTION SIMULATION, PAPER F 23
In the first step, feed gas containing 10% CO2/N2 at different flow rates (0.2, 0.5 and 1 litre/minute) at 300 K and 1.2 bar pressure enters the bottom of the bed. The CO2 front propagates through the bed and the N2 exits to the atmosphere through the top of the bed. The position of the CO2 mass transfer front at the end of this step is controlled by monitoring the concentration of CO2 in the exit gas and adjusting the exit flow rate. In the second step, the bed is evacuated counter-currently and the bed pressure at the end of this step is controlled by adjusting the valve leading to the vacuum pump. In the third step, N2 is used to re-pressurize the bed to feed pressure in a counter-current direction. The CO2 recovery and purity is calculated to characterize the VSA performance using different adsorbent structures.
These simulations were performed to explore the behaviour of different adsorbent structures in particular to judge the merits of structured adsorbents at short cycle times, which correspond to high flow rates.
Step 2 Desorption
Step 1 Adsorption
Step 3 Re-
pressurization
WasteFeed Product Figure 2.4: Three-step VSA cycle used to assess the performance of adsorbent structures. It is worth noting that the three-step cycle tested here is not indicative of the typical cycle which would be used in an industrial CO2 capture plant [55]. However, the major steps of adsorption and desorption (regeneration) are captured, which is sufficient in order to demonstrate the impact of adsorbent structure on VSA performance. 2.4 Cyclic adsorption simulation, Paper F To demonstrate the potential advantage of structured adsorbents (i.e. laminate, monolith and foam) under conditions of known variation in external concentration (or pressure), the simulation of an adsorbent structure under PSA condition was considered. The PSA cycle involves two steps: adsorption and desorption. The simulations are accomplished by switching the boundary conditions cyclically to account for pressure change at the

24 NUMERICAL SIMULATION
surface of adsorbent during pressurization (adsorption) and depressurization (desorption). A cyclic adsorption process as described below was used. The adsorption step finishes when the CO2 partial pressure at the product end of the column reaches 95% of the feed partial pressure. During the desorption step, the product end is closed and the feed end is opened to desorb CO2. This step continues until 5% of feed partial pressure is reached.
For all simulations considered in this part, external mass transfer resistance at the external surface was included in the model. Each structure was simulated under both adiabatic and non-isothermal conditions, and the CO2 concentration was cycled between an upper value of C0 down to 0 for two dimensionless half cycle times: (dimensionless time for adsorption and desorption steps) c = 0.04 and 0.1. To ensure a valid comparison is made between each structure, the same amount of adsorbent mass per unit volume was assumed for all configurations.
CHAPTER 3
Results and discussion
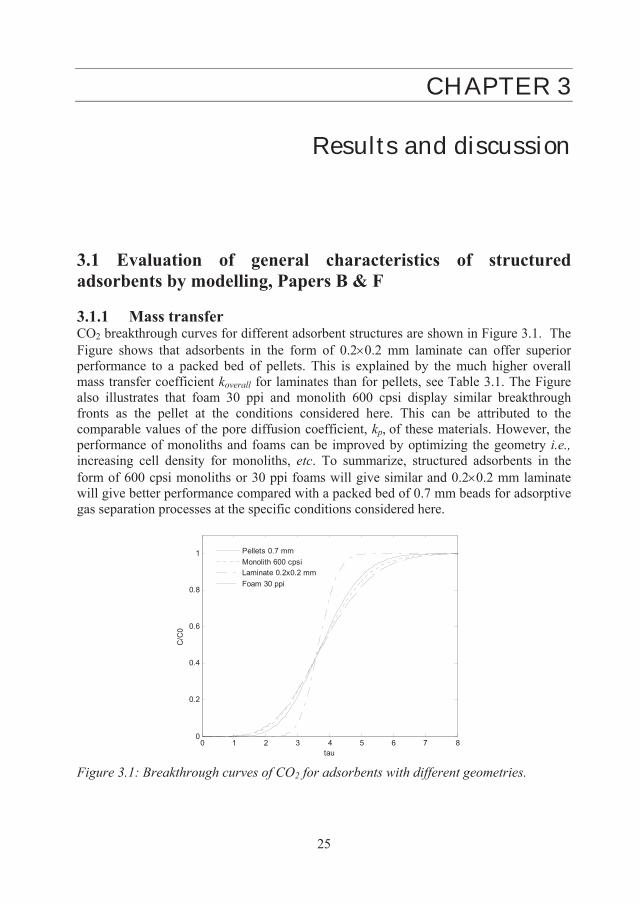
3.1 Evaluation of general characteristics of structured adsorbents by modelling, Papers B & F 3.1.1 Mass transfer CO2 breakthrough curves for different adsorbent structures are shown in Figure 3.1. The Figure shows that adsorbents in the form of 0.2 0.2 mm laminate can offer superior performance to a packed bed of pellets. This is explained by the much higher overall mass transfer coefficient koverall for laminates than for pellets, see Table 3.1. The Figure also illustrates that foam 30 ppi and monolith 600 cpsi display similar breakthrough fronts as the pellet at the conditions considered here. This can be attributed to the comparable values of the pore diffusion coefficient, kp, of these materials. However, the performance of monoliths and foams can be improved by optimizing the geometry i.e., increasing cell density for monoliths, etc. To summarize, structured adsorbents in the form of 600 cpsi monoliths or 30 ppi foams will give similar and 0.2 0.2 mm laminate will give better performance compared with a packed bed of 0.7 mm beads for adsorptive gas separation processes at the specific conditions considered here.
0 1 2 3 4 5 6 7 80
0.2
0.4
0.6
0.8
1
tau
C/C
0
Pellets 0.7 mmMonolith 600 cpsiLaminate 0.2x0.2 mmFoam 30 ppi
Figure 3.1: Breakthrough curves of CO2 for adsorbents with different geometries.
25
26 RESULTS AND DISCUSSION
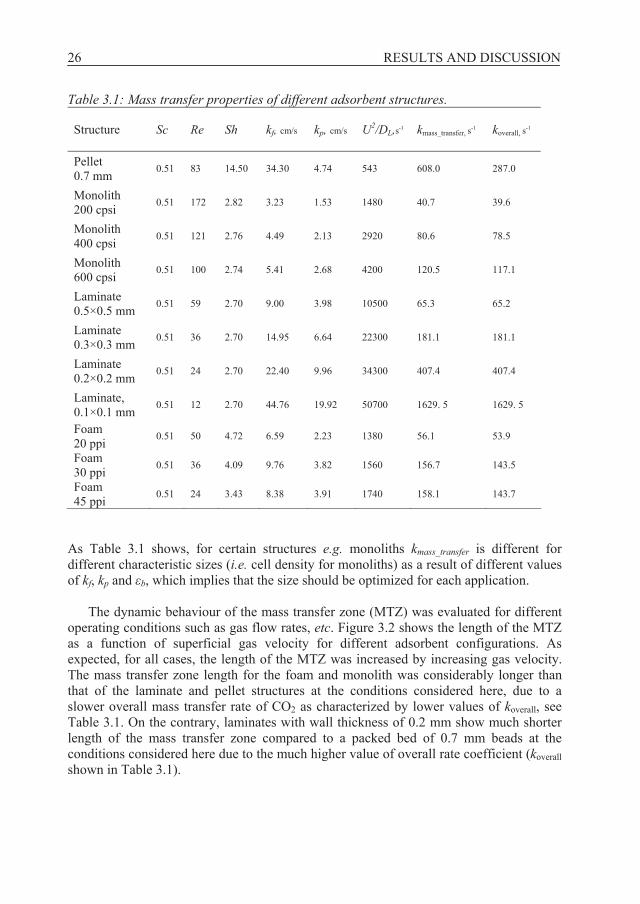
Table 3.1: Mass transfer properties of different adsorbent structures. Structure
Sc Re Sh kf, cm/s kp, cm/s U2/DL,s-1 kmass_transfer, s-1 koverall, s-1
Pellet 0.7 mm 0.51 83 14.50 34.30 4.74 543 608.0 287.0
Monolith 200 cpsi 0.51 172 2.82 3.23 1.53 1480 40.7 39.6
Monolith 400 cpsi 0.51 121 2.76 4.49 2.13 2920 80.6 78.5
Monolith 600 cpsi 0.51 100 2.74 5.41 2.68 4200 120.5 117.1
Laminate 0.5×0.5 mm 0.51 59 2.70 9.00 3.98 10500 65.3 65.2
Laminate 0.3×0.3 mm 0.51 36 2.70 14.95 6.64 22300 181.1 181.1
Laminate 0.2×0.2 mm 0.51 24 2.70 22.40 9.96 34300 407.4 407.4
Laminate, 0.1×0.1 mm 0.51 12 2.70 44.76 19.92 50700 1629. 5 1629. 5
Foam 20 ppi 0.51 50 4.72 6.59 2.23 1380 56.1 53.9
Foam 30 ppi 0.51 36 4.09 9.76 3.82 1560 156.7 143.5
Foam 45 ppi 0.51 24 3.43 8.38 3.91 1740 158.1 143.7
As Table 3.1 shows, for certain structures e.g. monoliths kmass_transfer is different for different characteristic sizes (i.e. cell density for monoliths) as a result of different values of kf, kp and b, which implies that the size should be optimized for each application.
The dynamic behaviour of the mass transfer zone (MTZ) was evaluated for different operating conditions such as gas flow rates, etc. Figure 3.2 shows the length of the MTZ as a function of superficial gas velocity for different adsorbent configurations. As expected, for all cases, the length of the MTZ was increased by increasing gas velocity. The mass transfer zone length for the foam and monolith was considerably longer than that of the laminate and pellet structures at the conditions considered here, due to a slower overall mass transfer rate of CO2 as characterized by lower values of koverall, see Table 3.1. On the contrary, laminates with wall thickness of 0.2 mm show much shorter length of the mass transfer zone compared to a packed bed of 0.7 mm beads at the conditions considered here due to the much higher value of overall rate coefficient (koverall shown in Table 3.1).

3.1 GENERAL CHARACTERISTICS OF ADSORBENTS, PAPERS B & F 27
0
5
10
15
20
25
10 20 30 50 100
Velocity, cm/s
MTZ
,cm
Bead 0.7 mmMonolith 600 cpsiLaminate 0.2 mmFoam 30 ppi
Figure 3.2: Length of MTZ for pellet, laminate, foam and monolith as a function of gas velocity.
3.1.2 Pressure drop Figure 3.3 shows the pressure drops associated with different adsorbent configurations for superficial velocities ranging from 0.1 to 1 m/s. The Figure illustrates that the low density monolith (200 cpsi) exhibited the lowest pressure drop, while as expected, the highest pressure drop was displayed by the beads (0.7 mm). The cell density of monoliths can be increased to increase adsorbent loading. The Figure also illustrates that increasing cell density of monoliths does not increase the pressure drop much and the monolithic adsorbents still display the lowest pressure drop compared to laminate, foam and beads. According to Giani et al. [56] and Patcas et al. [16], the pressure drop of foam structures is somewhat between those of monoliths and packed beds, as we observed.
1.E+00
1.E+02
1.E+04
10 100
Superficial velocity,cm/s
pres
sure
dro
p, P
a/cm
Bead 0.7mm Monolith 400cpsi Laminate 0.5mm
Foam 20ppi Monolith 200cpsi Monolith 600cpsi
Figure 3.3: Comparison of pressure drop for pellet, laminate foam and several monoliths as a function of superficial gas velocity.

28 RESULTS AND DISCUSSION
3.1.3 Heat effects Figure 3.4 shows breakthrough curves of the considered structured adsorbents in a non-isothermal, non-adiabatic system. Laminate 0.2×0.2 mm displays the sharpest breakthrough profile due to better mass transfer characteristics (i.e. larger kmass_transfer, see Table 3.1) than the other structures under the conditions studied. However, structured adsorbents in the form of laminate 0.2×0.2 mm result in earlier CO2 breakthrough compared to pellets because of lower adsorption capacity at higher bed temperature (338 K) when considering heat effects, see Figure 3.5. Although monolith 600 cpsi and foam 30 ppi adsorbents can dissipate the thermal effects more effectively than the pellets (with a temperature rise of 29 K and 13 K, respectively compared to 36 K for the pellets, see Figure 3.5) the monolith and foam adsorbents displayed more disperse breakthrough fronts compared to a bed of 0.7 mm pellets. This is mainly due to the larger mass transfer resistance indicated by lower values of kmass_transfer.
0.0
0.2
0.4
0.6
0.8
1.0
0 0.5 1 1.5 2Time, hour
C/C
0
Pellet 0.7 mm
Foam 30 ppi
Laminate 0.2x0.2
Monolith 600 cpsi
Figure 3.4: CO2 breakthrough curves for different structured adsorbents under non-isothermal, non-adiabatic conditions.
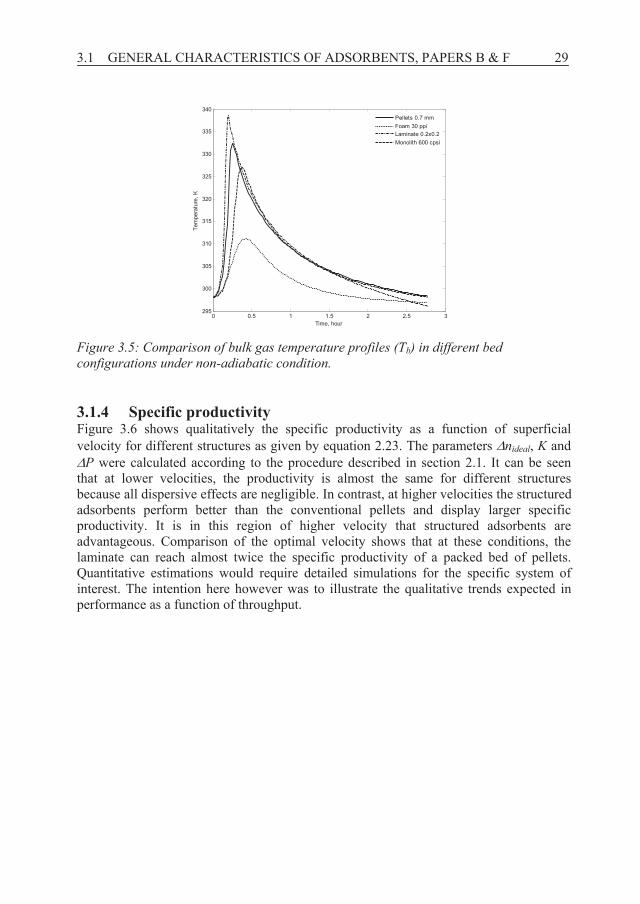
The bulk gas temperatures (Tb) as a function of time in beds of different adsorbents are shown in Figure 3.5. For all cases, the temperature starts to rise simultaneously with the CO2 breakthrough, i.e. there are both temperature and concentration fronts in the system as expected. The temperature rises up sharply as the result of adsorption and evolution of the heat of adsorption in the bed during the first few minutes to a maximum and starts to decrease as a result of heat loss from the column wall and by cooling from the gas flow. These results clearly reveal that thermal effects of adsorption can be managed by structured adsorbents characterized by more homogenous bed temperature. By using other support materials, with higher heat capacity, it should be possible to obtain even smaller heat effects and thus better performance.
3.1 GENERAL CHARACTERISTICS OF ADSORBENTS, PAPERS B & F 29
0 0.5 1 1.5 2 2.5 3295
300
305
310
315
320
325
330
335
340
Time, hour
Tem
pera
ture
, K
Pellets 0.7 mmFoam 30 ppiLaminate 0.2x0.2Monolith 600 cpsi
Figure 3.5: Comparison of bulk gas temperature profiles (Tb) in different bed configurations under non-adiabatic condition.
3.1.4 Specific productivity Figure 3.6 shows qualitatively the specific productivity as a function of superficial velocity for different structures as given by equation 2.23. The parameters nideal, K and
P were calculated according to the procedure described in section 2.1. It can be seen that at lower velocities, the productivity is almost the same for different structures because all dispersive effects are negligible. In contrast, at higher velocities the structured adsorbents perform better than the conventional pellets and display larger specific productivity. It is in this region of higher velocity that structured adsorbents are advantageous. Comparison of the optimal velocity shows that at these conditions, the laminate can reach almost twice the specific productivity of a packed bed of pellets. Quantitative estimations would require detailed simulations for the specific system of interest. The intention here however was to illustrate the qualitative trends expected in performance as a function of throughput.
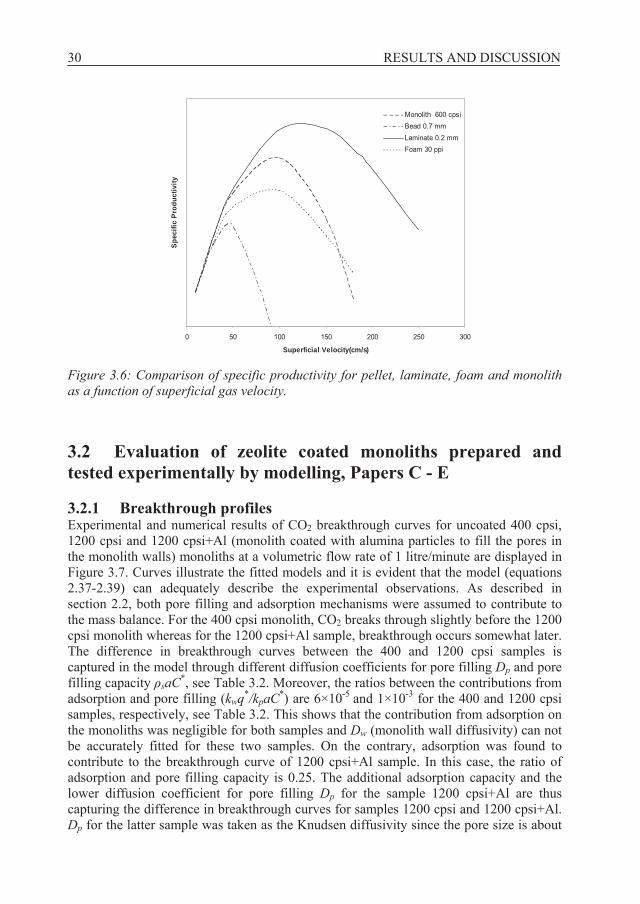
30 RESULTS AND DISCUSSION
0 50 100 150 200 250 300
Superficial Velocity(cm/s)
Spec
ific
Pro
duct
ivity
Monolith 600 cpsiBead 0.7 mmLaminate 0.2 mmFoam 30 ppi
Figure 3.6: Comparison of specific productivity for pellet, laminate, foam and monolith as a function of superficial gas velocity.
3.2 Evaluation of zeolite coated monoliths prepared and tested experimentally by modelling, Papers C - E 3.2.1 Breakthrough profiles Experimental and numerical results of CO2 breakthrough curves for uncoated 400 cpsi, 1200 cpsi and 1200 cpsi+Al (monolith coated with alumina particles to fill the pores in the monolith walls) monoliths at a volumetric flow rate of 1 litre/minute are displayed in Figure 3.7. Curves illustrate the fitted models and it is evident that the model (equations 2.37-2.39) can adequately describe the experimental observations. As described in section 2.2, both pore filling and adsorption mechanisms were assumed to contribute to the mass balance. For the 400 cpsi monolith, CO2 breaks through slightly before the 1200 cpsi monolith whereas for the 1200 cpsi+Al sample, breakthrough occurs somewhat later. The difference in breakthrough curves between the 400 and 1200 cpsi samples is captured in the model through different diffusion coefficients for pore filling Dp and pore filling capacity saC*, see Table 3.2. Moreover, the ratios between the contributions from adsorption and pore filling (kwq*/kpaC*) are 6×10⁻⁵ and 1×10⁻³ for the 400 and 1200 cpsi samples, respectively, see Table 3.2. This shows that the contribution from adsorption on the monoliths was negligible for both samples and Dw (monolith wall diffusivity) can not be accurately fitted for these two samples. On the contrary, adsorption was found to contribute to the breakthrough curve of 1200 cpsi+Al sample. In this case, the ratio of adsorption and pore filling capacity is 0.25. The additional adsorption capacity and the lower diffusion coefficient for pore filling Dp for the sample 1200 cpsi+Al are thus capturing the difference in breakthrough curves for samples 1200 cpsi and 1200 cpsi+Al. Dp for the latter sample was taken as the Knudsen diffusivity since the pore size is about

3.2 ZEOLITE COATED MONOLITH PERFORMANCE, PAPERS C - E 31
0.1 m and the mean free path of CO2 at 300 K and 1 atm is approximately the same, indicating that the diffusion is mostly of Knudsen type.
The results show that for the supports not coated with alumina, the breakthrough behaviour may be explained by pore filling in the voids of the monolith walls whereas both pore filling and adsorption affect the breakthrough behaviour of the support treated with alumina. It is worth pointing out here that due to high adsorption capacity of traditional adsorbents, pore filling is unimportant as opposed to the monolith supports with very low adsorption capacity. Our obtained values of macropore diffusivities are close to previously reported data for CO2 adsorption on NaX adsorbent using uptake curve measurements [29]. The parameters determined for the three monolith supports using the two-layer model were then used in the three-layer model for the zeolite coated monoliths.
0
0.2
0.4
0.6
0.8
1
1.2
0 50 100 150
Time, s
C/C
0
400 cpsi1200 cpsi1200 cpsi+AlModel
Figure 3.7: Experimental (points) and simulated (lines) breakthrough curves of carbon dioxide of uncoated monoliths at 1 litre/minute of 10% CO2 in N2.
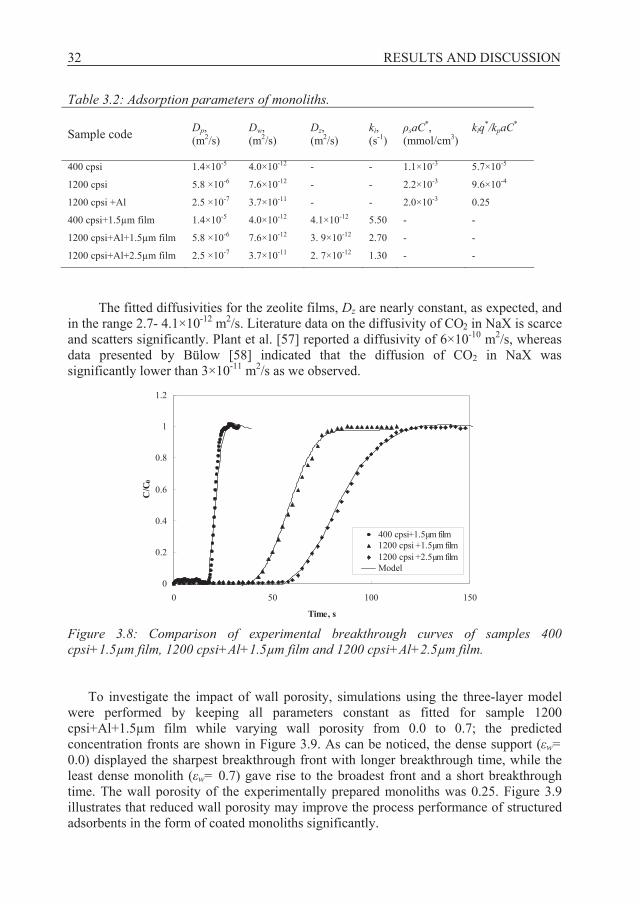
There was a good fit between the three-layer model and experimental data for all zeolite coated samples, see Figure 3.8. The breakthrough time is shortest for the 400 cpsi+1.5μm film followed by the 1200 cpsi+Al+1.5μm film and finally the 1200 cpsi+Al+2.5μm film; this trend is in agreement with the zeolite loading data of the samples. The differences between the breakthrough curves are captured in the model by differences in the support parameters as described above and in addition, differences in zeolite film thickness. The mass transfer coefficients ki decreased with increasing zeolite film as could be expected, see Table 3.2.
32 RESULTS AND DISCUSSION
Table 3.2: Adsorption parameters of monoliths. Sample code
Dp, (m2/s)
Dw, (m2/s)
Dz, (m2/s)
ki, (s-1)
saC*,
(mmol/cm3)
kiq*/kpaC*
400 cpsi 1.4×10⁻⁵ 4.0×10⁻¹² - - 1.1×10⁻³ 5.7×10⁻⁵
1200 cpsi 5.8 ×10⁻⁶ 7.6×10⁻¹² - - 2.2×10⁻³ 9.6×10⁻⁴
1200 cpsi +Al 2.5 ×10⁻⁷ 3.7×10⁻¹¹ - - 2.0×10⁻³ 0.25
400 cpsi+1.5μm film 1.4×10⁻⁵ 4.0×10⁻¹² 4.1×10⁻¹² 5.50 - -
1200 cpsi+Al+1.5μm film 5.8 ×10⁻⁶ 7.6×10⁻¹² 3. 9×10-12 2.70 - -
1200 cpsi+Al+2.5μm film 2.5 ×10⁻⁷ 3.7×10⁻¹¹ 2. 7×10-12 1.30 - -
The fitted diffusivities for the zeolite films, Dz are nearly constant, as expected, and in the range 2.7- 4.1×10⁻¹² m2/s. Literature data on the diffusivity of CO2 in NaX is scarce and scatters significantly. Plant et al. [57] reported a diffusivity of 6×10⁻¹⁰ m2/s, whereas data presented by Bülow [58] indicated that the diffusion of CO2 in NaX was significantly lower than 3×10-11 m2/s as we observed.
0
0.2
0.4
0.6
0.8
1
1.2
0 50 100
Time, s
C/C
0
150
400 cpsi+1.5μm film1200 cpsi +1.5μm film1200 cpsi +2.5μm filmModel
Figure 3.8: Comparison of experimental breakthrough curves of samples 400 cpsi+1.5μm film, 1200 cpsi+Al+1.5μm film and 1200 cpsi+Al+2.5μm film.
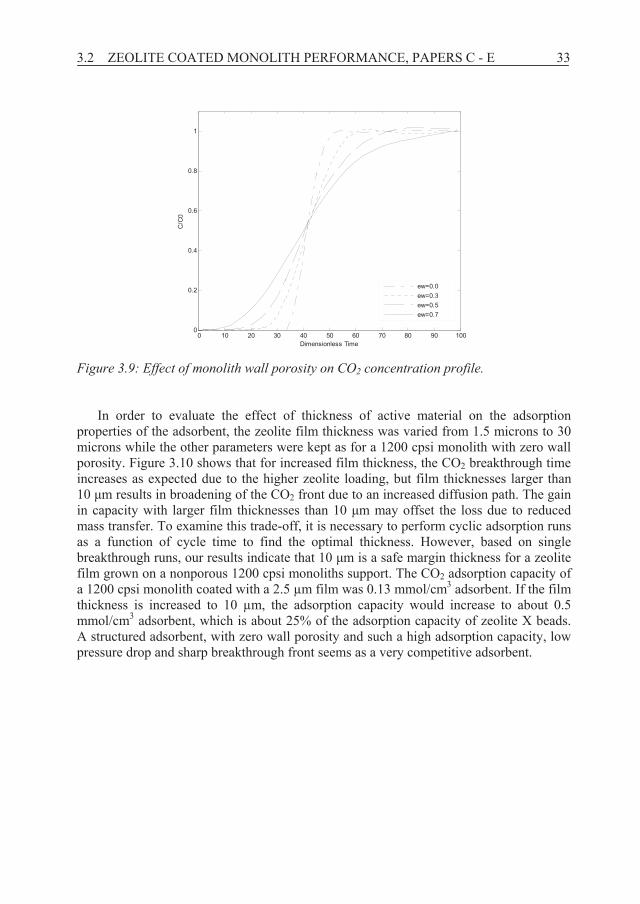
To investigate the impact of wall porosity, simulations using the three-layer model were performed by keeping all parameters constant as fitted for sample 1200 cpsi+Al+1.5μm film while varying wall porosity from 0.0 to 0.7; the predicted concentration fronts are shown in Figure 3.9. As can be noticed, the dense support ( w= 0.0) displayed the sharpest breakthrough front with longer breakthrough time, while the least dense monolith ( w= 0.7) gave rise to the broadest front and a short breakthrough time. The wall porosity of the experimentally prepared monoliths was 0.25. Figure 3.9 illustrates that reduced wall porosity may improve the process performance of structured adsorbents in the form of coated monoliths significantly.
3.2 ZEOLITE COATED MONOLITH PERFORMANCE, PAPERS C - E 33
0 10 20 30 40 50 60 70 80 90 1000
0.2
0.4
0.6
0.8
1
Dimensionless Time
C/C
0
ew=0.0ew=0.3 ew=0.5ew=0.7
Figure 3.9: Effect of monolith wall porosity on CO2 concentration profile.
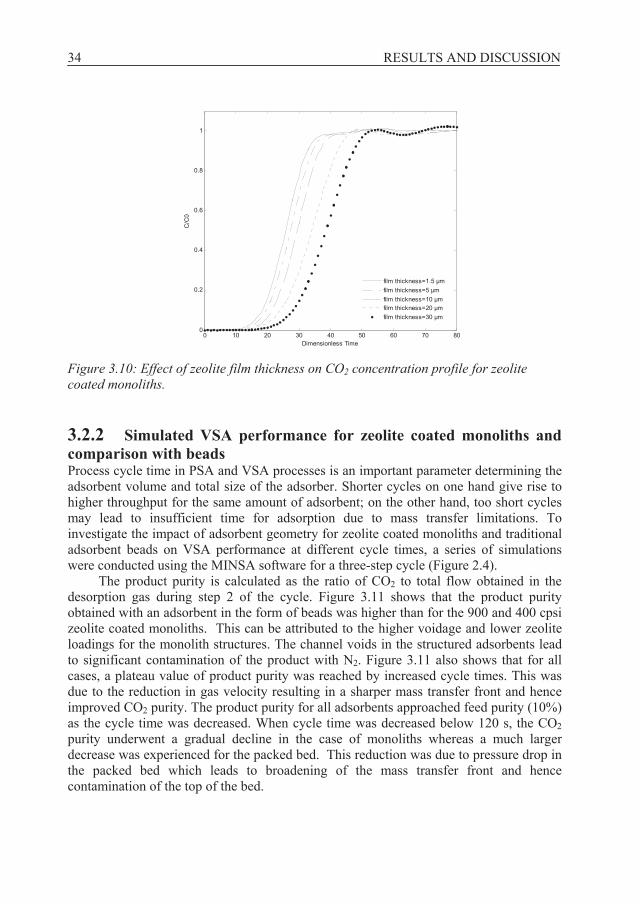
In order to evaluate the effect of thickness of active material on the adsorption properties of the adsorbent, the zeolite film thickness was varied from 1.5 microns to 30 microns while the other parameters were kept as for a 1200 cpsi monolith with zero wall porosity. Figure 3.10 shows that for increased film thickness, the CO2 breakthrough time increases as expected due to the higher zeolite loading, but film thicknesses larger than 10 m results in broadening of the CO2 front due to an increased diffusion path. The gain in capacity with larger film thicknesses than 10 m may offset the loss due to reduced mass transfer. To examine this trade-off, it is necessary to perform cyclic adsorption runs as a function of cycle time to find the optimal thickness. However, based on single breakthrough runs, our results indicate that 10 m is a safe margin thickness for a zeolite film grown on a nonporous 1200 cpsi monoliths support. The CO2 adsorption capacity of a 1200 cpsi monolith coated with a 2.5 μm film was 0.13 mmol/cm3 adsorbent. If the film thickness is increased to 10 μm, the adsorption capacity would increase to about 0.5 mmol/cm3 adsorbent, which is about 25% of the adsorption capacity of zeolite X beads. A structured adsorbent, with zero wall porosity and such a high adsorption capacity, low pressure drop and sharp breakthrough front seems as a very competitive adsorbent.
34 RESULTS AND DISCUSSION
0 10 20 30 40 50 60 70 800
0.2
0.4
0.6
0.8
1
Dimensionless Time
C/C
0
film thickness=1.5 μmfilm thickness=5 μmfilm thickness=10 μmfilm thickness=20 μmfilm thickness=30 μm
Figure 3.10: Effect of zeolite film thickness on CO2 concentration profile for zeolite coated monoliths.
3.2.2 Simulated VSA performance for zeolite coated monoliths and comparison with beads Process cycle time in PSA and VSA processes is an important parameter determining the adsorbent volume and total size of the adsorber. Shorter cycles on one hand give rise to higher throughput for the same amount of adsorbent; on the other hand, too short cycles may lead to insufficient time for adsorption due to mass transfer limitations. To investigate the impact of adsorbent geometry for zeolite coated monoliths and traditional adsorbent beads on VSA performance at different cycle times, a series of simulations were conducted using the MINSA software for a three-step cycle (Figure 2.4).
The product purity is calculated as the ratio of CO2 to total flow obtained in the desorption gas during step 2 of the cycle. Figure 3.11 shows that the product purity obtained with an adsorbent in the form of beads was higher than for the 900 and 400 cpsi zeolite coated monoliths. This can be attributed to the higher voidage and lower zeolite loadings for the monolith structures. The channel voids in the structured adsorbents lead to significant contamination of the product with N2. Figure 3.11 also shows that for all cases, a plateau value of product purity was reached by increased cycle times. This was due to the reduction in gas velocity resulting in a sharper mass transfer front and hence improved CO2 purity. The product purity for all adsorbents approached feed purity (10%) as the cycle time was decreased. When cycle time was decreased below 120 s, the CO2 purity underwent a gradual decline in the case of monoliths whereas a much larger decrease was experienced for the packed bed. This reduction was due to pressure drop in the packed bed which leads to broadening of the mass transfer front and hence contamination of the top of the bed.

3.2 ZEOLITE COATED MONOLITH PERFORMANCE, PAPERS C - E 35
0
10
20
30
40
50
60
0 50 100 150 200 250 300
cycle time, s
Puri
ty %
NaX beads900 cpsi + 1.6 μm film400 cpsi + 1.5 μm film
Figure 3.11: Product purity as a function of cycle time for different adsorbents. Product recovery is defined as the total amount of CO2 recovered during step 2
(evacuation step) to the total CO2 amount fed to the system. Figure 3.12 shows that the recovery obtained with the structured adsorbents was higher than that obtained with the packed bed. This was directly related to the sharpness of the mass transfer front during the feed step. The sharper front for the structured adsorbents resulted in less breakthrough of CO2 during step 1 and therefore a higher recovery in the product stream. The CO2 recovery is a function of CO2 working capacity (WC) which decreases as cycle time decreases. As evident from Figure 3.12, in the case of 400 and 900 cpsi zeolite coated monoliths, a decrease from 86% to 75% and 90% to 80% occurred respectively when cycle time was decreased from 205 to 15 s, while in the case of NaX pellets, the recovery only reaches 80% for long cycle times. Longer cycle time gives higher purity and recovery because the lower resulting velocities lead to sharper mass transfer zones. The recovery could be improved by replacing the three-step cycle with a more complex cycle incorporating product rinse and pressure equalisation. However, the scope of the VSA simulation was not to optimize system performance but rather to explore and illustrate the advantages and disadvantages of structured adsorbents versus conventional adsorbent beads.
As expected, all three adsorbents displayed a hyperbolic pattern for productivity as a function of cycle time as suggested by equation 2.23. The throughput was highest for a packed bed because of the higher zeolite loading per unit volume. However, at very short cycle times beads followed the expected inverse trend of productivity and structured adsorbents displayed larger throughput than the packed bed. It was clear that the dispersive effects of pressure drop and mass transfer were becoming more important at shorter cycle times for the packed bed. Cycle times below 15 s eventually lead to a drop in throughput for the packed bed as observed in Figure 3.13. Thus the structured adsorbents show promising performance at short cycle times provided that higher zeolite loadings can be obtained.

36 RESULTS AND DISCUSSION
30
40
50
60
70
80
90
100
0 50 100 150 200 250 300
cycle time, s
Rec
over
y %
NaX beads400 cpsi + 1.5 μm film900 cpsi + 1.6 μm film
Figure 3.12: Product recovery as a function of cycle time for different adsorbents.
0
5
10
15
20
25
30
35
0 50 100 150 200 250 300
cycle time, s
Thr
ough
put (
kg/m
3 hr)
NaX beads400 cpsi + 1.5 μm film900 cpsi + 1.6 μm film
0
5
10
15
20
25
30
35
0 10 20 30
Figure 3.13: Productivity as a function of cycle time for different adsorbents.
3.3 Cyclic adsorption simulation considering thermal effects, Paper F Thermal effects were investigated for four different configurations of adsorbents i.e. 0.7 mm pellet, 0.2×0.2 mm laminate, 600 cpsi monolith and 30 ppi foam; some of the properties of these adsorbents are given in Table 3.1. Figure 3.14 shows the CO2 loading

3.3 CYCLIC ADSORPTION SIMULATION, PAPER F 37
profiles for dimensionless half cycle times (dimensionless time for adsorption and desorption steps) of 0.1 (a) and 0.04 (b), respectively. The cycle simulation was performed according to the procedure described in section 2.4 under non-isothermal, non-adiabatic conditions. The plots display the adsorbate loading for the duration of the cyclic steady state. The difference in CO2 loadings for pellets compared to the other structures is quite substantial, especially at shorter cycle time. Again, these results illustrate that structured adsorbents are most suited for short cycle times, where their superiority is displayed. At the conditions studied here, the laminate structures exhibit best performance at both dimensionless cycle times as evident from the highest CO2 loading, however the other structured adsorbents are not that inferior and their performance could be improved by optimizing the geometry. These results show that structured adsorbents are good candidates for advanced PSA units where the aim is to run as short cycles as possible in order to reduce the adsorbent inventory. A similar trend was observed for adsorbents under adiabatic conditions.
0.4 0.45 0.5 0.55 0.60
0.1
0.2
0.3
0.4
0.5
0.6
0.7
0.8
0.9
Dimensionless Time
Dim
ensi
onle
ss C
O2
Load
ing
Pellets 0.7 mmLaminate 0.2x0.2Monolith 600 cpsiFoam 30 ppi
0.72 0.74 0.76 0.78 0.8 0.82
0.3
0.35
0.4
0.45
0.5
0.55
0.6
0.65
0.7
Dimensionless Time
Dim
ensi
onle
ss C
O2
Load
ing
Pellets 0.7 mmLaminate 0.2x0.2Monolith 600 cpsiFoam 30 ppi
(a) (b)
Figure 3.14: Dimensionless CO2 loading in a two-step PSA cycle with half cycle times of c= 0.1 (a) and of c= 0.04 (b) for different adsorbent structures.
To further examine the performance of laminate structures, simulations of the dimensionless CO2 loading for different thickness and spacing of the laminates are shown in Figure 3.15. This Figure illustrates that the laminates with thickness and spacing of 0.5 mm and less perform better, while laminates with thickness and spacing of 0.7 mm performs worse than 0.7 mm pellets. These results show that the replacement of conventional adsorbents with structured adsorbents is only beneficial when structured adsorbents with appropriate dimensions are used. The same conclusion holds for monoliths and foams.
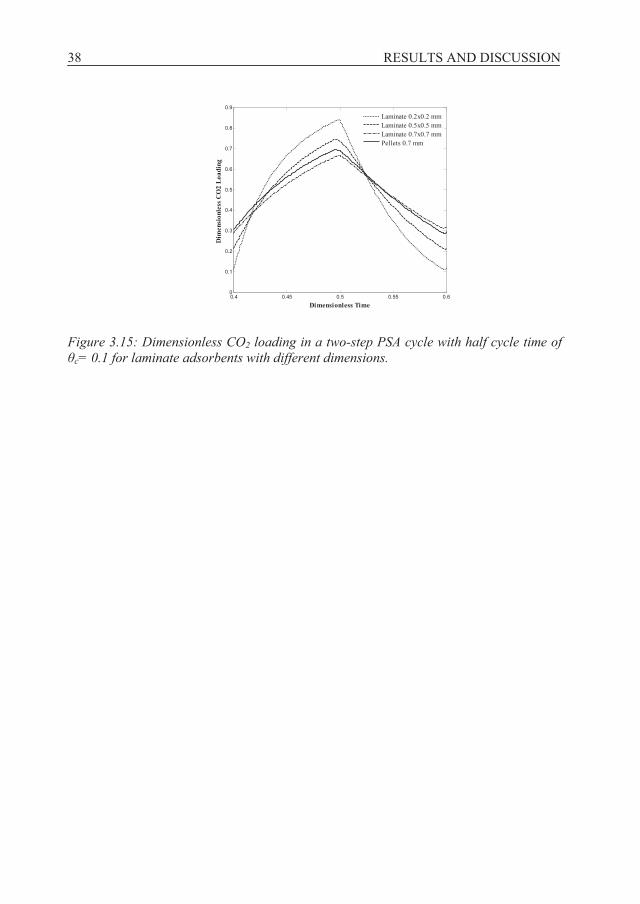
38 RESULTS AND DISCUSSION
0.4 0.45 0.5 0.55 0.60
0.1
0.2
0.3
0.4
0.5
0.6
0.7
0.8
0.9
Dimensionless Time
Dim
ensi
onle
ss C
O2
Load
ing
Laminate 0.2x0.2 mmLaminate 0.5x0.5 mmLaminate 0.7x0.7 mmPellets 0.7 mm
Figure 3.15: Dimensionless CO2 loading in a two-step PSA cycle with half cycle time of c= 0.1 for laminate adsorbents with different dimensions.

CHAPTER 4
Conclusions
4.1 Conclusions The impact of geometry of structured adsorbents on overall performance of adsorption-based gas separation systems has been studied using experiments and modelling. The main finding was that structured adsorbents with optimized geometry are potentially better adsorbents compared to traditional adsorbents at short cycle times. Two different approaches were used for the studies. The general approach was to evaluate general characteristics of structured adsorbents in gas separation systems by numerical modelling and this work showed that structured adsorbents with optimized geometry may provide following advantages compared to traditional adsorbents:
Lower pressure drop Better mass transfer properties characterized by sharper breakthrough fronts Better thermal management characterized by more uniform bed temperature Higher loading specially at short cycle time Higher throughput at optimum cycle time
The specific approach was to evaluate the performance of zeolite X coated monoliths
in CO2/N2 separation processes, both experimentally and by numerical modelling and the main outcomes of this work were:
Product purity in a VSA process using zeolite coated monoliths is reduced by higher voidage and lower zeolite loadings for the zeolite coated monoliths compared to beads. The channel voids in the structured adsorbents lead to significant contamination of the product with N2 and must be minimized in order to compete with traditional adsorbents. The product recovery in a VSA process using zeolite coated monoliths was higher compared to a process using beads thanks to the greater sharpness of the mass transfer front during the feed step for the structured adsorbents. Beads showed higher productivity at long cycle times, but at very short cycle times, the structured adsorbents showed higher productivity. The pores in the support introduced dispersion to the system by pore filling with gas, not adsorption, and the model indicated that the use of monoliths with lower
39

40 CONCLUSIONS
wall porosity would lead to less dispersion and thereby better performance of structured adsorbents. The model indicated that a zeolite X film with a thickness of 10 microns is optimal on a nonporous 1200 cpsi monolith for adsorption of CO2 from N2. The adsorption capacity of such a structured adsorbent would be about 25% of the adsorption capacity of zeolite X beads. A structured adsorbent, with such a high adsorption capacity, low pressure drop and sharp breakthrough front seems as a very competitive adsorbent.
CHAPTER 5
Future work
5.1 Future work Improved adsorbent materials are needed for the future improved gas separation processes. This study gives an insight in how these materials should be designed. However, there is still a need for research to address the following issues:
The models developed in the present work should be validated against real structures and then used to guide preparation of the materials. It would for instance be interesting to prepare a 10 μm zeolite film on a nonporous 1200 cpsi monolith and evaluate it experimentally.
The improved materials should be tested in a real rapid PSA or TSA processes.
The role of adsorbent morphology (pore size distribution, and interconnectivity of pores) on transport, separation and adsorption performance of structured adsorbents should be identified using the pore network modelling concept.
41

42 FUTURE WORK
REFERENCES [1] M. Suzuki, Adsorption Engineering (Chemical Engineering Monographs, Volume
25). New York: Elsevier, 1990. [2] RT. Yang, Gas Separation by Adsorption Processes (Series on Chemical
Engineering). London: Imperial College Press, 1997. [3] S. Auerbach, K. Carraco, P. Dutta, Handbook of Zeolite Science and Technology.
Upper Saddle River, New Jersey: Marcel Dekker, Inc., 2003. [4] C. Baerlocher, L. McCusker, D. Olson, Atlas of zeolite framework types. Netherlands:
Elsevier, 2007. [5] D. Breck, Zeolite molecular sieves: structure, chemistry and use. New York: Krieger Publ. Company, 1984. [6] S.H. Hyun, R.P. Danner,”Equilibrium adsorption of ethane, ethylene, isobutane, CO2,
and their binary mixtures on NaX molecular sieves”, J. Chem. Eng. Data., vol. 27, pp. 196-200, 1982.
[7] D. Ruthven, Principles of Adsorption and Adsorption Processes. John Wiley and Sons Inc., 1984.
[8] D. Ruthven, S. Farooq, K. Knaebel, Pressure Swing Adsorption. John Wiley and Sons
Inc., 1993. [9] T.C. Golden, C.M.A. Golden, D.P. Zwilling, “Self-supported structured adsorbent
fabric for gas separation”, U.S. Patent, US6565627, 2003. [10] P. Xiao, J. Zhang, P. Webley, G. Li, R. Singh, R. Todd, “Capture of CO2 from flue
gas streams with zeolite 13X by vacuum-pressure swing adsorption”, Adsorption, vol. 14, pp. 575-582, 2008.
[11] J. Smolarek, F.W. Leavitt, J.J. Nowobilski, V.E. Bergsten, J.H. Fassbaugh, “Radial
bed vacuum/pressure swing adsorber vessel”, European Patent, EP0820798, 1998. [12] S. Ergun, “Fluid flow through packed columns”, Chem. Eng. Prog., vol. 48, pp. 89-
94, 1952. [13] D.M. Ruthven, C. Thaeron, “Performance of a parallel passage adsorbent contactor”,
Gas. Sep. Purif., vol. 10, pp. 63-73, 1996.
43

44 REFERENCES [14] Y.Y. Li, S.P. Perera, B.D. Crittenden, “Zeolite monoliths for air separation, part 2:
Oxygen enrichment, pressure drop and pressurization”, Chem. Eng. Res. Des., vol. 76, pp. 921-930, 1998.
[15] A. Patton, B.D. Crittenden, S.P. Perera, “Use of the linear driving force
approximation to guide the design of monolithic adsorbents”, Chem. Eng. Res. Des., vol. 82, pp. 999-1009, 2004.
[16] F.C. Patcas, G.I. Garrido, B. Kraushaar-Czarnetzki, “CO oxidation over structured
carriers: A comparison of ceramic foams, honeycombs and beads”, Chem. Eng. Sci., vol. 62, pp. 3984-3990, 2007.
[17] S. Sircar, “Rapid thermal swing adsorption”, U.S. Patent, US0037672, 2003. [18] J. Collins, “Air separation by adsorption”, U.S. Patent, US4026680, 1977.
[19] V. Gueret, C. Monereau, P. Pullumbi, “PSA method using a composite adsorption bed comprising an adsorbent and PCM agglomerates”, W.I.P.O. Patent, WO2008037904, 2008.
[20] T.C. Golden, C.M.A. Golden, P.J. Battavio, “Multilayered adsorbent system for gas separations by pressure swing adsorption”, U.S. Patent, US6893483, 2005.
[21] E.J Rode, A.J.J. Boulet, A.M. Pelman, M.L. Babicki, B.G. Keefer, J.A. Sawad,
S. Alizadeh-khiavi, S. Roy, A.C. Gibbs, S.M. Kuznicki, “Engineered adsorbent structures for kinetic separation”, U.S. Patent, US7645324, 2010.
[22] A. Mosca, J. Hedlund, F.N. Ridha, P. Webley, “Optimization of synthesis
procedures for structured PSA adsorbents”, Adsorption, vol. 14, pp. 687-693, 2008. [23] O. Öhrman, J. Hedlund, J. Sterte, “Synthesis and evaluation of ZSM-5 films on
cordierite monoliths”, Appl. Catal. A:Gen., vol. 270, pp. 193-199, 2004. [24] J. Sterte, J. Hedlund, D. Creaser, O. Öhrman, Z. Wang, M. Lassinantti, Q. Li, F.
Jareman, “Application of the seed-film method for the preparation of structured molecular sieve catalysts”, Catal. Today, vol. 69, pp. 323-329, 2001.
[25] D.M. Ruthven, “Rectangular isotherm model for adsorption kinetics”, Ind. Eng.
Chem. Res., vol. 39, pp. 2127-2131, 2000. [26] A. Kodama, M. Goto, T. Hirose, T.J Kuma, “Experimental study of optimal
operation for a honeycomb adsorber operated with thermal swing”, Chem. Eng. Japan, vol. 26, pp. 530-535, 1993.
[27] K.P. Gadkaree, “Carbon honeycomb structures for adsorption applications”, Carbon,
vol. 36, pp. 981-989, 1998.
REFERENCES 45
[28] J.L. Williams, “Monolith structures, materials, properties and uses”, Catal. Today, vol. 69, pp. 3-9, 2002.
[29] L. Li, B. Xue, J. Chen, N. Guan, F. Zhang, D. Liu, H. Feng, “Direct synthesis of zeolite coatings on cordierite supports by in situ hydrothermal method”, Appl. Catal. A:Gen., vol. 292 pp. 312-321, 2005.
[30] A. Mosca, O. Öhrman, J. Hedlund, I. Perdana, D. Creaser, “NO2 and N2 sorption in
MFI films with varying Si/Al and Na/Al ratios”, Micropor. Mesopor. Mater., vol. 120, pp. 195-205, 2009.
[31] I. Perdana, D. Creaser, O. Öhrman, J. Hedlund, “A comparison of NOx adsorption
on Na, H and BaZSM-5 films”, Appl. Catal. B:Environ., vol. 72, pp. 82-91, 2007. [32] I. Perdana, D. Creaser, O. Öhrman, J. Hedlund, “NOx adsorption over a wide
temperature range on Na-ZSM-5 films”, J. Catal., vol. 234, pp. 219-229, 2005. [33] B.G. Keefer, C.R. Mclean, “High frequency rotary pressure swing adsorption
apparatus”, U.S. Patent, US6056804, 2000. [34] D.J. Connor, D.G. Doman, L. Jeziorowski, B.G. Keefer, B. Larisch, C. McLean, I.
Shaw, “Rotary pressure swing adsorption apparatus”, U.S. Patent, US6406523, 2002. [35] B.G. Keefer, A. Carel, B. Sellars, I. Shaw, B. Larisch, ”Adsorbent laminate
structures”, U.S. Patent, US6692626, 2004. [36] H.S. Kim, J.W. Kim, J.E. Yie, H. Moon, “Temperature-programmed adsorption and
characteristics of honeycomb hydrocarbon adsorbers”, Ind. Eng. Chem. Res., vol. 41, pp. 6589-6592, 2002.
[37] J.T. Richardson, D. Remue, J.K. Hung, “Properties of ceramic foam catalyst
supports: Mass and heat transfer” Appl. Catal. A:Gen., vol. 250, pp. 319-329, 2003. [38] J.A. Sawad, S. Alizadeh-Khiavi, S. Roy, S.M. Kuznicki, “High density adsorbent
structures”, W.I.P.O. Patent, WO2005032694, 2005. [39] K.B. Yoon, Y.J. Lee, Y.S. Park, J.S. Lee, “Macroporous foams comprising
microporous zeolite or zeotype material and preparation thereof by using polymeric templates having sponge structure”, W.I.P.O. Patent, WO2002028775, 2002.
[40] F.C. Buciuman, B. Kraushaar-Czarnetzki, “Preparation and characterization of
ceramic foam supported nanocrystalline zeolite catalysts”, Catal. Today, vol. 69, pp. 337-342, 2001.
[41] A. Bailey, F.A.P. Maggs, “Filter assemblies with layers of activated carbon fibrous
cloth”, U.S. Patent, US4234326, 1980.
46 REFERENCES
[42] W.B. Leedy, J.F. Eichelsbacher, T.H. Shelton, “Impregnated Monoliths”, U.S.
Patent, US200810236389, 2008. [43] L. Bonaccorsi, A. Freni, E. Proverbio, G. Restuccia, F. Russo, “Zeolite coated
copper foams for heat pumping applications”, Micropor. Mesopor. Mater., vol. 91, pp. 7-14, 2006.
[44] R.E. Critoph, T.Z. Telto, G.N.L. Davies, “A prototype of a fast cycle adsorption
refrigerator utilizing a novel carbon–aluminium laminate”, Proceedings of the institution of mechanical engineers, vol. 214, 2000.
[45] O. Öhrman, J. Hedlund, V. Msimang, K. Möller, “Thin ZSM-5 film catalysts on quartz and alumina supports”, Micropor. Mesopor. Mater., vol. 78, pp. 199-208, 2005.
[46] S. Sircar, R. Kumar, K.J. Anselmo, “Effects of column nonisothermality or nonadiabaticity on the adsorption breakthrough curves”, Ind. Eng. Chem. Proc. Des. Dev., vol. 22, pp. 10-15, 1983.
[47] A. Cybulski, J.A. Moulijn, Structured Catalysts and Reactors, New York: Marcel
Dekker, 1998. [48] J.T. Richardson, Y. Peng, D. Remue, “Properties of ceramic foam catalyst supports:
Pressure drop”, Appl. Catal. A: Gen., vol. 204, pp. 19-32, 2000. [49] L.J. Gibson, M.F. Ashby, Cellular Solids: Structure and Properties, London:
Cambridge University Press, 1997. [50] R.S. Todd, P.A. Webley, “Mass-Transfer Models for Rapid Pressure Swing
Adsorption Simulation”, AIChE J., vol. 52, pp. 3126-3145. [51] I. Pentchev, K. Paev, I. Seikova, “Dynamics of non-isothermal adsorption in packed
bed of biporous zeolites”, Chem. Eng. J., vol. 85, pp. 245-257, 2002. [52] A. Klinkenberg, “Heat Transfer in Cross-Flow heat Exchangers and Packed Beds”,
Ind. Eng. Chem., vol. 46, pp. 2285-2289, 1954. [53] P.A. Webley, J. He “Fast solution-adaptive finite volume method for PSA/VSA
cycle simulation; 1 single step simulation”, Comput. Chem. Eng., vol. 23, pp. 1701-1712, 2001.
[54] R.S. Todd, G.B. Ferraris, D. Manca, P.A. Webley, “Improved ODE integrator and
mass transfer approach for simulating a cyclic adsorption process”, Comput. Chem. Eng., vol. 27, pp. 883-899, 2003.

REFERENCES 47 [55] J. Zhang, P. Xiao, P.A. Webley “Cycle development and design for CO2 capture
from flue gas by vacuum swing adsorption”, Environ. Sci. Technol., vol. 42, pp. 563-569, 2008.
[56] L. Giani, G. Groppi, E. Tronconi, “Mass-transfer characterization of metallic foams
as supports for structured catalysts”, Ind. Eng. Chem. Res. vol. 44, pp. 4993-5002, 2005.
[57] D. Plant, H. Jobic, P. Llewellyn, G. Maurin, “Diffusion of CO2 in NaY and NaX
faujasite systems: quasi-elastic neutron scattering experiments and molecular dynamics simulations”, Eur. Phys. J. Special Top., vol. 141, pp. 127-132, 2007.
[58] M. Bülow, “Complex Sorption Kinetics of Carbon Dioxide in NaX-Zeolite Crystals”, Adsorption, vol. 8, pp. 9-14, 2002.

48 REFERENCES

Part II
49

50
PAPER A
Structured adsorbents in gas separation processes
Authors:F.Rezaei, P. Webley Separation and Purification Technology 70 (2010) 243 - 256
51

52 PAPER A
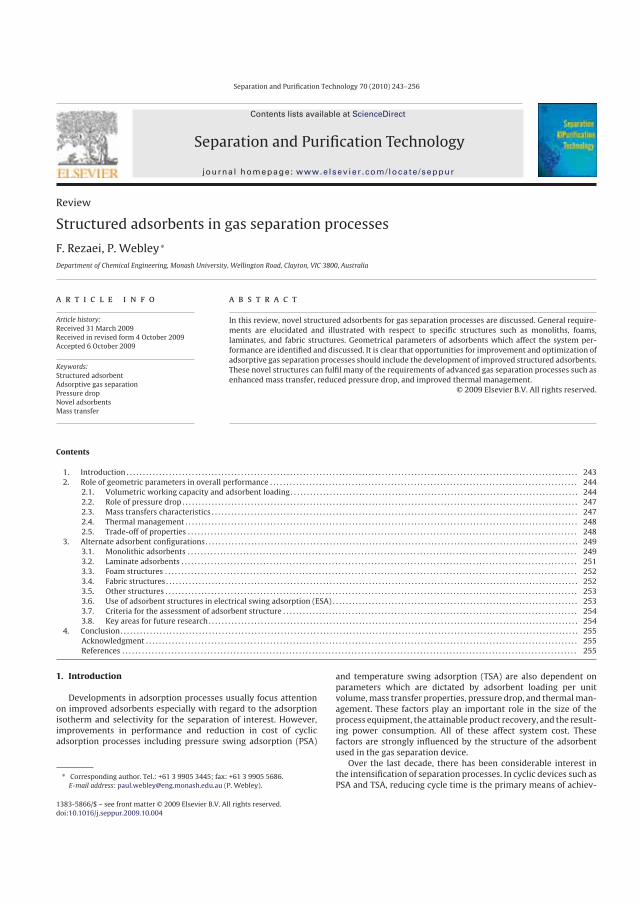
Separation and Purification Technology 70 (2010) 243–256
Contents lists available at ScienceDirect
Separation and Purification Technology
journa l homepage: www.e lsev ier .com/ locate /seppur
Review
Structured adsorbents in gas separation processes
F. Rezaei, P. Webley ∗
Department of Chemical Engineering, Monash University, Wellington Road, Clayton, VIC 3800, Australia
a r t i c l e i n f o
Article history:Received 31 March 2009Received in revised form 4 October 2009Accepted 6 October 2009
Keywords:Structured adsorbentAdsorptive gas separationPressure dropNovel adsorbentsMass transfer
a b s t r a c t
In this review, novel structured adsorbents for gas separation processes are discussed. General require-ments are elucidated and illustrated with respect to specific structures such as monoliths, foams,laminates, and fabric structures. Geometrical parameters of adsorbents which affect the system per-formance are identified and discussed. It is clear that opportunities for improvement and optimization ofadsorptive gas separation processes should include the development of improved structured adsorbents.These novel structures can fulfil many of the requirements of advanced gas separation processes such asenhanced mass transfer, reduced pressure drop, and improved thermal management.
© 2009 Elsevier B.V. All rights reserved.
Contents
1. Introduction . . . . . . . . . . . . . . . . . . . . . . . . . . . . . . . . . . . . . . . . . . . . . . . . . . . . . . . . . . . . . . . . . . . . . . . . . . . . . . . . . . . . . . . . . . . . . . . . . . . . . . . . . . . . . . . . . . . . . . . . . . . . . . . . . . . . . . . . . . 2432. Role of geometric parameters in overall performance . . . . . . . . . . . . . . . . . . . . . . . . . . . . . . . . . . . . . . . . . . . . . . . . . . . . . . . . . . . . . . . . . . . . . . . . . . . . . . . . . . . . . . . . . . . . . . 244
2.1. Volumetric working capacity and adsorbent loading . . . . . . . . . . . . . . . . . . . . . . . . . . . . . . . . . . . . . . . . . . . . . . . . . . . . . . . . . . . . . . . . . . . . . . . . . . . . . . . . . . . . . . . . 2442.2. Role of pressure drop . . . . . . . . . . . . . . . . . . . . . . . . . . . . . . . . . . . . . . . . . . . . . . . . . . . . . . . . . . . . . . . . . . . . . . . . . . . . . . . . . . . . . . . . . . . . . . . . . . . . . . . . . . . . . . . . . . . . . . . . . 2472.3. Mass transfers characteristics . . . . . . . . . . . . . . . . . . . . . . . . . . . . . . . . . . . . . . . . . . . . . . . . . . . . . . . . . . . . . . . . . . . . . . . . . . . . . . . . . . . . . . . . . . . . . . . . . . . . . . . . . . . . . . . . 2472.4. Thermal management . . . . . . . . . . . . . . . . . . . . . . . . . . . . . . . . . . . . . . . . . . . . . . . . . . . . . . . . . . . . . . . . . . . . . . . . . . . . . . . . . . . . . . . . . . . . . . . . . . . . . . . . . . . . . . . . . . . . . . . . 2482.5. Trade-off of properties . . . . . . . . . . . . . . . . . . . . . . . . . . . . . . . . . . . . . . . . . . . . . . . . . . . . . . . . . . . . . . . . . . . . . . . . . . . . . . . . . . . . . . . . . . . . . . . . . . . . . . . . . . . . . . . . . . . . . . . 248
3. Alternate adsorbent configurations . . . . . . . . . . . . . . . . . . . . . . . . . . . . . . . . . . . . . . . . . . . . . . . . . . . . . . . . . . . . . . . . . . . . . . . . . . . . . . . . . . . . . . . . . . . . . . . . . . . . . . . . . . . . . . . . . . 2493.1. Monolithic adsorbents . . . . . . . . . . . . . . . . . . . . . . . . . . . . . . . . . . . . . . . . . . . . . . . . . . . . . . . . . . . . . . . . . . . . . . . . . . . . . . . . . . . . . . . . . . . . . . . . . . . . . . . . . . . . . . . . . . . . . . . 2493.2. Laminate adsorbents . . . . . . . . . . . . . . . . . . . . . . . . . . . . . . . . . . . . . . . . . . . . . . . . . . . . . . . . . . . . . . . . . . . . . . . . . . . . . . . . . . . . . . . . . . . . . . . . . . . . . . . . . . . . . . . . . . . . . . . . . 2513.3. Foam structures . . . . . . . . . . . . . . . . . . . . . . . . . . . . . . . . . . . . . . . . . . . . . . . . . . . . . . . . . . . . . . . . . . . . . . . . . . . . . . . . . . . . . . . . . . . . . . . . . . . . . . . . . . . . . . . . . . . . . . . . . . . . . . 2523.4. Fabric structures . . . . . . . . . . . . . . . . . . . . . . . . . . . . . . . . . . . . . . . . . . . . . . . . . . . . . . . . . . . . . . . . . . . . . . . . . . . . . . . . . . . . . . . . . . . . . . . . . . . . . . . . . . . . . . . . . . . . . . . . . . . . . . 2523.5. Other structures . . . . . . . . . . . . . . . . . . . . . . . . . . . . . . . . . . . . . . . . . . . . . . . . . . . . . . . . . . . . . . . . . . . . . . . . . . . . . . . . . . . . . . . . . . . . . . . . . . . . . . . . . . . . . . . . . . . . . . . . . . . . . . 2533.6. Use of adsorbent structures in electrical swing adsorption (ESA) . . . . . . . . . . . . . . . . . . . . . . . . . . . . . . . . . . . . . . . . . . . . . . . . . . . . . . . . . . . . . . . . . . . . . . . . . . . 2533.7. Criteria for the assessment of adsorbent structure . . . . . . . . . . . . . . . . . . . . . . . . . . . . . . . . . . . . . . . . . . . . . . . . . . . . . . . . . . . . . . . . . . . . . . . . . . . . . . . . . . . . . . . . . . 2543.8. Key areas for future research . . . . . . . . . . . . . . . . . . . . . . . . . . . . . . . . . . . . . . . . . . . . . . . . . . . . . . . . . . . . . . . . . . . . . . . . . . . . . . . . . . . . . . . . . . . . . . . . . . . . . . . . . . . . . . . . . 254
4. Conclusion. . . . . . . . . . . . . . . . . . . . . . . . . . . . . . . . . . . . . . . . . . . . . . . . . . . . . . . . . . . . . . . . . . . . . . . . . . . . . . . . . . . . . . . . . . . . . . . . . . . . . . . . . . . . . . . . . . . . . . . . . . . . . . . . . . . . . . . . . . . . 255Acknowledgment . . . . . . . . . . . . . . . . . . . . . . . . . . . . . . . . . . . . . . . . . . . . . . . . . . . . . . . . . . . . . . . . . . . . . . . . . . . . . . . . . . . . . . . . . . . . . . . . . . . . . . . . . . . . . . . . . . . . . . . . . . . . . . . . . . . . 255References . . . . . . . . . . . . . . . . . . . . . . . . . . . . . . . . . . . . . . . . . . . . . . . . . . . . . . . . . . . . . . . . . . . . . . . . . . . . . . . . . . . . . . . . . . . . . . . . . . . . . . . . . . . . . . . . . . . . . . . . . . . . . . . . . . . . . . . . . . . 255
1. Introduction
Developments in adsorption processes usually focus attentionon improved adsorbents especially with regard to the adsorptionisotherm and selectivity for the separation of interest. However,improvements in performance and reduction in cost of cyclicadsorption processes including pressure swing adsorption (PSA)
∗ Corresponding author. Tel.: +61 3 9905 3445; fax: +61 3 9905 5686.E-mail address: [email protected] (P. Webley).
and temperature swing adsorption (TSA) are also dependent onparameters which are dictated by adsorbent loading per unitvolume, mass transfer properties, pressure drop, and thermal man-agement. These factors play an important role in the size of theprocess equipment, the attainable product recovery, and the result-ing power consumption. All of these affect system cost. Thesefactors are strongly influenced by the structure of the adsorbentused in the gas separation device.
Over the last decade, there has been considerable interest inthe intensification of separation processes. In cyclic devices such asPSA and TSA, reducing cycle time is the primary means of achiev-
1383-5866/$ – see front matter © 2009 Elsevier B.V. All rights reserved.doi:10.1016/j.seppur.2009.10.004

244 F. Rezaei, P. Webley / Separation and Purification Technology 70 (2010) 243–256
ing more production from a given quantity of material. However,as cycle time is reduced, cyclic devices usually face the problem ofdecreasing working capacity per cycle for the component of inter-est, decreasing product recovery and increasing pressure drop. Theextent to which cycle time reduces working capacity and recoveryand increases pressure drop is dependent on the structure of theadsorbent. Conventional gas separation systems are usually per-formed using adsorbents in the form of beads or granules. However,mass transfer and pressure drop drawbacks associated with con-ventional packed beds impose limitations in operating the processat optimum conditions in terms of energy consumption and overallsystem efficiency. Reducing particle size is the most obvious wayto decrease mass transfer resistance (which varies as the square ofparticle size) and trends over the last few decades have seen particlesizes reducing from 2 to 3 mm down to less than 0.7 mm. Combat-ing the accompanying increase in pressure drop with reduction inparticle size has led to bed geometries of a “pancake” nature, i.e.L/D ratios considerably less than one. However, considerable gasmaldistribution and channelling not to mention potential fluidiza-tion of packed beds are issues which emerge when shallow, largediameter packed beds are used.
An alternate approach to simply reduce particle size is to investi-gate entirely non-particulate, novel adsorbent structures. Alternateadsorbent geometries should satisfy a number of requirements inorder to be considered as suitable candidates for the replacementof pellet/bead configurations. In particular, such structures shouldyield high mass transfer kinetics with large film and solid masstransfer coefficients. Furthermore, they must exhibit high volumeworking capacity (loading per unit system volume) as well as lowvoidage for minimizing the size of the adsorber. In addition, the gasflow path in these novel adsorbent structures should produce lowpressure drop to minimize energy consumption. Finally, the useof novel adsorbent structures permits simultaneous engineering ofheat transfer into the adsorbent, an often overlooked considerationin design of adsorption processes. By this is meant the process ofheat transfer to/from the gas and the adsorption sites. Since adsorp-tion is exothermic and desorption endothermic, a thermal swingaccompanies the pressure swing and is usually detrimental to theoverall system performance, sometimes by as much as 30%. Effi-cient transfer of heat to and from the adsorbent can significantlyimprove system performance and a structured adsorbent affordsopportunities to accomplish this.
The present review examines the approaches taken in the pub-lished literature on fundamental and applied research of adsorbentgeometries using novel adsorbent structures in gas separationsystems. The review highlights in particular, monoliths, lami-nates, foams and fabrics structures along with their applications inadsorption based gas separation processes. The role of the geomet-ric parameters of these structured adsorbents is also evaluated. Theaim in this review is to illustrate and analyse recent advances in theapplication of novel adsorbents in gas separation and purificationprocesses. Finally, based on the review, a number of suggestionsfor future research are made. Fig. 1 illustrates some typical adsor-bent structures which have been used either commercially or inresearch studies.
Table 1 summarizes a large number of studies in which non-particulate adsorbent structures have been used with the keyresults reported. These will be discussed in more detail below.
2. Role of geometric parameters in overall performance
A number of physical adsorbent parameters govern the perfor-mance of adsorptive gas separation processes for a given adsorptionisotherm. As mentioned above, these parameters include volumet-ric working capacity, pressure drop, mass transfer characteristics,
Fig. 1. Illustration of a variety of adsorbent structures including (left to right):ceramic and carbon adsorbent monoliths, corrugated paper monoliths (center), fab-ric adsorbent and conventional beaded adsorbents.
as well as thermal management. It is possible to develop a struc-tured adsorbent with superior performance to a packed bed (on avolume or mass basis) provided the parameters listed above are attheir “optimal” values. However, care must be taken when using astructured adsorbent for a particular process since there is always atrade-off between these aforementioned parameters during oper-ation.
2.1. Volumetric working capacity and adsorbent loading
Volumetric working capacity is defined here as the moles ofgas processed per unit volume per cycle. This is a product of theworking capacity (moles of gas adsorbed/desorbed per unit massof adsorbent including binder, support, etc.) and the density of thecomposite adsorbent. The throughput attainable in a given volumeof vessel in a cyclic adsorption system may be expressed as:
Throughput (mole/s m3) = WC ∗ �B
�(1)
where WC is the working capacity (moles/kg adsorbent/cycle), �B
is the bulk adsorbent density (kg adsorbent/m3) and � is the cycletime (s/cycle). Although structured adsorbents are developed withthe aim of operation at faster cycle times (lower �), any devel-opment which simultaneously reduces adsorbent density (�B) isdetrimental to throughput. Thus although structured adsorbentsmay have remarkable advantages over adsorbent pellets such asfast mass transfer kinetics (due to shorter diffusion path) and easierheat transfer in all directions, as well as more uniform temperaturedistribution, their throughput is often lower, since the adsorbentloading on a mass or volume basis is often small compared toadsorbent materials in the form of pellets/beads.
It is worth mentioning that high adsorbent loading may notalways be a desirable parameter in all adsorptive processes ifother features are compromised. For instance, in some adsorptivesystems, mass and heat transfer processes dominate system per-formance (e.g. removing moisture from air) and hence reducingthe characteristic diffusion length may necessitate the use of thinlayers of adsorbent which may actually lead to reduced adsorbentloading. In terms of Eq. (1), high �B may compromise WC and hencean optimum loading may exist.
A feature related to adsorbent loading which becomes increas-ingly important as cycle time is reduced is “switching” losses.Switching losses are losses in throughput and separation due topressurizing and depressurizing “dead” space. These losses become

F. Rezaei, P. Webley / Separation and Purification Technology 70 (2010) 243–256 245
Tab
le1
Asu
mm
ary
ofst
ruct
ure
dad
sorb
ent
app
lica
tion
sin
adso
rpti
vep
roce
sses
.
Ref
eren
ceSt
ruct
ure
Pack
ing
det
ails
Syst
emEx
per
imen
talc
ond
itio
ns
Res
ult
s
Kod
ama
etal
.[21
]M
onol
ith
Hon
eyco
mb
roto
rw
ith
ath
insh
eet
ofsi
lica
gel
Air
deh
um
idifi
cati
onA
irve
loci
tyof
1.2
m/s
thro
ugh
a0.
2-m
lon
gh
oney
com
b10
–20%
hu
mid
ity
red
uct
ion
Gad
kare
e[2
3]M
onol
ith
,400
cpsi
Act
ivat
edca
rbon
hon
eyco
mb
stru
ctu
res
VO
Cre
mov
alH
oney
com
bsw
ith
abou
t18
wt%
carb
onB
reak
thro
ugh
curv
essi
mil
arto
pac
ked
bed
sLi
etal
.[24
]M
onol
ith
5Aze
olit
em
onol
ith
Oxy
gen
-en
rich
edai
r3.
8ba
rfe
edp
ress
ure
3–5
tim
eslo
wer
pre
ssu
red
rop
Bra
nd
anie
tal
.[32
]M
onol
ith
Car
bon
mon
olit
hC
O2–H
ean
dC
O2–N
2Pr
essu
re:
23To
rr,t
emp
erat
ure
:23
◦ CD
isp
ersi
onis
con
trol
led
bym
ass
tran
sfer
resi
stan
cera
ther
than
axia
ldis
per
sion
Yat
eset
al.[
34]
Mon
olit
h,5
0cp
siH
oney
com
bm
onol
ith
Effl
uen
tga
sp
uri
fica
tion
Pres
sure
:1
atm
,tem
per
atu
re:
room
tem
per
atu
reA
llow
ing
adso
rben
tre
gen
erat
ion
up
to30
0◦ C
Yu
etal
.[35
]M
onol
ith
,400
cpsi
Act
ivat
edca
rbon
mon
olit
hV
OC
rem
oval
Pres
sure
:1
atm
,tem
per
atu
re:
20,6
0,10
0,an
d14
0◦ C
Goo
dco
rrel
atio
nof
VO
Cs
adso
rpti
ond
ata
onac
tiva
ted
carb
onm
onol
ith
usi
ng
Lan
gmu
ir–F
reu
nd
lich
and
Toth
equ
atio
ns
Val
des
-Sol
iset
al.[
37]
Mon
olit
h,2
00–9
00cp
siC
arbo
n-c
oate
dce
ram
icm
onol
ith
sV
OC
rem
oval
Pres
sure
:1
atm
,tem
per
atu
re:
room
tem
per
atu
reB
ette
rbr
eakt
hro
ugh
per
form
ance
than
ap
acke
dbe
dG
ran
de
etal
.[41
]M
onol
ith
,424
,900
cpsi
4Ah
oney
com
bm
onol
ith
Prop
ane
and
pro
pyl
ene
adso
rpti
onPr
essu
re:
1.5,
5.6
and
10.0
kPa,
tem
per
atu
re:
room
tem
per
atu
re
Smal
ler
dif
fusi
vity
coef
fici
ents
than
extr
ud
ates
Cu
tler
etal
.[44
]M
onol
ith
,50–
3000
cpsi
Hon
eyco
mb
mon
olit
hD
esu
lph
uri
zati
onp
roce
ssPr
essu
re:
1at
m,t
emp
erat
ure
:25
–400
◦ CLo
wer
pre
ssu
red
rop
per
volu
me
Rib
eiro
etal
.[45
]M
onol
ith
,300
cpsi
Act
ivat
edca
rbon
hon
eyco
mb
mon
olit
hC
O2,C
H4,a
nd
N2
Ad
sorp
tion
Pres
sure
:1
atm
,tem
per
atu
re:
303–
423
KA
dso
rpti
onca
pac
ity
hon
eyco
mb
mon
olit
h:
CO
2>
CH
4>
N2
Jain
etal
.[46
]M
onol
ith
Mon
olit
hic
wh
eel
Air
sep
arat
ion
–C
ycle
tim
eof
35s
for
rap
idPS
AK
aboo
rdet
al.[
48]
Mon
olit
h,1
20cp
siH
oney
com
bm
onol
ith
Veh
icle
exh
aust
syst
ems
–Su
itab
lefo
rd
iese
len
gin
es
Jale
etal
.[49
]M
onol
ith
Hon
eyco
mb
mon
olit
hA
irse
par
atio
n–
Imp
rove
dN
2/O
2se
lect
ivit
yan
dN
2
cap
acit
yG
orba
chet
al.[
55]
Mon
olit
h,1
00,2
00,4
00cp
siZe
olit
e4A
-pol
yam
ide
mon
olit
hR
apid
PSA
(RPS
A)
Extr
usi
onof
pol
ymer
mat
rice
sfi
lled
wit
hze
olit
ep
owd
eru
sin
gth
erm
opla
stic
mat
eria
lsas
pla
stic
izin
gai
dan
dbi
nd
er
Enh
ance
men
tof
pro
du
ctiv
ity,
low
erp
ress
ure
dro
p
Yu
etal
.[10
5,10
6]M
onol
ith
,400
cpsi
Act
ivat
edca
rbon
mon
olit
hEl
ectr
oth
erm
alsw
ing
adso
rpti
on(E
SA)
Pres
sure
:1
atm
,tem
per
atu
re:
room
tem
per
atu
reH
igh
tolu
ene
vap
our
rem
oval
Gra
nd
ean
dR
odri
gues
[107
]M
onol
ith
,190
cpsi
Act
ivat
edca
rbon
hon
eyco
mb
mon
olit
hC
O2
rem
oval
ESA
Pres
sure
:101
kPa
tem
per
atu
re:
297
KC
O2
reco
very
:m
ore
than
89%
,CO
2
pu
rity
:16
%
Kee
fer
etal
.[66
,67]
and
Con
nor
etal
.[65
]La
min
ate
Ad
sorb
ent
shee
tR
otar
yPS
A,r
apid
PSA
–Lo
wer
pre
ssu
red
rop
Kee
fer
[70]
Lam
inat
eLa
min
ated
par
alle
lpas
sage
con
tact
orPS
Asy
stem
–O
per
atio
nat
hig
hfr
equ
ency
Mau
rer
[68]
Lam
inat
eSp
iral
lyw
oun
dad
sorb
ent
VO
Cre
mov
al–
Lon
ger
adso
rben
tli
feal
tern
ativ
efo
ra
ther
mal
swin
gad
sorp
tion
pro
cess
Ru
thve
nan
dTh
aero
n[4
]La
min
ate
Para
llel
pas
sage
con
tact
orco
ated
wit
hA
CF
shee
tsC
O2
rem
oval
Pres
sure
:1
atm
,tem
per
atu
re:
room
tem
per
atu
reH
igh
sele
ctiv
ity
rati
od
iffu
sion
tim
eco
nst
ant
of10
ms
Kee
fer
[70]
Lam
inat
eLa
yere
dad
sorb
ent
bed
sU
ltra
rap
idPS
A–
100
cycl
e/m
inK
eefe
r[6
7]La
min
ate
Ad
sorb
ent
lam
inat
eco
ated
wit
hX
-zeo
lite
Oxy
gen
enri
chm
ent
PSA
Ch
ann
elw
idth
:50
–75
�m
,w
allt
hic
knes
s:50
–75
�m
200
cycl
e/m
in
Rod
eet
al.[
72]
Lam
inat
ePa
rall
elp
assa
gesh
eets
Air
sep
arat
ion
–In
crea
sed
pro
du
ctiv
ity
and
/or
reco
very
Patc
aset
al.[
8]Fo
amC
eram
icfo
ams
Oxi
dat
ion
ofC
OFo
am20
,45
PPI
Bet
ter
per
form
ance
com
par
edto
pac
ked
bed
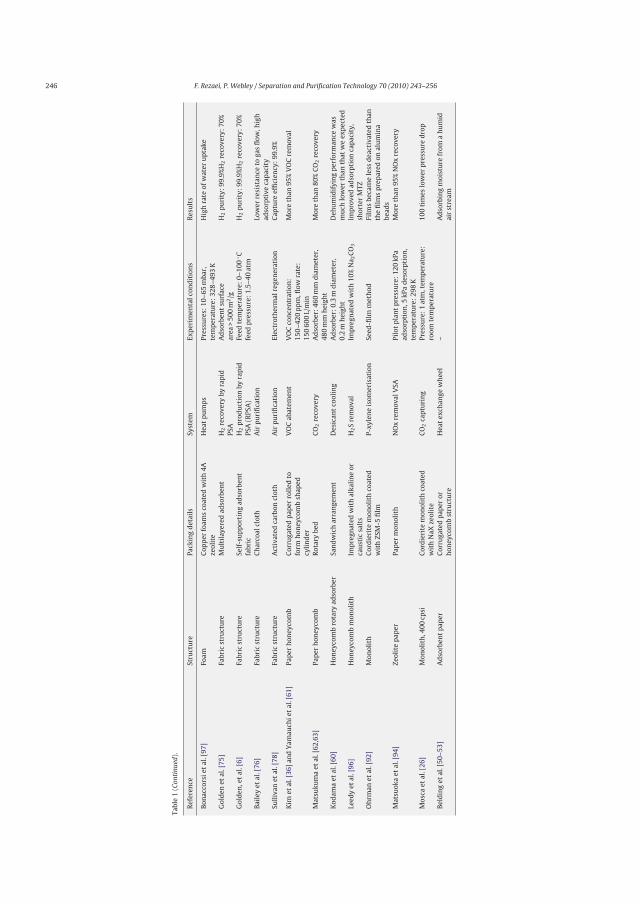
246 F. Rezaei, P. Webley / Separation and Purification Technology 70 (2010) 243–256
Tabl
e1
(Con
tinu
ed).
Ref
eren
ceSt
ruct
ure
Pack
ing
det
ails
Syst
emEx
per
imen
talc
ond
itio
ns
Res
ult
s
Bon
acco
rsie
tal
.[97
]Fo
amC
opp
erfo
ams
coat
edw
ith
4Aze
olit
eH
eat
pu
mp
sPr
essu
res:
10–6
5m
bar,
tem
per
atu
re:
328–
493
KH
igh
rate
ofw
ater
up
take
Gol
den
etal
.[75
]Fa
bric
stru
ctu
reM
ult
ilay
ered
adso
rben
tH
2re
cove
ryby
rap
idPS
AA
dso
rben
tsu
rfac
ear
ea>
500
m2/g
H2
pu
rity
:99
.9%
H2
reco
very
:70
%
Gol
den
,et
al.[
6]Fa
bric
stru
ctu
reSe
lf-s
up
por
tin
gad
sorb
ent
fabr
icH
2p
rod
uct
ion
byra
pid
PSA
(RPS
A)
Feed
tem
per
atu
re:
0–10
0◦ C
feed
pre
ssu
re:
1.5–
40at
mH
2p
uri
ty:
99.9
%H
2re
cove
ry:
70%
Bai
ley
etal
.[76
]Fa
bric
stru
ctu
reC
har
coal
clot
hA
irp
uri
fica
tion
Low
erre
sist
ance
toga
sfl
ow,h
igh
adso
rpti
veca
pac
ity
Sull
ivan
etal
.[78
]Fa
bric
stru
ctu
reA
ctiv
ated
carb
oncl
oth
Air
pu
rifi
cati
onEl
ectr
oth
erm
alre
gen
erat
ion
Cap
ture
effi
cien
cy:
99.9
%
Kim
etal
.[36
]an
dY
amau
chie
tal
.[61
]Pa
per
hon
eyco
mb
Cor
ruga
ted
pap
erro
lled
tofo
rmh
oney
com
bsh
aped
cyli
nd
er
VO
Cab
atem
ent
VO
Cco
nce
ntr
atio
n:
150–
420
pp
m,fl
owra
te:
150
600
L/m
in
Mor
eth
an95
%V
OC
rem
oval
Mat
suku
ma
etal
.[62
,63]
Pap
erh
oney
com
bR
otar
ybe
dC
O2
reco
very
Ad
sorb
er:
460
mm
dia
met
er,
480
mm
hei
ght
Mor
eth
an80
%C
O2
reco
very
Kod
ama
etal
.[60
]H
oney
com
bro
tary
adso
rber
San
dw
ich
arra
nge
men
tD
esic
ant
cool
ing
Ad
sorb
er:
0.3
md
iam
eter
,0.
2m
hei
ght
Deh
um
idif
yin
gp
erfo
rman
cew
asm
uch
low
erth
anth
atw
eex
pec
ted
Leed
yet
al.[
96]
Hon
eyco
mb
mon
olit
hIm
pre
gnat
edw
ith
alka
lin
eor
cau
stic
salt
sH
2S
rem
oval
Imp
regn
ated
wit
h10
%N
a 2C
O3
Imp
rove
dad
sorp
tion
cap
acit
y,sh
orte
rM
TZO
hrm
anet
al.[
92]
Mon
olit
hC
ord
ieri
tem
onol
ith
coat
edw
ith
ZSM
-5fi
lmP-
xyle
ne
isom
eris
atio
nSe
ed-fi
lmm
eth
odFi
lms
beca
me
less
dea
ctiv
ated
than
the
film
sp
rep
ared
onal
um
ina
bead
sM
atsu
oka
etal
.[94
]Ze
olit
ep
aper
Pap
erm
onol
ith
NO
xre
mov
alV
SAPi
lot
pla
nt
pre
ssu
re:
120
kPa
adso
rpti
on,5
kPa
des
orp
tion
,te
mp
erat
ure
:29
8K
Mor
eth
an95
%N
Ox
reco
very
Mos
caet
al.[
26]
Mon
olit
h,4
00cp
siC
ord
ieri
tem
onol
ith
coat
edw
ith
NaX
zeol
ite
CO
2ca
ptu
rin
gPr
essu
re:
1at
m,t
emp
erat
ure
:ro
omte
mp
erat
ure
100
tim
eslo
wer
pre
ssu
red
rop
Bel
din
get
al.[
50–5
3]A
dso
rben
tp
aper
Cor
ruga
ted
pap
eror
hon
eyco
mb
stru
ctu
reH
eat
exch
ange
wh
eel
–A
dso
rbin
gm
oist
ure
from
ah
um
idai
rst
ream
F. Rezaei, P. Webley / Separation and Purification Technology 70 (2010) 243–256 247
proportionally larger as the ratio of adsorbent volume to non-adsorbent void volume decreases. Typically, large low pressurePSA process vessels adsorb up to two magnitudes more gas on theadsorbent than exists in the void space. As the amount of adsor-bent decreases (due to faster cycling), the proportion of void spaceto adsorbent volume increases and therefore increasingly work isdone to simply compress and depress void space gas with no sep-aration. Reductions in switching losses can only be achieved byhigher adsorbent densities and careful engineering to minimizevoid space as well as investigation of alternate non-switching tech-nologies, e.g. rotary valve systems.
2.2. Role of pressure drop
Pressure drop impacts system performance in several ways. Theexistence of a pressure profile in the axial direction in an adsorp-tion process (both during adsorption and desorption) implies thatnot all of the adsorbent experiences the full pressure swing avail-able to the system. This directly reduces working capacity, WC.The problem is especially acute for vacuum swing adsorption inwhich low vacuum pressures are needed for adsorbent regenera-tion, e.g. CO2VSA [1]. In this application, a vacuum pressure of 3 kPamay be needed to produce sufficient CO2 recovery and throughput.Hence a pressure drop of just 1 kPa in the bed during the vacuumstep can reduce CO2 recovery by as much as 5%. In addition to thiseffect, increased pressure drop increases energy consumption. Oneoption to circumvent the high pressure drop problem of conven-tional packed beds without changing the type of adsorbent is toutilize radial bed adsorbers [2]. Radial beds produce lower pres-sure drop for the same mass flow rate due to the expanding radiusin the direction of flow. Lower cycle time and higher throughputswithout fluidization are possible, although their design is complexand costly.
To describe the role of system parameters contributing to pres-sure drop in a packed bed, the well known Ergun equation [3] isconsidered here:
�P
L= 150
(1 − ε)2
ε3
�
dp2
U + 1.75(1 − ε)
ε3
�
dpU2 (2)
where U is the superficial velocity, � and � are the density and vis-cosity of the gas, respectively, dp is the particle diameter and ε isthe bed voidage. Clearly decreasing void volume and particle sizeboth increase pressure drop. Although decreasing void volume alsoincreases pressure drop for structured adsorbents (not necessarilyaccording to (2) however), it is easier in parallel channel adsor-bents to control ε to obtain satisfactory performance. In addition,the tortuosity of the channels in monolith or laminate structures is1, compared with 2–3 for a packed bed of granules. Therefore thepressure drop in a packed bed is larger than in a monolith structurefor equal voidage. Furthermore, the system geometry in laminatesand monoliths can be easily manipulated to achieve lower headloss. This is achieved by decreasing cell density or wall thicknessin monoliths and increasing sheet spacing and decreasing wallthickness in laminates. Generally, parallel channels exhibit betterperformance with respect to pressure drop; however they must becarefully designed to avoid too much loss of adsorbent loading andlarge diffusion paths (wall thickness).
2.3. Mass transfers characteristics
Theoretical and experimental studies [4–8] have shown theinfluence of adsorbent structure on mass transfer kinetics which inturn influences the overall system efficiency. The separation per-formance may be degraded by dissipative effects of mass transferresistance (internal and external) and axial dispersion. At higher
gas velocities associated with higher cycle frequencies, the delete-rious effects of mass transfer resistances typically increase, sincein these conditions, the adsorption time scale becomes more com-parable to cycle time. The diffusion time constant for the limitingresistance in adsorption systems is of order L2/D where L is thelimiting length parameter and D the corresponding diffusivity. Forpellets, L is the pellet radius and D, the “effective” diffusivity. Inconventional packed bed processes, with cycle times of the orderof hours or even minutes, the timescale for adsorption into/out ofthe pellets is approximately 5–100 times shorter than the residencetime and hence mass transfer resistance is not dominant. This pic-ture changes dramatically when rapid cycles are used. If interstitialvelocities are 10–100 times higher, then the time scale for adsorp-tion becomes comparable to, or even greater than the residencetime leading to immediate breakthrough of the gas and unaccept-able operation. To reduce the timescale for adsorption, smallerparticles can be used, however, the resultant pressure drop and lowmechanical stability rapidly becomes unmanageable. Moreover,with increasing space velocity, conventional packed bed adsorbentscan be fluidized. The advantages of a rigid adsorbent structure aretherefore readily apparent.
Some adsorption process models developed are based on localequilibrium, i.e. ignore the mass transfer resistances in the system.In reality, those resistances are not always negligible and must betaken into account for more reliable prediction of system perfor-mance. The overall mass transfer coefficient, k, for systems withlinear isotherms obeying the linear driving force model can beevaluated through the relationship [9]
1kK
= Rp
3kf+ R2
p
15εpDp+ r2
c
15KDc+
(1 − ε
ε
)DL
v2(3)
where K is the equilibrium constant, kf is the external film coeffi-cient, Rp and rc are particle and crystal radii, respectively, Dp andDc are pore and intracrystalline diffusivity, respectively, DL is axialdispersion and v is velocity. The relative importance of internal andexternal resistances is expressed by the Biot number kfL/D where Lis a characteristic dimension (particle diameter) and D the internaldiffusion coefficient. The mass transfer Biot number for packed bedsfor most applications is in the range of 5–500 and hence the majorresistance for mass transfer is within the particle [10]. Generallyspeaking, micropore diffusion resistance dominates over film andmacropore resistances if
Dp/R2p
Dc/r2c
� 1 +(
1 − ε
ε
)K and
5Dp
kRp� 1
The opposite situation holds for macropore diffusion. In pel-leted systems and foam structures, the external film resistanceseldom plays a role in overall mass transfer and is usually neglected.According to Patcas et al. [8], the external mass transfer coefficientof foam structures is somewhat between those of monoliths andpacked beds. Typically, the mass transfer coefficient of foams wouldincrease by increasing the pore count at constant hydrodynamicconditions due to enhanced surface area available for adsorption.In the case of laminates and monoliths, however, we expect filmresistance to be very important, even governing, depending onchannel and wall thickness dimensions. Larger film coefficientscan be obtained by smaller channel diameters and sheet spacing.Unfortunately, the dependence of the film coefficient on Reynoldsnumber is quite weak as shown below. Higher velocities are there-fore not a practical way of achieving better mass transfer. We expectlaminar flow to prevail in the channels for all typical cycle times.The film resistance is comparable to the pore diffusion resistance inthis situation especially when the laminate or monolith walls arevery thin and internal mass transfer is very rapid.
248 F. Rezaei, P. Webley / Separation and Purification Technology 70 (2010) 243–256
The appropriate dimensionless group characterising film dif-fusion is the Sherwood Number, Sh. For pelleted systems theWakao–Funazkri equation [11] is typically used to estimate kf
Sh = 2 + 1.1Re0.6Sc0.33 (4)
For monolithic and laminate structures, Hawthorn’s equation[12] for laminar flow is employed
Sh = dkf
Dm= A
(1 + 0.139ReSc
dh
L
)0.81
(5)
where the parameter A is 3.6 for circular channels, 2.35 for tri-angular channels and 2.95 for square channels. Dm, dh and L aremolecular diffusion coefficients, channel hydraulic mean diameterand column length, respectively. Typically, d/L is very small sincechannels are of diameter 1 mm and length 100 mm while Re is usu-ally small (<500). A generalised correlation proposed by Groppi etal. [13] is appropriate to describe the external film mass transfercoefficient in foam structures
Sh = 0.91Re0.43Sc0.33 (6)
subject to the constraint
15 < Re < 200
It is clear therefore that external film diffusion which is typ-ically neglected for particulates may be important for adsorbentstructures and should be considered when modelling and design-ing these systems. A more detailed assessment of the impact ofexternal film resistance has recently been conducted by Rezaei andWebley [14].
The contribution of axial dispersion to k for pellets, is usuallysmall (similar to external diffusion) and can justifiably be neglected.The plug flow assumption is therefore adequate. Note however thatvery small particles (<1.0 mm) have significantly increased axialdispersion and DL/v2 may become comparable to pore diffusionresistance and indicates that for small diameter pellets, gains inkinetic effects from reducing particle size can be rapidly offset byincreased axial dispersion. In monoliths, axial dispersion is muchmore dependent on channel diameter and flow rate. For laminates,resistances in the porous material and external film are far greaterthan axial dispersion in the gas phase. Axial dispersion in a packedbed is correlated in terms of the Peclet number (Pe = Ud/DL), and canbe obtained from
εbDL
Dm= 20 + 0.5Re Sc (7)
where Dm is the molecular diffusion coefficient and d is particlediameter. The same expression is used for foam structures. In lami-nar flow, axial dispersion in monolithic structures can be calculatedfrom Taylor’s [15] analysis
Pe = Ud
DL≈ 192
Dm
Ud(8)
For laminates, a similar approach holds as with monoliths. Inturbulent flow, Taylor analysis gives:
Pe = 0.28√f
, f = 0.046Re−0.2 (9)
For this case, the extent of axial dispersion is greater but stillsignificantly less than the other factors causing broadening of themass transfer zone. In fact, more detailed analysis reveals that axialdispersion is usually negligible even in monolithic and laminatestructures [14]. Of course maldistribution and channelling are morelikely in monolith systems and laminates and require attention todetail in the fabrication process.
It should be noted that the binder in adsorbent structures mayinfluence the role of mass transfer. In certain adsorptive applica-tions such as dehumidification processes wherein the diffusivityof the adsorbate molecule (water) through the binder layer is highenough to reach the adsorbent particles, the binder material doesnot degrade the overall kinetics of the process. In contrast, in severaladsorptive processes such as air separation application, the binderserves as a kinetic barrier to adsorbate molecules from reachingthe adsorbent particle. The detailed pore engineering required forefficient mass transfer at the micro- and meso-scopic scale appliesto all adsorbent structures.
2.4. Thermal management
As mentioned earlier, pressure swing systems are affected by thethermal swing accompanying the adsorption/desorption process.As a first estimate, the temperature swing at a point in the bed isgiven by
�T = WC ∗ Qads
Cs(10)
where WC is the working capacity, Qads is the heat of adsorptionand Cs is the solid specific heat (kJ/kg). In turn, the temperatureswing affects the adsorption and desorption detrimentally, reduc-ing capacity on adsorption and increasing it on desorption. Toreduce the effect of this temperature swing several approacheshave been attempted including insertion of heat transfer devicesinto the packed bed [16], or use of metallic compounds or phasechange materials to either increase Cs or absorb the heat of adsorp-tion [17]. These approaches have met with limited success sincein the case of pellets having a size more than several micrometers,there is a temperature gradient between the surface and the innerpart of the particle during adsorption and desorption due to poorthermal conductivity of the adsorbent material. Therefore it is diffi-cult to obtain a uniform temperature across the particle regardlessof external heat transfer devices.
Adsorbents in the form of laminates, monoliths, cloths andfoams can positively influence the thermal behaviour of an adsor-ber bed by selecting a suitable support material with a favourablethermal conductivity. Consequently, the thermal properties of thesystem can be carefully engineered. In the case of monoliths,foams and laminates, a macropore wall structure can facilitate thedissipation of heat and consequently more nearly achieve a uni-form temperature distribution across the adsorbent. With regardto laminate structures, metallic supports exhibit favourable ther-mal properties with high thermal conductivity and heat capacity.Care must be taken however to avoid relative stresses induced inthe system during cyclic heating and cooling which may result indetachment of the adsorbent material from the support.
Foamed adsorbents offer a unique structure of high porosity(75–90%) and tortuosity, and hence we expect a more uniformtemperature distribution in the adsorbent. This is due to improvedturbulence and an inherent structure which means that heat can betransported not only by conduction, but other mechanisms such asconvection and even radiation. This a fertile area for future researchsince not only can adsorbent structure manage heat more effec-tively in a passive mode, but they may in fact offer opportunitiesfor “active” thermal management (see Section 3.6).
2.5. Trade-off of properties
The design of adsorbent structures involves, inevitably a trade-off between a number of parameters which govern the overalladsorbent performance. Adsorbents with high working capacityand fast kinetics are favoured for cyclic separation processes, how-ever these requirements can only be met at ideal conditions.
F. Rezaei, P. Webley / Separation and Purification Technology 70 (2010) 243–256 249
External surface area per unit volume of adsorbent is one ofthe most important characteristics governing the performance ofadsorbents but higher surface area is usually associated with loweradsorbent density. For laminate, cloth and monolith structures, inorder to maintain a sufficient surface area and hence improvedkinetic properties, the wall thickness and spacing should be keptsmall. Thinner wall thickness means shorter diffusion path but onthe other hand, lower adsorbent loading associated with thinnerwalls will result in insufficient adsorbent density [14]. The sameargument is valid for adsorbent voidage. High voidage may be asso-ciated with faster kinetics, however, the bed density is low whichgives rise to lower working capacity. Small spacing between adja-cent sheets or small channels increases the pressure drop as well.In the case of beads there is always a trade-off between pressuredrop and mass/heat transport characteristics, smaller pellets dis-play clearly high surface area and mass/heat kinetics, while thesystem pressure drop is dramatically increased.
Such trade-off behaviours should always take into considera-tion when dealing with adsorbent structure. In this regard, a formaloptimization approach could be employed by conducting appropri-ate simulations or experiments to identify the optimum conditionsfor a particular application. A general procedure to illustrate thisinterplay of features is provided below in Section 3.7.
3. Alternate adsorbent configurations
A large variety of structured adsorbents have been studied andcommercialized over the last 20 years. Table 1 provides a sum-mary of these reported structures together with details of theexperiments and key experimental results. The structures can becategorized as monoliths (including honeycomb topologies), lami-nates, foams, fabric structures and “other” structures.
3.1. Monolithic adsorbents
In recent years, monolithic adsorbents have received consider-able attention for use in adsorption systems [18]. Monoliths arestructured supports composed of parallel channels with a varietyof cross-sectional shapes. They have been widely used as a cata-lyst support in various applications including catalytic combustion,biochemical and electrochemical reactors, automotive catalyticconvertors, etc. [18,19]. The use of monoliths in adsorption pro-cess is rather new compared to its applications in the catalyticfield [20–22]. The characteristic difference between adsorptiveand catalytic monoliths stems from the need for sorption capac-ity in the former. Hence monoliths for adsorption are often entirelycomprised of adsorbent (or at least highly filled) while catalyticmonoliths usually rely on a wash coat of active catalyst on a mono-lithic support.
Early attempts in the use of monolithic adsorbent structures forseparation process were mostly related to elimination of VOCs fromair [21,23]. MAST carbon, a specialist developer of activated car-bon produces a variety of activated carbon monoliths for a rangeof applications including (but not limited to) VOC removal. Li et al.[24] examined the technical feasibility of 5A zeolite monolith (con-taining 25% Na-bentonite) for the production of oxygen-enrichedair. They compared their results to a packed bed of commercial pel-lets and showed while the separation performance of the monolithswas inferior to the pellets, the pressure drop in the monolith sys-tem was almost 3–5 times lower than the one in the packed bed,resulting in a 3–5 times faster pressurization time.
Although the unique structure of monoliths (continuous bodywith identical channels) significantly reduces the common prob-lems of conventional adsorbents (i.e. fluidization, high pressuredrop, etc.), these structures may very low loading of active adsor-
bent material. In addition, not all the adsorbent material presentin the skeleton of the monolith wall is accessible to the adsor-bate molecules passing through the channels. The active adsorbentmaterial may be directly extruded in the form of a structured mono-lith (commonly done for carbon monoliths in which case the entiremonolith is active adsorbent) or an active film may be grown onthe monolithic structures by various methods, namely, dip-coating,wash-coating, and slip-coating [25]. Mosca et al. [26] have shownhow films of NaX zeolite may be deposited on cordierite mono-lith supports. In order for monolithic adsorbents to meet the masstransfer requirements for efficient performance, both channel andwall thickness should be as small as possible [27]. It is known thatmonoliths with higher cell densities would give proportionally bet-ter performance because of their higher geometrical surface areaand solid loading; however, the improvement gained by higherdensity must be weighed against the added cost of their manu-facturing, since the manufacturing of such structures is complexand difficult. Furthermore, monoliths at such high density (severalhundred to over one thousand cpsi) with a large loading capacityof active adsorbent are not available yet in commercial quantities.An interesting and dramatic demonstration of the effectiveness ofultra-high cell density monoliths was provided by the work of Liet al. [28] in which a cuttlebone was used as a biomorphic tem-plate to produce a monolith of NaX with 16,000 cells per squareinch. These materials showed excellent mass transfer propertiesand still exhibited lower pressure drop than a packed bed.
The geometric parameters of monoliths which influence theprocessing requirements are defined in terms of cell density, cellspacing or wall thickness. The cell density of monoliths is defined asthe number of cells per unit of cross-sectional area and expressed ascells per square inch (cpsi). As discussed earlier, monoliths providelower pressure drop per unit length of the bed than a packed bed.Given constant gas viscosity, monolith length, and open frontal area(OFA), the pressure drop of monolith adsorbents increases withincreasing cell density. On the other hand, given a constant cell den-sity, the pressure drop decreases with decreasing wall thickness.Thus monoliths are one of the most efficient methods available topack high adsorbent surface area into a fixed volume while stillmaintaining low pressure drop.
Monoliths have two major resistances to mass transfer; externalfilm resistance, and pore diffusion within the walls. The charac-teristic diffusion length can be shortened by employing a thinneradsorbent wall. Unfortunately, the residence time in the mono-lith is likely to be much shorter than in a packed bed so that thetimescales of diffusion and transport through the channels maybe comparable. The low pressure drop of monoliths and laminatesmust be exploited by using long beds to give large gas residencetimes. High cell densities are favoured since these produce highadsorbent loading and short diffusion lengths.
Meyers and Liapis [29,30] have employed pore network the-ory to determine in an a priori manner, the mass transfer andpressure drop characteristics of monoliths and in columns packedwith porous particles. The outcome of their microscopic model wasthen employed in a dynamic macroscopic model to describe thedynamic behaviour of chromatographic columns. In another studyconducted by Liapis et al. [31], the dynamic behaviour of monolithadsorbents in a chromatographic column was evaluated throughmathematical modelling. Their result indicated remarkable bene-fits of monolithic adsorbents over spherical particles if a suitablemonolith (large through pores and small-sized skeleton) with con-trollable dimension is employed.
In another study, the adsorption kinetics and diffusion of CO2in carbon based monoliths was studied using the zero length col-umn (ZLC) method by Brandani et al. [32]. These authors showedthat the dispersion in the monoliths is mainly controlled by masstransfer resistance rather than axial mixing. Recently, Mosca et
250 F. Rezaei, P. Webley / Separation and Purification Technology 70 (2010) 243–256
al. [26] have used structured adsorbents in the form of thin zeo-lite films supported on cordierite monoliths for CO2 capture inPSA systems. The pressure drop was 45 times lower than a com-parable packed bed although the adsorption capacity of the newconfiguration adsorbents was 67 times lower than conventionalbeads. Their results suggest the potential of monolith struc-tured adsorbents as a competitive alternative to traditionally usedpacked beds in PSA processes providing a high cell density can beused.
Activated carbon monoliths such as those produced by MASTcarbon, are another class of adsorbents which offer great potentialfor use in various applications such as electric swing adsorption(ESA) and military filtration applications. The monoliths are typ-ically synthesized from a phenolic resin precursor followed bycarbonization step which offers high surface area available foradsorption [33]. Due to inherent electrical conductivity of acti-vated carbon, rapid thermal swing operation can be achieved byregeneration of the monolith through electrical heating. In con-tract to hot purge gas, this method will achieve far faster cycles.In addition, activated carbon monoliths are self-supporting andhence are virtually 100% active material. This advantage offeredby carbon monoliths makes them suitable candidates for electricalswing adsorption (ESA) processes. A more detailed discussion ofESA devices is presented in Section 3.6.
A number of studies have reported monolithic adsorbents for theremoval of volatile organic compounds (VOCs) from air [23,34–38].Shah et al. [39] studied the removal of volatile organic compounds(VOCs) from air using monoliths and performed simulations forcomparing the performance of their novel adsorbents with a packedbed of pellets. In another study Lee et al. [40] showed that theadsorptive performance of hydrophobic zeolite monoliths in theremoval of VOCs from air improves by increasing the cell densityand reducing wall thickness.
Patton et al. [7] observed that by optimizing the design of mono-lithic structures such as appropriate wall thickness, channel widthand shape, it would be possible to improve the separation per-formance of monoliths. They further suggest the use of regularhexagonal channels, for efficient internal mass transfer perfor-mance. The authors then evaluated the performance of hexagonalmonoliths with a wall thickness of 0.4 mm and a channel dimen-sion of 0.6 mm for the removal of VOCs from air and showed thatthe internal mass transfer performance of these adsorbents arecomparable with a typical packed bed containing 1 mm pellets.
Grande et al. [41] demonstrated the behaviour of zeolite 4A hon-eycomb monolith for the adsorption of propane and propylene atdifferent pressures and temperatures. Adsorption equilibrium dataof both gases were reported to be identical to commercial extru-dates, while the kinetic parameters were three orders of magnitudesmaller than extrudates. In other studies performed by Zabka etal. [42,43] the main focus was devoted to the utilization of silica-based monoliths in HPLC columns and the equilibrium and kineticsof adsorption was examined by taking into account Darcy’s law andHETP concepts.
Cutler et al. [44] discloses the use of honeycomb monolithicadsorbents for fuel desulphurization process. The authors furtherrecommend the utilization of such adsorbers in fuel reformingapparatus for generating hydrogen fuel for hydrogen-powered fuelcells, or in fuel delivery systems for supplying low-sulphur fuelto combustion engines, or in other systems supporting combus-tion processes requiring the use of low-sulphur fuel. Adsorptionof CO2, CH4 and N2 in activated carbon honeycomb monolithswas performed by Ribeiro et al. [45]. This investigation aimedat the generation of bio-methane from renewable fuels. Theauthors conducted mathematical modelling for further evaluationof adsorption performance of honeycomb monoliths. A recentlypublished patent by Jain et al. [46] reports the operation of rapid
PSA systems for air separation processes for a cycle time of 35 susing monolith adsorbents.
Desulphurization process can be performed using adsorbents orcatalysts in different forms including pellets/beads, foams or mono-liths. He et al. [47] studied the development of high surface areastructured monolith adsorbents for sulphur removal. These hon-eycomb sulphur traps were fabricated by extruding commerciallyavailable sulphur removal catalysts such as zinc based materialsinto monolithic honeycombs, however, no information regardingthe application of this honeycomb sulphur adsorbent was pro-vided.
Monolithic adsorbents are found to be suitable for use in NOxadsorbers. In these cases, the active adsorbent materials such aszeolites, silicas or alkali/alkaline earth metal oxides are wash-coated on the monolithic structure. Kaboord et al. [48] disclosedpollution control devices, especially adsorbent and catalyst bedsfor diesel engines using monolith structures.
Jale et al. [49] disclosed the use of alkali or alkaline metal saltsin preparing zeolite containing adsorbent sheets, their preparationinto adsorbent monoliths and their subsequent use in air separa-tion process. Based on the author’s claims, the prepared monolithadsorbent exhibits improved nitrogen capacity (around 0.6 mmol/gby addition of LiOH to the sheet) and nitrogen/oxygen selectiv-ity (9.1 at 300 mbar) in air separation process via either PSA orVSA.
The rapid heating and cooling features of monolithic and thinwalled zeolite systems make them ideally suited to TSA appli-cations. One such application is dehumidification of air [50–54].In these applications, monoliths are fabricated into large rotarywheels, permitting alternate adsorption and desorption to occur atdifferent parts of the wheel as it is rotated. For instance, Belding etal. [50], describe the employment of Y-zeolite in the fabrication of adesiccant wheel to provide a body which readily adsorbs moisturecontained in ambient air. They further showed through experi-ments that the zeolite wheel is very efficient in water removal witha capacity of 5.41 tons and a coefficient of performance of 0.92 [53].
The potential application of adsorbent polymer monoliths inparticular, zeolite 4A-polyamide adsorbent, in rapid PSA for theadsorption of water vapour was evaluated by Gorbach et al. [55].According to their results, although the adsorption capacity ofthe polymeric adsorbents was found to be the same as pellets,the mass transfer kinetics was enhanced substantially. The advan-tage of polymeric monoliths over conventional ceramic monolithscould be in the manufacturing step, which is simple and avoidsenergy-intensive high temperature treatment steps, although theafter-treatment step (creating a secondary pore structure) is anenergy demanding step.
Although many studies have been undertaken to evaluatethe mass transfer and pressure drop characteristics of mono-liths in adsorption applications, the effect of thermal managementand adsorbent loading in adsorptive efficiency has been scarcelydiscussed. Future work should carefully consider the potentialenhancement in performance by examining the options of thermalmanagement for monolithic structures.
The introduction of thermal swing honeycomb rotor adsor-bers into the market in 1980s for VOC removal opened a newpath toward development of air treatment process and stimulatedresearchers to study this area. This developed technology utilizesthe adsorbent material in the form of a honeycomb or monolithconfiguration rather than particles. The employment of the adsor-bent in these configurations (honeycomb or monoliths) gives riseto a rapid response to temperature swing in the regeneration step.Initially, activated carbon was chosen to act as adsorbent material,however, soon, it was replaced by zeolite type adsorbents (highsilica adsorbents) in order to avoid the possibility of adsorbentignition during thermal regeneration by hot air.

F. Rezaei, P. Webley / Separation and Purification Technology 70 (2010) 243–256 251
Zeolite paper honeycomb structures have found several appli-cations in adsorption processes mainly VOC removal and airtreatment by TSA apparatus. These adsorbents are usually madeby impregnation of ceramic papers and corrugating the sheets inorder to create the honeycomb structure [21,56–60]. In the studyconducted by Kim et al. [36] zeolite paper in the form of hon-eycomb rotors was employed in the removal of trace amount ofVOCs. Their honeycomb adsorbent showed a remarkable efficiencyfor removing toluene, MEK and cyclohexanone. In another recentstudy by Yamauchi et al. [61], a zeolite honeycomb rotor adsorbentwas applied to the VOC abatement systems operating with TSA.These authors showed that the VOC removal efficiency dependsmainly on variables such as rotation speed, gas flow rate, regen-eration temperature. By operating at optimum condition based onthese variables, it is possible to achieve a high performance withmore than 95% VOC elimination from the feed gas. Although thehoneycomb adsorbers were first employed for elimination of VOCsand other pollutants, recently, some researchers have reported theapplication of this type of adsorbents for CO2 recovery [62]. Mat-sukuma et al. [63] showed through pilot plant experiments that theCO2 recovery in rotary adsorption towers having an inner diameterof 460 mm and adsorbent height of 480 mm could attain more than80%.
Another application of multi-pass honeycomb rotary adsorbersis in desiccant cooling systems with a sandwich arrangement ofhoneycomb shaped adsorbed blocks and aluminium passages [60].In terms of thermal management, this structure offers advantagesin terms of operating at semi-isothermal condition. The authorssuggest the direct regeneration of this system by hot water heatinginstead of air.
3.2. Laminate adsorbents
Laminate structures can be considered a simpler form of mono-liths in which the channels are replaced by 1D slits. As withmonoliths, they can potentially exhibit significantly better per-formance than a packed bed. The practical difficulties involved inreproducibly making such structures are not trivial however. Thetolerances between sheets must be tight (<5%) to avoid maldis-tribution. This requires that the spacing must be maintained towithin less than 0.01 mm generally speaking. As a result of thisdifficult manufacturing process, the use of laminate adsorbentsin separation processes is not common. There are few publishedpatents which describe the use of adsorbent materials in theform of laminate sheets in adsorptive gas separation applications[6,64–66].
Like monoliths, laminate adsorbents suffer from the problem oflow adsorbent density due to several factors. A binder is usuallypresent in the adsorbent matrix in addition to the presence of anexternal support. These non-adsorbent components directly reducethe volume loading of the adsorbent. This is in contrast to fabricsor self-supporting adsorbents where the structure itself would beable to compensate the problem of low adsorbent density. Laminatesheets can be packed into corrugated layers to increase adsorbentloading (and surface area) [36].
In laminate structures, the pressure drop per unit length iscontrolled mainly by altering the space between adjacent sheets.Like monolithic structures, thin sheets with small spacing not onlyincrease pressure drop but also increase adsorbent loading anddecrease mass transfer resistance. To achieve a practical configura-tion, some spacing technology is needed to ensure uniform channelwidth. These spacing devices can be manufactured by differentmethods, such as corrugating the laminates or making ridges onthe sheets. The spaces between adjacent layers could be also cre-ated using external spacing devices such as mesh or grid. Care mustbe taken to ensure the spacer technology does not significantly con-
tribute to higher pressure drop nor obstruct the gas flow throughthe adsorbent.
In 1992, Keefer [67] studied the operation of gas separationby PSA at high cycle frequencies using laminated parallel passageadsorbers. The adsorbent sheets were layered as a stack of flatsheets with channel width between adjacent sheets ranging from15 to 75 �m. They showed that the attainable cycle frequency ofthese laminate sheet configurations is superior by almost an orderof magnitude to that attainable in a packed bed, while the bedlength could be reduced by a similar factor. They further employedtheir structured adsorbents for extraction of trace levels of H2 iso-topes from helium in which the H2 recovery was shown to be 100%with 34% purity. Maurer [68] described the application of a spirallywound adsorbent in TSA systems for gas purification. The adsorbentlayers contain adsorbent particles and the layers are separated byscreens located between them. Ruthven and Thaeron [4] performedsome theoretical and experimental studies on the application of aparallel passage adsorbent (coated with activated carbon fiber) forseparation of CO2 and N2. Their results revealed that such adsorbentconfigurations are well suited to a dual piston rapid PSA system, andoffer a combination of low pressure drop and a large number of the-oretical stages for applications like CO2 removal from stack gases.Another interesting outcome of this investigation was that macro-pore diffusion is a dominant mass transfer resistance in ACF sheets.Furthermore, numerical simulation of such parallel passage con-tactors used in piston-driven PSA was performed in another study[69]. The model developed could efficiently predict the pressuredynamics of parallel-passage piston-driven PSA.
In more recent published patents [64,70] Keefer and co-workersillustrate the utilization of adsorbent laminate structures at ultrarapid PSA systems operating at cyclic frequency of 100 cycle perminute (corresponding to a cycle time of 0.6 s) while the cycle timeof conventional PSA devices for gas separation processes is on theorder of several minutes. Such laminate adsorbents could be cre-ated in different configurations such as rectangular, spiral-woundor annular stack. Moreover, a support or a reinforcement materialis required in their fabrication.
Keefer et al. [66] discloses methods of fabricating zeolite adsor-bent laminate structures with various sheet supports such as metalfoils, woven wire mesh, woven glass fiber cloth and nonwoven fiberglass scrims for the use in PSA systems. The adsorbent laminatescoated with X-zeolites were then used in oxygen enrichment PSAwith cycle frequencies up to 200 cycles per minutes. The adsorbentlaminates had a channel width of 50–75 �m with adsorbent thick-ness of 50–75 �m on both sides of the sheets. Although methods forforming adsorbent laminate structures particularly for use in PSAdevices have been addressed in detail, no report on the utilizationof such structures in real processes has been reported.
Laminate adsorbent structures have been described by Sawadet al. [71]. The authors teach the fabrication of high density adsor-bent sheets by different technologies. Based on the patent claims, itwould be possible to couple the benefits of metallic monoliths (i.e.heat transfer characteristics) and those self-supporting adsorbentsheets through impregnating sheets by materials with high heattransport rate.
Rode et al. [72] illustrated the application of improved adsorbentsheet-based parallel passage structures for PSA, TSA and partial PSAdevices. According to this patent, the adsorbent can be constructedby adhering a suitable adsorbent to a support sheet, mesh or gridon one or both sides of the sheet. These sheet layers may includea binder to immobilize the adsorbent particles or fibrous materialsfor reinforcement of structure. These authors examined the per-formance of laminate sheets by employing them for air, CH4–N2and CH4–CO2 separation systems. This patent reports the utiliza-tion of such configurations not only in kinetic-controlling processesbut also in different adsorptive separation systems by incorporat-

252 F. Rezaei, P. Webley / Separation and Purification Technology 70 (2010) 243–256
ing suitable adsorbent materials. In the case of air separation overa modified 4A zeolite in the form of adsorbent laminates, theirresults showed that cycle frequency can be intensified by a fac-tor of 4, when the zeolite crystal diameter is reduced by a factor of4. Alternatively, the adsorbent structure may use zeolite crystals of1 �m diameter to achieve a 16-fold intensification (increasing cyclefrequency toward 160 cycles/min), while retaining approximatelyequal kinetic selectivity and thus separation performance. More-over, based on the author’s claims, for separation of carbon dioxidefrom methane, the ideal kinetic-controlled adsorptive selectivitycould be as high as around 100 which may be very favourable foreffective separation.
3.3. Foam structures
Ceramic foams have many attractive features as catalyst sup-ports, however, their utilization in adsorptive gas separationapplications is scarce. These types of adsorbents may have sub-stantial benefits over other adsorbent configurations. They offerhigh geometric surface area resulting in an increase in the rateof external mass transfer and due to their inherent large poros-ity these structures are capable of maintaining a lower pressuredrop than a packed bed of pellets/beads [73]. However, it is arguedthat such structures may not be suitable candidates in severalcyclic processes such as PSA or partial PSA devices because of theadsorbent’s high tortuosity and porosity which decrease separationperformance.
Due to the inherent high porosity of foam adsorbents, theamount of active material may not be adequate to exhibit the samevolume activity as a packed bed of pellets, however, this problemcould be solved through adjusting the amount of adsorbent coat-ing on the structure of the foam. As with monolith adsorbents, theflow friction and hence the pressure drop is decreased due to thelarger flow channels and presence of large number of voids whichallows the radial mixing of flow. This is the advantage (high bedporosity) of foam adsorbents over monolithic structures in whichlaminar flow does not allow radial mixing. Typically, higher voidagein the bed is favoured for operation at high velocities (i.e. highcycle frequency in cyclic operations) where pressure drop becomescrucial.
More recently, Patcas et al. [8] have performed an experimentalcomparison of catalysts with different carriers, namely, honeycombmonoliths, ceramic foams and spherical particles based on theirpressure drop and mass and heat transfer characteristics in theoxidation of carbon monoxide. Their result showed that the perfor-mance of foam catalysts in terms of combined high mass transferand low pressure drop was superior to particles and inferior to thathoneycomb structures.
There has been extensive research on the preparation of zeolitefoams using polymeric templates [71,74], but in spite of the promis-ing advantages offered by foam structures, their employment ingas separation processes has not been studied yet. According toYoon et al. [74], since there is no blocking problem owing to a bind-ing agent and since zeolite is formed in the form of a thin layer inthe foam even without any separate support, gas can freely moveinside the zeolite foam having various outer shapes and thus thezeolite usage efficiency is substantially increased to nearly 100%.Moreover, due to the presence of macropores which are spatiallycommunicated with each other and are large enough for moleculesto freely enter and leave, the pressure drop could be substantiallyreduced in adsorption processes.
3.4. Fabric structures
Adsorbent fabrics present advantageous features for gas sep-aration application. Due to the self-supporting nature of these
configurations, they can potentially provide high adsorbent load-ings while simultaneously providing very rapid mass transferthrough the thin fibers of which the fabric is composed. Adsorbentfabric can be fabricated into various configurations in such a waythat it still maintains the benefits of the fabric. The preferred config-urations are parallel sheets and spiral-wound structures. Additionaladvantages offered by flexible adsorbent fabrics are lower attritionrates and higher mechanical strength. There is often no require-ment for external support or spacers [75]. The heat transportcharacteristics of fabric adsorbents could be enhanced by mod-ifying the materials present in the structure through employingmaterials with high thermal conductivity (by coating or impregna-tion techniques or weaving). Self-supporting cloths offer a lowerresistance to gas flow and give rise to a lower pressure drop in thebed and of course eliminate fluidization issues.
The use of adsorbent fabrics in adsorption processes was firstreported in the early 1980s when Bailey et al. [76] described theapplication of charcoal cloth configuration in adsorptive filters forair purification process. This patent claims that such cloth formadsorbents offer an appreciable adsorptive capacity and a muchlower resistance to gas flow when compared to conventional pel-lets/beads. These charcoal cloths could be preferentially positionedparallel to the direction of gas flow for better performance.
Golden et al. [6] reports the use of adsorbent fabrics with aver-age pore diameter from 12 to 15 Å in rapid PSA systems for CO2capturing and H2 recovery. They found that these configurationsare particularly suitable at shorter cycle times where mass transfercharacteristics play a key role in separation. Employment of fabricadsorbents at longer cycle times where separation is performedbased on equilibrium, does not give rise to any advantage overpacked beds of pellets. Later, Golden et al. [75] reported data forthe capture of CO2 and H2 recovery by rapid PSA and comparedthe results with monolithic and granules geometries. They claima hydrogen recovery of at least 70% and a productivity of 99.9%.In the case of CO2 adsorption using self-supported fabrics, a CO2mass transfer coefficient of at least 0.5 s−1 can be obtained whichcorresponds to a larger mass transfer rate than that attainable in apacked bed.
Sawad et al. [71] demonstrated coating activated carbon pow-der onto a fabric, cloth or felt made from activated carbon fibers.According to the authors’ claims, such adsorbent structures havethe advantage that the substrate itself is an active adsorbent mate-rial which leads to a higher density adsorbent compared to the samesystem using an inert or non-adsorbent support.
By using an organic binder system, an activated carbon-coatedactivated carbon fabric, cloth, or felt may be treated under theappropriate conditions (including high temperature pyrolysis anda steam- or CO2-activation stage) to convert the binder to activeadsorbent. Using either or both of the above inventive modifica-tions, the resulting adsorbent sheet possesses a high adsorbentdensity because a greater portion of the sheet structure mayactively adsorb gases compared to systems where the binder and/orsubstrate are inert toward the desired adsorption process [71].
In the case of electrothermal desorption of adsorbents,Petkovska et al. [77] employed a bed with layers of activated carboncloths in TSA process. A few years later, Sullivan et al. [78] used thesame adsorbent configuration for removing hazardous air pollu-tants such as MEK, with a capture efficiency of more than 99.9% bymass. The adsorbent cloths were used in annular-cartridge config-uration with the advantage of rapid electrothermal regeneration aswell as low pressure drop. In another study Baudu et al. [79] appliedthe principle of thermal regeneration by Joule effect to a bed ofactivated charcoal cloth/or grains, for air treatment application.
As with fabric adsorbents, very little research has been per-formed with respect to thermal management or adsorbent loadingconsiderations. Based on the unique feature of such adsorbents and
F. Rezaei, P. Webley / Separation and Purification Technology 70 (2010) 243–256 253
noticeable benefits gained by utilizing them in advanced adsorptiveseparation processes, there is a large opportunity to exploit theirfeatures for thermal management.
3.5. Other structures
In the case of traditional pellets used in adsorptive gas sep-aration, recent advances have been achieved for fabrication ofbinderless pellets by converting the binder material to an activeadsorbent. This dense packing technology tends to maximize thedensity of active adsorbent material. Attempts have been made toimprove the fabrication process of beads/pellets; synthesizing ofparticles with controllable physical properties and well-orderedstructures with uniform pore size distribution are among them.However, the most important drawback of particles configurations(high pressure drop) remains a large challenge which motivates theapplication of other structures.
The film growing method is another widely used technologyfor improving the adsorbent performance by increasing the activematerial loading [80–90]. Nikolajsen et al. [91] developed a struc-tured sintered metal fiber plate covering a thin film of MFI-typezeolite for adsorption applications. This configuration was shownto be an efficient adsorbent in VOC removal. Ohrman et al. [92]grew well-defined ZSM-5 films on 400 cpsi cordierite monolithsusing the seed-film method. They further tested their structuredcatalysts for P-xylene isomerisation. In another approach, Perdanaet al. [93] reported the modelling of cordierite monoliths coatedwith a thin film of NaZSM-5, for NOx adsorption application. Mat-suoka et al. [94] describes the bench and pilot scale NOx removalby adsorption process using VSA apparatus. The recovery of NOxfrom the denitrator was reported to be more than 95%.
Barrett et al. [95] fabricated adsorbent beads with higher masstransfer rates than ordinary pellets. The method employed formaking these pellets involves the steps of low pressure extrusionand spherization. Although a detailed description of manufactur-ing steps was provided, the potential application of these improvedpellets was not discussed.
Recently Leedy et al. [96], employed adsorbent honeycombmonoliths impregnated with alkaline or caustic salts to removeacidic gases, specifically H2S. According to the disclosed claimsof this patent, impregnated activated carbon monoliths exhibitimproved adsorption capacity with a shorter mass transfer zone(MTZ) at a substantially lower pressure drop, compared to acti-vated carbon pellets impregnated with the same alkaline salt witha similar loading. The impregnated monolith structures showed amass transfer zone of 2–4 in. while the mass transfer zone relatedto impregnated pellets was 8–12 in. The pressure drops relatedto these structures were 0.1 and 2 in. H2O/ft, respectively. Theadsorption capacity of impregnated monoliths was reported tobe 70 kg H2S/m3 bed, while the impregnated particles showed17 kg H2S/m3 adsorption capacity.
An important application of structured adsorbents is in adsorp-tion heat pump systems. Due to strict environmental regulations,adsorption heat pumps have gained more attention than con-ventional mechanical heat pump systems. In spite of rigorousadvantages offered by such systems, their coefficient of perfor-mance (COP) is still lower than mechanical ones, therefore a widevariety of studies have been conducted to improve the performanceof adsorption heat pumps. Among them, the adsorbent bed struc-ture has received attention. Currently, the adsorption heat pumpuses the adsorbent materials in the form of pellets, granules orfibers.
In the study conducted by Bonaccorsi et al. [97] open cellcopper foams coated with active adsorbent material (zeolite 4A)was applied. In another study, a fast cycle adsorption refrigeratorwas evaluated using monolithic carbon discs combined with alu-
minium fins aimed at enhancing the heat and mass transfer ratesby Critoph et al. [98]. Due to low thermal conductivity of the adsor-bent materials used in adsorption heat pumps, designers attemptedto overcome this deficiency by employing fins or metallic supportssuch as aluminium, steel or copper for coating adsorbent materials.
3.6. Use of adsorbent structures in electrical swing adsorption(ESA)
The concepts of “in situ” heating of adsorbents by electric cur-rent in the regeneration step was first proposed 40 years ago [99]and since then many studies have been devoted to apply this princi-ple and develop TSA processes [77–79,100–104]. In electrothermaldesorption devises, there are two electric resistances when pelletsare being used, namely, the intrinsic resistance of each grain, aswell as the resistance due to contact between particles. This impliesthat the resistance in the bed is anisotropic and the temperature isinhomogeneous along the bed. The use of ohmic heating necessi-tates a continuous adsorbent for electrical continuity and thereforestructured adsorbents are desirable. In the case of fabric or clothconfigurations being used in ESA devices, the problem of inhomo-geneous temperature and the existence of hot points does not seemto be a severe issue, due to the movement of current in the directionof fibers although there might be a resistance at a microscopic scalebetween fibers. Monolithic structures are well adapted to applica-tion in ESA since the problem of electric contacts between particlesin packed beds or even cloths is completely removed.
ESA confers remarkable benefits compared to conventionalthermal regenerations, since the heat is delivered directly to theadsorbent media not to the vessel. Furthermore, heating by elec-tricity allows the control of purge gas flow rate and the bedtemperature independently from the power applied to obtain themaximum amount of effluent concentration. On the other hand, itmust not be forgotten that the electric current is derived from apower station in which heat is used to generate power. Thus usingelectric current to generate heat is not thermodynamically desir-able and should only be examined in cases where direct thermalregeneration is impractical.
Yu et al. [35] used activated carbon monoliths for VOCs removalusing electrothermal desorption method. Yu et al. [105,106] inves-tigated the electrothermal swing adsorption (ESA) process with anactivated carbon monolith (400 cpsi) as adsorbent for adsorptionof toluene vapours. They showed that activated carbon monolithsbehave as a semi-conductor and the resistivity decreases as tem-perature decreases and amount adsorbed increases. The authorsshowed that the toluene vapours could be effectively enriched tohigh concentration. Also, they emphasized that the process perfor-mance is strongly dependent on the operating conditions and thedesorption rate could be controlled by adjusting the electric cur-rent and purge gas flow rate. In a more recent study by Grande andRodrigues [107], electric swing adsorption was employed for theremoval of low molar fractions of CO2 from flue gas. These authorsutilized carbon honeycomb monolith as an adsorbent in ESA sys-tem which showed low electrical resistivity. Based on their findings,direct Joule effect enhanced CO2 desorption rate. However, in orderto obtain a higher recovery (more than 89%), the CO2 purity wassacrificed to 16%. Place et al. [108] in their patent describe theapplication of porous monolithic carbon adsorbents for removingof VOCs from gas stream in an ESA system. The regeneration ofmonoliths that are electrically connected is performed using directheating by electric current. According to author’s claims, due to thelow regenerant gas flows required in this system, the additionalload on the adsorber is minimized. This is only possible with theelectrically heated monoliths where large regenerant gas flows tocarry the heat to the reactor are not required. Moreover, due tothe low thermal capacity of the monolithic structures they can be
254 F. Rezaei, P. Webley / Separation and Purification Technology 70 (2010) 243–256
cooled back sufficiently quickly to the normal adsorption temper-atures using feed gases without any adverse effect on the overalladsorption cycle.
3.7. Criteria for the assessment of adsorbent structure
From the preceding discussion it is clear that a large number ofadsorbent structures are available and some have received closestudy. It is of interest however to attempt to derive criteria for theassessment of these competing structures for an application. Opti-mization of adsorbent structures for gas separations was recentlystudied by Rezaei and Webley [14]. The key results from that studyare discussed here.
In a gas separation process, the goal is usually to maximizespecific productivity, i.e. to be able to maximize throughput in agiven amount of adsorbent. It is therefore necessary to consideran appropriate combination of process parameters to demonstratehow the pressure drop, cycle time and adsorption front affect sys-tem performance. As pointed out in Section 2.1, the system specificproductivity is the product of the working capacity (moles of gasadsorbed/desorbed per unit mass of adsorbent including binder,support, etc.) and the density of the composite adsorbent. Thethroughput attainable in a given volume of vessel in a cyclic adsorp-tion system may be expressed as
Throughput (TPD) ∝ gas productioncycle × mads
× cycleday
(11)
Specific productivity = kWC
�(12)
where mads is the mass of adsorbent and k is a proportionality con-stant. The effect of pressure drop on the productivity is to reducethe overall working capacity. Instead of operating between a highpressure PH and a low pressure PL, the average bed pressure onadsorption is only PH − �P/2 and the bed pressure on desorption isPL + �P/2. In practice, the bed pressure drop on adsorption and des-orption is not equal since the gas velocity is different in these steps.For simplicity in this analysis, we assume they are equal. Thus thepressure difference between adsorption and desorption is approx-imately diminished from PH − PL to PH − PL − �P. Generally (for anyisotherm), the working capacity will be reduced by some functionof �P written as f1 (�P). The situation for linear isotherms is shownin more detail below. A more exact analysis of the effect of pressurecan only be obtained through detailed numerical simulations.
The effect of mass transfer zone (MTZ) on specific productivityis to reduce the effective length of bed which also translates to areduction in working capacity. Again, this can be represented gen-erally as some function f2 of the MTZ. The specific productivity cantherefore be written as:
Specific productivity = k[WC − f1(�P) − f2(MTZ)]�
(13)
where f1 and f2 are functions of �P and MTZ, respectively. Sincethe cycle time is inversely proportional to bed velocity
� ∝ 1U
The specific productivity equation can be further rearranged to
specific productivity = k′[WC − f1(�P) − f2(MTZ)]U
= k′[WC − f1(�P(U)) − f2(MTZ(U))]U (14)
where k′ is another proportionality constant and the dependence ofpressure drop and mass transfer zone on velocity is made explicit.In order to find f1 and f2, consider a linear isotherm. For no pressuredrop in the system, the ideal amount of adsorbate loading per mass
of adsorbent is given by
WC = �nideal = K(PH − PL) (15)
As mentioned earlier, pressure drop affects the process byreducing the average pressure swing between feed and blowdownin PSA system. The working capacity for the system with pressuredrop and a mass transfer zone is therefore (to a first approximation)
�nnon-ideal =(
K((
PH − �P
2
)−
(PL + �P
2
)))(1 − MTZ
L
)
= (K(PH − PL) − K�P)(
1 − MTZ
L
)(16)
�nnon-ideal = (�nideal − K�P)(
1 − MTZ
L
)(17)
Therefore, the specific productivity of the adsorbent system canbe represented by the following correlation
specific productivity = k′(�nideal − K�P)(
1 − MTZ
L
)U (18)
Eq. (18) indicates that specific productivity is proportional tothe superficial velocity and inversely proportional to MTZ and pres-sure drop. Therefore any factor affecting the MTZ and pressure dropmay influence the specific productivity. Specifically, the trade-off inspecific productivity as a function of velocity is clear. At high veloc-ities, cycle time is reduced however, the pressure drop and MTZlength increases which decrease overall system performance. Atlow velocities, pressure drop and MTZ effects are small but the longcycle times lead to low specific productivity. The maximum specificproductivity as a function of velocity therefore depends strongly onhow much MTZ and pressure drop are negatively affected by highvelocities. Our earlier study showed that different adsorbent struc-tures achieve their optimum performance at different velocitieswith structured adsorbents most suited to regions of high velocitywhere they display their superiority [14].
3.8. Key areas for future research
A major driver toward the development of future adsorptivegas separation processes lies in the development of improvedsorbent materials. However, these improved materials with bet-ter adsorption–desorption capacity must ultimately find theirway into a real process for commercial applications that shouldoperate within a rapid PSA or TSA regime or other intensiveseparation processes to maximize product output per unit massof adsorbent. As shown above, a wide variety of possible struc-tures have been advanced over the last two decades to overcomeexisting limitations of pressure drop, mass transfer, etc. In manycases however, some feature of the process is compromisedso that inferior performance to a packed bed results. Thereis a need for research to address the following questions andissues:
(a) What is the optimum generalised gas–solid contacting topol-ogy to effect a particular separation and to what extent do theexisting structures approach this optimal topology? Researchshould be directed to developing useful mathematical modelswhich encompass the compensating effects of adsorbent load-ing, mass transfer, pressure drop, and heat transfer as a functionof gas/solid contacting geometry and a function of adsorbenttype. These general models should be validated against exist-ing structures and then used to guide further experimentalefforts.
(b) The role of thermal management in TSA/PSA processes hasnot received sufficient attention. Modern manufacturing tech-niques can create adsorbent structures with heat transfer
F. Rezaei, P. Webley / Separation and Purification Technology 70 (2010) 243–256 255
characteristics superior to conventional beads or pellets andfuture research should be directed to understanding therelationship between adsorbent structure, heat transfer prop-erties and overall system performance. Such techniques mayinvolve the process of producing binderless material toimprove heat and mass transport characteristics, productionof composite adsorbents with high electrical and thermalconductivity in order to dissipate adsorption heat easierand efficient, employment of suitable support to tailor thethermal properties of the support with mass transfer prop-erties of active material and production of activated carbonmonoliths.
(c) The relationship between separation performance, macro-scopic adsorbent structure (the subject of this review) and themacro/meso/micropore hierarchy of the adsorbent has not beenexplored to date. Thus pore engineering must be integrated withsystems engineering to produce an overall optimal structure.This is a fertile area for future research into adsorbent structuresparticularly with the explosion in development of nanoporousmaterials.
4. Conclusion
Conventional gas separation processes using packed bedsof beads or granules suffer predominantly from high pressuredrop and mass transfer resistance when higher throughputs arerequired, leading to lower productivity and recovery and higherpower consumption. This restricts their application to low through-puts and makes them less attractive compared to the cryogenicprocesses for large volume production and high productivity. Theseproblems could be overcome by employing alternate adsorbentstructures. The major trends toward the design of more com-pact processes with lower capital and operating cost suggestthe use of adsorbent configurations which offer a low pressuredrop, fast mass transfer kinetics and high working capacity. Thenew generation of cyclic adsorption systems with cycle timemuch shorter than conventional ones necessitates not only animproved process cycle but the employment of novel adsor-bent configurations which satisfy almost all requirements ofgas process systems in terms of performance and process effi-ciency.
In this short review, the use of different adsorbent structureswith improved performance as a competitive alternate to conven-tional packed beds of pellets/beads was discussed. Although theadvances achieved in the utilization of structured adsorbents dur-ing the last decade have been significant, there is still a need todevelop generalised rules or criteria for optimizing the selectionand design of a particular adsorbent structure for a particular appli-cation. These criteria must take into account all of the importantcharacteristics of adsorbents which affect the system behaviour. Inour recent study [14] we have qualitatively studied the impact ofadsorbent structure on overall performance of adsorption based gasseparation systems and formulated a new methodology for evalu-ating different adsorbent configurations. This methodology couldhelp provide a general overview of adsorbent evaluation and selec-tion. Future work should focus on examining optimal gas–solidcontact topologies in a more general sense to provide a theoret-ical limit to which practical devices could be compared. Such astudy could employ concepts such as pore network models cou-pled to macroscopic flow models to study the dynamic behaviourof the interaction of the adsorption process with the macroscopicflow process. This modelling effort is currently underway in ourlaboratory. In addition, advanced thermal management oppor-tunities which are possible with adsorbent structures should bestudied.
Acknowledgment
The authors would like to acknowledge the Monash ResearchGraduate School (MRGS) for providing scholarship support forFateme Rezaei.
References
[1] P. Xiao, J. Zhang, P. Webley, G. Li, R. Singh, R. Todd, Adsorption 14 (2008)575–582.
[2] J. Smolarek, F.W. Leavitt, J.J. Nowobilski, V.E. Bergsten, J.H. Fassbaugh, Euro-pean Patent, EP0820798 (1998).
[3] S. Ergun, Chem. Eng. Prog. 48 (1952) 89–94.[4] D.M. Ruthven, C. Thaeron, Gas Sep. Purif. 10 (1996) 63–73.[5] Y.Y. Li, S.P. Perera, B.D. Crittenden, Chem. Eng. Res. Des. 76 (1998) 921–930.[6] T.C. Golden, C.M.A. Golden, D.P. Zwilling, US Patent US6,565,627 (2003).[7] A. Patton, B.D. Crittenden, S.P. Perera, Chem. Eng. Res. Des. 82 (2004)
999–1009.[8] F.C. Patcas, G.I. Garrido, B. Kraushaar-Czarnetzki, Chem. Eng. Sci. 62 (2007)
3984–3990.[9] D.M. Ruthven, Principles of Adsorption and Adsorption Processes, John Wiley
& Sons, Inc., 1984, p. 243.[10] R.T. Yang, Gas Separation by Adsorption Processes, John Wiley and Sons, Inc.,
1987.[11] N. Wakao, T. Funazkri, Chem. Eng. Sci. 33 (1978) 1375–1384.[12] R.D. Hawthorn, AIChE Symp. 70 (1974) 428–438.[13] G. Groppi, L. Giani, E. Tronconi, Ind. Eng. Chem. Res. 46 (2007) 3955–3958.[14] F. Rezaei, P. Webley, Chem. Eng. Sci. (2009), doi:10.1016/j.ces.2009.08.029.[15] G.I. Taylor, Proc. Phys. Soc. Sect. B 67 (1954) 857–869.[16] J. Collins, US Patent, US4,026,680 (1977).[17] V. Gueret, C. Monereau, P. Pullumbi, PCT Int. Appl., W.I.P.O. Patent
WO2008037904 (2008).[18] D.M. Ruthven, Ind. Eng. Chem. Res. 39 (2000) 2127–2131.[19] S. Irandoust, B. Andersson, Catal. Rev. Sci. Eng. 30 (1988) 341–392.[20] I.L. Maclaine-Cross, P.J. Banks, Int. J. Heat Mass Transf. 15 (1972) 1225–1242.[21] A. Kodama, M. Goto, T. Hirose, T.J. Kuma, Chem. Eng. Jpn. 26 (1993) 530–535.[22] R.E. Kenson, Environ. Prog. 4 (1985) 161–164.[23] K.P. Gadkaree, Carbon 36 (1998) 981–989.[24] Y.Y. Li, S.P. Perera, B.D. Crittenden, Chem. Eng. Res. Des. 76 (1998) 931–941.[25] L. Li, B. Xue, J. Chen, N. Guan, F. Zhang, D. Liu, H. Feng, Appl. Catal. A: Gen. 292
(2005) 312–321.[26] A. Mosca, J. Hedlund, F.N. Ridha, P. Webley, Adsorption 14 (2008) 687–693.[27] M. Park, et al., US Patent US 6,171,373 (2001).[28] G. Li, R. Singh, D. Li, C. Zhao, L. Liu, P. Webley, J. Mater. Chem. (2009),
doi:10.1039/b912329f.[29] J.J. Meyers, A.I. Liapis, J. Chromatogr. A 827 (1998) 197–213.[30] J.J. Meyers, A.I. Liapis, J. Chromatogr. A 852 (1999) 3–23.[31] A.I. Liapis, J.J. Meyers, O.K. Crosser, J. Chromatogr. A 865 (1999) 13–25.[32] F. Brandani, A. Rouse, S. Brandani, D.M. Ruthven, Adsorption 10 (2004)
99–109.[33] B. Crittenden, A. Patton, C. Jouin, S. Perera, S. Tennison, J.A.B. Echevarria,
Adsorption 11 (2005) 537–541.[34] M. Yates, J. Blanco, P. Avila, M.P. Martin, Micropor. Mesopor. Mater. 37 (2000)
201–208.[35] F.D. Yu, L.A. Luo, G. Grevillot, J. Chem. Eng. Data 47 (2002) 467–473.[36] H.S. Kim, J.W. Kim, J.E. Yie, H. Moon, Proceedings of the Third Pacific Basin
Conference on Adsorption Science and Technology, vol. 1, 2003, pp. 286–290.[37] T. Valdes-Solis, M.J.G. Linders, F. Kapteijn, G. Marban, A.B. Fuertes, Chem. Eng.
Sci. 59 (2004) 2791–2800.[38] A. Lapkin, L. Joyce, B.D. Crittenden, Environ. Sci. Technol. 38 (2004)
5815–5823.[39] D.B. Shah, S.P. Perera, B.D. Crittenden, in: Fundamentals of Adsorption, Boston,
1996, pp. 813–820.[40] L.Y. Lee, S.P. Perera, B.D. Crittenden, S.T. Kolaczkowski, Adsorpt. Sci. Technol.
18 (2000) 147–170.[41] C.A. Grande, S. Cavenati, P. Barcia, J. Hammer, H.G. Fritz, A.E. Rodrigues, Chem.
Eng. Sci. 61 (2006) 3053–3063.[42] M. Zabka, M. Minceva, A.E. Rodrigues, Chem. Eng. Process: Process Intens. 45
(2006) 150–160.[43] M. Zabka, P.S. Gomes, A.E. Rodrigues, Sep. Purif. Technol. 63 (2008) 324–333.[44] W.A. Cutler, L. He, C.M. Sorensen, L.K. Owens, W.I.P.O. Patent WO2004058372
(2005).[45] R.P. Ribeiro, T.P. Sauer, F.V. Lopes, R.F. Moreira, C.A. Grande, A.E. Rodrigues, J.
Chem. Eng. Data 53 (2008) 2311–2317.[46] R. Jain, A.I. LaCava, A. Maheshwary, J.R. Ambriano, D.R. Acharya, F.R. Fitch, US
Patent US6,521,019 (2003).[47] L. He, L.K. Owens, W.A. Cutler, C.M. Sorensen, Ceram. Eng. Sci. Proc. 25 (2004)
529–534.[48] W.S. Kaboord, J.A. Kovacich, D.M. Becher, F.J. Begale, US Patent US2005249645
(2005).[49] S.R. Jale, F.R. Fitch, S. Dongmin, US Patent US6,436,173 (2002).[50] W.A. Belding, M.F.P. Delmas, W.D. Holeman, D.A. McDonald, US Patent,
US5,685,897 (1997).

256 F. Rezaei, P. Webley / Separation and Purification Technology 70 (2010) 243–256
[51] W.A. Belding, M.F.P. Delmas, W.D. Holeman, D.A. McDonald, US Patent US5,650,221 (1997).
[52] W.A. Belding, W.D. Holeman, Z. Lavan, R.L. Jones, US Patent US5,580,369(1996).
[53] W.A. Belding, C.H. Lam, W.D. Holeman, S.L. Janke, US Patent US5,890,372(1999).
[54] R.A. Macriss, W.F. Rush, S.A. Weil, US Patent US4,012,206 (1977).[55] A.B. Gorbach, M. Stegmaier, G. Eigenberger, J. Hammer, H.G. Fritz, Adsorption
11 (2005) 515–520.[56] A. Kodama, Memoirs of the Faculty of Engineering, vol. 40, Kumamoto Uni-
versity, 1996, pp. 313–351.[57] A. Kodama, K. Andou, M. Ohkura, M. Goto, T. Hirose, J. Chem. Eng. Jpn. 36
(2003) 819–826.[58] A. Kodama, M. Goto, T. Hirose, T. Kuma, J. Chem. Eng. Jpn. 28 (1995) 19–24.[59] A. Kodama, M. Goto, T. Hirose, T. Kuma, J. Chem. Eng. Jpn. 27 (1994) 644–649.[60] A. Kodama, N. Watanabe, T. Hirose, M. Goto, H. Okano, Adsorption 11 (2005)
603–608.[61] H. Yamauchi, A. Kodama, T. Hirose, H. Okano, K.I. Yamada, Ind. Eng. Chem.
Res. 46 (2007) 4316–4322.[62] Y. Matsukuma, Y. Matsushita, H. Kakigami, G. Inoue, M. Minemoto, A. Yasu-
take, N. Oka, Kagaku Kogaku Ronbunshu 32 (2006) 138–145.[63] Y. Matsukuma, K. Sadagata, H. Kakigami, G. Inoue, M. Minemoto, A. Yasutake,
N. Oka, Kagaku Kogaku Ronbunshu 32 (2006) 146–152.[64] B.G. Keefer, C.R. Mclean, US Patent US6,056,804 (2000).[65] D.J. Connor, D.G. Doman, L. Jeziorowski, B.G. Keefer, B. Larisch, C. McLean, I.
Shaw, US Patent US 6,406,523 (2002).[66] B.G. Keefer, A. Carel, B. Sellars, I. Shaw, B. Larisch, US Patent, US6,692,626
(2004).[67] B.G. Keefer, US Patent US5,082,473 (1992).[68] R.T. Maurer, US Patent US5,338,450 (1994).[69] S. Farooq, C. Thaeron, D.M. Ruthven, Sep. Purif. Technol. 13 (1998) 181–193.[70] B.G. Keefer, US Patent US6,176,897 (2001).[71] J.A. Sawad, S. Alizadeh-Khiavi, S. Roy, S.M. Kuznicki, W.I.P.O. Patent
WO2005032694 (2005).[72] E.J. Rode, A.J.J. Boulet, A.M. Pelman, M.L. Babicki, B. Keefer, J.A. Sawada,
S. Alizadeh-Khiavi, S. Roy, A.C. Gibbs, S.M. Kuznicki, W.I.P.O. PatentWO200660743432 (2007).
[73] J.T. Richardson, D. Remue, J.K. Hung, Appl. Catal. A: Gen. 250 (2003) 319–329.[74] K.B. Yoon, Y.J. Lee, Y.S. Park, J.S. Lee, US Patent US2,002,183,407 (2002).[75] T.C. Golden, C.M.A., Golden, P.J. Battavio, US Patent US6,893,483 (2005).[76] A. Bailey, F.A.P. Maggs, US Patent US4,234,326 (1980).[77] M. Petkovska, D. Tondeur, G. Grevillot, J. Granger, M. Mitrovic, Sep. Sci. Tech-
nol. 26 (1991) 425–444.[78] P.D. Sullivan, M.J. Rood, K.J. Hay, S. Qi, J. Environ. Eng. 127 (2001) 217–223.[79] M. Baudu, P. Le Cloirec, G. Martin, De Charbons Actifs Utilises Pour Le Traite-
ment D’air 13 (1992) 423–435.[80] J.E. Antia, R. Govind, Appl. Catal. A 131 (1995) 107–120.
[81] J. Hedlund, B.J. Schoeman, J. Sterte, Stud. Surf. Sci. Catal. 105 (1997)2203–2210.
[82] R. Aiello, F. Crea, F. Testa, A.S. Gattuso, in: I. Kiricsi, J.B. Nagy, H.G. Karge (Eds.),Porous Materials in Environmental Friendly Processes, Elsevier, Amsterdam,1999, p. 29.
[83] Z. Shan, W.E.J. Van Kooten, O.L. Oudshoorn, J.C. Jansen, H. Van Bekkum, C.M.Van Den Bleek, H.P.A. Calis, Micropor. Mesopor. Mater. 34 (2000) 81–91.
[84] C.D. Madhusoodana, R.N. Das, Y. Kameshima, A. Yasumori, K. Okada, Micropor.Mesopor. Mater. 46 (2001) 249–255.
[85] J. Sterte, J. Hedlund, B.J. Schoeman, Catal. Today 69 (2001) 323–329.[86] E.I. Basaldella, A. Kikot, J.F. Bengoa, J.C. Tara, Mater. Lett. 52 (2002) 350–354.[87] M.A. Ulla, R. Mallada, J. Coronas, L. Gutierrez, E. Miro, J. Santamaria, Appl. Catal.
A: Gen. 253 (2003) 257–269.[88] A.E.W. Beers, T.A. Nijhuis, N. Aalders, F. Kapteijn, J.A. Moulijn, Appl. Catal. A:
Gen. 243 (2003) 237–250.[89] J. Coronas, J. Santamaria, Chem. Eng. Sci. 59 (2004) 4879–4885.[90] J. Hedlund, O. Ohrman, V. Msimang, E. van Steen, W. Bohringer, S. Sibya, K.
Moller, Chem. Eng. Sci. 59 (2004) 2647–2657.[91] K. Nikolajsen, L. Kiwi-Minsker, A. Renken, Chem. Eng. Res. Des. 84 (2006)
562–568.[92] O. Ohrman, J. Hedlund, J. Sterte, Appl. Catal. A: Gen. 270 (2004) 193–199.[93] I. Perdana, D. Creaser, I. Made Bendiyasa, Rochmadi, B. Wikan Tyoso Chem.
Eng. Sci. 62 (2007)3882-3893.[94] S. Matsuoka, T. Kodama, J. Izumi, H. Tsutaya, K. Kurosu, H. Someya, J. Nucl. Sci.
Technol. 41 (2004) 466–472.[95] P.A. Barrett, N.A. Stephenson, S.J. Pontonio, W.I.P.O. Patent WO2008051904
(2008).[96] W.B. Leedy, J.F. Eichelsbacher, T.H. Shelton, US Patent US200810236389
(2008).[97] L. Bonaccorsi, A. Freni, E. Proverbio, G. Restuccia, F. Russo, Micropor. Mesopor.
Mater. 91 (2006) 7–14.[98] R.E. Critoph, T.Z. Telto, L.N.G. Davies, Proc. Inst. Mech. Eng. 214 (2000).[99] B.M. Fabuss, W.H. Dubois, 63rd Annual Meeting of the Air Pollution Control
Association 18 (1970).[100] W. Hauck, G. Grevillot, A.S. Lamine, Chemie-Ingenieur-Technik 69 (1997)
1138–1142.[101] M. Petkovska, M. Mitrovic, Chem. Eng. J. Biochem. Eng. J. 53 (1994) 157–165.[102] M. Petkovska, M. Mitrovic, Chem. Eng. Res. Des. 72 (1994) 713–722.[103] M. Rood, P. Sulliva, K.J. Hay, US Patent, US6,364,936 (2002).[104] E. Crezee, B.D. Tennison, B.D. Crittenden, Proceedings of 7th World Congress
on Chemical Engineering, Glasgow, 2005.[105] F.D. Yu, L.A. Luo, G. Grevillot, J. Environ. Eng. 130 (2004) 242–248.[106] F.D. Yu, L. Luo, G. Grevillot, Chem. Eng. Process: Process Intens. 46 (2007)
70–81.[107] C.A. Grande, A.E. Rodrigues, Int. J. Greenhouse Gas Control 2 (2008) 194–202.[108] R.N. Place, A.J. Blackburn, S.R. Tennison, A.P. Rawlinson, B.D. Crittenden, US
Patent US6,964,695 (2005).
PAPER B
Optimum structured adsorbents for gas separation processes
Authors:F.Rezaei, P. Webley
Chemical Engineering Science 64 (2009) 5182 - 5191
67

68 PAPER B

Chemical Engineering Science 64 (2009) 5182 -- 5191
Contents lists available at ScienceDirect
Chemical Engineering Science
journal homepage: www.e lsev ier .com/ loca te /ces
Optimum structured adsorbents for gas separation processes
Fateme Rezaei, Paul Webley∗Department of Chemical Engineering, Monash University, VIC 3800, Australia
A R T I C L E I N F O A B S T R A C T
Article history:Received 2 June 2009
Received in revised form 19 August 2009
Accepted 22 August 2009
Available online 1 September 2009
Keywords:
Structured adsorbent
Mass transfer zone
Pressure drop
Adsorbent loading
Recent developments in separation technology by adsorption have included the development of new
structured adsorbents which offer some attractive characteristics compared to a typical packed bed.
These improved features include lower energy consumption, higher throughput and superior recovery
and purity of product. However, the exact combination of structural, geometric parameters which yields
optimum performance is unknown. This study formulates a methodology for comparison based on a
variety of analytical and numerical models and uses it to examine the performance of different adsorbent
configurations. In particular, monolithic, laminate and foam structures are evaluated and compared to a
packed bed of pellets. The effects of physical adsorbent parameters which govern the performance of a PSA
process are considered during model development. Comparisons are carried out based on mass transfer
kinetics, adsorbent loading and pressure drop of a PSA system for CO2/N2 separation. The results indicated
that structured adsorbents can provide superior throughput to packed beds provided their geometrical
parameters exceed certain values. For example, laminate structures can offer superior performance to a
packed bed of pellets only if the critical sheet thickness and spacing are less than about 0.2mm. Each
adsorbent structure should be designed to operate at its “optimal” velocity. When operating at velocities
higher than the “optimal” value, the increase in pressure drop and length of the mass transfer zone more
than offsets gains accrued through reduction in cycle time.
© 2009 Elsevier Ltd. All rights reserved.
1. Introduction
Efficient gas separation processes operating at high throughputare compromised when adsorbent materials in the form of beadsor granules are used. High pressure drop associated with gas flowthrough a packed bed of beads/pellets and mass transfer limitationsrelated to gas diffusion into or out of the beads rapidly reduce sys-tem performance. To address these drawbacks, different adsorbentstructures may be considered.
Recently, various structured adsorbents with enhanced ad-sorption characteristics such as monolithic, laminate and foamstructures have gained considerable attention as substitutes fortraditional adsorbent particles (Kodama et al., 1993; Maurer, 1994;Gadkaree, 1997; Li et al., 1998; Golden et al., 2003; Brandani et al.,2004; Keefer et al., 2004; Sawad et al., 2005; Golden et al., 2005;Zabka et al., 2006; Grande et al., 2006; Rode et al., 2007).
Parallel channel monolithic structures with controllable shape,cell density and wall thickness have been reported for their use inadsorptive gas separation systems (Kodama et al., 1993; Gadkaree,1997; Li et al., 1998; Lee et al., 2000; Yu et al., 2002; Yates et al.,
∗ Corresponding author. Tel.: +61399053445; fax: +61399055686.
E-mail address: [email protected] (P. Webley).
0009-2509/$ - see front matter © 2009 Elsevier Ltd. All rights reserved.
doi:10.1016/j.ces.2009.08.029
2003). Themain advantage of such configurations resides in their lowpressure drop and higher mass transfer rates. Although it has beenreported that the mass transfer characteristics of monolithic adsor-bents is somewhat inferior to a comparable packed bed, this is morea consequence of early monolithic structures with thick walls ratherthan any intrinsic limitation. It would be possible to improve themass transfer behaviour of monoliths by utilizing structures with re-duced channel width and wall thickness or more appropriate shape.Patton et al. (2004) suggests the employment of hexagonal chan-nels rather than ordinary square or circular channels. These authorsapplied the linear driving force model (LDF) to optimize practicalmonolith channels taking mass transfer and pressure drop character-istics into account. In recent study performed by Zabka et al. (2008),the performances of the separation of chiral species by the simulatedmoving bed (SMB) unit packed with conventional adsorbent beadsand monolithic adsorbents were compared. The authors concludedthat the selection of particle diameter or different bed morphologiesis a trade-off between the productivity and eluent consumption.
The use of parallel laminate structures for adsorption processesis rather new with a few patents describing the use of adsorbentmaterials in the form of laminate sheets in adsorptive gas separa-tion applications. Rode et al., 2007 demonstrated the application ofimproved adsorbent sheet based parallel passage structures for PSA,TSA and partial PSA devices. In order for laminates to be effective
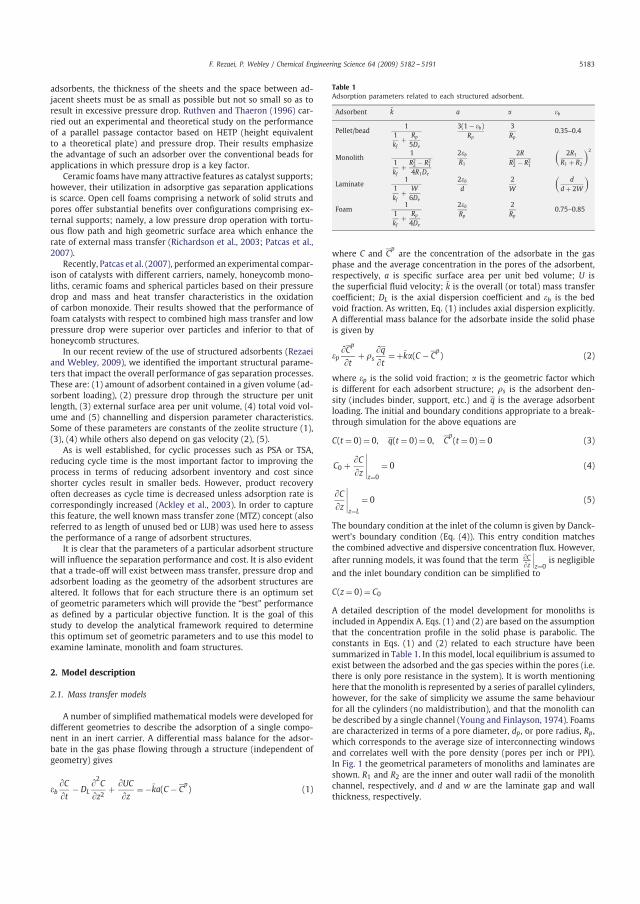
F. Rezaei, P. Webley / Chemical Engineering Science 64 (2009) 5182 -- 5191 5183
adsorbents, the thickness of the sheets and the space between ad-jacent sheets must be as small as possible but not so small so as toresult in excessive pressure drop. Ruthven and Thaeron (1996) car-ried out an experimental and theoretical study on the performanceof a parallel passage contactor based on HETP (height equivalentto a theoretical plate) and pressure drop. Their results emphasizethe advantage of such an adsorber over the conventional beads forapplications in which pressure drop is a key factor.
Ceramic foams havemany attractive features as catalyst supports;however, their utilization in adsorptive gas separation applicationsis scarce. Open cell foams comprising a network of solid struts andpores offer substantial benefits over configurations comprising ex-ternal supports; namely, a low pressure drop operation with tortu-ous flow path and high geometric surface area which enhance therate of external mass transfer (Richardson et al., 2003; Patcas et al.,2007).
Recently, Patcas et al. (2007), performed an experimental compar-ison of catalysts with different carriers, namely, honeycomb mono-liths, ceramic foams and spherical particles based on their pressuredrop and mass and heat transfer characteristics in the oxidationof carbon monoxide. Their results showed that the performance offoam catalysts with respect to combined high mass transfer and lowpressure drop were superior over particles and inferior to that ofhoneycomb structures.
In our recent review of the use of structured adsorbents (Rezaeiand Webley, 2009), we identified the important structural parame-ters that impact the overall performance of gas separation processes.These are: (1) amount of adsorbent contained in a given volume (ad-sorbent loading), (2) pressure drop through the structure per unitlength, (3) external surface area per unit volume, (4) total void vol-ume and (5) channelling and dispersion parameter characteristics.Some of these parameters are constants of the zeolite structure (1),(3), (4) while others also depend on gas velocity (2), (5).
As is well established, for cyclic processes such as PSA or TSA,reducing cycle time is the most important factor to improving theprocess in terms of reducing adsorbent inventory and cost sinceshorter cycles result in smaller beds. However, product recoveryoften decreases as cycle time is decreased unless adsorption rate iscorrespondingly increased (Ackley et al., 2003). In order to capturethis feature, the well known mass transfer zone (MTZ) concept (alsoreferred to as length of unused bed or LUB) was used here to assessthe performance of a range of adsorbent structures.
It is clear that the parameters of a particular adsorbent structurewill influence the separation performance and cost. It is also evidentthat a trade-off will exist between mass transfer, pressure drop andadsorbent loading as the geometry of the adsorbent structures arealtered. It follows that for each structure there is an optimum setof geometric parameters which will provide the “best” performanceas defined by a particular objective function. It is the goal of thisstudy to develop the analytical framework required to determinethis optimum set of geometric parameters and to use this model toexamine laminate, monolith and foam structures.
2. Model description
2.1. Mass transfer models
A number of simplified mathematical models were developed fordifferent geometries to describe the adsorption of a single compo-nent in an inert carrier. A differential mass balance for the adsor-bate in the gas phase flowing through a structure (independent ofgeometry) gives
�b�C�t
− DL�2
C
�z2+ �UC
�z= −ka(C − C
p) (1)
Table 1
Adsorption parameters related to each structured adsorbent.
Adsorbent k a � �b
Pellet/bead1
1
kf+ Rp
5De
3(1 − �b)Rp
3
Rp0.35–0.4
Monolith1
1
kf+ R2
2 − R21
4R1De
2�bR1
2R
R22 − R2
1
(2R1
R1 + R2
)2
Laminate1
1
kf+ W
6De
2�bd
2
W
(d
d + 2W
)
Foam1
1
kf+ Rp
4De
2�bRp
2
Rp0.75–0.85
where C and Cpare the concentration of the adsorbate in the gas
phase and the average concentration in the pores of the adsorbent,respectively, a is specific surface area per unit bed volume; U isthe superficial fluid velocity; k is the overall (or total) mass transfercoefficient; DL is the axial dispersion coefficient and �b is the bedvoid fraction. As written, Eq. (1) includes axial dispersion explicitly.A differential mass balance for the adsorbate inside the solid phaseis given by
�p�Cp
�t+ �s
�q�t
= +k�(C − Cp) (2)
where �p is the solid void fraction; � is the geometric factor whichis different for each adsorbent structure; �s is the adsorbent den-sity (includes binder, support, etc.) and q is the average adsorbentloading. The initial and boundary conditions appropriate to a break-through simulation for the above equations are
C(t = 0) = 0, q(t = 0) = 0, Cp(t = 0) = 0 (3)
C0 + �C�z
∣∣∣∣∣z=0
= 0 (4)
�C�z
∣∣∣∣∣z=L
= 0 (5)
The boundary condition at the inlet of the column is given by Danck-wert's boundary condition (Eq. (4)). This entry condition matchesthe combined advective and dispersive concentration flux. However,
after running models, it was found that the term �C�z
∣∣∣z=0
is negligible
and the inlet boundary condition can be simplified to
C(z = 0) = C0
A detailed description of the model development for monoliths isincluded in Appendix A. Eqs. (1) and (2) are based on the assumptionthat the concentration profile in the solid phase is parabolic. Theconstants in Eqs. (1) and (2) related to each structure have beensummarized in Table 1. In this model, local equilibrium is assumed toexist between the adsorbed and the gas species within the pores (i.e.there is only pore resistance in the system). It is worth mentioninghere that the monolith is represented by a series of parallel cylinders,however, for the sake of simplicity we assume the same behaviourfor all the cylinders (no maldistribution), and that the monolith canbe described by a single channel (Young and Finlayson, 1974). Foamsare characterized in terms of a pore diameter, dp, or pore radius, Rp,which corresponds to the average size of interconnecting windowsand correlates well with the pore density (pores per inch or PPI).In Fig. 1 the geometrical parameters of monoliths and laminates areshown. R1 and R2 are the inner and outer wall radii of the monolithchannel, respectively, and d and w are the laminate gap and wallthickness, respectively.

5184 F. Rezaei, P. Webley / Chemical Engineering Science 64 (2009) 5182 -- 5191
R1
R2U0
δz
U0
w
d
Fig. 1. Structured adsorbents: (a) monolith and (b) laminate.
The total mass transfer coefficient can be represented as follows:
1
k= 1
kf+ 1
kp(6)
where kf and kp are film and pore mass transfer coefficients, respec-tively. The pore mass transfer coefficient, kp, for pellets, monoliths,foam and laminate structures are
(kp)pellets = 5De
R(7)
(kp)monoliths = 4DeR1
R22 − R21(8)
(kp)foams = 4De
R(9)
(kp)laminates = 6De
w(10)
where De is the effective diffusivity which is taken to be identicalfor different structures, since we assume here that the intrinsic porestructure of the adsorbent is the same. This latter constraint is notrequired but was adopted here for simplicity in the comparison ofstructures. Indeed, some advantages of novel adsorbent structuresmay well be that superior De can be achieved by engineering thepore structure into the adsorbent structure. The solid adsorbent isassumed to have the same properties in all adsorbent structures.
The appropriate dimensionless group characterising film diffu-sion is the Sherwood number, Sh. For pelleted systems the Wakaoand Funazkri (1978) equation was used to estimate kf
Sh = 2 + 1.1Re0.6Sc0.33 (11)
For monolithic and laminate structures, Hawthorn (1974) equationfor laminar flow was employed
Sh = dkfDm
= A
(1 + 0.139Re Sc
d
L
)0.81
(12)
where the parameter A is 3.6 for circular channels, 2.35 for triangu-lar channels and 2.95 for square channels. Dm and L are moleculardiffusion coefficients and column length, respectively.
A generalized correlation proposed by Groppi et al. (2007) wasemployed to describe the external film mass transfer coefficient infoam structures
Sh = 0.91Re0.43Sc0.33 (13)
Table 2
Film and pore mass transfer expressions for structured adsorbents.
Adsorbent kf expression kp expression
Pellet/bead Sh = 2+1.1Re0.6 Sc0.33 kp = 5De
R
Monolith Sh = 2.696
[1 + 0.139
(2R1
L
)Re Sc
]0.81
kp = 4DeR1
R22 − R2
1
Laminate Sh = 2.696
[1 + 0.139
(d
L
)Re Sc
]0.81
kp = 6De
w
Foam Sh = 0.91Re0.43 Sc0.33 kp = 4De
R
subject to the constraint
15<Re<200
A summary of kf and kp expressions related to each configuration ispresented in Table 2.
Since axial dispersion acts to disperse the breakthrough frontin an adsorbent system, it is important to include its effect. Axialdispersion in a packed bed is correlated in terms of the Peclet number(Pe = Ud/DL), and can be obtained from
�bDL
Dm= 20 + 0.5Re Sc (14)
where Dm is the molecular diffusion coefficient. The same expressionwas used for foam structures. In laminar flow, axial dispersion inmonolithic structures can be calculated from Taylor (1954) analysis
DL = Dm + 1
192
U2(2R1)2
Dm(15)
For laminates, a similar approach holds as with monoliths.The inclusion of axial dispersion can be done either through the
term DL�2C/�z2 or, since its effect is to disperse the mass transfer
front, it can be represented through the mass transfer coefficient,k. In our numerical study presented later, it was included explicitly
through the term DL�2C/�z2. However, for linear adsorption isotherm
models, the contribution of dispersion can alternatively be estimatedby adding the term DL/U
2 to the mass transfer coefficient of theadsorbent (Ruthven, 1984), thus the overall rate constant is
(1
k
)overall
=(1
k
)mass_transfer
+ DL
U2(16)
Estimation of mass transfer rate constant, kmass_transfer is performedby assuming a parabolic concentration profile in the adsorbent ma-terial (as discussed earlier and derived in the appendix) and a lineardriving force based on a gas concentration driving force model. Themass transfer coefficient kmass_transfer for different structures is
Pellets :
(1
k
)mass_transfer
= �b1 − �b
(Rp3kf
+ R2p15De
)(17)
Monolith :
(1
k
)mass_transfer
= R12kf
+ R22 − R218De
(18)
Laminate :
(1
k
)mass_transfer
= d
2kf+ Wd
6De(19)
Foam :
(1
k
)mass_transfer
= Rp2kf
+ R2p8De
(20)

F. Rezaei, P. Webley / Chemical Engineering Science 64 (2009) 5182 -- 5191 5185
2.2. Pressure drop
The pressure drop of the adsorbent structures was calculatedusing well known equations for each case. For pellets, the Ergun(1952) equation was used
�P
L= 150
(1 − �)2
�3�d2p
U + 1.75(1 − �)
�3�dp
U2 (21)
where, � and � are density and viscosity of the flowing gas. Formonolithic and laminate structures, the Hagen–Poiseuille equation(Cybulski and Moulijn, 1998) was applied
�P
L= 32�
d2p�bU (22)
Although the Ergun equation has often been used to describe thepressure drop of open-cell foams, in this work the pressure drop inthe foam adsorbents was calculated from equations recently pro-posed by Richardson et al. (2000) in which the authors, based onthe work of Gibson and Ashby (1997) considered that the cellularmedium is formed by uniform tri-dimensional cells.
�P
L= �1s
2(1 − �)2
�3�U + �2s(1 − �)
�3�U2 (23)
where �1 and �2 and s can be calculated using following expressions:
�1 = 973d0.743p (1 − �)−0.0982 (24)
�2 = 368d−0.7523p (1 − �)0.07158 (25)
s = 12.979[1 − 0.971(1 − �)0.5]
dp(1 − �)0.5(26)
2.3. Characterisation and calculation of the mass transfer zone (MTZ)
Adsorbent systems with non-linear and favourable isotherms ex-hibit constant pattern behaviour during adsorption (Sircar et al.,1983). By employing such constant pattern conditions, it is possibleto evaluate the mass transfer zone characteristics of the system. Inthis work, the MTZ is created by dispersion resulting from all of thedispersive forces in the system as encapsulated by the overall (total)rate constant k. The width of the mass transfer zone is the productof the zone velocity and the extent of spreading
MTZ = �(t2 − t1) (27)
where t2 and t1 are the two times of breakthrough (5% and 95% ofthe outlet concentration). The zone velocity, �, can be obtained froma simple rearrangement of the governing equations. If we add thebalance equations for the solid and gas phases, we obtain the singleequation
�b�C�t
+ �UCi�z
+(a
�
)�s
�q�t
= 0 (28)
This balance equation is obtained based on these assumptions thatthe accumulation in the particle pores is neglected and axial disper-sion term is also neglected. Assuming constant velocity, the velocityof the mass transfer zone, � is therefore approximately by
� = U
�b +(a
�
)�s
qfeedcfeed
(29)
The isotherm slope therefore appears in the expression for the MTZ,as expected. The difference in breakthrough time t1 and t2 can be de-rived from constant pattern analyses as shown by Sircar et al. (1983)
and it follows that t2−t1 is inversely proportional to the overall rateconstant, k, for constant pattern conditions. Thus (t2 − t1) ∝ 1/(�k).Combining these equations gives proportionality for the mass trans-fer zone
MTZ ∝ U
��bk + ak�s(qfeed/cfeed)(30)
This equation is simple enough to be implemented in a spreadsheetand shows the major dependency of the MTZ on superficial velocity,U, and rate constant as well as geometric factors a and �. It should benoted that linear systems do not show constant pattern behaviour inthe presence of dispersive phenomena such as mass transfer resis-tance and axial dispersion although qualitatively Eq. (30) will indi-cate the expected trends. Although (30) is useful to provide a relativeassessment of the impact of variables on MTZ (and is used later toderive a heuristic model), it is possible and desirable to read off thelength of the mass transfer directly from the numerical simulationsin the z-domain. This was done as described below.
2.4. Numerical solution of the conservation equations and basis forsimulation
Simulations of the numerical models for different adsorbentgeometries were performed using COMSOL 3.5a. The conservationequations were solved using the Lagrange quadratic finite elementmethod, with a total number of 2424 elements. To confirm thatnumerical dispersion was not affecting the results, the simulationswere routinely tested with more elements (double) with no changein results. The simulations of breakthrough curves in each case donot take more than 20 s. The physical characteristics of structuresconsidered for comparison are presented in Table 3. A cylindricalbed size of 2 cm diameter and 30 cm length was chosen arbitrarily.The adsorbent voidage in each case was taken to be the same (0.6)and the amount of binder was taken to be the same (10% by weight).The density of the foam, monolith wall and laminate sheet was takento be the same as a pellet density. This may not be true of an actuallaminate or monolith especially if a support structure is needed.For the sake of comparison, there should be the same amount ofadsorbent mass per unit volume of bed for all configurations, whileas can be seen from Table 3, the adsorbent mass is different for allgeometries. Therefore, in order to compensate the lower amount ofactive adsorbent in laminates, foams and monolithic configurations,and ensure the same stoichiometric breakthrough time (to allowcomparison of breakthrough fronts), the superficial velocity wasadjusted for each adsorbent structure.
The gas system used for calculations was 10% CO2 in N2 and theadsorbent was taken to be NaX. The equilibrium data for CO2 onNaX at 298.15K were taken from Hyun and Danner (1982). Althoughthe actual isotherm is non-linear, the simulation we performed wasbased on a linear isotherm with the equilibrium constant, K, takenfrom the CO2 adsorption isotherm at lower pressures (up to 10kPa).A linear constant of 41gmol/kgkPa was used. It was also assumedthat the functionality of the effective diffusion coefficient, De, can beevaluated from the equivalent molecular diffusion coefficient scaledby a voidage–tortuosity term in the molecular diffusion regime inwhich macropore diffusion is rate-limiting step.
3. Results and discussion
3.1. External surface area comparison
One of the most important parameters which govern the perfor-mance of an adsorbent is its external surface area per unit volume,since the mass transfer rate is directly proportional to this param-eter. In Fig. 2, the comparison between the external surface areas

5186 F. Rezaei, P. Webley / Chemical Engineering Science 64 (2009) 5182 -- 5191
Table 3
Physical properties of structures used in the computations.
Structure Bed
voidage
Adsorbent
mass (g)
Bed density
(g/cm3)
Specific surface
area (cm2/cm3)
Adsorbent
width (mm)
Cell size
(mm)
Total
voidage
Superficial
velocity (m/s)
0.7mm pellet 0.37 64.69 0.686 54.0 0.35 – 0.75 1
Monolith, 200 cpsi 0.65 35.93 0.381 18.0 0.35 1.45 0.86 0.444
Monolith, 400 cpsi 0.65 35.93 0.381 25.4 0.25 1.02 0.86 0.444
Monolith, 600 cpsi 0.65 35.93 0.381 31.1 0.20 0.84 0.86 0.444
Laminate, 0.5mm×0.5mm 0.50 51.30 0.544 20.0 0.50 0.50 0.80 0.6344
Laminate, 0.3mm×0.3mm 0.50 51.30 0.544 33.3 0.30 0.30 0.80 0.6344
Laminate, 0.2mm×0.2mm 0.50 51.30 0.544 50.0 0.20 0.20 0.80 0.6344
Laminate, 0.1mm×0.1mm 0.50 51.30 0.544 100.0 0.10 0.10 0.80 0.6344
Foam, 20PPI 0.80 20.54 0.218 19.75 0.81 – 0.804 0.318
Foam, 30PPI 0.80 20.54 0.218 26.66 0.60 – 0.816 0.318
Foam, 45PPI 0.80 20.54 0.218 37.20 0.43 – 0.813 0.318
600.7mm pellets
Monoliths
40
50
45 PPI foam
20
30
10
exte
rnal
sur
face
are
a, c
m-1
00
Cells/in2200 400 600 800 1000 1200
εb = 0.7
εb = 0.37εb = 0.5
Fig. 2. Comparison of external surface areas for pellet, foam and several monoliths.
per unit volume of 1mm bead diameter, 45PPI foam and differentvoidage monolithic structures is shown. It is clear that small beadedpacked beds and foam adsorbents have very high external surfacearea which is difficult to match with monolithic structures.
For comparison, a 45PPI foam and 0.7mm pellet diameter packedbed have an external area of 37 and 54 cm2/cm3, respectively. Mono-liths can only match the external surface area by using very high celldensities and high voidages. Unfortunately, high voidage compro-mises system performance and reduces overall density which morethan offsets the gain in external surface area. Practical cell densitiesof 400 cpsi and voidages of 0.5 will give about 22 cm2/cm3, a littleover half of the surface area of a 1mm packed bed. To compensatethe smaller surface area of monolithic adsorbents, a thin layer of ac-tive film with desirable voidage may be grown on the wall surface.The presence of such a film does not obstruct the gas flow throughthe channel (due to the small thickness in the range of several mi-crons) while it could enhance the cell density of the active adsorbent.
Fig. 3 shows that the surface area per unit volume of laminatesystems compares favourably with packed beds for small laminatespacings and wall thickness. However, practical difficulties associ-ated with maintaining small spacing may complicate deployment ofthese systems. Furthermore, lower adsorbent loading associatedwiththinner walls will result in insufficient overall adsorbent density.
3.2. Comparison of mass transfer characteristics
The typical mass transfer characteristics of adsorbent struc-tures were calculated using equations presented in Section 2.1 and
300e = 0.37
200
250 e = 0.5e = 0.7
100
150
50
exte
rnal
sur
face
are
a, c
m-1
0.7mm pellets
00 0.2 0.4 0.6 0.8 1
spacing, mm
Fig. 3. Comparison of external surface areas for packed bed and several laminates
with varying voidages.
the values at a constant superficial velocity of 1m/s are given inTable 4. It is clear from this table that although kinetic propertiesof beads are somewhat superior to other structures, increasingcell density in monolithic adsorbents, decreasing the spacing be-tween adjacent sheets in laminate configurations or choosing foamswith higher number of pore per inch (PPI), can give proportionallyimproved performance.
Laminate structures can exhibit significantly better performancethan a packed bed (> 50%) but only if the critical sheet thick-ness and spacing is less than about 0.2mm. As stated earlier, thepractical difficulties involved in reproducibly making such struc-tures are not trivial. The tolerances must be quite tight (< 5%) inthe channels to avoid maldistribution. This requires that the spac-ing must be maintained to within < 0.01mm. Typically, the masstransfer coefficient of foams would increase by increasing the porecount at constant hydrodynamic conditions due to enhanced sur-face area available for adsorption. The axial dispersion coefficientof foams is much smaller than dispersion resulting from pore diffu-sion coefficients and could be justifiably neglected. For example, for30PPI foam with characteristic diameter of 0.695mm, DL/U
2 is about6.4×10−4.
The influence of monolith external voidage on performance issubtle. At high voidages (> 0.7), cell walls are thin, high external sur-face area per unit volume is obtained leading to good mass transfer,however, bed densities are low. These effects counteract each other.The opposite situation occurs at low voidage. The optimal voidage
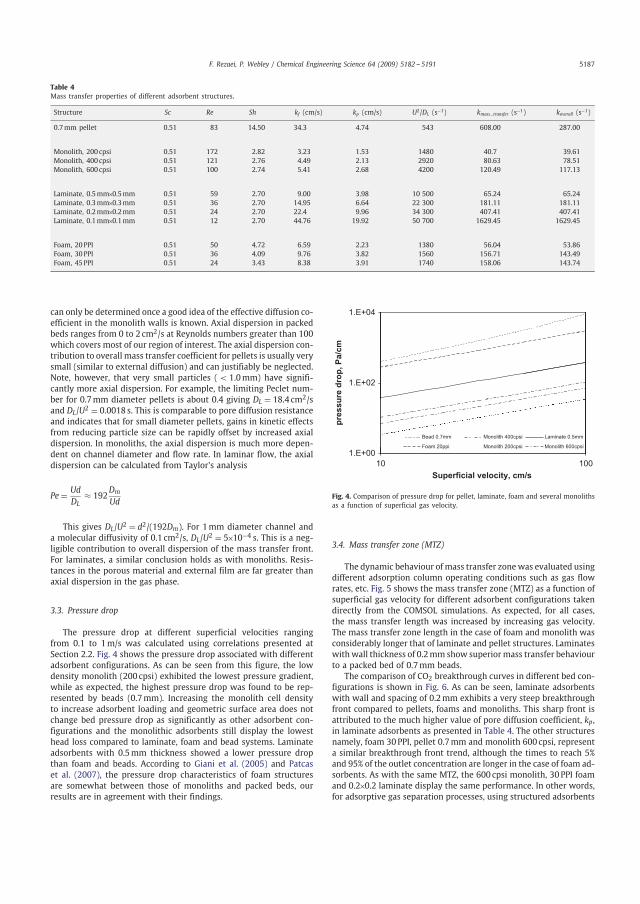
F. Rezaei, P. Webley / Chemical Engineering Science 64 (2009) 5182 -- 5191 5187
Table 4
Mass transfer properties of different adsorbent structures.
Structure Sc Re Sh kf (cm/s) kp (cm/s) U2/DL (s−1) kmass_ transfer (s−1) koverall (s−1)
0.7mm pellet 0.51 83 14.50 34.3 4.74 543 608.00 287.00
Monolith, 200 cpsi 0.51 172 2.82 3.23 1.53 1480 40.7 39.61
Monolith, 400 cpsi 0.51 121 2.76 4.49 2.13 2920 80.63 78.51
Monolith, 600 cpsi 0.51 100 2.74 5.41 2.68 4200 120.49 117.13
Laminate, 0.5mm×0.5mm 0.51 59 2.70 9.00 3.98 10 500 65.24 65.24
Laminate, 0.3mm×0.3mm 0.51 36 2.70 14.95 6.64 22 300 181.11 181.11
Laminate, 0.2mm×0.2mm 0.51 24 2.70 22.4 9.96 34 300 407.41 407.41
Laminate, 0.1mm×0.1mm 0.51 12 2.70 44.76 19.92 50 700 1629.45 1629.45
Foam, 20PPI 0.51 50 4.72 6.59 2.23 1380 56.04 53.86
Foam, 30PPI 0.51 36 4.09 9.76 3.82 1560 156.71 143.49
Foam, 45PPI 0.51 24 3.43 8.38 3.91 1740 158.06 143.74
can only be determined once a good idea of the effective diffusion co-efficient in the monolith walls is known. Axial dispersion in packedbeds ranges from 0 to 2 cm2/s at Reynolds numbers greater than 100which covers most of our region of interest. The axial dispersion con-tribution to overall mass transfer coefficient for pellets is usually verysmall (similar to external diffusion) and can justifiably be neglected.Note, however, that very small particles (< 1.0mm) have signifi-cantly more axial dispersion. For example, the limiting Peclet num-ber for 0.7mm diameter pellets is about 0.4 giving DL = 18.4 cm2/sand DL/U
2 = 0.0018 s. This is comparable to pore diffusion resistanceand indicates that for small diameter pellets, gains in kinetic effectsfrom reducing particle size can be rapidly offset by increased axialdispersion. In monoliths, the axial dispersion is much more depen-dent on channel diameter and flow rate. In laminar flow, the axialdispersion can be calculated from Taylor's analysis
Pe = Ud
DL≈ 192
Dm
Ud
This gives DL/U2 = d2/(192Dm). For 1mm diameter channel and
a molecular diffusivity of 0.1 cm2/s, DL/U2 = 5×10⁻⁴ s. This is a neg-
ligible contribution to overall dispersion of the mass transfer front.For laminates, a similar conclusion holds as with monoliths. Resis-tances in the porous material and external film are far greater thanaxial dispersion in the gas phase.
3.3. Pressure drop
The pressure drop at different superficial velocities rangingfrom 0.1 to 1m/s was calculated using correlations presented atSection 2.2. Fig. 4 shows the pressure drop associated with differentadsorbent configurations. As can be seen from this figure, the lowdensity monolith (200 cpsi) exhibited the lowest pressure gradient,while as expected, the highest pressure drop was found to be rep-resented by beads (0.7mm). Increasing the monolith cell densityto increase adsorbent loading and geometric surface area does notchange bed pressure drop as significantly as other adsorbent con-figurations and the monolithic adsorbents still display the lowesthead loss compared to laminate, foam and bead systems. Laminateadsorbents with 0.5mm thickness showed a lower pressure dropthan foam and beads. According to Giani et al. (2005) and Patcaset al. (2007), the pressure drop characteristics of foam structuresare somewhat between those of monoliths and packed beds, ourresults are in agreement with their findings.
1.E+04
1.E+02
1.E+0010 100
Bead 0.7mm Monolith 400cpsi Laminate 0.5mm
Foam 20ppi Monolith 200cpsi Monolith 600cpsi
Superficial velocity, cm/s
pres
sure
dro
p, P
a/cm
Fig. 4. Comparison of pressure drop for pellet, laminate, foam and several monoliths
as a function of superficial gas velocity.
3.4. Mass transfer zone (MTZ)
The dynamic behaviour ofmass transfer zonewas evaluated usingdifferent adsorption column operating conditions such as gas flowrates, etc. Fig. 5 shows the mass transfer zone (MTZ) as a function ofsuperficial gas velocity for different adsorbent configurations takendirectly from the COMSOL simulations. As expected, for all cases,the mass transfer length was increased by increasing gas velocity.The mass transfer zone length in the case of foam and monolith wasconsiderably longer that of laminate and pellet structures. Laminateswithwall thickness of 0.2mm show superiormass transfer behaviourto a packed bed of 0.7mm beads.
The comparison of CO2 breakthrough curves in different bed con-figurations is shown in Fig. 6. As can be seen, laminate adsorbentswith wall and spacing of 0.2mm exhibits a very steep breakthroughfront compared to pellets, foams and monoliths. This sharp front isattributed to the much higher value of pore diffusion coefficient, kp,in laminate adsorbents as presented in Table 4. The other structuresnamely, foam 30PPI, pellet 0.7mm and monolith 600 cpsi, representa similar breakthrough front trend, although the times to reach 5%and 95% of the outlet concentration are longer in the case of foam ad-sorbents. As with the same MTZ, the 600 cpsi monolith, 30PPI foamand 0.2×0.2 laminate display the same performance. In other words,for adsorptive gas separation processes, using structured adsorbents
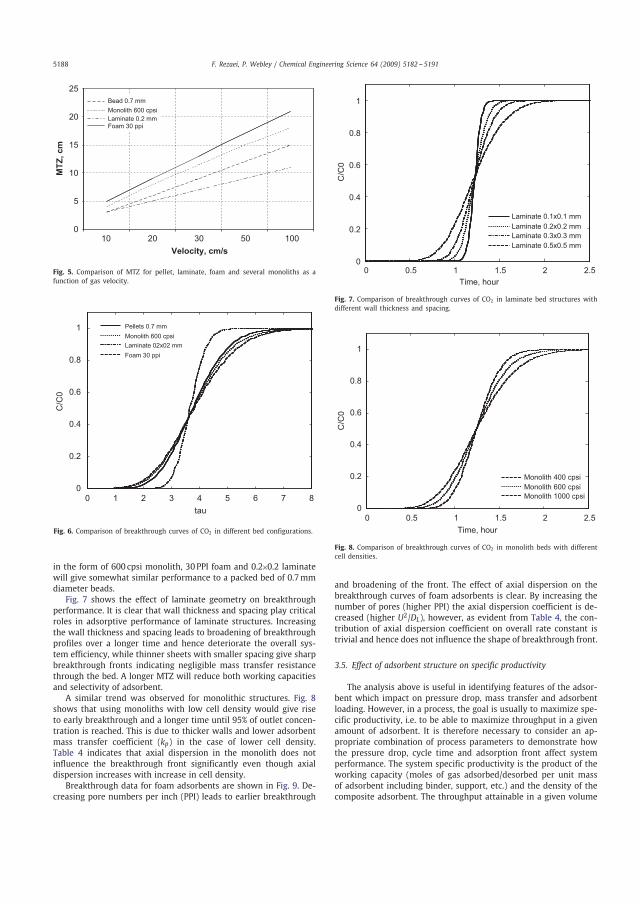
5188 F. Rezaei, P. Webley / Chemical Engineering Science 64 (2009) 5182 -- 5191
25Bead 0.7 mmMonolith 600 cpsi
20 Laminate 0.2 mmFoam 30 ppi
10
15
MTZ
, cm
5
010 20 30 50 100
Velocity, cm/s
Fig. 5. Comparison of MTZ for pellet, laminate, foam and several monoliths as a
function of gas velocity.
1 Pellets 0.7 mmMonolith 600 cpsiLaminate 02x02 mm
0.8
.Foam 30 ppi
0.6
C/C
0
0.4
0
0.2
0 1 2 3 4 5 6 7 8tau
Fig. 6. Comparison of breakthrough curves of CO2 in different bed configurations.
in the form of 600 cpsi monolith, 30PPI foam and 0.2×0.2 laminatewill give somewhat similar performance to a packed bed of 0.7mmdiameter beads.
Fig. 7 shows the effect of laminate geometry on breakthroughperformance. It is clear that wall thickness and spacing play criticalroles in adsorptive performance of laminate structures. Increasingthe wall thickness and spacing leads to broadening of breakthroughprofiles over a longer time and hence deteriorate the overall sys-tem efficiency, while thinner sheets with smaller spacing give sharpbreakthrough fronts indicating negligible mass transfer resistancethrough the bed. A longer MTZ will reduce both working capacitiesand selectivity of adsorbent.
A similar trend was observed for monolithic structures. Fig. 8shows that using monoliths with low cell density would give riseto early breakthrough and a longer time until 95% of outlet concen-tration is reached. This is due to thicker walls and lower adsorbentmass transfer coefficient (kp) in the case of lower cell density.Table 4 indicates that axial dispersion in the monolith does notinfluence the breakthrough front significantly even though axialdispersion increases with increase in cell density.
Breakthrough data for foam adsorbents are shown in Fig. 9. De-creasing pore numbers per inch (PPI) leads to earlier breakthrough
1
0.8
0.6
0.4
C/C
0
0.2 Laminate 0.2x0.2 mmLaminate 0.3x0.3 mmLaminate 0.5x0.5 mm
0 0.5 1 1.5 2 2.50
Time, hour
Laminate 0.1x0.1 mm
Fig. 7. Comparison of breakthrough curves of CO2 in laminate bed structures with
different wall thickness and spacing.
1
0.8
0.6
0.4
0.2 Monolith 400 cpsiMonolith 600 cpsiMonolith 1000 cpsi
0 0.5 1 1.5 2 2.50
Time, hour
C/C
0
Fig. 8. Comparison of breakthrough curves of CO2 in monolith beds with different
cell densities.
and broadening of the front. The effect of axial dispersion on thebreakthrough curves of foam adsorbents is clear. By increasing thenumber of pores (higher PPI) the axial dispersion coefficient is de-creased (higher U2/DL), however, as evident from Table 4, the con-tribution of axial dispersion coefficient on overall rate constant istrivial and hence does not influence the shape of breakthrough front.
3.5. Effect of adsorbent structure on specific productivity
The analysis above is useful in identifying features of the adsor-bent which impact on pressure drop, mass transfer and adsorbentloading. However, in a process, the goal is usually to maximize spe-cific productivity, i.e. to be able to maximize throughput in a givenamount of adsorbent. It is therefore necessary to consider an ap-propriate combination of process parameters to demonstrate howthe pressure drop, cycle time and adsorption front affect systemperformance. The system specific productivity is the product of theworking capacity (moles of gas adsorbed/desorbed per unit massof adsorbent including binder, support, etc.) and the density of thecomposite adsorbent. The throughput attainable in a given volume
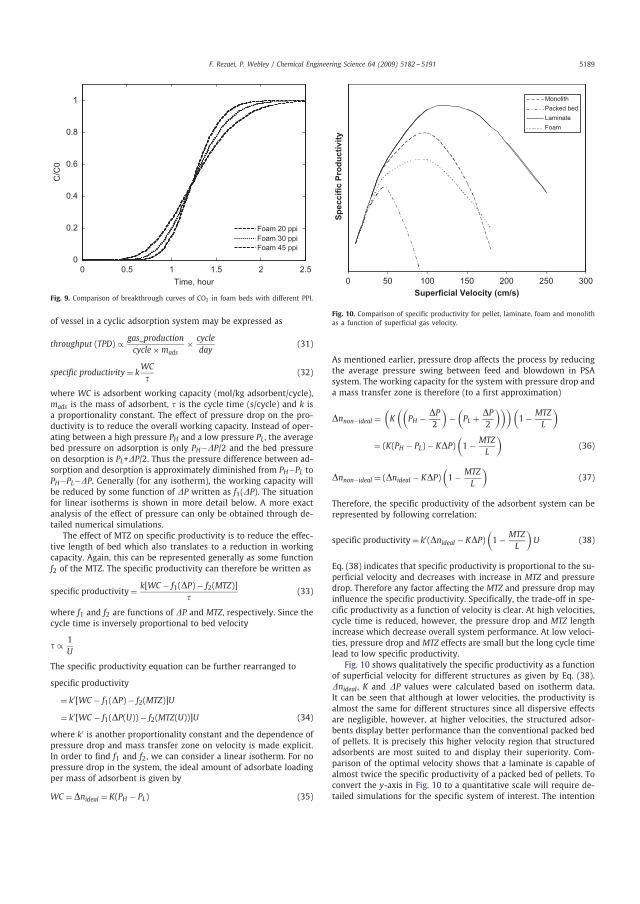
F. Rezaei, P. Webley / Chemical Engineering Science 64 (2009) 5182 -- 5191 5189
1
0.8
0.6
0.4
0.2 Foam 20 ppiFoam 30 ppiFoam 45 ppi
0 0.5 1 1.5 2 2.50
Time, hour
C/C
0
Fig. 9. Comparison of breakthrough curves of CO2 in foam beds with different PPI.
of vessel in a cyclic adsorption system may be expressed as
throughput (TPD) ∝ gas_production
cycle × mads× cycle
day(31)
specific productivity = kWC
�(32)
where WC is adsorbent working capacity (mol/kg adsorbent/cycle),mads is the mass of adsorbent, � is the cycle time (s/cycle) and k isa proportionality constant. The effect of pressure drop on the pro-ductivity is to reduce the overall working capacity. Instead of oper-ating between a high pressure PH and a low pressure PL, the averagebed pressure on adsorption is only PH−�P/2 and the bed pressureon desorption is PL+�P/2. Thus the pressure difference between ad-sorption and desorption is approximately diminished from PH−PL toPH−PL−�P. Generally (for any isotherm), the working capacity willbe reduced by some function of �P written as f1(�P). The situationfor linear isotherms is shown in more detail below. A more exactanalysis of the effect of pressure can only be obtained through de-tailed numerical simulations.
The effect of MTZ on specific productivity is to reduce the effec-tive length of bed which also translates to a reduction in workingcapacity. Again, this can be represented generally as some functionf2 of the MTZ. The specific productivity can therefore be written as
specific productivity = k[WC − f1(�P) − f2(MTZ)]
�(33)
where f1 and f2 are functions of �P and MTZ, respectively. Since thecycle time is inversely proportional to bed velocity
� ∝ 1
U
The specific productivity equation can be further rearranged to
specific productivity
= k′[WC − f1(�P) − f2(MTZ)]U
= k′[WC − f1(�P(U)) − f2(MTZ(U))]U (34)
where k′ is another proportionality constant and the dependence ofpressure drop and mass transfer zone on velocity is made explicit.In order to find f1 and f2, we can consider a linear isotherm. For nopressure drop in the system, the ideal amount of adsorbate loadingper mass of adsorbent is given by
WC = �nideal = K(PH − PL) (35)
Monolith Packed bedLaminateFoam
0Superficial Velocity (cm/s)
Spec
cific
Pro
duct
ivity
50 100 150 200 250 300
Fig. 10. Comparison of specific productivity for pellet, laminate, foam and monolith
as a function of superficial gas velocity.
As mentioned earlier, pressure drop affects the process by reducingthe average pressure swing between feed and blowdown in PSAsystem. The working capacity for the system with pressure drop anda mass transfer zone is therefore (to a first approximation)
�nnon−ideal =(K
((PH − �P
2
)−
(PL + �P
2
))) (1 − MTZ
L
)
= (K(PH − PL) − K�P)
(1 − MTZ
L
)(36)
�nnon−ideal = (�nideal − K�P)
(1 − MTZ
L
)(37)
Therefore, the specific productivity of the adsorbent system can berepresented by following correlation:
specific productivity = k′(�nideal − K�P)
(1 − MTZ
L
)U (38)
Eq. (38) indicates that specific productivity is proportional to the su-perficial velocity and decreases with increase in MTZ and pressuredrop. Therefore any factor affecting the MTZ and pressure drop mayinfluence the specific productivity. Specifically, the trade-off in spe-cific productivity as a function of velocity is clear. At high velocities,cycle time is reduced, however, the pressure drop and MTZ lengthincrease which decrease overall system performance. At low veloci-ties, pressure drop and MTZ effects are small but the long cycle timelead to low specific productivity.
Fig. 10 shows qualitatively the specific productivity as a functionof superficial velocity for different structures as given by Eq. (38).�nideal, K and �P values were calculated based on isotherm data.It can be seen that although at lower velocities, the productivity isalmost the same for different structures since all dispersive effectsare negligible, however, at higher velocities, the structured adsor-bents display better performance than the conventional packed bedof pellets. It is precisely this higher velocity region that structuredadsorbents are most suited to and display their superiority. Com-parison of the optimal velocity shows that a laminate is capable ofalmost twice the specific productivity of a packed bed of pellets. Toconvert the y-axis in Fig. 10 to a quantitative scale will require de-tailed simulations for the specific system of interest. The intention
5190 F. Rezaei, P. Webley / Chemical Engineering Science 64 (2009) 5182 -- 5191
here, however, is to illustrate the qualitative trends expected in per-formance as a function of throughput.
4. Conclusion
In this study, some important features of different adsorbentstructures were derived and their performance compared. Mathe-matical models were developed based on structural and geometricparameters that impact overall system performance such as voidage,external surface area per unit volume and bulk density. Limiting LDFtype expressions were derived for laminates, monoliths and foamstructures. Pressure drop and mass transfer characteristics were in-vestigated. Based on the simulation results, laminate systems wereshown to be potentially very promising structures provided they canbemade with small spacings (< 0.2mm) and sheet widths (0.2mm).Monoliths can be considered as successful candidates if appropriatecell densities (> 1000 cpsi) and voidages are used. The actual val-ues to use depend on the effective diffusivities that can be obtainedfor diffusion in the monolith walls. Low density monoliths are pe-nalized not only by having less mass per unit volume, but also byhaving far less external surface area per unit volume than a packedbed. The overall rate constant is, therefore, diminished considerablycompared to a packed bed. As shown theoretically, the contributionof axial dispersion to overall rate constant was trivial for almost alladsorbent configurations, while the internal rate and external filmcontributions were, respectively, about 75% and 25%. To compensatefor reduced mass, a faster cycle is needed; however, the interstitialvelocity rapidly rises and stretches the mass transfer zone, so that itmay be impossible to match a packed bed performance with a lowdensity monolith. As we progress in monolith development, it willbe important to attempt to lower the voidage and increase the celldensity. Foam structures on the other hand show comparable prop-erties to packed beds.
Finally, we show that the throughput for alternate adsorbentstructures may be substantially higher than a packed bed providedthe structure is operated at its optimal velocity. Increasing beyondthis value leads to an increase in pressure drop and mass transferzone which more than offsets the gains in cycle time reduction.
Notation
a specific surface area per unit bed volume, cm2/cm3
C bulk concentration, gmol/cm3
Cp average solid concentration, gmol/cm3
Cp gas concentration in voids in adsorbent, gmol/cm3
Cs gas concentration at adsorbent surface, gmol/cm3
De effective diffusivity, cm2/sDL axial dispersion coefficient, cm2/sDm molecular diffusion coefficient, cm2/sk equation constant parameter
k total mass transfer coefficient, cm/sk′ equation constant parameterkf film mass transfer coefficients, cm/skp pore mass transfer coefficients, cm/sL column length, cmN molar (radial) flux of component, gmol/cm2 sNs molar flux at adsorbent surface, gmol/cm2 sq average adsorbent loading, gmol/kg adsorbentqp adsorbent loading, gmol/kg zeoliteR1 inner wall radii of monolith channel, cmR1 outer wall radii of monolith channel, cmU superficial fluid velocity, cm/sw wall thickness, cm
Greek letters
� geometry's factor, cm−1
�b bed void fraction�p solid void fraction�s adsorbent density (includes binder, support, etc.), g/cm3
Acknowledgement
The authors would like to acknowledge the Monash ResearchGraduate School (MRGS) for providing scholarship support forFateme Rezaei.
Appendix A. Model for monoliths
A.1. Gas phase equations
Single-component adsorption is considered. The monolith is rep-resented by a series of parallel cylinders. We solve for the break-through in one cylinder only since all the cylinders are the same(assume no maldistribution). A differential mass balance for the ad-sorbate in the gas phase flowing through the bed gives
(�C�t
)z
− DL
�b
�2C
�z2+ 1
�b
�(UC)�z
+ akf�b
(C − Cs) = 0
The specific surface area for the monolith per unit volume can berepresented as
a = 2
R1
A.2. Solid phase equations
A differential mass balance for the adsorbate inside the monolithwall is given by
�p
(�Cp
�t
)r
+ �sw
(�qp
�t
)r
+ 1
r
(�(rN)�r
)t
= 0
The volume-mean concentration is given by
Cp = 1
(R22 − R21)
∫ R2
R1
2Cp dr = 2
R22 − R21
∫ R2
R1
rCp dr
qp = 2
R22 − R21
∫ R2
R1
rqp dr
Considering the boundary condition of �C�r
∣∣∣r=R2
= 0 and substituting
the above equations into the differential equation gives
�p
(�Cp
�t
)+ �sw
(�qp
�t
)+ 2R1
R22 − R21Ns = 0
In this equation, Ns is the flux at R = R1 which is given by
N = kf (C − Cs)
In terms of an overall driving force this can also be written as
Ns = kp(Cs − Cp)
In order to specify Ns, continuity at the pellet surface is considered:
kf (C − Cs) = −De
(�Cp
�r
)R1
F. Rezaei, P. Webley / Chemical Engineering Science 64 (2009) 5182 -- 5191 5191
In this equation, De is the “effective diffusion coefficient” forthe adsorbate in the adsorbent wall. To apply this equation, theconcentration profile within the adsorbent is approximated by aparabola:
Cp = A(t) + B(t)r2
Considering Cp = Cs at r = R1, it follows that(�Cp
�r
)R1
= 4R1
R22 − R21(Cs − C
p)
Finally, the surface flux and concentration can be solved in terms ofC and C
p1 as
N = kf kp
kf + kp(C − C
p)
N = k(C − Cp)
1
k= 1
kf+ 1
kp
Considering kp = 4DeR1/R22 − R21, the overall mass transfer coefficient
is given by
k = 1
1
kf+ R22 − R21
4R1De
Assuming constant velocity and linear isotherm (q = KC), the gas andsolid phase conservation equations can be summarized as
(�C�t
)z
− DL
�b
�2C
�z2+ U
�b
�C�z
+ ak
�b(C − C
p) = 0
(�Cp
�t
)z
= 2�pR1k(C − Cp)
(R22 − R21)(�p + �swK)
References
Ackley, M.W., Smolarek, J., Leavitt, F.W., 2003. Pressure swing adsorption gasseparation method, using adsorbents with high intrinsic diffusivity and lowpressure ratios, United States Patent and Trademark Office Granted US6506234.
Brandani, F., Rouse, A., Brandani, S., Ruthven, D.M., 2004. Adsorption kinetics anddynamic behavior of a carbon monolith. Adsorption 10 (2), 99–109.
Cybulski, A., Moulijn, J.A., 1998. Structured Catalysts and Reactors, p. 1.Ergun, S., 1952. Fluid flow through packed columns. Chemical Engineering Progress
48 (2), 89–94.Gadkaree, K.P., 1997. System and method for adsorbing contaminants and
regenerating the adsorber, United States Patent and Trademark Office GrantedUS5658372.
Giani, L., Groppi, G., Tronconi, E., 2005. Mass-transfer characterization of metallicfoams as supports for structured catalysts. Industrial and Engineering ChemistryResearch 44 (14), 4993–5002.
Gibson, L.J., Ashby, M.F., 1997. Cellular Solids: Structure and Properties. CambridgeUniversity Press, Cambridge.
Golden, T.C., Golden, C.M.A., Zwilling, D.P., 2003. Self-supporting absorbent fabric forgas separation, United States Patent and Trademark Office Granted US6565627.
Grande, C.A., Cavenati, S., Barcia, P., Hammer, J., Fritz, H.G., Rodrigues, A.E., 2006.Adsorption of propane and propylene in zeolite 4A honeycomb monolith.Chemical Engineering Science 61 (10), 3053–3063.
Groppi, G., Giani, L., Tronconi, E., 2007. Generalized correlation for gas/solid mass-transfer coefficients in metallic and ceramic foams. Industrial and EngineeringChemistry Research 46 (12), 3955–3958.
Hawthorn, R.D., 1974. Afterburner catalysts-effects of heat and mass transfer betweengas and catalyst surface. A.I.Ch.E. Symposium 70 (137), 428–438.
Hyun, S.H., Danner, R.P., 1982. Equilibrium adsorption of ethane, ethylene, isobutane,CO2, and their binary mixtures on 13X molecular sieves. Journal of ChemicalEngineering Data 27, 196–200.
Keefer, B.G., Carel, A., Sellars, B., Shaw, I., Larisch B., 2004. Adsorbent laminatestructures, United States Patent and Trademark Office Granted US6692626.
Kodama, A., Goto, M., Hirose, T., Kuma, T., 1993. Experimental study of optimaloperation for a honeycomb adsorber operated with thermal swing. Journal ofChemical Engineering of Japan 26 (5), 530–535.
Lee, L.Y., Perera, S.P., Crittenden, B.D., Kolaczkowski, S.T., 2000. Manufacture andcharacterisation of silicalite monoliths. Adsorption Science and Technology 18(2), 147–170.
Li, Y.Y., Perera, S.P., Crittenden, B.D., 1998. Zeolite monoliths for air separation, part2: Oxygen enrichment, pressure drop and pressurization. Trans, p. 76.
Maurer, R.T., 1994. Spiral-wound adsorber module, United States Patent andTrademark Office Granted US5338450.
Patcas, F.C., Garrido, G.I., Kraushaar-Czarnetzki, B., 2007. CO oxidation over structuredcarriers: a comparison of ceramic foams, honeycombs and beads. ChemicalEngineering Science 62 (15), 3984–3990.
Patton, A., Crittenden, B.D., Perera, S.P., 2004. Use of the linear driving forceapproximation to guide the design of monolithic adsorbents. ChemicalEngineering Research and Design 82 (8), 999–1009.
Rezaei, F., Webley, P.A., 2009. Application of structured adsorbents in gas separationProcesses—a review. Separation Science and Technology, in review.
Richardson, J.T., Peng, Y., Remue, D., 2000. Properties of ceramic foam catalystsupports: pressure drop. Applied Catalysis A: General 204 (1), 19–32.
Richardson, J.T., Remue, D., Hung, J.K., 2003. Properties of ceramic foam catalystsupports: mass and heat transfer. Applied Catalysis A: General 250 (2), 319–329.
Rode, E.J., Boulet, A.J.J., Pelman, A.M., Babicki, M.L., Keefer, B., Sawada, J.A., Alizadeh-Khiavi, S., Roy, S., Gibbs, A.C., Kuznicki, S.M., 2007. Engineered adsorbentstructures for kinetic separation, World Intellectual Property Organization PatentWO200660743432.
Ruthven, D.M., 1984. Principles of Adsorption and Adsorption Processes. Wiley,New York.
Ruthven, D.M., Thaeron, C., 1996. Performance of a parallel passage adsorbentcontactor. Gas Separation and Purification 10 (1), 63–73.
Sawad, J.A., Alizadeh-Khiavi, S., Roy, S., Kuznicki, S.M., 2005. High density adsorbentstructures, United States Patent and Trademark Office Granted WO2005032694.
Sircar, S., Kumar, R., Anselmo, K.J., 1983. Effects of column nonisothermalityor nonadiabaticity on the adsorption breakthrough curves. Industrial andEngineering Chemistry Process Design and Development 22 (1), 10–15.
Taylor, G.I., 1954. Diffusion and mass transport in tubes. Proceedings of the PhysicalSociety Section B 67 (12), 857–869.
Wakao, N., Funazkri, T., 1978. Effect of fluid dispersion coefficients on particle-to-fluid mass transfer coefficients in packed beds: correlation of sherwood numbers.Chemical Engineering Science 33 (10), 1375–1384.
Yates, M., Blanco, J., Martin-Luengo, M.A., Martin, M.P., 2003. Vapour adsorptioncapacity of controlled porosity honeycomb monoliths. Microporous andMesoporous Materials 65 (2–3), 219–231.
Young, L.C., Finlayson, B.A., 1974. Mathematical modeling of the monolith converter.Advances in Chemistry Series (13), 629–643.
Yu, F.D., Luo, L.A., Grevillot, G., 2002. Adsorption isotherms of VOCs onto an activatedcarbon monolith: experimental measurement and correlation with differentmodels. Journal of Chemical and Engineering Data 47 (3), 467–473.
Zabka, M., Minceva, M., Rodrigues, A.E., 2006. Experimental and modeling study ofadsorption in preparative monolithic silica column. Chemical Engineering andProcessing: Process Intensification 45 (2), 150–160.
Zabka, M., Gomes, P.S., Rodrigues, A.E., 2008. Performance of SMB with conventionaland monolith columns. Separation Purification Technology 63 (2), 324–333.

PAPER C
Structured zeolite NaX coatings on ceramic cordierite monolith supports for PSA
applications
Authors:A. Mosca, J. Hedlund, P. A. Webley, M. Grahn, F. Rezaei
Microporous and Mesoporous Materials 130 (2010) 38 - 48
79

80 PAPER C

Structured zeolite NaX coatings on ceramic cordierite monolith supportsfor PSA applications
Alessandra Mosca a,*, Jonas Hedlund a, Paul A. Webley b, Mattias Grahn a, Fateme Rezaei b
aDiv. of Chemical Technology, Luleå University of Technology, SE-97187 Luleå, SwedenbDept. of Chemical Engineering, Monash University, Clayton, VIC 3800, Australia
a r t i c l e i n f o
Article history:Received 3 June 2009Received in revised form 12 October 2009Accepted 13 October 2009Available online 17 October 2009
Keywords:Structured adsorbentsNaX filmMonolithCO2 adsorption
a b s t r a c t
Novel structured adsorbents in the form of thin zeolite films grown on substrates designed for low pres-sure drop have a great potential to improve pressure swing adsorption (PSA) processes. In the presentwork, template free films of NaX zeolite were grown on the walls of ceramic cordierite supports usinga seeding technique. The supports had 400 parallel channels per square inch. Films were grown both froma gel and a clear synthesis solution. The materials were analyzed by scanning electron microscopy, X-raydiffraction, N2 adsorption/desorption measurements, Hg-porosimetry as well as CO2 breakthrough exper-iments. When a gel was used for film growth, a film consisting of well intergrown crystals with a thick-ness of about 1 lm was obtained. However, a large amount of sediments were deposited on top of thefilm, which resulted in a dispersed CO2 adsorption breakthrough front. Zeolite films grown in one longerhydrothermal treatment in a clear solution were less intergrown and consisted of both NaX and hydroxy-sodalite crystals and, in addition, some sediments were deposited on top of the film, which again resultedin a dispersed breakthrough front. By using a multiple-step synthesis procedure and a clear synthesissolution, well intergrown NaX films, free from sediments and with only a very small fraction of hydroxy-sodalite crystals could be prepared. The CO2 breakthrough front for the latter adsorbent was sharper thanthe front for an empty adsorption column and only shifted in time. This indicates that the flow distribu-tion in the adsorbent is even and that the mass transfer resistance in the film is very low due to the smallfilm thickness and high effective diffusivity for CO2 in the NaX film and still, the adsorption capacity isconsiderable. The even flow distribution, very lowmass transfer resistance and low pressure drop in com-bination with considerable adsorption capacity in this adsorbent indicates that it is a promising adsor-bent for PSA applications. The findings from the present work will be important for the developmentof structured adsorbents to use as a competitive alternative to traditionally used adsorbents in PSA.
� 2009 Elsevier Inc. All rights reserved.
1. Introduction
Pressure swing adsorption (PSA) is a commonly used technol-ogy for gas separation which is relying on selective adsorption ofone of the components in a gas mixture at elevated pressure oncertain materials, such as zeolites [1–4]. A typical PSA system in-volves a number of connected columns containing adsorbent mate-rial that undergo successive pressurization and depressurizationsteps in order to produce a continuous stream of purified productgas.
Zeolites are porous crystalline aluminosilicates of SiO4�4 and
AlO5�4 tetrahedra connected by oxygen bridges [5]. Zeolites are
widely used in PSA gas separation processes and are particularlysuitable for oxygen enrichment from air by PSA (low silica zeoliteX) [6,10,54] or H2 recovery from refinery fuel gas or coke oven
gases [38,56], whereas zeolite 5A is used in carbon-zeolite layeredbeds to obtain a high purity (>99.99%) hydrogen stream.
Zeolite NaX is particularly suitable for carbon dioxide capturefrom flue gas or oxygen enrichment from air by PSA [6–10]. CO2
and N2 are adsorbed in the zeolite pores due to the strong quadru-polar interaction between the molecules and the electric field gen-erated by the charge balancing cations in the micropores of thezeolite [5]. The possibility to exchange the cations represents avaluable measure for tuning the volume available for adsorption,as well as the selectivity. Consequently, the adsorption capacityof CO2 in zeolite X increases with decreasing ion size and increas-ing charge density, in the order Cs+, Rb+, K+, Na+, Li+ [11]. Low silicazeolite X in the Li+ form (Li-LSX) exhibits a higher selectivity withrespect to N2 than zeolite NaX, due to the higher polarizing powerof the small Li+ cation, and is therefore the most widely used zeo-lite adsorbent in air separation processes [10,52,53]. The adsorp-tion capacity may also be controlled by tuning the Si/Al ratio ofthe zeolite.
1387-1811/$ - see front matter � 2009 Elsevier Inc. All rights reserved.doi:10.1016/j.micromeso.2009.10.010
* Corresponding author. Tel.: +46 920 491293; fax: +46 920 491199.E-mail address: [email protected] (A. Mosca).
Microporous and Mesoporous Materials 130 (2010) 38–48
Contents lists available at ScienceDirect
Microporous and Mesoporous Materials
journal homepage: www.elsevier .com/locate /micromeso
In PSA processes there is a trade-off between pressure drop andmass- and heat-transfer limitations [12]. The adsorbents in indus-trial PSA processes are usually in the form of beads, pellets orextrudates. Larger adsorbent particles results in lower pressuredrop, but increased mass- and heat-transfer limitation due to thelong mass- and heat-transfer path along the radius of the particlesresulting in a reduced performance of the process [38,51]. Thus, itis of great importance to develop novel structured adsorbents,which may exhibit higher mass transfer coefficients, higherthroughputs, and lower pressure drop, and represent a competitivealternative to adsorbents in form of beads/pellets [13–15,48–51].
High mass transfer coefficients may be achieved by using thinfilms of an adsorbent material grown on structured supports, withthe advantage of having a short diffusion path. Although the adsor-bent loading is often small compared to traditional adsorbents,high throughputs may be achieved by increasing the cycle fre-quency and still maintain a low pressure drop [51]. In this context,monolithic adsorbents are of great interest, and a few reports onthe use of monolith structures in adsorption processes have beenpublished [13–15,51]. Monoliths are structured materials withparallel channels, available with various cell densities and cellshapes. Low pressure drop, uniform flow distribution, thermalstability and unproblematic scale-up are some of the advantageswith these materials [13,15]. The mineral cordierite, 2MgO �2Al2O3 � 5SiO2, is often used as the main material in monoliths.Cordierite monoliths with tailored macrostructure, high porosityand low thermal expansion are used as supports in automotive cat-alytic converters and as diesel particulate filters (DPF) [16,17].Monolith substrates may be wash-coated, dip-coated, slip-coated,slurry-coated or extruded directly into catalytic bodies usingappropriate materials [18,19]. Due to the difficulty in washcoatingthe zeolite, a binder material is needed, which causes a reductionin the accessible surface area of the zeolite coating and increasesthe diffusion resistance of the adsorbing species. Due to surfacetension effects of the washcoat during manufacturing, more mate-rial is deposited at the corners of the monolith channels, conse-quently increasing the diffusion path of the adsorbing species[18]. However, the performance of a zeolite coating is dependenton its morphology. A perfect, smooth film without intercrystallinepores will have other transport properties than a coating com-prised of a multilayer of crystals with intercrystalline porosity.For well defined zeolite films, the mass transfer resistance can becontrolled by varying the film thickness. This was demonstratedrecently by our group [20], where thin ZSM-5 zeolite films withoutbinder material were grown on 400 cells per square inch (cpsi) cor-dierite monoliths by first depositing a monolayer of colloidal zeo-lite seed crystals on the monoliths and then growing the crystals tothin films. The catalytic activity of the films was subsequently eval-uated by p-xylene isomerisation, and the effect of film thickness onmass transfer was clearly demonstrated. As opposed to wash-coated monoliths, these films had an even thickness, i.e., no effects
of surface tension in the corners. Growth of zeolite films withoutbinder material on ceramic cordierite supports was previously alsoreported by Zamaro et al. [46] (mordenite) and our group [30](faujasite).
In another work, the adsorption and diffusion of CO2 in a carbonmonolith adsorbent were studied with the Zero Length Column(ZLC) method by Brandani et al. [21]. The ZLC data showed thatthe dispersion in the monolith was controlled by mass transferresistance rather than axial mixing. Zeolite monoliths consistingof 5A zeolite and Na-bentonite with square lattice channels and awall thickness of 0.98 mm were prepared by Li et al. [14,19,22].The adsorption performance of the zeolite monolith was comparedwith that of 5A zeolite pellets (1.5 mm in diameter and 3.6 mmlong) used for the production of oxygen enriched air. The main out-comes of the work were that the adsorption performance of thezeolite monolith was of the same magnitude as the pellets whilstthe pressure drop through the zeolite monolith was 3–5 times low-er than that for the packed bed. The lower pressure drop resultedin a 3–5 times faster pressurization time when the PSA unit wasloaded with the zeolite monolith. Shorter pressurization time isan advantage [14,19,22,51] and allows faster PSA cycles which re-sults in a higher productivity and should compensate for the loweradsorbent loading when using monoliths instead of traditionaladsorbents [51].
Possible ways of improving the separation performance of thezeolite monoliths would thus be to reduce further the mass- andheat-transfer resistance by reducing the wall thickness andincreasing the cell density of the zeolite monolith [12,51].
In the present work, another approach, i.e., zeolite coatedmonoliths, was pursued to arrive at adsorbent monoliths withlow mass- and heat-transfer resistance. Instead of preparing zeo-lite monoliths, very thin zeolite NaX films with thicknesses rangingfrom 0.4 to 1.5 lm were grown on 400 cpsi cordierite monoliths toarrive at zeolite coated monoliths. The zeolite coated monolithswere characterized by scanning electron microscopy (SEM), X-raydiffraction (XRD), mercury intrusion porosimetry (MIP), N2 adsorp-tion and desorption at liquid nitrogen temperature, and CO2
adsorption breakthrough profiles.
2. Experimental section
2.1. Synthesis
A seeding method was used for zeolite film growth on mono-liths. The method is very flexible and allows for control of thethickness and preferred [23–25,47] orientation of the crystals inthe film. In addition, the adsorption [26,27] as well as diffusion[28,29] properties of the film has been studied and reported. Inthe present work, cordierite monoliths with a cell density of400 cpsi (Corning) were used as supports. Twelve monolith
Nomenclature
t time, sc concentration at time t, vol%c0 concentration at time 0, vol%K dimensionless Henry constantk coefficient of mass transfer, s�1
k* geometric factor, m�2 [12]z column length, mv superficial velocity, m/sd�qdt uptake rateq* equilibrium adsorbate loading, kg/kg
�q adsorbate loading, kg/kgDeff effective diffusivity, m2/sR radius of sediments, ml film thickness, m
Greek lettersn dimensionless concentrations dimensionless timee void fraction
A. Mosca et al. /Microporous and Mesoporous Materials 130 (2010) 38–48 39

samples were cut with a sharp tool to a cylindrical shape (11 cmlong and 2 cm in diameter) from the original monolith and NaXfilms were grown on the monolith samples in a similar way as de-scribed in previous works [20,30].
In order to remove contaminants that could affect zeolite crys-tallization, the monoliths were cleaned by rinsing in toluene, ace-tone and several times in a 0.1 M NH3 solution. The monoliths weresubsequently first dried at room temperature, then in a ventilatedoven at 110 �C, and thereafter cooled in a desiccator.
The seeding method used for film preparation consisted of threemain steps. (i) Preparation of 80 nm template free colloidal faujasiteseeds. A 1 wt% template free colloidal faujasite seed sol was pre-pared as described earlier [31,55]. (ii) Deposition of seeds onto thesurface of substrates by electrostatic adsorption. An aqueous solutionof 0.4 wt% cationic polymer was prepared by diluting a commercialpolymer mixture (Redifloc 4150, EKA Chemicals) in distilled water.The pH was adjusted to 8.0 by addition of a dilute ammonia solu-tion. The surface charge of the substrates was reversed by treat-ment in the cationic polymer solution for 10 min. After chargereversal, the substrates were rinsed with a 0.1 M NH3 solution sixtimes to remove excess polymer and were subsequently immersedin the seed sol for 10 min to adsorb a monolayer of the 80 nm fauj-asite seeds. Excess seeds were removed by rinsing six times in a0.1 M NH3 solution. The sample was left in a 0.1 M NH3 solutionprior to film growth. (iii) Growth of the colloidal seed crystals into acontinuous polycrystalline film. A gel with molar composition of14Na2O:Al2O3:10SiO2:800H2O or a clear synthesis solution withmolar composition of 80Na2O:Al2O3:9.0SiO2:5000H2O was usedfor film growth. To prepare the solutions, sodiummetasilicate (Na2-SiO3�9H2O, 98%, Sigma–Aldrich) was mixed with pelletized sodiumhydroxide (99.9% NaOH, Merck) and distilled water. An aqueoussolution of aluminum sulfate (Al2(SO4)3�18H2O, Riedel-de-Häen)was added. Thereafter, the mixture was vigorously stirred for2 min or 2 h for the clear solution and the gel, respectively.
Hydrothermal treatment was performed in an oil bath under re-flux at 100 �C at atmospheric pressure. During synthesis, the chan-nels of the support were oriented vertically to reduce zeolitesedimentation from the bulk synthesis mixture onto the walls ofthe substrate. When using the clear solution, zeolite films weregrown in two ways. In the first method, a single hydrothermaltreatment was performed for 4 h. In the second method, a multi-step procedure was used, and the hydrothermal treatment wascarried out in five steps of 1 h and 20 min. When performing themultiple-step synthesis procedure, 91 g of fresh synthesis solutionwas used for each step. Films grown from the gel were grown inone step for 9 h, using 91 g of synthesis mixture. The sample codesstart with the letter C or G for clear solution or gel, respectively,followed by a number indicating the duration of the hydrothermaltreatment in hours, see Table 1. After hydrothermal treatment, thesamples were carefully rinsed several times in a 0.1 M NH3 solu-tion and then dried at room temperature and thereafter for 5–6 hat 100 �C in a ventilated oven. The samples were subsequentlycooled in a desiccator prior to characterization. The top ends ofall samples were polished to a final length of 10 cm, in order to re-move any potentially sedimented zeolite.
The zeolite film samples were not calcined as they are grownfrom template free seeds (as discussed above) in a template freesynthesis mixtures, and thus template free.
Relatively large discrete crystals (sample label DC) of NaX zeo-lite were also grown and the powder was used as a reference mate-rial. A synthesis mixture with a molar composition of4.76Na2O:Al2O3:3.50SiO2:450H2O:2.00TEA was used, similarly asdescribed by Hamilton et al. [32]. Aluminum wire (Aldrich,99.999%) was dissolved under gentle heating and reflux in a0.8 M NaOH solution prepared from NaOH pastilles (Merck, NaOH>99.999%) and distilled water. The resulting aluminate solutionwas then filtered through 0.2 lm syringe filters (Acrodisc� SyringeFilters). Thereafter, TEA (98%+, Aldrich) was added to the filteredaluminate solution. A silicate solution was prepared by dissolvingsodium metasilicate pentahydrate (Na2SiO3�5H2O, 98%, Sigma–Al-drich) in distilled water. The silicate solution was also filteredthrough 0.2 lm syringe filters after dissolution of the sodiummetasilicate pentahydrate. Thereafter, the aluminate and silicatesolutions were mixed, and the resulting solution was stirred for1 min and a gel formed. The gel was then placed in a Teflon linedautoclave and synthesis was performed under autogenous pres-sure at 115 �C for 3 days. The crystals obtained were purified by re-peated centrifugations (14,000g) and redispersion in distilledwater, four times in total. The crystals were subsequently usedfor SEM observations and as a reference for N2 adsorption anddesorption at liquid nitrogen temperature.
2.2. Physical characterization
The weight gain (gzeolite/gsample) was calculated by measuringthe weight increase of the support before and after hydrothermaltreatment.
A Philips XL 30 scanning electron microscope (SEM) equippedwith a LaB6 emission source was used for studies of surface mor-phology of crystals and films and also to measure film thickness.The monoliths were cut in the channel direction prior to SEMinvestigation. Images were recorded on samples covered with athin layer of gold (about 10 nm) deposited by sputtering. For eachstructured adsorbent sample, more than 10 SEM pictures were re-corded at various locations (i.e., close to the walls, at the end and inthe center) in order to fully appreciate the morphology of eachsample. The selected SEM pictures shown in this paper are repre-sentative for each sample.
The average particle size of 100 crystals in sample DC was esti-mated by measurements in SEM images to 7 lm, with a standarddeviation of ±200 nm. Due to the size of these crystals, there areonly macropores between these crystals (that cannot be detectedby nitrogen adsorption) and these crystals should thus be an idealreference material for nitrogen adsorption measurements withminimum mesoporosity between the crystals.
X-ray diffraction data (XRD) in the two-theta range 5–35� wererecorded with a Siemens D 5000 powder diffractometer equippedwith a Cu-target and running in Bragg-Brentano geometry.
Nitrogen adsorption/desorption isotherms at liquid N2 temper-ature were measured for all samples with a Micromeritrics ASAP
Table 1Sample characteristics.
Sample code Synthesis conditions Film thickness(lm)
Weight gain(gzeolite/gsample)
BET surface area(m2/gsample)
Zeolite loadinga
(gzeolite/gsample)Mesop. vol.b
(cm3/gzeolite)
G9 Gel, 100 �C, 9 h 1.1 0.060 33.16 0.046 0.024C4 Clear solution, 100 �C, 4 h 0.4 0.015 8.65 0.012 0.111C5�1h20 min Clear solution, 100 �C, 5 steps of
1 h 20 min1.5 0.036 18.02 0.025 0.082
a From BET.b From BJH method.
40 A. Mosca et al. /Microporous and Mesoporous Materials 130 (2010) 38–48
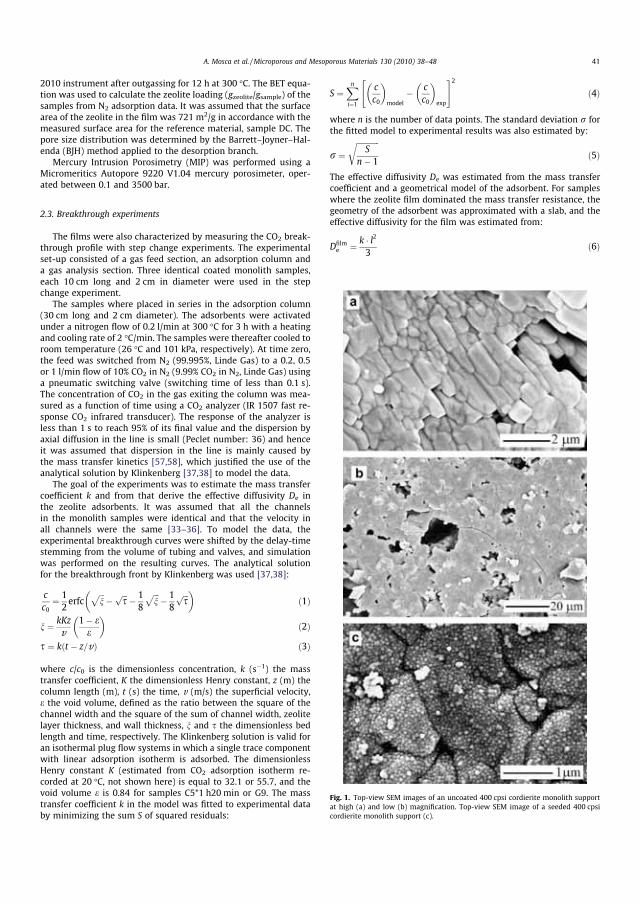
2010 instrument after outgassing for 12 h at 300 �C. The BET equa-tion was used to calculate the zeolite loading (gzeolite/gsample) of thesamples from N2 adsorption data. It was assumed that the surfacearea of the zeolite in the film was 721 m2/g in accordance with themeasured surface area for the reference material, sample DC. Thepore size distribution was determined by the Barrett–Joyner–Hal-enda (BJH) method applied to the desorption branch.
Mercury Intrusion Porosimetry (MIP) was performed using aMicromeritics Autopore 9220 V1.04 mercury porosimeter, oper-ated between 0.1 and 3500 bar.
2.3. Breakthrough experiments
The films were also characterized by measuring the CO2 break-through profile with step change experiments. The experimentalset-up consisted of a gas feed section, an adsorption column anda gas analysis section. Three identical coated monolith samples,each 10 cm long and 2 cm in diameter were used in the stepchange experiment.
The samples where placed in series in the adsorption column(30 cm long and 2 cm diameter). The adsorbents were activatedunder a nitrogen flow of 0.2 l/min at 300 �C for 3 h with a heatingand cooling rate of 2 �C/min. The samples were thereafter cooled toroom temperature (26 �C and 101 kPa, respectively). At time zero,the feed was switched from N2 (99.995%, Linde Gas) to a 0.2, 0.5or 1 l/min flow of 10% CO2 in N2 (9.99% CO2 in N2, Linde Gas) usinga pneumatic switching valve (switching time of less than 0.1 s).The concentration of CO2 in the gas exiting the column was mea-sured as a function of time using a CO2 analyzer (IR 1507 fast re-sponse CO2 infrared transducer). The response of the analyzer isless than 1 s to reach 95% of its final value and the dispersion byaxial diffusion in the line is small (Peclet number: 36) and henceit was assumed that dispersion in the line is mainly caused bythe mass transfer kinetics [57,58], which justified the use of theanalytical solution by Klinkenberg [37,38] to model the data.
The goal of the experiments was to estimate the mass transfercoefficient k and from that derive the effective diffusivity De inthe zeolite adsorbents. It was assumed that all the channelsin the monolith samples were identical and that the velocity inall channels were the same [33–36]. To model the data, theexperimental breakthrough curves were shifted by the delay-timestemming from the volume of tubing and valves, and simulationwas performed on the resulting curves. The analytical solutionfor the breakthrough front by Klinkenberg was used [37,38]:
cc0
¼ 12erfc
ffiffiffin
p� ffiffiffi
sp � 1
8
ffiffiffin
p� 18
ffiffiffis
p� �ð1Þ
n ¼ kKzv
1� ee
� �ð2Þ
s ¼ kðt � z=vÞ ð3Þ
where c/c0 is the dimensionless concentration, k (s�1) the masstransfer coefficient, K the dimensionless Henry constant, z (m) thecolumn length (m), t (s) the time, v (m/s) the superficial velocity,e the void volume, defined as the ratio between the square of thechannel width and the square of the sum of channel width, zeolitelayer thickness, and wall thickness, n and s the dimensionless bedlength and time, respectively. The Klinkenberg solution is valid foran isothermal plug flow systems in which a single trace componentwith linear adsorption isotherm is adsorbed. The dimensionlessHenry constant K (estimated from CO2 adsorption isotherm re-corded at 20 �C, not shown here) is equal to 32.1 or 55.7, and thevoid volume e is 0.84 for samples C5*1 h20 min or G9. The masstransfer coefficient k in the model was fitted to experimental databy minimizing the sum S of squared residuals:
S ¼Xni¼1
cc0
� �model
� cc0
� �exp
" #2
ð4Þ
where n is the number of data points. The standard deviation r forthe fitted model to experimental results was also estimated by:
r ¼ffiffiffiffiffiffiffiffiffiffiffiffiS
n� 1
rð5Þ
The effective diffusivity De was estimated from the mass transfercoefficient and a geometrical model of the adsorbent. For sampleswhere the zeolite film dominated the mass transfer resistance, thegeometry of the adsorbent was approximated with a slab, and theeffective diffusivity for the film was estimated from:
Dfilme ¼ k � l2
3ð6Þ
Fig. 1. Top-view SEM images of an uncoated 400 cpsi cordierite monolith supportat high (a) and low (b) magnification. Top-view SEM image of a seeded 400 cpsicordierite monolith support (c).
A. Mosca et al. /Microporous and Mesoporous Materials 130 (2010) 38–48 41

where l represent the thickness of the film or slab.For samples where mass transfer resistance was dominated by
relatively large sediments deposited from the bulk of the synthesismixture on the growing film, the geometry of the adsorbent wasapproximated with spheres, and the effective diffusivity was esti-mated from:
Daggregatee ¼ k � R2
15ð7Þ
where R represent the radius of sediments or spheres, respectively.
3. Results and discussion
3.1. Characterization by SEM, weight gain, and zeolite loading
Fig. 1a shows a SEM image of a surface of the wall of an un-coated 400 cpsi cordierite monolith. Cordierite grains form an un-even surface and some macropores are also observed between thegrains. A low magnification SEM top view-image of the 400 cpsicordierite monolith is shown in Fig. 1b, which illustrates macrop-ores with various size between the grains in the cordierite mono-lith. Fig. 1c shows a monolayer of 80 nm NaX seeds crystalsadsorbed onto the surface of the support. The seeds cover the en-tire external surface of the cordierite monolith walls. A few aggre-gates of seed crystals with a size between 200 and 400 nm are alsoobserved.
Fig. 2a shows a top-view SEM image of sample G9. The film ap-pears to be very well intergrown and typical NaX crystals withoctahedral habit and with a size ranging between about 600 and2000 nm are observed. A SEM image of sample C4 grown in the
clear solution by a single hydrothermal treatment for 4 h is shownin Fig. 2c. The film is less intergrown and comprised of NaX crystalswith a size ranging between about 170 and 1000 nm and in addi-tion, hydroxysodalite (HS) crystals with a typical ball-of-yarn habitand a diameter of about 2000 nm are observed. These hydroxy-sodalite crystals will not contribute to the CO2 or N2 adsorptioncapacity of the film due to the very small pore size (2.2–2.8 Å)[39] of this zeolite. Zeolite HS likely forms as a result of the de-creased hydrothermal stability of the NaX crystals during a longerhydrothermal treatment as phase changes are common in the crys-tallization system of zeolite NaX upon longer synthesis durations[40]. However, no HS crystals formed on the G9 sample, whichwas prepared from a quite different synthesis mixture, i.e., a gel.To limit the deposition of sediments, formation of HS crystals,and obtain a better intergrown film in the clear solution, a multi-ple-step synthesis procedure was developed where the clear syn-thesis solution was replaced every 1 h 20 min.
A NaX film was grown in five steps of 1 h 20 min, see Fig. 2e.This film (sample C5�1 h20 min) appears more well intergrownthan the film in sample C4, but not as intergrown as the film insample G9, and the number and size of HS crystals embedded inthe zeolite film was significantly reduced compared to the onegrown in one longer hydrothermal treatment (sample C4). Theaverage thickness of the NaX film sample grown in the gel (sampleG9) is about 1.1 lm, as shown in Fig. 2b and reported in Table 1.Fig. 2d shows a cross-sectional image of the NaX film grown inthe clear solution in a single hydrothermal treatment (sampleC4). As already observed from top-view images, the zeolite coatingconsists of small, not well intergrown crystals and it is thereforedifficult to define a film thickness. However, as shown by Fig. 2d,the NaX coating has an average thickness of about 0.4 lm. Fig. 2f
Fig. 2. Top-view and cross-sectional SEM images of the NaX film samples G9 (a,b), C4 (c,d), and C5�1 h 20 min (e,f).
42 A. Mosca et al. /Microporous and Mesoporous Materials 130 (2010) 38–48

shows a side-view image of a NaX film grown in the clear solutionin five steps of 1 h and 20 min. The film has an average thickness ofabout 1.5 lm and again appears to be well intergrown.
Fig. 3a shows a top-view image at low magnification of the filmgrown in the gel. Large aggregates, with radii ranging from ca. 0.5to 10 lm, are observed on top of the film. These aggregates wereprobably deposited by sedimentation from the synthesis mixture.Sediments deposited on top of and embedded in the film may bea disadvantage in PSA applications due to the increased diffusionpath of the adsorbing species. Fig. 3b, recorded at higher magnifi-cation, illustrates that the sediments are well intergrown. A muchlower amount of sediments was observed for the film sampleC5�1 h20 min, as shown in Fig. 3c.
The weight gain of the samples increases in the orderC4 < C5�1 h20 min < G9 and is hence highest for the zeolite filmsample grown in the gel, see Table 1. The high weight gain for sam-ple G9 suggests the presence of sediments in accordance with SEMobservations.
The measured surface area of the monolith support was0.24 m2/g, which was about 35, 80 and 140 times lower than thosemeasured for the zeolite film samples C4, C5�1 h20 min and G9,respectively. The observed surface area of the zeolite coated mono-liths thus stem almost entirely from the deposited zeolite, see Ta-ble 1. The surface area of the monolith was consequently neglectedwhen estimating the zeolite loading of the zeolite coated mono-liths from nitrogen adsorption data. The zeolite loading estimatedfor all zeolite film samples by liquid nitrogen adsorption is, as ex-pected, in rough accordance with the measured weight gain, seeTable 1. In the absence of sediments and zeolite growth insidethe pores of the support, a linear relationship between zeolite load-ing (or weight gain) and the thickness of the zeolite films should beobserved. The zeolite loading of the film sample grown in the gel(sample G9), 0.046 gzeolite/gsample, is about two times higher thanthe one grown with multiple steps (0.025 gzeolite/gsample), althoughthe film thickness is lower on the former sample. This suggests thepresence of sediments on sample G9 as observed by SEM, seeFig. 3a. The zeolite loading of the sample grown in the clear solu-tion for 4 h is 0.012 gzeolite/gsample about half of that for the samplegrown by the multi-step synthesis procedure (sampleC5�1 h20 min), although the thickness of the latter NaX film isapproximately four times higher. This indicates that the zeolitecoating grown by the multi-step procedure (C5�1 h20 min) has lesssediments than sample C4, in concert with the SEM observations.In summary, all results discussed in this section indicate that filmsgrown by the multiple-step synthesis procedure have less sedi-ments and HS crystals than the films grown using the otherprocedures.
3.2. Characterization by XRD
Fig. 4 shows XRD patterns for all samples. The data show thatthe discrete crystals (sample DC) are comprised of randomly ori-ented zeolite X crystals and a very small fraction of zeolite P, inaccordance with previous results [32].
The film samples are composed of randomly oriented NaX andcordierite crystals. It is worth noting that the intensity of thelow-angle peaks (between 5� and 11�) is lower for the discretecrystals (sample DC) than the films. This is the result of the pres-ence of template molecules (TEA) in sample DC, which affect theelectron density inside the crystals, similarly as observed for tem-plate containing silicalite-1 crystals [41,42]. For the zeolite filmsamples, the intensity of the NaX zeolite peaks increases in the or-der C4 < C5�1 h20 min < G9, i.e., with increasing zeolite loadingand weight gain as expected. No hydroxysodalite reflections wereobserved by XRD for the NaX film samples although few HS crys-tals were observed by SEM for sample C4 and very few for sampleC5�1 h20 min. The fraction of sodalite crystals should thus be verysmall and should not affect the adsorption performance of theadsorbents. At 2h of about 16.5� and 27.8�, some minor unidenti-fied reflections were observed for the film samples.
3.3. Nitrogen adsorption–desorption isotherms and pore sizedistribution
The N2 adsorption–desorption isotherms expressed as mmol/gsample (gsample is the total weight of each sample including bothzeolite and support) for a cordierite monolith support and theNaX coated supports are shown in Fig. 5a. The amount of nitrogenadsorbed by the uncoated cordierite monolith is very low com-pared to the coated samples, which shows that the volume ofnitrogen adsorbed by the coated samples mainly originates fromthe zeolite film and larger adsorbed amounts per gram sample isa result of higher zeolite loading for the film coated samples as dis-cussed above. Although the thickness of the film grown in the clear
Fig. 3. Low magnification SEM images of the NaX films samples G9 (a), sediment ofsample G9 (b), and low magnification SEM image of C5�1 h20 min (c).
A. Mosca et al. /Microporous and Mesoporous Materials 130 (2010) 38–48 43

solution with the multiple-step synthesis procedure (sampleC5*1 h20 min) is higher than the gel (sample G9), the amount ofnitrogen adsorbed by the latter is higher, this is due to the highzeolite loading caused by the presence of sediments on the lattersample, as discussed earlier. The contribution of the sediments tothe total adsorption capacity in sample G9 was estimated fromnitrogen adsorption data and SEM observations under the assump-tion that the observed nitrogen adsorption capacity (0.21 mmol/g sample) of sample C5*1 h20 min entirely stem from a 1.5 lmfilmas follows. This assumption is supported by SEM observations. Theadsorption capacity for the 1.1 lm film in sample G9 should thusbe about 0.15 mmol/g sample (0.21 mmol/g sample � 1.1/1.5). Theobserved adsorption capacity for sample G9 was 0.43 mmol/g sam-ple and the adsorption capacity of the sediments on this sampleshould thus be about 0.28 mmol/g sample (observed-film mmol/gsample). Sediments thus represent the main fraction of zeolite insample G9, and their contribution to the total adsorption capacityis about 65%, whereas about 35% is due to adsorption in the film.Thus, the sediments, with their long diffusion paths, will dominatethe CO2 uptake during breakthrough experiments, as will be dis-cussed below.
Fig. 5b shows the isotherms expressed as mmol/gzeolite (gzeolite isthe weight of zeolite on each sample determined from nitrogenadsorption, as discussed above). The N2 adsorption/desorption iso-therm of the reference powder DC is also included in the figure.Note that the y-scales for the films are shifted, since data wouldoverlap otherwise. For all samples, the volume adsorbed at lowpressure increased rapidly up to about 9 mmol/gzeolite due toadsorption in zeolite pores. The isotherm of the reference powderDC is typical for a microporous sample consisting of large crystals,essentially free of mesopores between the crystals and conse-quently no hysteresis loop is observed. For all film samples (butnot for the powder DC), a hysteresis loop that closes at a relativepressure p/p0 of 0.45 is observed, similarly as observed previouslyfor MFI zeolite films grown on cordierite monolith supports [43].This loop is an effect of capillary condensation, most likely in theintercrystalline mesopores in the form of grain boundaries in thezeolite films.
Fig. 6 shows the cumulative mesopore volume, per gram zeolite,of the film samples and reference powder DC. The total mesopore
Fig. 4. XRD patterns for the reference NaX powder (sample DC) and the NaX film samples G9, C4, and C5*1 h20 min. The cordierite, the NaX, and the zeolite P peaks arelabeled by the symbols ‘‘s”, ‘‘�”, and j, respectively. The symbol h indicates unidentified reflections.
Fig. 5. Nitrogen adsorption–desorption isotherms of the NaX film samples andreference NaX crystals (sample DC) per gram sample (a) and per gram zeolite (b).
44 A. Mosca et al. /Microporous and Mesoporous Materials 130 (2010) 38–48

volume of the reference powder DC is 0.003 cm3/g zeolite, i.e., verylow, as expected for large NaX crystals. The total mesopore volumeper gram zeolite of the film samples C4, C5�1 h20 min, and G9 isequal to 0.111, 0.082 and 0.024 cm3/gzeolite, respectively, as re-ported in Table 1. The mesopore volume per gram zeolite of thesamples is thus significantly higher than for the reference powder.This difference is assigned to mesopores in the form of grainboundaries and cracks in the films formed during drying. The mes-opore volume is an indication of the crystal intergrowth in the zeo-lite films, and sample G9 shows the lowest mesopore volume,indicating that this film is better intergrown than samplesC5�1 h20 min and C4, in concert with the SEM observations.
3.4. Characterization by MIP
Fig. 7 shows the cumulative pore volumes (cm3/g sample)determined by MIP of a support and the NaX film samples G9,C4, and C5�1 h20 min, see figure legend for details. In the regionbetween 80 and 2 lm, the cumulative pore volume shows a steepincrease for the uncoated support as well as for samples C4 and G9,probably due to Hg filling the pores in the walls of the monolith
(wall thickness about 100 lm). Sample C5�1 h20 min shows a low-er pore volume between 80 and 2 lm, which indicates that thisfilm blocks the pores in the monolith walls for mercury intrusion,by pore filling, similarly to capillary condensation phenomena at acertain relative pressure, likely since this film is the thickest andthus blocks some of the macropores in the monolith wall. Below2 lm, down to 7 nm (MIP detection limit) all film samples featurea similar cumulative pore volume, indicating open grain bound-aries in the films, as observed by SEM and nitrogen adsorption/desorption results.
3.5. Characterization of breakthrough properties
3.5.1. Qualitative interpretation of CO2 breakthrough profilesFig. 8a shows the CO2 breakthrough curves measured at a volu-
metric flowrate of 0.2 l/min. The time to reach 50% of the final con-centration occurred after about 28 s both for the empty columnand the column loaded with an uncoated support, see also Table 2.
The shape of the breakthrough front is sharp and the break-through curves for the empty column and the uncoated substrateare almost completely overlapping. This indicates that the ob-served dispersion might not be due to the support but rather todispersion in the tubing and valves of the system. Since the curvesare overlapping, the widths of the breakthrough curves, defined asthe difference between the time to reach 5% and 95% of the finalconcentration [44], were ca. 17 s, both for the empty column andthe column loaded with the uncoated monolith substrates. This re-sult indicates that the gas velocity is uniform in all the channels ofthe uncoated monoliths. The volume of the empty column and allpipes in the system is about 167 cm3 and the geometrical volumeof the monolith walls is as much as 41 cm3 (25% of the empty sys-tem). The fact that the breakthrough curves for the empty columnand the column loaded with an uncoated support overlaps, indi-cate that the breakthrough front is delayed by diffusion into thepores of the support resulting in dispersion in the breakthroughfront. However, this dispersion is exactly counteracted by theacceleration of the breakthrough front that should be caused bythe geometrical volume occupied by the monolith walls, which ex-plains why the two breakthrough curves overlap.
The time to reach 50% of the final concentration occurred afterabout 33 s for sample C4, see Table 2. The time to reach 50% of thefinal concentration is linked to the adsorption capacity and alsomorphology of the sample. The time to reach 50% of the final con-centration for sample C4 is almost the same as for a monolith with-out film, due to the very low adsorption capacity and low zeoliteloading of this sample, as discussed earlier. The breakthroughcurve for this sample is therefore not discussed further. On theother hand, the time to reach 50% of the final concentration isabout 76 s and 136 s for samples C5�1 h20 min and G9, respec-tively, see Table 2. These samples thus show a significant adsorp-tion capacity, in accordance with the measured zeolite loading,as discussed above.
The breakthrough front for the film C5�1 h20 min is character-ized by a steep increase in the CO2 concentration compared to theother sample, indicating an even flow distribution in the monolithchannels.
The width (9 s) of breakthrough front of sample C5�1 h20 min iseven smaller than for the uncoated monolith (17 s). This indicatesthat for the C5�1 h20 min sample, the flow pattern is close to ideal(virtually no axial dispersion) and that the resistance to masstransfer in the film is very low. MIP showed that the number ofpores in the 1–100 lm range is smaller for the C5�1 h20 min sam-ple as compared to the uncoated monolith. The reduced macropo-rosity observed for the zeolite coated sample C5�1 h20 minprobably explains the reduced dispersion of the breakthrough frontcompared to the breakthrough front observed for the uncoated
Fig. 6. Cumulative BJH mesopore volume (cm3/g zeolite) for the film samples andreference powder as a function of pore diameter (nm).
Fig. 7. Mercury intrusion pore volume distributions for the uncoated 400 cpsicordierite monolith and the NaX film samples G9, C4, and C5�1 h20 min.
A. Mosca et al. /Microporous and Mesoporous Materials 130 (2010) 38–48 45
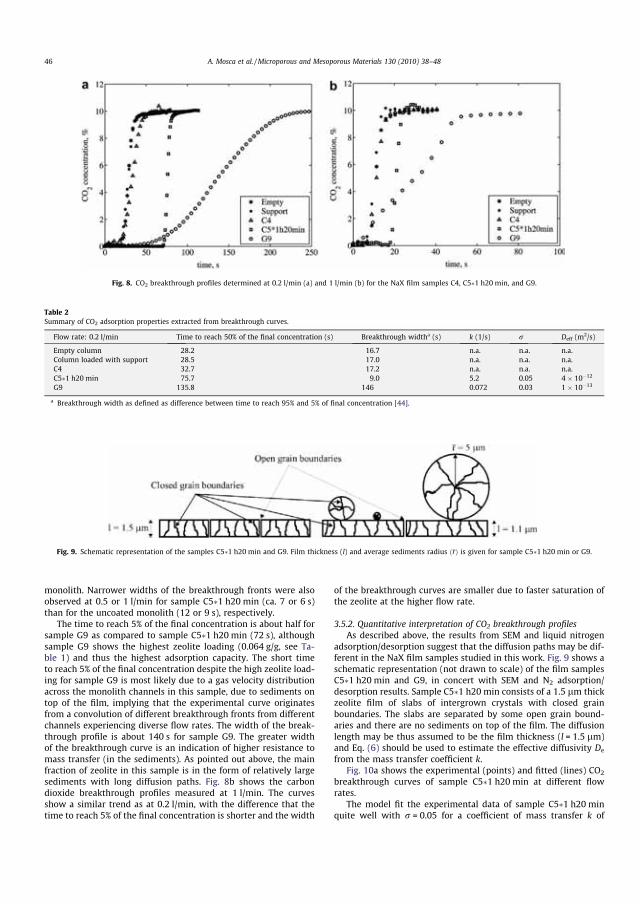
monolith. Narrower widths of the breakthrough fronts were alsoobserved at 0.5 or 1 l/min for sample C5�1 h20 min (ca. 7 or 6 s)than for the uncoated monolith (12 or 9 s), respectively.
The time to reach 5% of the final concentration is about half forsample G9 as compared to sample C5�1 h20 min (72 s), althoughsample G9 shows the highest zeolite loading (0.064 g/g, see Ta-ble 1) and thus the highest adsorption capacity. The short timeto reach 5% of the final concentration despite the high zeolite load-ing for sample G9 is most likely due to a gas velocity distributionacross the monolith channels in this sample, due to sediments ontop of the film, implying that the experimental curve originatesfrom a convolution of different breakthrough fronts from differentchannels experiencing diverse flow rates. The width of the break-through profile is about 140 s for sample G9. The greater widthof the breakthrough curve is an indication of higher resistance tomass transfer (in the sediments). As pointed out above, the mainfraction of zeolite in this sample is in the form of relatively largesediments with long diffusion paths. Fig. 8b shows the carbondioxide breakthrough profiles measured at 1 l/min. The curvesshow a similar trend as at 0.2 l/min, with the difference that thetime to reach 5% of the final concentration is shorter and the width
of the breakthrough curves are smaller due to faster saturation ofthe zeolite at the higher flow rate.
3.5.2. Quantitative interpretation of CO2 breakthrough profilesAs described above, the results from SEM and liquid nitrogen
adsorption/desorption suggest that the diffusion paths may be dif-ferent in the NaX film samples studied in this work. Fig. 9 shows aschematic representation (not drawn to scale) of the film samplesC5�1 h20 min and G9, in concert with SEM and N2 adsorption/desorption results. Sample C5�1 h20 min consists of a 1.5 lm thickzeolite film of slabs of intergrown crystals with closed grainboundaries. The slabs are separated by some open grain bound-aries and there are no sediments on top of the film. The diffusionlength may be thus assumed to be the film thickness (l = 1.5 lm)and Eq. (6) should be used to estimate the effective diffusivity De
from the mass transfer coefficient k.Fig. 10a shows the experimental (points) and fitted (lines) CO2
breakthrough curves of sample C5�1 h20 min at different flowrates.
The model fit the experimental data of sample C5�1 h20 minquite well with r = 0.05 for a coefficient of mass transfer k of
Fig. 8. CO2 breakthrough profiles determined at 0.2 l/min (a) and 1 l/min (b) for the NaX film samples C4, C5�1 h20 min, and G9.
Table 2Summary of CO2 adsorption properties extracted from breakthrough curves.
Flow rate: 0.2 l/min Time to reach 50% of the final concentration (s) Breakthrough widtha (s) k (1/s) r Deff (m2/s)
Empty column 28.2 16.7 n.a. n.a. n.a.Column loaded with support 28.5 17.0 n.a. n.a. n.a.C4 32.7 17.2 n.a. n.a. n.a.C5�1 h20 min 75.7 9.0 5.2 0.05 4 � 10�12
G9 135.8 146 0.072 0.03 1 � 10�13
a Breakthrough width as defined as difference between time to reach 95% and 5% of final concentration [44].
Fig. 9. Schematic representation of the samples C5�1 h20 min and G9. Film thickness (l) and average sediments radius ð�rÞ is given for sample C5�1 h20 min or G9.
46 A. Mosca et al. /Microporous and Mesoporous Materials 130 (2010) 38–48
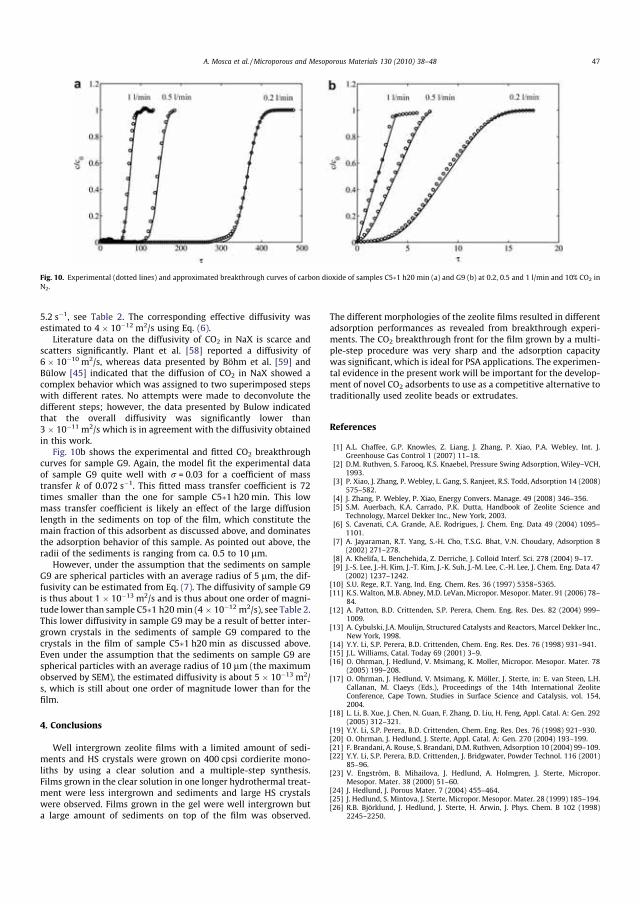
5.2 s�1, see Table 2. The corresponding effective diffusivity wasestimated to 4 � 10�12 m2/s using Eq. (6).
Literature data on the diffusivity of CO2 in NaX is scarce andscatters significantly. Plant et al. [58] reported a diffusivity of6 � 10�10 m2/s, whereas data presented by Böhm et al. [59] andBülow [45] indicated that the diffusion of CO2 in NaX showed acomplex behavior which was assigned to two superimposed stepswith different rates. No attempts were made to deconvolute thedifferent steps; however, the data presented by Bulow indicatedthat the overall diffusivity was significantly lower than3 � 10�11 m2/s which is in agreement with the diffusivity obtainedin this work.
Fig. 10b shows the experimental and fitted CO2 breakthroughcurves for sample G9. Again, the model fit the experimental dataof sample G9 quite well with r = 0.03 for a coefficient of masstransfer k of 0.072 s�1. This fitted mass transfer coefficient is 72times smaller than the one for sample C5�1 h20 min. This lowmass transfer coefficient is likely an effect of the large diffusionlength in the sediments on top of the film, which constitute themain fraction of this adsorbent as discussed above, and dominatesthe adsorption behavior of this sample. As pointed out above, theradii of the sediments is ranging from ca. 0.5 to 10 lm.
However, under the assumption that the sediments on sampleG9 are spherical particles with an average radius of 5 lm, the dif-fusivity can be estimated from Eq. (7). The diffusivity of sample G9is thus about 1 � 10�13 m2/s and is thus about one order of magni-tude lower than sample C5�1 h20 min (4 � 10�12 m2/s), see Table 2.This lower diffusivity in sample G9 may be a result of better inter-grown crystals in the sediments of sample G9 compared to thecrystals in the film of sample C5�1 h20 min as discussed above.Even under the assumption that the sediments on sample G9 arespherical particles with an average radius of 10 lm (the maximumobserved by SEM), the estimated diffusivity is about 5 � 10�13 m2/s, which is still about one order of magnitude lower than for thefilm.
4. Conclusions
Well intergrown zeolite films with a limited amount of sedi-ments and HS crystals were grown on 400 cpsi cordierite mono-liths by using a clear solution and a multiple-step synthesis.Films grown in the clear solution in one longer hydrothermal treat-ment were less intergrown and sediments and large HS crystalswere observed. Films grown in the gel were well intergrown buta large amount of sediments on top of the film was observed.
The different morphologies of the zeolite films resulted in differentadsorption performances as revealed from breakthrough experi-ments. The CO2 breakthrough front for the film grown by a multi-ple-step procedure was very sharp and the adsorption capacitywas significant, which is ideal for PSA applications. The experimen-tal evidence in the present work will be important for the develop-ment of novel CO2 adsorbents to use as a competitive alternative totraditionally used zeolite beads or extrudates.
References
[1] A.L. Chaffee, G.P. Knowles, Z. Liang, J. Zhang, P. Xiao, P.A. Webley, Int. J.Greenhouse Gas Control 1 (2007) 11–18.
[2] D.M. Ruthven, S. Farooq, K.S. Knaebel, Pressure Swing Adsorption, Wiley–VCH,1993.
[3] P. Xiao, J. Zhang, P. Webley, L. Gang, S. Ranjeet, R.S. Todd, Adsorption 14 (2008)575–582.
[4] J. Zhang, P. Webley, P. Xiao, Energy Convers. Manage. 49 (2008) 346–356.[5] S.M. Auerbach, K.A. Carrado, P.K. Dutta, Handbook of Zeolite Science and
Technology, Marcel Dekker Inc., New York, 2003.[6] S. Cavenati, C.A. Grande, A.E. Rodrigues, J. Chem. Eng. Data 49 (2004) 1095–
1101.[7] A. Jayaraman, R.T. Yang, S.-H. Cho, T.S.G. Bhat, V.N. Choudary, Adsorption 8
(2002) 271–278.[8] A. Khelifa, L. Benchehida, Z. Derriche, J. Colloid Interf. Sci. 278 (2004) 9–17.[9] J.-S. Lee, J.-H. Kim, J.-T. Kim, J.-K. Suh, J.-M. Lee, C.-H. Lee, J. Chem. Eng. Data 47
(2002) 1237–1242.[10] S.U. Rege, R.T. Yang, Ind. Eng. Chem. Res. 36 (1997) 5358–5365.[11] K.S. Walton, M.B. Abney, M.D. LeVan, Micropor. Mesopor. Mater. 91 (2006) 78–
84.[12] A. Patton, B.D. Crittenden, S.P. Perera, Chem. Eng. Res. Des. 82 (2004) 999–
1009.[13] A. Cybulski, J.A. Moulijn, Structured Catalysts and Reactors, Marcel Dekker Inc.,
New York, 1998.[14] Y.Y. Li, S.P. Perera, B.D. Crittenden, Chem. Eng. Res. Des. 76 (1998) 931–941.[15] J.L. Williams, Catal. Today 69 (2001) 3–9.[16] O. Ohrman, J. Hedlund, V. Msimang, K. Moller, Micropor. Mesopor. Mater. 78
(2005) 199–208.[17] O. Ohrman, J. Hedlund, V. Msimang, K. Möller, J. Sterte, in: E. van Steen, L.H.
Callanan, M. Claeys (Eds.), Proceedings of the 14th International ZeoliteConference, Cape Town, Studies in Surface Science and Catalysis, vol. 154,2004.
[18] L. Li, B. Xue, J. Chen, N. Guan, F. Zhang, D. Liu, H. Feng, Appl. Catal. A: Gen. 292(2005) 312–321.
[19] Y.Y. Li, S.P. Perera, B.D. Crittenden, Chem. Eng. Res. Des. 76 (1998) 921–930.[20] O. Ohrman, J. Hedlund, J. Sterte, Appl. Catal. A: Gen. 270 (2004) 193–199.[21] F. Brandani, A. Rouse, S. Brandani, D.M. Ruthven, Adsorption 10 (2004) 99–109.[22] Y.Y. Li, S.P. Perera, B.D. Crittenden, J. Bridgwater, Powder Technol. 116 (2001)
85–96.[23] V. Engström, B. Mihailova, J. Hedlund, A. Holmgren, J. Sterte, Micropor.
Mesopor. Mater. 38 (2000) 51–60.[24] J. Hedlund, J. Porous Mater. 7 (2004) 455–464.[25] J. Hedlund, S. Mintova, J. Sterte, Micropor. Mesopor. Mater. 28 (1999) 185–194.[26] R.B. Björklund, J. Hedlund, J. Sterte, H. Arwin, J. Phys. Chem. B 102 (1998)
2245–2250.
Fig. 10. Experimental (dotted lines) and approximated breakthrough curves of carbon dioxide of samples C5�1 h20 min (a) and G9 (b) at 0.2, 0.5 and 1 l/min and 10% CO2 inN2.
A. Mosca et al. /Microporous and Mesoporous Materials 130 (2010) 38–48 47

[27] M. Grahn, A. Lobanova, A. Holmgren, J. Hedlund, Chem. Mater. 20 (2008)6270–6276.
[28] F. Jareman, J. Hedlund, Micropor. Mesopor. Mater. 82 (2005) 201–207.[29] F. Jareman, J. Hedlund, J. Sterte, Sep. Purif. Technol. 32 (2003) 159–163.[30] A. Mosca, J. Hedlund, F.N. Ridha, P. Webley, Adsorption 14 (2008) 687–693.[31] Q. Li, D. Creaser, J. Sterte, Chem. Mater. 14 (2002) 1319–1324.[32] K.E. Hamilton, E.N. Coker, A. Sacco, A.G. Dixon, R.W. Thompson, Zeolites 13
(1993) 645–653.[33] H. Ahn, S. Brandani, AIChE J. 51 (2005) 1980–1990.[34] H. Chang, X.-G. Yuan, H. Tian, A.-W. Zeng, Chem. Eng. Process. 45 (2006) 747–
754.[35] R.P. Ribeiro, T.P. Sauer, F.V. Lopes, R.F. Moreira, C.A. Grande, A.E. Rodrigues, J.
Chem. Eng. Data 53 (2008) 2311–2317.[36] L.C. Young, B.A. Finlayson, Adv. Chem. Ser. 13 (1974) 629–643.[37] A. Klinkenberg, Ind. Eng. Chem. 46 (1954) 2285–2289.[38] D.M. Ruthven, Principles of Adsorption and Adsorption Processes, JohnWiley &
Sons, New York, 1984.[39] A. van Niekerk, J. Zah, J.C. Breytenbach, H.M. Krieg, J. Membr. Sci. 300 (2007)
156–164.[40] D.W. Breck, Zeolite Molecular Sieves: Structure, Chemistry and Use, Krieger
Publ. Company, 1984.[41] M. Lassinantti Gualtieri, A.F. Gualtieri, J. Hedlund, Micropor. Mesopor. Mater.
89 (2005) 1–5.[42] M. Milanesio, G. Artioli, A.F. Gualtieri, L. Palin, C. Lamberti, J. Am. Chem. Soc.
125 (2003) 14549–14558.
[43] A. Mosca, O. Öhrman, J. Hedlund, I. Perdana, D. Creaser, Micropor. Mesopor.Mater. 120 (2009) 195–205.
[44] T. Valdés-Solis, M.J.G. Linders, F. Kapteijn, G. Marbán, A.B. Fuertes, Chem. Eng.Sci. 58 (2004) 2791–2800.
[45] M. Bülow, Adsorption 8 (2002) 9–14.[46] J.M. Zamaro, M.A. Ulla, E.E. Miró, Appl. Catal. A 314 (2006) 101–113.[47] M. Lassinantti, J. Hedlund, J. Sterte, Micropor. Mesopor. Mater. 38 (2000) 25–
34.[48] C. Grande, A.E. Rodrigues, Chem. Eng. Sci. 61 (2006) 3053–3067.[49] Rui P. Ribeiro, T.P. Sauer, F.V. Lopes, R.F. Moreira, C.A. Grande, A.E. Rodrigues, J.
Chem. Eng. Data 53 (2008) 2311–2317.[50] C. Grande, A.E. Rodrigues, Int. J. Greenhouse Gas Control 2 (2008) 194–202.[51] F. Rezaei, P. Webley, Sep. Purif. Technol., doi:10.1016/j.seppur.2009.10.004.[52] C.G. Coe, J.F. Kirner, R. Pierantozzi, T.R. White, Nitrogen Adsorption with a
Divalent Cation Exchanged Lithium-X Zeolite, US Patent 5, 258,058 (1993).[53] N.D. Hutson, S.U. Rege, R.T. Yang, AIChE J. 45 (1999) 724–734.[54] J.C. Santos, P. Cruz, T. Regala, F.D. Magalhaes, A. Mendes, Ind. Eng. Chem. Res.
46 (2007) 591–599.[55] M. Lassinantti, J. Hedlund, J. Sterte, Stud. Surf. Sci. Catal. 125 (1999) 181–187.[56] C.-H. Lee, J. Yang, H. Ahn, AIChE J. 45 (1999) 535–545.[57] H.S. Fogler, Elements of Chemical Reaction Engineering, Prentice Hall Inc.,
2000.[58] D. Plant, H. Jobic, P. Llewellyn, G. Maurin, Eur. Phys. J. Special Top. 141 (2007)
127–132.[59] J. Böhm, B. Hunger, H. Papp, Stud. Surf. Sci. Catal. 158 (2005) 1113–1120.
48 A. Mosca et al. /Microporous and Mesoporous Materials 130 (2010) 38–48

PAPER D
Comparison of traditional and structured adsorbents for CO2 separation by vacuum-
swing adsorption
Authors:F. Rezaei, A. Mosca, P. Webley, J. Hedlund, P. Xiao
Industrial & Engineering Chemistry Research 49 (2010) 4832 - 4841
93

94 PAPER D

Comparison of Traditional and Structured Adsorbents for CO2 Separation byVacuum-Swing Adsorption
Fateme Rezaei,† Alessandra Mosca,‡ Paul Webley,*,† Jonas Hedlund,‡ and Penny Xiao†
Department of Chemical Engineering, Monash UniVersity, Victoria 3800, Australia, and DiVision of ChemicalEngineering, Luleå UniVersity of Technology, SE-97187 Luleå, Sweden
The development of structured adsorbents with attractive characteristics is an important step in the improvementof adsorption-based gas-separation processes. The improved features of structured adsorbents include lowerenergy consumption, higher throughput, and superior recovery and purity of product because of the evenflow distribution, very low mass-transfer resistance, and low pressure drop in combination with a reasonableadsorption capacity. This study examines the vacuum-swing adsorption (VSA) CO2 separation performanceof structured adsorbents in the form of thin NaX films grown on the walls of ceramic cordierite monoliths,and the results are compared with NaX pellets. Adsorption equilibrium and dynamic properties are exploredexperimentally. The CO2 breakthrough front for the NaX film grown on the 400 cells/in.2 (cpsi) monolithwas close to ideal and indicated that axial dispersion was very small and that the mass-transfer resistance inthe film was very low. The breakthrough front for the structured adsorbent with 400 cpsi was sharper thanthat for the structured adsorbent with 900 cpsi and only shifted to shorter breakthrough times because of thelower amount of zeolite and higher effective diffusivity of the former sample. In addition, the CO2 breakthroughfronts for the 400 and 900 cpsi structured adsorbents were both sharper than the breakthrough front for NaXbeads. This indicates that the flow distribution in the structured adsorbents is more even and that the mass-transfer resistance in the film is very low because of the small film thickness and high effective diffusivityfor CO2 in the NaX film. Experimental data were used to obtain overall mass-transfer linear-driving-forceconstants, which were subsequently used in a numerical simulation program to estimate the performance ofthe adsorbents for CO2/N2 separation in a VSA process. It was found that the recovery of structured adsorbentswas superior to that of a packed bed because of the much shorter mass-transfer zone. The purity, on the otherhand, was not as high as that obtained with a packed bed because of excessive voidage in the structuredadsorbents. Increased cell density or improved zeolite loading of the structured adsorbents would improvethe CO2 purity without sacrificing recovery for the structured adsorbents, and this represents a path forwardto improved VSA performance for CO2 capture.
1. Introduction
Over the past decade, there has been considerable interest inthe intensification of separation processes. In cyclic processessuch as PSA, VSA, and TSA (pressure-, vacuum-, and temper-ature-swing adsorption, respectively), reducing the cycle timeis the primary means of achieving more production from a givenquantity of adsorbent. However, as the cycle time is reduced,cyclic processes usually face the problem of decreasing theworking capacity per cycle for the component of interest,decreasing the product recovery, and increasing the pressuredrop. The extent to which the cycle time reduces the workingcapacity and recovery and increases the pressure drop isdependent on the structure of the adsorbent.1,2 Conventionaladsorbents for gas separations are usually prepared in the formof beads or granules, and these materials are used in packedbeds. The mass transfer and pressure drop associated withpacked beds of conventional adsorbents impose limitations inoperating the process at optimum conditions in terms of energyconsumption and the overall system efficiency.
Recently, various structured adsorbents with enhanced ad-sorption characteristics such as monoliths, laminates, and foamshave gained considerable attention as substitutes for conven-tional adsorbent particles.3-15 A detailed review of these
alternate structures and their merits was recently conducted byRezaei and Webley.1
Parallel channel monolithic structures with controllable shape,cell density, and wall thickness have been reported for theiruse in adsorptive gas-separation systems.3,5,6,8,16-19 The mainadvantage of such configurations resides in the low pressuredrop and higher mass-transfer rates. Although it has beenreported that the mass-transfer characteristics of monolithicadsorbents are somewhat inferior to those of a comparablepacked bed, this is more a consequence of early monolithicstructures with thick walls rather than any intrinsic limitation.Reduced channel width and wall thickness or production of amore appropriate cross-sectional flow profile may providesuperior mass-transfer properties of monolithic adsorbentscompared to packed beds.
Although the unique structure of monoliths (continuous bodywith identical channels) significantly reduces the commonproblems of conventional adsorbents (i.e., fluidization, highpressure drop, etc.), these structures often have low loading ofthe active adsorbent material per column volume because ofhigh void volume. The active adsorbent may be presented tothe flowing gas in two different ways. In the first approach, theactive adsorbent material is directly extruded in the form of astructured monolith (commonly done for carbon monoliths). Inthe second approach, the monolithic structure is inactive butacts as a mechanical support for the adsorbent: usually a thinfilm is deposited on the monolithic structures by variousmethods, namely, dip coating, wash coating, and slip coating.6,16
* To whom correspondence should be addressed. Tel: +61 3 99053445. Fax: +61 3 9905 5686. E-mail: [email protected].
† Monash University.‡ Luleå University of Technology.
Ind. Eng. Chem. Res. 2010, 49, 4832–48414832
10.1021/ie9016545 © 2010 American Chemical SocietyPublished on Web 04/12/2010
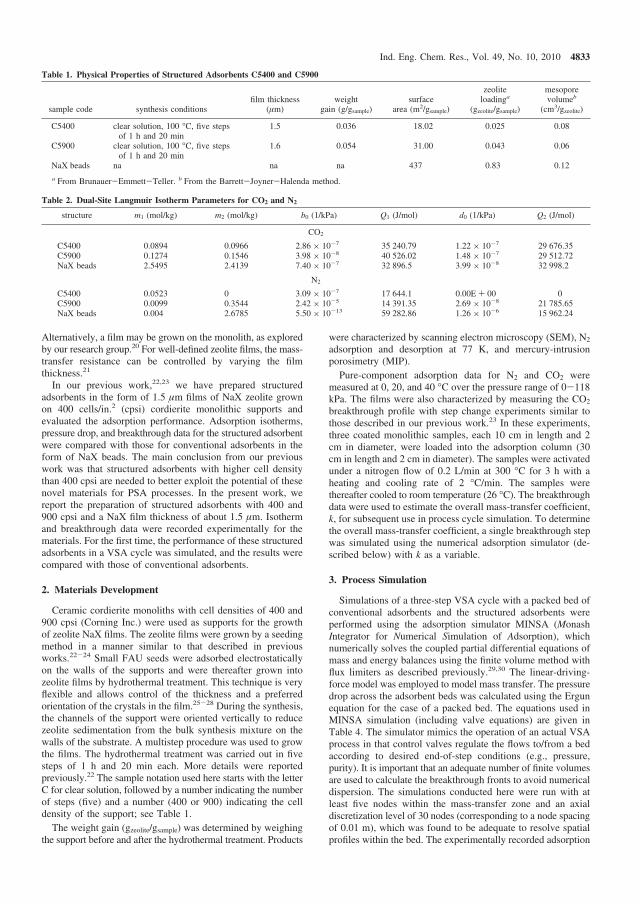
Alternatively, a film may be grown on the monolith, as exploredby our research group.20 For well-defined zeolite films, the mass-transfer resistance can be controlled by varying the filmthickness.21
In our previous work,22,23 we have prepared structuredadsorbents in the form of 1.5 μm films of NaX zeolite grownon 400 cells/in.2 (cpsi) cordierite monolithic supports andevaluated the adsorption performance. Adsorption isotherms,pressure drop, and breakthrough data for the structured adsorbentwere compared with those for conventional adsorbents in theform of NaX beads. The main conclusion from our previouswork was that structured adsorbents with higher cell densitythan 400 cpsi are needed to better exploit the potential of thesenovel materials for PSA processes. In the present work, wereport the preparation of structured adsorbents with 400 and900 cpsi and a NaX film thickness of about 1.5 μm. Isothermand breakthrough data were recorded experimentally for thematerials. For the first time, the performance of these structuredadsorbents in a VSA cycle was simulated, and the results werecompared with those of conventional adsorbents.
2. Materials Development
Ceramic cordierite monoliths with cell densities of 400 and900 cpsi (Corning Inc.) were used as supports for the growthof zeolite NaX films. The zeolite films were grown by a seedingmethod in a manner similar to that described in previousworks.22-24 Small FAU seeds were adsorbed electrostaticallyon the walls of the supports and were thereafter grown intozeolite films by hydrothermal treatment. This technique is veryflexible and allows control of the thickness and a preferredorientation of the crystals in the film.25-28 During the synthesis,the channels of the support were oriented vertically to reducezeolite sedimentation from the bulk synthesis mixture on thewalls of the substrate. A multistep procedure was used to growthe films. The hydrothermal treatment was carried out in fivesteps of 1 h and 20 min each. More details were reportedpreviously.22 The sample notation used here starts with the letterC for clear solution, followed by a number indicating the numberof steps (five) and a number (400 or 900) indicating the celldensity of the support; see Table 1.
The weight gain (gzeolite/gsample) was determined by weighingthe support before and after the hydrothermal treatment. Products
were characterized by scanning electron microscopy (SEM), N2
adsorption and desorption at 77 K, and mercury-intrusionporosimetry (MIP).
Pure-component adsorption data for N2 and CO2 weremeasured at 0, 20, and 40 °C over the pressure range of 0-118kPa. The films were also characterized by measuring the CO2
breakthrough profile with step change experiments similar tothose described in our previous work.23 In these experiments,three coated monolithic samples, each 10 cm in length and 2cm in diameter, were loaded into the adsorption column (30cm in length and 2 cm in diameter). The samples were activatedunder a nitrogen flow of 0.2 L/min at 300 °C for 3 h with aheating and cooling rate of 2 °C/min. The samples werethereafter cooled to room temperature (26 °C). The breakthroughdata were used to estimate the overall mass-transfer coefficient,k, for subsequent use in process cycle simulation. To determinethe overall mass-transfer coefficient, a single breakthrough stepwas simulated using the numerical adsorption simulator (de-scribed below) with k as a variable.
3. Process Simulation
Simulations of a three-step VSA cycle with a packed bed ofconventional adsorbents and the structured adsorbents wereperformed using the adsorption simulator MINSA (MonashIntegrator for Numerical Simulation of Adsorption), whichnumerically solves the coupled partial differential equations ofmass and energy balances using the finite volume method withflux limiters as described previously.29,30 The linear-driving-force model was employed to model mass transfer. The pressuredrop across the adsorbent beds was calculated using the Ergunequation for the case of a packed bed. The equations used inMINSA simulation (including valve equations) are given inTable 4. The simulator mimics the operation of an actual VSAprocess in that control valves regulate the flows to/from a bedaccording to desired end-of-step conditions (e.g., pressure,purity). It is important that an adequate number of finite volumesare used to calculate the breakthrough fronts to avoid numericaldispersion. The simulations conducted here were run with atleast five nodes within the mass-transfer zone and an axialdiscretization level of 30 nodes (corresponding to a node spacingof 0.01 m), which was found to be adequate to resolve spatialprofiles within the bed. The experimentally recorded adsorption
Table 1. Physical Properties of Structured Adsorbents C5400 and C5900
sample code synthesis conditionsfilm thickness
(μm)weight
gain (g/gsample)surface
area (m2/gsample)
zeoliteloadinga
(gzeolite/gsample)
mesoporevolumeb
(cm3/gzeolite)
C5400 clear solution, 100 °C, five stepsof 1 h and 20 min
1.5 0.036 18.02 0.025 0.08
C5900 clear solution, 100 °C, five stepsof 1 h and 20 min
1.6 0.054 31.00 0.043 0.06
NaX beads na na na 437 0.83 0.12
a From Brunauer-Emmett-Teller. b From the Barrett-Joyner-Halenda method.
Table 2. Dual-Site Langmuir Isotherm Parameters for CO2 and N2
structure m1 (mol/kg) m2 (mol/kg) b0 (1/kPa) Q1 (J/mol) d0 (1/kPa) Q2 (J/mol)
CO2
C5400 0.0894 0.0966 2.86 × 10⁻⁷ 35 240.79 1.22 × 10⁻⁷ 29 676.35C5900 0.1274 0.1546 3.98 × 10⁻⁸ 40 526.02 1.48 × 10⁻⁷ 29 512.72NaX beads 2.5495 2.4139 7.40 × 10⁻⁷ 32 896.5 3.99 × 10⁻⁸ 32 998.2
N2
C5400 0.0523 0 3.09 × 10⁻⁷ 17 644.1 0.00E + 00 0C5900 0.0099 0.3544 2.42 × 10⁻⁵ 14 391.35 2.69 × 10⁻⁸ 21 785.65NaX beads 0.004 2.6785 5.50 × 10⁻¹³ 59 282.86 1.26 × 10⁻⁶ 15 962.24
Ind. Eng. Chem. Res., Vol. 49, No. 10, 2010 4833
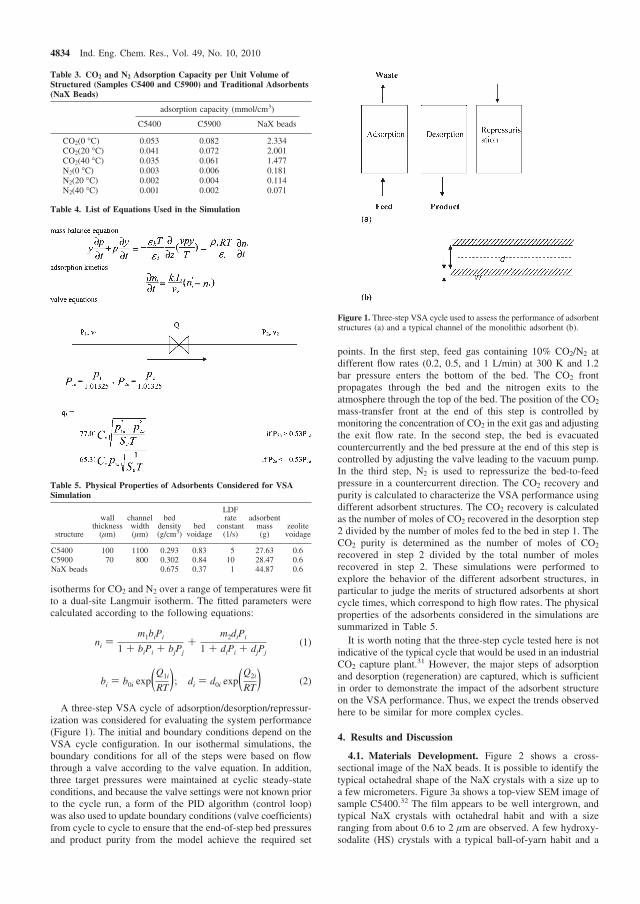
isotherms for CO2 and N2 over a range of temperatures were fitto a dual-site Langmuir isotherm. The fitted parameters werecalculated according to the following equations:
A three-step VSA cycle of adsorption/desorption/repressur-ization was considered for evaluating the system performance(Figure 1). The initial and boundary conditions depend on theVSA cycle configuration. In our isothermal simulations, theboundary conditions for all of the steps were based on flowthrough a valve according to the valve equation. In addition,three target pressures were maintained at cyclic steady-stateconditions, and because the valve settings were not known priorto the cycle run, a form of the PID algorithm (control loop)was also used to update boundary conditions (valve coefficients)from cycle to cycle to ensure that the end-of-step bed pressuresand product purity from the model achieve the required set
points. In the first step, feed gas containing 10% CO2/N2 atdifferent flow rates (0.2, 0.5, and 1 L/min) at 300 K and 1.2bar pressure enters the bottom of the bed. The CO2 frontpropagates through the bed and the nitrogen exits to theatmosphere through the top of the bed. The position of the CO2
mass-transfer front at the end of this step is controlled bymonitoring the concentration of CO2 in the exit gas and adjustingthe exit flow rate. In the second step, the bed is evacuatedcountercurrently and the bed pressure at the end of this step iscontrolled by adjusting the valve leading to the vacuum pump.In the third step, N2 is used to repressurize the bed-to-feedpressure in a countercurrent direction. The CO2 recovery andpurity is calculated to characterize the VSA performance usingdifferent adsorbent structures. The CO2 recovery is calculatedas the number of moles of CO2 recovered in the desorption step2 divided by the number of moles fed to the bed in step 1. TheCO2 purity is determined as the number of moles of CO2
recovered in step 2 divided by the total number of molesrecovered in step 2. These simulations were performed toexplore the behavior of the different adsorbent structures, inparticular to judge the merits of structured adsorbents at shortcycle times, which correspond to high flow rates. The physicalproperties of the adsorbents considered in the simulations aresummarized in Table 5.
It is worth noting that the three-step cycle tested here is notindicative of the typical cycle that would be used in an industrialCO2 capture plant.31 However, the major steps of adsorptionand desorption (regeneration) are captured, which is sufficientin order to demonstrate the impact of the adsorbent structureon the VSA performance. Thus, we expect the trends observedhere to be similar for more complex cycles.
4. Results and Discussion
4.1. Materials Development. Figure 2 shows a cross-sectional image of the NaX beads. It is possible to identify thetypical octahedral shape of the NaX crystals with a size up toa few micrometers. Figure 3a shows a top-view SEM image ofsample C5400.32 The film appears to be well intergrown, andtypical NaX crystals with octahedral habit and with a sizeranging from about 0.6 to 2 μm are observed. A few hydroxy-sodalite (HS) crystals with a typical ball-of-yarn habit and a
Table 3. CO2 and N2 Adsorption Capacity per Unit Volume ofStructured (Samples C5400 and C5900) and Traditional Adsorbents(NaX Beads)
adsorption capacity (mmol/cm3)
C5400 C5900 NaX beads
CO2(0 °C) 0.053 0.082 2.334CO2(20 °C) 0.041 0.072 2.001CO2(40 °C) 0.035 0.061 1.477N2(0 °C) 0.003 0.006 0.181N2(20 °C) 0.002 0.004 0.114N2(40 °C) 0.001 0.002 0.071
Table 4. List of Equations Used in the Simulation
Table 5. Physical Properties of Adsorbents Considered for VSASimulation
structure
wallthickness
(μm)
channelwidth(μm)
beddensity(g/cm3)
bedvoidage
LDFrate
constant(1/s)
adsorbentmass(g)
zeolitevoidage
C5400 100 1100 0.293 0.83 5 27.63 0.6C5900 70 800 0.302 0.84 10 28.47 0.6NaX beads 0.675 0.37 1 44.87 0.6
ni )m1biPi
1 + biPi + bjPj+
m2diPi
1 + diPi + djPj(1)
bi ) b0i exp(Q1i
RT); di ) d0i exp(Q2i
RT) (2)
Figure 1. Three-step VSA cycle used to assess the performance of adsorbentstructures (a) and a typical channel of the monolithic adsorbent (b).
4834 Ind. Eng. Chem. Res., Vol. 49, No. 10, 2010

diameter of about 1 μm are also observed. The pores in HSzeolite are too small to allow any CO2 adsorption. HS may formas a consequence of aluminum depletion32 in the synthesismixture during growth of zeolite X. Figure 3b shows a cross-sectional image of the NaX film grown on the 400 cpsi support.Again, the crystals in the zeolite film appear to be wellintergrown, and the film has an average thickness of ap-proximately 1.5 μm.
Figure 3c shows a top-view SEM image of sample C5900.The film appears to be quite similar to the film in sample C5400.However, the number and size of the HS crystals embedded inthe zeolite film on the 900 cpsi support were reduced comparedto the film on the 400 cpsi support. Cordierite containsaluminum, and HS formation is probably reduced by morealuminum leaching from the 900 cpsi support, which has a largerexternal area per volume of support than the 400 cpsi support.The average thickness of the zeolite film on the 900 cpsi supportis about 1.6 μm, as shown in Figure 3d. Some zeolite crystalswere also observed in the pores of the walls of both of thestructured adsorbents; see Figure 4. The weight gains are 0.036and 0.054 g/gsample for samples C5400 and C5900, respectively;see Table 1. Thus, the weight gain is about 1.5 times higher forthe latter sample. The geometrical external (wall) surface areaper gram of sample of the 900 cpsi support is about 1.4 timeshigher than the 400 cpsi support, which accords well with theweight gain of the samples. The N2 adsorption-desorptionisotherms recorded at 77 K expressed as millimoles per gramof sample for the structured adsorbents and the NaX beads areshown in Figure 5a. The amount of nitrogen adsorbed increasesin the order of C5400 < C5900 < NaX beads. The zeoliteloadings estimated from N2 adsorption data as in previouswork31 for the 400 and 900 cpsi structured adsorbents are, asexpected, in approximate accordance with the measured weightgain; see Table 1. The zeolite loading of the NaX beads is equalto 0.83 gz/gsample
22 (see Table 1) and is about 33 and 20 timeshigher than those for samples C5400 and C5900, respectively.
The total mesopore volume per gram of zeolite is 0.08, 0.06,and 0.12 cm3/gz for C5400, C5900, and NaX beads, respectively;see Table 1. The mesopore volumes per gram of zeolite for thestructured adsorbents are quite similar, which is expectedbecause the films were grown by identical procedures. Themesopore volume per gram of zeolite of the NaX beads is inthe same range of data as that reported in the literature (0.07cm3/gz)34 and is also similar to that for the structured adsorbents.
Figure 6a shows the cumulative pore volumes (cm3/gsample)determined by MIP of a 400 cpsi support and the structuredadsorbent grown on the same support, sample C5400. The totalMIP pore volume for the support is about 0.25 cm3/g. The steep
increase of the cumulative pore volume in the region betweenabout 25 and 2 μm corresponds to the pores in the wall of thesupport. Compared to the 400 cpsi support, the total pore volumeis similar for the 900 cpsi support; see Figure 6b. However, thesize distribution of the pores in the wall is narrower for thelatter support and shifted to somewhat smaller pore sizes, about0.8-2 μm. The cumulative pore volume of the structuredadsorbent sample C5900 almost overlaps with that of thecorresponding support, as expected. However, the structuredadsorbent sample C5400 displays pores in the range 0.01-1μm, which are absent in the corresponding 400 cpsi supportand in sample C5900. These pores should thus stem from thezeolite film in the structured adsorbent C5400 and may representopen grain boundaries and cracks in the film. A hypothesis isthat these pores have formed as a result of the repeated (>10)activations at 300 °C in a flow of dry gas prior to breakthroughexperiments of this sample. It is well-known that FAU zeolitecrystals contract significantly upon dehydration,38,39 which mayresult in the formation of cracks and open grain boundaries inthe film. Sample C5900 has only been activated two times priorto breakthrough experiments and characterization by MIP.
Figure 7a shows the CO2 isotherms measured at 0-40 °Cexpressed in millimoles per gram of sample of samples C5400and C5900. For both samples, the CO2 adsorption capacity isreduced at higher temperatures, as expected. For all tempera-tures, the CO2 adsorption capacity per gram sample for sampleC5400 is about half that for sample C5900, in agreement withthe zeolite loading and weight gain discussed above. Figure 7bshows the CO2 isotherm per gram of sample of the NaX beads.The CO2 adsorption capacity per gram of sample of the beadsis about 28 or 17 times higher than that for the structuredadsorbents C5400 or C5900, in rough agreement with the zeoliteloading. At all temperatures, the CO2 adsorption capacity perunit volume of the adsorption column loaded with samplesC5400 or C5900 is about 44 or 26 times lower than that for thepacked bed; see Table 3. For all samples, dual-site Langmuiradsorption isotherms were fitted to the experimental CO2
adsorption data, as shown in Figure 7a,b, and the fittedparameters are given in Table 2.
Figure 8a shows the N2 adsorption isotherms measured at0-40 °C expressed in millimoles per gram of sample forsamples C5400 and C5900. Similarly as observed for CO2
adsorption, the N2 adsorption capacity of sample C5400 is abouthalf that for sample C5900. Figure 8b shows the N2 adsorptionisotherms measured at 0-40 °C for NaX beads. At alltemperatures, the N2 adsorption capacity per unit volume ofsamples C5400 or C5900 is about 54 or 30 times lower thanthat for the packed bed. For all samples, the N2 adsorptioncapacity per gram of sample is about 10 times lower than theCO2 adsorption capacity, as expected for CO2/N2 adsorptionon zeolite X.36,37 Dual-site Langmuir isotherms were fitted tothe experimental data, and the fitted parameters are given inTable 2.
The pressure drop (not shown here) for a column loadedwith the NaX beads22 is about 100 or 70 times higher than thatwhen the column is loaded with the structured 400 and 900cpsi adsorbents, respectively.
Figure 9a shows the CO2 breakthrough curves for sampleC5400. The time to reach 50% of the final concentrationoccurred after ca. 76, 35, or 21 s at flow rates of 0.2, 0.5, and1 L/min, respectively. The sharp breakthrough fronts indicatethat the flow pattern is close to ideal (virtually no axialdispersion) and that the resistance to mass transfer in the filmis very low. Figure 9b shows the CO2 breakthrough curves for
Figure 2. Top-view SEM image of NaX beads.
Ind. Eng. Chem. Res., Vol. 49, No. 10, 2010 4835
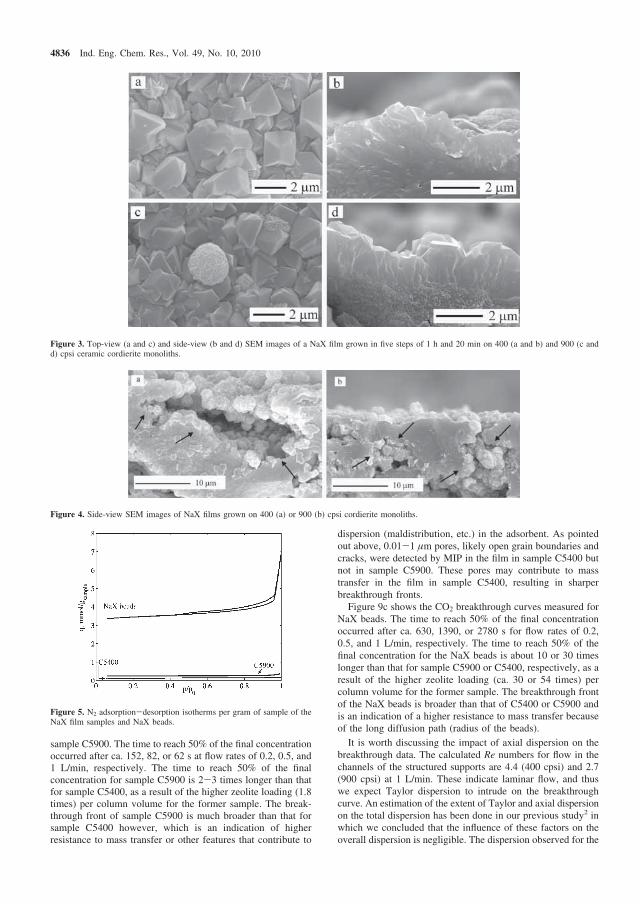
sample C5900. The time to reach 50% of the final concentrationoccurred after ca. 152, 82, or 62 s at flow rates of 0.2, 0.5, and1 L/min, respectively. The time to reach 50% of the finalconcentration for sample C5900 is 2-3 times longer than thatfor sample C5400, as a result of the higher zeolite loading (1.8times) per column volume for the former sample. The break-through front of sample C5900 is much broader than that forsample C5400 however, which is an indication of higherresistance to mass transfer or other features that contribute to
dispersion (maldistribution, etc.) in the adsorbent. As pointedout above, 0.01-1 μm pores, likely open grain boundaries andcracks, were detected by MIP in the film in sample C5400 butnot in sample C5900. These pores may contribute to masstransfer in the film in sample C5400, resulting in sharperbreakthrough fronts.
Figure 9c shows the CO2 breakthrough curves measured forNaX beads. The time to reach 50% of the final concentrationoccurred after ca. 630, 1390, or 2780 s for flow rates of 0.2,0.5, and 1 L/min, respectively. The time to reach 50% of thefinal concentration for the NaX beads is about 10 or 30 timeslonger than that for sample C5900 or C5400, respectively, as aresult of the higher zeolite loading (ca. 30 or 54 times) percolumn volume for the former sample. The breakthrough frontof the NaX beads is broader than that of C5400 or C5900 andis an indication of a higher resistance to mass transfer becauseof the long diffusion path (radius of the beads).
It is worth discussing the impact of axial dispersion on thebreakthrough data. The calculated Re numbers for flow in thechannels of the structured supports are 4.4 (400 cpsi) and 2.7(900 cpsi) at 1 L/min. These indicate laminar flow, and thuswe expect Taylor dispersion to intrude on the breakthroughcurve. An estimation of the extent of Taylor and axial dispersionon the total dispersion has been done in our previous study2 inwhich we concluded that the influence of these factors on theoverall dispersion is negligible. The dispersion observed for the
Figure 3. Top-view (a and c) and side-view (b and d) SEM images of a NaX film grown in five steps of 1 h and 20 min on 400 (a and b) and 900 (c andd) cpsi ceramic cordierite monoliths.
Figure 4. Side-view SEM images of NaX films grown on 400 (a) or 900 (b) cpsi cordierite monoliths.
Figure 5. N2 adsorption-desorption isotherms per gram of sample of theNaX film samples and NaX beads.
4836 Ind. Eng. Chem. Res., Vol. 49, No. 10, 2010

900 cpsi structured adsorbent can therefore be attributed to mass-transfer resistance or perhaps maldistribution of the gas intothe channels. If a 900 cpsi structured adsorbent with mass-transfer resistance and flow distribution similar to the those ofa 400 cpsi structured adsorbent could be prepared, it wouldrepresent a better or an “ideal” monolithic adsorbent. This“ideal” 900 cpsi adsorbent was simulated in the study describedbelow.
4.2. Process Simulation Results. In order to ensure that thesimulation parameters were chosen correctly and the simulationsmimic the real system, benchmarking against the experimentalbreakthrough curves for sample C5400 was first performed. Theoverall mass-transfer coefficient k400 for the C5400 adsorbentwas first determined by fitting of the breakthrough data; seeFigure 10a. This figure illustrates that the model can describeexperimental data adequately. Because the breakthrough dataof the C5900 adsorbent were not indicative of an “ideal”adsorbent (as discussed above), we have chosen to simulate the“ideal” 900 cpsi adsorbent. The overall mass-transfer coefficientk900 for the ideal 900 cpsi adsorbent was estimated using ourexpression for monoliths developed earlier:2
where W and d are the wall thickness and channel width of themonolith (as depicted in Figure 1b), kf is external gas film mass-
transfer coefficient calculated from correlations presented earlier2
for laminar flow in the monolithic channels, and De is theeffective diffusivity. After estimation of the mass-transfercoefficient k900, it was then employed in the simulations to modelthe breakthrough front of the ideal 900 cpsi adsorbent; see Figure10b.
The process cycle time in semibatch-type processes such asPSA and VSA is an important parameter determining theadsorbent volume and total size of the adsorber. Shorter cycles,on the one hand, give rise to higher throughputs for the sameamount of adsorbent; on the other hand, cycles which are tooshort may lead to insufficient time for adsorption because ofmass-transfer limitations. To investigate the impact of theadsorbent geometry on the VSA performance at different cycletimes, a series of simulations were conducted for a feedtemperature of 27.7 °C and a feed pressure of 1.2 bar for athree-step cycle (Figure 1a).
The product purity is calculated as the ratio of CO2 to totalflow obtained in the desorption gas during step 2 of the cycle.Figure 11 shows that the product purity obtained with the packedbeds is higher than that for the 900 and 400 cpsi structuredadsorbents. This can be attributed to the higher voidage andlower zeolite loadings in the monolithic structures. The channelvoids in the structured adsorbents lead to significant contamina-tion of the product with N2. Figure 11 also shows that for all
Figure 6. Mercury-intrusion pore-volume distribution for the NaX filmsamples.
1k900
) d4kf
+Wd[1 - 1
d + W(d3 + W6 )]
8De(3)
Figure 7. CO2 isotherms per gram of sample at 0, 20, or 40 °C of NaXfilm samples (a) and NaX beads (b). C5400, C5900, and NaX beads arelabeled by the symbols 0, O, and b, respectively.
Ind. Eng. Chem. Res., Vol. 49, No. 10, 2010 4837
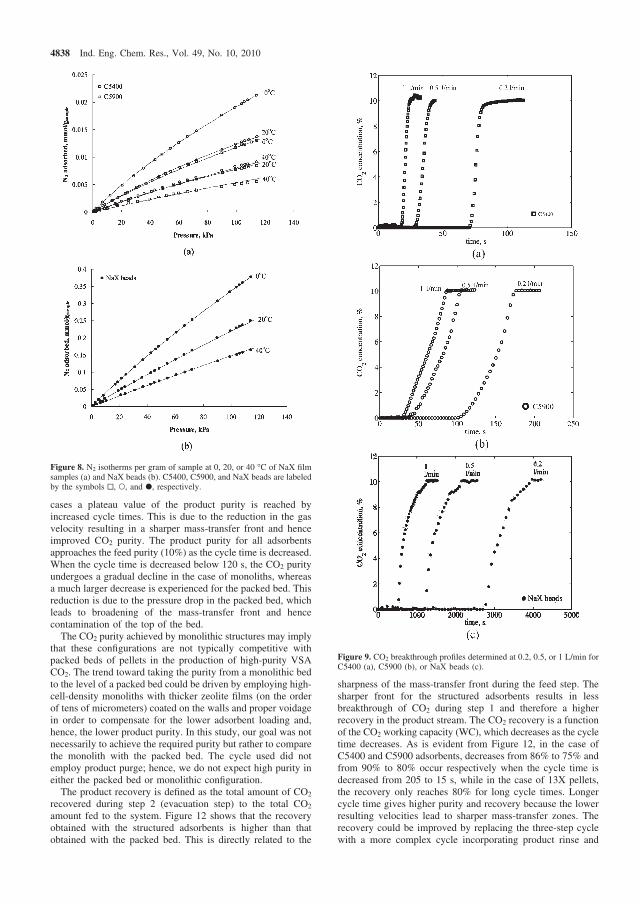
cases a plateau value of the product purity is reached byincreased cycle times. This is due to the reduction in the gasvelocity resulting in a sharper mass-transfer front and henceimproved CO2 purity. The product purity for all adsorbentsapproaches the feed purity (10%) as the cycle time is decreased.When the cycle time is decreased below 120 s, the CO2 purityundergoes a gradual decline in the case of monoliths, whereasa much larger decrease is experienced for the packed bed. Thisreduction is due to the pressure drop in the packed bed, whichleads to broadening of the mass-transfer front and hencecontamination of the top of the bed.
The CO2 purity achieved by monolithic structures may implythat these configurations are not typically competitive withpacked beds of pellets in the production of high-purity VSACO2. The trend toward taking the purity from a monolithic bedto the level of a packed bed could be driven by employing high-cell-density monoliths with thicker zeolite films (on the orderof tens of micrometers) coated on the walls and proper voidagein order to compensate for the lower adsorbent loading and,hence, the lower product purity. In this study, our goal was notnecessarily to achieve the required purity but rather to comparethe monolith with the packed bed. The cycle used did notemploy product purge; hence, we do not expect high purity ineither the packed bed or monolithic configuration.
The product recovery is defined as the total amount of CO2
recovered during step 2 (evacuation step) to the total CO2
amount fed to the system. Figure 12 shows that the recoveryobtained with the structured adsorbents is higher than thatobtained with the packed bed. This is directly related to the
sharpness of the mass-transfer front during the feed step. Thesharper front for the structured adsorbents results in lessbreakthrough of CO2 during step 1 and therefore a higherrecovery in the product stream. The CO2 recovery is a functionof the CO2 working capacity (WC), which decreases as the cycletime decreases. As is evident from Figure 12, in the case ofC5400 and C5900 adsorbents, decreases from 86% to 75% andfrom 90% to 80% occur respectively when the cycle time isdecreased from 205 to 15 s, while in the case of 13X pellets,the recovery only reaches 80% for long cycle times. Longercycle time gives higher purity and recovery because the lowerresulting velocities lead to sharper mass-transfer zones. Therecovery could be improved by replacing the three-step cyclewith a more complex cycle incorporating product rinse and
Figure 8. N2 isotherms per gram of sample at 0, 20, or 40 °C of NaX filmsamples (a) and NaX beads (b). C5400, C5900, and NaX beads are labeledby the symbols 0, O, and b, respectively.
Figure 9. CO2 breakthrough profiles determined at 0.2, 0.5, or 1 L/min forC5400 (a), C5900 (b), or NaX beads (c).
4838 Ind. Eng. Chem. Res., Vol. 49, No. 10, 2010

pressure equalization. However, the scope of the present workwas not to optimize the system performance but rather to exploreand illustrate the advantages and disadvantages of structuredadsorbents versus conventional adsorbent beads.
The specific productivity (throughput) of the adsorbents atdifferent cycle times is presented in Figure 13. The throughputattainable in a given volume of the vessel in a cyclic adsorptionsystem may be expressed as
where WC is the adsorbent working capacity (mol/kgadsorbent/cycle), mads is the mass of the adsorbent, τ is the cycle time(s/cycle), and f is a proportionality constant. As expected, all threeadsorbents displayed a hyperbolic pattern for productivity as afunction of the cycle time, as suggested by the above equation.The throughput is highest for a packed bed because of the higherzeolite loading per unit volume. However, the structured adsorbentsfollow the expected inverse trend of productivity and cycle timemore closely that the packed bed, also at very short cycle times. Itis clear that dispersive effects of the pressure drop and mass transferare becoming more important at shorter cycle times for the packedbed. Cycle times below 15 s eventually lead to a drop in thethroughput for the packed bed, as observed in Figure 13 and alsoobserved in our earlier studies.31 Thus, the structured adsorbentsshow promising performance at short cycle times provided thathigher zeolite loadings can be obtained.
Parts a-c of Figure 14 illustrate simulated pressure profiles ofthree adsorbents for a 25 s cycle time at z ) 0 (inlet) and z ) 1(outlet). As is clearly shown, both types of monoliths showedidentical profiles at the inlet (z ) 0) and outlet (z ) 1) of theadsorption column, indicating a negligible pressure drop along the
Figure 10. Comparison of the CO2 breakthrough front of C5400 at 1 L/minwith that of an ideal profile of sample C5900 (a). Comparison of theexperimental and simulated CO2 breakthrough fronts of sample C5900 (b).
Figure 11. Product purity as a function of the cycle time for differentadsorbents.
Figure 12. Product recovery as a function of the cycle time for differentadsorbents.
Figure 13. System productivity as a function of the cycle time for differentadsorbents.
through put (TPD) ∝ gas productioncycle × mads
cycleday
specific productivity ) fWC
τ
Ind. Eng. Chem. Res., Vol. 49, No. 10, 2010 4839

bed; however, running a PSA cycle with a bed of granules givesrise to considerable pressure drop characterized by different curvesat the inlet and outlet of the bed (Figure 14a).
5. Conclusion
Structured adsorbents were prepared by growing uniform NaXfilms on ceramic cordierite monoliths with the two differentcell densities. The performance of the structured adsorbents in
a VSA process for CO2 capture was evaluated and comparedwith conventional adsorbent beads by mathematical modeling.We found that a CO2 product purity of greater than 30% and arecovery of 90% is achievable with an ideal 900 cpsi monolithicadsorbent in a three-step VSA cycle. Although beads showed abetter performance in terms of purity and throughput at longercycle times, at shorter cycle times, structured adsorbents mayshow less effect of the pressure drop and hence lead to improvedproduct recovery, purity, and throughput. In summary, ourresults indicate that structured adsorbents are good candidatesfor use in rapid cycles when the system performance iscompromised by using conventional beads. It is clear, however,that every effort must be made to increase the zeolite loadingwithout compromising the effective mass transfer. Our futurework will examine the performance of adsorbent monoliths withhigher cell density (1200 cpsi) with improved synthesis condi-tions in VSA processes.
Acknowledgment
The authors acknowledge the Monash Research GraduateSchool for providing scholarship support for F.R. and the Ph.D.Polis Project at Luleå University of Technology for supportingA.M.
Appendix
Notationbi ) dual-site Langmuir isotherm constantCv ) dimensionless structural parameter within the effective
diffusion coefficient related to viscous flowdi ) dual-site Langmuir isotherm constantd ) channel width, μmDe ) effective diffusivity, cm2/sf ) proportionality equation constantk400, k900 ) total mass-transfer coefficient for 400 and 900 cpsi
monoliths, 1/skf ) external gas film mass-transfer coefficients, cm/ski ) mass-transfer coefficient, 1/sL0 ) parameter for rescaling zreal
mi ) dual-site Langmuir isotherm constantni ) dual-site Langmuir isotherm constantn ) adsorbent loading, mol/kgni* ) equilibrium adsorbent loading, mol/kgp ) pressure, barP1a ) partial pressure of CO2, barP2a ) partial pressure of N2, barq1a ) flow rate of CO2, m3/hq2a ) flow rate of N2, m3/hQ1 ) heat of adsorption of CO2, J/molQ2 ) heat of adsorption of N2, J/molqs ) superficial flow rate, m3/hR ) gas constantSg ) gas entropy, J/mol ·Kτ ) cycle time, st ) temporal coordinate, sT ) temperature, KV0 ) parameter for rescaling Vreal
V ) interstitial velocity, m/sW ) channel wall thickness, μmWC ) working capacityy ) mole fractionz ) spatial coordinate, mFb ) bulk density, kg/m3
Fgas ) density of gas, mol/m3
Figure 14. Simulated pressure histories for (a) 13X adsorbent, (b) C5400,and (c) C5900 as a function of the time during a single cycle at the top andbottom of the column.
4840 Ind. Eng. Chem. Res., Vol. 49, No. 10, 2010
εb ) bed voidageεt ) total voidage
Literature Cited
(1) Rezaei, F.; Webley, P. A. Application of structured adsorbents ingas separation Processes. Sep. Sci. Technol. 2010, 70, 243.
(2) Rezaei, F.; Webley, P. A. Optimization of structured adsorbents forgas separation. Chem. Eng. Sci. 2009, 64, 5182.
(3) Kodama, A.; Goto, M.; Hirose, T.; Kuma, T. Experimental study ofoptimal operation for a honeycomb adsorber operated with thermal swing.J. Chem. Eng. Jpn. 1993, 26, 530.
(4) Maurer, R. T. Spiral-wound adsorber module. U.S. Patent 5,338,450,1994.
(5) Gadkaree, K. P. System and method for adsorbing contaminants andregenerating the adsorber. U.S. Patent 5,658,372, 1997.
(6) Li, Y. Y.; Perera, S. P.; Crittenden, B. D. Zeolite monoliths for airseparation, part 2: Oxygen enrichment, pressure drop and pressurization.Chemical Engineering Research and Design 1998, 76 (A8), 931.
(7) Golden, T. C.; Golden, C. M. A.; Zwilling, D. P. Self-supportingabsorbent fabric for gas separation. U.S. Patent 6,565,627, 2003.
(8) Brandani, F.; Rouse, A.; Brandani, S.; Ruthven, D. M. Adsorptionkinetics and dynamic behavior of a carbon monolith. Adsorption 2004, 10,99.
(9) Keefer, B. G.; Carel, A.; Sellars, B.; Shaw, I.; Larisch, B. Adsorbentlaminate structures. U.S. Patent 6,692,626, 2004.
(10) Sawad, J. A.; Alizadeh-Khiavi, S.; Roy, S.; Kuznicki, S. M. Highdensity adsorbent structures. W.I.P.O. Patent WO2005032694, 2005.
(11) Golden, T. C.; Golden, C. M. A.; Battavio, P. J. Multilayeredadsorbent system for gas separations by pressure swing adsorption. U.S.Patent 6,893,483, 2005.
(12) Zabka, M.; Minceva, M.; Rodrigues, A. E. Experimental andmodeling study of adsorption in preparative monolithic silica column.Chemical Engineering and Processing 2005, 45 (2), 150.
(13) Grande, C. A.; Cavenati, S.; Barcia, P.; Hammer, J.; Fritz, H. G.;Rodrigues, A. E. Adsorption of propane and propylene in zeolite 4Ahoneycomb monolith. Chem. Eng. Sci. 2006, 61, 3053.
(14) Rode, E. J.; Boulet, A. J. J.; Pelman, A. M.; Babicki, M. L.; Keefer,B.; Sawada, J. A.; Alizadeh-Khiavi, S.; Roy, S.; Gibbs, A. C.; Kuznicki,S. M. Engineered adsorbent structures for kinetic separation. W.I.P.O. PatentWO200660743432, 2007.
(15) Grande, C. A.; Ribeiro, R. P. P. L.; Rodrigues, A. E. CO2 capturefrom NGCC power stations using Electric Swing. Energy Fuels 2009, 23,2797.
(16) Li, L.; Xue, B.; Chen, J.; Guan, N.; Zhang, F.; Liu, D.; Feng, H.Direct synthesis of zeolite coatings on cordierite supports by in situhydrothermal method. Appl. Catal., A 2005, 292, 312.
(17) Lee, L. Y.; Perera, S. P.; Crittenden, B. D.; Kolaczkowski, S. T.Manufacture and characterisation of silicalite monoliths. Adsorpt. Sci.Technol. 2000, 18, 147.
(18) Yu, F. D.; Luo, L. A.; Grevillot, G. Adsorbption isotherms of VOCsonto an activated carbon monolith: Experimental measurement and cor-relation with different models. J. Chem. Eng. Data 2002, 47, 467.
(19) Yates, M.; Blanco, J.; Martin-Luengo, M. A.; Martin, M. P. Vapouradsorption capacity of controlled porosity honeycomb monoliths. Mi-croporous Mesoporous Mater. 2003, 65, 219.
(20) Ohrman, O.; Hedlund, J.; Sterte, J. Appl. Catal., A 2004, 270, 193.
(21) Hedlund, J.; Ohrman, O.; Msimang, V.; Moller, K.; Steen, E. V. W.;Bohringer, W.; Sibya, S. The synthesis and testing of thin film ZSM-5catalysts. Chem. Eng. Sci. 2004, 59, 2647.
(22) Mosca, A.; Hedlund, J.; Ridha, F. N.; Webley, P. Optimization ofsynthesis procedures for structured PSA adsorbents. Adsorption 2008, 14,687.
(23) Mosca, A.; Hedlund, J.; Webley, P.; Grahna, M.; Rezaei, F.Structured zeolite nax coatings on ceramic cordierite monolith supports forPSA applications. Microporous Mesoporous Mater. 2009 doi:10.1016/j.micromeso.2009.10.010.
(24) Mosca, A.; Hedlund, J.; Ohrman, O.; Perdana, I.; Creaser, D.Microporous Mesoporous Mater. 2009, 120, 195.
(25) Engstrom, V.; Mihailova, B.; Hedlund, J.; Holmgren, A.; Sterte, J.The effect of seed size on the growth of silicalite-1 films on gold surfaces.Microporous Mesoporous Mater. 2000, 38, 51.
(26) Hedlund, J. Control of the preferred orientation in MFI filmssynthesized by seeding. J. Porous Mater. 2000, 7, 455.
(27) Hedlund, J.; Mintova, S.; Sterte, J. Controlling the preferredorientation in silicalite-1 films synthesized by seeding. MicroporousMesoporous Mater. 1999, 28, 185.
(28) Hedlund, J.; Jareman, F. Texture of MFI films grown from seeds.Current Opinion in Colloid & Interface Science; Elsevier: New York, 2005;Vol. 10, issues 5-6, pp 226-232.
(29) Webley, P. A.; He, J. Fast solution-adaptive finite volume methodfor PSA/VSA cycle simulation; 1 single step simulation. Comput. Chem.Eng. 2001, 23, 1701.
(30) Todd, R. S.; Ferraris, G. B.; Manca, D.; Webley, P. A ImprovedODE integrator and mass transfer approach for simulating a cyclic adsorptionprocess. Comput. Chem. Eng. 2003, 27, 883.
(31) Zhang, J.; Xiao, P.; Webley, P. A. Cycle development and designfor CO2 capture from flue gas by vacuum swing adsorption. EnViron. Sci.Technol. 2008, 42, 563.
(32) Todd, R. S.; Webley, P. A. Mass-transfer models for rapid pressureswing adsorption simulation. AIChE J. 2006, 52, 3126.
(33) Breck, D. W. Zeolite molecular sieVes: structure, chemistry anduse; Krieger Publishing Company: Malabar, FL, 1984; p 771.
(34) Yamamoto, T. A.; Piluck, E. A.; Seong-Ick, K.; Takao, O.Preparation and characterization of cobalt cation-exchanged NaX zeoliteas catalyst for wastewater treatment. J. Ind. Eng. Chem. 2007, 137, 1142.
(35) Ruthven, D. M. Principles of Adsorption and Adsorption Processes;John Wiley & Sons, Inc.: New York, 1984; p 243.
(36) Auerbach, S. M.; Carrado, K. A.; Dutta, P. K. Handbook of zeolitescience and technology; Marcel Dekker, Inc.: New York, 2003; p 1204.
(37) Todd, R. S.; Webley, P. A. Mass-transfer models for rapid pressureswing adsorption simulation. AIChE J. 2006, 52, 3126.
(38) Caro, J.; Albrecht, D.; Noack, M. Why is it so extremely difficultto prepare shape-selective Al-rich zeolite membranes like LTA and FAUfor gas separation. Sep. Purif. Technol. 2009, 66, 143.
(39) Noack, M.; Kolsch, P.; Dittmar, A.; Stohr, M.; Georgi, G.;Schneider, M.; Dingerdissen, U.; Feldhoff, A.; Caro, J. Proof of the ISS-concept for LTA and FAU membranes and their characterization byextended gas permeation studies. Microporous Mesoporous Mater. 2007,102, 1.
ReceiVed for reView October 24, 2009ReVised manuscript receiVed January 30, 2010
Accepted March 4, 2010
IE9016545
Ind. Eng. Chem. Res., Vol. 49, No. 10, 2010 4841
PAPER E
The effect of wall porosity and zeolite film thickness on the dynamic behavior of
adsorbents in the form of coated monoliths
Authors:F. Rezaei, A. Mosca, J. Hedlund, P. Webley, M. Grahn, J. Mouzon
Submitted to Separation and Purification Technology
105

106 PAPER E
The effect of wall porosity and zeolite film thickness on the dynamic behavior of adsorbents in the form of coated monoliths
F. Rezaei a,b, A. Mosca a , J. Hedlund a, P.A. Webley b, M. Grahn a, J. Mouzon a aDiv. of Chemical Technology, Luleå University of Technology, SE-97187, Luleå, Sweden
bDept. of Chemical Engineering, Monash University, Clayton, VIC-3800, Australia *Corresponding author. Tel.: +46 920 492986, Fax: +46 920 491199
E-mail: [email protected]
Abstract
The effects of wall porosity, channel width distribution and zeolite film thickness on the
performance of 400 and 1200 cells per square inch (cpsi) cordierite monoliths coated with zeolite X
films with thicknesses of 1.5 and 2.5 μm were examined. To investigate the effect of wall porosity
and restrict growth of zeolite to the external surface of the monolith channels, the macro pores in the
walls of the 1200 cpsi cordierite monoliths were filled with colloidal -alumina particles. The
adsorbents were characterized by SEM, MIP and carbon dioxide breakthrough experiments and a
mathematical model describing the diffusion and adsorption in the system was fitted to the data. The
model accounted for carbon dioxide uptake by filling the pores in the support by carbon dioxide gas
and adsorption of carbon dioxide on cordierite, alumina and zeolite. The model indicates that the
uptake of carbon dioxide by adsorption on cordierite is much slower than by pore filling and too
slow to influence the very fast breakthrough experiments with monoliths without zeolite film that are
over in less than 1 minute. It was shown that the pores in the cordierite monolith result in dispersion
by pore filling with carbon dioxide gas, not adsorption, and the model indicated that the use of
monoliths with lower wall porosity would lead to less dispersion and thereby better performance of
structured adsorbents. When the pores of the monolith were filled with alumina, the pore size was
reduced and a lower diffusion coefficient for pore filling and some adsorption on -alumina was
observed as expected. The channel width distribution and the wall thickness distribution of the
monoliths were very narrow and did not result in any broadening of the CO2 breakthrough front.
Monoliths were coated with films with thicknesses of 1.5 and 2.5 μm and significant adsorption
capacity, roughly proportional to the film thickness, was observed. The CO2 adsorption capacity of a
1200 cpsi monolith coated with a 2.5 μm film was 0.13 mmol/cm3 adsorbent, which should be
compared to the adsorption capacity of zeolite X beads, which is about 2.3 mmol/cm3 adsorbent. To
increase adsorption capacity of a non-porous zeolite coated monolith, film thickness could be
increased. The model indicated that the film thickness could be increased up to about 10 μm without
107
increasing the dispersion and thereby approach the adsorption capacity for beads. However,
simulation of the whole cycle must be performed in order to find the optimum film thickness for a
real cyclic process. This work has lead to better understanding of the role of the support porosity and
pore size distribution and film thickness for coated monolith adsorbents.
Keywords: Breakthrough front; Zeolite film thickness; Monolith wall porosity; CO2 adsorption
1. Introduction
Novel adsorbents with superior characteristics compared to traditional adsorbents may improve
adsorptive gas separation processes significantly. In cyclic adsorption processes, such as pressure
swing adsorption (PSA) and temperature swing adsorption (TSA), reducing cycle time is the primary
means of achieving a higher production. However, as cycle time is reduced, cyclic processes usually
face several problems viz. decreased working capacity per cycle for the component of interest,
decreasing product recovery and increasing pressure drop. The extent to which reduced cycle time
reduces working capacity and recovery and increases pressure drop is highly dependent on the
structure of the adsorbent [1].
The remarkable advantages of structured adsorbents in the form of parallel channel structures
with controllable shape, cell density and wall thickness for their use in adsorption based gas
separation systems have been reported by many researchers [2-9]. A detailed review of these
alternate structures and their merits was recently conducted by Rezaei and Webley [1].
Although the unique structure of a parallel channel monolith (continuous body with identical
parallel channels) significantly reduces the common problems of conventional adsorbents (i.e.
fluidization, high pressure drop, etc.), adsorbents with this structure often have low loading of active
adsorbent material per column volume because of the high void volume [10]. In monolith
adsorbents, the active adsorbent may be presented to the flowing gas in two different ways. In the
first approach, the active adsorbent material is directly extruded in the form of a parallel channel
monolith as in carbon monoliths [11]. In the second approach, the parallel channel monolith only
108
acts as a mechanical support for a film of the adsorbent. Thin films may be deposited on supports by
various methods, namely, dip-coating, wash-coating, or slip-coating [12]. Our group has developed a
method for film growth on supports since 1995. The method was first described in a conference [13]
and since then, films have been prepared and evaluated as membranes [14], sensors [15] catalysts
[16] and adsorbents [17]. We have also explored the possibilities to grow films on monolith supports
[18]. Increased thickness of the adsorbent film improves adsorbent capacity in one hand but
increases the diffusion path length [16] on the other hand; hence optimization of these opposing
variables is needed in order to find the most advantageous film thickness.
Among the considerable research work being reported so far on the development of monolithic
adsorbents for gas separation applications, little attention has been paid to find the optimum
structure. Although it is well-established that a monolith with high cell density and thin walls would
result in better performance, the role of other important parameters such as monolith wall porosity
and pore size distribution in the monolith on overall separation efficiency has rarely been
investigated. For applications in which the adsorbent is fabricated by coating a layer of active
adsorbent on the surface of the support, the thickness of the film is another important factor that
needs to be taken into account while optimizing the process.
In our previous works [10,19,20] for zeolite coated monoliths with a cell density of 400 cpsi,
one lumped mass transfer resistance was considered and the model proved successful for describing
the kinetics of CO2 adsorption. However, as we prepared and tested coated monoliths with cell
densities exceeding 400 cpsi, it was evident from experimental data that the monolith support itself
dispersed the gas flow significantly. The aim of the present work is therefore to experimentally and
theoretically investigate the impact of monolith wall porosity, channel width distribution and zeolite
film thickness on the dynamic behaviour of zeolite coated 400 and 1200 cpsi monolith adsorbents
for CO2 adsorption. A more detailed model, accounting for adsorption and mass transfer in both the
zeolite film and the monolith wall was developed and fitted to the experimental data.
109

2. Experimental
2.1 Preparation of adsorbents
Cordierite monoliths with cell densities of 400 cpsi were obtained from Corning. Faujasite films
with a thickness of about 1.5 μm were grown on these supports as described in detail previously
[10,19,20]. In brief, faujasite crystals with a size of about 80 nm were first deposited in a monolayer
on the monolith. In the next step, these crystals were grown to a continuous film with a thickness of
about 1.5 μm using 5 synthesis steps in a clear synthesis solution with a molar composition of
73Na2O:Al2O3:8SiO2:4550H2O. Cordierite monoliths with a cell density of 1200 cpsi were obtained
from NGK. To minimize wall porosity and growth of zeolite in the pores in the walls of the 1200
cpsi monoliths, these were impregnated with colloidal alumina particles prior to film growth. A
slurry was first prepared by milling 58 wt% Al2O3 powder having a particle size of 0.4 μm ( -
alumina A16-SG, Alcoa Chemical Co.), 39 wt% distilled H2O and 3 wt% dispersant (Dispex® A40,
Ciba) in a glass bottle with agate balls (zirconium oxide) for 2 h. The monolith was treated with
cationic polymer solution [10,19,20] and then kept horizontally under rotation for 1 minute in the
slurry. The excess slurry in the channels was then removed by flushing with a controlled air-flow.
This procedure was repeated 3 times to obtain a homogeneous pore filling with alumina. The
impregnated monolith was dried and then kept at 1200 ºC for 4 h, with a heating and cooling rate of
5 ºC/min, in order to increase the stability of the alumina, and to avoid redispersion of alumina
particles during zeolite film growth. Films with a thickness of about 1.5 and 2.5 μm were grown on
the 1200 cpsi monoliths using five or ten synthesis steps, respectively, in a similar way as for the 400
cpsi monoliths [10,19,20]. However, it was necessary to use a synthesis solution with higher alumina
concentration to reduce the formation of zeolite P crystals that formed in this system, as a result of
more extensive zeolite growth on the 1200 cpsi monoliths, which resulted in a depletion of
aluminum in the synthesis mixture. The molar composition of this synthesis mixture was
73Na2O:1.1Al2O3:8SiO2:4550H2O. The sample codes used here for coated monoliths start with a
110
number (viz. 400 or 1200) indicating the cell density of the support, followed by letters Al in the
case of 1200 cpsi monoliths describing the pore filling of monolith walls by alumina, and a number
indicating the thickness of the zeolite coating.
2.2 Morphological characterization of adsorbents
The morphology of the adsorbents were characterized by scanning electron microscopy (SEM)
with a Philips XL30 microscope, N2 adsorption at 77 K using a Micromeritics ASAP2010
instrument, and mercury intrusion porosimetry (MIP) using a Micromeritics Autopore 9220V1.04
instrument. The weight gain (gzeolite/gsample) was determined by weighing the support before and after
hydrothermal treatment. Image analysis of 100 low magnification SEM images recorded using a FEI
Magellan 400 instrument, was used to estimate channel width and wall thickness distributions of
monolith samples. Images were brought together in such a way that neither overlapping nor gap
appeared between them.
2.3 Breakthrough experiments
The adsorbents were also characterized by measuring the CO2 breakthrough profile with step
change experiments similar to those described in our previous work [19]. In these experiments,
three monolith samples, each 10 cm long and 2 cm in diameter were loaded in series in the
adsorption column (30 cm long and 2 cm diameter). The samples were activated under a nitrogen
flow of 0.2 l/min at 300 ºC for 3 hours with a heating and cooling rate of 2 ºC/min. The samples
were thereafter cooled to room temperature (26 ºC).
3. Numerical simulation
In the model developed here for uncoated monoliths, gas transport in the monolith walls was
modeled considering a single cylindrical channel with two layers accounting for half of the monolith
channel and half of the channel wall (Figure 1 (a)). As the monolith supports were porous, some CO2
will diffuse into these pores during the experiments thus representing a form of uptake by pore
filling. In addition, CO2 may be adsorbed onto the walls of the support as well as onto the alumina
111
particles present in the pores of the 1200 cpsi+Al sample. For zeolite coated monoliths, a model
involving three layers, accounting for half of the monolith channel, the zeolite film and half of the
channel wall with/without alumina particles, as depicted in Figure 1 (b) was used. As will be
discussed below, the uptake in the zeolite film and in the monolith wall occur in parallel in the three-
layer model. A simplified mathematical model considering axially dispersed plug flow was
employed to describe the flow in the monolith. The component mass balance in the gas phase is
given by
tq
zCU
zCD
tC
sL1
2
2
(1)
where C and q are the adsorbate concentration in gas and solid phases; U is the superficial fluid
velocity; DL is the axial dispersion coefficient, is monolith void fraction and s is adsorbent density.
The component mass balance in the solid phase, i.e. the zeolite and/or alumina particles, is expressed
by
qqktq
i * (2)
where ki is the mass transfer coefficient expressed by 23
i
ii l
Dk , Di is the diffusivity and li is the
characteristic diffusion length (zeolite film thickness and half wall thickness for the zeolite and
alumina adsorption, respectively), where index i=z refers to the zeolite film, index i=w refers to
monolith wall or for the 1200 cpsi+Al sample, monolith wall and alumina particles. To account for
gas uptake due to pore filling in gas phase in the voids of the monolith wall, a modified version of
equation (2) was used for the adsorbate mass balance in the monolith wall with Dp (p refers to pore
filling) as variable and was taken as
CCaktq
p (3)
112
where C is adsorbate concentration in the pores of the monolith wall and a is the specific pore
volume (pores in the wall) (cm3/gadsorbent) of the support. For the monolith samples, where CO2 may
both fill the pores of the support walls and be adsorbed onto the wall (and for the 1200 cpsi+Al
sample also be adsorbed onto the alumina particles), a combination of equations (2) and (3)
accounting for both pore filling and adsorption mechanisms was used to model the breakthrough
fronts of the supports. For the samples coated with a zeolite film, simulation was then performed
using the three-layer model where uptake was considered to take place in zeolite film, alumina
particles (for supports filled with alumina) and in the voids of the support in parallel. Equation (2)
was employed to calculate the component mass balance in zeolite film and as explained before, a
combination of both equations (2) and (3) were used for mass balance in the support. The
assumption that the uptake in the zeolite film and in the support (pore filling and adsorption by
alumina) occurs in parallel is justified by the presence of open grain boundaries and cracks in the
zeolite film as shown earlier [10,16,18-20]. In open grain boundaries and cracks, the diffusivity is
much higher than in the zeolite pores, which should result in parallel uptake processes.
For the uncoated 400 cpsi and 1200 cpsi monoliths, pore filling was assumed to occur by
molecular diffusion and the diffusion coefficient was estimated using the Chapman-Enskog
equation. For the 1200 cpsi+Al sample, pore filling by Knudsen diffusion was assumed since the
pore size between alumina particles was about 100 nm. For all samples kw in equation 2 was then
fitted to experimental data using equations 1-3. For the zeolite coated samples, the mass transfer
coefficients kw and kp determined for the monolith walls previously were kept constant and kz was
determined by fitting the three-layer model to experimental breakthrough data for zeolite coated
monoliths using equations 1-3.
The initial and boundary conditions for a breakthrough experiment are
C (t = 0) = 0, q (t = 0) = 0, C (t = 0) = 0, (4)
00
0zz
CC (5)
113

0Lzz
C (6)
The CO2 adsorption in the zeolite film was assumed to follow a linear isotherm with the equilibrium
constant, K, taken from the CO2 adsorption isotherm at low pressures (up to 10 kPa) [21]. The
program COMSOL 3.5a was used to fit ki to the experimental breakthrough data. The conservation
equations were solved using the Lagrange Quadratic Finite Element Method (LQFEM), with a total
number of 6960 elements. To confirm that numerical dispersion was not affecting the results, the
simulations were routinely tested with twice as many elements with no change in results.
The flow in each channel was modeled based on the channel width distribution determined by
SEM. The interstitial velocity was considered constant along the channel and calculated based on the
monolith porosity (as was estimated using the total number of channels for different cell densities
and the volume occupied by channels) for a given superficial velocity.
4. Results and Discussion
4.1 Physical characterization
For monoliths, a broad channel width distribution will cause flow mal-distribution, as pointed
out by Ahn and Brandani [22] and a wall thickness distribution introduces a range of diffusional time
constants giving rise to a broader breakthrough front. To determine these distributions for our 1200
cpsi cordierite monoliths, low magnification SEM images were recorded and channel and wall
widths were determined by image analysis. Figure 2 (a) shows the channel width distribution and
Figure 2 (b) the wall thickness distribution. The results show that both channel width and wall
thickness display quite narrow distributions. The average channel width is 701 μm with a standard
deviation of 7 μm. The average wall thickness is 55.6 μm with a standard deviation of 2.7 μm. The
channels and walls are thus very homogeneous in size and thickness, respectively. In Table 1, the
geometrical properties corresponding to each sample are presented.
Figure 3 (a) shows a top-view SEM image of a 1200 cpsi cordierite monolith impregnated with
alumina particles and heated to 1200 °C. The alumina coating consists of a layer of particles with an
114
average size of 400 nm. Most of the pores of the support are filled with alumina, as indicated by
arrows in Figure 3 (b), which will suppress growth of zeolite in the pores of the support. This is quite
important since growth of zeolite in the support pores would lead to long diffusion paths in the
zeolite, which would result in reduced performance of the adsorbent.
Figure 4 (a) shows a top-view SEM image of a zeolite film grown on the impregnated 1200
cpsi cordierite monolith using five synthesis steps. The film appears to be rather well intergrown and
zeolite X crystals with typical octahedral habit are observed. A few zeolite P crystals with a typical
ball of yarn habit are also observed. Figure 4 (b) shows a cross-sectional image of the film grown
using five synthesis steps, illustrating that the thickness of the zeolite film is about 1.5 m. Figure 4
(c) and (d) show corresponding images of the film grown using ten synthesis steps. This sample
appears similar as the one grown for five steps with the main differences that the observed crystals
are larger and that the film thickness is about 2.5 m. The cross sectional images illustrate that film
growth is mostly occurring on the external surface of the alumina impregnated monoliths, which
results in minimum diffusion paths in the zeolite. As we have shown before [20], growth of zeolite
occurred in the macropores of the 400 cpsi sample.
Table 2 shows the weight gain, BET surface area and zeolite loading (determined from
nitrogen adsorption data as in previous works [10, 20]) for all adsorbent samples. Mostly the weight
gain is discussed here since these three parameters follow the same trend for all samples. The weight
gain is caused by deposition of zeolite on the samples, which in turn leads to increased surface area
and zeolite loading. The weight gain for the 400 cpsi monolith coated with a 1.5 μm film is
comparable to the weight gain for the 1200 cpsi monolith coated with alumina and a 1.5 μm film.
This illustrates that alumina is reducing growth of zeolite in the pores of the 1200 cpsi support,
since a higher weight gain otherwise would be observed on the 1200 cpsi support, that has much
more wall area available for zeolite growth than the 400 cpsi monoliths in accordance with SEM
observations. The weight gain for the monoliths coated with 1.5 μm films is about half of the weight
115
gain for the 1200 cpsi monolith coated with alumina and a 2.5 μm film. The 1200 cpsi monolith
coated with alumina and a 2.5 μm film has the highest weight gain of all samples due to the
combination of a support with high cell density which gives larger surface accessible for film
growth, and the greatest film thickness. Consequently, this adsorbent has the highest zeolite loading
and BET surface area per g adsorbent. The BET surface area is as high as 41 m2/g sample, which is
about 10% of that for typical zeolite X beads used as adsorbents [20]. A structured adsorbent with its
characteristic low pressure drop and even flow distribution as discussed earlier [20] with such a high
specific surface area and short diffusion paths seems as a very promising adsorbent. Figure 5 shows
derivative pore volumes (cm3/g μm) determined by MIP of a 400 cpsi cordierite monolith, a 400 cpsi
support coated with a 1.5 μm zeolite film, an uncoated 1200 cpsi cordierite monolith, a 1200 cpsi
support impregnated with alumina, and for the samples coated with 1.5 and 2.5 m NaX films. The
figure shows that the uncoated 1200 cpsi monolith displays a peak at a pore diameter of about 3 μm.
This peak is shifted to about 0.1 μm for the impregnated 1200 cpsi+Al monolith as a result of pore
filling with alumina grains. The zeolite samples also display a peak at a pore size of about 0.1 μm,
since the porosity of the support remains after growth of the zeolite film. The pore size for the 400
cpsi support and 400 cpsi+1.5μm sample were estimated to be respectively, 7.5 and 7 μm. The MIP
data for all samples are summarized in Table 2. The steep increase of the derivative pore volumes in
the region close to 100 m corresponds to Hg intrusion in the channels of the supports.
The CO2 adsorption capacities determined by adsorption measurements of zeolite coated
monoliths are also presented in Table 2. As expected, the 1200 cpsi monolith coated with 2.5μm film
displayed the largest loading (0.134 mmol/cm3) which was about twice as large as the capacity of the
samples coated with a 1.5μm film, in agreement with weight gain values and the discussion above.
4.2 Breakthrough experiments and numerical simulations
To study the effect of channel width distribution, simulations of the breakthrough curve for a
1200 cpsi monolith with a channel width distribution as measured, i.e. ranging from 691 to 711 μm,
116

were performed. The channel width distribution of monolith shown in Figure 2 (a) was discretized
into three parts and the mean value for each of the three segments (693, 700, 708 μm, respectively)
were employed in the simulation. The fractional areas for each of the three segments were 0.10 for
the 691-695 μm range, 0.78 for the 695-705 μm range and 0.12 for the 705-711 μm range. The
velocity is different for different channel widths; therefore, to calculate the velocity distribution
corresponding to the determined channel width distribution, it was assumed that the pressure drop is
constant over all channels and that the flow could be described with the Hagen-Poiseuille equation
[23].
The volumetric flow distribution was calculated by solving three Hagen-Poiseuille equations
simultaneously (one for each segment in the channel width distribution), with the restrictions that the
pressure drop is equal in all channels and that the fraction of flow from each segment equals the
fractions determined for the channel width distribution and that the sum of the volumetric flow rates
calculated for each segment equals the volumetric flow rate in the experiment i.e. 1 l/min.
The average gas velocity for each segment in the channel distribution was then calculated from
the Hagen-Poiseuille equation using this pressure drop and the average channel width for each
segment. To assess the effect of the distribution in channel width, a breakthrough curve was
simulated using the average gas velocity for each segment of the channel width distribution and the
flow rate for each segment was weighted using the fractional areas determined for each segment.
The simulations run were conducted using a feed gas containing 10% CO2 with a flow rate of 1 l/min
and the temperature was set to 27°C as in the experiments. Figure 6 illustrates the results and reveals
that there is no significant difference between the breakthrough fronts and therefore the weighted-
average breakthrough was selected to be fitted to experimental data. The figure confirms the effect
of channel width distribution on broadening CO2 front is trivial and therefore can be ignored, at least
for the monoliths used here with very narrow channel width distributions.
117

The measured CO2 breakthrough curves for the uncoated 400, 1200 cpsi and 1200 cpsi+Al
monoliths at a volumetric flow rate of 1 l/min are displayed by points in Figure 7. Curves illustrate
the fitted models and it is evident that the model can adequately describe the experimental
observations. For the 400 cpsi monolith, CO2 breaks through slightly before the 1200 cpsi monolith
whereas for the 1200 cpsi+Al sample, breakthrough occurs somewhat later. The difference in
breakthrough curves between the 400 and 1200 cpsi samples is captured in the model through
different diffusion coefficients for pore filling Dp and pore filling capacity saC*, see Table 3 and 2,
respectively. Moreover, the ratios between the contributions from adsorption and pore filling
(kwq*/kpaC*) are 6×10⁻⁵ and 1×10⁻³ for the 400 and 1200 cpsi samples, respectively, see Table 3. This
indicates that the contribution from adsorption on the monoliths was negligible for both samples and
Dw can not be accurately fitted for these two samples. On the contrary, adsorption was found to
significantly contribute to the breakthrough curve of 1200 cpsi+Al sample. Again, the breakthrough
curve could be adequately described by the model. In this case, the ratio of adsorption and pore
filling is 0.25. The additional adsorption capacity and the lower diffusion coefficient for pore filling
Dp for the sample 1200 cpsi+Al are thus capturing the difference in break through curves for samples
1200 cpsi and 1200 cpsi+Al. Dp for the latter sample was taken as the Knudsen diffusivity since the
pore size is about 0.1 m and the mean free path of CO2 at 300 K and 1 atm is approximately the
same, indicating that the diffusion is mostly of Knudsen type.
The results show that for the supports not coated with alumina, the breakthrough behaviour
may be explained by pore filling in the voids of the monolith walls whereas both pore filling and
adsorption affects the breakthrough behaviour of the support treated with alumina. The parameters
determined for the three monolith samples using the two-layer model were then used in the three-
layer model for the zeolite coated monoliths.
For the non-coated monolith samples, the contribution from pore filling was much higher than
that of adsorption on the monolith. This can be rationalized by the fact that pore filling is a fast
118

process as the breakthrough experiments for these samples, which are over in less than 1 minute. To
the best of our knowledge there are no data on the structure of CO2 adsorbed on cordierite, but under
the assumption that the adsorption on cordierite follows the same mechanisms as for many metal
oxides forming carbonate species on the surface [24], the adsorption of carbon dioxide on cordierite
may be significantly slower than ordinary physisorption. The results presented here indicate that the
uptake of carbon dioxide by adsorption on cordierite is much slower than by pore filling and too
slow to influence the very fast breakthrough experiments with non-coated monolith samples and
therefore the breakthrough curves for these samples may be adequately described with the pore
filling contribution only.
The CO2 breakthrough fronts of the zeolite coated monoliths are presented in Figure 8. There
was a good fit between the three-layer model and experimental data for all samples. The
breakthrough time is shortest for the 400 cpsi+1.5μm film followed by the 1200 cpsi+Al+1.5μm
film and finally the 1200 cpsi+Al+2.5μm film, this trend is in agreement with the zeolite loading
presented in Table 2. Again, the three layer model can describe the experimental observations
adequately. The differences between the break through curves were captured in the model by
differences in the parameters for the supports as described above and in addition, differences in
zeolite film thickness. The fitted diffusivities for the zeolite films Dz are nearly constant, as
expected, and in the range 2.7-4.1×10⁻¹² m2/s. As it was pointed out by Bülow [25], for CO2-NaX
systems, at least two mechanisms govern uptake and release of CO2 by NaX crystals. Presupposed
diffusion is extremely fast and superimposed diffusion is a very slow process compared to the first
one. Literature data on the diffusivity of CO2 in NaX is scarce and scatters significantly. Plant et al.
[26] reported a diffusivity of 6×10⁻¹⁰ m2/s, whereas data presented by Bülow [25] indicated that the
diffusion of CO2 in NaX was significantly lower than 3×10-11 m2/s as we observed.
To investigate the impact of wall porosity, simulations were performed by keeping all
parameters constant in the three layer model for the sample 1200 cpsi+Al+1.5μm film while varying
119

wall porosity from 0.0 to 0.7; the predicted break through fronts are shown in Figure 9. Keep in
mind that the wall porosity for the real sample was 0.32. The results are in agreement with the
discussion above as the dense support ( w=0.0) displayed the sharpest breakthrough front with
longer breakthrough time, while the least dense monolith ( w=0.7) gave rise to the broadest front and
a short breakthrough time. These results confirm our hypothesis that dense supports with lower
porosity may improve both zeolite film synthesis and process performance of structured adsorbents
in the form of coated monoliths.
In order to verify the effect of thickness of active material on the adsorption properties of the
adsorbent, the zeolite film thickness in the model was varied from 1.5 microns to 30 microns while
the other parameters were kept as for a 1200 cpsi monolith with zero wall porosity. Figure 10 shows
that by increased film thickness, the CO2 breakthrough time increases as expected due to the higher
zeolite loading. Further, film thicknesses larger than 10 m results in broadening of the CO2 front
due to an increased diffusion path. However, the gain in capacity with larger film thicknesses than
10 m may well completely offset the loss due to mass transfer. To examine this trade-off, it is
necessary to perform cyclic adsorption runs as a function of cycle time to find the optimal thickness;
such study will be discussed in a separate paper. Based on single breakthrough runs, our results
indicate that 10 m is a safe margin thickness for a zeolite film grown on a nonporous 1200 cpsi
monoliths support. As discussed above, the CO2 adsorption capacity of a 1200 cpsi monolith coated
with a 2.5 μm film was 0.13 mmol/cm3 adsorbent. If the film thickness is increased to 10 μm, the
adsorption capacity would increase to about 0.5 mmol/cm3 adsorbent which is about 25% of the
adsorption capacity of zeolite X beads. A structured adsorbent, with such a high adsorption
capacity, low pressure drop and sharp breakthrough front seems as a very competitive adsorbent. We
aim to prepare and investigate such samples in the nearby future.
5. Conclusions
120

Experimental and theoretical studies were conducted in order to evaluate the performance of
structured zeolite adsorbents, consisting of well intergrown zeolite films on cordierite monoliths.
Attention was given to the effects of monolith support parameters (i.e. wall porosity, diffusivity,
channel width distribution) and zeolite film thickness on the adsorption performance. The present
work has shown that the adsorption capacity of zeolite coated monoliths with high cell density can
approach that of zeolite beads. The importance of support porosity on adsorption performance has
been illustrated and the advantage of zeolite coated monoliths with low wall porosity for gas
separation processes has been demonstrated for the first time. This work has also shown that
although a thicker zeolite film increases adsorption, a too thick film compromises the adsorption
kinetics resulting in a broader front. Simulations indicated that a zeolite X film with a thickness of
10 μm is optimal for a nonporous 1200 cpsi monolith for CO2 adsorption. More experimental and
theoretical studies are required to confirm these results.
Acknowledgment
The authors would like to acknowledge the Monash Research Graduate School (MRGS) for
providing scholarship support for Fateme Rezaei. The Knut and Alice Wallenberg foundation is
acknowledged for financially supporting the Magellan SEM instrument. Jonas Hedlund is
acknowledging Bio4energy for financial support.
References
[1] F. Rezaei, P. Webley, Sep. Purif. Technol. 70 (2010) 243-256.
[2] D.M. Ruthven, C. Thaeron, Gas Sep. Purif. 10 (1996) 63-73. [3] Y.Y. Li, S.P. Perera, B.D. Crittenden, Chem. Eng. Res. Des. 76 (1998) 921-930.
[4] F. Rezaei, P. Webley, Chem. Eng. Sci. 64 (2009), 5182-2191. [5] T.C. Golden, C.M.A. Golden, D.P. Zwilling, European Patent, US6565627, (2003).
[6] K.P. Gadkaree, Carbon 36 (1998) 981-989. [7] Y.Y. Li, S.P. Perera, B.D. Crittenden, Chem. Eng. Res. Des. 76 (1998) 931-941. [8] F. Brandani, A. Rouse, S. Brandani, D.M. Ruthven, Adsorption 10 (2004) 99-109.
121
[9] M. Zabka, M. Minceva, A.E. Rodrigues, Chem. Eng. Process- Process Intens. 45 (2006) 150-
160. [10] A. Mosca, J. Hedlund, P. Webley, M. Grahn, F. Rezaei, Micropor. Mesopor. Mater. 130 (2010)
38-48. [11]Y. Li, S. Perera, and B. Crittenden, Chem. Eng. Res. Des. Transactions of the Institute of
Chemical Engineers, Part A 76 (1998) 921- 930. [12] L. Li, B. Xue, J. Chen, N. Guan, F. Zhang, D. Liu, H. Feng, Appl. Catal. A: Gen. 292 (2005)
312-321. [13] J. Hedlund, B.J. Schoeman, J. Sterte, Book Series: studies in surface science and catalysis 105
(1997) 2203-2210. [14] J. Hedlund, J. Sterte, M. Anthonis et al., Micropor. Mesopor. Mater. 52 (2002) 179-189. [15] M. Grahn, Z. Wang, M. Lidstrom-Larsson, A. Holmgren, J. Hedlund, J.sterte, Micropor.
Mesopor. Mater. 81 (2005) 357-363.
[16] J. Hedlund, O. Öhrman, V. Msimang, E.V. Steen, W. Böhringer, S. Sibya, K. Möller, Chem. Eng. Sci. 59 (2004) 2647-2657.
[17] R.B. Bjorklund, J. Hedlund, J. Sterte, H. Arwin, J. Phys. Chem. B 102 (1998) 2245-2250. [18] O. Öhrman, J. Hedlund, J. Sterte, Appl. Catal. A Gen. 270 (2004) 193-199. [19] A. Mosca, J. Hedlund, F.N. Ridha, P. Webley, Adsorption 14 (2008) 687-693. [20] F. Rezaei, A. Mosca, P. Webley, J. Hedlund, P. Xiao, Ind. Eng. Chem. Res. 49 (2010), 4832-
4841. [21] S.H. Hyun, R.P. Danner, J. Chem. Eng. Data 27 (1982) 196-200. [22] H. Ahn, S. Brandani, Adsorption 11 (2005) 473-477. [23] A. Cybulski, J.A. Moulijn, Structured Catalysts and Reactors, New York: Marcel Dekker, 1998. [24] J. Baltrusaitis, J. Schuttlefield, E. Zeitler, V.H. Grassian, Chem. Eng. J.
doi:10.1016/j.cej.2010.12.041.
[25] M. Bülow, Adsorption 8 (2002) 9-14.
[26] D. Plant, H. Jobic, P. Llewellyn, G. Maurin, Eur. Phys. J. Special Top. 141 (2007) 127-132.
Notation
a specific saturation volume, cm3/ g adsorbent
122

C bulk concentration, mole/cm3
C gas concentration in voids of monolith wall, mole/cm3
DL axial diffusion coefficient, cm2/s
Dp pore diffusivity, cm2/s
Dw monolith wall diffusivity, cm2/s
Dz zeolite film diffusivity, cm2/s
ki solid mass transfer coefficient, 1/s
kp pore mass transfer coefficient, 1/s
li diffusion length, cm
q average adsorbent loading, mole/g adsorbent
q* equilibrium adsorbent loading, mole/g adsorbent
t time, s
U velocity, cm/s
z axial length, cm
s adsorbent density, g/cm3
pore voidage
123

List of Tables
Table 1. Sample geometrical properties
Table 2. Sample characteristics
Table 3. Adsorption kinetics of monoliths
124
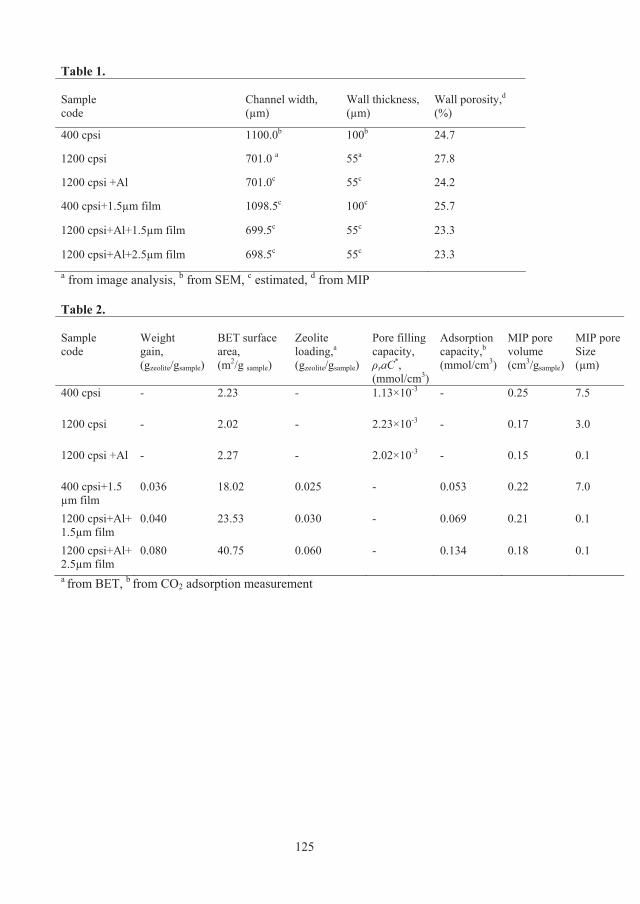
Table 1. Sample code
Channel width, (μm)
Wall thickness, (μm)
Wall porosity,d (%)
400 cpsi 1100.0b 100b 24.7
1200 cpsi 701.0 a 55a 27.8
1200 cpsi +Al 701.0c 55c 24.2
400 cpsi+1.5μm film 1098.5c 100c 25.7
1200 cpsi+Al+1.5μm film 699.5c 55c 23.3
1200 cpsi+Al+2.5μm film 698.5c 55c 23.3
a from image analysis, b from SEM, c estimated, d from MIP
Table 2. Sample code
Weight gain, (gzeolite/gsample)
BET surface area, (m2/g sample)
Zeolite loading,a (gzeolite/gsample)
Pore filling capacity,
saC*, (mmol/cm3)
Adsorption capacity,b (mmol/cm3)
MIP pore volume (cm3/gsample)
MIP pore Size (μm)
400 cpsi - 2.23 - 1.13×10⁻³ - 0.25 7.5
1200 cpsi - 2.02 - 2.23×10⁻³ - 0.17 3.0
1200 cpsi +Al - 2.27 - 2.02×10⁻³ - 0.15 0.1
400 cpsi+1.5 μm film
0.036 18.02 0.025 - 0.053 0.22 7.0
1200 cpsi+Al+ 1.5μm film
0.040 23.53 0.030 - 0.069 0.21 0.1
1200 cpsi+Al+ 2.5μm film
0.080 40.75 0.060 - 0.134 0.18 0.1
a from BET, b from CO2 adsorption measurement
125

Table 3. Sample code
Dp, (m2/s)
Dw,a (m2/s)
Dz, (m2/s)
ki, (s-1)
kiq*/kpaC*
400 cpsi 1.4×10⁻⁵ 4.0×10⁻¹² - - 5.7×10⁻⁵
1200 cpsi 5.8 ×10⁻⁶ 7.6×10⁻¹² - - 9.6×10⁻⁴
1200 cpsi +Al 2.5 ×10⁻⁷ 3.7×10⁻¹¹ - - 0.25
400 cpsi+1.5μm film 1.4×10⁻⁵ 4.0×10⁻¹² 4.1×10⁻¹² 5.50 -
1200 cpsi+Al+1.5μm film 5.8 ×10⁻⁶ 7.6×10⁻¹² 3. 9×10-12 2.70 -
1200 cpsi+Al+2.5μm film 2.5 ×10⁻⁷ 3.7×10⁻¹¹ 2. 7×10-12 1.30 - a Could not be fitted accurately due to very low adsorption rate
126

List of Figures
Figure 1. Monolith channel geometry composed of channel wall, zeolite film and monolith channel
layers, (a) two-layer mode (b) three-layer model.
Figure 2. (a) Mean channel area distribution and (b) Mean wall thickness distribution of 1200 cpsi
monolith support.
Figure 3. SEM top-view (a) and cross sectional (b) images of a 1200 cpsi cordierite monolith
slurry-impregnated with Al2O3.
Figure 4. SEM top-view (a, c) and cross-sectional (b, d) images of NaX films grown in 5 or 10
steps, respectively, on 1200 cpsi cordierite monolith filled with Al2O3 particles.
Figure 5. Mercury intrusion pore volume distributions for 1200 cpsi cordierite monolith, sample
1200 cpsi+Al, and NaX film samples 1200 cpsi+Al+1.5μm film, and 1200 cpsi+Al+2.5μm film,.
Figure 6. CO2 breakthrough curves for different monolith channel sizes.
Figure 7. Experimental (dotted lines) and approximated breakthrough curves of carbon dioxide of
uncoated monolithic samples at 1 l/min and 10% CO2 in N2.
Figure 8. Comparison of experimental breakthrough curves of samples 1200 cpsi+Al+1.5μm film,
1200 cpsi+Al+2.5μm film, and 400 cpsi+ 1.5 μm film [20].
Figure 9. Effect of monolith wall porosity on CO2 concentration profile.
Figure 10. Effect of zeolite film thickness on CO2 concentration profile.
127
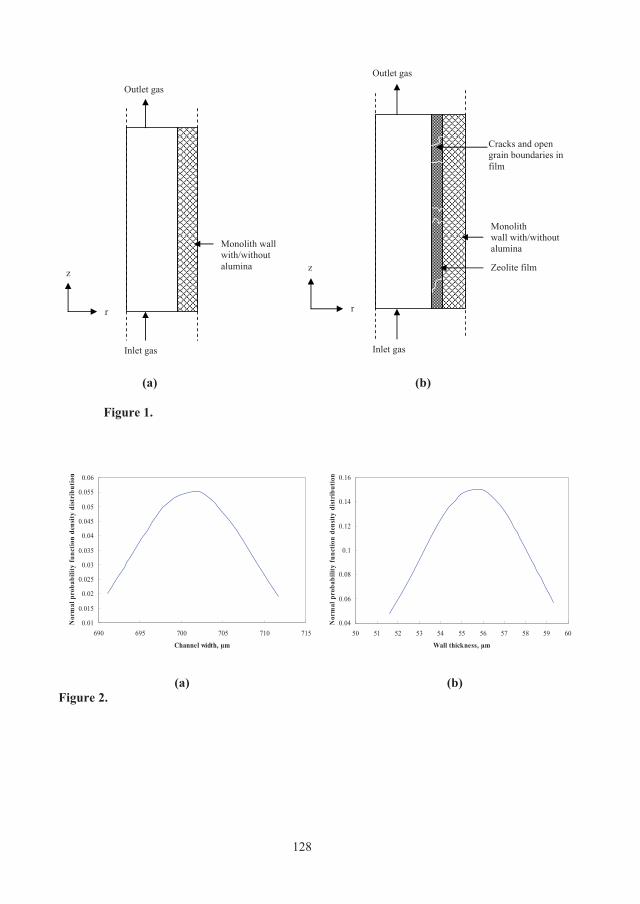
(a) (b)
Figure 1.
0.01
0.015
0.02
0.025
0.03
0.035
0.04
0.045
0.05
0.055
0.06
690 695 700 705 710 715
Channel width, μm
Nor
mal
pro
babi
lity
func
tion
dens
ity d
istri
butio
n
0.04
0.06
0.08
0.1
0.12
0.14
0.16
50 51 52 53 54 55 56 57 58 59 60
Wall thickness, μm
Nor
mal
pro
babi
lity
func
tion
dens
ity d
istri
butio
n
(a) (b)Figure 2.
Monolith wall with/without alumina
Zeolite film
Outlet gas
Inlet gas
z
r
Cracks and open grain boundaries in film
Monolith wall with/without alumina
Outlet gas
z
r
Inlet gas
128
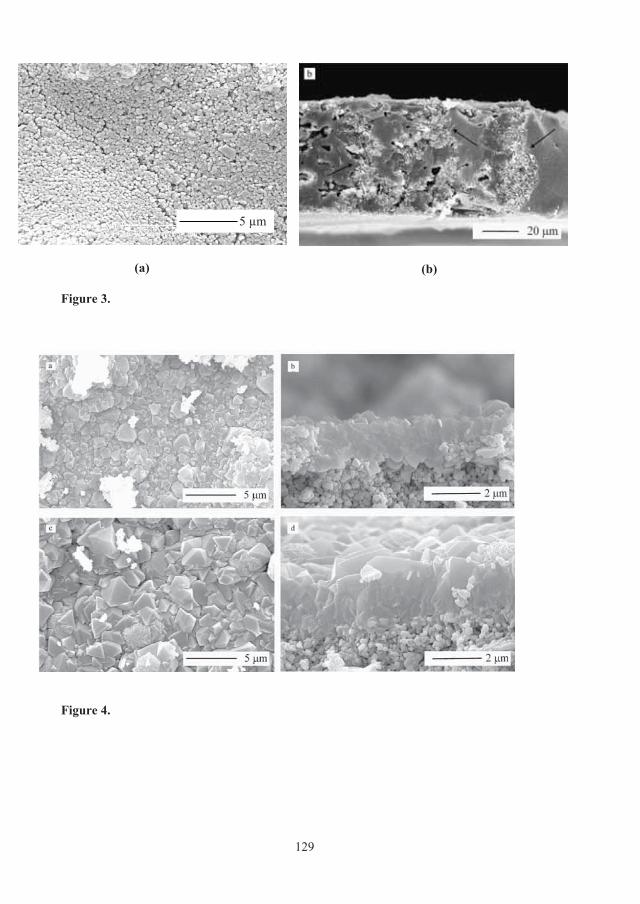
(a)
(b)
5 μm
Figure 3.
Figure 4.
129

Figure 5.
0 10 20 30 40 50 60 70 80 900
0.2
0.4
0.6
0.8
1
Dimensionless Time
C/C
0
Channel width=693μmChannel width=701μmChannel width=711μmWeighted-average
Figure 6.
130

0
0.2
0.4
0.6
0.8
1
1.2
0 50 100 150
Time, s
C/C
0
400 cpsi1200 cpsi1200 cpsi+AlModel
Figure 7.
0
0.2
0.4
0.6
0.8
1
1.2
0 50 100 150
Time, s
C/C
0
400 cpsi+1.5μm film1200 cpsi +1.5μm film1200 cpsi +2.5μm filmModel
Figure 8.
131

0 10 20 30 40 50 60 70 80 90 1000
0.2
0.4
0.6
0.8
1
Dimensionless Time
C/C
0
ew=0.0ew=0.3 ew=0.5ew=0.7
Figure 9.
132

0 10 20 30 40 50 60 70 800
0.2
0.4
0.6
0.8
1
Dimensionless Time
C/C
0
film thickness=1.5 μmfilm thickness=5 μmfilm thickness=10 μmfilm thickness=20 μmfilm thickness=30 μm
Figure 10.
133

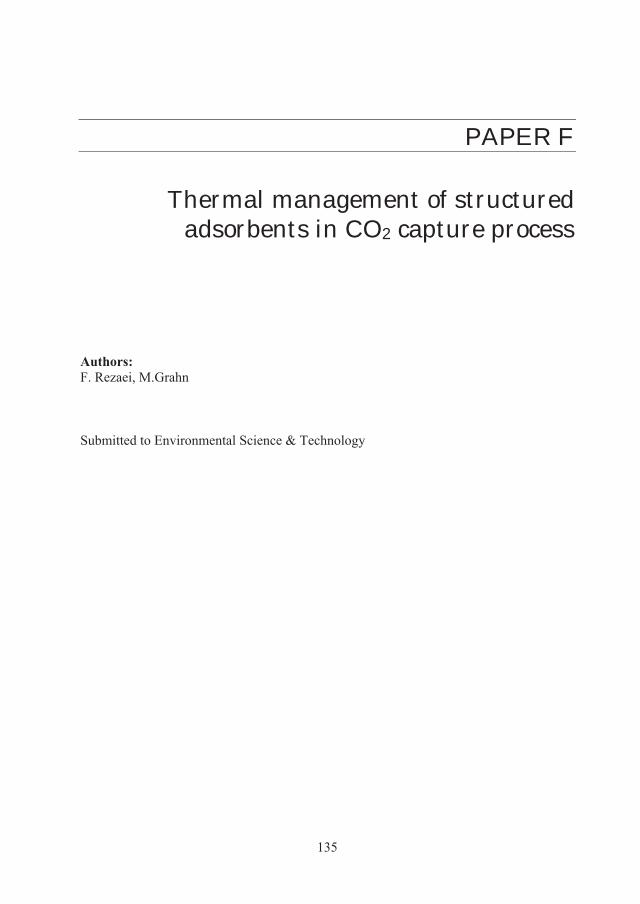
PAPER F
Thermal management of structured adsorbents in CO2 capture process
Authors:F. Rezaei, M.Grahn
Submitted to Environmental Science & Technology
135

136 PAPER F

Thermal management of structured adsorbents in CO2 capture process Fateme Rezaei *, Mattias Grahn
Div. of Chemical Technology, Luleå University of Technology, SE-97187, Luleå, Sweden *Corresponding author. Tel.: +46 920 492986, Fax: +46 920 491199
E-mail: [email protected]
Abstract
In order to have an efficient adsorptive separation, structured adsorbents are expected to
satisfy not only mass transfer and pressure drop requirements, but also the thermal
management requirements. To what extent the structure of adsorbent affects the thermal
behaviour of the system is a question which would be addressed in this study. The primary
purpose of this study was to assess the performance of alternate adsorbents through
development of numerical models for prediction of their thermal behaviour under a two-step
pressure swing adsorption (PSA) condition. The single step CO2 breakthrough and
temperature profiles confirmed the efficiency of structured adsorbents in managing the
thermal effects evolved in the bed under non-isothermal conditions. Two-step PSA results
also showed that under real cyclic processes, structured adsorbents maintain their superiority
and introduce themselves as potential candidates for advanced PSA units. At the shorter
cycle time large discrepancies between traditional and structured adsorbents arose, implying
the capability of advanced structures in increasing the adsorbed amount of CO2 more
efficiently that in longer cycles. However, their competency is limited to certain dimensions
provided their geometrical parameters should not exceed certain values.
Keywords: Thermal management, Structured adsorbents, Adiabatic, Non-isothermal, PSA cycle
1. Introduction
Adsorption processes are commonly assumed to be isothermal. The assumption is based
on the fact that thermal effects caused by heat generation inside the column impose
negligible influence on adsorption dynamics. However, in practice, this assumption is no
longer justified especially for high concentration feeds in which the heat of adsorption
generates thermal waves in both axial and radial directions, affecting the concentration
137
profiles. Therefore, in most cases, the rate of adsorption is mainly controlled by both heat and
mass transfer kinetics and hence, the non-isothermal nature of the adsorptive gas separation
processes must be taken into account during process design. Under non-isothermal
conditions, the temperature and concentration wave fronts (or the combination of both) move
through the bed with different velocities and shapes, depending on various parameters such
as gas flow rate, thermal storage capacity and adsorptive capacity of the adsorbent (1-7).
In our previous study (8), we presented a new methodology to find the optimal adsorbent
structure and showed that for dilute systems, parallel channel adsorbents in the form of
laminate structures exhibit substantially better performance than other structures, but for the
sake of computational simplicity we confined our study to the case of isothermal operation
only. However, non-isothermal effects especially at higher feed concentration are very
important and can deteriorate process efficiency and deform breakthrough curves. Therefore,
in order to have a comprehensive analysis of an adsorption process, it is necessary to take
into consideration an efficient thermal management during cyclic adsorption processes such
as pressure swing adsorption (PSA) or temperature swing adsorption (TSA).
Basically, there are two different approaches for managing thermal effects in adsorptive
gas separation processes, namely external and internal management. In the first approach, the
thermal effect can be efficiently managed by employing an in-bed multi-tubular heat
exchanger to extract the heat of adsorption from the column. To do so, the adsorbent material
is required to exhibit high effective thermal conductivity and high heat exchange coefficient.
In this respect, the composite of expanded natural graphite with activated carbon has been
already studied by several researchers (9,10). This method is only applicable to small scale
columns and the difficulty associated with its industrial application makes it impractical for
real gas separation units. In the internal mode of thermal management, in order to control in
situ thermal effects generated during adsorption, the focus is given to adsorbent materials. In
138

this case, the goal is to employ the materials which are capable of storing a large amount of
heat and hence mitigating thermal effects in such a way that isothermal condition could be
maintained in the column. The materials used for this purpose are normally phase change
materials (PCM) which can be mixed with active adsorbent materials (11). Sometimes
different adsorbent materials are blended to mitigate the heat generated during adsorption.
Under theses conditions the adsorption heat is transferred from the ‘strong’ adsorbent to the
‘weak’ adsorbent resulting in enhanced equilibrium capacity. This method also possesses
some limitations: the PCM could dilute the amount of active adsorbent and reduce the
adsorbent loading on one hand and increase the characteristic diffusion path and hence
increase the mass transfer resistance on the other hand.
Another possible option to carefully manage the thermal effects is to utilize adsorbent
with different geometries than pellets. The use of conventional adsorbent materials in the
form of beads or granules in advanced gas separation systems is compromised when an
efficient process with high performance and low energy demand is required. Recently,
various structured adsorbents with enhanced adsorption characteristics such as monolithic,
laminates and foam structures have gained considerable attention as alternate candidates for
traditional adsorbent particles. Over the last twenty years there have been numerous patents
on such systems including a theoretical study (12-16) and development and marketing of
rapid cycle adsorption processes based on parallel passage contactors has been reported
(17,18). For further information see a recent published review on application of structured
adsorbents in gas separation processes (19).
It is expected that the thermal properties of the system can be carefully engineered by
employing structured adsorbents. In the case of monoliths, foams and laminates, a macropore
wall structure can facilitate the dissipation of heat and consequently more nearly achieve a
uniform temperature distribution across the adsorbent. With regard to laminate structures,
139
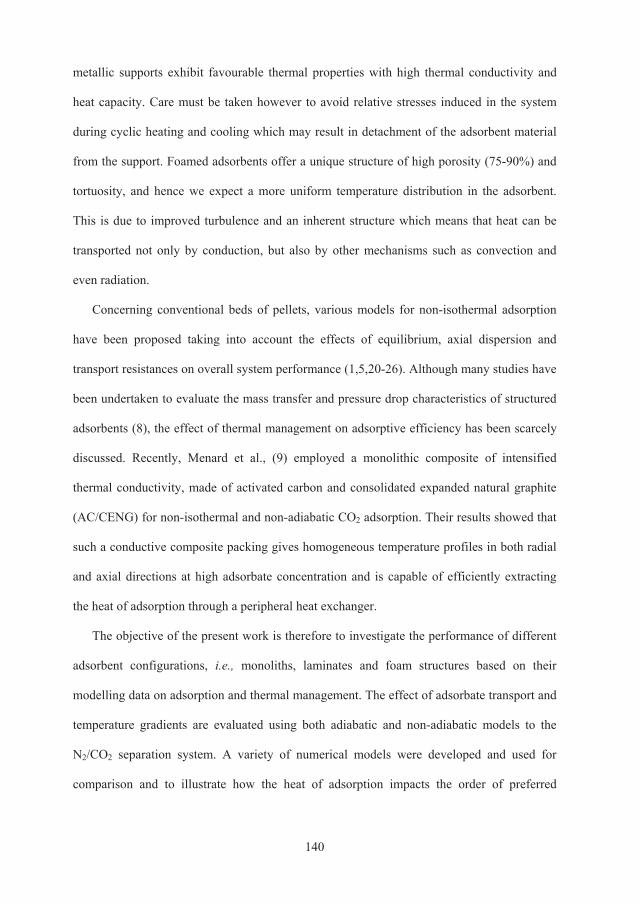
metallic supports exhibit favourable thermal properties with high thermal conductivity and
heat capacity. Care must be taken however to avoid relative stresses induced in the system
during cyclic heating and cooling which may result in detachment of the adsorbent material
from the support. Foamed adsorbents offer a unique structure of high porosity (75-90%) and
tortuosity, and hence we expect a more uniform temperature distribution in the adsorbent.
This is due to improved turbulence and an inherent structure which means that heat can be
transported not only by conduction, but also by other mechanisms such as convection and
even radiation.
Concerning conventional beds of pellets, various models for non-isothermal adsorption
have been proposed taking into account the effects of equilibrium, axial dispersion and
transport resistances on overall system performance (1,5,20-26). Although many studies have
been undertaken to evaluate the mass transfer and pressure drop characteristics of structured
adsorbents (8), the effect of thermal management on adsorptive efficiency has been scarcely
discussed. Recently, Menard et al., (9) employed a monolithic composite of intensified
thermal conductivity, made of activated carbon and consolidated expanded natural graphite
(AC/CENG) for non-isothermal and non-adiabatic CO2 adsorption. Their results showed that
such a conductive composite packing gives homogeneous temperature profiles in both radial
and axial directions at high adsorbate concentration and is capable of efficiently extracting
the heat of adsorption through a peripheral heat exchanger.
The objective of the present work is therefore to investigate the performance of different
adsorbent configurations, i.e., monoliths, laminates and foam structures based on their
modelling data on adsorption and thermal management. The effect of adsorbate transport and
temperature gradients are evaluated using both adiabatic and non-adiabatic models to the
N2/CO2 separation system. A variety of numerical models were developed and used for
comparison and to illustrate how the heat of adsorption impacts the order of preferred
140
adsorbent configurations being used in cyclic adsorption processes. In addition, numerical
evaluation of structured adsorbents is demonstrated on a simple two-step PSA system at
different cycle duration under non-isothermal conditions.
2. Model Description
2.1 Heat and mass transfer models
A one dimensional mathematical model was developed to simulate the column behaviour
in terms of temperature profiles under two different non-isothermal conditions viz. adiabatic
and non-adiabatic. The following assumptions were applied to the mass and energy balance
equations:
1. The ideal gas law holds.
2. Concentration and temperature distribution in the radial direction is neglected.
3. The gas, solid and wall physical properties are considered constant.
4. Heat capacities of bulk and adsorbed CO2 are assumed negligible.
5. Concentration profile is considered to be parabolic in shape.
For different geometries, a number of simplified mathematical models were developed taking
into account a single-component adsorption. In most published literature, a homogeneous
model (neglecting the temperature difference between gas and solid phases) was employed
for performing energy balance in adsorbers, however, the assumption of having an overall
temperature across the bed may not be the case for structured adsorbents. For this reason we
applied a heterogeneous model and assigned an average temperature (T ) for the solid and a
bulk temperature (Tb) for the gas phase. For a non-isothermal system, differential mass and
energy balances for the adsorbate in the gas phase flowing through the bed give:
pLb CCak
zUC
zCU
zCD
tC )()(
2
2
(1)
141
)-T(TRh)T-a(Th)(
z)(TCU
zT
tTC wb
wb
wb
b
bbpgg
bL
bpgg
212
2
(2)
where C and p
C are the concentration of the adsorbate in the gas phase and the average
concentration in the pores of the adsorbent, respectively; a is the specific surface area per
unit bed volume; U is the interstitial gas velocity; k is the overall (or total) mass transfer
coefficient; DL is the axial dispersion coefficient; b is the bed void fraction; g is gas density;
Cpg is bulk heat capacity; h is heat transfer coefficient between the gas and solid phases; hw
is the heat transfer coefficient between the gas and adsorber wall; L is the thermal axial
dispersion coefficient; Rw is adsorber wall radius and Tb, T and Tw are bulk, adsorbent and
wall temperatures respectively. It should be noted that the model considers velocity variation
in the PSA column due to adsorption.
Differential mass and heat balances for the adsorbate inside the solid phase are given
by:
ps
p
p CCktq
tC (3)
TThtqH)()(
tTC bsppss 1 (4)
where p is solid void fraction; is geometry’s factor; s is adsorbent density (includes
binder, support, etc); q is average adsorbent loading and - H is heat of adsorption. The
linear driving force model (LDF) was used for estimating the rate of adsorption. A detailed
analysis of the differential mass balance for the adsorbate in the gas and solid phases can be
found in our previous work (see (8)). The temperature–dependent Dual-Site Langmuir
isotherm equation was considered to represent adsorption equilibrium:
jjii
ii
jjii
iii PdPd
PdmPbPb
Pbmq11
21 (5)
142
where temperature dependent parameters bi and di are given by:
TRHdd
TRHbb i
iii
ii2
01
0 exp;exp (6)
The values of parameters of Dual-Site Langmuir isotherms are listed in Table 1 (27).
Concerning the heat transfer through the column wall, the following equation is used to
describe the energy balance in the column wall:
0)()( 21w outwwwwbwww
pw TTUaTThat
TC (7)
where aw1 and aw2 are wall internal and logarithmic specific surface areas respectively; Uw is
the global heat transfer coefficient and Tout is the ambient temperature. The aw1 and aw2 are
calculated using following expressions:
)(1www
w tdtwda
w
wwww
w
dtdtd
aln)(
12 (8)
in which tw and dw are respectively column wall thickness and internal column wall diameter.
The initial and boundary conditions applied to above equations are:
C, p
C , Tb (t = 0) = 0, 0)0(tq , 00 )(tT (9)
00
0zz
CC , Tb (z = 0) = T0 (10)
0Lzz
C , 0Lz
b
zT (11)
Applying the analogy for mass and heat transfer between solid and gas, the corresponding
transfer coefficients were estimated from appropriate correlations in the same way as
described in our previous paper (8) and the parameters related to each structure have been
summarized in Tables 2 and 3. It is worth to mention here that the monolith is represented by
a series of parallel cylinders, however, we assume the same behaviour for all the cylinders
(no maldistribution), and the monolith can be described by a single channel (28). Moreover,
143

the geometrical parameters of foam were derived by considering the foam structure as a
cylinder.
2.2 Cyclic adsorption simulation
To demonstrate the potential advantage of structured adsorbents under conditions of
known variation in external concentration (or pressure), the simulation of an adsorbent
structure under PSA condition was considered within the current study. The PSA cycle
involves two steps: adsorption and desorption. The simulations are accomplished by
switching the boundary conditions cyclically to account for pressure change at the surface of
the adsorbent during pressurization (adsorption) and depressurization (desorption). The
adsorption step finishes when the CO2 partial pressure at product end of the column reaches
95% of the feed partial pressure. During the desorption step, the product end is closed and the
feed end is opened to desorb CO2. This step continues until 5% of the feed partial pressure is
reached.
For all simulations considered in this study, external mass transfer resistance at the
external surface was included in the model. For each adsorbent structure, simulations were
performed for two dimensionless half cycle times c = 0.04 and 0.1 and the CO2
concentration was cycled between an upper value of C0 down to 0. To ensure a valid
comparison is made between each structure, the same amount of adsorbent mass per unit
volume was assumed for all configurations.
2.3 Numerical solution of the conservation equations and basis for simulation
The above described mathematical models were solved numerically using COMSOL
Multiphysics 3.5a. The number of mesh elements was increased until no further change was
observed in process performance. The chemical engineering module was used to solve the set
of partial differential equations. The physical characteristics of structures considered for
comparison were presented in our previous paper (8). A cylindrical bed size of 2 cm diameter
144
and 30 cm length was chosen arbitrarily for single breakthrough runs. The adsorbent voidage
in each case was taken to be the same (0.6) and the amount of binder was taken to be the
same. The density of the foam, monolith wall and laminate sheet was taken to be the same as
the pellet density. This may not be true for an actual laminate or monolith especially if a
support structure is needed. Furthermore, the cycling procedure was added in COMSOL to
control the cycling and plot the profiles at the end of each step for every cycle. Starting with
a clean adsorbent with an arbitrary geometry, the adsorbate loading profiles evolved in time
until a cyclic steady-state (CSS) was reached.
In order to investigate the effects of non-isothermal conditions on the performance of
structured adsorbents used in adsorption based gas separation processes, the model
predictions were compared with isothermal and adiabatic model calculations for CO2
breakthrough over a bed of zeolite 13X in different configurations. The heat transfer
parameters used for computations are given in Table 4. The values of these parameters are
given at 1 atm and 298 K for a mixture of 10% CO2 in N2. Further, the adsorbent physical
properties were considered to be the same for all geometries.
3. Results and Discussion
The typical set of data for breakthrough runs and temperature profiles under adiabatic and
non-isothermal, non-adiabatic conditions as compared to the corresponding isothermal
conditions is shown in Figure 1 (a,b) for conventional packed bed of pellets. As evident from
Figure 1 (a), the thermal effects on concentration front are remarkable leading to broadening
of the front and early CO2 breakthrough from the column end. The variations in gas bulk
temperature with time in the packed bed illustrated in Figure 1 (b) indicate clearly the axial
thermal gradients within the bed. The temperature rises up sharply as the result of adsorption
during the first few minutes to a maximum at 365 K and remains almost constant in the case
of adiabatic column, while the temperature increase under non-adiabatic condition is much
145

smaller with a peak value of 332 K and starting to decrease as a result of heat loss from the
column wall.
Breakthrough curves for a 600 cpsi monolith at different conditions are presented in
Figure 2 (a). As expected, the CO2 concentration fronts appeared earlier and more disperse
(and unsymmetrical) under non-isothermal conditions, the effect was most pronounced under
adiabatic condition due to the higher temperature in an adiabatic bed then in a non-adiabatic
bed (340 K and 327 K, respectively). Temperature profiles of monolith adsorbents with
different cell densities (Figure 2 (b)) indicates that monoliths with higher cell density results
in a lower and more uniform bed temperature, though the difference is not too large. A higher
cell density monolith can facilitate the dissipation of the heat of adsorption more effectively
than a lower cell density monolith due to shorter characteristic heat transfer length.
Breakthrough curves for foam 30 ppi packing are presented in Figure 3 (a). Adsorbents in
the form of foam structure present the same general trend as the other adsorbents under
adiabatic conditions, characterized by early breakthrough and broader fronts under non-
isothermal conditions and especially at adiabatic conditions. In Figure 3 (b) temperature
breakthrough curves for foam adsorbents with different number of pores (ppi) are shown.
The trends indicate that by increasing the number of pores (higher ppi), more uniform
temperature can be obtained within the bed. This is due to this fact that the resistance to heat
transfer decreases and dissipation of heat occurs faster in foams with higher ppi. The
temperature rise predicted for the foam structures is modest (Figure 3 (b)) but the effect on
the breakthrough curves is pronounced with a very short time to breakthrough under
adiabatic conditions compared to under isothermal conditions (Figure 3 (a)).
Considering laminate structures, as shown in Figure 4 (a,b), the breakthrough curves are
seemingly less distorted than for the structures discussed previously However still there is a
significant reduction in performance as evidenced by the earlier breakthrough observed
146

under non-isothermal conditions compared to the breakthrough under isothermal conditions
resulting from the reduced adsorption capacity under non-isothermal conditions. The wall
thickness and spacing of laminate structures were varied to evaluate their impacts on
temperature fronts and as expected, thinner laminates with small spacing could dissipate
thermal effects more efficiently (Figure 4 (b)).
In Figure 5 (a) the comparison of concentration profiles of all adsorbents in an adiabatic
system is presented. As can be seen, although laminate 0.2×0.2 mm adsorbent exhibits a
sharper breakthrough profile (due to better mass transfer characteristics) than the other
structures, it gives an earlier CO2 front than packed bed of pellets under adiabatic conditions.
In contrast, monolith 600 cpsi and foam 30 ppi adsorbents shows earlier breakthrough
compared to a bed of 0.7 mm pellets and the breakthrough curve for the foam is also more
dispersed than the curves for pellet or monolith. This is mainly due to the combination of
both mass transfer resistance and heat effects evolved in the bed of such structures. As one
would expect, for all geometries, the CO2 breakthrough occurred earlier under adiabatic
conditions than at isothermal operation as a result of higher bed temperature. The gas
temperature evolution in different bed configurations shown in Figure 5 (b) indicates that
structured adsorbents could significantly reduce the temperature gradients (by 46% in the
case of foam 30 ppi) and present a rather homogenous axial temperature distribution.
In order to investigate the role of adsorbent geometry in thermal management of
adsorption beds, the typical features of non-isothermal, non-adiabatic model predictions of
adsorbent geometries are compared and demonstrated in Figure 6 (a,b). The same trend could
be observed for concentration fronts under non-adiabatic conditions as under adiabatic
conditions, however the breakthrough curves were less dispersed under non-adiabatic
conditions (Figure 6 (a)), probably as a result of the smaller temperature rises observed under
non-adiabatic conditions. Although the foam structure is good in dissipating the thermal
147

effect (with a temperature rise of only 13 K, Figure 6 (b)), however, due to larger mass
transfer resistance (see (8)) it displays a broader front. For all cases, the temperature starts to
rise simultaneously with the CO2 breakthrough indicating the combination of both
temperature and concentration waves in the system. Operating the system under non-
isothermal, non-adiabatic conditions, allowing heat exchange through the column wall
improve the breakthrough time significantly, as compared to the adiabatic column. These
results clearly reveal that advanced adsorbent configurations could systematically manage
thermal effects of adsorption leading to efficient performance.
As compared to the corresponding isothermal and adiabatic systems, all adsorbents
display the same trend under non-adiabatic conditions. As one would expect, in non-
isothermal processes, adsorbents exhibit a broader front due to the effect of the temperature
rise due to adsorption, in our simulation, for all cases, the breakthrough fronts obtained under
non-isothermal conditions are also distorted and unsymmetrical compared to isothermal
fronts. This can be attributed to the higher temperature of the bed and evolution of thermal
waves influencing the concentration fronts in non-isothermal adsorber. Due to the heat loss
from the adsorber wall, the maximum temperature obtained under non-adiabatic conditions is
much lower than under adiabatic conditions.
Figure 7 (a,b) shows CO2 loading profiles during the simulated PSA process under non-
adiabatic conditions for the different adsorbent structures under investigation (0.7 mm pellet,
0.2×0.2 mm laminate, 600 cpsi monolith and 30 ppi foam). The figures results are simulated
values for two different dimensionless half cycle times of 0.1 and 0.04 respectively. The
plots display the solid-averaged loading for the duration of the CSS. The difference between
CO2 loadings on pellet versus the other structures is quite substantial especially at shorter
cycle time (Figure 7 (b)). The difference in CO2 loading (maximum - minimum loading)
during one cycle should be large for best utilization of the adsorbent and at both half cycle
148
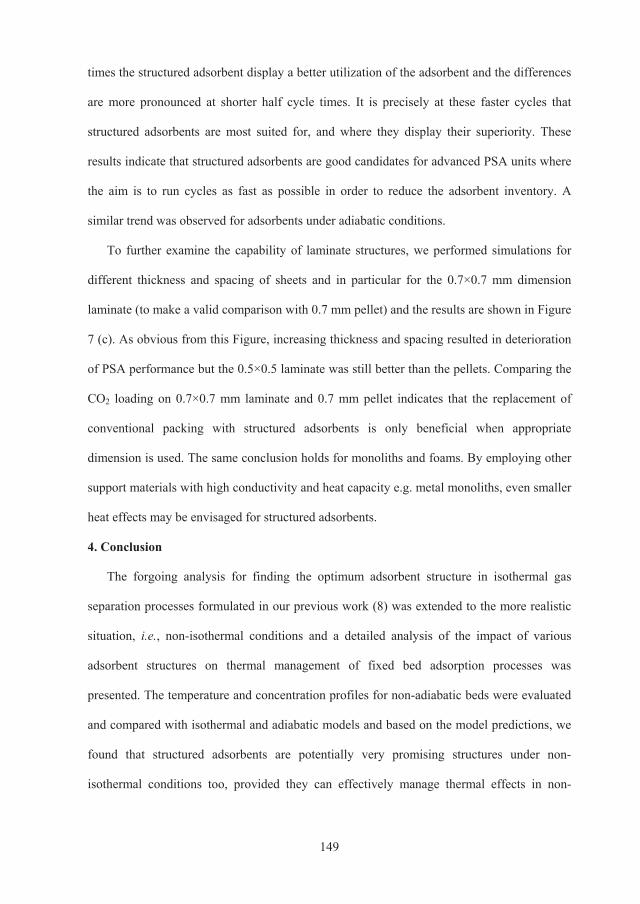
times the structured adsorbent display a better utilization of the adsorbent and the differences
are more pronounced at shorter half cycle times. It is precisely at these faster cycles that
structured adsorbents are most suited for, and where they display their superiority. These
results indicate that structured adsorbents are good candidates for advanced PSA units where
the aim is to run cycles as fast as possible in order to reduce the adsorbent inventory. A
similar trend was observed for adsorbents under adiabatic conditions.
To further examine the capability of laminate structures, we performed simulations for
different thickness and spacing of sheets and in particular for the 0.7×0.7 mm dimension
laminate (to make a valid comparison with 0.7 mm pellet) and the results are shown in Figure
7 (c). As obvious from this Figure, increasing thickness and spacing resulted in deterioration
of PSA performance but the 0.5×0.5 laminate was still better than the pellets. Comparing the
CO2 loading on 0.7×0.7 mm laminate and 0.7 mm pellet indicates that the replacement of
conventional packing with structured adsorbents is only beneficial when appropriate
dimension is used. The same conclusion holds for monoliths and foams. By employing other
support materials with high conductivity and heat capacity e.g. metal monoliths, even smaller
heat effects may be envisaged for structured adsorbents.
4. Conclusion
The forgoing analysis for finding the optimum adsorbent structure in isothermal gas
separation processes formulated in our previous work (8) was extended to the more realistic
situation, i.e., non-isothermal conditions and a detailed analysis of the impact of various
adsorbent structures on thermal management of fixed bed adsorption processes was
presented. The temperature and concentration profiles for non-adiabatic beds were evaluated
and compared with isothermal and adiabatic models and based on the model predictions, we
found that structured adsorbents are potentially very promising structures under non-
isothermal conditions too, provided they can effectively manage thermal effects in non-
149

isothermal beds specially when heat transfer through column wall is allowed (i.e. non-
adiabatic conditions).
PSA CO2 separation on 13X zeolite in different forms was investigated considering the
square-wave change from adsorption to desorption as a common boundary condition. A
comparison of CO2 loading on various adsorbent geometries suggests that the replacement of
conventional adsorbent configurations with novel structures in PSA units leads to a
significant gain, provided that cycle time can be reduced and therefore application of
compact rapid cycles with less adsorbent inventory is allowed.
Acknowledgment
The authors would like to acknowledge Chemical Technology Division for providing
financial support for Fateme Rezaei.
References
(1) Farooq, S.; Ruthven, D.M. Heat effects in adsorption column dynamics. 1. Comparison of one- and two-dimensional models. Ind. Eng. Chem. Res. 1990, 29, 1076-1084.
(2) Grande, C.A.; Cavenati, S.; Barcia, P.; Hammer, J.; Fritza, H.G.; Rodrigues, A.E.
Adsorption of propane and propylene in zeolite 4A honeycomb monolith. Chem. Eng. Sci. 2006, 61, 3053-3067.
(3) Kim, D.J.; Kim, J.W.; Yie J.E.; Moon, H. Temperature-programmed adsorption and
characteristics of honeycomb hydrocarbon adsorbers. Ind. Eng. Chem. Res. 2002, 41, 6589-6592.
(4) Marcussen, L. Comparison of experimental and predicted breakthrough curves for
adiabatic adsorption in fixed bed. Chem. Eng. Sci. 1982, 37, 299-309. (5) Meyer, A.; Weber, T.W. Non-isothermal adsorption in fixed beds. AIChE J. 1966, 13,
457-465. (6) Pan, C.Y.; Basmadjian, D. An analysis of adiabatic sorption of single solutes in fixed
beds: pure thermal wave formation and its practical implications. Chem. Eng. Sci. 1970, 25, 1653-1664.
(7) Raghavan, N.S.; Ruthven, D.M. Dynamic behaviour of an adiabatic adsorption column-II.
Numerical simulation and analysis of experimental data. Chem. Eng. Sci. 1984, 39, 1201-1212.
150

(8) Rezaei, F.; Webley, P. Optimum structured adsorbents for gas separation processes. Chem. Eng. Sci. 2009, 64, 5182-2191.
(9) Menard, D.; Py, X.; Mazet, N. Activated carbon monolith of high thermal conductivity
for adsorption processes improvement: Part A: Adsorption step. Chem. Eng. Process. 2005, 44, 1029-1038.
(10) Reschke, G.; Mathews, W. Abluftreinigung and lossungsmittel-rusckgewinnung durch
adsorption an adsorberharzen. Chemie Ingenieur Technik 1995, 67, 50-59. (11) Meljac, L.; Goetz, V.; Py, X. Isothermal composite adsorbent. Part I: Thermal
characterisation. Appl. Thermal Eng. 2007, 27, 1009-1016. (12) Keefer, B.G.; Mclean, C.R. High frequency rotary pressure swing adsorption apparatus,
United States Patent and Trademark Office Granted, US6056804, 2000. (13) Ruthven, D.M.; Thaeron, C. Performance of a parallel passage adsorbent contactor. Gas
Sep. Purif. 1996, 10, 63-73. (14) Keefer, B.G.; Carel, A.; Sellars, B.; Shaw, I.; Larisch, B. Adsorbent laminate structures,
United States Patent and Trademark Office Granted, US6692626, 2004. (15) Connor, D.J.; Doman, D.G.; Jeziorowski, L.; Keefer, B.G.; Larisch, B. McLean, C.;
Shaw, I. Rotary pressure swing adsorption apparatus, United States Patent and Trademark Office Granted, US 6406523, 2002.
(16) Keefer, B.G. Extraction and concentration of a gas component, United States Patent and
Trademark Office Granted, US5082473, 1992. (17) Connor, D.J.; Doman, D.G. Spacerless parallel passage contactor, World Intellectual
Property Organization, WO069408, 2004. (18) Gibbs, A.C.; Pelman, A.M. Parallel passage contactor structure, United States Patent
and Trademark Office Granted, US0048648, 2006. (19) Rezaei, F.; Webley, P. Structured adsorbents in gas separation processes. Sep. Purif.
Technol. 2010, 70, 243-256. (20) Carter, J.W. A numerical method for prediction of adiabatic adsorption in fixed beds.
Transactions of the Institute of Chemical Engineers. 1966, 44, 253-258. (21) Kaguei, S.; Shemilt, L.W.; Wakao, N. Models and experiments on adsorption columns
with constant wall temperature-radially varying and radially lumped models. Chem. Eng. Sci. 1989, 44, 483-491.
(22) Lee, R.G.; Weber, T.W. Isothermal adsorption in fixed beds. Canadian J. Chem. Eng.
1969, 47, 54-59. (23) Lin, W.; Farooq, S.; Tien, C. Estimation of overall effective coefficient of heat transfer
for nonisothermal fixed-bed adsorption. Chem. Eng. Sci. 1999, 54, 4031-4040.
151

(24) Ozil, P.; Bonnetain, L. Theoretical prediction of temperature profiles in an adsorbent
fixed-bed. Chem. Eng. Sci. 1978, 33, 1233-1237. (25) Park, I.; Knaebel K.S. Adsorption breakthrough behavior: unusual effects and possible
causes. AIChE J. 1992, 38, 660-670. (26) Pentchev, I.; Paev, K.; Seikova, I. Dynamics of non-isothermal adsorption in packed bed
of biporous zeolites. Chem. Eng. J. 2002, 85, 245-257. (27) Rezaei, F.; Mosca, A.; Webley, P.; Hedlund, J.; Xiao, P. Comparison of traditional and
structured adsorbents for CO2 separation by vacuum-swing adsorption. Ind. Eng. Chem. Res. 2010, 49, 4832-4841.
(28) Young, L.C.; Finlayson, B.A. Mathematical modeling of the monolith converter.
Advances in Chemistry Series (13), Seattle, 1974; p. 629. Nomenclature
a specific surface area per unit bed volume, cm2cm-3
aw1 wall internal specific surface area, cm2cm-3
aw2 wall logarithmic specific surface area, cm2cm-3
bi Dual-Site Langmuir isotherm constant
C Bulk concentration, gmole cm-3
C0 feed concentration, gmole cm-3
pC average solid concentration, gmole/cm3
Cpg bulk heat capacity, J mol-1K-1
Cps solid heat capacity, J kg-1K-1
Cpw column wall heat capacity, J kg-1K-1
d channel width, cm
di Dual-Site Langmuir isotherm constant
dw internal wall diameter, cm
De effective diffusivity, cm2s-1
Dm molecular diffusion coefficient, cm2s-1
DL axial dispersion coefficient, cm2s-1
k total mass transfer coefficient, cm s-1
h heat transfer coefficient between the gas and solid phases, W cm-2K-1
hf film heat transfer coefficient, W cm-2K-1
hp pore heat transfer coefficient, W cm-2K-1
152

hw heat transfer coefficient between the gas and adsorber wall, W cm-2K-1
L column length, cm
mi Dual-Site Langmuir isotherm constant
q average adsorbent loading, gmole kg adsorbent-1
R gas constant, 8.314 Jmol-1K-1
R1 inner wall radii of monolith channel, cm
R2 outer wall radii of monolith channel, cm
RP pore radius, cm
Rw adsorber wall radius, cm
t time, s
tw column wall thickness, cm
T adsorbent temperature, K
Tb bulk temperature, K
T0 feed temperature, K
Tw wall temperature, K
U local gas velocity, cm s-1
Uw global heat transfer coefficient, W cm-2K-1
w laminate wall thickness, cm
W zeolite weight fraction
z axial position, cm
- H heat of adsorption, J mol-1
H1 heat of adsorption of CO2, J/mole
H 2 heat of adsorption of N2, J/mol
Greek Symbols
specific surface area, cm2cm-3
g gas density, kg cm-3
s adsorbent density (includes binder,support,etc), kg cm-3
w column wall density, kg cm-3
b gas thermal conductivity, W cm-1K-1
L thermal axial dispersion coefficient, Wcm-1K-1
s adsorbent thermal conductivity, Wcm-1K-1
153

b bed void fraction
p solid void fraction
List of tables
Table 1: CO2 isotherm constants for Dual-Site Langmuir equation
Table 2: Adsorption parameters related to each structured adsorbent
Table 3: Film and pore heat transfer expressions of structured adsorbents
Table 4: Heat transfer properties of different adsorbent structures
154

Table 1
Parameter Values m1 (mol/kg) 2.5495
m2 (mol/kg) 2.4139
b0 (1/kPa) 7.5×10⁻⁷
H1 (J/mol) 32896
d0 (1/kPa) 3. 99×10-8
H2 (J/mol) 32998
Table 2
Adsorbent h a b
Pellet/Bead
0.35-0.4
Monolith
Laminate
Foam
0.75-0.85
pR3
p
b
R)3(1
s
p
f 5R
h1
1
s1
21
22
f 4RRR
h1
1 2
21
1
RR2R
1
b
R2
21
22
1
RR2R
sf 6w
h1
1
w2dd
d2 b
w2
p
b
R2
Table 3
Adsorbent hf expression hp expression
Pellet/Bead Nu = 2 + 1.1Re0.6 Pr0.33 p
sp R
5h
Monolith 0.81
PrRe2139016962 1 )LR(..Nu 2
12
2
1sp RR
R4h
Laminate 0.81
PrRe139016962 )Ld(..Nu
w6h s
p
Foam Nu = 0.91Re0.43 Pr0.33 p
sp R
4h
pR2
s
p
f 4R
h1
1
155

Table 4
Structure Pr Re Nu hf Wm-2K-1
hp Wm-2K-1
h Wm-2K-1
Pellet 0.7 mm 0.43 83 17.35 32.23 28.57 15.15 Monolith 200 cpsi 0.43 172 21.69 27.64 48.00 17.54 Monolith 400 cpsi 0.43 121 19.32 29.90 60.00 19.95 Monolith 600cpsi 0.43 100 16.62 32.24 80.00 23.48 Laminate 0.5x0.5 mm 0.43 59 14.30 37.17 24 14.58 Laminate 0.3x0.3 mm 0.43 36 10.78 46.7 40 21.55 Laminate 0.2x0.2 mm 0.43 24 8.72 56.66 60 29.14 Laminate 0.1x0.1 mm 0.43 12 6.25 81.26 120 48.45 Foam 20 ppi 0.43 50 12.96 10.46 9.94 5.1 Foam 30 ppi 0.43 36 10.78 11.77 13.45 6.28 Foam 45 ppi 0.43 24 8.72 13.05 18.43 7.64
156

List of figures
Figure 1. CO2 breakthrough curves (a) and temperature profiles (b) in packed beds of pellets
under isothermal, adiabatic and non-adiabatic conditions.
Figure 2. CO2 breakthrough curves (a) and temperature profiles (b) in monolith beds under
isothermal, adiabatic and non-adiabatic conditions.
Figure 3. CO2 breakthrough curves (a) and temperature profiles (b) in foam beds under
isothermal, adiabatic and non-adiabatic conditions.
Figure 4. CO2 breakthrough curves (a) and temperature profiles (b) in laminate beds under
isothermal, adiabatic and non-adiabatic conditions.
Figure 5. Comparison of CO2 breakthrough curves (a) and temperature profiles (b) in
different bed configurations under adiabatic conditions.
Figure 6. Comparison of CO2 breakthrough curves (a) and temperature profiles (b) in
different bed configurations under non-adiabatic conditions.
Figure 7. Dimensionless CO2 loading of two-step PSA cycle with half cycle time c = 0.1 (a)
c = 0.04 (b) on different adsorbent structures and on laminate adsorbents with different
dimensions at c = 0.1 (c).
157
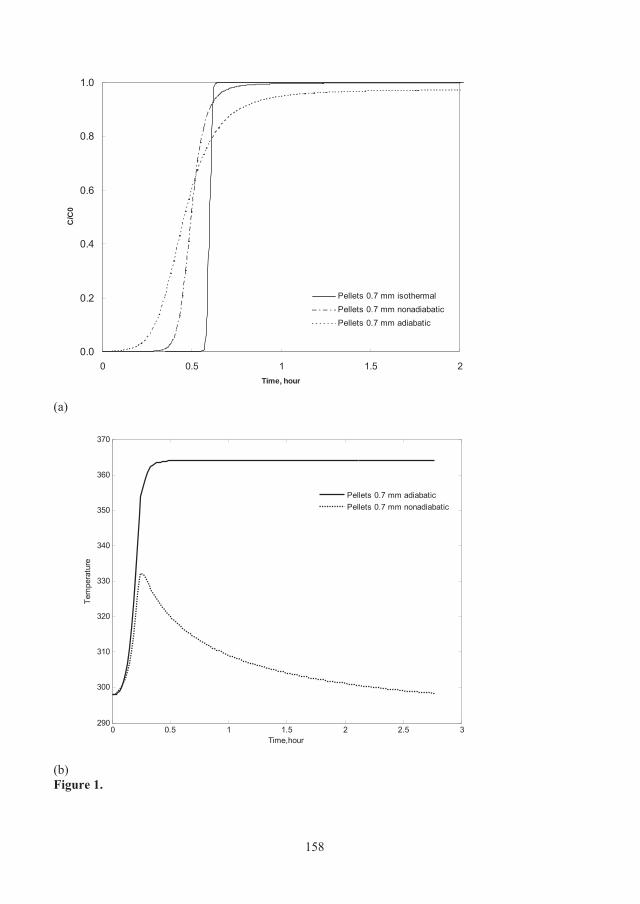
0.0
0.2
0.4
0.6
0.8
1.0
0 0.5 1 1.5Time, hour
C/C
0
2
Pellets 0.7 mm isothermalPellets 0.7 mm nonadiabaticPellets 0.7 mm adiabatic
(a)
0 0.5 1 1.5 2 2.5 3290
300
310
320
330
340
350
360
370
Time,hour
Tem
pera
ture
Pellets 0.7 mm adiabaticPellets 0.7 mm nonadiabatic
(b) Figure 1.
158
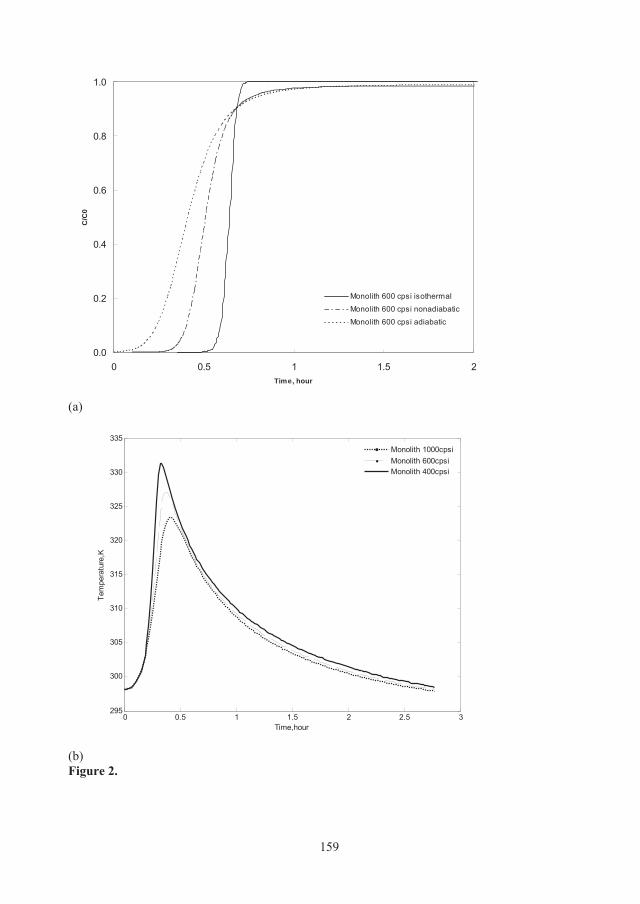
0.0
0.2
0.4
0.6
0.8
1.0
0 0.5 1 1.5 2Time, hour
C/C
0
Monolith 600 cpsi isothermal
Monolith 600 cpsi nonadiabatic
Monolith 600 cpsi adiabatic
(a)
0 0.5 1 1.5 2 2.5 3295
300
305
310
315
320
325
330
335
Time,hour
Tem
pera
ture
,K
Monolith 1000cpsiMonolith 600cpsiMonolith 400cpsi
(b) Figure 2.
159

0.0
0.2
0.4
0.6
0.8
1.0
0 0.5 1 1.5 2Time, hour
C/C
0
Foam 30 ppi isothermal
Foam 30 ppi nonadiabatic
Foam 30 ppi adiabatic
(a)
0 0.5 1 1.5 2 2.5 3296
298
300
302
304
306
308
310
312
314
316
Time,hour
Tem
pera
ture
,K
Foam 45ppiFoam 30ppiFoam 20ppi
(b) Figure 3.
160

0.0
0.2
0.4
0.6
0.8
1.0
0 0.5 1 1.5 2Time, hour
C/C
0
Laminate 0.2x0.2 isothermal
Laminate 0.2x0.2 nonadiabatic
Laminate 0.2x0.2 adiabatic
(a)
0 0.5 1 1.5 2 2.5 3290
300
310
320
330
340
350
Time,hour
Tem
pera
ture
, K
Laminate 0.5x0.5Laminate 0.3x0.3Laminate 0.2x0.2Laminate 0.1x0.1
(b) Figure 4.
161

0.0
0.2
0.4
0.6
0.8
1.0
0 0.5 1 1.5 2Time, hour
C/C
0
Pellet 0.7 mm
Foam 30 ppi
Laminate 0.2x0.2Monolith 600 cpsi
(a)
0 0.5 1 1.5 2 2.5290
300
310
320
330
340
350
360
370
Time,hour
Tem
pera
ture
,K
Pellets 0.7 mmFoam 30 ppiLaminate 0.2x0.2Monolith 600 cpsi
(b) Figure 5.
162
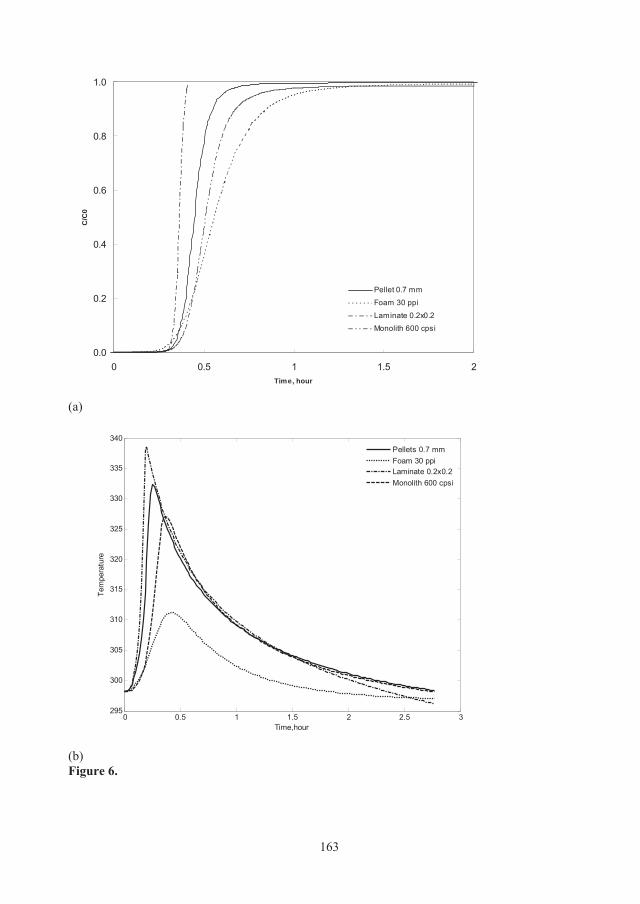
0.0
0.2
0.4
0.6
0.8
1.0
0 0.5 1 1.5 2Time, hour
C/C
0
Pellet 0.7 mm
Foam 30 ppi
Laminate 0.2x0.2Monolith 600 cpsi
(a)
0 0.5 1 1.5 2 2.5 3295
300
305
310
315
320
325
330
335
340
Time,hour
Tem
pera
ture
Pellets 0.7 mmFoam 30 ppiLaminate 0.2x0.2Monolith 600 cpsi
(b) Figure 6.
163

0.4 0.45 0.5 0.55 0.60
0.1
0.2
0.3
0.4
0.5
0.6
0.7
0.8
0.9
Dimensionless Time
Dim
ensi
onle
ss C
O2
Load
ing
Pellets 0.7 mmLaminate 0.2x0.2Monolith 600 cpsiFoam 30 ppi
(a)
164

0.72 0.74 0.76 0.78 0.8 0.82
0.3
0.35
0.4
0.45
0.5
0.55
0.6
0.65
0.7
Dimensionless Time
Dim
ensi
onle
ss C
O2
Load
ing
Pellets 0.7 mmLaminate 0.2x0.2Monolith 600 cpsiFoam 30 ppi
(b)
165
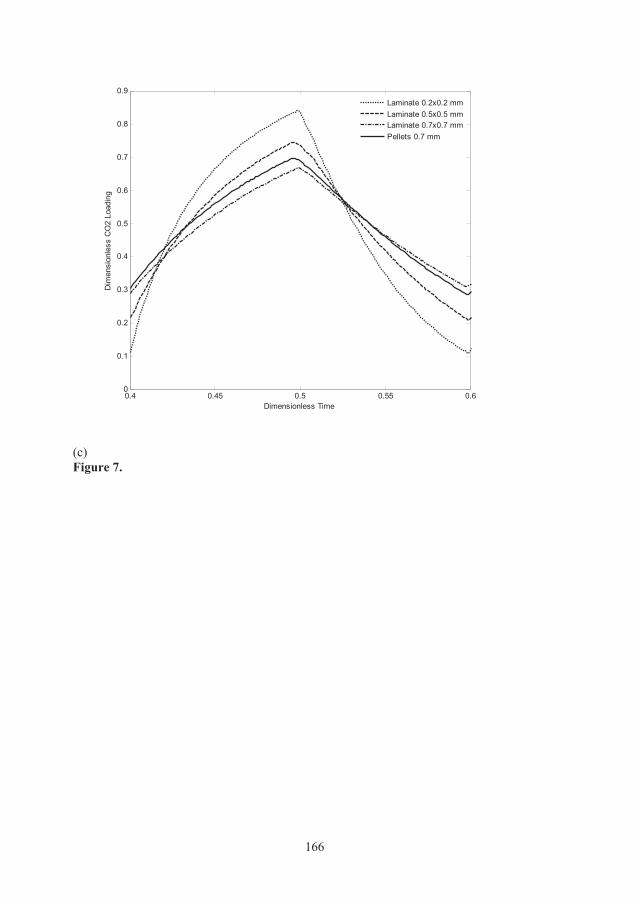
166
0.4 0.45 0.5 0.55 0.60
0.1
0.2
0.3
0.4
0.5
0.6
0.7
0.8
0.9
Dimensionless Time
Dim
ensi
onle
ss C
O2
Load
ing
Laminate 0.2x0.2 mmLaminate 0.5x0.5 mmLaminate 0.7x0.7 mmPellets 0.7 mm
(c) Figure 7.


![The Adsorption and Separation of CO2/CH4 Mixtures with ... · with Nanoporous Adsorbents by molecular simulation . ... H = 2.43 nm and pressure P = 2.56-3.41 MPa. Peng [12] ... Huang](https://static.fdocuments.net/doc/165x107/5b252bfe7f8b9a76208b485f/the-adsorption-and-separation-of-co2ch4-mixtures-with-with-nanoporous-adsorbents.jpg)


