High-throughput screening and optimization of a multimodal ...

John W Ward, MD
Task Force for Global Health
CDC, Atlanta, Georgia, USA
Optimization of
Screening Strategies

Agenda
Screening Criteria
Screening Roles
Essential Components of Screening Programs
Technical and Operational Research

Public Health Screening Criteria
1. The condition sought should be an important health problem.
2. There should be an accepted treatment
3. Facilities for diagnosis and treatment should be available.
4. There should be a recognizable latent or early symptomatic stage.
5. There should be a suitable test or examination.
6. The test should be acceptable to the population.
7. The natural history of the condition should be adequately understood.
8. There should be an agreed policy on whom to treat as patients.
9. The cost of case-finding should be economically balanced in relation to possible expenditure on medical care as a whole.
10. Case-finding should be a continuing process
Wilson Junger, WHO 1968. www.who.int

Role of Screening
• Prevention of transmission
• Prevention of disease and mortality
• Policy and planning
• Public health surveillance and program evaluation

HBV Testing Patient Population
Total anti-HBc
Reactive
HBsAg
HBV DNA
>20,000
Treat
HBV DNA
<20,000
Monitor
Non-reactive
Anti-HBs quantitative
Reactive/Non-reactive
Detect antibody protection
Detect active infectionLab-based or Point of Care
HBV DNA testingLab based
Detect evidence of infection
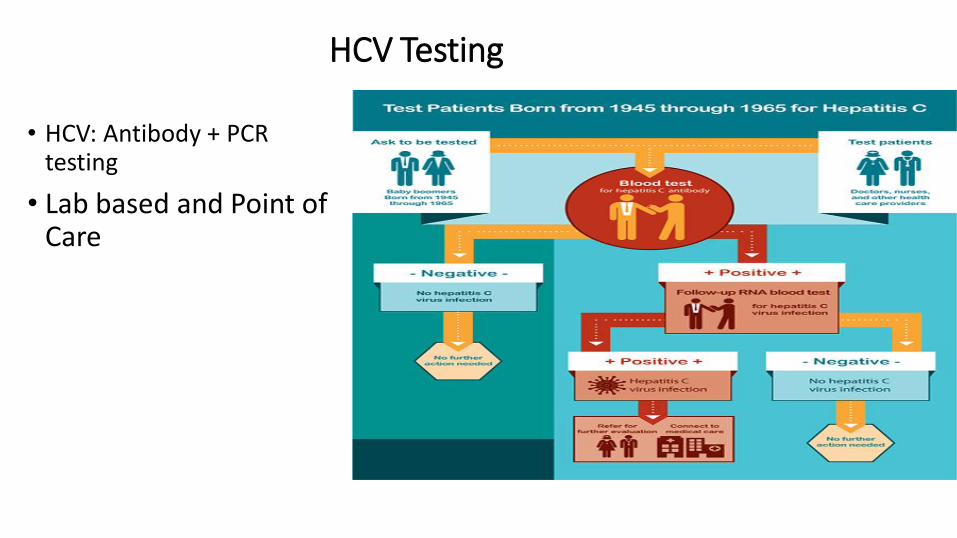
HCV Testing
• HCV: Antibody + PCR testing
• Lab based and Point of Care
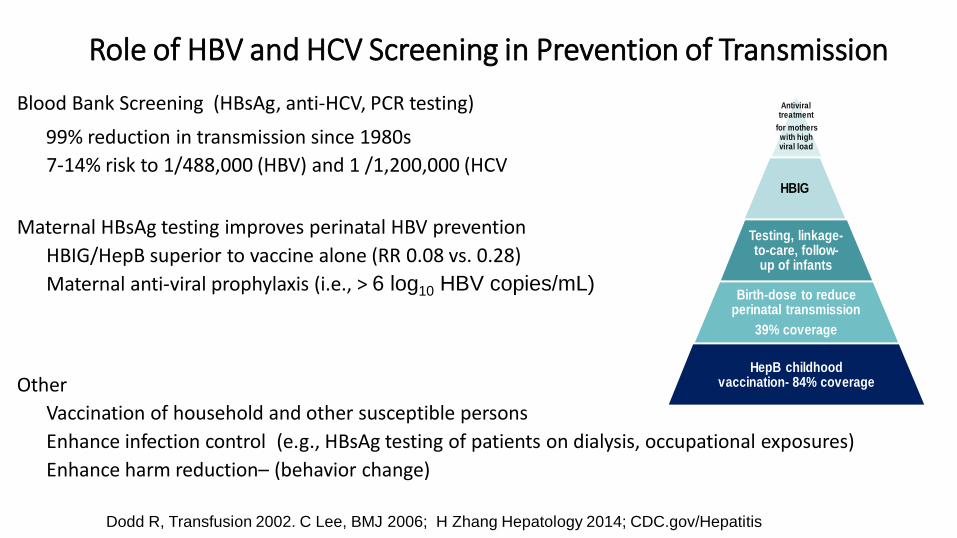
Role of HBV and HCV Screening in Prevention of Transmission
Blood Bank Screening (HBsAg, anti-HCV, PCR testing)
99% reduction in transmission since 1980s
7-14% risk to 1/488,000 (HBV) and 1 /1,200,000 (HCV
Maternal HBsAg testing improves perinatal HBV prevention
HBIG/HepB superior to vaccine alone (RR 0.08 vs. 0.28)
Maternal anti-viral prophylaxis (i.e., > 6 log10 HBV copies/mL)
Other
Vaccination of household and other susceptible persons
Enhance infection control (e.g., HBsAg testing of patients on dialysis, occupational exposures)
Enhance harm reduction– (behavior change)
Dodd R, Transfusion 2002. C Lee, BMJ 2006; H Zhang Hepatology 2014; CDC.gov/Hepatitis
Antiviral treatment
for mothers with high viral load
HBIG
Testing, linkage-to-care, follow-up of infants
Birth-dose to reduce perinatal transmission
39% coverage
HepB childhood vaccination- 84% coverage

Antiviral Therapy Can Reduce HCV Prevalence Among Injecting Drug Users
Annually treating 10 HCV infections per 1000 IDU and achieve SVR of 62.5%
Projected to result in a relative decrease in HCV prevalence over 10 years of 31%, 13%, or 7% for prevalence of 20%, 40%, or 60%, respectively
HCV Cure as Prevention
Martin et al. Journal of Hepatology 2011 vol. 54 j 1137–1144
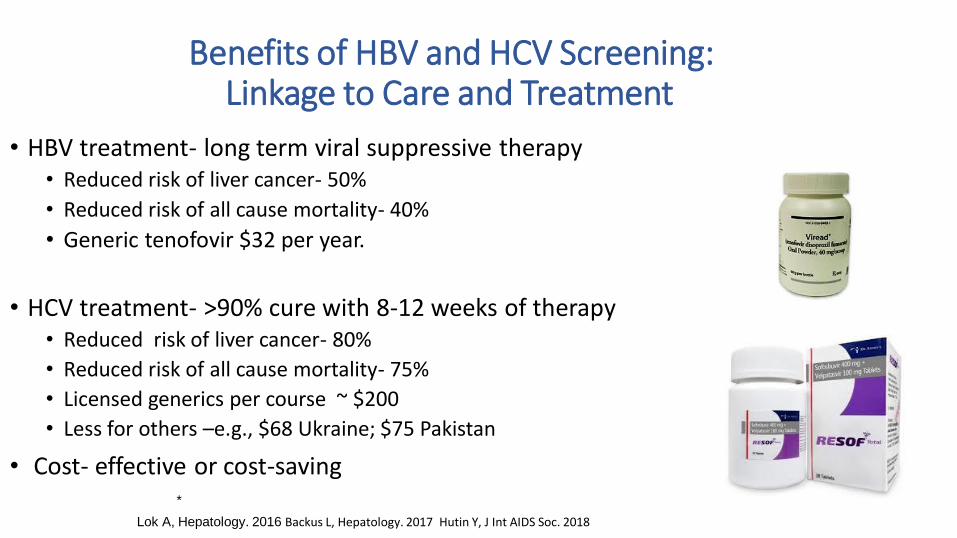
Benefits of HBV and HCV Screening:Linkage to Care and Treatment
• HBV treatment- long term viral suppressive therapy • Reduced risk of liver cancer- 50%
• Reduced risk of all cause mortality- 40%
• Generic tenofovir $32 per year.
• HCV treatment- >90% cure with 8-12 weeks of therapy• Reduced risk of liver cancer- 80%
• Reduced risk of all cause mortality- 75%
• Licensed generics per course ~ $200
• Less for others –e.g., $68 Ukraine; $75 Pakistan
• Cost- effective or cost-saving
Lok A, Hepatology. 2016 Backus L, Hepatology. 2017 Hutin Y, J Int AIDS Soc. 2018
*
Sources – WHO (Center for Disease Analysis )
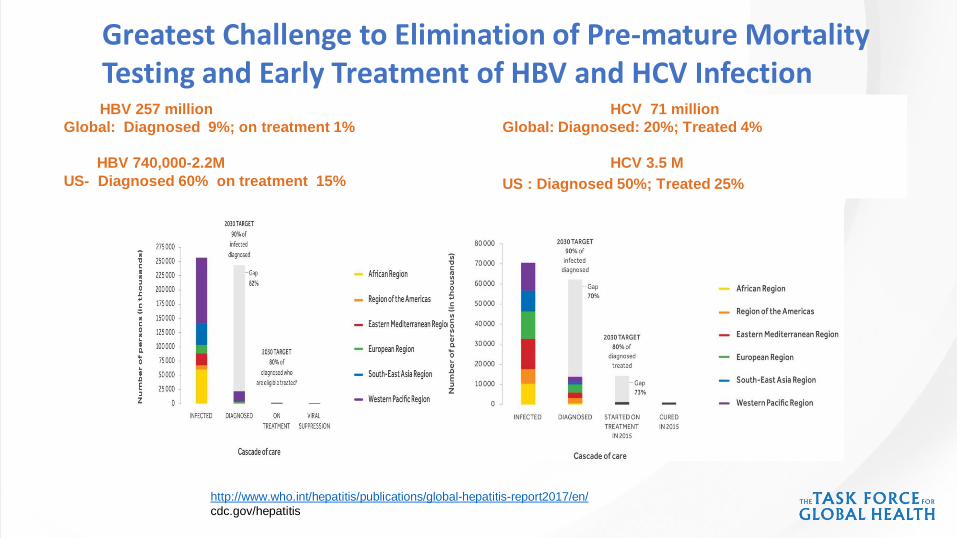
HBV 257 million
Global: Diagnosed 9%; on treatment 1%
HBV 740,000-2.2M
US- Diagnosed 60% on treatment 15%
HCV 71 million
Global: Diagnosed: 20%; Treated 4%
HCV 3.5 M
US : Diagnosed 50%; Treated 25%
Greatest Challenge to Elimination of Pre-mature Mortality Testing and Early Treatment of HBV and HCV Infection
http://www.who.int/hepatitis/publications/global-hepatitis-report2017/en/
cdc.gov/hepatitis
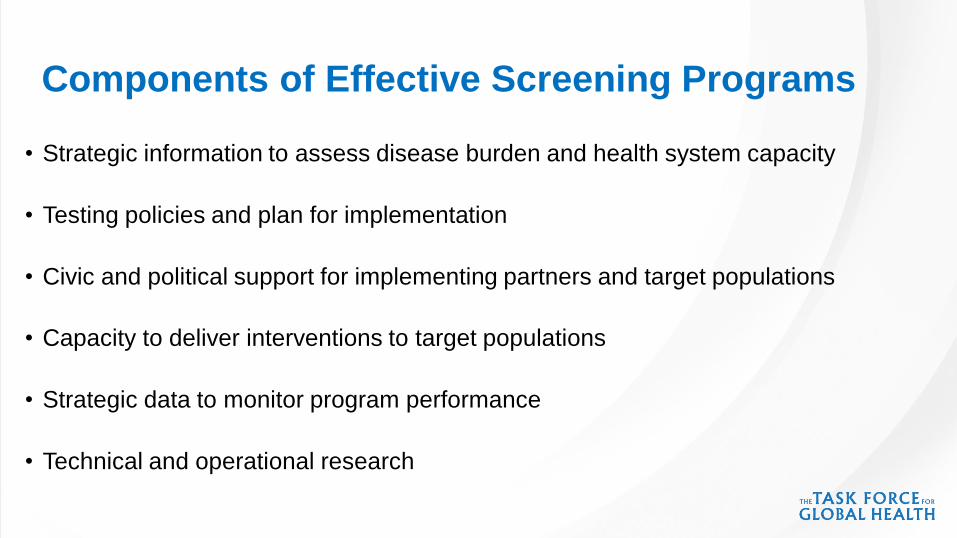
Components of Effective Screening Programs
• Strategic information to assess disease burden and health system capacity
• Testing policies and plan for implementation
• Civic and political support for implementing partners and target populations
• Capacity to deliver interventions to target populations
• Strategic data to monitor program performance
• Technical and operational research

WHO Recommendations for HBV and HCV Testing and Treatment
• Testing
• Risk populations- exposures, clinical illness
• Exposures- blood, and sexual and household (HBV)
• All blood donors
• General population- > 2% or > 5% prevalence including HBsAg for pregnant women;
• Sub-population
• Birth cohorts
• Treat all persons with HCV
13
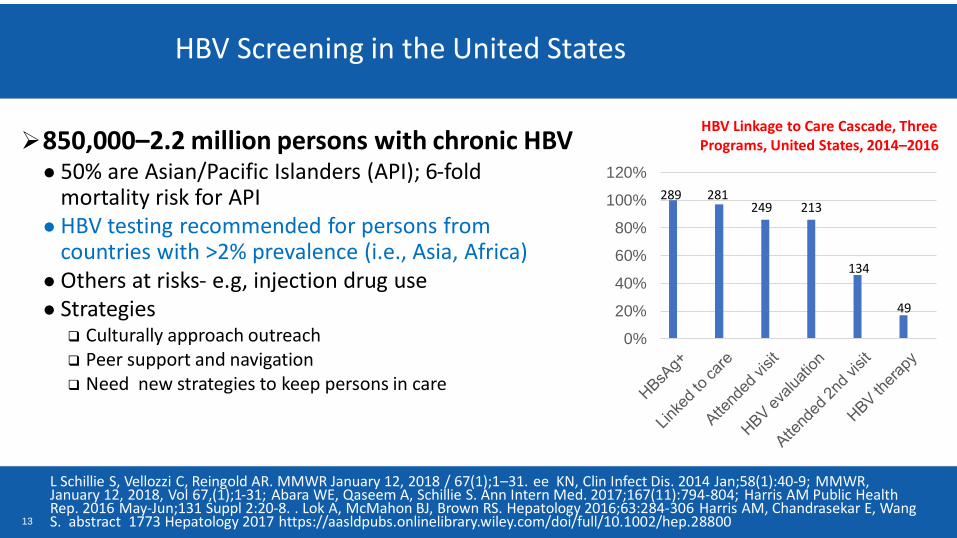
HBV Screening in the United States
L Schillie S, Vellozzi C, Reingold AR. MMWR January 12, 2018 / 67(1);1–31. ee KN, Clin Infect Dis. 2014 Jan;58(1):40-9; MMWR, January 12, 2018, Vol 67,(1);1-31; Abara WE, Qaseem A, Schillie S. Ann Intern Med. 2017;167(11):794-804; Harris AM Public Health Rep. 2016 May-Jun;131 Suppl 2:20-8. . Lok A, McMahon BJ, Brown RS. Hepatology 2016;63:284-306 Harris AM, Chandrasekar E, Wang S. abstract 1773 Hepatology 2017 https://aasldpubs.onlinelibrary.wiley.com/doi/full/10.1002/hep.28800
850,000–2.2 million persons with chronic HBV● 50% are Asian/Pacific Islanders (API); 6-fold
mortality risk for API● HBV testing recommended for persons from
countries with >2% prevalence (i.e., Asia, Africa)● Others at risks- e.g, injection drug use ● Strategies
Culturally approach outreach Peer support and navigation Need new strategies to keep persons in care
HBV Linkage to Care Cascade, Three Programs, United States, 2014–2016
0%
20%
40%
60%
80%
100%
120%
289 281249 213
134
49
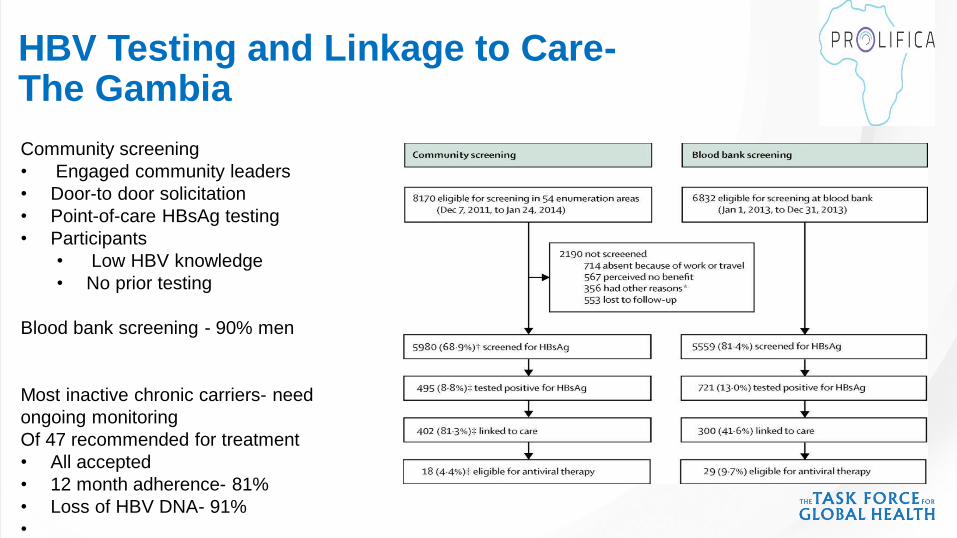
HBV Testing and Linkage to Care-The Gambia
Community screening
• Engaged community leaders
• Door-to door solicitation
• Point-of-care HBsAg testing
• Participants
• Low HBV knowledge
• No prior testing
Blood bank screening - 90% men
Most inactive chronic carriers- need
ongoing monitoring
Of 47 recommended for treatment
• All accepted
• 12 month adherence- 81%
• Loss of HBV DNA- 91%
•
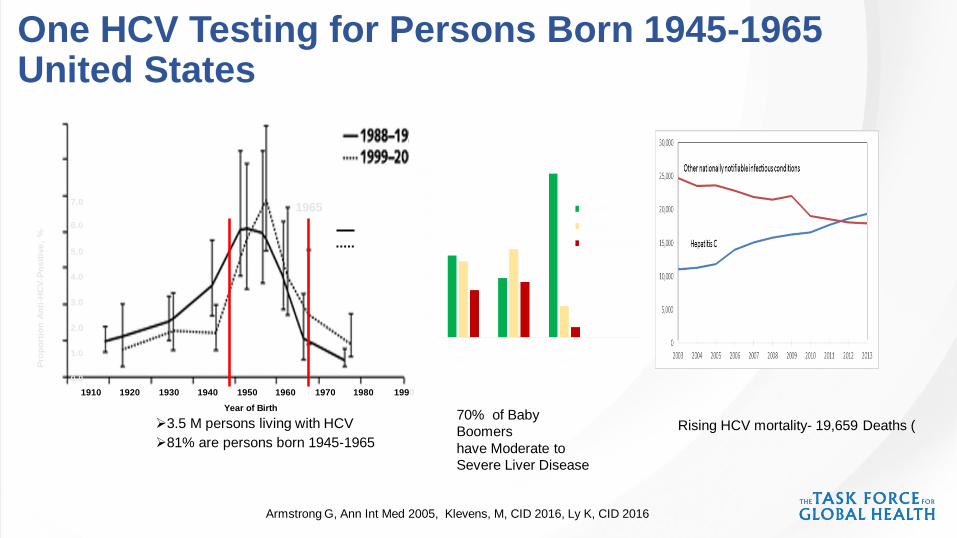
One HCV Testing for Persons Born 1945-1965 United States
Armstrong G, Ann Int Med 2005, Klevens, M, CID 2016, Ly K, CID 2016
Rising HCV mortality- 19,659 Deaths (
7.0
6.0
5.0
4.0
3.0
2.0
1.0
0.0
1910 1920 1930 1940 1950 1960 1970 1980 1990
Year of Birth
Pro
po
rtio
n A
nti
-HC
V-P
osit
ive
, %
1965
3.5 M persons living with HCV
81% are persons born 1945-1965
70% of Baby
Boomers
have Moderate to
Severe Liver Disease

Proportion of HCV infected Persons by Year of Birth- 16 Countries
Gane et al. ,J Viral Hepatitis, 2015

HCV Burden of Disease, HCV Testing
and Treatment Cost- Thailand

Strategies that Expand Access to
HCV Testing, Care and Cure- United States
•Testing policies
• Provider education
•Clinical decision tools
•Reflex RNA testing
•Performance
indicators/incentives
•Case management
•Co-localization of HCV and
primary care
• Accessible HCV therapies 0
0,5
1
1,5
2
2,5
3
3,5
4
4,5
2005 2006 2007 2008 2009 2010 2011 2012 2013 2014
Perc
en
t 1945-1965
Other birthyears
Birth Year Group
91% increase Percent HCV Antibody Tested by Birth Year Group
Brady J, Hepatology 2017, Isenhour, C, AJPH 2017, B Reilly MMWR, 2016, Kanwal F,
Clin Gastroenterol Hepatol 2012, Coyle, C, MMWR 2015, Mera, MMWR 2016, Canary L, Ann Int Med 2015, CDC unpublished data
68,440,635 unique enrollees

Educating Providers and Communities

Reflex HCV Testing
Public-Private Partnerships
CDC, unpublished data
Quest changes policy and tests all anti-HCV+ specimens
Total tested: Quest 415,000; LabCorps 319,000

Eliminating Hepatitis C Among US Military Veterans- VA
Implementing strategies
– Standing testing orders/reminders
– Care algorithms
– Program evaluation and staff accountability
– Resources for HCV treatment
Status
– 78.8% of Veterans born 1945-1965 screened for HCV
– >90% diagnosed; ~15,500 undiagnosed
– 87,000 treated with all-oral DAAs; 90-95% cure
– 58,000 remain eligible for treatment; most difficult to engage in care
Tim Morgan viralhepatitisaction.org/summit-presentationsTim Morgan viralhepatitisaction.org/summit-presentations
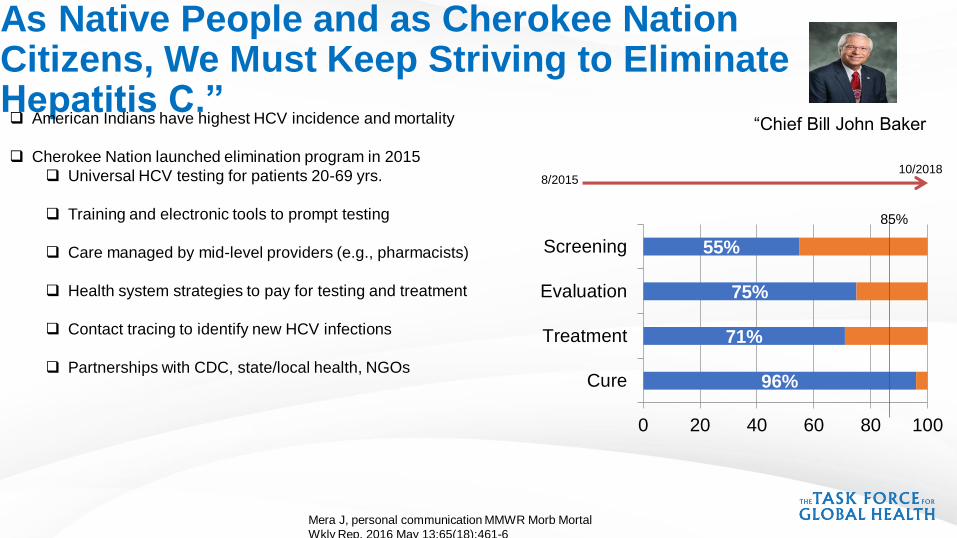
As Native People and as Cherokee Nation Citizens, We Must Keep Striving to Eliminate Hepatitis C.”
Mera J, personal communication MMWR Morb Mortal
Wkly Rep. 2016 May 13;65(18):461-6
“Chief Bill John Baker American Indians have highest HCV incidence and mortality
Cherokee Nation launched elimination program in 2015
Universal HCV testing for patients 20-69 yrs.
Training and electronic tools to prompt testing
Care managed by mid-level providers (e.g., pharmacists)
Health system strategies to pay for testing and treatment
Contact tracing to identify new HCV infections
Partnerships with CDC, state/local health, NGOs
8/201510/2018
96%
71%
75%
55%
0 20 40 60 80 100
Cure
Treatment
Evaluation
Screening
85%

Elimination Programs Improve AccessCountry of Georgia Example
• ~150,000 HCV RNA+ persons; 5.4% prevalence
• Goal: 90% diagnosed; 95% treated; 95% cured by 2020
• 40,000 HCV RNA+ persons treated (5/15-10/2017)
• Key tools
• National planning
• Data to guide and evaluate program
• Health system strengthening
• Political support
• Partnerships – Gilead, Abbott, CDC, State, WHO,
Nasrullah M, Nat Rev Gastroenterol Hepatol. 2017 Jul

Evaluate Quality of Hepatitis Laboratory Testing WHO Assessment Tool Hep-LAT (10 Quality System Elements)
100%98%
94%100%97%
33%93%
78%92%
80%
0% 20% 40% 60% 80% 100%
1-building facilities…2-biosafety, hygiene…
3-specimen collection…4-equipment
5-reagents and supply6-analysis and test…7-laboratory staff &…
8-total quality9-reporting, analysis &…
10- outbreak…
81%20%
59%32%
97%17%
73%20%25%0%
0% 20% 40% 60% 80% 100%
1-building facilities…2-biosafety, hygiene…
3-specimen collection…4-equipment
5-reagents and supply6-analysis and test…7-laboratory staff &…
8-total quality9-reporting, analysis &…
10- outbreak…
Laboratory Systems
Republic of Georgia
# of Labs Hep-LAT Indicator
Mean (Range)
Total Annual Test
Volume (2014 estimated)
NCDC Public Health Labs 10 85% (79%-92%) 5,000
Clinical Laboratories 9 64% (42%-92%) 50,000
DVH WIP | June 13, 2017

25
Increase Priority for Neglected Populations: The Incarcerated
Canary L, APHA 2016; CDC unpublished data He T, Ann Intern Med. 2016 Jan 19;164(2):84-92 Hochstatter KR, Health Justice. 2017 Oct 30;5(1):10.
https://www.nytimes.com/2018/03/15/us/hepatitis-c-drugs-prisons.html
Incidence 16·4 per 100py
Prevalence -26% ; 2.2M
Testing/treatment cost-effective $20-29K/QALY
Only 6 studies to guide HCV testing
Fewer studies of care and treatment
March 18, 2018
Any National Campaign to Eliminate Hepatitis C
Would Almost Certainly Involve Prisons.” —
26
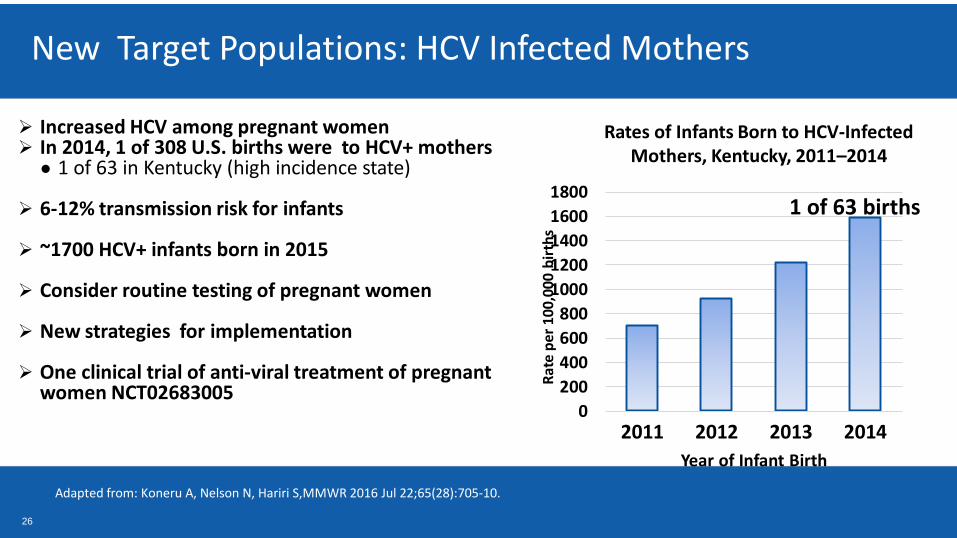
New Target Populations: HCV Infected Mothers
Adapted from: Koneru A, Nelson N, Hariri S,MMWR 2016 Jul 22;65(28):705-10.
Increased HCV among pregnant women In 2014, 1 of 308 U.S. births were to HCV+ mothers
● 1 of 63 in Kentucky (high incidence state)
6-12% transmission risk for infants
~1700 HCV+ infants born in 2015
Consider routine testing of pregnant women
New strategies for implementation
One clinical trial of anti-viral treatment of pregnant women NCT02683005
0
200
400
600
800
1000
1200
1400
1600
1800
2011 2012 2013 2014
Year of Infant Birth
1 of 63 births
Rates of Infants Born to HCV-Infected Mothers, Kentucky, 2011–2014
Rat
e p
er
100,
000
bir
ths

Consider Screening All Adults for HCV infection
• Response to large increases in HCV incidence (United States)
• Increase opportunities for treatment as prevention
• Recognized benefits of early treatment
• Integrate with other strategies- i.e., HIV
• Cost-effective
• United States
• $28,000/QALY with 280,000 additional cures
• $11,378/QALY gained when HCV prevalence > 0.07%
• France - €31,100/QALY.
Eckman M, Clin Gastroenterol Hepatol. 2018; Deuffic-Burban S ; J Hepatol. 2018 Barocas JA Clin Infect Dis.
2018

Improve Tests for Current HCV infection
Mixon-Hayden T Journal of Clinical Virology Hullegie SJ, Int AIDS Soc. 2017 Tala A, J Subst Abuse Treat. 2017; Gupta E, J Clin Virol. 2017; McHugh MP; J Clin Microbiol. 2017 May
28
• HCV core antigen testing: low sample volume, less pristine
sampling; rapid turn around (1 hour), CE marked
• High correlation with HCV RNA
• High sensitivity/ specificity; in 33 studies – 93% /99%
• Reduced sensitivity at <3000 HCV RNA
• Not widely commercially available
• Point of care PCR: rapid turn around (105 minutes vs 5
hours for lab-based ) limit of detection (10 to 10 8 ) similar
to lab based PCR no biosafety handling, CE marked
• Sensitivity/ specificity 100%/94%
• Need POC

Components of Effective Screening Programs
• Strategic information to assess disease burden and health system capacity
• Testing policies and plan for implementation
• Civic and political support for implementing partners and target populations
• Capacity to deliver interventions to target populations
• Strategic data to monitor program performance
• Technical and operational research

Let’s Work Together to Eliminate Viral Hepatitis