Optimization of load-bearing and impact energy absorption ...
64
Rowan University Rowan University Rowan Digital Works Rowan Digital Works Theses and Dissertations 7-7-2021 Optimization of load-bearing and impact energy absorption Optimization of load-bearing and impact energy absorption capacities of honeycomb structures by density gradation capacities of honeycomb structures by density gradation Oyindamola Khadijat Rahman Rowan University Follow this and additional works at: https://rdw.rowan.edu/etd Part of the Materials Science and Engineering Commons, and the Mechanical Engineering Commons Recommended Citation Recommended Citation Rahman, Oyindamola Khadijat, "Optimization of load-bearing and impact energy absorption capacities of honeycomb structures by density gradation" (2021). Theses and Dissertations. 2931. https://rdw.rowan.edu/etd/2931 This Thesis is brought to you for free and open access by Rowan Digital Works. It has been accepted for inclusion in Theses and Dissertations by an authorized administrator of Rowan Digital Works. For more information, please contact [email protected].
Transcript of Optimization of load-bearing and impact energy absorption ...
Rowan University Rowan University
Rowan Digital Works Rowan Digital Works
Theses and Dissertations
7-7-2021
Optimization of load-bearing and impact energy absorption Optimization of load-bearing and impact energy absorption
capacities of honeycomb structures by density gradation capacities of honeycomb structures by density gradation
Oyindamola Khadijat Rahman Rowan University
Follow this and additional works at: https://rdw.rowan.edu/etd
Part of the Materials Science and Engineering Commons, and the Mechanical Engineering Commons
Recommended Citation Recommended Citation Rahman, Oyindamola Khadijat, "Optimization of load-bearing and impact energy absorption capacities of honeycomb structures by density gradation" (2021). Theses and Dissertations. 2931. https://rdw.rowan.edu/etd/2931
This Thesis is brought to you for free and open access by Rowan Digital Works. It has been accepted for inclusion in Theses and Dissertations by an authorized administrator of Rowan Digital Works. For more information, please contact [email protected].
OPTIMIZATION OF LOAD-BEARING AND IMPACT ENERGY ABSORPTION
CAPACITIES OF HONEYCOMB STRUCTURES BY DENSITY GRADATION
by
Oyindamola Rahman
A Thesis
Submitted to the
Department of Mechanical Engineering
Henry M. Rowan College of Engineering
In partial fulfillment of the requirement
For the degree of
Master of Science in Engineering
at
Rowan University
June 3, 2021
Thesis Chair: Behrad Koohbor, Ph.D.
Committee Members:
Chen Shen, Ph.D.
Nand Singh, Ph.D.

© 2021 Oyindamola Rahman

iii
Acknowledgements
Foremost, I give thanks to Almighty God, for without his mercies and grace, this study
would not have been possible. I would also like to appreciate my parents Mr. and Mrs.
Rahman for their love, prayer, and sacrifices for educating and preparing me for the
future.
Similarly, my deep and sincere gratitude goes to my esteemed research supervisor, Dr.
Behrad Koohbor, for being the ideal advisor and for giving me the opportunity to do this
research and providing invaluable guidance and insightful criticism which aided in the
writing of this paper in numerable ways. Many thanks for his words of encouragement
which have always been enlightening. I could not imagine a better advisor and it is a
great privilege to study under his guidance.
I would like to thank my colleagues, Kazi, Jeeva, Robert and Nick whom I have worked
with over the last two years for showing me support and giving me their time, energy,
and expertise. The general help and friendship are greatly appreciated. Also, I express my
gratitude to my little sisters, Oyinlola, Oyinkan, and Bolu for their support, prayers, and
words of encouragement towards the actualization of this dream. May God continue to
bless and keep them.
Last and certainly not the least, my express gratitude goes to Olayemi Shittu for going on
this journey quite willingly with me. Thank you for always bolstering my spirits and for
your unwavering believe in me and my abilities

iv
Abstract
Oyindamola Rahman
OPTIMIZATION OF LOAD-BEARING AND IMPACT ENERGY ABSORPTION
CAPACITIES OF HONEYCOMB STRUCTURES BY DENSITY GRADATIONS
2020-2021
Behrad Koohbor, PhD.
Master of Science in Mechanical Engineering
Density gradation has been analytically and experimentally proven to enhance the load-
bearing and energy absorption efficiency of cellular solids. This research focuses on the
analytical optimization (by virtual experiments) of polymeric honeycomb structures made
from flexible thermoplastics to achieve density-graded structures with desired mechanical
properties. The global stress-strain curves of single-density honeycomb structures are
used as input to an analytical model that enables the characterization of the constitutive
response of density-graded hexagonal honeycombs with discrete and continuous
gradations and for various gradients. The stress-strain outputs are used to calculate the
specific energy absorption, efficiency, and ideality metrics for all density-graded
structures. The analytical results are shown to be in good agreement with previous
experimental measurements. The findings of this research suggest that the choice of an
optimal gradient depends on the specific application and design criteria. For example,
graded structures wherein low-density layers are dominant are shown to outperform high
density uniform honeycombs in terms of specific energy absorption capacity while
possessing higher strength compared with low density uniform structures.
v
Table of Contents
Abstract .............................................................................................................................. iv
List of Figures .................................................................................................................... vi
List of Tables .................................................................................................................... vii
Chapter 1: Introduction ........................................................................................................ 1
1.1 Motivation for Present Work .................................................................................. 6
1.2 Objective of Thesis ................................................................................................. 7
1.3 Outline of Thesis .................................................................................................... 7
Chapter 2: Density-Dependent Constitutive Model ............................................................. 9
Chapter 3: Modelling ......................................................................................................... 15
3.1. Materials and Gradients ....................................................................................... 15
3.2 Analytical Model Development ........................................................................... 19
Chapter 4: Model Validation ............................................................................................. 22
4.1. Model Validation and Deformation Mechanism ................................................. 22
4.2 Strength-Energy Absorption Correlation ............................................................. 26
4.3 Hexagonal Honeycombs with Continuous Gradients .......................................... 31
Chapter 5: Conclusions and Future Directions .................................................................. 36
5.1 Conclusions .......................................................................................................... 36
5.2 Future Directions .................................................................................................. 37
References .......................................................................................................................... 39
Appendix ............................................................................................................................ 44
vi
List of Figures
Figure Page
Figure 1. Schematics of a Honeycomb Structure [7] ........................................................... 1
Figure 2. Honeycomb Crash Absorption Structure [8] ........................................................ 2
Figure 3. Mechanics of a Single-Density Honeycomb Structure ......................................... 3
Figure 4. Schematic of a Single Elastomeric Hexagonal Cell ........................................... 12
Figure 5. Stress-Strain-Specific Energy Absorption Metrics ............................................. 14
Figure 6. Schematic of Density Graded Honeycomb Structure ......................................... 18
Figure 7. Stress-Strain, Specific Energy, and Efficiency Diagrams [34] ........................... 25
Figure 8. Stress Relationship Metrics ................................................................................ 27
Figure 9. Specific Energy Absorption Correlation ............................................................ 28
Figure 10. Strain Range ..................................................................................................... 30
Figure 11. Stress-Strain and Specific Energy-Stress Responses ........................................ 31
Figure 12. Distribution of Relative Density ....................................................................... 32
Figure 13. Continuously Graded Structures. ...................................................................... 34

vii
List of Tables
Table Page
Table 1. Gradients and Properties of Hexagonal Honeycombs ......................................... 16
Table 2. Continuously Graded Honeycombs ..................................................................... 18
1
Chapter 1
Introduction
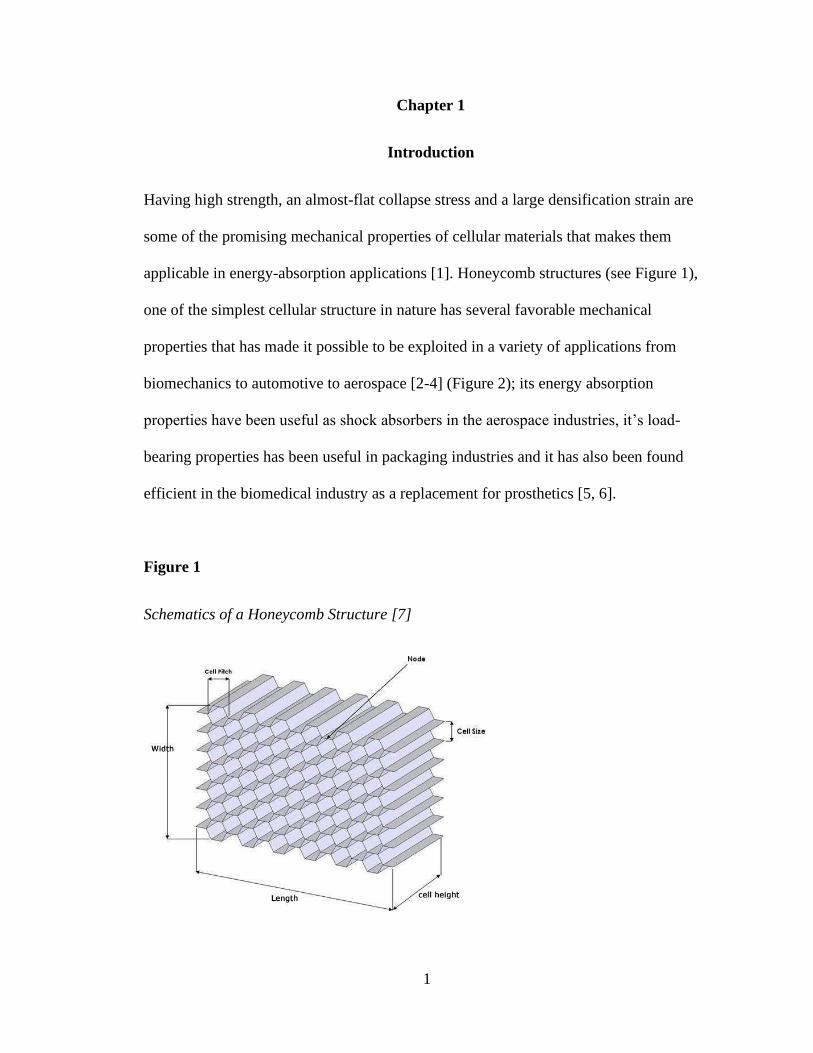
Having high strength, an almost-flat collapse stress and a large densification strain are
some of the promising mechanical properties of cellular materials that makes them
applicable in energy-absorption applications [1]. Honeycomb structures (see Figure 1),
one of the simplest cellular structure in nature has several favorable mechanical
properties that has made it possible to be exploited in a variety of applications from
biomechanics to automotive to aerospace [2-4] (Figure 2); its energy absorption
properties have been useful as shock absorbers in the aerospace industries, it’s load-
bearing properties has been useful in packaging industries and it has also been found
efficient in the biomedical industry as a replacement for prosthetics [5, 6].
Figure 1
Schematics of a Honeycomb Structure [7]
2
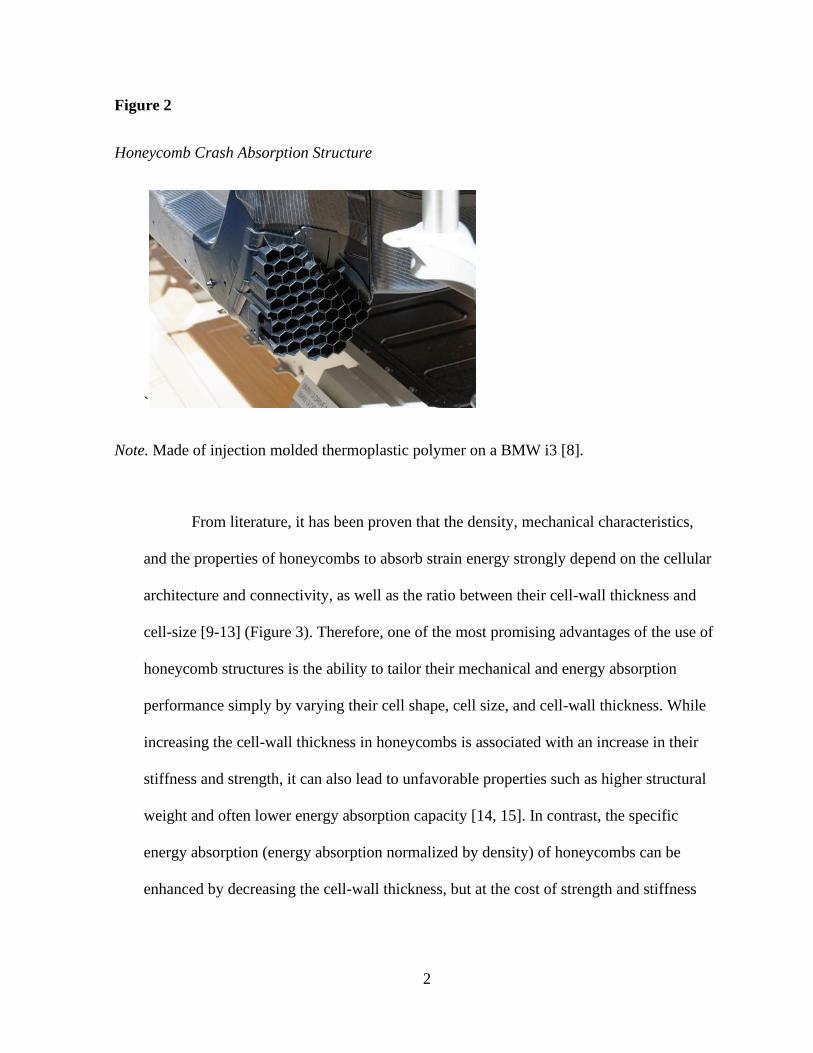
Figure 2
Honeycomb Crash Absorption Structure
`
Note. Made of injection molded thermoplastic polymer on a BMW i3 [8].
From literature, it has been proven that the density, mechanical characteristics,
and the properties of honeycombs to absorb strain energy strongly depend on the cellular
architecture and connectivity, as well as the ratio between their cell-wall thickness and
cell-size [9-13] (Figure 3). Therefore, one of the most promising advantages of the use of
honeycomb structures is the ability to tailor their mechanical and energy absorption
performance simply by varying their cell shape, cell size, and cell-wall thickness. While
increasing the cell-wall thickness in honeycombs is associated with an increase in their
stiffness and strength, it can also lead to unfavorable properties such as higher structural
weight and often lower energy absorption capacity [14, 15]. In contrast, the specific
energy absorption (energy absorption normalized by density) of honeycombs can be
enhanced by decreasing the cell-wall thickness, but at the cost of strength and stiffness

3
Figure 3
Mechanics of a Single-Density Honeycomb Structure
The concept of density gradation in cellular materials is derived from the juxtaposition
between the dichotomy between stiffness/strength and energy absorption/density. The
fundamental idea in density-graded cellular structures is to develop an integrated
structure by spatially varying the local cell-wall thickness to cell-size ratio (equivalent to
nominal density) which brings about the reduction in the overall weight of the structure
while its load-bearing and energy absorption capacities are improved upon [16]. Previous
studies suggest that density gradation can significantly improve the load-bearing, energy
absorption, and damage resistance of density-graded foams [17-20]. The impact
resistance of foams and other cellular structures were shown to improve remarkably by
density gradation [21-23], these researchers have led to the development of helmets and
other protective components with enhanced impact energy mitigating performance [24,
25].
4
With the rapid development of advanced manufacturing methods, engineers have more
freedom in the design and manufacture of cellular structures and can create complex
lattice structures or “Architected structures” [26-30]. 3D printing an additive
manufacturing method provides the freedom to fabricate lattice structures with complex
geometric designs that is unmatched by any other method [31-36]. Hexagonal
honeycomb structures have been fabricated severally with 3D printing such as [36],
which enables their fabrication with difference in cell wall thickness thereby resulting in
varying nominal densities. This difference in densities affect the mechanical properties of
the structures such as the weight, strength, energy absorption, etc. Additive
manufacturing has given the opportunity for the optimization and improvement of these
structures, thereby combining the favorable properties of structures with various densities
to derive one optimized structure that is the best fit for a particular purpose. This
optimization can be achieved by several ways; changing the geometry and topology of
the cells [37], gradation of densities in one structure, development of multi-material
structures [32], etc.
There has been extensive analytical, experimental, and theoretical work done on the in-
plane and out-of-plane mechanical properties of honeycombs under static loading and
dynamic crushing conditions for single density and graded density honeycombs. During
the in-plane deformation of a honeycomb structure by compression [36, 38, 39], the cell
walls first undergo bending which results in a linear elastic regime, thereafter followed by
an almost linear plastic collapse at the collapse stress which shows presents itself
depending on the properties of the material used (elastic buckling for elastomers, plastic
hinging for plastics and brittle fracture for brittle materials). Finally, as the strain
increases, opposite cell walls come in contact with each other, closing up the honeycomb
5
structure and leading to a sharp rise in the stiffness and the densification of the cell wall
material [9].
For honeycomb structures with t/l < 0.25, Gibson and Ashby developed a mathematical
model to derive a corresponding bi-linear stress-strain curve [7]. Zhang et al [39]
computationally investigated the dynamic crushing behavior and energy absorption of
honeycombs with density gradient. Ivanez et al [40] analyzed the crush behavior and
energy absorption capability of aluminum honeycomb core using virtual compressive
tests and varying the cell size and cell wall thickness and material. Mousanezhad et al.
[41] investigated the effects of density gradation on in-plane dynamic crushing response
and impact behavior of hexagonal honeycombs through computational modeling. Their
modeling results indicated that density gradation can improve the impact response of
hexagonal honeycomb structures. They also reported that variations in the gradient
function significantly affects the crushing response of density-graded structures by
altering the location of the failure localization sites and changing the plastic energy
dissipation mechanisms. Bates et al. [36] performed experiments on the compressive
behavior of 3D printed thermoplastic polyurethane (TPU) honeycombs with graded
densities and discovered that graded hexagonal honeycombs structures.
have the ability to absorb the strain energy more effectively, but translates to lower
efficiency in comparison with single-density structures. Galehdari et al [38] also
conducted an analytical, experimental and numerical study of a graded honeycomb
structure under in-plane impact load with low velocity. These researchers all show a
consistent layer-by-layer deformation of the density-graded honeycombs. The layer with
6
the lowest density undergoes deformation and therefore densification first, followed by
the next, etc., thereby resulting in a step-wise global stress-strain curve [36].
While there has been computational work done on honeycomb structures with density
gradient and density gradation has been proved to be a good way to improve the energy
absorption capabilities of cellular structures, there has been a lack of comprehensive
computational work done on the optimization of a functionally graded honeycomb
structure. This research takes advantage of both the honeycomb structure and
advancement in manufacturing to produce a functionally graded honeycomb structure
with the correct combination of densities that would give the best energy absorption,
lightest weight and highest strength in just one architecture material. Using a MATLAB
code, the local strain at each density layer is interpolated and the global strain
corresponding to a particular stress is calculated. Further post work is done to derive the
specific energy absorbed, ideality, etc. for different density gradients.
1.1 Motivation for Present Work
In recent years, density gradation has been proposed as a favorable approach that
enables the development of lightweight, high strength, and high energy absorbing cellular
solids. The basic idea behind the concept of density-graded cellular solids is to develop
an integrated structure in which the local density is varied spatially and along certain
directions such that the overall weight of the structure remains low while its strength and
energy absorption capacity (as well as other properties, e.g., ductility, weight, etc.) are
enhanced. Recent successes in the development of density-graded structures signals that
density gradation can truly enhance the energy absorption of cellular solids, while also
enabling the customization of the structural weight, load-bearing performance, and other
7
functionalities at the same time. Therefore, the interest in the design, fabrication, and
mechanical characterization of density-graded cellular solids has witnessed a tremendous
increase.
1.2 Objective of Thesis
The objective of this present work is to extend the previously proposed idea of
gradient optimization into the area of graded honeycombs. To this goal, this work uses an
analytical data-driven approach to determine the global stress-strain response of density-
graded structures from the stress-strain response of their single-density constituents. The
proposed analytical approach facilitates virtual testing of dozens of density-graded
honeycombs via a computational cost saving methodology that can be an efficient
alternative to finite element modeling. The proposed approach uses a data-driven
algorithm that facilitates the characterization of the load-bearing and energy absorption
performance of density-graded honeycombs, thereby enabling the identification of
optimal gradients. Specifically, the approach presented in this work provides a practical
solution to the design of honeycombs with high energy absorption and strength
properties.
1.3 Outline of Thesis
The information proceeds as follows: Chapter 2 describes the background and
justification of the proposed idea. Model development and various gradients examined
are discussed in Chapter 3. In Chapter 4, the validity of the modeling approach is
discussed first. Detailed analysis of 3-stage and continuously graded honeycombs are
then elaborated. The potential applicability of the presented approach in the design and
development of novel ordered cellular structures with superior strength and energy

8
absorption characteristics as well as suggested recommendations are highlighted in
Chapter 5.
9
Chapter 2
Density-Dependent Constitutive Model
During the in-plane deformation of a honeycomb structure by compression, cell walls
first undergo bending which results in a linear elastic regime, thereafter followed by an
almost linear plastic collapse at the collapse stress which presents itself in the form of a
plateau in the stress-strain curve, depending on the properties of the material used (elastic
buckling for elastomers, plastic hinging for plastics and brittle fracture for brittle
materials). Finally, as the strain increases, opposite cell walls come in contact with one
another, closing up the honeycomb structure and leading to a sharp rise in the stiffness.
The latter phenomenon marks the onset of the densification stage [9]. For honeycomb
structures with t/l < 0.25 (with t and l denoting cell wall thickness and cell edge size,
respectively), Gibson and Ashby developed a mathematical model to derive a
corresponding bi-linear stress-strain curve [9]
For hexagonal honeycomb structures with a small t/l ratio, loaded in the in-plane
direction, the effect of axial and shear deformation on each hexagonal cell are negligible
compared to that of the bending of the cell walls [9]. Using the Gibson and Ashby
equations, the density-dependent stress-strain data for each honeycomb structure was
calculated. For uniform hexagonal honeycombs with cell-wall thickness t and cell edge
length l (Figure 4a), regular cells; h=l and θ=300 and are isotropic
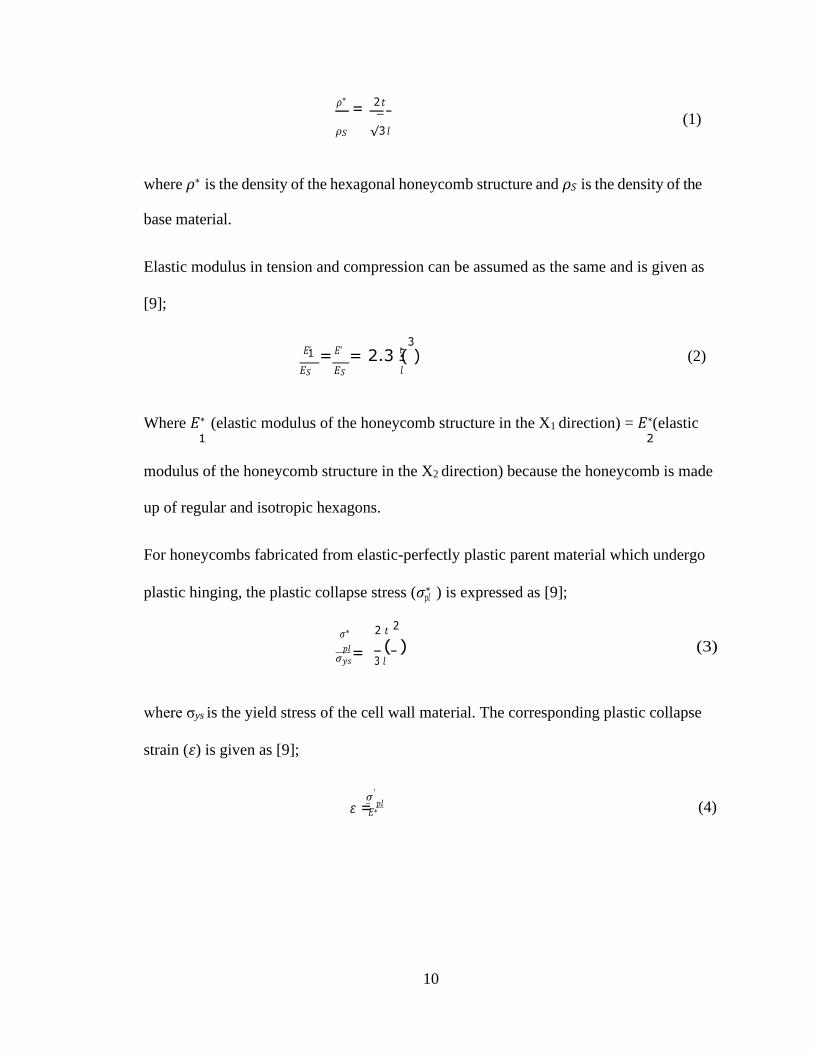
The relative density, i.e., the density of the honeycomb divided by the density of the cell-
wall material, is given as [9];
10
𝐸1∗ 𝐸∗ 𝑡2
𝑝𝑙
𝜎
𝜌∗ =
2 𝑡
𝜌𝑆 √3 𝑙
(1)
where 𝜌∗ is the density of the hexagonal honeycomb structure and 𝜌𝑆 is the density of the
base material.
Elastic modulus in tension and compression can be assumed as the same and is given as
[9];
3
= = 2.3 ( ) (2) 𝐸𝑆 𝐸𝑆 𝑙
Where 𝐸∗ (elastic modulus of the honeycomb structure in the X1 direction) = 𝐸∗(elastic 1 2
modulus of the honeycomb structure in the X2 direction) because the honeycomb is made
up of regular and isotropic hexagons.
For honeycombs fabricated from elastic-perfectly plastic parent material which undergo
plastic hinging, the plastic collapse stress (𝜎∗ ) is expressed as [9];
𝜎∗ 2 𝑡 2
𝑝𝑙 = 𝜎𝑦𝑠
( ) (3) 3 𝑙
where σys is the yield stress of the cell wall material. The corresponding plastic collapse
strain (𝜀) is given as [9];
∗
𝜀 = 𝑝𝑙 𝐸∗
(4)
11
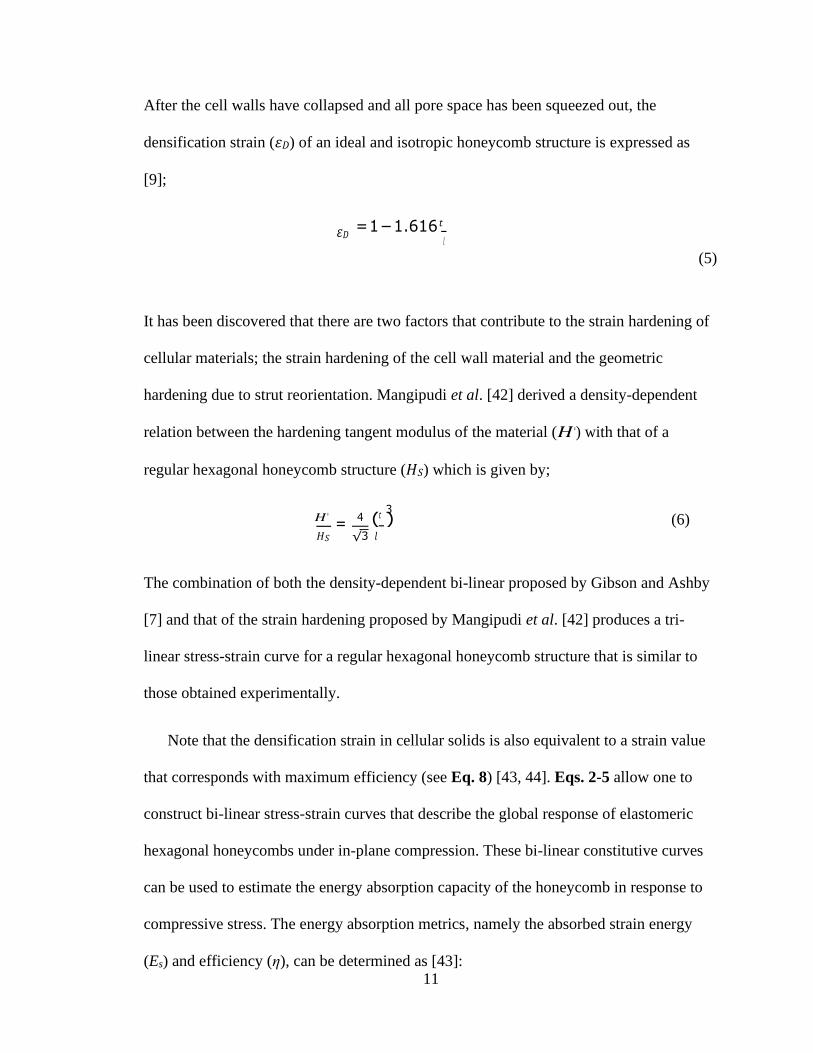
After the cell walls have collapsed and all pore space has been squeezed out, the
densification strain (𝜀𝐷) of an ideal and isotropic honeycomb structure is expressed as
[9];
𝜀𝐷 = 1 − 1.616 𝑡
𝑙
(5)
It has been discovered that there are two factors that contribute to the strain hardening of
cellular materials; the strain hardening of the cell wall material and the geometric
hardening due to strut reorientation. Mangipudi et al. [42] derived a density-dependent
relation between the hardening tangent modulus of the material (𝐻∗) with that of a
regular hexagonal honeycomb structure (𝐻𝑆) which is given by;
𝐻 ∗
= 4 (𝑡
3) (6)
𝐻𝑆 √3 𝑙
The combination of both the density-dependent bi-linear proposed by Gibson and Ashby
[7] and that of the strain hardening proposed by Mangipudi et al. [42] produces a tri-
linear stress-strain curve for a regular hexagonal honeycomb structure that is similar to
those obtained experimentally.
Note that the densification strain in cellular solids is also equivalent to a strain value
that corresponds with maximum efficiency (see Eq. 8) [43, 44]. Eqs. 2-5 allow one to
construct bi-linear stress-strain curves that describe the global response of elastomeric
hexagonal honeycombs under in-plane compression. These bi-linear constitutive curves
can be used to estimate the energy absorption capacity of the honeycomb in response to
compressive stress. The energy absorption metrics, namely the absorbed strain energy
(Es) and efficiency (η), can be determined as [43]:

12
Es ( ) = 0 ( ).d
( ).d
(7)
( ) = 0
(8)
Considering the density-dependent constitutive and energy absorption relations described
above, it is reasonable to assume that the energy absorption of a hexagonal honeycomb is
directly proportional to (t/l)3, as the energy is a product of stress and strain. Similarly, the
specific energy and specific efficiency, i.e. energy absorption and efficiency metrics
normalized by density, will be proportional to (t/l)2 and (t/l)-1, respectively. Finally, as
indicated by Eq. 5, the strain range over which a hexagonal honeycomb retains its energy
absorption efficiency decreases linearly with (t/l) [44].
Figure 4
Schematic of a Single Elastomeric Hexagonal Cell
Note. (a) undeformed, and (b) deformed states

13
The interdependence of density, strength, and energy absorption capacity in
hexagonal honeycombs implies that, from a design perspective, there is not a single
density that simultaneously offers both high strength and excellent energy absorption
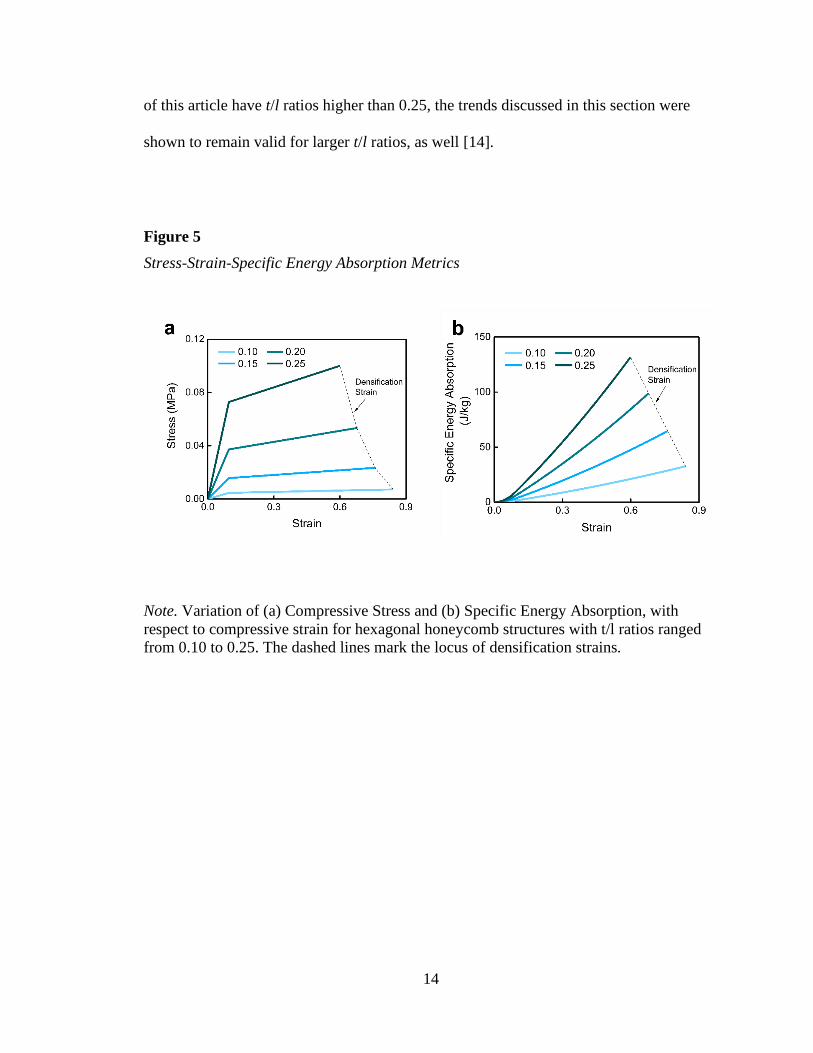
performance at a low mass. This statement is graphically shown in Figure 5 wherein bi-
linear stress-strain and specific energy absorption curves are constructed for elastomeric
hexagonal honeycombs with t/l ratios ranging from 0.1 to 0.25. To construct these curves,
we have considered thermoplastic polyurethane (TPU) with density, Young’s modulus,
and strain hardening modulus of 1235 kg/m3, 21.2 MPa, and 1.50 MPa, respectively,
extracted from [14, 45]. Stress-strain and energy-strain curves shown in Figure 5 confirm
that strength and energy absorption performance of elastomeric hexagonal honeycombs
are strongly dependent on the relative density of the structure, while the latter is also a
function of the compressive strain. For example, according to the data shown in Figure
5b, designing of a hexagonal component with a 25 J/kg energy absorption capacity can
be achieved through the use of several t/l ratios, but at the cost of strength and/or overall
deformability of the structure.
The interplay between density-dependent strength and energy absorption
performance of hexagonal honeycombs suggests that it is possible to benefit from the
design of honeycombs with a spatially-variable density in order to optimize the strength-
energy absorption capacity of the structure while maintaining a low overall density. In the
forthcoming sections, we elaborate on our approach to achieving this goal.
While the simplified approach discussed here to explicate the density-dependent
behavior of hexagonal honeycombs is valid for t/l ratios lower than 0.25 [9] and we
recognize that the structures examined in the next section and throughout the remainder
14
of this article have t/l ratios higher than 0.25, the trends discussed in this section were
shown to remain valid for larger t/l ratios, as well [14].
Figure 5
Stress-Strain-Specific Energy Absorption Metrics
Note. Variation of (a) Compressive Stress and (b) Specific Energy Absorption, with
respect to compressive strain for hexagonal honeycomb structures with t/l ratios ranged
from 0.10 to 0.25. The dashed lines mark the locus of densification strains.
15
t
Chapter 3
Modeling
3.1. Materials and Gradients
Hyperplastic hexagonal honeycomb structures manufactured by Bates et al. [36]
with various nominal densities were considered as input to our model. These honeycomb
structures were fabricated by Bates et al. [36] from thermoplastic polyurethane (TPU) via
fused filament 3D printing and in three relative densities of ρ*= 0.26, 0.37, and 0.5.
Global stress-strain data associated with these structures were digitized from the data
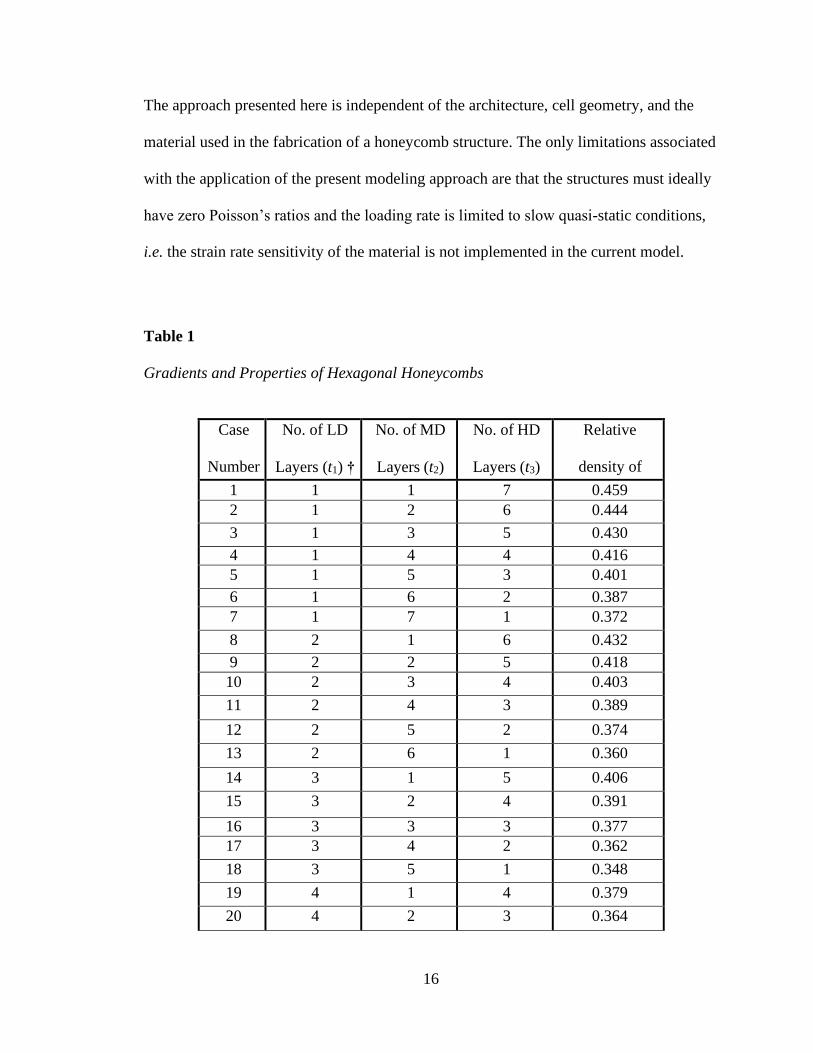
published in [36]. 3-stage graded hexagonal structures with a total number of 9 rows (see
Figure 6a) and with various gradients were studied. 28 different gradients with details
listed in Table 1 were studied. These 28 gradient combinations cover the range of
structures with the highest relative density (case No. 1, [1:1:7]) to the lowest relative
density (case No. 28, [7:1:1]), and includes the linear 3-stage gradient (case No. 16
[3:3:3]). The latter gradient is also used for the validation of the modeling results with the
experimental measurements reported by Bates et al. [36]. For each gradient, the nominal
relative density of the structure was calculated as:
3
*
i i
* = i 3
ti
i
(9)
where, * and t are the relative density and the corresponding number of layers (see
i i
Table 1). The total number of rows (i.e., 9) was selected to resemble the structures
studied by Bates et al. [36].
16
The approach presented here is independent of the architecture, cell geometry, and the
material used in the fabrication of a honeycomb structure. The only limitations associated
with the application of the present modeling approach are that the structures must ideally
have zero Poisson’s ratios and the loading rate is limited to slow quasi-static conditions,
i.e. the strain rate sensitivity of the material is not implemented in the current model.
Table 1
Gradients and Properties of Hexagonal Honeycombs
Case
Number
No. of LD
Layers (t1) †
No. of MD
Layers (t2)
No. of HD
Layers (t3)
Relative
density of
1 1 1 7 0.459
2 1 2 6 0.444
3 1 3 5 0.430
4 1 4 4 0.416
5 1 5 3 0.401
6 1 6 2 0.387
7 1 7 1 0.372
8 2 1 6 0.432
9 2 2 5 0.418
10 2 3 4 0.403
11 2 4 3 0.389
12 2 5 2 0.374
13 2 6 1 0.360
14 3 1 5 0.406
15 3 2 4 0.391
16 3 3 3 0.377
17 3 4 2 0.362
18 3 5 1 0.348
19 4 1 4 0.379
20 4 2 3 0.364
17
3
Case
Number
No. of LD
Layers (t1) †
No. of MD
Layers (t2)
No. of HD
Layers (t3)
Relative
density of
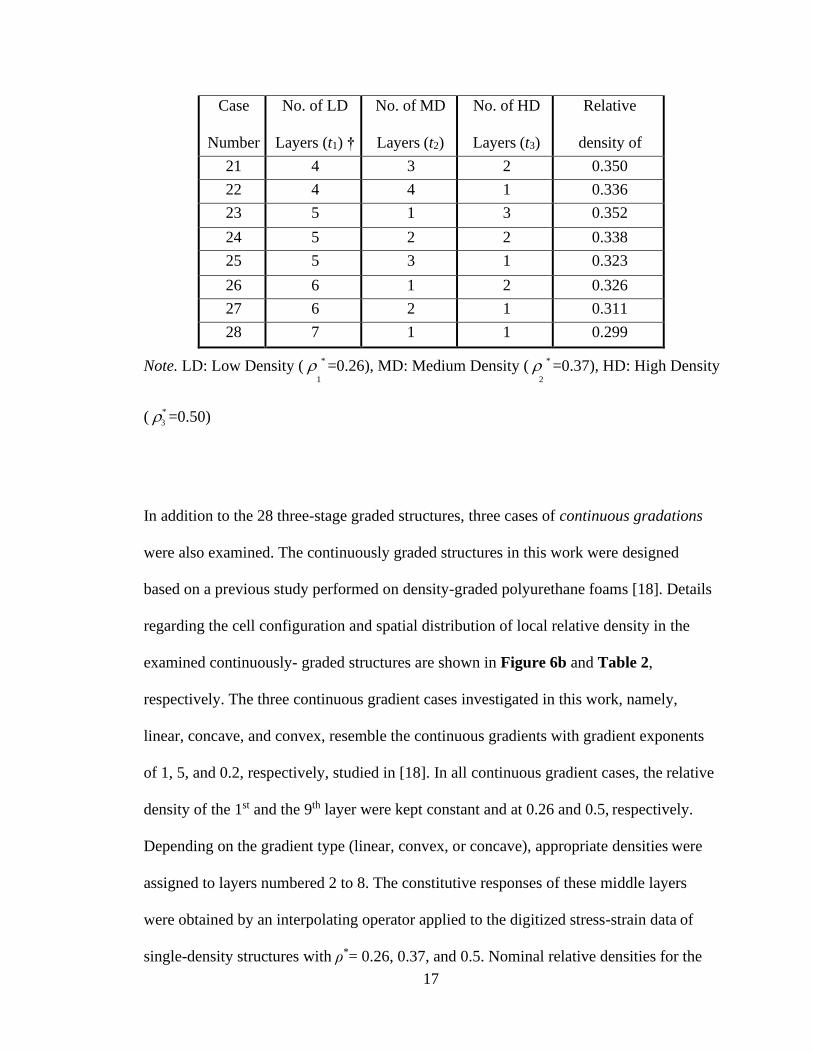
21 4 3 2 0.350
22 4 4 1 0.336
23 5 1 3 0.352
24 5 2 2 0.338
25 5 3 1 0.323
26 6 1 2 0.326
27 6 2 1 0.311
28 7 1 1 0.299
Note. LD: Low Density ( * =0.26), MD: Medium Density ( *
=0.37), HD: High Density 1 2
( * =0.50)
In addition to the 28 three-stage graded structures, three cases of continuous gradations
were also examined. The continuously graded structures in this work were designed
based on a previous study performed on density-graded polyurethane foams [18]. Details
regarding the cell configuration and spatial distribution of local relative density in the
examined continuously- graded structures are shown in Figure 6b and Table 2,
respectively. The three continuous gradient cases investigated in this work, namely,
linear, concave, and convex, resemble the continuous gradients with gradient exponents
of 1, 5, and 0.2, respectively, studied in [18]. In all continuous gradient cases, the relative
density of the 1st and the 9th layer were kept constant and at 0.26 and 0.5, respectively.
Depending on the gradient type (linear, convex, or concave), appropriate densities were
assigned to layers numbered 2 to 8. The constitutive responses of these middle layers
were obtained by an interpolating operator applied to the digitized stress-strain data of
single-density structures with ρ*= 0.26, 0.37, and 0.5. Nominal relative densities for the
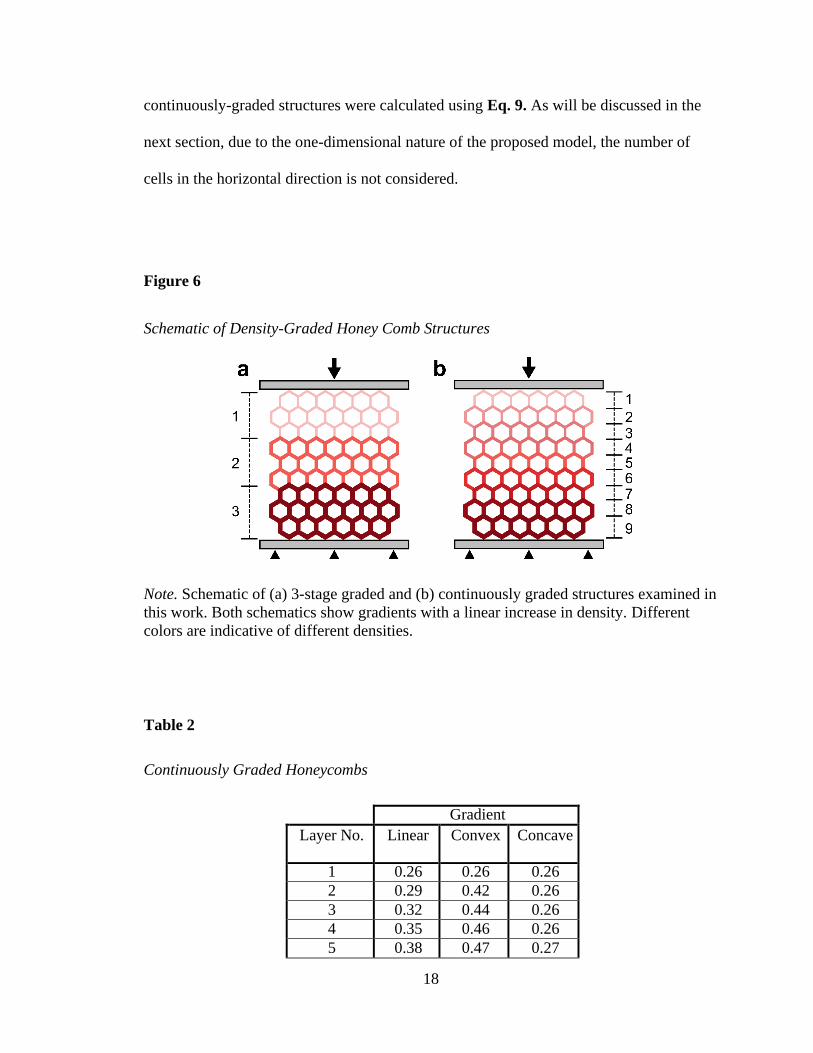
18
continuously-graded structures were calculated using Eq. 9. As will be discussed in the
next section, due to the one-dimensional nature of the proposed model, the number of
cells in the horizontal direction is not considered.
Figure 6
Schematic of Density-Graded Honey Comb Structures
Note. Schematic of (a) 3-stage graded and (b) continuously graded structures examined in
this work. Both schematics show gradients with a linear increase in density. Different
colors are indicative of different densities.
Table 2
Continuously Graded Honeycombs
Gradient
Layer No. Linear Convex Concave
1 0.26 0.26 0.26
2 0.29 0.42 0.26
3 0.32 0.44 0.26
4 0.35 0.46 0.26
5 0.38 0.47 0.27
19
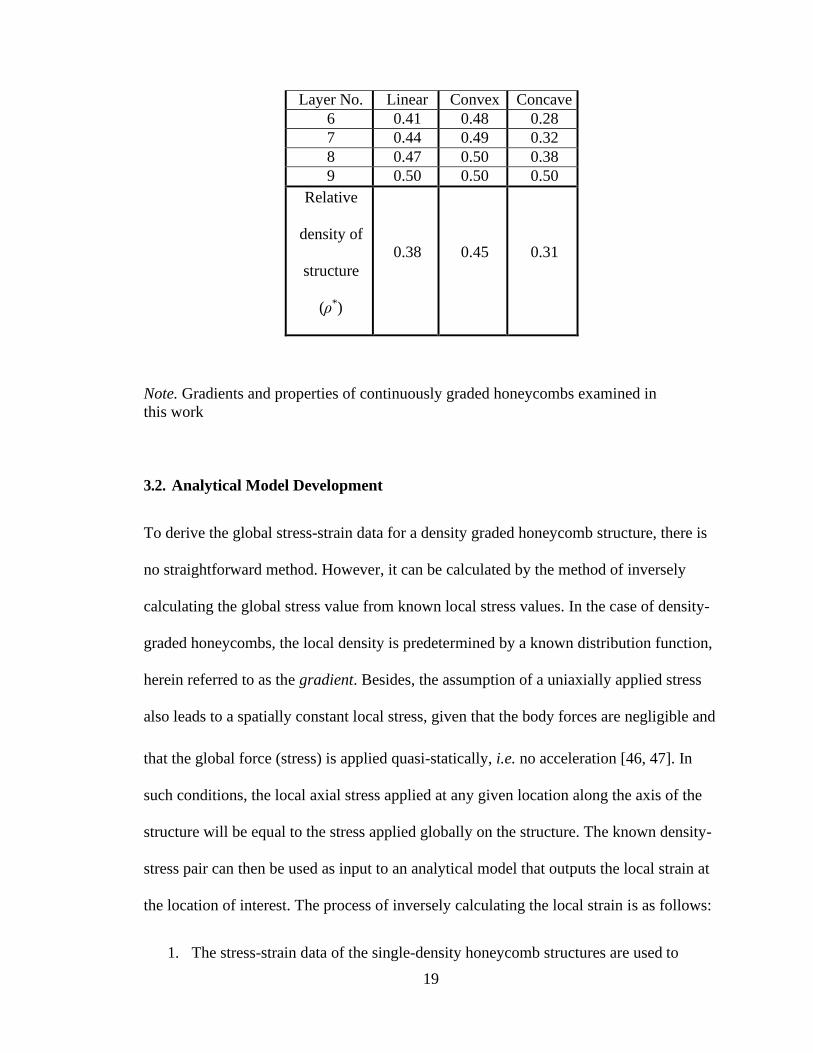
Layer No. Linear Convex Concave
6 0.41 0.48 0.28
7 0.44 0.49 0.32
8 0.47 0.50 0.38
9 0.50 0.50 0.50
Relative
density of
structure
(ρ*)
0.38
0.45
0.31
Note. Gradients and properties of continuously graded honeycombs examined in
this work
3.2. Analytical Model Development
To derive the global stress-strain data for a density graded honeycomb structure, there is
no straightforward method. However, it can be calculated by the method of inversely
calculating the global stress value from known local stress values. In the case of density-
graded honeycombs, the local density is predetermined by a known distribution function,
herein referred to as the gradient. Besides, the assumption of a uniaxially applied stress
also leads to a spatially constant local stress, given that the body forces are negligible and
that the global force (stress) is applied quasi-statically, i.e. no acceleration [46, 47]. In
such conditions, the local axial stress applied at any given location along the axis of the
structure will be equal to the stress applied globally on the structure. The known density-
stress pair can then be used as input to an analytical model that outputs the local strain at
the location of interest. The process of inversely calculating the local strain is as follows:
1. The stress-strain data of the single-density honeycomb structures are used to

20
generate a stress-strain-density dataset. The desired gradient is also used as
another input, wherein the local density is known at any given location (y) along
the honeycomb axis.
2. A virtual global stress is applied incrementally. At a location with known density
and for a given global stress increment, assuming equivalence between global and
local stress, the corresponding local strain is calculated using a scattered data
interpolation process applied to the stress-strain-density dataset. The interpolation
process in this work is performed using a triangulation-based natural neighbor
interpolation method with C1 continuity.
3. Repeat Step 2 for all layers along the axis of the honeycomb structure until all
local strains corresponding with the global stress increment are obtained. Global
strain corresponding with the global stress increment is calculated by integrating
local strains along the y-axis.
4. Update the global stress increment and repeat Step 2 and Step 3 until the full
global stress-strain response of the given gradient is obtained. Repeat the above
process for all gradients.
Once all global constitutive data are obtained, the energy absorption metrics,
namely the absorbed energy (Es), efficiency (η), and ideality (I) can be determined using
Eqs. 6, 7, and 9, respectively [48].
( ).d
I ( ) = 0
(9)
where, and denote global stress and global strain, respectively. For all cases studied
21
in this work, the maximum global stress applied to the graded structures was 2 MPa. The
global stress was applied in increments of 0.01 MPa. Also, considering the rate-
independent nature of the work, strain rate and its effects on the load-bearing and energy
absorption performance was not considered. For single-density structures, the
densification strain ( d ) was evaluated as the strain at which the efficiency parameter (η)
is maximum [49]. For 3-stage graded structures, the efficiency curves will have three
peaks corresponding to the three distinct density regions within the structures. In such
cases, the strain associated with the last local peak is considered as the nominal
densification strain of the structure. The same approach is applied to continuously graded
structures, wherein the nominal densification strain of the structure is identified as the
global strain corresponding with the last local peak in the efficiency curve.
The data-driven model described above can be applied to any gradient function as
long as the basic assumptions (i.e. quasi-static and uniaxial stress state) are satisfied. The
analytical model used in this work was scripted in MATLAB. Obtaining the complete
output dataset that contained the global stress-strain and energy absorption data of all 28
gradients listed in Table 1 took approximately 40 minutes using a personal computer
with 2.4 GHz processor and 8 GB of memory.

22
Chapter 4
Model Validation
4.1. Model Validation and Deformation Mechanism
The accuracy of the model predictions in this work was validated through
reproducing the results obtained by Bates et al. [36] for 2-stage and 3-stage graded
structures. For brevity, results of the 2-stage gradations are provided as Supplemental
Information. Figure 4 shows the comparison between the model predictions obtained
from the data-driven model proposed in this work and the experimental measurements
reported in Bates et al. [36]. Results shown in this figure include the stress-strain, specific
energy, and efficiency data for a 3-stage gradient with a linear density distribution, i.e.
each density constitutes 3 out of 9 layers of the structure (case No. 16 in Table 1). The
model predicted data and experimental measurements show almost identical results,
confirming the validity of the modeling efforts in this work.
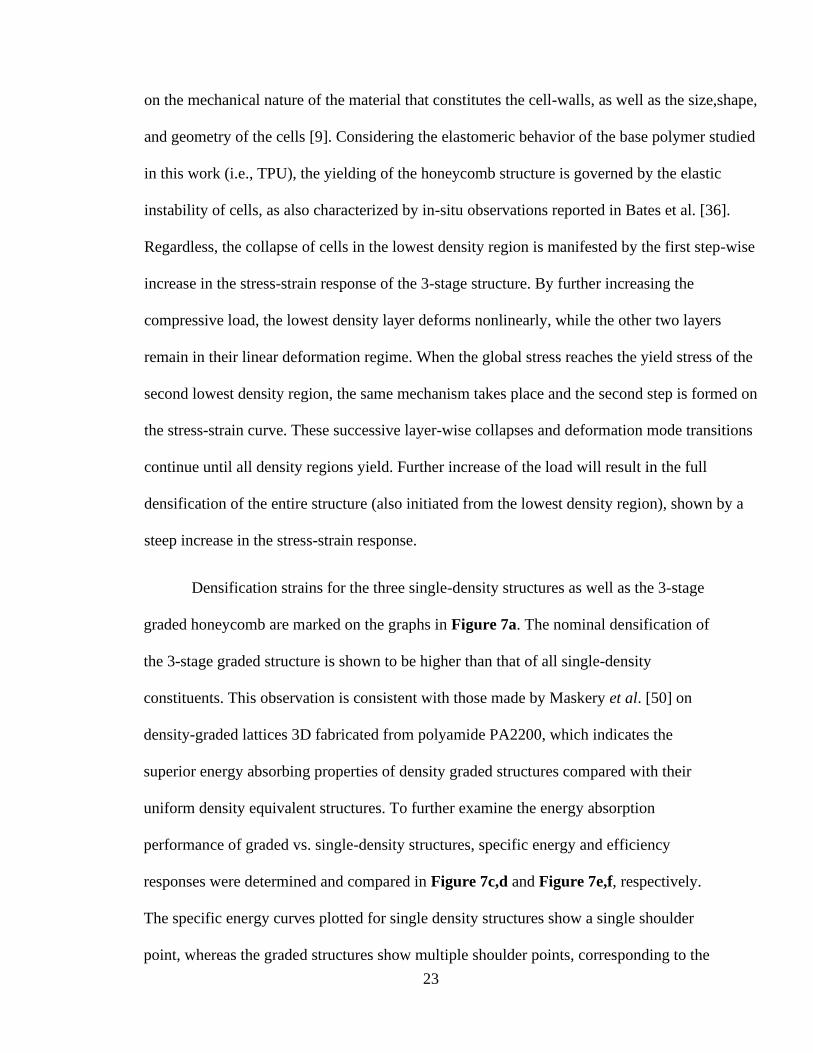
The stress-strain curve obtained for the 3-stage graded structure shows a step-wise
trend with three distinct yielding and plateau regions. This behavior has also been
observed for graded foams [18] and functionally graded lattice structures [50, 51] and
originates from the consecutive yielding and densification of the individual single-density
regions in the structure. Upon the application of a compressive uniaxial load on a density-
graded structure, such as the one studied here, all single-density regions undergo linear
deformation first, while the larger portion of the deformation is exerted in the lowest
density region. The linear deformation condition maintains until the global stress reaches
the yield strength of the lowest-density layer yields. This so-called yield strength depends
23
on the mechanical nature of the material that constitutes the cell-walls, as well as the size,shape,
and geometry of the cells [9]. Considering the elastomeric behavior of the base polymer studied
in this work (i.e., TPU), the yielding of the honeycomb structure is governed by the elastic
instability of cells, as also characterized by in-situ observations reported in Bates et al. [36].
Regardless, the collapse of cells in the lowest density region is manifested by the first step-wise
increase in the stress-strain response of the 3-stage structure. By further increasing the
compressive load, the lowest density layer deforms nonlinearly, while the other two layers
remain in their linear deformation regime. When the global stress reaches the yield stress of the
second lowest density region, the same mechanism takes place and the second step is formed on
the stress-strain curve. These successive layer-wise collapses and deformation mode transitions
continue until all density regions yield. Further increase of the load will result in the full
densification of the entire structure (also initiated from the lowest density region), shown by a
steep increase in the stress-strain response.
Densification strains for the three single-density structures as well as the 3-stage
graded honeycomb are marked on the graphs in Figure 7a. The nominal densification of
the 3-stage graded structure is shown to be higher than that of all single-density
constituents. This observation is consistent with those made by Maskery et al. [50] on
density-graded lattices 3D fabricated from polyamide PA2200, which indicates the
superior energy absorbing properties of density graded structures compared with their
uniform density equivalent structures. To further examine the energy absorption
performance of graded vs. single-density structures, specific energy and efficiency
responses were determined and compared in Figure 7c,d and Figure 7e,f, respectively.
The specific energy curves plotted for single density structures show a single shoulder
point, whereas the graded structures show multiple shoulder points, corresponding to the
24
number of density regions in the structure. The shoulder points in all cases also
correspond to the points of maximum efficiency, as shown in Figure 7e,f. The enhanced
energy absorption of a graded structure over an equivalent uniform structure is revealed
in comparing the specific energy curves obtained for the 3-stage structure with the
single-density structure with relative density * = 0.37. Despite the <2% difference in
their nominal density, the graded structure shows higher amounts of energy absorption
over an extended stress range. Specifically, except for a narrow stress range of ca. 0.15-
0.6 MPa, the graded structure outperforms the single-density structure in terms of the
amount of energy absorbed by an average of ~10%. On the other hand, comparing the
efficiency curves of the two structures reveals that while the overall energy absorbing
capacity of the 3-stage graded honeycomb is slightly better than that of the single-
density structure, the efficiency response of the former is still inferior to that of the
latter. Although this observation implicitly points to the enhanced strength of the graded
structure, it also raises the question about the performance of the other 27 cases in terms
of combined strength and energy absorption characteristics.

25
Figure 7
Stress-Strain, Specific Energy, and Efficiency Diagrams [34]
Note. single-density and 3-stage graded hexagonal honeycomb ( * = 0.377) obtained
from model (a,c,e) and experiment (b,d,f). dashed and dotted lines represent the single-
density structures. Solid lines denote the variable of interest for the 3-stage graded
structure. The hollow red circles in (a) mark the densification strains. The experimental
data in panels (b) , (d), and (f) are

26
4.2. Strength-Energy Absorption Correlation
Stress-strain responses of a subset of the 28 three-stage cases examined in this
work are shown in Figure 8a. The subset shown in this figure includes all cases wherein
the middle-density layer makes only 1 out of 9 layers in the structure (see Table 1). The
stress-strain curves shown include that of case No. 1 [1:1:7], i.e. the structure with the
highest nominal density, as well case No. 28 [7:1:1], i.e. the one with the lowest nominal
density. The step-wise stress-strain pattern is observed for all cases in Figure 8a,
suggesting that the general deformation mechanism explained earlier in Section 4.1. is
independent of gradient. Nevertheless, the extent of the stress plateaus and, more
importantly, the nominal densification strains (Figure 8b) are found to be strongly
dependent on the gradient.
Figure 8b shows densification strains for single-density and 3-stage graded
structures. The single-density structures in this figure are marked as LD, MD, and HD,
corresponding with low ( * = 0.26), medium ( * = 0.37), and high density ( * = 0.5)
structures, respectively. With the exception of a few cases (case No. 1, 2, 8) density-
grade structures show significantly higher densification strains compared with all single-
density honeycombs.

27
Figure 8
Strain Relationship Metrics
Note. Stress-strain curves for a subset of 3-stage graded structures, ranged from the
lowest density to highest density cases. Densification strain is marked on each curve with
a hollow circle. (b) A comparison between the densification strains of single-density and
all 3-stage gradients examined in this work. The horizontal dashed line marks the highest
densification strain in the single-density structures
Energy absorption metrics for a representative subset of the 3-stage graded
structures are shown in Figure 9. Specific energy trends in Figure 9a resemble those
shown earlier in Figure 7c, i.e. curves with three shoulder points. Higher density
gradients (represented by lower case numbers) show a higher energy absorption
performance among the subset of cases show in Figure 9a. The amount of energy
absorbed by all 3-stage graded structures at their densification strains was determined and
normalized by the corresponding density of each structure. The results are presented in
Figure 9b as another indicator of the effectiveness of gradation in enhancing the overall
energy absorption capacity. A great majority of 3-stage graded structures show slightly
lower specific energy at densification strain compared with the HD single-density
honeycomb. Interestingly, all 3-stage graded structures, regardless of their gradient, show

28
approximately 30% improvement in the same metric compared with the MD single-
density honeycomb, and about 200% improvement compared with the LD single-density
honeycomb.
Efficiency and ideality metrics for the same subset of cases are shown in Figure
9c and Figure 9d, respectively. All curves shown in these figures indicate a three-peaked
pattern that corresponds with the number of density regions in the structure. A
comparison between the efficiency and ideality curves for different cases shows that the
intensity of the third peak increases for lower case numbers. This behavior stems from
the increased contribution of the HD layer in gradients with lower case numbers.
Figure 9
Specific Energy Absorption Correlation

29
Note. Variation of specific energy as a function of stress for a subset of 3-stage graded
structures, ranged from the lowest density to highest density cases.*(b) Energy absorbed
at the point of densification normalized by the density, (E @ ) s d
, plotted for all
single-density and 3-stage graded structures. Efficiency-stress and ideality-stress curves
for the same subset are shown in (c) and (d), respectively.
It is documented that cellular solids show their highest energy absorption capacity
over a strain range that is bound by those corresponding to maximum ideality and
maximum efficiency, the latter being indicative of the densification strain, as well [48].
These two critical strains were identified for all cases listed in Table 1, and the strain
range bound between the two critical strains were determined and plotted in Figure 10.
The lower and upper bounds on the individual columns in Figure 10 are associated with
the strain at maximum ideality and densification points, respectively. In general, higher
case numbers which associate with lower density gradients show a smaller strain range.
Also, the last case number in every batch, which marks the gradients with the largest
portion of MD constituents, outperforms other gradients in the batch. Accordingly, case
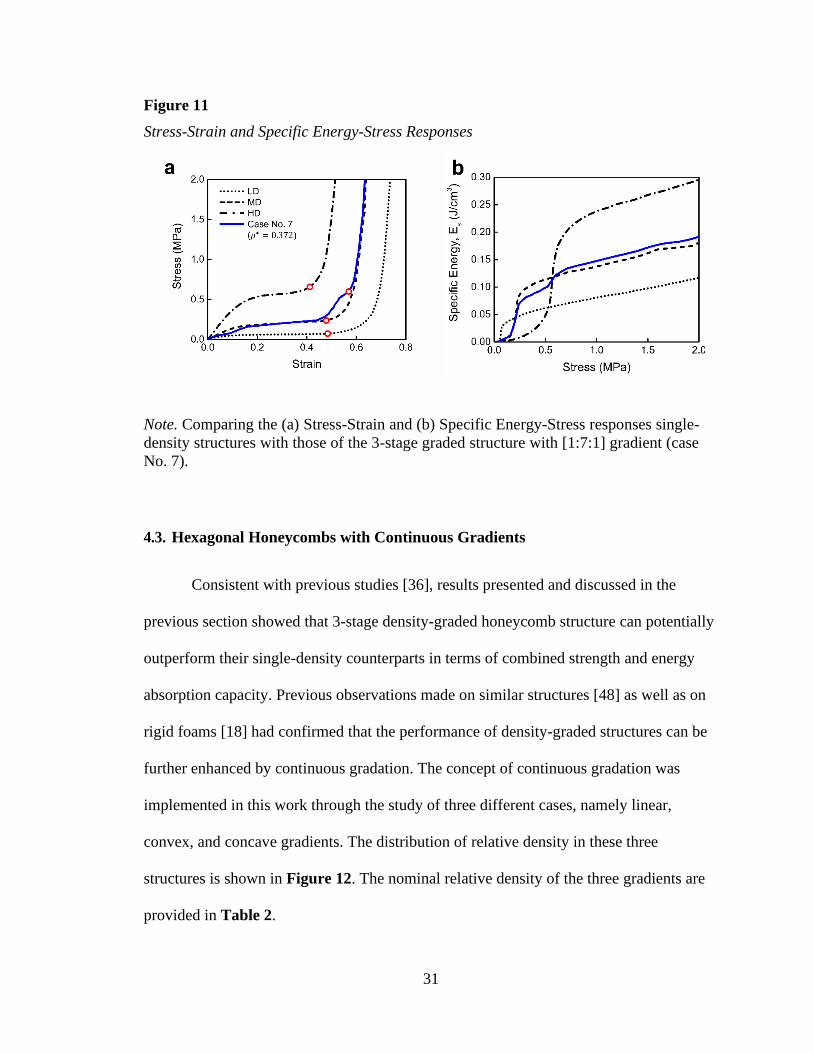
No. 7 shows the highest strain range among all other gradients. To better realize the
response of this particular gradient, we have plotted the stress-strain and energy response
of case No. 7 in Figure 11. The stress-strain response of this gradient is close to that of

30
the MD structure, except two slight variations at the beginning and the end of the plateau
region. Besides, the relative density of case No. 7 is also very close to that of the MD
structure, with a difference of <1%. Despite such negligible differences, the graded
structure is found to have at least 17% higher densification strain compared with all
single-density structures. The energy absorption of the graded structure is also shown to
be at least 6% higher than that of the MD structure at stress levels above 0.6 MPa.
Figure 10
Strain Range
Note. Strain range bound by those corresponding with maximum ideality and
densification for the 28 cases of 3-stage graded structures.
31
Figure 11
Stress-Strain and Specific Energy-Stress Responses
Note. Comparing the (a) Stress-Strain and (b) Specific Energy-Stress responses single-
density structures with those of the 3-stage graded structure with [1:7:1] gradient (case
No. 7).
4.3. Hexagonal Honeycombs with Continuous Gradients
Consistent with previous studies [36], results presented and discussed in the
previous section showed that 3-stage density-graded honeycomb structure can potentially
outperform their single-density counterparts in terms of combined strength and energy
absorption capacity. Previous observations made on similar structures [48] as well as on
rigid foams [18] had confirmed that the performance of density-graded structures can be
further enhanced by continuous gradation. The concept of continuous gradation was
implemented in this work through the study of three different cases, namely linear,
convex, and concave gradients. The distribution of relative density in these three
structures is shown in Figure 12. The nominal relative density of the three gradients are
provided in Table 2.

32
Figure 12
Distribution of Relative Density
Note. Distribution of relative density in continuously graded structures with linear,
concave, and convex gradients.
An approach similar to that applied to the 3-stage graded structures was used to
evaluate the strength and energy absorption behaviors of the three continuously graded
structures. Figure 13 shows the stress-strain and the corresponding energy metric curves
(specific energy, efficiency, and ideality) for the three continuously graded structures.
Curves for single-density honeycombs are also shown for comparison. The general shape
of the stress-strain curves if different for the continuously graded honeycombs compared
with the 3-stage structures. Although the same step-wise yielding and densification
mechanisms are still valid for continuously graded structures, the higher number of steps,
which is directly correlated with the higher number of densities, masks the distinct steps
on the stress-strain curves, especially for the linear gradient (see Figure 13a). Both
linear and convex gradients show higher strength than the concave gradient as well as the
LD and MD honeycombs. This observation is particularly important for the linear
33
gradient whose density is close to that of both the MD honeycomb (see Table 2) and the
3-stage discretely graded structure (see Figure 7a) but shows a noticeably higher strength
at strains >0.2. From an energy absorption perspective, linear and convex gradients show
an enhanced energy absorption capability compared with LD and MD honeycombs as
well as concave gradient at stresses >0.5 MPa. On the other hand, the strain energy
absorbed by the concave gradient outperforms those of linear and convex gradients as
well as the HD honeycomb at stresses <0.4 MPa.
The strength-energy absorption dichotomy also reveals itself in efficiency and
ideality data obtained for the continuously graded structures. The efficiency responses of
the continuously graded honeycombs show significant differences in terms of their
general shape and value. For example, while the concave gradient indicates a lower
maximum efficiency than all other cases, it retains its high efficiency over a wider stress
range. In contrast, both linear and convex gradients show single efficiency peaks at
higher stress values but with steeply decaying values after reaching their relative
efficiency peaks. The ideality curves also show quite different patterns, wherein the
convex gradient indicates a distinct double-peak curve, with higher ideality values over a
wide range of stresses while the other two continuous gradients (linear and concave)
show a single peak at low stress levels.

34
Figure 13
Continuously Graded Structures
Note. (a)Stress-Strain, (b) Specific Energy-Stress, (c) Efficiency-Stress and (d) Ideality-
Stress curves for the three continuously graded structures. Curves of the single-density
honeycombs (LD, MD, HD) are shown for comparison.
Considering the load-bearing and energy absorption performances of the three
continuously-graded structures in comparison with the uniform density honeycombs, one
can conclude that there is not a single gradient that offers low density, enhanced load-

35
bearing (strength), and energy absorption capacity at all stress and strain levels. Rather,
an optimized structure must be selected based on design criteria and the applications
sought. Nevertheless, our findings indicate that density gradation is indeed a promising
strategy in achieving structural designs that, when applied in a controlled way, can result
in enhanced performance overall.
36
Chapter 5
Conclusions and Future Directions
5.1 Conclusions
Stress-strain and energy absorption behaviors of density-graded hexagonal
honeycombs were studied using an analytical modeling approach. Stress-strain data
obtained for single-density honeycomb structures with three different relative
densities were used as input to a model that uses an interpolation algorithm to output
the stress-strain curve of density-graded structures with known gradients. 28 different
cases of 3-stage graded hexagonal honeycombs along with 3 cases of continuously-
graded structures were examined. Results confirmed that the modeling approach
proposed in this work is capable of predicting the stress-strain and energy absorption
behaviors of density-graded honeycombs with good agreement with experimental
measurements. It was also found that density gradation can lead to a combination of
high strength and improved energy absorption at low structural weights. Density
gradation was specifically shown to allow for increasing the densification strain of a
graded structure. We also showed that, consistent with previous studies, continuous
gradation can lead to an improved energy absorption capacity compared with
discretely graded honeycombs. Through the use of a variety of energy absorption
metrics, we showed that there is not a single gradient function that leads to the best
combination of strength, energy absorption, and low structural weight. Rather, the
choice of an optimized gradient depends on the application sought.

37
5.2 Future Directions
While the approach presented in this work facilitates the study of a complete set
of density-graded honeycomb structures with acceptable accuracy and in a
computationally efficient manner, there is still a lack of similar models that facilitate the
strain rate dependent response of the materials. More advanced models with the
capability to address the rate-sensitive response of density-graded structures are being
developed by the authors. The modeling approach discussed in this work (in conjunction
with its future rate-sensitivity module) has the potential to guide the design of density-
graded structure beyond honeycombs fabricated from different materials. One specific
area that similar optimization approaches can be applied to is the newly developed areas
of functionally graded metamaterials and origami structures [52-55]. Besides, the
modeling approach discussed here can supplement advanced finite element models used
in the topology optimization of elastoplastic cellular and metamaterials [56, 57].
Recommendations:
• The quasi-static mechanical properties of single-density honeycomb structures
have been historically observed to be stronger in the out-of-plane direction as
opposed to the in-plane direction (as the cell-walls do not bend but rather compress
or extend and thereby resulting in a higher elastic modulus.The plastic collapse
strength is also significantly higher due to the involvement of axial and bending
deformations). Advancing the concept of this work into investigating the
mechanical properties of out-of-plane graded honeycomb structures as they
function within a sandwich structure would also be a great next step. These
density-graded honeycomb structures in the out-of-plane direction are suitable for
38
use in creating body protective amour, protective headgear and have been found
occurring naturally in nature as balsa wood amongst others.
• Investigating the effect of strain/work hardening/softening after a particular
graded honeycomb structure has experienced multiple cycles of loading
conditions is also a probable future direction.
• Honeycombs which is one of the simplest lattice structures has been employed in
this research but the fundamental principle of this work can be extended to even
more complex structures that either strut-based or surface-based, e.g. triply
periodic minimal surface (gyroids). Auxetic metamaterials with negative
poisson’s ratio are also a viable candidate for further research due to having better
mechanical properties. By carefully engineering the unit cells in these
metamaterials, optimized and more favorable mechanical, thermal, etc. properties
that do not rely on their chemical composition can be achieved.
• The roles printing imperfections through additive manufacturing have on the
cellular structures is a strong future research focus as it affects the material
integrity and would showcase itself in the properties of both the single density and
density-graded structures.
• The effect on the rate of loading conditions should also be looked into. Cellular
materials are strain-rate sensitive and the investigation of the mechanical response
of the structure under high speed impact is a viable research area. Efforts are
currently underway to include strain rate effects in a computer algorithm that
considers the rate-sensitive constitutive response of the honeycombs, as well.
39
References
[1] Habib F, Iovenitti P, Masood S, Nikzad M, Ruan D. Design and evaluation of 3D
printed polymeric cellular materials for dynamic energy absorption. International Journal
of Advanced Manufacturing Technology 2019; 103: 2347-2361.
https://doi.org/10.1007/s00170-019-03541-4
[2] Zhang Q, Yang X, Li P, Huang G, Feng S, Shen C, Han B, Zhang X, Jin F, Xu F, Lu
TJ. Bioinspired engineering of honeycomb structure – Using nature to inspire human
innovation. Progress in Materials Science 2015; 74: 332-400.
https://doi.org/10.1016/j.pmatsci.2015.05.001
[3] Fan H, Luo Y, Yang F, Li W. Approaching perfect energy absorption through structural
hierarchy. International Journal of Engineering Sciences 2018; 130: 12-32.
https://doi.org/10.1016/j.ijengsci.2018.05.005
[4] Li Z, Liu D, Qian Y, Wang Y, Wang T, Wang L. Enhanced strength and weakened
dynamic sensitivity of honeycombs by parallel design. International Journal of Mechanical
Sciences 2019; 151: 672-683. https://doi.org/10.1016/j.ijmecsci.2018.12.013
[5] Jardini A, Larosa M, Filho R, de Carvalho Zavaglia CA, Bernards LF, Lambert CS,
Calderoni DR, Kharmandayan P. Cranial reconstruction: 3D biomodel and custom-built
implant created using additive manufacturing. Journal of Cranio-Maxillofacial Surgery
2014; 42: 1877-1844. https://doi.org/10.1016/j.jcms.2014.07.006
[6] Yan Q, Dong H, Su J, Han J, Song B, Wei Q, Shi Y. A review of 3D printing technology
for medical applications. Engineering 2018; 4: 729-742.
https://doi.org/10.1016/j.eng.2018.07.021
[7] https://www.globalspec.com/learnmore/materials_chemicals_adhesives/composites_te
xtiles_reinforcements/honeycombs_honeycomb_materials
[8] https://www.wikiwand.com/en/Honeycomb_structure
[9] Gibson L, Ashby M. Cellular solid: Structures and properties, 2n ed. Cambridge:
Cambridge University Press; 1997.
[10] Malek S, Gibson L. Effective elastic properties of periodic hexagonal honeycombs.
Mechanics of Materials 2015; 91: 226-240.
https://doi.org/10.1016/j.mechmat.2015.07.008
[11] Oftadeh R, Haghpanah B, Papadopoulos J, Hamouda AMS, Nayeb-Hashemi H, Vaziri
A. Mechanics of anisotropic hierarchical honeycombs. International Journal of Mechanical
Sciences 2014; 81: 126-136. https://doi.org/10.1016/j.ijmecsci.2014.02.011
[12] Huang J, Gong X, Zhang Q, Scarpa F, Liu Y, Leng J. In-plane mechanics of a novel
zero Poisson's ratio honeycomb core. Composites Part B 2016; 89: 67-76.
https://doi.org/10.1016/j.compositesb.2015.11.032
[13] Qiao J, Chen C. In-plane crushing of a hierarchical honeycomb. International Journal
of Solids and Structures 2016; 85-86: 57-66. https://doi.org/10.1016/j.ijsolstr.2016.02.003

40
[14] Bates SRG, Farrow IR, Trask RS. 3D printed polyurethane honeycombs for repeated
tailored energy absorption. Materials and Design 2016; 112: 172-183.
https://doi.org/10.1016/j.matdes.2016.08.062
[15] Kumar S, Ubaid J, Abishera R, Schiffer A, Deshpande VS. Tunable energy absorption
characteristics of architected honeycombs enabled via additive manufacturing. ACS
Applied Materials and Interfaces 2019; 11: 42549-42560.
https://doi.org/10.1021/acsami.9b12880
[16] Li Z, Jiang Y, Wang T, Wang L, Zhuang W, Liu D. In-plane crushing behaviors of
piecewise linear graded honeycombs. Composite Structures 2019; 207: 425-437.
https://doi.org/10.1016/j.compstruct.2018.09.036
[17] Kiernan S, Gilchrist MD. Towards a virtual functionally graded foam: Defining the
large strain constitutive response of an isotropic closed cell polymeric cellular solid.
International Journal of Engineering Sciences 2010; 48: 1373-1386.
https://doi.org/10.1016/j.ijengsci.2010.09.004
[18] Koohbor B, Kidane A. Design optimization of continuously and discretely graded
foam materials for efficient energy absorption. Materials & Design 2016; 102: 151-161.
https://doi.org/10.1016/j.matdes.2016.04.031
[19] Chen D, Kitipornchai S, Yang J. Dynamic response and energy absorption of
functionally graded porous structures. Materials & Design 2018; 140: 473-487.
https://doi.org/10.1016/j.matdes.2017.12.019
[20] Duan Y, Zhao X, Du B, Shi X, Zhao H, Hou B, Li Y. Quasi-static compressive
behavior and constitutive model of graded foams. International Journal of Mechanical
Sciences 2020; 177: 105603. https://doi.org/10.1016/j.ijmecsci.2020.105603
[21] Liu J, Hou B, Lu F, Zhao H. A theoretical study of shock front propagation in the
density graded cellular rods. International Journal of Impact Engineering 2015; 80: 133-
142. https://doi.org/10.1016/j.ijimpeng.2015.02.001
[22] Zheng J, Qin Q, Wang TJ. Impact plastic crushing and design of density-graded
cellular materials. Mechanics of Materials 2016; 94: 66-78.
https://doi.org/10.1016/j.mechmat.2015.11.014
[23] Chang B, Zheng Z, Zhang Y, Zhao K, He S, Yu J. Crashworthiness design of graded
cellular materials: An asymptotic solution considering loading rate sensitivity.
International Journal Impact Engineering 2020; 143: 103611.
https://doi.org/10.1016/j.ijimpeng.2020.103611
[24] Forero Rueda MA, Cui L, Gilchrist MD. Optimisation of energy absorbing liner for
equestrian helmets. Part I: Layered foam liner. Materials and Design 2009; 30: 3405-3413.
https://doi.org/10.1016/j.matdes.2009.03.037
[25] Cui L, Forero Rueda MA, Gilchrist MD. Optimisation of energy absorbing liner for
equestrian helmets. Part II: Functionally graded foam liner. Materials and Design 2009;
30: 3414-3419. https://doi.org/10.1016/j.matdes.2009.03.044

41
[26] Gorsse S, Hutchinson C, Gouné M, Banerjee R. Additive manufacturing of metals: a
brief review of the characteristic microstructures and properties of steels, Ti-6Al-4V and
high-entropy alloys. Science and Technology of Advanced Materials 2017; 18: 584-610.
https://doi.org/10.1080/14686996.2017.1361305
[27] Qi D, Lu Q, He CW, Li Y, Wu W, Xiao D. Impact energy absorption of functionally
graded chiral honeycomb structures. Extreme Mechanics Letters 2019; 32: 100568.
https://doi.org/10.1016/j.eml.2019.100568
[28] Qin R, Zhou J, Chen B. Crashworthiness design and multiobjective optimization for
hexagon honeycomb structure with functionally graded thickness. Advances in Materials
Science and Engineering 2019; https://doi.org/10.1155/2019/8938696
[29] Yang L, Ferrucci M, Martens R, Dewulf W, Yan C, Shi Y, Yang S. An investigation
into the effect of gradients on the manufacturing fidelity of triply periodic minimal surface
structures with graded density fabricated by selective laser melting. Journal of Materials
Processing Technology 2020; 275: 116367.
https://doi.org/10.1016/j.jmatprotec.2019.116367
[30] Yang L, Martens R, Ferrucci M, Yan C, Shi Y, Yang S. Continuous graded Gyroid
cellular structures fabricated by selective laser melting: Design, manufacturing and mechanical properties. Materials and Design 2019; 162: 394-404.
https://doi.org/10.1016/j.matdes.2018.12.007
[31] Mahbod M, Asgari M. Elastic and plastic characterization of a new developed
additively manufactured functionally graded porous lattice structure: Analytical and
numerical models. International Journal of Mechanical Sciences 2019; 248-266.
https://doi.org/10.1016/j.ijmecsci.2019.02.041
[32] Bandyopadhyay A, Heer B. Additive manufacturing of multi-material structures.
Materials Science and Engineering R 2018; 129: 1-16.
https://doi.org/10.1016/j.mser.2018.04.001
[33] Compton BG, Lewis JA. 3D-printing of lightweight cellular composites. Advanced
Materials 2014; 26: 5930-5935. https://doi.org/10.1002/adma.201401804
[34] Li D, Liao W, Dai N, Xie YM. Comparison of mechanical properties and energy
absorption of sheet-based and strut-based gyroid cellular structures with graded densities.
Materials 2019; 12: 2183. https://doi.org/10.3390/ma12132183
[35] Yu S, Sun J, Bai J. Investigation of functionally graded TPMS structures fabricated
by additive manufacturing. Materials and Design 2019; 182: 108021.
https://doi.org/10.1016/j.matdes.2019.108021
[36] Bates SRG, Farrow I, Stark RS. Compressive behaviour of 3D printed thermoplastic
polyurethane honeycombs with graded densities. Materials and Design 2019; 162: 130-
142. https://doi.org/10.1016/j.matdes.2018.11.019

42
[37] Chantarapanich N, Laohaprapanon A, Wisutmethangoon S, Jiamwatthanachai P,
Chalermkarnnon P, Suchaitpwatskul S, Puttawibul P, Sitthiseripratip K. Fabrication of
three-dimensional honeycomb structure for aeronautical applications using selective laser
melting: a preliminary investigation. Rapid Prototyping Journal 2014; 20: 551-558.
https://doi.org/10.1108/RPJ-08-2011-0086
[38] Galehdari SA, Kadkhodayan M, Hadidi-Moud S. Analytical, experimental and
numerical study of a graded honeycomb structure under in-plane impact load with low
velocity. International Journal of Crashworthiness 2015; 20: 387-400.
https://doi.org/10.1080/13588265.2015.1018739
[39] Zhang X, An L, Ding H. Dynamic crushing behavior and energy absorption of
honeycombs with density gradient. Journal of Sandwich Structures & Materials 2103; 16:
125-147. https://doi.org/10.1177/1099636213509099
[40] Ines Ivañez, Lorena M.Fernandez-Cañadas, SoniaSanchez-Saez. Compressive
deformation and energy-absorption capability of aluminium honeycomb core. Composite
Structures, 2017, 174. https://doi.org/10.1016/j.compstruct.2017.04.056.
[41] Mousanzhad D, Ghosh R, Ajdari A. Hamouda AMS, Nayeb-Hashemi H, Vaziri A.
Impact resistance and energy absorption of regular and functionally graded hexagonal
honeycombs with cell wall material strain hardening. International Journal of Mechanical
Sciences 2014; 89: 413-422. https://doi.org/10.1016/j.ijmecsci.2014.10.012
[42] Mangipudi KR, Van Buuren SW, Onck PR. The microstructural origin of strain
hardening in two-dimensional open-cell metal foams. International Journal of Solids and
Structures 2010; 47: 2081-2096. https://doi.org/10.1016/j.ijsolstr.2010.04.009
[43] Avalle M, Belingardi G, Montanini R. Characterization of polymeric structural foams
under compressive impact loading by means of energy-absorption diagram. International
Journal of Impact Engineering 2001; 25: 455-472. https://doi.org/10.1016/S0734-
743X(00)00060-9
[44] Li QM, Magkiriadis I, Harrigan JJ, Compressive strain at the onset of densification of
cellular solids. Journal of Cellular Plastics 2006; 42: 371-392.
https://doi.org/10.1177/0021955X06063519
[45] Technical Specification. NinjaFlex® 3D printing filament, https://ninjatek.com/wp-
content/uploads/2019/10/NinjaFlex-TDS.pdf [accessed 26 June 2020].
[46] Koohbor B, Kidane A, Lu W, Sutton MA. Investigation of the dynamic stress–strain
response of compressible polymeric foam using a non-parametric analysis. International
Journal of Impact Engineering 2016; 91: 170-182.
https://doi.org/10.1016/j.ijimpeng.2016.01.007
[47] Koohbor B, Singh NK, Kidane A. Radial and axial inertia stresses in high strain rate
deformation of polymer foams. International Journal of Mechanical Sciences 2020; 181:
105679. https://doi.org/10.1016/j.ijmecsci.2020.105679
43
[48] Avalle M, Belingardi G, Montanini R. Characterization of polymeric structural foams
under compressive impact loading by means of energy-absorption diagram. International
Journal of Impact Engineering 2001; 25: 455-472. https://doi.org/10.1016/S0734-
743X(00)00060-9
[49] Li QM, Magkiriadis I, Harrigan JJ, Compressive strain at the onset of densification of
cellular solids. Journal of Cellular Plastics 2006; 42: 371-392.
https://doi.org/10.1177/0021955X06063519
[50] Maskery I, Hussey A, Panesar A, Aremu A, Tuck C, Ashcroft I, Hague R. An
investigation into reinforced and functionally graded lattice structures. Journal of Cellular
Plastics 2016; 53: 151-165. https://doi.org/10.1177/0021955X16639035
[51] Bai L, Gong C, Chen X, Sun Y, Xin L, Pu H, Peng Y, Luo J. Mechanical properties
and energy absorption capabilities of functionally graded lattice structures: Experimental
and simulations. International Journal of Mechanical Sciences 2020; 182: 105735.
https://doi.org/10.1016/j.ijmecsci.2020.105735
[52] Ma J, Song J, Chen Y. An origami-inspired structure with graded stiffness.
International Journal of Mechanical Sciences 2018; 136: 134-142.
https://doi.org/10.1016/j.ijmecsci.2017.12.026
[53] Li Z, Chen W, Hao H. Functionally graded truncated square pyramid folded structures
with foam filler under dynamic crushing. Composites Part B 2019; 177: 107410.
https://doi.org/10.1016/j.compositesb.2019.107410
[54] Yuan L, Dai H, Song J, Ma J, Chen Y. The behavior of a functionally gradedorigami
structure subjected to quasi-static compression. Materials and Design 2020; 189: 108494.
https://doi.org/10.1016/j.matdes.2020.108494
[55] Wang Y, Sigmund O. Quasiperiodic mechanical metamaterials with extreme isotropic
stiffness. Extreme Mechanics Letters 2020; 34: 100596.
https://doi.org/10.1016/j.eml.2019.100596
[56] Panesar A, Abdi M, Hickman D, Ashcroft I. Strategies for functionally graded lattice
structures derived using topology optimisation for Additive Manufacturing. Additive
Manufacturing 2018; 19: 81-94. https://doi.org/10.1016/j.addma.2017.11.008
[57] Rohanifar M, Hatami-Marbini H. Numerical modelling of mechanical properties of
2D cellular solids with bi-modulus cell walls. Mechanics of Advanced Materials and
Structures 2019 (in press) https://doi.org/10.1080/15376494.2018.1563251
44
Appendix
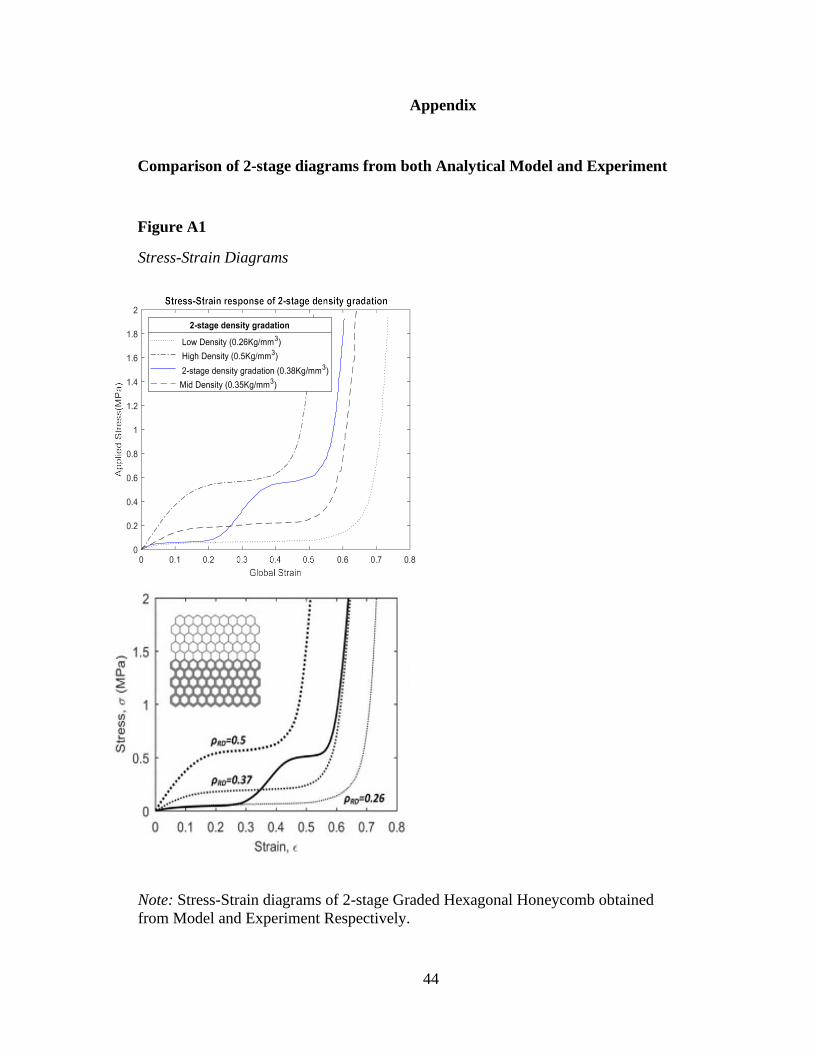
Comparison of 2-stage diagrams from both Analytical Model and Experiment
Figure A1
Stress-Strain Diagrams
Note: Stress-Strain diagrams of 2-stage Graded Hexagonal Honeycomb obtained
from Model and Experiment Respectively.
45
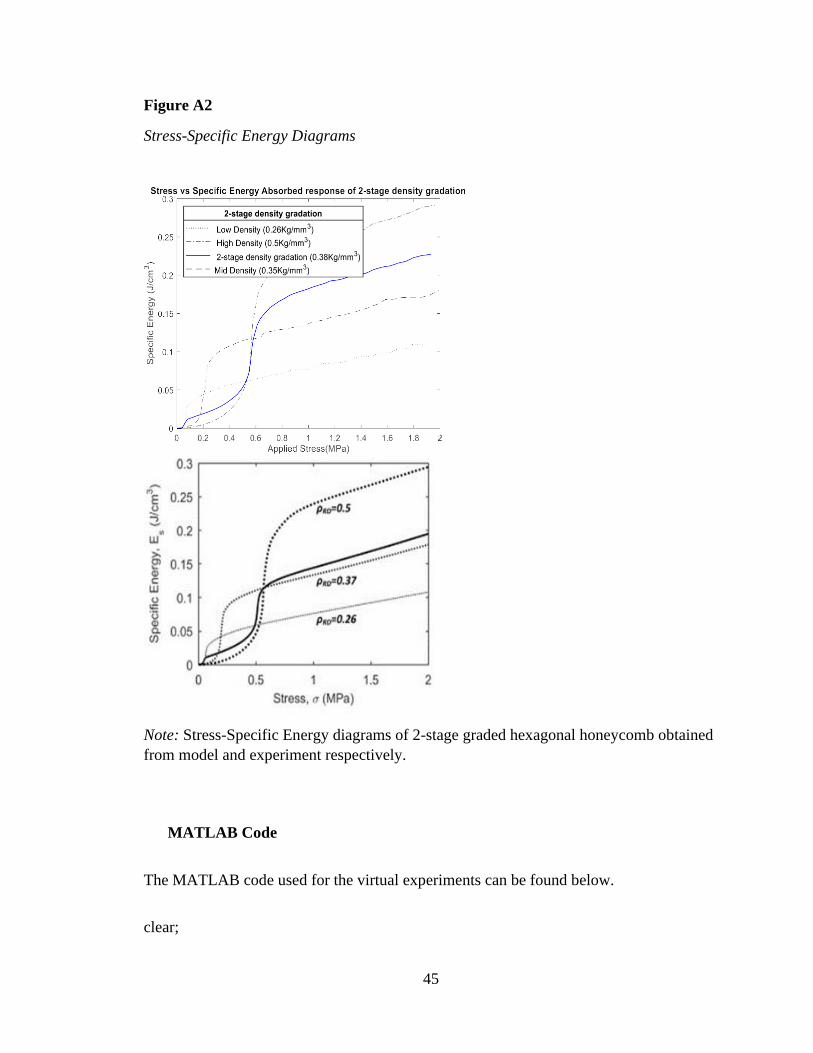
Figure A2
Stress-Specific Energy Diagrams
Note: Stress-Specific Energy diagrams of 2-stage graded hexagonal honeycomb obtained
from model and experiment respectively.
MATLAB Code
The MATLAB code used for the virtual experiments can be found below.
clear;
46
clc;
input=xlsread('...xlsx'); % input data
density=input(:,1);
stress=input(:,2);
strain=input(:,3);
H=65.5; % total thickness in mm
dist=xlsread('...xlsx'); % density gradation
thickness_dist=dist(:,1); % thickness in every 0.1mm
density_dist1=dist(:,2); % density distribution of the gradation distribution
pressure=0:0.01:2
h_0=H/(length(thickness_dist)-1);
for i=1:length(pressure) % pressure for loop
stress_applied(i)=pressure(i); % stress in MPa
output(i,2)=stress_applied(i); % stress as an output in MPa
Final_thickness1(i)=0; % incorporating the final thickness
in the for loop
for j=1:length(thickness_dist) % density distribution for loop
local_strain1(j)=griddata(density,stress,strain,density_dist1(j),stress_applied(i));
% linear interpolation to derive local strain

47
h_f1(j)=h_0*exp((-1)*(local_strain1(j)));
Final_thickness1(i)=Final_thickness1(i)+h_f1(j); % final thickness of the graded
global_strain1(i)=log(H/Final_thickness1(i)); % global strain of the graded
end output(i,3)=global_strain1(i); % global strain as an output
Overview of the Input and Output Files from the Virtual Experiments
The following tables are the data input for the 3-Stage Density Gradation
Virtual Experiments
Table A1
Data Input for Density Gradation
Density(Kg/mm^3) Stress(Mpa) Strain
0.26 0 0
0.26 0.01716714 0.015905
0.26 0.02543806 0.029161
0.26 0.03390794 0.039769
0.26 0.041927 0.055674
0.26 0.04232097 0.069329
0.26 0.04835914 0.087752
0.26 0.05127885 0.10617
0.26 0.05147642 0.124584
0.26 0.05761223 0.143006
0.26 0.05771099 0.161425
0.26 0.05781119 0.17677
0.26 0.05982393 0.198262
0.26 0.06066362 0.211986
0.26 0.06082827 0.230529
0.26 0.061882 0.255029

48
Density(Kg/mm^3) Stress(Mpa) Strain
0.26 0.06311684 0.274984
0.26 0.06324855 0.294929
0.26 0.06361077 0.315648
0.26 0.06377542 0.330737
0.26 0.06398397 0.350174
0.26 0.06414587 0.365519
0.26 0.06458218 0.399278
0.26 0.06789154 0.411554
0.26 0.07210646 0.445326
0.26 0.07227934 0.466809
0.26 0.07246868 0.484455
0.26 0.07269918 0.500567
0.26 0.08665286 0.535113
0.26 0.10380065 0.558921
0.26 0.12594543 0.580433
0.26 0.13078599 0.592716
0.26 0.16370405 0.614243
0.26 0.2123512 0.637325
0.26 0.27233473 0.654284
0.26 0.32641737 0.665097
0.26 0.39342794 0.675928
0.26 0.47787444 0.683712
0.26 0.56730969 0.689969
0.26 0.63189999 0.694658
0.26 0.71968878 0.699889
0.26 0.81328955 0.704105
0.26 0.87651882 0.708434
0.26 0.93506111 0.708594
0.26 0.99668879 0.70887
0.26 1.06180495 0.713641
0.26 1.11677349 0.7167
0.26 1.1682749 0.716768
0.26 1.21092955 0.716893
0.26 1.26269416 0.717931
0.26 1.30558358 0.719599
0.26 1.35705657 0.722316
0.26 1.40230759 0.723299
0.26 1.461975 0.723378
0.26 1.55144317 0.726566
0.26 1.61111058 0.726645
0.26 1.68068962 0.729806

49
Density(Kg/mm^3) Stress(Mpa) Strain
0.26 1.74035702 0.729885
0.26 1.7947049 0.733125
0.26 1.86960347 0.733214
0.26 1.9367293 0.733492
0.33 0 0
0.33 0.01843318 0.002827
0.33 0.0322726 0.022075
0.33 0.06990954 0.043432
0.33 0.08616598 0.058381
0.33 0.11060738 0.07089
0.33 0.13050193 0.089196
0.33 0.15039648 0.110044
0.33 0.16283057 0.127333
0.33 0.17194891 0.144622
0.33 0.17899489 0.166996
0.33 0.18272512 0.185302
0.33 0.18620667 0.207675
0.33 0.18686982 0.224964
0.33 0.19184346 0.245101
0.33 0.1926724 0.262898
0.33 0.19815668 0.274205
0.33 0.20276498 0.29056
0.33 0.20344861 0.308866
0.33 0.21256694 0.327172
0.33 0.21505376 0.345477
0.33 0.21754058 0.363783
0.33 0.21919846 0.382089
0.33 0.22001817 0.401581
0.33 0.22168528 0.420226
0.33 0.22701503 0.440057
0.33 0.22748786 0.459889
0.33 0.23121808 0.478194
0.33 0.24655347 0.495483
0.33 0.27639529 0.519891
0.33 0.30830946 0.537688
0.33 0.37794038 0.558282
0.33 0.45005812 0.571249
0.33 0.51430094 0.580402
0.33 0.57439905 0.581927
0.33 0.63781293 0.586504
0.33 0.65646407 0.594131
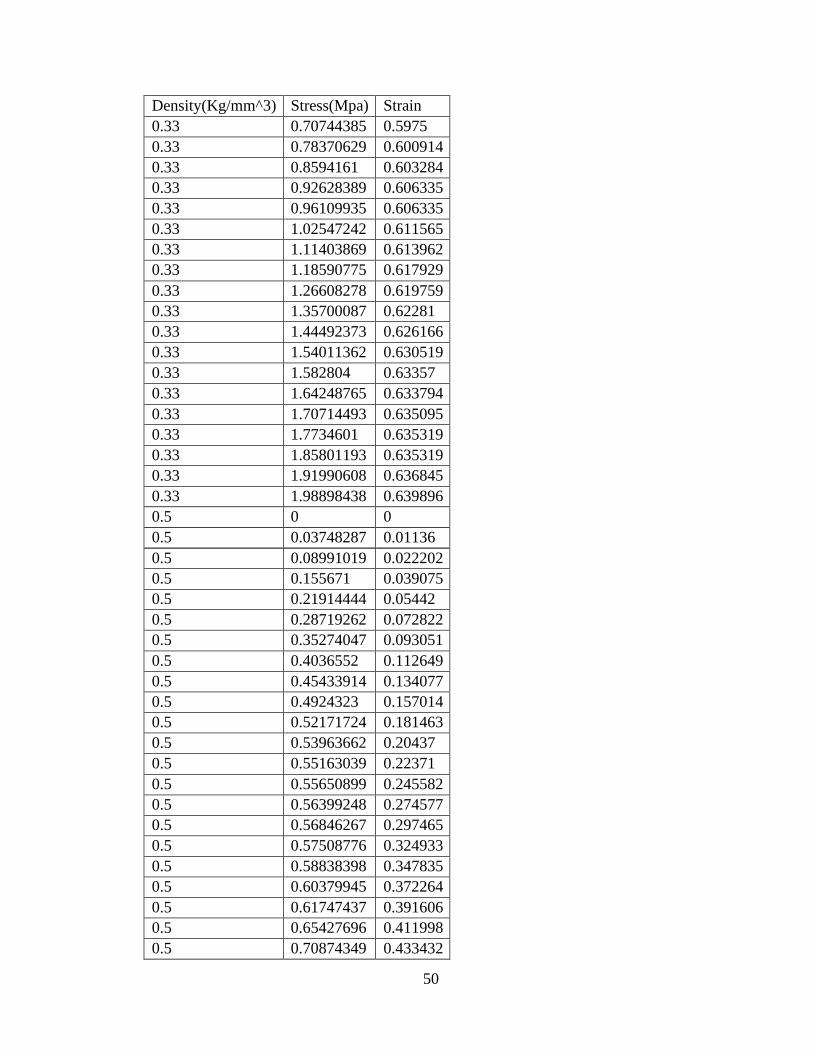
50
Density(Kg/mm^3) Stress(Mpa) Strain
0.33 0.70744385 0.5975
0.33 0.78370629 0.600914
0.33 0.8594161 0.603284
0.33 0.92628389 0.606335
0.33 0.96109935 0.606335
0.33 1.02547242 0.611565
0.33 1.11403869 0.613962
0.33 1.18590775 0.617929
0.33 1.26608278 0.619759
0.33 1.35700087 0.62281
0.33 1.44492373 0.626166
0.33 1.54011362 0.630519
0.33 1.582804 0.63357
0.33 1.64248765 0.633794
0.33 1.70714493 0.635095
0.33 1.7734601 0.635319
0.33 1.85801193 0.635319
0.33 1.91990608 0.636845
0.33 1.98898438 0.639896
0.5 0 0
0.5 0.03748287 0.01136
0.5 0.08991019 0.022202
0.5 0.155671 0.039075
0.5 0.21914444 0.05442
0.5 0.28719262 0.072822
0.5 0.35274047 0.093051
0.5 0.4036552 0.112649
0.5 0.45433914 0.134077
0.5 0.4924323 0.157014
0.5 0.52171724 0.181463
0.5 0.53963662 0.20437
0.5 0.55163039 0.22371
0.5 0.55650899 0.245582
0.5 0.56399248 0.274577
0.5 0.56846267 0.297465
0.5 0.57508776 0.324933
0.5 0.58838398 0.347835
0.5 0.60379945 0.372264
0.5 0.61747437 0.391606
0.5 0.65427696 0.411998
0.5 0.70874349 0.433432

51
Density(Kg/mm^3) Stress(Mpa) Strain
0.5 0.77574734 0.448781
0.5 0.85308263 0.461094
0.5 0.92518091 0.468824
0.5 1.0135303 0.476576
0.5 1.12285839 0.481307
0.5 1.16325941 0.485941
0.5 1.23220431 0.487563
0.5 1.32808321 0.492275
0.5 1.42812935 0.493942
0.5 1.48618242 0.498601
0.5 1.58092274 0.501786
0.5 1.65266955 0.503413
0.5 1.75526117 0.507117
0.5 1.85953988 0.511332
0.5 1.96042659 0.513
DISTRIBUTION
Below is the Gradation Distribution of Case 2 (1-2-6)
Table A2
Gradation Distribution of Case 2 (1-2-6)
H Gradation H Gradation H Gradation H Gradation
0 0.26 4.1 0.26 8.2 0.35 12.3 0.35
0.1 0.26 4.2 0.26 8.3 0.35 12.4 0.35
0.2 0.26 4.3 0.26 8.4 0.35 12.5 0.35
0.3 0.26 4.4 0.26 8.5 0.35 12.6 0.35
0.4 0.26 4.5 0.26 8.6 0.35 12.7 0.35
0.5 0.26 4.6 0.26 8.7 0.35 12.8 0.35
0.6 0.26 4.7 0.26 8.8 0.35 12.9 0.35
0.7 0.26 4.8 0.26 8.9 0.35 13 0.35
0.8 0.26 4.9 0.26 9 0.35 13.1 0.35
0.9 0.26 5 0.26 9.1 0.35 13.2 0.35

52
H Gradation H Gradation H Gradation H Gradation
1 0.26 5.1 0.26 9.2 0.35 13.3 0.35
1.1 0.26 5.2 0.26 9.3 0.35 13.4 0.35
1.2 0.26 5.3 0.26 9.4 0.35 13.5 0.35
1.3 0.26 5.4 0.26 9.5 0.35 13.6 0.35
1.4 0.26 5.5 0.26 9.6 0.35 13.7 0.35
1.5 0.26 5.6 0.26 9.7 0.35 13.8 0.35
1.6 0.26 5.7 0.26 9.8 0.35 13.9 0.35
1.7 0.26 5.8 0.26 9.9 0.35 14 0.35
1.8 0.26 5.9 0.26 10 0.35 14.1 0.35
1.9 0.26 6 0.26 10.1 0.35 14.2 0.35
2 0.26 6.1 0.26 10.2 0.35 14.3 0.35
2.1 0.26 6.2 0.26 10.3 0.35 14.4 0.35
2.2 0.26 6.3 0.26 10.4 0.35 14.5 0.35
2.3 0.26 6.4 0.26 10.5 0.35 14.6 0.35
2.4 0.26 6.5 0.26 10.6 0.35 14.7 0.35
2.5 0.26 6.6 0.26 10.7 0.35 14.8 0.35
2.6 0.26 6.7 0.26 10.8 0.35 14.9 0.35
2.7 0.26 6.8 0.26 10.9 0.35 15 0.35
2.8 0.26 6.9 0.26 11 0.35 15.1 0.35
2.9 0.26 7 0.26 11.1 0.35 15.2 0.35
3 0.26 7.1 0.26 11.2 0.35 15.3 0.35
3.1 0.26 7.2 0.26 11.3 0.35 15.4 0.35
3.2 0.26 7.3 0.26 11.4 0.35 15.5 0.35
3.3 0.26 7.4 0.35 11.5 0.35 15.6 0.35
3.4 0.26 7.5 0.35 11.6 0.35 15.7 0.35
3.5 0.26 7.6 0.35 11.7 0.35 15.8 0.35
3.6 0.26 7.7 0.35 11.8 0.35 15.9 0.35
3.7 0.26 7.8 0.35 11.9 0.35 16 0.35
3.8 0.26 7.9 0.35 12 0.35 16.1 0.35
3.9 0.26 8 0.35 12.1 0.35 16.2 0.35
4 0.26 8.1 0.35 12.2 0.35 16.3 0.35
16.4 0.35 20.5 0.35 24.6 0.5 28.7 0.5
16.5 0.35 20.6 0.35 24.7 0.5 28.8 0.5
16.6 0.35 20.7 0.35 24.8 0.5 28.9 0.5
16.7 0.35 20.8 0.35 24.9 0.5 29 0.5
16.8 0.35 20.9 0.35 25 0.5 29.1 0.5
16.9 0.35 21 0.35 25.1 0.5 29.2 0.5
17 0.35 21.1 0.35 25.2 0.5 29.3 0.5
17.1 0.35 21.2 0.35 25.3 0.5 29.4 0.5
17.2 0.35 21.3 0.35 25.4 0.5 29.5 0.5
17.3 0.35 21.4 0.35 25.5 0.5 29.6 0.5
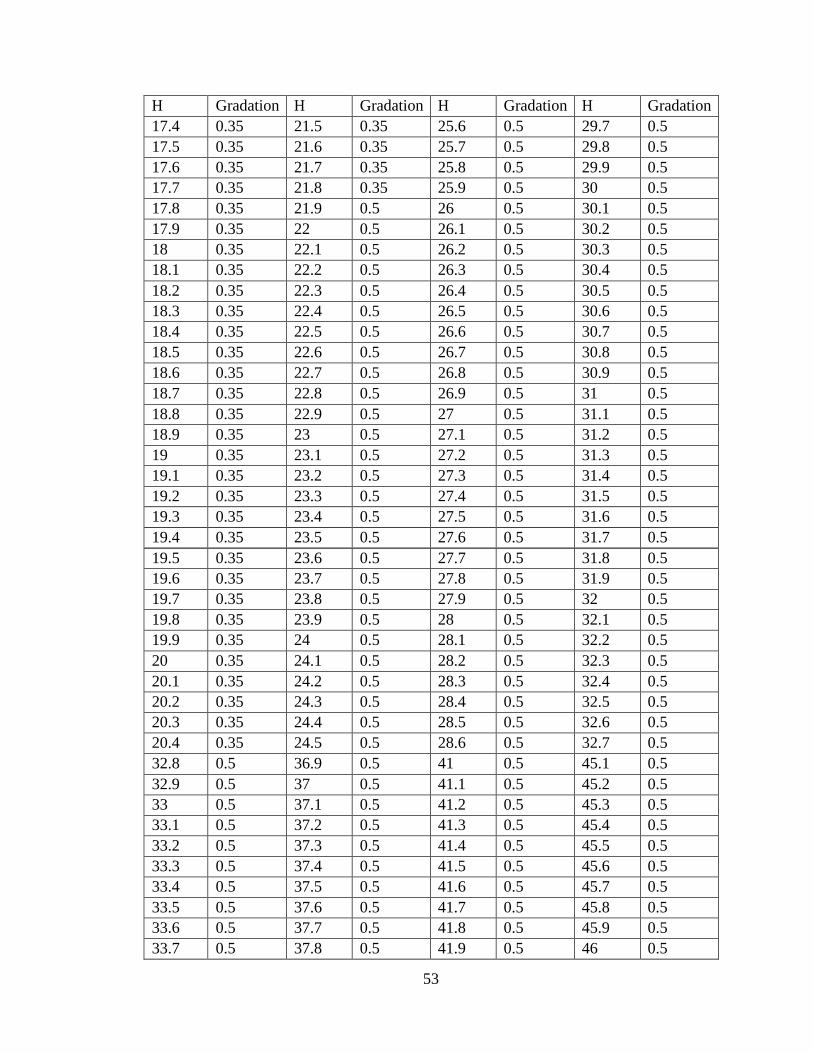
53
H Gradation H Gradation H Gradation H Gradation
17.4 0.35 21.5 0.35 25.6 0.5 29.7 0.5
17.5 0.35 21.6 0.35 25.7 0.5 29.8 0.5
17.6 0.35 21.7 0.35 25.8 0.5 29.9 0.5
17.7 0.35 21.8 0.35 25.9 0.5 30 0.5
17.8 0.35 21.9 0.5 26 0.5 30.1 0.5
17.9 0.35 22 0.5 26.1 0.5 30.2 0.5
18 0.35 22.1 0.5 26.2 0.5 30.3 0.5
18.1 0.35 22.2 0.5 26.3 0.5 30.4 0.5
18.2 0.35 22.3 0.5 26.4 0.5 30.5 0.5
18.3 0.35 22.4 0.5 26.5 0.5 30.6 0.5
18.4 0.35 22.5 0.5 26.6 0.5 30.7 0.5
18.5 0.35 22.6 0.5 26.7 0.5 30.8 0.5
18.6 0.35 22.7 0.5 26.8 0.5 30.9 0.5
18.7 0.35 22.8 0.5 26.9 0.5 31 0.5
18.8 0.35 22.9 0.5 27 0.5 31.1 0.5
18.9 0.35 23 0.5 27.1 0.5 31.2 0.5
19 0.35 23.1 0.5 27.2 0.5 31.3 0.5
19.1 0.35 23.2 0.5 27.3 0.5 31.4 0.5
19.2 0.35 23.3 0.5 27.4 0.5 31.5 0.5
19.3 0.35 23.4 0.5 27.5 0.5 31.6 0.5
19.4 0.35 23.5 0.5 27.6 0.5 31.7 0.5
19.5 0.35 23.6 0.5 27.7 0.5 31.8 0.5
19.6 0.35 23.7 0.5 27.8 0.5 31.9 0.5
19.7 0.35 23.8 0.5 27.9 0.5 32 0.5
19.8 0.35 23.9 0.5 28 0.5 32.1 0.5
19.9 0.35 24 0.5 28.1 0.5 32.2 0.5
20 0.35 24.1 0.5 28.2 0.5 32.3 0.5
20.1 0.35 24.2 0.5 28.3 0.5 32.4 0.5
20.2 0.35 24.3 0.5 28.4 0.5 32.5 0.5
20.3 0.35 24.4 0.5 28.5 0.5 32.6 0.5
20.4 0.35 24.5 0.5 28.6 0.5 32.7 0.5
32.8 0.5 36.9 0.5 41 0.5 45.1 0.5
32.9 0.5 37 0.5 41.1 0.5 45.2 0.5
33 0.5 37.1 0.5 41.2 0.5 45.3 0.5
33.1 0.5 37.2 0.5 41.3 0.5 45.4 0.5
33.2 0.5 37.3 0.5 41.4 0.5 45.5 0.5
33.3 0.5 37.4 0.5 41.5 0.5 45.6 0.5
33.4 0.5 37.5 0.5 41.6 0.5 45.7 0.5
33.5 0.5 37.6 0.5 41.7 0.5 45.8 0.5
33.6 0.5 37.7 0.5 41.8 0.5 45.9 0.5
33.7 0.5 37.8 0.5 41.9 0.5 46 0.5

54
H Gradation H Gradation H Gradation H Gradation
33.8 0.5 37.9 0.5 42 0.5 46.1 0.5
33.9 0.5 38 0.5 42.1 0.5 46.2 0.5
34 0.5 38.1 0.5 42.2 0.5 46.3 0.5
34.1 0.5 38.2 0.5 42.3 0.5 46.4 0.5
34.2 0.5 38.3 0.5 42.4 0.5 46.5 0.5
34.3 0.5 38.4 0.5 42.5 0.5 46.6 0.5
34.4 0.5 38.5 0.5 42.6 0.5 46.7 0.5
34.5 0.5 38.6 0.5 42.7 0.5 46.8 0.5
34.6 0.5 38.7 0.5 42.8 0.5 46.9 0.5
34.7 0.5 38.8 0.5 42.9 0.5 47 0.5
34.8 0.5 38.9 0.5 43 0.5 47.1 0.5
34.9 0.5 39 0.5 43.1 0.5 47.2 0.5
35 0.5 39.1 0.5 43.2 0.5 47.3 0.5
35.1 0.5 39.2 0.5 43.3 0.5 47.4 0.5
35.2 0.5 39.3 0.5 43.4 0.5 47.5 0.5
35.3 0.5 39.4 0.5 43.5 0.5 47.6 0.5
35.4 0.5 39.5 0.5 43.6 0.5 47.7 0.5
35.5 0.5 39.6 0.5 43.7 0.5 47.8 0.5
35.6 0.5 39.7 0.5 43.8 0.5 47.9 0.5
35.7 0.5 39.8 0.5 43.9 0.5 48 0.5
35.8 0.5 39.9 0.5 44 0.5 48.1 0.5
35.9 0.5 40 0.5 44.1 0.5 48.2 0.5
36 0.5 40.1 0.5 44.2 0.5 48.3 0.5
36.1 0.5 40.2 0.5 44.3 0.5 48.4 0.5
36.2 0.5 40.3 0.5 44.4 0.5 48.5 0.5
36.3 0.5 40.4 0.5 44.5 0.5 48.6 0.5
36.4 0.5 40.5 0.5 44.6 0.5 48.7 0.5
36.5 0.5 40.6 0.5 44.7 0.5 48.8 0.5
36.6 0.5 40.7 0.5 44.8 0.5 48.9 0.5
36.7 0.5 40.8 0.5 44.9 0.5 49 0.5
36.8 0.5 40.9 0.5 45 0.5 49.1 0.5
49.2 0.5 53.3 0.5 57.4 0.5 61.5 0.5
49.3 0.5 53.4 0.5 57.5 0.5 61.6 0.5
49.4 0.5 53.5 0.5 57.6 0.5 61.7 0.5
49.5 0.5 53.6 0.5 57.7 0.5 61.8 0.5
49.6 0.5 53.7 0.5 57.8 0.5 61.9 0.5
49.7 0.5 53.8 0.5 57.9 0.5 62 0.5
49.8 0.5 53.9 0.5 58 0.5 62.1 0.5
49.9 0.5 54 0.5 58.1 0.5 62.2 0.5
50 0.5 54.1 0.5 58.2 0.5 62.3 0.5
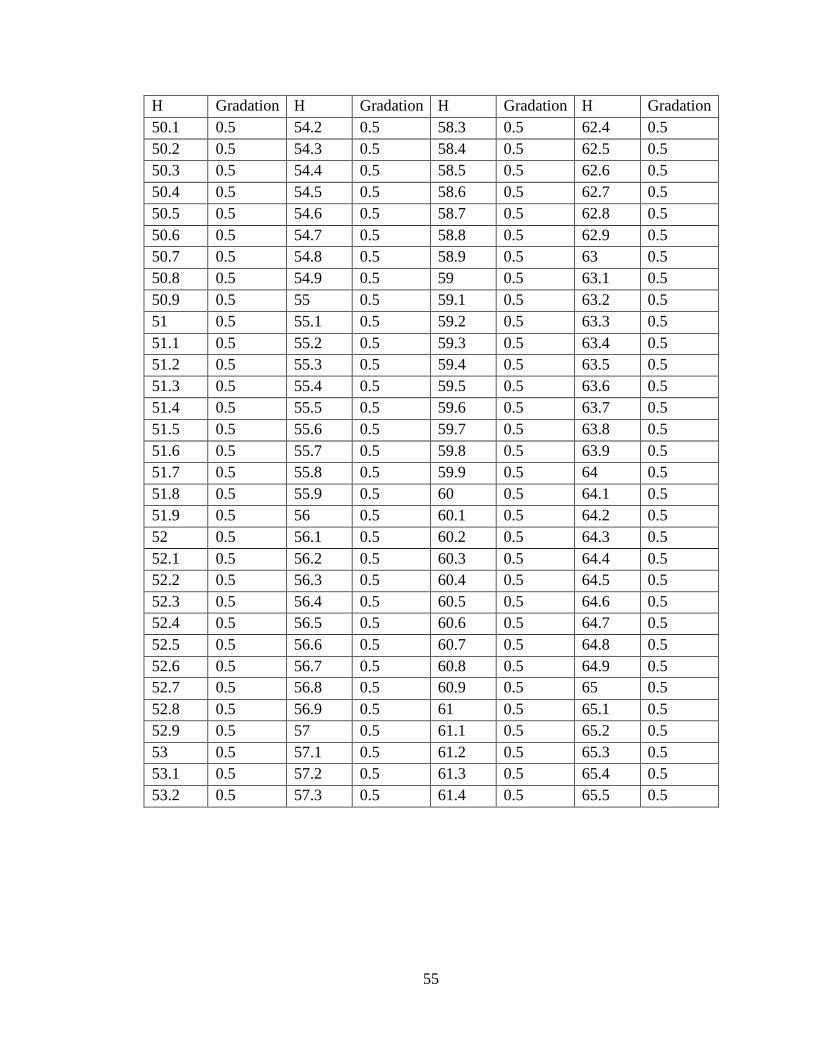
55
H Gradation H Gradation H Gradation H Gradation
50.1 0.5 54.2 0.5 58.3 0.5 62.4 0.5
50.2 0.5 54.3 0.5 58.4 0.5 62.5 0.5
50.3 0.5 54.4 0.5 58.5 0.5 62.6 0.5
50.4 0.5 54.5 0.5 58.6 0.5 62.7 0.5
50.5 0.5 54.6 0.5 58.7 0.5 62.8 0.5
50.6 0.5 54.7 0.5 58.8 0.5 62.9 0.5
50.7 0.5 54.8 0.5 58.9 0.5 63 0.5
50.8 0.5 54.9 0.5 59 0.5 63.1 0.5
50.9 0.5 55 0.5 59.1 0.5 63.2 0.5
51 0.5 55.1 0.5 59.2 0.5 63.3 0.5
51.1 0.5 55.2 0.5 59.3 0.5 63.4 0.5
51.2 0.5 55.3 0.5 59.4 0.5 63.5 0.5
51.3 0.5 55.4 0.5 59.5 0.5 63.6 0.5
51.4 0.5 55.5 0.5 59.6 0.5 63.7 0.5
51.5 0.5 55.6 0.5 59.7 0.5 63.8 0.5
51.6 0.5 55.7 0.5 59.8 0.5 63.9 0.5
51.7 0.5 55.8 0.5 59.9 0.5 64 0.5
51.8 0.5 55.9 0.5 60 0.5 64.1 0.5
51.9 0.5 56 0.5 60.1 0.5 64.2 0.5
52 0.5 56.1 0.5 60.2 0.5 64.3 0.5
52.1 0.5 56.2 0.5 60.3 0.5 64.4 0.5
52.2 0.5 56.3 0.5 60.4 0.5 64.5 0.5
52.3 0.5 56.4 0.5 60.5 0.5 64.6 0.5
52.4 0.5 56.5 0.5 60.6 0.5 64.7 0.5
52.5 0.5 56.6 0.5 60.7 0.5 64.8 0.5
52.6 0.5 56.7 0.5 60.8 0.5 64.9 0.5
52.7 0.5 56.8 0.5 60.9 0.5 65 0.5
52.8 0.5 56.9 0.5 61 0.5 65.1 0.5
52.9 0.5 57 0.5 61.1 0.5 65.2 0.5
53 0.5 57.1 0.5 61.2 0.5 65.3 0.5
53.1 0.5 57.2 0.5 61.3 0.5 65.4 0.5
53.2 0.5 57.3 0.5 61.4 0.5 65.5 0.5

56
DISTRIBUTION OUTPUT
The tables below are the Global Stress-Strain Output for Case 2 (1-2-6)
Table A3
Global Stress-Strain Output for Case 2 (1-2-6)
Stress Strain
0 -0.00153
0.01 0.001875
0.02 0.005915
0.03 0.012611
0.04 0.018004
0.05 0.025598
0.06 0.038608
0.07 0.061054
0.08 0.071356
0.09 0.076045
0.1 0.079984
0.11 0.083735
0.12 0.088229
0.13 0.093205
0.14 0.097886
0.15 0.102468
0.16 0.107711
0.17 0.113607
0.18 0.122273
0.19 0.137855
0.2 0.148456
. .
. .
. .
1.93 0.560473