
Optimization of Influential Factors in Gold Electrowinning ... strength and current density on gold...
12
International Journal of Science and Research (IJSR) ISSN (Online): 2319-7064 Index Copernicus Value (2015): 78.96 | Impact Factor (2015): 6.391 Volume 6 Issue 7, July 2017 www.ijsr.net Licensed Under Creative Commons Attribution CC BY Optimization of Influential Factors in Gold Electrowinning using Response Surface Methodology Gideon A. Ocran Department of Chemical Engineering, Kwame Nkrumah University of Science and Technology, Kumasi, Ghana Abstract: Electrowinning is the extraction of metals from aqueous solution. The effects of three main factors namely temperature, caustic strength and current density on gold electrowinning were studied in order to obtain high electrowinning efficiency. Response surface methodology, in combination with central composite face-centered design (RSM-CCF), was used to fit the model and ridge analysis to optimize the selected factors. A series of 17 experiments arranged in a CCF design was carried out and the results fitted using ordinary least squares (OLS) method. Findings confirmed that the effect of caustic strength was found to be the most influential of the three factors followed by temperature and current density.For deposition of gold in the circuit current density was also vital. The average electrowinning efficiency at 683, 750 and 800 A/m 2 are 77, 82.1 and 86.2% respectively. Mathematical model was constructed to characterise the electrowinning efficiency. From the model, optimal ranges obtained were caustic strength of 2.28 - 2.43%, current density of 784.50– 797.00 Am -2 and temperature of 46.70 – 49.50℃. Keywords: Gold, Electrowinning efficiency, Optimization, Response surface methodology (RSM), Central composite face-centered (CCF) design, Ordinary least squares (OLS) 1. Introduction Electrometallurgy is a technology developed after the discovery of electric current around the nineteenth century and has been employed extensively in separation and purification processes in the metal industries. Gold electrowinning is an electrolytic process in which a direct current carried by free electrons drives chemical reaction of reduction of aurocyanide to solid gold usingelectrodes immersed in an electrolyte [1]. Generally, the electrowinning process is affected by electrochemical and physical parameters. Some electrochemical parameters include concentration and composition of electrolyte, temperature, current density and strength of additives whiles physical parameters are current distribution, time and electrolyte flow rate [2]. Gold is contaminated by base metals such as copper, iron, nickel and cobalt that have been eluted during upstream operations [3]. The impurities depending on the operating conditions and concentration usually co-deposit with gold in the circuit [1]. Some of the impurities such as copper and iron can be easily removed to such an extent that they virtually do not affect gold deposition. However, some of them such as nickel and cobalt are not easily removed [4],[5]. Low base metals content will result in improve gold deposition and bullion fineness (quality of gold). A high electrowinning efficiency and bullion fineness can be obtained from highly purified electrolyte. However, severe electrolyte purification can be economically nonviable [4]. An alternative way to achieve increase electrowinning efficiency is optimization of gold electrowinning operating conditions. The design of experiment (DOE) and statistical techniques are widely used to optimize process parameters [6]. Often the results which have been obtained from the traditional approach of studying “one factor at a time” were only valid for fixed experimental [7]. The response surface methodology technique provides an efficient and systematic method to optimize the response or performance design [8]. RSM is a collection of mathematical and statistical techniques for designing experiments, building models, evaluating the effects of factors and analysis of problems [9],[10]. It is employed to study the relationship between one or more response variables and a set of quantitative or qualitative experimental factors. RSM is often used after the important factors are identified and to find the factor settings that optimise the response [11], [12]. The application of RSM reduces the number of experiments required for the analysis of the main effects and interactions between factors [11],[13],[14]. An important point is that many different variables can be examined simultaneously. In the present study, the objective was to optimize gold electrowinning operation by studying the influence of temperature,caustic strengthand current density on electrowinning efficiency and also optimum parameters forgold electrowinning. Plant scale data is used for the optimisation process. 2. Materials and Methods 2.1 Factors Selection The independent factors selected for the study were temperature (x 1 ), caustic strength (x 2 ) and current density (x 3 ). For the three test factors selected, each one has three levels in the central composite design matrix. The design required 17 experiments. The effect of each independent Paper ID: ART20174961 DOI: 10.21275/ART20174961 479
-
Upload
hoangduong -
Category
Documents
-
view
223 -
download
4
Transcript of Optimization of Influential Factors in Gold Electrowinning ... strength and current density on gold...
International Journal of Science and Research (IJSR) ISSN (Online): 2319-7064
Index Copernicus Value (2015): 78.96 | Impact Factor (2015): 6.391
Volume 6 Issue 7, July 2017
www.ijsr.net Licensed Under Creative Commons Attribution CC BY
Optimization of Influential Factors in Gold
Electrowinning using Response Surface
Methodology
Gideon A. Ocran
Department of Chemical Engineering, Kwame Nkrumah University of Science and Technology, Kumasi, Ghana
Abstract: Electrowinning is the extraction of metals from aqueous solution. The effects of three main factors namely temperature,
caustic strength and current density on gold electrowinning were studied in order to obtain high electrowinning efficiency. Response
surface methodology, in combination with central composite face-centered design (RSM-CCF), was used to fit the model and ridge
analysis to optimize the selected factors. A series of 17 experiments arranged in a CCF design was carried out and the results fitted
using ordinary least squares (OLS) method. Findings confirmed that the effect of caustic strength was found to be the most influential
of the three factors followed by temperature and current density.For deposition of gold in the circuit current density was also vital. The
average electrowinning efficiency at 683, 750 and 800 A/m2 are 77, 82.1 and 86.2% respectively. Mathematical model was constructed to
characterise the electrowinning efficiency. From the model, optimal ranges obtained were caustic strength of 2.28 - 2.43%, current
density of 784.50– 797.00 Am-2 and temperature of 46.70 – 49.50℃.
Keywords: Gold, Electrowinning efficiency, Optimization, Response surface methodology (RSM), Central composite face-centered
(CCF) design, Ordinary least squares (OLS)
1. Introduction
Electrometallurgy is a technology developed after the
discovery of electric current around the nineteenth century
and has been employed extensively in separation and
purification processes in the metal industries. Gold
electrowinning is an electrolytic process in which a direct
current carried by free electrons drives chemical reaction of
reduction of aurocyanide to solid gold usingelectrodes
immersed in an electrolyte [1].
Generally, the electrowinning process is affected by
electrochemical and physical parameters. Some
electrochemical parameters include concentration and
composition of electrolyte, temperature, current density and
strength of additives whiles physical parameters are current
distribution, time and electrolyte flow rate [2].
Gold is contaminated by base metals such as copper, iron,
nickel and cobalt that have been eluted during upstream
operations [3]. The impurities depending on the operating
conditions and concentration usually co-deposit with gold in
the circuit [1]. Some of the impurities such as copper and
iron can be easily removed to such an extent that they
virtually do not affect gold deposition. However, some of
them such as nickel and cobalt are not easily removed
[4],[5].
Low base metals content will result in improve gold
deposition and bullion fineness (quality of gold). A high
electrowinning efficiency and bullion fineness can be
obtained from highly purified electrolyte. However, severe
electrolyte purification can be economically nonviable [4].
An alternative way to achieve increase electrowinning
efficiency is optimization of gold electrowinning operating
conditions.
The design of experiment (DOE) and statistical techniques
are widely used to optimize process parameters [6]. Often
the results which have been obtained from the traditional
approach of studying “one factor at a time” were only valid
for fixed experimental [7].
The response surface methodology technique provides an
efficient and systematic method to optimize the response or
performance design [8]. RSM is a collection of
mathematical and statistical techniques for designing
experiments, building models, evaluating the effects of
factors and analysis of problems [9],[10]. It is employed to
study the relationship between one or more response
variables and a set of quantitative or qualitative experimental
factors. RSM is often used after the important factors are
identified and to find the factor settings that optimise the
response [11], [12]. The application of RSM reduces the
number of experiments required for the analysis of the main
effects and interactions between factors [11],[13],[14]. An
important point is that many different variables can be
examined simultaneously.
In the present study, the objective was to optimize gold
electrowinning operation by studying the influence of
temperature,caustic strengthand current density on
electrowinning efficiency and also optimum parameters
forgold electrowinning. Plant scale data is used for the
optimisation process.
2. Materials and Methods
2.1 Factors Selection
The independent factors selected for the study were
temperature (x1), caustic strength (x2) and current density
(x3). For the three test factors selected, each one has three
levels in the central composite design matrix. The design
required 17 experiments. The effect of each independent
Paper ID: ART20174961 DOI: 10.21275/ART20174961 479

International Journal of Science and Research (IJSR) ISSN (Online): 2319-7064
Index Copernicus Value (2015): 78.96 | Impact Factor (2015): 6.391
Volume 6 Issue 7, July 2017
www.ijsr.net Licensed Under Creative Commons Attribution CC BY
factor and their interaction over the considered response
(electrowinning efficiency) was investigated.
2.2 Method of Analysis
Simple random sampling technique with replacement was
used to sample the data.The function „RANDBETWEEN‟ in
Microsoft excel spreadsheet was employed to generate 17
individuals in each of the 17 groups. The averages of each
group correspond to one experiment. The minimum and
maximum level of each factor were determined as shown in
(table 1)in order to use the CCF methodology
[12],[15],[16],[17].The 17 experimental runs were designed
in accordance with central compositeface-centered (CCF),
which allowed a full quadratic model for the response under
investigation. The minimal level, centre level and maximal
level of the experimental parameters were coded as -1, 0 and
1 respectively. A detailed discussion of CCF design is
documented elsewhere [18].The CCF design is often
classified as anRSM design [18]. The actual values of the
factors in natural units along with the response values are
presented in table 2.
Response surface methodology which includes factorial
designs and regression analysis was used for the
experimental design, model fitting and validation, and
condition optimization [14].The correlation matrix between
the selected factors was determined using MODDE 10.1.1
Umetrics software. The RSM model was expressed as:
where dependent variable y was a function of 1 2 3, ,x x x and
the experimental error term denoted as e .
A quadratic regression model was selected in the gold
electrowinning operation.The quadratic regression model
was used to predict response values for any factor
combination in the region of interest, since it was a sound
choice for the optimization objective and involves modelling
the curved response functions. A second-order quadratic
model was employed for curvature in the response surface of
this study. For three independent variables, the second-order
quadratic model was expressed as:
2 2 2
1 1 2 2 3 3 11 1 22 2 33 3 12 1 2 13 1 3 23 2 3 2oy b b x b x b x b x b x b x b x x b x x b x x e
where ob is the value of the fixed response at the central
point of the experiment, 1 2,b b and 3b are the coefficients
of the linear terms; 11 22,b b and 33b are the coefficients of
the quadratic terms and 12 13,b b and 23b are the coefficients
of the cross products.
The method of ordinary least squares was used to estimate
the parameters of the mathematical model. Finally, separate
test was performed at the conditions predicted by the model.
2.3 Statistical Analysis of Results
A number of techniques were used to measure the adequacy
of the regression model. The model fitting was evaluated by
checking the coefficient of determination (R2),
reproducibility and prediction measure (Q2). The optimal
conditions for the factors were determined by the method of
ridge analysis in RSM. The validity of the model was
examined at 95% confidence interval.
Table 1: Maximum and minimum levels of the three factors Factor Description Minimum value Maximum value
Temperature x1 45.94 53.88
Caustic Strength x2 2.28 3.17
Current Density x3 781.3 797.1
Table 2: Central composite face-centered design
arrangements of the factors in natural units along with the
response Experim
ent
number
Run
orde
r
Independent factor Response
variable
Temperaturex1/
(°C)
Caustic
strengthx2/
(%)
Current
densityx3/(
Am-2)
Electrowin
ning
efficiency
y/(%)
1 15 49.00 2.60 796.50 85.94
2 13 49.06 2.54 790.63 85.69
3 12 48.75 2.74 790.63 83.94
4 6 47.88 2.58 796.25 87.00
5 2 47.47 2.70 788.24 85.41
6 17 49.24 2.62 794.12 84.88
7 7 49.47 2.75 787.88 82.59
8 9 47.35 2.61 797.10 85.41
9 3 49.65 2.68 781.35 84.29
10 10 47.82 2.74 796.71 84.65
11 16 48.35 2.67 788.24 85.59
12 1 49.29 2.46 787.12 86.24
13 5 45.94 2.28 788.24 90.00
14 11 48.82 2.43 785.29 86.12
15 8 53.88 3.08 788.24 80.06
16 4 51.94 3.17 794.12 77.59
17 14 48.88 2.61 785.29 86.00
3. Results and Discussion
3.1 RSM Model Analysis of the Data
3.1.1Data Evaluation
The correlation between temperature, caustic strength,
current density and electrowinning efficiency is shown in
table 3.
Table 3: Correlation matrix of the selected factors Temperature Caustic
strength
Current
density
Electrowinning
efficiency
Temperature 1 0.77796 -0.14117 -0.84194
Caustic strength 0.77796 1 0.15286 -0.95412
Current density -0.14117 0.15286 1 -0.0726654
Electrowinning
efficiency
-0.84194 -0.95412 -0.0726654 1
From table 3 there exist strong negative
relationshipsbetween caustic strength and electrowinning
efficiency then temperature and electrowinning efficiency. A
very weak negative relationship is recorded between current
density and electrowinning efficiency.
Paper ID: ART20174961 DOI: 10.21275/ART20174961 480

International Journal of Science and Research (IJSR) ISSN (Online): 2319-7064
Index Copernicus Value (2015): 78.96 | Impact Factor (2015): 6.391
Volume 6 Issue 7, July 2017
www.ijsr.net Licensed Under Creative Commons Attribution CC BY
3.1.2 Fitting the Model and Evaluation of Fit
The result of the quadratic response-surface model fitting for
the response(y)is shown in table 4.The fitted model is given
as
y = 85.619 – 1.382x1– 2.629x2+ 0.645x3– 0.7512
1x –0.746
2
2x + 0.0642
3x – 0.676 1 2x x +
0.249 1 3x x – 0.574 2 3x x (3)
Table 4: The quadratic model for the response variable Electrowinning
efficiency
Coeff. SC Std. Err. P Conf.int(±)
Constant 85.6193 0.624041 2.88246e-013 1.47564
Temperature -1.38201 0.46118 0.0200362 1.09053
Causticstrength -2.629 0.46118 0.000734898 1.09053
Current density 0.644999 0.46118 0.204648 1.09053
temp*temp -0.751272 0.890973 0.426984 2.10684
cau*cau -0.746271 0.890973 0.429926 2.10684
cur*cur 0.0637261 0.890973 0.944981 2.10684
temp*cau -0.67625 0.515615 0.231053 1.21925
temp*cur 0.248752 0.515615 0.644215 1.21925
cau*cur -0.573748 0.515615 0.302565 1.21925
Testing the goodness of fit of the model by checking
whether the model is adequate is through examination of the
plot shown in figure 1
Figure 1: Summary of fit plot of the initial model
A model can be judged as good if R2–Q
2<0.2–0.3, Q
2>0.5,
model validity>0.25 and reproducibility is greater than 0.5
[12].From figure 1, the total measure of fit (R2) is 0.877
which indicate that about 87.7% of the total variation in the
response can be explained by the three independent factors.
The model validity for the response is higher than 0.25,
which means that there is no significant lack of fit. The
reproducibility of 0.963 is above 0.5 which implies that
there is a small pure error, good control of the experimental
set up and the model validity evaluated. However, the
predictive measure (Q2) is -0.615 which is not acceptable for
the model. A possible reason forthe low Q2value could be
that the regression model contains irrelevant term(s) [18].
This was checked through a bar chart of the regression
coefficients.
Paper ID: ART20174961 DOI: 10.21275/ART20174961 481

International Journal of Science and Research (IJSR) ISSN (Online): 2319-7064
Index Copernicus Value (2015): 78.96 | Impact Factor (2015): 6.391
Volume 6 Issue 7, July 2017
www.ijsr.net Licensed Under Creative Commons Attribution CC BY
Figure 2: Bar chart of regression coefficients
Figure 2 provides the plot of the regression coefficients for
the model. The plot shows the model term which is not
significant for the response. From the plot the cur*cur
quadratic term display a need to improve the model.
The N-plot of residuals lies between normal lines as shown
in figure 3. It can be observed that the residuals are
distributed normally. Some gaps between observations in the
response probablestate that non-linear relationship exists
between the factors and the response. The deviation of
experiment 4 and 5 could as well be due to the irrelevant
term seen in the regression coefficient.
Figure 3: Normal probability graph for the response
Figure 4 shows the residuals plot against run order and it
states that there is no systematic relationship between
residual and the run order.
Paper ID: ART20174961 DOI: 10.21275/ART20174961 482

International Journal of Science and Research (IJSR) ISSN (Online): 2319-7064
Index Copernicus Value (2015): 78.96 | Impact Factor (2015): 6.391
Volume 6 Issue 7, July 2017
www.ijsr.net Licensed Under Creative Commons Attribution CC BY
Figure 4: Residual versus run order for the response
The plot of the residuals against the predicted response is
shown in figure 5. It can be observed that the plot is random
with no patterns.
Figure 5: Plot of residuals against predicted response
In order to evaluate the fit, it is worthy to look at the
observed against predicted values for the response. Figure 6
predicted the observed values very well and majority of the
experiments are within the target efficiency.
Paper ID: ART20174961 DOI: 10.21275/ART20174961 483

International Journal of Science and Research (IJSR) ISSN (Online): 2319-7064
Index Copernicus Value (2015): 78.96 | Impact Factor (2015): 6.391
Volume 6 Issue 7, July 2017
www.ijsr.net Licensed Under Creative Commons Attribution CC BY
Figure 6: Graph of observed against predicted values for the response
The present statue of the model is the best possible fit and
can be effectively used for explaining the relationship
between the factors and response with a good reliability.
However, the model is not a tractable tool in order to predict
electrowinning efficiency for new series of data.The worst
case scenario encountered for the predictive measure in
figure 1 necessitate that the model needs to be
improved.Logarithmic transformation is carried out for
current density as detailed in table 5.
Table 5: Transformation factor table Factor Abbr. Units Type Settings Transformation Precision
Temperature temp °C Quantitative 45.94 to 53.88 None 0.199
Caustic Strength cau % Quantitative 2.28 to 3.17 None 0.0223
Current density cur Am-2 Quantitative 781.3 to 797.1 10log(C1*Y + C2) 0.393
Where Y is the value of the current density and C1 and C2
are constants. The statistically non-significant term in the
regression coefficient plot (Fig.2) is transformed. Thus the
model was refined and simplified.The precision in table 5
tellshow close the measured values are measured reliably.
The summary of fit plot of the refined model is presented in
figure 7.It can be seen from figure 7 that the Q2 value has
increased, and now amount to 0.556. The model show
improved model validity of 0.7 as compared to the previous
value of 0.4 in figure 1.
Figure 7: Summary of fit plot of refined model
Paper ID: ART20174961 DOI: 10.21275/ART20174961 484

International Journal of Science and Research (IJSR) ISSN (Online): 2319-7064
Index Copernicus Value (2015): 78.96 | Impact Factor (2015): 6.391
Volume 6 Issue 7, July 2017
www.ijsr.net Licensed Under Creative Commons Attribution CC BY
The outcome of the normal probability plot of the residuals
after refinement is shown in figure 8 and reveals that the
model looks satisfactory as there were no outliers as seen
earlier in figure 3.
Figure 8: Normal probability plot of residuals after model refinement
The regression coefficient of the refined model was made in
order to obtain information concerning how the input
variables affect the response as shown in figure 9. The plot
shows that temperature and caustic strength have a strong
effect on the response.
Figure 9: Regression coefficient plot for recovery of Au after model refinement
In addition the analysis of variance (ANOVA) of the refined
model shown in table 6 reveals that the regression model is
statistically significant with a 95% confidence level. The P-
value for the regression is smaller than 0.05.
Table 6: Analysis of variance (ANOVA) for the quadratic m
odel for the response variable (refined model) Electro-
winning
efficiency
DF SS MS
(variance)
F P SD
Total 17 123664 7274.37
Constant 1 123598 123598
Total
corrected
16 66.2722 4.14201 2.03519
Regression 9 63.0487 7.00541 15.2125 0.001 2.64677
Residual 7 3.22353 0.460505 0.678605
Lack of fit 5 2.66173 0.532346 1.89513 0.380 0.3000272962
Pure error 2 0.561805 0.280903 0.5
Paper ID: ART20174961 DOI: 10.21275/ART20174961 485

International Journal of Science and Research (IJSR) ISSN (Online): 2319-7064
Index Copernicus Value (2015): 78.96 | Impact Factor (2015): 6.391
Volume 6 Issue 7, July 2017
www.ijsr.net Licensed Under Creative Commons Attribution CC BY
From the ANOVA table 6, itcan be deduced that the lack of
fit (model error) is of the samemagnitude as the replicate
error for the response,because their P-values are greater than
0.05 at 95% confidence level. Therefore, the model has
small error and good fitting power, meaning thatthe model
shows no lack of fit.
Figure 10 shows that the observed response correlated well
with the predicted values. Therefore, the model is considered
as good and can be used for the predictions and optimization
of the process.
Figure 10: Relationship between observed and predicted values for response after model refinement
The regression model describing the relation of the response
and the parameters investigatedafter transformation of the
current density is given in table 7. The refined fitted model
is given as
y = 85.384 – 0.713x1– 1.9x2 – 0.190x3 – 0.3402
1x – 0.335
2
2x + 0.4752
3x – 0.117 1 2x x –
0.587 1 3x x – 1.485 2 3x x (4)
Table 7: Theestimated parameters of the refined model Electrowinning
efficiency
Coeff. SC Std. Err. P Conf.int(±)
Constant 85.3841 0.290375 1.38913e-015 0.686637
Temperature -0.712998 0.214594 0.0127205 0.50744
Caustic strength -1.9 0.214594 4.74415e-005 0.50744
Current density -0.190003 0.214594 0.405323 0.50744
temp*temp -0.339661 0.414582 0.439623 0.980344
cau*cau -0.334635 0.414582 0.446128 0.980344
cur*cur 0.475345 0.414582 0.289239 0.980344
temp*cau -0.117496 0.239923 0.639302 0.567335
temp*cur -0.587497 0.239923 0.0441922 0.567335
cau*cur -1.485 0.239923 0.00044984 0.567335
The model equation (4) can be used with a good reliability
to evaluate the main effects of the three independent factors
on the response as well as inter-relation of both factors and
response. A normalized coefficient of the refined model is
shown in figure 11 is used to interpret the importance of the
factors and their interactions on the response.
Figure 11: Normalized coefficients for the response
Paper ID: ART20174961 DOI: 10.21275/ART20174961 486
International Journal of Science and Research (IJSR) ISSN (Online): 2319-7064
Index Copernicus Value (2015): 78.96 | Impact Factor (2015): 6.391
Volume 6 Issue 7, July 2017
www.ijsr.net Licensed Under Creative Commons Attribution CC BY
The effects of the factors areagain confirmed in figure 11.
The cur*cur quadratic term shows a positive effect whiles
the remaining quadratic terms shows negative effects. The
interaction termsalso shows negative effect on
electrowinning. The presence of squares and interaction
terms in the regression equation confirms a quadratic
behavior and non-linear combining effects of the factors.
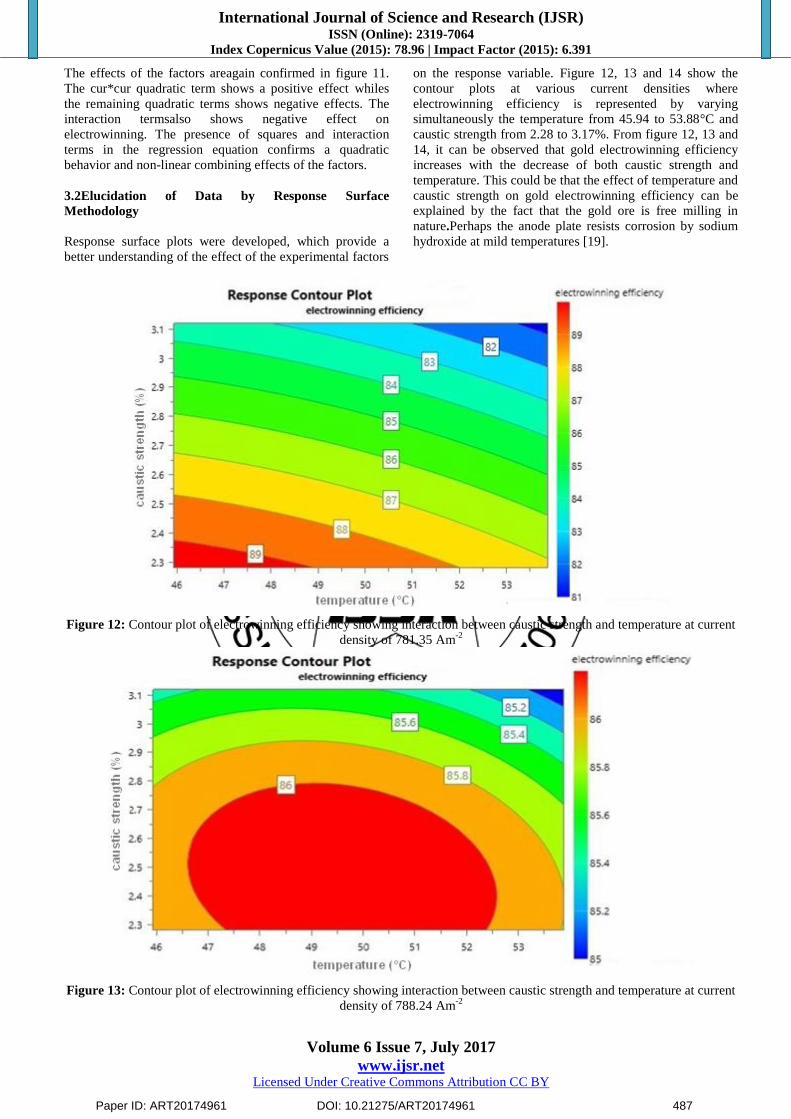
3.2Elucidation of Data by Response Surface
Methodology
Response surface plots were developed, which provide a
better understanding of the effect of the experimental factors
on the response variable. Figure 12, 13 and 14 show the
contour plots at various current densities where
electrowinning efficiency is represented by varying
simultaneously the temperature from 45.94 to 53.88°C and
caustic strength from 2.28 to 3.17%. From figure 12, 13 and
14, it can be observed that gold electrowinning efficiency
increases with the decrease of both caustic strength and
temperature. This could be that the effect of temperature and
caustic strength on gold electrowinning efficiency can be
explained by the fact that the gold ore is free milling in
nature.Perhaps the anode plate resists corrosion by sodium
hydroxide at mild temperatures [19].
Figure 12: Contour plot of electrowinning efficiency showing interaction between caustic strength and temperature at current
density of 781.35 Am-2
Figure 13: Contour plot of electrowinning efficiency showing interaction between caustic strength and temperature at current
density of 788.24 Am-2
Paper ID: ART20174961 DOI: 10.21275/ART20174961 487

International Journal of Science and Research (IJSR) ISSN (Online): 2319-7064
Index Copernicus Value (2015): 78.96 | Impact Factor (2015): 6.391
Volume 6 Issue 7, July 2017
www.ijsr.net Licensed Under Creative Commons Attribution CC BY
Figure 14: Contour plot of electrowinning efficiency showing interaction between caustic strength and temperature at current
density of 797.06 Am-2
Also, gold electrowinning efficiency increases up to a
limiting amount with high current density as shown in figure
12, 13 and 14 respectively. This could be that current is
consumed by other side reactions such as the evolution of
hydrogen and the deposition of other metals such as copper,
and does not contribute to further gold deposition. Similar
trend was observed by Costello (2005) in electrowinning of
gold ore[20].The corners in the left bottom of the above
graphs represent a minimum amount of the caustic strength
and temperature.
3.3 Model Validation
In order to test the validity of the model with respects to the
response variable of gold electrowinning efficiency, a
separate simulationtest was performed at the conditions
predicted by the model, as shown in table 8. The results of
table 8 indicate a close agreement with the values predicted
by the model. Therefore, the model from a response surface
methodology is considered to be exact and consistent, for
predicting the electrowinning efficiency of gold from
solution.
Table 8: Output of optimized parameter Temperature
(°C)
Caustic
strength
(%)
Current
density
(Am-2)
Electrowinning
efficiency
(%)
Iterations Log (D) DPMO Cpk
(electrowinning
efficiency)
46.734 2.369 784.492 86.917 0 -4.1062 5600 0.979366
46.999 2.458 786.324 86.953 11 -4.5945 2700 1.13777
48.322 2.399 782.921 86.648 7 -2.8537 2400 1.12238
53.317 2.311 786.649 85.773 22 -1.7693 2000 1.17786
47.131 2.636 796.275 87.198 8 -2.3590 10900 0.836248
46.999 2.769 796.798 86.459 7 -2.4810 5100 0.962633
53.086 2.369 792.347 86.623 0 -2.7935 4400 1.06795
53.579 2.431 796.958 86.826 19 -3.4645 11000 0.805516
49.910 2.725 792.347 85.887 0 -1.8545 0 1.79263
46.734 2.280 784.492 86.997 0 -6.9419 12700 0.808779
46.734 2.725 792.347 86.433 0 -2.4394 2000 1.24856
49.910 2.725 797.060 86.328 0 -2.2924 5400 0.966049
3.4 Process Optimization
Optimization of the factors affecting the electrowinning
process can be carried out depending on the outcome from
the process. For high electrowinning efficiency of gold, the
option is for minimum caustic strength and temperature as
displayed in figure 12, 13 and 14.Conversely, for practical
and economic reasons, low production cost due toreagent
cost and less elution problems due to low caustic strength
are required. An agreement must be made among these
factors in order to have desirable electrowinning conditions.
Literature available indicates that the elution of all metal
cyanide species could be improved by adding less hydroxide
to the pre-treatment.However, too much caustic strength
would result in elution of base metals from the carbon,
which will consequently lower the electrowinning efficiency
Paper ID: ART20174961 DOI: 10.21275/ART20174961 488

International Journal of Science and Research (IJSR) ISSN (Online): 2319-7064
Index Copernicus Value (2015): 78.96 | Impact Factor (2015): 6.391
Volume 6 Issue 7, July 2017
www.ijsr.net Licensed Under Creative Commons Attribution CC BY
and fineness of the gold bullion [1].Therefore, a level
conditionmust be found based on the mineralogy of the ore,
solventand also energyrequirement so as not to create
problems during onward processing.
The three factors considered for the study affect the
economics of the process in various ways.For high current
density,the electric field increases implying that it increases
the gold deposition on the surface of the cathode.
Temperature influences many parameters in solutions such
as dissolved oxygen, activity coefficients, oxidation rates
and corrosion. For temperature above 45 to 50°Cthe effect
of the ions decline dramaticallyand thereby enhance gold
deposition. In practice, caustic is added to the pre-treatment,
but mainly to stabilize the cyanide and to improve
conductivity to enhance cell performance. Therefore, the
desirable condition for gold electrowinning are caustic
strength of 2.28 - 2.43%, current density of 784.50– 797.00
Am-2
and temperature of 46.70 – 49.50°C to obtain an
electrowinning efficiency of about 86.9% (close to the target
value of 87%). The merit of lesser base metals is the higher
fineness of the gold bullion and hencereduction of the
refining costs. This is due to the relationship between the
fineness and the refining costs. Another potential means of
reducingthe base metals would be to add cyanide and caustic
after the elution.This will allow to increase the cyanide
strength and run the electrowinning at the recommended
condition.This could be interesting to explore in the future.
4. Conclusions
Gold electrowinning is relatively a simple process.
However, using a proper analytical method to accurately
evaluate the outcome of the process is a much challenging
step. The use of mathematical modelling in optimization of
the process has been ascertained.From the experiment run on
the plant scale, three findings could be highlighted.
1) Optimization of influential factors in gold electrowinning
is conducted using response surface methodology-central
composite face-centered design (RSM-CCF).
2) The three factors considered affect the electrowinning
process in various ways. The caustic strength was found
to have the most influential effect with current density
being less significant on electrowinning efficiency.
Temperature along with the other two factors had a
negative effect on electrowinning efficiency.
3) A strong mathematical model with no lack of fit was
developed and the validity of the model evaluated
experimentally. The result shows that the model is
reliable and accurate for predicting the electrowinning
efficiency.
5. Acknowledgement
The researcher would like to appreciate the management of
Goldfields Ghana Limitedthe mine where data was obtained
for the study.
References
[1] Lunga, A.L. (2006), Optimizing the Operating
Conditions of Gold Elution and Electrowinning for Tau
Lekoa Stream at Kopanang Gold Plant, Msc Thesis
Dissertation, University of Witwatersrand,
Johannesburg, 19-36.
[2] Paul, R.L., Filmer, A.O. and Nicol, M.J. (1983), The
Recovery of Gold from Concentrated
AurocyanideSolutions, 689-704 in Proceedings of 3rd
International Symposium on Hydrometallurgy:
Hydrometallurgy Research, Development and Plant
Practice, Edited by K. Osseo-Asare and J.D. Miller,
Warrendale PA: TMS.
[3] Steyn, J. and Sandenbergh, R.F. (1984), A Study of the
Influence of Copper on the Gold Electrowinning
Process, B.Eng Thesis Dissertation, University of
Pretoria, The South African Institute Mining and
Metallurgy, 177-182.
[4] Jianming L., Huajun, G., Dreisinger, D. and Downing,
B. (2013), Effects of Current Density and Nickel as an
Impurity on Zinc Electrowinning, Journal of
Metallurgical Engineering (ME) Vol. 2, Issue 3, 79-87.
[5] Kirk, D.W. and Foulkes, F.R. (1984), A Potentiometric
Study of Metals Affecting Precious Metal Recovery
from Alkaline Cyanide Solutions, Journal of the
Electrochemical Society: Electrochemical Science and
Technology (April):760-769.
[6] (), Experiment Design and Analysis Reference,
ReliaSoft Corporation, Worldwide Headquarters, 1450
South Eastside Loop, Tucson, Arizona 85710-6703,
USA, 184-209
[7] Coman, G. and Bahrim, G. (2011), Optimization of
XylanaseProduction by Streptomyces Species of
aBenzene-Toluene Mixture by Hydrocarbon–Adapted
Bacterial Communities, Ann. Microbial, 12.
[8] Dean, A. and Voss, D. (1999), Design and Analysis of
Experiment, Springer-Verlag New York, Inc, Fifth
Avenue, New York (NY), 103-126
[9] Abalos, A., Maximo, F., Manresa, M.A. and Bastida, J.
(2002), Utilization of Response Surface Methodology to
Optimize the Culture Media for the Production of
Rhamnolipids by Pseudomonas aeruginosa AT 10,
Journal of Chemical Technology and Biotechnology
77:777-784.
[10] Montgomery, D.C. (2005) Design and Analysis of
Experiments: Response Surface Method and Designs,
6th
Edition, New York: John Wiley and Sons. Inc., 1-44.
[11] Zhang, Z., Peng, J. and Srinivasakannan, C.(2010),
Leaching Zinc from Spent Catalyst: Process
Optimization using Response Surface Methodology,
Journal of Hazardous Materials, 176:1113-1117
[12] Awe, S.A., Khoshkhoo, M., Kruger, P. and Sandström,
A. (2012), Modelling and Process Optimization of
Antimony Removal from a Complex Copper
Concentrate, Trans. Nonferrous Met. Soc. China, 22,
675-685.
[13] Mehrabani, J.V., Noaparast, M., Mousavi, M., Dehghan,
R. and Ghorbani, A. (2010), Process Optimization and
Modelling of Sphalerite Flotation from a Low-Grade
Zn-Pb Ore using Response Surface Methodology,
Separation and Purification Technology, 72:242-249.
[14] García, V., Landaburu-Aguirre, J., Pongrácz, E.,
Perämäki, P. and Keiski, R.L. (2009), Dehydration of
Water/Dichloromethane/n-butanol Mixtures by
Pervaporation; Optimization and Modelling by
Paper ID: ART20174961 DOI: 10.21275/ART20174961 489
International Journal of Science and Research (IJSR) ISSN (Online): 2319-7064
Index Copernicus Value (2015): 78.96 | Impact Factor (2015): 6.391
Volume 6 Issue 7, July 2017
www.ijsr.net Licensed Under Creative Commons Attribution CC BY
Response Surface Methodology, Journal of Membrane
Science, 338:111-118
[15] Awe, S.A., Samuelsson, C. and Sandström, Å. (2010),
Dissolution Kinetics of Tetrahedrite Mineral in Alkaline
Sulphide Media, Hydrometallurgy, 103:167-172.
[16] Awe, S.A. and Sandström, Å. (2010), Leaching
Mechanism of Tetrahedrite in Alkaline Sulfide Solution,
Conference in Minerals Engineering, Lulea, Sweden,
13-24
[17] Awe, S.A. and Sandström, Å. (2011), Upgrading of an
Impure Copper Concentrate for Pyrometallurgical
Processing, Proceedings of European Metallurgical
Conference, Dusseldorf, Germany, 15-31.
[18] Eriksson, L., Johansson, E.,Kettaneh-wold, N.,
WiKström, C. and Wold, S. (2008), Design of
Experiments-Principles and Applications, Umetrics AB,
Umea, 145-167
[19] Craig, B.D. and Anderson, D.S. (1995), Handbook of
Corrosion Data, Second Edition, Materials Park: ASM
International.
[20] Costello, M. (2005), Electrowinning: Advances in Gold
Ore Processing, Developments in Mineral Processing,
15.
Paper ID: ART20174961 DOI: 10.21275/ART20174961 490