Optimization of electronic protection testing for the F/A ...
72
University of Tennessee, Knoxville University of Tennessee, Knoxville TRACE: Tennessee Research and Creative TRACE: Tennessee Research and Creative Exchange Exchange Masters Theses Graduate School 12-2003 Optimization of electronic protection testing for the F/A-18 active Optimization of electronic protection testing for the F/A-18 active guidance air-to-air weapon system guidance air-to-air weapon system Cassidy Clayton Norman Follow this and additional works at: https://trace.tennessee.edu/utk_gradthes Recommended Citation Recommended Citation Norman, Cassidy Clayton, "Optimization of electronic protection testing for the F/A-18 active guidance air- to-air weapon system. " Master's Thesis, University of Tennessee, 2003. https://trace.tennessee.edu/utk_gradthes/5272 This Thesis is brought to you for free and open access by the Graduate School at TRACE: Tennessee Research and Creative Exchange. It has been accepted for inclusion in Masters Theses by an authorized administrator of TRACE: Tennessee Research and Creative Exchange. For more information, please contact [email protected].
Transcript of Optimization of electronic protection testing for the F/A ...

University of Tennessee, Knoxville University of Tennessee, Knoxville
TRACE: Tennessee Research and Creative TRACE: Tennessee Research and Creative
Exchange Exchange
Masters Theses Graduate School
12-2003
Optimization of electronic protection testing for the F/A-18 active Optimization of electronic protection testing for the F/A-18 active
guidance air-to-air weapon system guidance air-to-air weapon system
Cassidy Clayton Norman
Follow this and additional works at: https://trace.tennessee.edu/utk_gradthes
Recommended Citation Recommended Citation Norman, Cassidy Clayton, "Optimization of electronic protection testing for the F/A-18 active guidance air-to-air weapon system. " Master's Thesis, University of Tennessee, 2003. https://trace.tennessee.edu/utk_gradthes/5272
This Thesis is brought to you for free and open access by the Graduate School at TRACE: Tennessee Research and Creative Exchange. It has been accepted for inclusion in Masters Theses by an authorized administrator of TRACE: Tennessee Research and Creative Exchange. For more information, please contact [email protected].

To the Graduate Council:
I am submitting herewith a thesis written by Cassidy Clayton Norman entitled "Optimization of
electronic protection testing for the F/A-18 active guidance air-to-air weapon system." I have
examined the final electronic copy of this thesis for form and content and recommend that it be
accepted in partial fulfillment of the requirements for the degree of Master of Science, with a
major in Aviation Systems.
Ralph Kimberlin, Major Professor
We have read this thesis and recommend its acceptance:
Accepted for the Council:
Carolyn R. Hodges
Vice Provost and Dean of the Graduate School
(Original signatures are on file with official student records.)

To the Graduate Council: I am submitting herewith a thesis written by Cassidy Clayton Norman entitled "Optimization of Electronic Protection Testing for the Fl A-18 Active Guidance Air-toAir Weapon System." I have examined the final paper copy of this thesis for form and content and recommend that it be accepted in partial fulfillment of the requirements for the degree of Master of Science, with a major in Aviation Systems.
We have read this thesis and recommend its acceptance:
Frank Collins \
?� K¾cJv-<
Richard Ranaudo
�, & -� Ralpli Kimb�rlin, Major Professor
Acceptance for the Council:
Anne Mayhew, Vice ovost Dean of Graduate Studies

,,--:--
/ ' l, ,' -

OPTIMIZATION OF ELECTRONIC PROTECTION TESTING FOR THE F/A-18 ACTIVE GUIDANCE
AIR-TO-AIR WEAPON SYSTEM
A Thesis Presented for the Master of Science Degree
The University of Tennessee, Knoxville
Cassidy Clayton Norman
December 2003

ACKNOWLEDGEMENTS
First and Foremost, I thank my wife Michelle for her continuous support of my academic efforts. She unselfishly allowed me to spend many nights and weekends working towards my Master of Science degree in Aviation Systems. Without her patience -especially during the months of developing this thesis combined with working overtime on special projects associated with Operation Iraqi Freedom - I would not have been able to finish the degree program before returning to the Fleet.
A thesis on the topic of AMRAAM would not have been possible without the support and direct assistance of the Navy AMRAAM Test Team at NA VAIR Weapons Division in Point Mugu. Mr. Brad George, AMRAAM Integrated Project Team Lead, described the current management and budget of the Weapon Systems Evaluation program and generally supported my research effort. Mr. Tom Kelch and Mr. Don Zeleny helped me define the problem academically. Mr. Eric Christensen helped keep my thesis as realistic and useful as possible. Not only did he answer my incessant - and occasionally repeated - questions, but he also wrote a paper comprehensively explaining technical, programmatic, and organizational aspects of the Weapon Systems Evaluation program. Without the skill of decoding flight data by Larry Nevius and analysis by Norbert Metternich, I would not have been able to include nearly as much data in my evaluation. Mr. Tom Schell helped me to acquire digital photographs of the laboratories. Additionally, Jody Villanueva helped me to gather a history of electronic warfare and Mr. Dan Radke helped me ensure that I met all security requirements.
At the Advanced Weapons Laboratory (AWL) in China Lake, Mr. Henry Ottenhoff and Dr. William "Doc" Shoemaker helped me by supplying information on the AIM-9X and APG-79 radar system, respectively. The help of Mr. John Garrett in understanding the AWL' s Radar Laboratory and its usefulness for EP testing proved to be crucial to my research.
AMRAAM testing was my first choice of thesis topics. Thanks to all of the Navy AMRAAM Test Team and the AWL Radar Test Team for supporting my research efforts, allowin·g me to complete a thesis that I hope will contribute to the Navy's weapons testing programs.
ii
ABSTRACT The AIM-120A Advanced Medium Range Air-to-Air Missile (AMRAAM) is the premier air-to-air missile in the US arsenal. Although designed to counter threats that employ analog-based Electronic Attack (EA), the new threat of digital-based EA, Digital Radio Frequency Memory (DRFM), places a high priority on the capability to evaluate AMRAAM' s Electronic Protection (EP), which is defined as the capability to counter EA. AMRAAM effectiveness is not only dependent on its own capability to counter EA, but also on the ability of the fighter aircraft radar to counter the same EA while supporting the AMRAAM ( via data links) during the AMRAAM' s intercept profile.
In the US Navy, the AMRAAM is carried by the F/A-18. EP testing of the two versions of F/A-18 radar has been limited due to funding constraints and other higher priority testing of the various capabilities associated with the air-to-air and air-to-ground Fl A-18 mission requirements. In 1996, the US Navy funded the Weapon System Evaluation program, which includes EP testing of the F/A-18 and AMRAAM weapon system. Current test methods involve captive carriage of the AMRAAM against full-scale targets employing specific EA techniques. Radar data links to the missile are recorded in flight and replayed in the Hard-Ware In The Loop (HWIL) simulator to test missile performance during simulated missile intercept of the same EA threat. Twenty simulations are executed in the HWIL for each test flight to calculate missile probability of guidance (Po). For each HWIL simulation, 50 lethality simulations are executed to calculate probability of weapon effectiveness (PWE), Final products of the test program are a table illustrating Po and a bar chart illustrating PWE against several specific EA threats, including in both cases performance of the missile with perfect aircraft radar support to isolate missile performance. Neither the table nor the chart includes uncertainty associated with the calculated probabilities.
A closer look at the test methods revealed that only a few tests of aircraft radar are used to characterize aircraft radar performance versus the EA threat while thousands of simulations are used to characterize AMRAAM performance. For the average number of test runs of each radar mode, the uncertainty associated with the aircraft radar performance calculation was found to be± 43.6% while the uncertainty associated with AMRAAM performance calculation was found to be± 1.39% (using 95% confidence interval). The combined uncertainty is± 44.4%, which spans a wide range of performance for any calculation of Po or PWE. The large uncertainty does not offer a solid foundation on which to base fighter tactics. Three methods of increasing the number of radar performance data were investigated for the purpose of decreasing the uncertainty associated with EP testing. First, synthetic data link file generation was determined to be ineffective because the data link error files were not stationary or ergotic, signal characteristics that are required for accurate generation of data link files. Second, time shift expansion, which involves generation of additional data link files (more radar performance data) from the recorded aircraft radar track files, was found to have some potential to reduce uncertainty. More evaluation would be necessary to quantify effectiveness. However, the effectiveness of time shift expansion would be limited at best because it does not add to the general characterization of aircraft radar performance against EA (no new radar performance runs, only more data from existing runs). Third, the NA VAIR Weapons Division China Lake F/A-18 radar laboratory was
iii

researched as a method for generating more radar simulations against EA to more fully characterize radar performance.
Utilization of the radar laboratory was determined to be by far the best technique for optimizing weapons system testing. The higher cost associated with more independent aircraft radar runs would reduce the number of test flights per year by one ( due to the fixed budget), but the dramatic reduction in uncertainty (from± 44.4% to± 20.5%) would be well worth the cost. Calculating PWE against four types of EA within 20.5% is much more valuable than calculating PWE for five types within 44.4%.
The AMRAAM will remain in the US arsenal for many more years, and will face many new threats. The AMRAAM Integrated Project Team should pursue incorporation of the radar laboratory simulations into the EP testing process to significantly improve the accuracy associated with evaluation of weapon system performance. Additionally, NA VAIR should work towards long-term co-development of coupled systems such as the F/ A-18 radar and the AMRAAM to save money and to increase overall performance by allowing optimization of the weapon system through coherent development of system components.
iv

PREFACE
This paper discusses various methods of evaluating the performance of one weapon system: the F/ A-18 and Advanced Medium Range Air-to-Air Missile (AMRAAM). Specific test results for this weapon system are classified. However, this paper discusses programmatic methods of testing at an unclassified level. Actual performance of the weapon system and specific threats against which the weapon system has been tested are intentionally not included. All sets of data in this paper have been altered through irreversible processes. Values of each set of data were uniquely normalized to a maximum of 1 or minimum of -1. However, characteristics of the processes have been preserved for analysis through relative signal comparison.
Opinions expressed in this paper represent the perspectives of Lieutenant Cassidy Norman after serving as AMRAAM Project Officer for over two years. These opinions do not necessarily reflect the views of VX-30, the AMRAAM Integrated Project Team, Naval Test Wing Pacific, NA VAIR Weapons Division, the US Navy, or the US Department of Defense.
V

TABLE OF CONTENTS
IN"TRODUCTION ............................................................................................................... 1 1. BACKGROUND ............................................................................................................ 5
HISTORY OF FLIGHT TESTIN"G ............................................................................ 5 Air-to-Air Missile Testing ....................................................................................... 6 F/A-18 Radar Testing History ................................................................................. 7 AMRAAM Testing History ..................................................................................... 7 Weapons System Testing History ........................................................................... 8 Test Goal: Probability of Guidance and Probability of Weapon Effectiveness ...... 8 Test Assets ............................................................................................................. 10
AMRAAM Captive Equipment (ACE) ............................................................. 10 Integration Test Vehicle (ITV) ........................................... ............................... 10 Hard-Ware In the Loop (HWIL) Simulation ..................................................... 12 Digital Simulation .............................................................................................. 12
Weapons System Evaluation (WSE) Funding ....................................................... 13 2. ELECTRONIC PROTECTION TEST METHODS ..................................................... 14
EVALUATION OF TEST METHODOLOGY ........................................................ 15 STATISTICAL ANALYSIS OF THE EP TESTIN"G PROCESS ............................ 17 IN"VESTIGA TION OF RADAR DAT A LIN"KS AS STOCHASTIC SIGNALS .... 19
Probability Density Function ................................................................................. 20 Determination of Stationarity ................................................................................ 20 Determination of Ergodicity .................................................................................. 20
3. TEST METHOD OPTIMIZATION TECHNIQUES ................................................... 24 SYNTHETIC DATA LINK FILE GENERATION ................................................. 24 TIME SHIFT EXPANSION OF RADAR TRACK FILES ...................................... 24 EMPLOYMENT OF RADAR LABORATORY ..................................................... 27
Radar Laboratory Description ............................................................................... 27 EP Testing in Radar Laboratory ............................................................................ 28 Radar Laboratory Costs ......................................................................................... 29 Determination of Optimal Number of Radar Data Sets ........................................ 30
CONCLUSIONS ................................................................................................................ 32 RECOMMEND A TIO NS ................................................................................................... 33 REFERENCES .................................................................................................................. 34 APPENDICES ................................................................................................................... 37 VITA .................................................................................................................................. 58
Vl

LIST OF TABLES
Table 1: Missile Program Asset Allocations ...................................................................... 6 Table 2: Electronic Testing Performance Metric ................................................................ 8 Table 3: Format of Final Product Illustrating Probability of Guidance .............................. 9
Table 4: Cost versus Quality for AMRAAM EP Testing ................................................. 15 Table 5: Radar Performance Categories ........................................................................... 17 Table 6: Uncertainty of PR Based on Five Flight Test Runs ............................................. 18 Table 7: Uncertainty of PM Based on 5,000 Missile Simulations ..................................... 19 Table 8: Ensemble Averages for STT Range Errors ........................................................ 23 Table 9: Cost of HWIL Operations as Data Sets Increase ............................................... .30 Table 10: Proposed WSE Budget Shift.. ........................................................................... 31 Table 11: Uncertainties in Optimized Test Process .......................................................... 31 Table 12: Comparison of Optimization Techniques ......................................................... 32 Table C-1: Ensemble Averages for STT Range Rate Errors ............................................ 51 Table C-2: Ensemble Averages for TWS Range Errors ................................................... 51 Table C-3: Ensemble Averages for TWS Range Rate Errors ........................................... 51
vii

LIST OF FIGURES
Figure 1: AMRAAM Profile ............................................................................................... 1 Figure 2: Illustration of AMRAAM Employment in EA Environment.. ............................ 3 Figure 3: Format of Final Product Illustrating Probability of Weapon Effectiveness ...... 10 Figure 4: ACE Pod Used for Captive AMRAAM Testing ............................................... 11 Figure 5: ITV Pod Used for Captive AMRAAM Testing ................................................ 11 Figure 6: AMRAAM HWIL Facility ................................................................................ 12 Figure 7: EP Test Budget for FY 2003 ............................................................................. 13 Figure 8: EP Testing Flow for Each EA ........................................................................... 17 Figure 9: Flight 1 STT Range Errors ................................................................................ 21 Figure 10: Flight 1 STT Range Rate Errors ...................................................................... 21 Figure 11: STT Mean Range Error ..................................... � ............................................. 22 Figure 12: STT Range Error Standard Deviation ............................................................. 22 Figure 13: Illustration of Time Shift Expansion Method .................................................. 25 Figure 14: Flight 4 Track File and Data Link STT Range Errors during Run 12 ............. 26 Figure 15: Flight 4 Track File and Data Link STT Range Rate Errors during Run 12 .... 26 Figure 16: Radar Laboratory Configuration ..................................................................... 28 Figure 17: Radar Laboratory Components ....................................................................... 29 Figure A-1: Flight 1 TWS Range Errors ........................................................................... 39 Figure A-2: Flight 1 TWS Range Rate Errors .................................................................. 39 Figure A-3: Flight 2 STT Range Errors ............................................................................ 40 Figure A-4: Flight 2 TWS Range Errors .......................................................................... .40 Figure A-5: Flight 2 STT Range Rate Errors ................................................................... .41 Figure A-6: Flight 2 TWS Range Rate Errors .................................................................. 41 Figure A-7: Flight 3 STT Range Errors ........................................................................... .42 Figure A-8: Flight 3 TWS Range Errors .......................................................................... .42 Figure A-9: Flight 3 STT Range Rate Errors ................................................................... .43 Figure A-10: Flight 3 TWS Range Rate Errors ............................................................... .43 Figure A-11: Flight 4 STT Range Errors ......................................................................... .44 Figure A-12: Flight 4 TWS Range Errors ......................................................................... 44 Figure A-13: Flight 4 STT Range Rate Errors .................................................................. 45 Figure A-14: Flight 4 TWS Range Rate Errors ............................................................... .45
Vlll

LIST OF FIGURES (continued)
Figure B-1: TWS Mean Range Errors ........................................ ..................................... .4 7 Figure B-2: STT Mean Range Rate Errors ............................................ ... . ...................... .47 Figure B-3: TWS Mean Range Rate Errors ....................... ................. ....................... ...... .48 Figure B-4: TWS Range Error Standard Deviation .............. . ........... ............................... .48 Figure B-5: STT Range Rate Error Standard Deviation ..... . . . . . ............. . .. . .............. . .. . . . . .. .49 Figure B-6: TWS Range Rate Error Standard Deviation ......... ......................................... 49 Figure D-1: Run 4 Range Errors ....... .................... ...................... ...................................... 53 Figure D-2: Run 4 Range Rate Errors ................... .............................. . . .. . ......................... 53 Figure D-3: Run 6 Range Errors ............................................... ........................................ 54 Figure D-4: Run 6 Range Rate Errors ................... ............................. ....... . . . ..................... 54 Figure D-5: Run 8 Range Errors ............................ ..................... ....... ............... ............ .... 55 Figure D-6: Run 8 Range Rate Errors ................... ................................... . . ....................... 55 Figure D-7: Run 10 Range Errors ............. .................... ............. ............ ........................... 56 Figure D-8: Run 10 Range Rate Errors ............................. .............. ....... .......... .......... ....... 56 Figure D-9: Run 14 Range Errors ........... ............... . ............................ ................. ............. 57 Figure D-10: Run 14 Range Rate Errors ................................................... .. ...................... 57
ix

ACE AESA AIM AMRAAM ARS AWG css
DOF DRFM EA ECM EP EW FY GPS HWIL IR ITV NAVAIR OFP pdf Pa
PM
PR
PWE RF STT T&E TEAM SIM TSPI TWS USAF USN WSE
LIST OF ACRONYMS
AMRAAM Captive Equipment Active Electronically Scanning Array Airborne Interceptor Missile Advanced Medium Range Air-to-Air Missile AMRAAM Raytheon Simulation Aircraft Waveform Generator Complex Seeker Simulator Degrees of Freedom Digital Radio Frequency Memory Electronic Attack Electronic Counter Measures Electronic Protection Electronic Warf are Fiscal Year Global Positioning System Hard-Ware In The Loop Infra-Red Integration Test Vehicle Naval Air Systems Command Operation Flight Program Probability Density Function Probability of Guidance Probability of Missile Effectiveness Probability of Radar Effectiveness Probability of Weapon Effectiveness Radio Frequency Single Target Track Test and Evaluation Raytheon's Team Simulator Time Space Position Information Track While Scan United States Air Force United States Navy Weapon System Evaluation
X

INTRODUCTION
Air-to-air missile technology in the US Armed Services has become increasingly more complex and capable since the first AIM-9 Sidewinder was fielded in 1956. The Sidewinder successfully incorporated Infra-Red (IR) homing capability for missile guidance. Two decades later, the US military had two additional air-to-air missiles in its inventory representing two new technologies and a significantly increased engagement range: the AIM-7 Sparrow and the AIM-54 Phoenix. The Sparrow is a medium-range missile with semi-active radar guidance. The Phoenix is a long-range missile that incorporates active radar guidance. The latest air-to-air missile is the AIM-120 Advanced Medium Range Air-to-Air Missile (AMRAAM), an aerial intercept missile fielded just after the Operation Desert Storm that provides "autonomous launch and leave capability against single and multiple targets in all environments1
." The AMRAAM, illustrated in figure 1, is an active radar guidance missile designed as "a follow-on to the AIM-7 Sparrow" that is "faster, smaller and lighter, and has improved capabilities against low-altitude targets2
."
Today the AMRAAM, carried by the F-15, F-16, and F/A-18, is the cornerstone of the US air superiority. It is the only active radar missile currently carried by these aircraft.
ANTENNA BATTERIES
INERTIAL REFERENCE UNIT
TARGET DETECTION DEVICE
TRANSMITTER ELECTRONICS ARMAMENT ROCKET MOTOR
Figure 1: AMRAAM Profile
1
CONTROL ACTUATOR
DATA LINK RECEIVER

Two newer fighter aircraft not yet fielded, the F-22 and Joint Strike Fighter, were designed to carry the AMRAAM as a primary air-to-air weapon. The internal weapons bays of these two aircraft were specifically sized to carry multiple AMRAAMs.
Fighter aircraft that carry AMRAAM during combat operations use air-to-air radars to detect and identify airborne threats including aircraft and cruise missiles 1 • Once the predetermined rules of engagement have been satisfied and the fighter aircraft are within range, the AMRAAM can be fired at the target. When launched, the AMRAAM quickly accelerates to supersonic speeds and guides towards the target using proportional navigation based on target data transmitted from the fighter aircraft radar1 . In the terminal phase of the intercept, the AMRAAM activates its own radar system and tracks the target to intercept, allowing the fighter to maneuver as desired without having to maintain a radar track on the target 1 .
Just as flares were developed in the 1960's to counter the threat of Sidewinders, Electronic Warfare (EW) has evolved to counter the threat of semi-active and active radar missiles. In addition to passive protection (such as chaff), defense against radar missiles now includes active Electronic Attack (EA), also referred to as 'jamming' or Electronic Counter Measures (ECM). "EA is the intentional radiation or re-radiation of Radio Frequency (RF) signals to interfere with the operation of a radar by saturating its receiver with false targets or false target information3
." "Initial jamming responses included onboard self-protection pulse repeater, noise jamming, and missile-guidance-link jamming," all designed to attack radar guidance and missile endgame performance4. "The onboard jammin� degraded the missile-guidance and lock-on capability by creating angle and range errors . "
Deceptive signals, even when as simple as noise jamming, can create a complex RF environment. Figure 2 is a simplistic diagram of AMRAAM employment against a jamming threat. Even before the AMRAAM is fired, the F/A-18 radar may meet the threshold of the jammer, which will stimulate EA designed to deceive not only the F/A-18 radar, but also the radar of the AMRAAM. An EA threat can deny shot potential by destroying the quality of the F/A-18 radar track before the AMRAAM is fired. After an AMRAAM has been fired, an EA threat can cause the AMRAAM to miss by corrupting the F/A-18 radar track resulting in the F/A-18 sending bad data links to the AMRAAM or by denying/corrupting the AMRAAM' s track file during the terminal phase of missile flight. In any case, the AMRAAM is required to quickly and accurately process a dense array of signals to successfully prosecute the threat.
AMRAAM missile software has become increasingly more sophisticated, including advanced capabilities to detect and ignore deceptive signals. "Older analog [EA] techniques, using set-on oscillators or frequency memory loops, suffer a significant loss of jamming effectiveness against modem coherent or spread spectrum radars due to the processing gain of the radar5
." Even though several new and untested versions of analog EA techniques are still being discovered, the recent advent of digital recording
2

+-) ) ) ) ) ) ) ) ) ) F/A-1 8 radar signals directed towards target aircraft.
�)( ) ( ) ( ) ( ) ( ) ( ) ( ) ( ) ( ) (-. F/A-1 8 generates target track fi le based on reflected radar signals.
+:�?((i(((()( ( � Q
( ◊ (� tamru
Target initiates EA when threshold is met. If able to maintain a solid track file, AM RAAM
is launched and initia lly supported by data l inks from F/A-1 8 radar.
AMRMM activates self-contained radar and prosecutes taraet to intercept.
Figure 2: Illustration of AMRAAM Employment in EA Environment
capabilities in EA threats has produced a much more capable EA technology. Instead of using a mechanical signal generator with limited signal alteration, the Digital Radio Frequency Memory (DRFM) technology allows the incoming radar signal to be digitally stored and then repeated with "no loss of effectiveness5
." The preserved signal allows for "deceptive modulation of pulse replicas". that can be transmitted "at precisely optimum time for maximum ECM effect6
." The capability of digitally storing an incoming radar signal with no degradation over time6 gives a jammer with DRFM technology the unique capability to simultaneously deceive in both range and velocity7
, enabling the "jamming energy to be concentrated far more effectively within the victim radar's bandwidth5 ."
Although no DRFM techniques have been recorded in air-to-air combat involving US forces8
, many experts believe this significantly more capable EA technique represents the next generation of EA technology4
•9
•10
• In the global market for military aircraft, recent sales have demonstrated a larger emphasis on EW. The recent purchase of US F-16s by the United Arab Emirates hinged on the inclusion of the most advanced EW package sold to date - a package even more advanced than EW packages found in US Air Force (USAF) F-16s. DRFM technology is included not only in the F-16 avionics suite, but in aircraft development in many countries worldwide. An additional reason DRFM is "an attractive way of implementing a false-target system" is that "DRFM is inherently
3

compatible with computer control so that systems with the short reaction times necessary for modern electronic warfare can be implemented 10." "While it once took 10-15 years to proliferate advanced technologies to the third world, co-production and co-procurement today give third world countries rapid access to technology improvements [such as DRFM{" Political decisions in the last decade have "not led to sustained investment needed to keep these [EW] systems on the cutting edge in the deadly game of measure and countermeasure 1 1
." With the current funding shortfalls in acquisition programs all across the US Department of Defense, optimization of test programs is even more critical to maintaining the cutting edge of EW technology. Military aircraft, particularly those from the United States, Great Britain, and Israel, have consistently demonstrated in conflicts since World War II that maintaining the advantage in EW is a decisive advantage in combat. Understanding and improving air-to-air missile capability against EA threats capable of DRFM will likely play an important role in the future of the US military.
4

I. BACKGROUND
HISTORY OF FLIGHT TESTING
Since the introduction of RF guided air-to-air missiles, creating tactically representative test environments has been challenging. "The efforts of the Test and Evaluation (T &E) process are simulations of the projected weapon system performance in the tactical environment 1 2
." T&E can be executed using computers, laboratories, and actual flight test, (including captive carry and actual live missile launches). The tactical environment is difficult to simulate for several reasons. The RF missile is a high performance vehicle that operates using advanced aerodynamic principles. Targets for other weapons such as guided bombs are relatively simple - stationary targets on· the ground often made from simple building materials. However, targets for air-to-air missiles must not only be fully functional flight vehicles capable of autonomous or remote control, but must also be representative of the defined threat. Ensuring targets are tactically representative is challenging. Additional simulation challenges include replication the highly dynamic intercept between two vehicles traveling towards each other at high-subsonic or supersonic airspeeds and the associated dynamics of RF signal transmission and reflection from the atmosphere, the Earth, and other airborne vehicles.
Analog and digital computer simulations have grown in the last four decades to encompass a large part of air-to-air missile simulation. The low-cost and high-speed of computers make simulation an important part of most test programs. However, "the complexity of the radar, combined with the sophistication of modern ECM techniques, makes it difficult, if not impossible, to gain this required level of understanding through analysis alone7
." Experience has shown that computer simulation of air-to-air missiles should be used only after the software has been modified and validated to represent actual missile flight performance, and then only for limited application 1 3 .
Hard-Ware In The Loop (HWIL) simulations, which can simulate an RF environment more accurately than all-digital simulation, can offer a valuable source of information for T &E. Several concepts associated with the missile can be tested with actual missile hardware to better understand or improve performance. Still, actual "launches of the RF guided missile provide proof of performance for the missile system. While representing a small number of the T&E tests, launches receive the lion's share of attention as the program results are reviewed by the program office, the responsible service, the Department of Defense, and the Congress1 4
."
Sub-scale aerial targets can be used to meet the requirements of certain aspects of testing with air-to-air missile launches. Two sub-scale targets that have been used by the US Navy (USN) and USAF for the last three decades are the BQM-34 Firebee and the BQM-74 Chukar. Sub-scale targets can be modified to include specific radar characteristics. However, in many ways, sub-scales do not accurately represent threat aircraft. Threat characteristics such as jet engine modulation, identify friend or foe response, and allaspect radar cross section cannot be simulated with sub-scale targets. Full-scale targets are still optimum for air-to-air RF missile testing.
5

Live fire testing of missiles is expensive not only because of the cost of the missiles, but also because of the costs of using a test range and the cost associated with a target presentation. All missile test programs would benefit from having a high number of missiles to test, but funding constraints have always restricted the number of missiles available. For several missiles currently in US inventory, the number of missiles available for testing before initial release is shown in table 1. In each case, a portion of these assets was used for live fire testing and another portion was permanently converted to test articles such as captive-carry pods and bench-top test hardware articles. Follow-on test programs are allocated even fewer assets. After initial release of the AIM-120A AMRAAM, three phases of improvement were scheduled to improve missile performance. The most current phase of AMRAAM testing, Phase III, includes only eight assets for air-launch testing. Although the complexity of these weapons has increased, proportional spending of defense funds for air-to-air missiles has decreased, most likely due to the relatively few air-to-air conflicts the US Armed services have encountered since the Vietnam War.
Air-to-Air Missile Testing
Due to the complexity of the threat environment created by EA, air-to-air missile testing against EW threats is the most difficult to simulate accurately. Even after one threat is accurately modeled or simulated, there are many different types of EA to counter. EA techniques always seem to be developed and fielded one step ahead of the air-to-air missile's ability to counter the technique 1 3
.
Electronic Protection (EP) is a specific form of electronic counter counter measures, in which an air-to-air radar system is designed to defeat the intended effects of EA. Although the baseline AMRAAM was designed to include EP versus various jamming threats, and follow-on versions of AMRAAM software have concentrated on becoming increasing more resilient to EA, the effectiveness of AMRAAM also depends on the performance of the aircraft radar that is used to support the AMRAAM during its initial phase of flight. EA targets the radar in the aircraft (the APG-65 and APG-73 radars in the F/A-18) as well as the radar in the AMRAAM itself.
Table 1 : Missile Program Asset Allocations
PROGRAM TOTAL TEST ASSETS'"
Sidewinder AIM-9L 65 Sparrow AIM-7F 92 Phoenix AIM-54A 122 Sparrow AIM-7M 96 AMRAAM AIM-1 20A 97 Sidewinder AIM-9X 73 * Note: All numbers of total test assets were listed in reference 14
except AIM-9X, which was recorded in reference 15 .
6

F/A-18 Radar Testing History Most early air-to-air RF missiles were designed to optimize performance specifications in terms of range and maneuverability. At first, there were no significant EA threats, so EP was not a priority. Initial design requirements ( or specifications) for RF missile and aircraft radars did not even include EP performance. As EA threats evolved, RF missiles such as the AMRAAM were developed to include EP as a counter to EA. However, aircraft radars priorities were initially focused on several other large functions such as air-to-ground mapping. EP has not yet evolved nearly as much in aircraft radar. For example, the baseline F/A-18 radar, APG-65, had no formal requirements for EP capability16
• Some EP capability has since been designed into the radar, but nearly all testing conducted to date has been of the "blue sky" type, meaning a clean environment. No formal weapon system integration (aircraft and missile) has been realized for the F/A-18 against electronic threats. Today the APG-65 (baseline radar for the F/A-18) and the APG-73 (upgraded radar for the F/A-18) in the F/A-18 aircraft receive little funding for improvements such as expanded EP capability. The newest aircraft radar, which receives nearly all F/A-18 radar funding, is the APG-79 Active Electronically Scanning Array (AESA) radar. The APG-79 was designed for the F/A-18 E/F Super Hornet. However, the EP specifications of the APG-79 are limited and APG-79 development does not include integrated weapons systems optimization through co-development with weapons such as the AMRAAM 17
•
Development of missiles systems in the USN is a function of several independent design efforts. Program managers in Naval Air Systems Command (NA VAIR) are funded for development of specific systems such as aircraft, air-to-air missiles, mission planning, etc. Development of the F/A-18 and its radar systems, the APG-65 and APG-73, has been independent of the development of the AMRAAM and other missiles in terms of EP. Although integrated weapon system development, which proved effective for the AWG-9 (F-14 radar) and AIM-54C Phoenix (active radar guidance missile carried by the F-14), would have offered much more capable AMRAAM weapon systems, short-term funding limitations precluded integrated development of the F/ A-18 radar and the AMRAAM 1 8
• After having seen only a few air threats employing EA in combat in the last three decades, EP funding was probably not at the top of the USN requirements for the F/A-18 radar. Since Operation Desert Storm, precision-guided weapons integration, such as Global Positioning System (GPS) guided bombs, have received more attention and funding.
AMRAAM Testing History "Typically, AMRAAM testing against various electronic attack waveforms has been missile-only using assumed aircraft support values . . . This has always been a shortcoming of the test program, since it is well known that aircraft performance against EA greatly affects missile performance, at least early in flight 16
." The AMRAAM was integrated into the F/A-18 by developing the F/A-18 radar and mission computer software to support the missile functions. However, the design of the missile and the radar were not further developed to optimize weapon system performance against threats such as EA.
7

Weapons System Testing History
The USAF is the lead service of the joint AMRAAM program, which also includes the USN. Although the USAF has no dedicated testing effort for weapons systems against EA, they do perform aircrew weapons training at Tyndall Air Force Base involving the launching of live missiles against various threat systems, often including EA. Although the data gathered is considered very accurate, there are relatively few data points (85-100 event per year) and there is no verification and validation of launch results using simulation 13 •
AMRAAM EP system characterization is important enough to be one function of the Navy AMRAAM Test Team, though funding is limited. AMRAAM EP testing is a subset of the F/A-18 and AMRAAM Weapon System Evaluation (WSE), a program designed to document the performance of the F/A-18 and AMRAAM when used together as a weapons system against tactically representative threats. No dedicated effort to evaluate the total weapon system was made until the WSE was started in 1996.
Test Goal: Probability of Guidance and Probability of Weapon Effectiveness
Performance is measured by the metric shown in table 2 designed to classify Probability of Guidance (PG) into generalized performance categories. This metric dates from early AMRAAM development when AMRAAM performance was measured against the performance of the AIM-7 and AIM-154 16
. Although the criteria are rather arbitrary, the traditional metric provides a consistent reference frame, and is familiar to program managers.
One of the final products of the EP testing completed under the WSE program is a color table, or ' color chart' as it is called, representing PG against specific EA threats. The table includes the AMRAAM performance supported by both the Fl A-18' s APG-65 and APG-73 radars versus all threats tested. Two modes of the radar are tested versus each threat: Single Target Track (STT) and Track While Scan (TWS). The table also represents performance against the EA threats using perfect radar cueing of the AMRAAM to show the effects of the EA on the missile alone. For illustration, an example of the table format is shown in table 3.
Each year, the Navy AMRAAM Test Team and representatives from Top Gun and other activities meet to generate a list of the top 10 threats for testing. Generally, each
Table 2: Electronic Testing Performance Metric
Criteria
Pa > 85% 50% < Pa < 85% 20% < Pa < 50%
Pa < 20%
8
Qualitative E uivalent
Good Fair Poor
Mar inal

Table 3: Format of Final Product Illustrating Probability of Guidance
Threat
EA 1
EA 2
EA 3
EA 4
EA 5
APG-65 STT
Perfect
successive version of missile software has enhanced capability to counter EA. However, not all missile software versions are tested against all EA threats due to priorities and funding constraints. Sometimes priorities include testing of the missile software most widely used in the Fleet, as opposed to the newest, most capable version of software. So the composite table represents an aggregate performance of several software versions without specifying the software version of the missile for each individual table cell . The "stoplight" format is a historically useful reference il lustrating qualitative system performance to decision makers. Top Gun has requested it because of its simplicity. However, individuals who use the table to make programmatic or tactical decisions often do not realize the several versions of software represented. Additionally, users of the table also do not, in general, realize the uncertainties associated with each calculation of Pa. Uncertainty, which is unique for each Pa calculation, is not included in the table. Users of the table recognize that NA VAIR is responsible for providing the highest quality of information possible, and do not consider the uncertainty of each performance calculation in their decision-making processes.
Another major drawback of the table is the excessive range of Pa represented by a single color . . Performance of the AMRAAM supported by APG-73 STT against EA 4 might be represented by a green cell , indicating what could be considered "fair" performance. Pa could be any percentage within the range of 50% to 85%. For small numbers of data runs, which is common in missile testing, the uncertainty is also large. An uncertainty of only 25% associated with a calculated Pa of 65% covers three color cells of performance from blue to yel low, representing a range or performance anywhere from "poor" to "good." The large range of color cells combined with no representation of uncertainty make the table a somewhat ambiguous indication of weapon system performance against EA.
To better illustrate weapon system performance against EA, another final product was created to show differences between missile performance using actual aircraft radar data and missile performance using perfect aircraft radar data. Performance is represented in terms of probabil ity of weapon effectiveness (PWE), which combines Pa and the results of lethality simulations to calculate the percentage of time the AMRAAM would successfully intercept the target. The format of this chart is shown in figure 3 . Although
9

VI
C1) C: C1)
.:: C1)
w C: 0 g- � a, -
0 >,
= :c 0
1 00
90
80
70
60
50
40
30
20
1 0
0
2
EA Type
- --- - -- --
_Jio A<:tual Data ■ Perfect Miss i le Cue
3
l
Figure 3: Format of Final Product Illustrating Probability of Weapon Effectiveness
this format specifies the version of AMRAAM software for each test and presents performance in much more specific terms, there is still no indication of the uncertainty associated with the probability calculation.
The table and bar chart are updated yearly. The primary customers of these two final products are Top Gun, the squadron in the USN responsible for generating and teaching Fleet tactics, and program managers, who are responsible for deciding how funding will be spent to improve performance through further development. The products are also made available other squadrons responsible for tactics training.
Test Assets
AMRAAM Captive Equipment (ACE)
One of the main components of the EP test program is the ACE pod, shown in figure 4. The ACE pod is an AMRAAM missile encapsulated by unique test equipment designed to keep the missile cool during RF seeker and guidance unit operation. The pod also includes equipment that allows for real-time performance data transmission and data recording.
Integration Test Vehicle (ITV)
The ITV pod is a captive-carry AMRAAM missile, comprised of a functional guidance unit and disabled transmitter inside a missile body without fins, as shown in figure 5. The ITV is a simpler vehicle than the ACE. There is no recording equipment, and no need for a cooling system. However, the ITV does have a data link receiver. Similar to
10

Figure 4: ACE pod used for captive AMRAAM testing
ITV on outboard station of dual m issile launcher
Figure 5: ITV pod used for captive AMRAAM testing
1 1

the ACE, the ITV receives pre-launch cueing and post-launch data links from the F/A-18 radar during simulated fly-out and relays this information to ground facilities via telemetry.
Hard-Ware In the Loop (HWIL) Simulation
The HWIL facility is used for real-cueing and perfect-cueing simulation series. The HWIL is an anechoic chamber housing an AMRAAM seeker/servo assembly mounted on a 3-axis flight table and a 60-horn RF array that generates the appropriate radiofrequency signals including target return, EA, and clutter. A special Aircraft Waveform Generator (A WG) is used to provide the APG-65 and APG-73 fire control radar signals during simulation runs. A central digital processor programmed with a 6-Degrees-OfFreedom (DOF) aerodynamic model and various environment models controls these HWIL components. Pictures of the HWIL components are shown in figure 6.
Digital Simulation
The first all-digital simulator used for EP testing was the Complex Seeker Simulator (CSS), which was a 6-DOF, UNIX-based, digital simulation of early versions of the AMRAAM. CSS was owned and operated by the US government until funding for digital simulation was transferred to the prime contractor in 1997.
Simulation Computers Shielded Room Antenna Array
, , , Missile Interface
Missile on Flight Table
Real Time Data Presentation Anechoic Chamber
Figure 6: AMRAAM HWIL Facility
1 2
Current simulators include the AMRAAM Raytheon Simulation (ARS) and Raytheon' s Team Simulator (TEAM SIM). ARS is a simple 3-DOF simulator that does not include robust EA models. TEAM SIM is a 6-DOF, FORTRAN-based simulator that can more accurately model EA against specific versions of the AMRAAM. TEAM SIM very accurately models AMRAAM software, including the actual execution of AMRAAM code during simulation, but is limited in modeling the complex hardware characteristics of the missile (and of the aircraft).
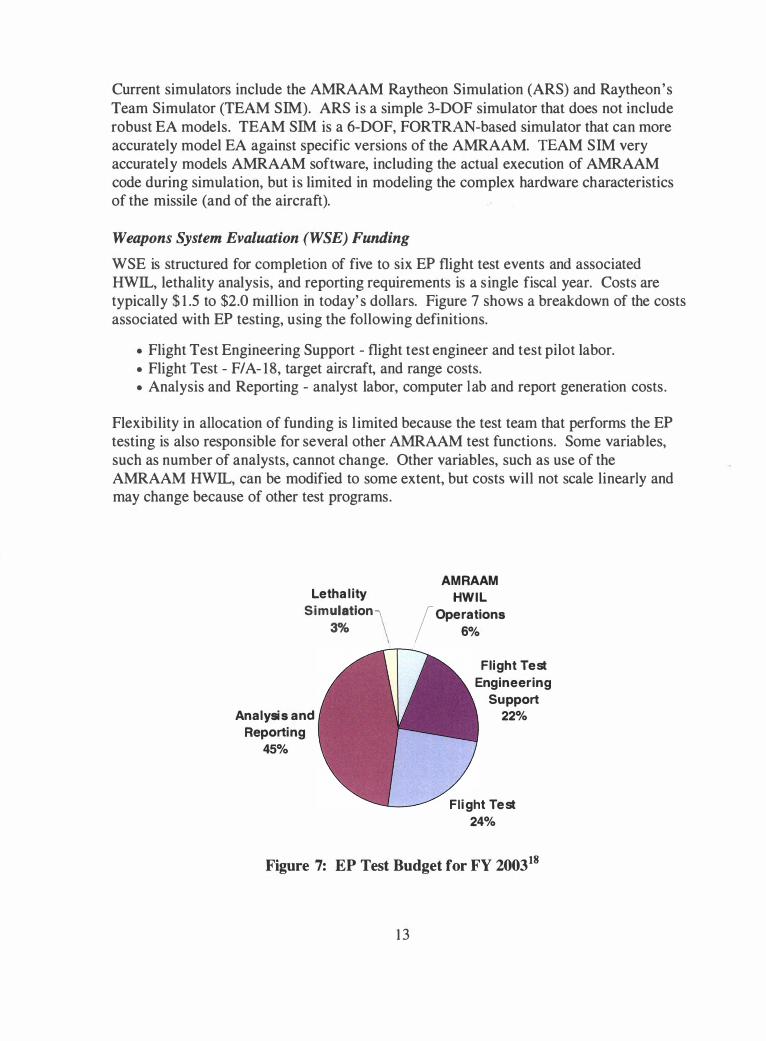
Weapons System Evaluation (WSE) Funding WSE is structured for completion of five to six EP flight test events and associated HWIL, lethality analysis, and reporting requirements is a single fiscal year. Costs are typically $ 1 .5 to $2.0 million in today' s dollars. Figure 7 shows a breakdown of the costs associated with EP testing, using the following definitions.
• Flight Test Engineering Support - flight test engineer and test pilot labor. • Flight Test - F/A- 18, target aircraft, and range costs. • Analysis and Reporting - analyst labor, computer lab and report generation costs .
Flexibility in allocation of funding is l imited because the test team that performs the EP testing is also responsible for several other AMRAAM test functions. Some variables, such as number of analysts, cannot change. Other variables, such as use of the AMRAAM HWIL, can be modified to some extent, but costs will not scale linearly and may change because of other test programs.
Letha l ity S imulation,
Analysis and Reporting
45%
3%
AMRAAM
HWIL
/ Operations 6%
Flight Test Engineering
Support 22%
Fl i ght Test 24%
Figure 7: EP Test Budget for FY 200318
1 3

2. ELECTRONIC PROTECTION TEST METHODS
AMRAAM WSE is a program that is difficult to understand because of the complex nature of the test environment and the broader programmatic issues associated with AMRAAM flight testing. Although at first it may appear that EP testing is a candidate for improvement through advanced simulation methods or more efficient use of existing test assets, optimization requires a more thorough analysis. The two end products (table and bar graphs) do not seem to capture the technical acuity present in other AMRAAM flight testing results. The table is not well liked by AMRAAM engineers and analysts because it does not represent the technical resolution standard in most engineering documentation8
•1 3
. The table and chart, however, serve the customer well. Producing more accurate representation of AMRAAM EP performance (reducing uncertainty associated with performance calculations) would improve the program more than changing the format of the test results.
On paper, the number of captive test flights and number of AMRAAM HWIL simulations for each captive run appears to be more of a result of funding and test asset availability than a statistically optimized process. Initially, using the HWIL for EP testing dovetailed with the organizational desire to keep the HWIL as a viable test asset and programmatic interest in weapon system evaluation 1 6
. Although there is some documentation detailing the structure of EP testing, there is no documentation showing that the current asset utilization provides optimum evaluation of the Fl A-18 and AMRAAM weapon system.
Table 4 shows the options available for missile testing using available test assets. A live missile shot against a full-scale target would give the most accurate indication of weapon system performance. However, the cost of a missile and unit cost of a full-scale target (if the missile guides properly and destroys the target) for one data point is excessive. Replacing the warhead with a telemetry system would increase the data that could be gathered on one shot, but does not decrease the very high cost of live-fire missile testing. In fact, the added instrumentation would likely increase the cost.
At the other end of the scale, running all-digital computer simulations is relatively inexpensive. However, these simulations cannot accurately model EA, resulting in lowfidelity data that does not accurately represent weapon system performance.
Generating new test assets, such as a digital computer simulation with higher fidelity in simulating EA could also be considered. Computers have been used effectively to simulate missile kinematics. However, the cost of accurately modeling the highly dynamic electromagnetic environment when an AMRAAM is shot at an airborne target transmitting EA may be prohibitively high, if not impossible8
• As an example, the contract to Dynetics for development of the CSS cost more than $360 million in the early 1990's 1 8
. The contract supported other functions but nearly all funding was for CSS. Some aspects of the target environment such as main lobe clutter and altitude return were excellent in CSS, but the simulator lacked credible EA models 1 3
•
14

Table 4: Cost versus Quality for AMRAAM EP Testing
Test Type Data Characteristics Cost
Warhead missile versus full scale target • highest quality very high • one data point only
Telemetry missile versus full scale target • high quality • continuous data collection very high
Telemetry captive missile versus sub- • medium quality
scale target with EW pod • continuous data collection high • limited test application
Telemetry captive missile versus full- • medium quality high scale tar,e;et with EW pod • continuous data collection • medium to low quality
HWIL simulation of missile profile • invalid without validation medium from actual flight test
Computer simulation of missile profile • low quality low • only valid for kinematics
For scenarios difficult to model, as is usually the case with EA, digital simulations generally require validation through actual flight test. EA techniques are uniquely different, requiring flight test validation for every technique, thereby negating much if not all of the cost savings associated with digital simulation.
The unpredictable nature of RF warfare places a high premium on the value of generalized performance parameters. Repeated airborne testing associated with the captive missile option (ACE and ITV) allows for quick and accurate collection of large amounts of data that can be used to calculate generalized performance of the weapon system. Although captive missile testing does not include performance of the missile as it approaches the target at high speeds, the AMRAAM HWIL can be used as an efficient means of providing "end game" data. The use of a captive missile against a full-scale target capable of generating the specific EA combined with HWIL simulations of missile
fly-out using recorded aircraft radar data links has proven to be the best tradeoff between cost and data quality. Sub-scale targets such as the BQM-34 and BQM-74 also offer a viable solution, and have proven capable of providing some EA capability. However, sub-scale targets have lower RF fidelity and higher presentation costs than manned fullscale targets.
EVALUATION OF TEST METHODOLOGY
Since 1996, the EP portion of WSE testing has evolved to a consistent process. First, a yearly list of the top threats is generated. Based on a prioritized ranking of EA techniques, asset availability, and cost of testing, captive flight tests are scheduled throughout the year. Typically, seven flights are planned and five actually generate data. Reasons for failure to complete missions include range conflicts, aircraft maintenance problems, weather, instrumentation problems, telemetry problems, and test equipment
15

technical problems. Each flight involves two F/A-18s with captive AMRAAMs each, one ACE and one ITV. One F/A-18 is configured with APG-65 radar and the other with APG-73 radar. Two aircraft are used to simulate a tactical section employing AMRAAM against one or more full-scale targets configured with EA generating equipment. An average of 10 flight passes (with one simulated missile shot by each aircraft per run) are completed for each flight. Each aircraft executes half of the passes using STT radar mode and half using TWS radar mode.
Umbilical cueing (initial transmission of data to missile on the rail just before firing) and data link files (transmission of data from aircraft to missile in flight) for each run are recorded, representing F/A-18 radar performance in the threat environment. These files are then loaded into the AMRAAM HWIL to be used during the AMRAAM fly-out simulation in a modeling of the same environment (there is no accurate simulation of missile fly-out in the captive missile flight tests). For each data link file from the F/A-18, 20 HWIL runs (fly-out simulations) are executed. Each run records unique AMRAAM end-to-end performance. No two runs are alike primarily because of the stochastic nature of the radar and jamming through natural effects that cannot be controlled. Some jammers are free running - they can only be turned on; the phase of their jam cycles cannot be timed during the runs8
• Additionally, a 16-parameter noise model is sometimes used to simulate the expected variance of both rocket motor thrust and physical missile loading alignment on the F/A-188
• Po is calculated from the fly-out simulation results.
Each HWIL fly-out simulation is then recorded and input into a digital computer lethality simulation that accurately models the missile kinematics relative to a model of actual threat aircraft using an endgame methodology called SCAN 1 9 (developed at USN Pacific Missile Test Center, now NA VAIR Weapons Division - Point Mugu). Fifty lethality simulations are run on an Alpha workstation for each HWIL run. Using the results of the lethality simulation and various performance metrics, PWE is computed for the AMRAAM when supported by both STT and TWS track modes of both radars. A diagram of the test flow is illustrated in figure 8.
The basis of this AMRAAM performance calculation includes how well the aircraft directs the missile to the target area. The AMRAAM in many cases may be able to correct for inaccurate radar information. However, if the radar does not provide information with a certain degree of accuracy, the missile will never find the target. Weighing the importance of the radar and missile performance in the weapon system is difficult because of the complicated nature of the environment. Missile performance would likely be considered inore important, but radar performance must meet at least a certain level of accuracy. Evaluation of the weapon system involves answering a simple question: will the missile kill the target? Generally, radar performance can be divided into the three categories delineated in table 5.
Although radar performance can be categorized neatly, measuring weapon system performance is not as simple. Due to the stochastic nature of EA effectiveness, often
16

Missi le performance
5 0 0 0 L e t h a l i t y s i m u l a t i o n s
\! t \ ! 1 00 A M RAA M H W I L ru n s
Radar performance I
\ ! lcl Flight test runs for � each radar mode
Figure 8: EP Testing Flow for Each EA
Table 5: Radar Performance Categories
Radar Performance Category Description
INEFFECTIVE Missile never sees target
MODERATELY EFFECTNE Missile sees target and is sometimes
able to correct for error in radar data
EFFECTNE Missile sees target and is able to guide
to the target
successive runs with the same radar against the same threat will results in radar performance in each of the three categories shown in table 5.
Accurately modeling radar performance in the HWIL is essential to accurately measuring total weapon system effectiveness. Figure 8 shows that although several simulations are used to quantify missile performance, the foundation for measurement of weapon system effectiveness is radar performance, recorded on only a few captive flight tests.
STATISTICAL ANALYSIS OF THE EP TESTING PROCESS
In attempt to quantify the uncertainty associated with current EP performance calculations, a statistical analysis was completed. Using a simple model, PWE is related to the probability of radar effectiveness (PR) and probability of missile effectiveness (PM) by the multiplication rule for dependent events20
:
17

Considering PR the true population percentage of the time the radar effectively supports the missile, we can calculate the confidence interval in estimating PR for a given sample size (n) of five using the following equations20
.
u {1p = -
z
0i is the standard deviation of the population, u is the uncertainty, Z is the number of standard deviations, and 7t is the assumed value of population percentage. Since there is no way to estimate population percentage, a value of 50% is used for 7t because it represents the largest sample size that could be required. Solving for the uncertainty (u) using Z values associated with different confidence intervals results in the numbers show in table 6.
Therefore, calculation of PWE can at best be within± 43.6% of the true performance of the weapon system, assuming perfect missile performance and using a confidence interval of 95%, which is a common system evaluation parameter in the USN.
Following the same procedure results in the uncertainty for PM shown in table 7. The larger sample for missile performance vastly decreases the uncertainty associated with calculating missile effectiveness (PM),
Combining the uncertainties using the multiplication rule results in an uncertainty of ± 44.4% in the calculation of PWE (using 95% confidence interval). If PWE were calculated to be 50%, this large uncertainty of± 44.4% would span all four colors representing performance shown in table 2. Such large uncertainty does not serve as a solid foundation for generation of fighter tactics for combating EA.
The small data sample of radar performance is the limiting factor in calculating Pa and PWE. More samples are needed for reasonable levels of uncertainty. The obvious way to
Table 6: Uncertainty of PR Based on Five Flight Test Runs
Confidence Number of Standard Uncertainty (u) Interval Deviations (Z) 90% 1.645 ± 36.6% 95% 1.960 ± 43.6% 99% 2.575 ± 57.2%
18

Table 7: Uncertainty of PM Based on 5,000 Missile Simulations
Confidence Number of Standard Uncertainty (u)
Interval Deviations (Z)
90% 1 .645 ± 1 . 1 6% 95% 1 .960 ± 1 .39% 99% 2.575 ± 1 .82%
generate more radar data would be to increase the numbers of runs (number of flights) against each EA technique. As shown in figure 7, costs associated with flight test already account for 46% of the WSE budget for EP testing. Funding for the program can not be increased to accommodate more flights and the associated increase in HWIL simulations and analysis. Doubling the number of missions against each EA technique would double the sample size. However, instead of being able to evaluate five EA techniques each year, the additional data collection would only allow evaluation of two or three EA techniques. After seven years of consistent reporting of weapon system performance, halving the number of techniques evaluated without cutting program costs would jeopardize the program as a whole because in a time of shrinking budgets, many would argue that the results do not warrant program costs. Other ways must be found to increase radar samples.
INVESTIGATION OF RADAR DATA LINKS AS STOCHASTIC SIGNALS
To get a better idea of the characteristics of the radar data sent to the missile, and to investigate the possibility of recreating radar data, characteristic parameters of the radar data links were plotted and evaluated using MATLAB 6.5 and Microsoft Excel 2000 software tools.
The primary function of the radar data links is to provide angle, position and velocity information of the target to the missile. Errors in measurement and transmission of position and velocity represent the stochastic nature of radar performance and the effectiveness of EA. Calculation of errors present during a flight test is possible through comparison of missile data to the actual target position and velocity, recorded through electronic tracking of Time Space Position Information (TSPI) on the test ranges. Average TSPI deviation has been calculated in an independent study to be 1 7 meters for a high-speed missile (> Mach 2)8
• For EP testing, TSPI is considered to be truth data. Four flight tests were selected for further investigation. To approximate a distributed collection of radar performance, flight tests were chosen based on test pilot impression of radar performance against EA as indicated by radar display indications in the cockpit. The four tests represent what was considered to be the best performance, worst performance, and two average performances out of eight consecutive EP flight tests, each testing performance against a different type of EA. Two tests represent APG-65 performance and two represent APG-73 performance. Each flight test included approximately half the runs using STT and half using TWS.
19

Probability Density Function All stochastic processes are "an ensemble of time signals" that have values represented by random variables21
. The random variable is best described by its probability density function, referred to as "pdf." If the pdf of a random signal does not change with time, the process represented by the random variable is considered stationary. If, for a stationary process, "the time averages . . . converge to ensemble averages," the process is considered ergotic21
• Therefore, if the radar data link errors can be assumed to be stationary and ergotic, then the pdf of the process can be estimated from one or more recorded signals. Synthetic generation of signals with the same pdf (sampling from the ensemble of time signals) would, in that case, be possible.
Determination of Stationarity In stationary processes, the mean and variance of the signals are constants. To determine stationarity, the data link errors were first plotted as functions of time. Figures 9 and 10 show range and range rate data link errors from one of the test flights plotted as a function of time.
Figure 10 uses two vertical axes to better illustrate the data trends because the significantly larger values associated with runs 1 and 5 compressed the other data series into a nearly straight line. Inspection of the time-based plot of STT range and range rate shows that each test runs appears to have resulted in unique sets of data, with no generalized or repeated trend. The same is true for the TWS test runs in flight 1, as well as all of the test runs in the other three flights. Appendix A includes similar figures for each test run of the four flights.
Further investigation required calculation of time-based mean and deviation to determine whether or not these signal characteristics vary with time or remain relatively constant within some repetitive deviation. Since each test run started from approximately the same separation between the shooter and target, all sets of data link errors were analyzed by referencing the umbilical data as the start of each run. Figures 1 1 and 1 2 show the mean and standard deviation for STT test runs on each of the four flights. Clearly the signals appear to vary with time in all cases. Both mean and standard deviation appear to follow random patterns for all four flights. There is no apparent governing equation that could explain these signal characteristics. Similar characteristics are found for mean and standard deviation for TWS range errors, STT range rate errors, and TWS range rate errors, all plotted in Appendix B.
Determination of Ergodicity Signals can not be considered ergotic without first being stationary. Figures 11 and 12 do not suggest stationarity. Further evidence that the signals cannot be considered ergotic is found in the characteristics of the ensemble averages. As shown in table 8, there is considerable variance between averages for each run. Ergotic signals would converge to
20

• run 1 0.8
j ■ run 3 <> run 5
i:i' 0.6
L t;. run 7
CD O run 9 -� "ii 0 ■ run 1 1 E ... 0.4 0
s " ! • ! ... ■ E 0.2 ■ 9 � ◊ ...
� -LU ◊ ◊ Cl) ■ • Cl • C 0 0 cc 0 •
-0.2 ◊
-0.4 0 2 3 4 5 6 7 8 9 1 0 1 1 1 2 1 3 1 4 1 5 1 6 1 7
Successive Data Links
Figure 9: Flight 1 STT Range Errors
0. 1 0.6 ·• i:i' 0.075 CD -� "ii 0.05
0.025 s
0 oi ,-.:- -0.025 er;-Cl) -0.05 C
... -0.075
-0. 1 ca cc -0. 1 25 Cl C -0. 1 5 ca cc
0 0.4 i:i'
0 0 -� • 0 'i 0 0.2 E
ij ...
.g 0
�
s
◊ ◊ 0 It) ,, I C
0 0 0 ◊ ca
I ,-
-0.2 � • • cc
■ ■ ■: ■ run 3 • • l -0.4 �
t;. run 7 LU ., • • O run 9 • -0.6 � ■ run 1 1 Cl
C
e run 1 ca -0.8 ct
-0. 1 75 ■ <> run 5
-0.2 .._ ____________________ i()io ______ -1
0 2 3 4 5 6 7 8 9 1 0 1 1 1 2 1 3 1 4 1 5 1 6 1 7
Successive Data Links
Figure 10: Flight 1 STT Range Rate Errors
21

0.4 ..-�---------........... -"""'!"-"'!""------!'------�-----!"'-� • 0.3 -L� _. e flight 1
I □ flight 2 ♦ flight 3 A flight 4 =s
-� 0.2 "i E 0 .5. 0.1 f w & 0 C ta a:
i -0. 1 Q) :ii:
-0.2
• l �0'il t u . � t�- O D □ • • • •
• �Mi • • t .._ u
- r .
I . l -0.3 ,......_ __ ......,_....,. ____ ......, __ ......,. __ .,..... ______ _,_ ____ ..... _.__, 0 1 2 3 4 5 6 7 8 9 1 0 1 1 1 2 1 3 1 4 1 5 1 6 1 7 1 8 1 9 20 21 22 23 24 25 26 27 28 29 30 31 32
Successive Data Links
Figure 11 : STT Mean Range Errors
0.5 -----------------------------
1 I =s � =; 0.4 E ... 0
s C 0 ; 0.3 , ·;;
I'
Q) '
"E cu 'g 0.2 s en ... 0 ... ... w & 0. 1 C cu a:
i :11 I
& L • t I • • • •
e flight 1 j . I □ flight 2
1 • flight 3
+-;11
Tt � I
2 3 4 5 6 7 8 9 1 0 1 1 1 2 1 3 1 4 1 5 1 6 1 7 1 8 1 9 20 21 22 23 24 25 26 27 Successive Data Links
Figure 12: STT Range Error Standard Deviation
22
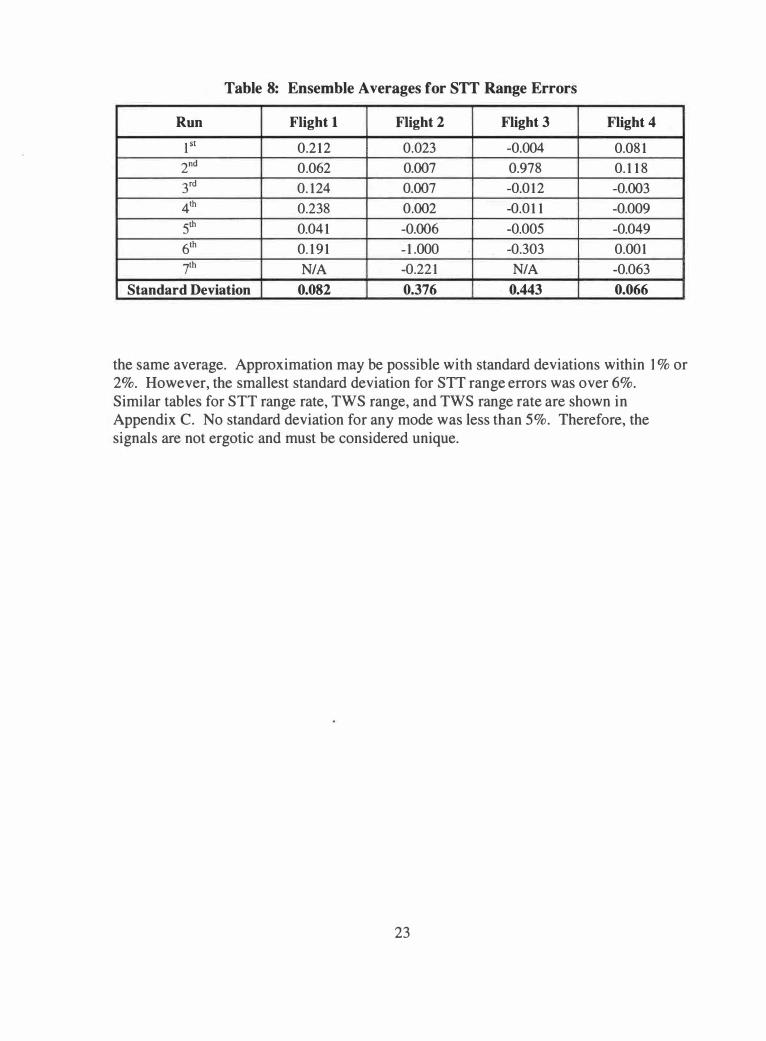
Table 8: Ensemble Averages for STT Range Errors
Run Flight 1 Flight 2 Flight 3 Flight 4
1 st 0.2 12 0.023 -0.004 0.08 1
2nd 0.062 0.007 0.978 0. 1 1 8
3rd 0. 124 0.007 -0.0 12 -0.003
4th 0.238 0.002 -0.0 1 1 -0.009
5th 0.04 1 -0.006 -0.005 -0.049
6th 0. 19 1 - 1 .000 -0.303 0.001
7th NIA -0.22 1 NIA -0.063
Standard Deviation 0.082 0.376 · 0.443 0.066
the same average. Approximation may be possible with standard deviations within 1 % or 2%. However, the smallest standard deviation for STT range errors was over 6%. Similar tables for STT range rate, TWS range, and TWS range rate are shown in Appendix C. No standard deviation for any mode was less than 5%. Therefore, the signals are not ergotic and must be considered unique.
23

3. TEST METHOD OPTIMIZATION TECHNIQUES
An increase in the number of radar data files is needed to better characterize radar performance against specific EA to decrease the uncertainty associated with the weapon system evaluation. Budget constraints do not allow more test flights - certainly not as many as would be necessary to significantly decrease the uncertainty associated with the current testing process. The following three techniques for generation of radar data files were investigated for their viability in the test process.
• Synthetic data link file generation • Time shift expansion of data link files • Employment of radar laboratory to generate additional radar performance data
Each technique was evaluated for accuracy in representing radar performance while staying within budget requirements.
SYNTHETIC DATA LINK FILE GENERATION
The simplest way to generate radar data files would be to generate the files based on characteristics of the flight test radar data files. Costs associated with implementing this technique would be low. However, using generated data files would not increase the accuracy of the test process. Based on the statistical evaluation of test radar data above, the radar data files are neither stationary nor ergotic. There is no known governing equation or function that can be used for signal generation. Therefore, inclusion of synthetically generating signals in the EP testing process would increase, rather than decrease, uncertainty in the testing results.
TIME SHIFT EXPANSION OF RADAR TRACK FILES
Since synthetically generated data does not appear to be useful, generating more data files from each test flight (using actual test data) was investigated. During an intercept, the Fl A-18 radar continually maintains a track file of the target. After missile launch, data link messages are transmitted to the missile at discrete time intervals using current track file information. Test instrumentation in the F/A-18s records mux bus traffic during the flight, which includes radar track file information sampled at a high data rate. Time shift expansion involves projecting what data links would have been at different time intervals of the missile fly-out. Figure 13 illustrates time shift expansion by projecting data links at half of the period of actual data links.
Although recorded for each test flight in case specific radar or aircraft discrepancies are noted, mux bus data is not typically included in EP evaluation. Only one of the four flights investigated (flight 4) had associated mux bus data still available. Flight 4 may not have been the best example for time shift expansion, but data from all other flights had not been saved. Extracting this data and comparing it to TSPI, considered truth data,
24

Actual data l i nks (recorded in flight test)
31 I
Projected data l inks
Figure 13: Illustration of Time Shift Expansion Method
allowed for determination of track file errors between data links, effectively drawing the l ine between data points on graphs showing data link errors (such as figures 9 and 1 0) . Run 12 of flight 4 was selected because STT range errors (shown in figure 1 4) suggest l imited usefulness of time shift expansion and, at the same time, STT range rate errors ( shown in figure 1 5) suggest some potential for the method.
Both figures illustrate the relationship between track file, data link, and projected data link errors, which were created by plotting the data link value according to the radar track file at times corresponding to the addition of half of the average data link period to each data link time. Gaps between data l inks represent data links that were not recorded by the missile due to any of a number of reasons associated with the dynamics of the threat environment. For purposes of generating a realistic time shifted set of data links, gaps were included in the projected data.
Inspection of the projected data links in figure 14 reveals a profile not significantly different that the actual set of data links. The profile of projected data links in figure 1 5 differs more than the actual data l inks but may not differ enough to significantly change the AMRAAM P0. Appendix D includes charts similar to figures 1 4 and 1 5 for each of the runs in flight 4 in which data was recovered. Data l inks in TWS runs do not appear to correlate to the track files as closely as STT. Such differences can probably be explained by extrapolation and processing delays associated with the time-share concept of TWS. Projected data links for TWS runs involved averaging actual data links across each data link period and extrapolating data link trends when actual data links did not bound the projected data l ink time.
Incorporating mux bus data into the EP testing process would be relatively inexpensive. From track file data in the mux bus, more than one set of radar data links could be
25

0 .... ----...... --..---�--..... --.--------..-----""""!""----. � - J
1 -STT Track File -0.2 - ' • Data Links
♦ Projected Data Links � � -0.4 E - + �-0 C ';;' -0.6 0 .. .. 8, -0.8 C ca a:
-1
I
-1 .2 ...,_ ___________________________ ----! ____ ___. -10 0 1 0 20 30 40 50 60 70 80 90 1 00
Time (normalized)
Figure 14: Flight 4 Track File and Data Link STT Range Errors during Run 12
� Cl> .t:t
,5.
w s
Cl> C ca a:
0.4
0.2
0
-0.2
-0.4
-0.6
-0.8 -
-1
-1 .2 · -1 0 0 1 0 20 30 40 50 60 70
Time (normalized)
- STT Track File • Data Links ♦ Projected Data Links
80 90 1 00
Figure 15: Flight 4 Track File and Data Link STT Range Rate Errors during Run 12
26
1 1 0
1 1 0
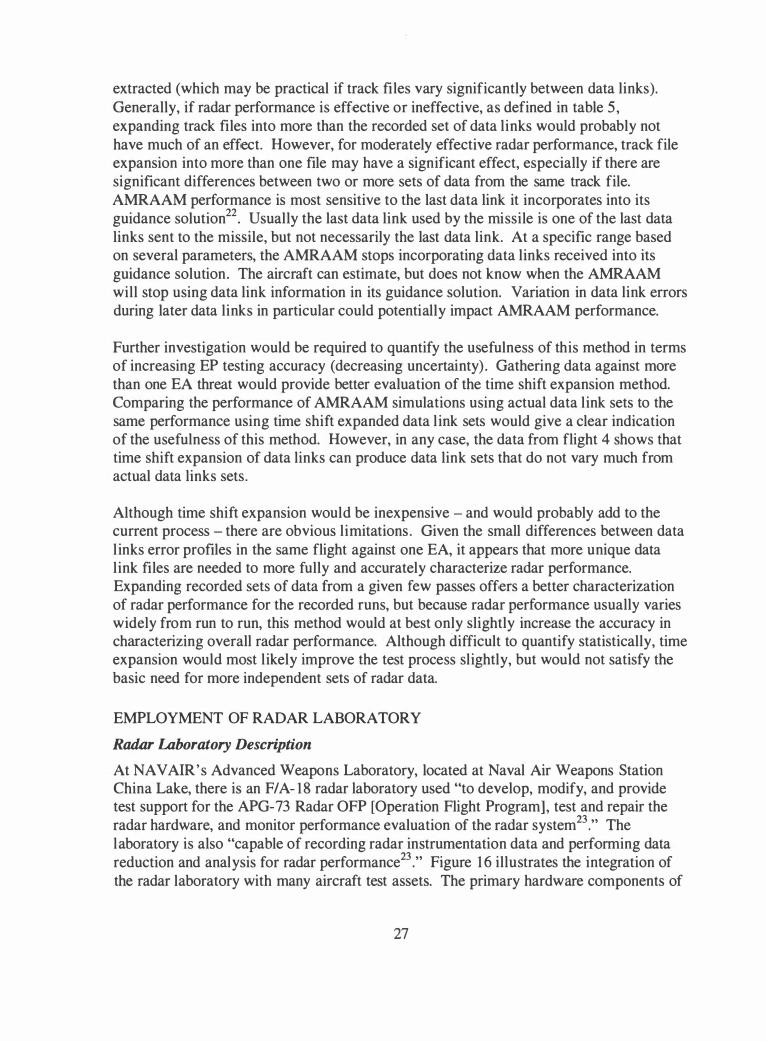
extracted (which may be practical if track files vary significantly between data links). Generally, if radar performance is effective or ineffective, as defined in table 5 , expanding track files into more than the recorded set of data links would probably not have much of an effect. However, for moderately effective radar performance, track file expansion into more than one file may have a significant effect, especially if there are significant differences between two_ or more sets of data from the same track file. AMRAAM performance is most sensitive to the last data link it incorporates into its guidance solution22
• Usually the last data link used by the missile is one of the last data links sent to the missile, but not necessarily the last data link. At a specific range based on several parameters, the AMRAAM stops incorporating data links received into its guidance solution. The aircraft can estimate, but does not know when the AMRAAM will stop using data link information in its guidance solution. Variation in data link errors during later data links in particular could potentially impact AMRAAM performance.
Further investigation would be required to quantify the usefulness of this method in terms of increasing EP testing accuracy (decreasing uncertainty) . Gathering data against more than one EA threat would provide better evaluation of the time shift expansion method. Comparing the performance of AMRAAM simulations using actual data link sets to the same performance using time shift expanded data l ink sets would give a clear indication of the usefulness of this method. However, in any case, the data from flight 4 shows that time shift expansion of data links can produce data link sets that do not vary much from actual data links sets .
Although time shift expansion would be inexpensive - and would probably add to the current process - there are obvious limitations . Given the small differences between data l inks error profiles in the same flight against one EA, it appears that more unique data link files are needed to more fully and accurately characterize radar performance. Expanding recorded sets of data from a given few passes offers a better characterization of radar performance for the recorded runs, but because radar performance usually varies widely from run to run, this method would at best only slightly increase the accuracy in characterizing overall radar performance. Although difficult to quantify statistically, time expansion would most likely improve the test process slightly, but would not satisfy the basic need for more independent sets of radar data.
EMPLOYMENT OF RADAR LABORATORY Radar Ltlboratory Description At NAVAIR's Advanced Weapons Laboratory, located at Naval Air Weapons Station China Lake, there is an F/A- 18 radar laboratory used "to develop, modify, and provide test support for the APG-73 Radar OFP [Operation Flight Program], test and repair the radar hardware, and monitor performance evaluation of the radar system23
." The laboratory is also "capable of recording radar instrumentation data and performing data reduction and analysis for radar performance23
." Figure 1 6 illustrates the integration of the radar laboratory with many aircraft test assets. The primary hardware components of
27

REMOTE llHK TO OTUER
FIA- 18 LIIBS
Ml!ilikm anpulllr&
FUR i.AB
Clldqllt Dlsplay Group
DATA Rl:OUCTION
• HP 900O • S-ita • !JC&
CSCI
s□c Cabinet
ShlJlallan I Network
SMS C&bnat
Ra:lar CClnl Wtallll ssr.a-
RECORDm
sy&taTI
VAX 400:)
STl: CONTID.
RIP Tmt • CD,I Maita- [quipme • IDB P1nel Rack • IOI
" VAX JQOO
ANlENNA BENCH
Tari,t Gtnntar
• PC
Figure 16: Radar Laboratory Configuration (reprinted from reference 23)
Ra)th!ia, - El Segundo Baaing . St. Louis
r eed lbm
J11mmars
the radar laboratory are the antenna rack and an antenna feed horn. The antenna rack is used to mount an actual radar assembly (either APG-65 or APG-73). Power and cooling allow continuous radar operation. The feed horn is located directly in front of the radar assembly, mounted on a catwalk attached to the outside wall of the radar laboratory space. This configuration allows for testing against real world targets located outside of the laboratory. The laboratory is also comprised of the operator console and spread bench (both shown in figure 17), an equipment rack, and an equipment bay. The equipment bay contains radar software and software used for target generation. Multiple targets can be generated in three-dimensions using the wave-guide assembly on the radar. Targets utilizing EA can be simulated using the feed horn. For current operations, the target generator is used almost exclusively for radar software validation (no performance testing).
EP Testing in Radar La,boratory Performance testing of radar EP in the radar laboratory has been limited for two reasons. First, the feed horn is physically fixed directly in front of the radar rack. Therefore, maneuvering of EA targets can only be simulated in range. Second, there is no calculation or recording of target truth data by which to compare radar performance. The only way to approximate truth data is to estimate target position using radar performance against the target without EA as a baseline. For example, a test run against an EA target
28
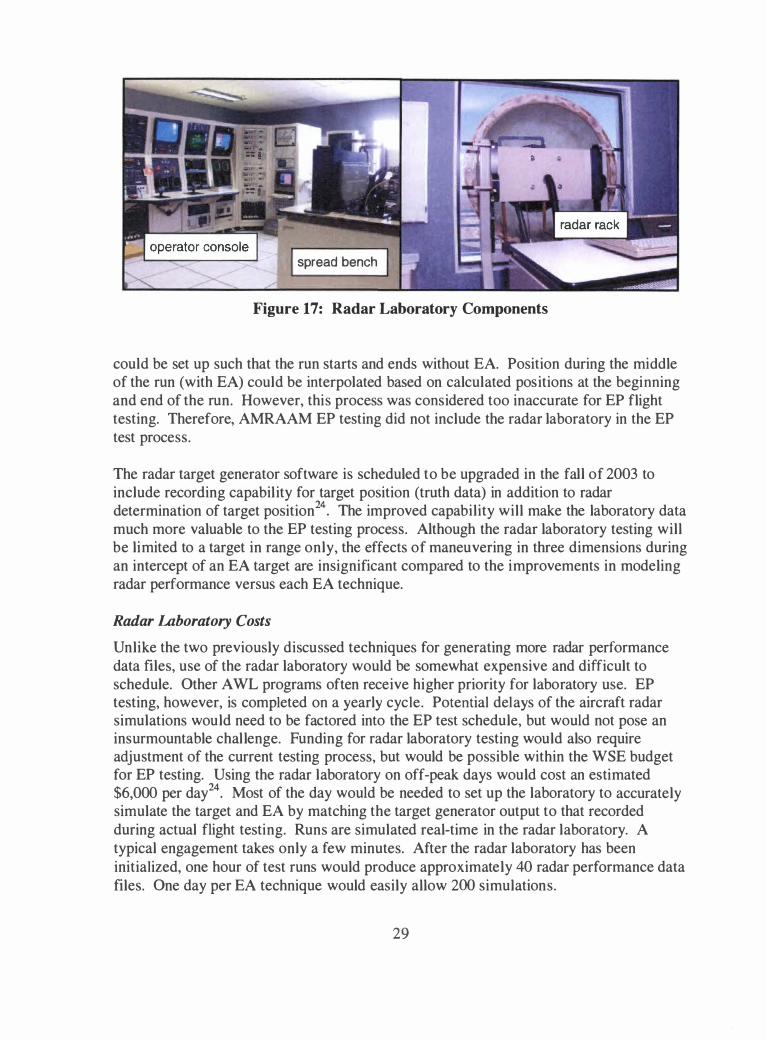
spread bench
Figure 17: Radar Laboratory Components
could be set up such that the run starts and ends without EA. Position during the middle of the run (with EA) could be interpolated based on calculated positions at the beginning and end of the run. However, this process was considered too inaccurate for EP flight testing. Therefore, AMRAAM EP testing did not include the radar laboratory in the EP test process.
The radar target generator software is scheduled to be upgraded in the fall of 2003 to include recording capabil ity for target position (truth data) in addition to radar determination of target position24
• The improved capability will make the laboratory data much more valuable to the EP testing process. Although the radar laboratory testing will be limited to a target in range only, the effects of maneuvering in three dimensions during an intercept of an EA target are insignificant compared to the improvements in modeling radar performance versus each EA technique.
Radar Laboratory Costs
Unlike the two previously discussed techniques for generating more radar performance data files, use of the radar laboratory would be somewhat expensive and difficult to schedule. Other AWL programs often receive higher priority for laboratory use. EP testing, however, is completed on a yearly cycle. Potential delays of the aircraft radar simulations would need to be factored into the EP test schedule, but would not pose an insurmountable challenge. Funding for radar laboratory testing would also require adjustment of the current testing process, but would be possible within the WSE budget for EP testing. Using the radar laboratory on off-peak days would cost an estimated $6,000 per day24
• Most of the day would be needed to set up the laboratory to accurately simulate the target and EA by matching the target generator output to that recorded during actual flight testing. Runs are simulated real-time in the radar laboratory. A typical engagement takes only a few minutes. After the radar laboratory has been initialized, one hour of test runs would produce approximately 40 radar performance data files. One day per EA technique would easily allow 200 simulations.
29

More radar performance data files would mean less uncertainty in the EP testing process, but increasing the number of radar laboratory runs would also increase the costs associated with set-up and operation of the HWIL. Although fewer HWIL runs would be required for each radar data set to maintain the same total number of AMRAAM simulations, the cost of setting up the HWIL for each radar data set accounts for a significant portion of the HWIL operational cost1 8
• Table 9 illustrates that if the number of radar sets were doubled, the increase in HWIL operational costs would be 40%.
Determination of Optimal Number of Radar Data Sets Increasing the number of radar data sets used for HWIL tests will cost more money. If WSE funding remains relatively steady, as is expected 1 8
, some other part of the budget will have to be reduced. The only logical reduction would be number of test flights. If the number of test flights per year were reduced by one, enough money would be available for inclusion of many more radar data sets into the HWIL. Many factors outside the scope of this study are involved in budget determination each year. For analysis purposes only, an approximation of budget components was made to illustrate the increase in overall decrease in uncertainty that would be gained by increasing the radar data. Table 10 shows a theoretical budget shift, assuming more radar data would only slightly increase analysis required.
Using the budget structure in figure 7, the increase in money for HWIL operations would allow approximately 80 more radar data files for each test flight. The radar laboratory would need to be used to generate 40 simulations (20 STT and 20 TWS) of APG-65 and of APG-73 for each EA technique. These 80 runs would be added to the 10 flight test runs of each radar type against the EA target for a total of 100 radar data sets to be tested in the HWIL. Using the 95% confidence interval, the uncertainties associated with performance calculations for each radar mode would be decreased from± 44.4% to± 20.5% as shown in table 11.
Table 9: Cost of HWIL Operations as Data Sets Increase
HWIL Cost Break-down Current EP Testing Doubling Radar Data (20 radar data sets) (40 radar data sets)
Set-up $8,000 $16,000
Test run execution (1000 total) $10,000 $10,000
HWIL Labor/Maintenance $2,000 $2,000
Total Cost $20,000 $28,000
30

Table 10: Proposed WSE Budget Shift
Budget Component 2003 WSE Budget Theoretical Budget for 5 EP Test Flights for 4 EP Test Flights
Flights $382,000 $305,600
Flight Support $339,000 $267,200
Radar Laboratory $0 $24,000
HWIL Operations $ 100,000 $2 14,200
Analysis $703,000 $7 1 3 ,000
Lethality Simulations $47,000 $47,000
Total Cost $1, 571,000 $1, 571,000
Table 11: Uncertainties in Optimized Test Process
Probability Uncertainty
Current Test Process Optimized Test Process
PR ± 43.6% ± 19.6%
PM ± 1 . 1 6% ± 1 . 1 6%
PWE ± 44.4% ± 20.5%
3 1
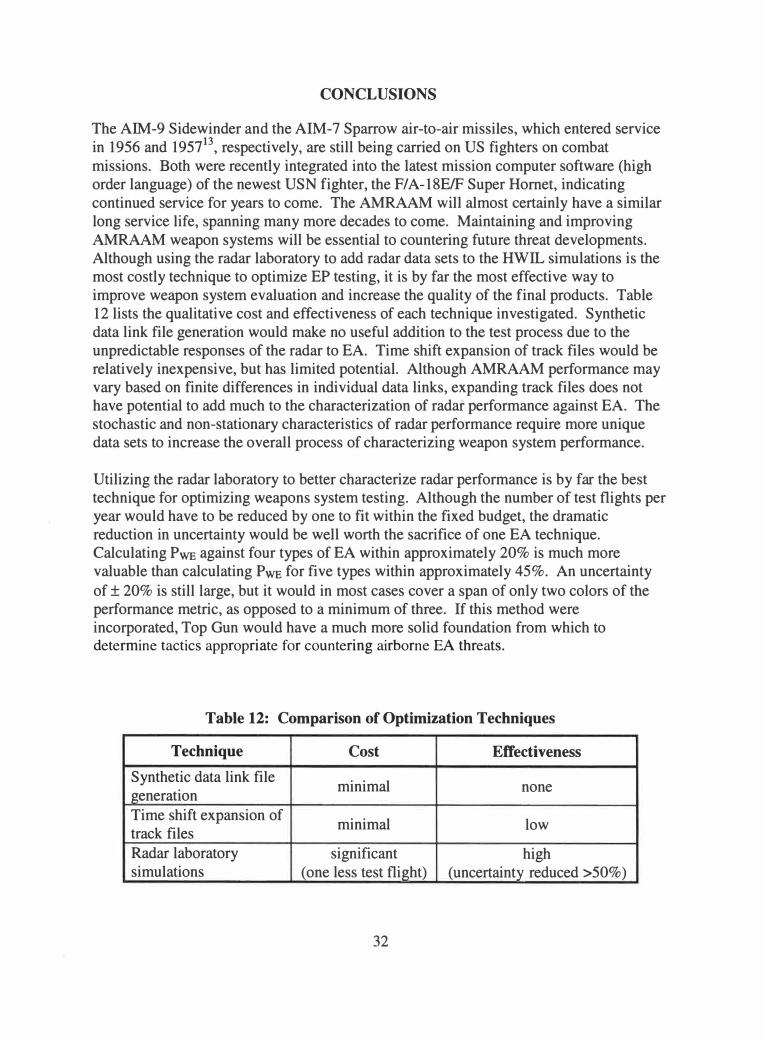
CONCLUSIONS
The AIM-9 Sidewinder and the AIM-7 Sparrow air-to-air missiles, which entered service in 1956 and 195? 13
, respectively, are still being carried on US fighters on combat missions. Both were recently integrated into the latest mission computer software (high order language) of the newest USN fighter, the F/A-18E/F Super Hornet, indicating continued service for years to come. The AMRAAM will almost certainly have a similar long service life, spanning many more decades to come. Maintaining and improving AMRAAM weapon systems will be essential to countering future threat developments. Although using the radar laboratory to add radar data sets to the HWIL simulations is the most costly technique to optimize EP testing, it is by far the most effective way to improve weapon system evaluation and increase the quality of the final products. Table 12 lists the qualitative cost and effectiveness of each technique investigated. Synthetic data link file generation would make no useful addition to the test process due to the unpredictable responses of the radar to EA. Time shift expansion of track files would be relatively inexpensive, but has limited potential. Although AMRAAM performance may vary based on finite differences in individual data links, expanding track files does not have potential to add much to the characterization of radar performance against EA. The stochastic and non-stationary characteristics of radar performance require more unique data sets to increase the overall process of characterizing weapon system performance.
Utilizing the radar laboratory to better characterize radar performance is by far the best technique for optimizing weapons system testing. Although the number of test flights per year would have to be reduced by one to fit within the fixed budget, the dramatic reduction in uncertainty would be well worth the sacrifice of one EA technique. Calculating PWE against four types of EA within approximately 20% is much more valuable than calculating PWE for five types within approximately 45%. An uncertainty of± 20% is still large, but it would in most cases cover a span of only two colors of the performance metric, as opposed to a minimum of three. If this method were incorporated, Top Gun would have a much more solid foundation from which to determine tactics appropriate for countering airborne EA threats.
Table 12: Comparison of Optimization Techniques
Technique Cost Effectiveness
Synthetic data link file minimal none generation Time shift expansion of minimal low track files Radar laboratory significant high simulations ( one less test flight) (uncertainty reduced >50%)
32

RECOMMENDATIONS
After the AWL radar laboratory is upgraded, the AMRAAM IPT should pursue incorporation of the radar laboratory simulations into the EP testing process. When possible, NA VAIR should pursue co-development of coupled systems such as the F/ A-18 radar and the AMRAAM. Division of test programs routinely causes independent system development at the expense of weapon system performance. Integration of system development is often constrained by short-term (fiscal) funding. More money is spent later in attempt to understand performance of mature systems than would have been required to characterize combined performance during co-development. The WSE effort has cost NA VAIR approximately $11 million since it began in 19961 8
. Though it may not have been feasible at the time, integration of AMRAAM and radar software earlier in the developmental stage would not have cost nearly as much. Additionally, performance could certainly have been optimized to provide more weapon system capability8· 1 3 • This weapon system is now too mature to be optimized for overall system performance. Managers of current programs, such as the APG-79 AESA radar, and future programs should work towards integrating the development of weapons systems such as aircraft radars and air-to-air radar missiles, which will not only save money, but also increase overall performance of the weapon system.
33

REFERENCES
34

REFERENCES
1. "Approved Navy Training System Plan for the AIM-120 Advanced Medium
Range Air-to-Air Missile," United States Navy, Naval Training System Plan, N-
88-NTSP-A-50-8111 C/A, June 1998.
2. "AIM-120 AMRAAM Slammer," Federation of American Scientists Military
Analysis Network, Electronic Resource, http://www.fas.org/man/dod-
101/sys/missile/aim- l 20.html, website visited July 2003.
3. "Electronic Combat Training System," developed by Aircrew for Aircrew,
Chapter 9: Introduction to Radar Jamming, Electronic Resource, http://www.info
strategies.com/ects.htm, website visited July 2003.
4. Gobel, Dan; "Jamming: The First 100 Years;" The Journal of Electronic Defense;
February 1999.
5. Stott, G. F. ; "Digital Modulation for Radar Jamming;" IEE Colloquium on Signal
Processing in Electronic Warfare; London, UK; 31 January 1994.
6. Hill, Peter C. J. ; Truffert, Vincent; "Statistical Processing Techniques for
Detecting DRFM Repeat-Jam Radar Signals;" IEE Colloquium on Signal
Processing in Electronic Warfare; London, UK; 31 January 1992.
7. DiFillippo, D; Geling, G. ; Currie, G. ; "Simulator for Advanced Fighter Radar
EPM Development;" IEE Proceedings - Radar, Sonar, and Navigation; Volume
148, Issue 3; June 200 1 .
8. Metternich, Norbert; AMRAAM Analyst; Interview at NA VAIR Weapons
Division, Naval Base Ventura County - Point Mugu; 23 January 2003.
9. Pring, P. C. J. ; James, G. E. ; Hayes, D. ; White, M. P. ; "The Phase Performance of
Digital Radio Frequency Memories (DRFMs);" Second International Conference
on Advanced A-D and D-A Conversion Techniques and Their Applications;
Cambridge, UK; 8 July 1994.
10. Roome, S. J; "Digital Radio Frequency Memory;" Electronics and
Communication Engineering Journal; Volume 2, Issue 4; August 1990.
11. Gilchrest, Wayne T. ; Member of US Congress; "Protecting Self-Protection;"
Electronic Warfare Working Group; Issue Brief #6; 17 May 2001.
12. Eichblatt, Emil J. ; Performance Simulation in Support of Test and Evaluation;
Pacific Missile Test Center, Point Mugu; Second Printing; October 1983.
13. Christensen, Eric; AMRAAM Lead Flight Test Engineer; Interview at NA VAIR
Weapons Division, Naval Base Ventura County - Point Mugu; 06 February 2003.
35

REFEREN CES (continued)
14. Eichblatt, Emil J. ; Test and Evaluation of an Air-to-Air RF Guided Missile;
Pacific Missile Test Center, Point Mugu; Fourth Printing; October 1984. 15. Ottenhoff, Henry; Advanced Weapons Laboratory Weapon Systems Integrations
Engineer; Interview at NA VAIR Weapons Division, Naval Air Weapons Station China Lake; 05 June 2003.
16. Christensen, Eric; "History of AMRAAM Weapon System Evaluation (WSE) Testing;" NA VAIR Weapons Division, Naval Base Ventura County - Point Mugu; March 2003.
17. Shoemaker, William; US Navy Lieutenant and Ph.D. ; Advanced Weapons Laboratory APG-79 Project Officer, VX-31; Interview at NA VAIR Weapons Division, Naval Air Weapons Station China Lake; 13 January 2003.
18. George, Brad; AMRAAM Integrated Project Team Lead; Interview at NA VAIR Weapons Division, Naval Base Ventura County - Point Mugu; 30 January 2003.
19. Ball, Robert E. ; The Fundamentals of Aircraft Combat Survivability Analysis and
Design; AIAA Educational Series; Second Printing; 1985. 20. Sanders, Donald H. and Murph, Franklin A. ; Statistics: A Fresh Approach; Third
Edition; McGraw Hill Book Company; 1985. 21. Burris, C. Sidney; McClellan, James H. ; Oppenheim, Alan V. ; Parks, Thomas W. ;
Schafer, Ronald W. ; Schuessler, Hans W. ; Computer-Based Exercises for Signal
Processing Using MATLAB; MATLAB Curriculum Series; Prentice Hall; 1994. 22. Zeleny, Don; AMRAAM System Engineer; Interview at NA VAIR Weapons
Division, Naval Base Ventura County - Point Mugu; 12 December 2002. 23. Fankhauser, M.; "F/A-18 Facilities Description;" F/A-18 Weapons System
Integration and Test La.boratories; NA VAIR Weapons Division; 10 January 2002.
24. Garrett, John; Advanced Weapons Laboratory F/A-18 Radar Test Engineer; Interview at NA VAIR Weapons Division, Naval Air Weapons Station China Lake; 06 May 2003.
36

APPENDICES
37

APPENDIX A
Range and Range Rate Errors in STT and TWS for Flights 1 through 4
38

O run 2 0.8 ■ run 6
� ♦ run 8
Cl) 0.6 A run 1 0 -� E
,5. 0.4 � CD tn 0.2
fl a: t • '1 • ■ ■
0 ■ � 0
fl 0 0
Cl
-0.2 0 2 3 4 5 6 7 8 9 1 0 1 1 1 2
Successive Data Links
Figure A-1 : Flight 1 TWS Range Errors
O run 2 0.8 ■ run 6
� I' ♦ run 8
CD A run 10 ■ ■ -� o.6 I
E
0.4 ,5.
�
s 0.2 CIII
� 0 a: 6 CD
Iii a tn 0 ■ a: 0 0 0 0 0
-0.2 6.
-0.4 0 2 3 4 5 6 7 8 9 1 0
Successive Data Links
Figure A-2: Flight 1 TWS Range Rate Errors
39 Appendix A

0. 1 1 0. 1
S' 0.09 ♦ -� cii 0.08 E
0 0.07 s. 0.06 .... II) 0.05 -'flt 0.04
� 0.03 0.02 C �
� ◊ a:
� 0.01
uj 0 •
-rr g, -O.Q1 C
� -0.02 -0.03 , -0.04
0 1 2
0.6
0.4
0.2 S'
♦ -� cii 0 ti
';:' -0.2 ,6
uj l CD -0.4
t -0.6
-0.8
-1 0
Appendix A
t -+ -
t j ♦
••
.- . •
• ■
I e
T 3 4 5 6 7 8 9 1 0 1 1 1 2
Successive Data Links
0
13
+-_f e run 1 1 t ■ run 3 ◊ run 4
....__ ----+---
fl. run 5 O run 7
.,__ -,-
■ run 9 f ♦ run 1 0
T
• •
� I n --B � � I
1 4 1 5 1 6
- -
17 1 8
--,.-
1 9 20
Figure A-3: Flight 2 STT Range Errors
,■ I ■
a ■ • •
i 0 0 0 ■
'" "- � /5,, n
0 j
O run 2
1■ run 6 ♦ run 8 fl. run 1 2
2 3 4 5 6 7 8 9 1 0 Successive Data Links
Figure A-4: Flight 2 TWS Range Errors
40
0. 1
0 S'
-0. 1 Cl) -� cii
-0.2 E C
-0 3 -. 0 ...
-0.4 "g ca
-0.5 C: C �
-0.6 a: 0
-0.7 � CD
-0.8 g, ca a:
-0.9
-1
1 1

� -- -i:, en a, C .!:::! � 'ii .. E e o ._ C w Q) 0 ai � a: ,.._ Q) en C al a:
0.6
0.4
:;- 0.2 Q) .!:::! 'ii E 0
e -0.2 w .! � -0.4 Q) en C al -0.6 r:c
-0.8
-1
0.06 .---------------------------- 0
0.04
0.02
0
-0.02
-0.04
-0.06
-0.08
-0. 1
-0. 1 2
-0. 1 4 • • • • ♦ ♦ • - ♦
l
- i -
- j + +-
J _--i- -
t •-run 1 ■ run 3
, <> run 4 � run 5 O run 7
l♦ run 1 0 ■ run 9
-0. 1
-0.2 j .!:::! 'ii
-0.3 E C
-0.4 -0)
C
-0.5 � e
-0.6 w .!
-0.7 a: Q) en C
-0.8 �
-0.9 ' i -0. 1 6 __________________ ....., ________________ _, -1
0
0 1
D. ♦ 0
2 3 4 5 6 7 8 9 1 0 1 1 1 2 1 3 1 4 1 5 1 6 1 7 1 8 1 9 20 21 Successive Data Links
Figure A-5: Flight 2 STT Range Rate Errors
O run 2 ■ run 6 +
■ ■ ■ ♦ run 8 ■ � run 1 2 -
♦ ■ 1■ ♦
,g- ii j � � 6. 6. ■ 0 0 0
-I
2 3 4 5 6 7 8 9 1 0 1 1
Successive Data Links
Figure A-6: Flight 2 TWS Range Rate Errors
1 2
41 Appendix A

o.o3 ..... _,_ .. ___ __,, ____ ..,.... __ ..,... _________
I
�""!"'t---.-0.02 -1-----,- j +---- : ��� : t
S' 1 I I • . _ _,__ _ ____,__ _ ___,_ 6 run 8 i 0.01 -I e e -, 1. • - ----J,_____
_j_ O run 1 1
0.8 S' .E:!
0.6 � 0 0 fl :!1
f! • -!-6 e ■ run 4 - �
c t , A _ 1
T l e ■ run 1
12 I
.,. ;- -0.01
V
f :::: ■
◊ I t- : �---t � l +-J .- ; 0.2
i
0.4
r::: • r-� ·� t �± _A tr--+-- -I �0
.2 i
[ -0.06 --------------- I r� - �fl i � I �4
-0.07 -, ■ ■ Iii -0.08 .,___..;......;.......:......:.,_. ____ """"" __ ....;.._.....;,,....,;;;;;;...a111..1---,Ll,.----' -0.6 0 1 2 3 4 5 6 7 8 9 1 0 1 1 12 13 14 1 5 1 6 17 1 8 19 20 21 22 23 24
Successive Data Links
Figure A-7: Flight 3 STT Range Errors
□. □
f -□ -1-
I O run 1 ,■ run 3 ♦ run 5
�
6 run 7 e run 9 □ run 1 0
2 3 4 5 6 7 8 9 1 0 1 1 1 2 1 3 1 4 1 5 1 6 1 7 1 8 1 9 Successive Data Links
Figure A-8: Flight 3 TWS Range Errors
Appendix A 42

0.8
0.6
Q) -� 0.4 E ... 0.2 ... e o ... ! -0.2 a: Q) g, -0.4 a, a:
-0.6
-0.8
e run 2 -� ■ run 4
<> run 6 -- - - � run 8
■ ■ o run 1 1 ■ run 1 2
D. i5. _jj, I ! -.- : • • . t - A I ◊ • ■ ' .
/. ■ ■ ■ ■ ■
■ i -- · ..
• ' • •
t ■ i I■
■ ■ ■
•
-1 ._....., ____________ ......_ _____________ ___. 0 1 2 3 4 5 6 7 8 9 10 1 1 12 1 3 1 4 1 5 1 6 1 7 1 8 1 9 20 21 22 23 24
Successive Data Links
Figure A-9: Flight 3 STT Range Rate Errors
0.3
I 0.2
i □
I■ + 0.1 � • □ □ □
,;- 0 • " ¼- • - 0 � 9 •
♦ Q) -□- Q fj 6.. • • t • � -0. 1
,C) 0 6 /J. -■ E □ 0 -0.2
O run 1 ':' -0.3 + □ e
i ■ run 3
w -0.4 s 6, ♦ run 5 � -0.5 t � run 7 Q) 0 e run 9 g, -0.6
□ run 1 0 a: -0.7
l -0.8 D -+-
□ -0.9 ·□
-1 0 2 3 4 5 6 7 8 9 1 0 1 1 1 2 1 3 1 4 1 5 1 6 1 7 1 8 1 9 20
Successive Data Links
Figure A-10: Flight 3 TWS Range Rate Errors
43 Appendix A

0. 1 75
-1 0. 1 5 · •■ ■ 1 ' - I t I • run 5-
1 I
■ ■ run 6 0.1 25 .. , .. o run 8 0.75 II)
I , . ••• ,... �
c-; 0.1 -- - o run 1 2 Cl) ,... .!:i N • • ■ run 1 3 -; ,... 0.Q75
r � E
tti - • ... ♦ run 1 5 0.5 0 � ,,
1 1 .s co
Q) an .!:i o.o5 /j,, run 1 0 0 en -; T
,... . ■;
C § e 0.025 :I a: 0 a: ._ C
◊ ◊ O ◊ ◊ ◊ O 0 ◊ O ? 0 <>--<>· 0.25 ...
o - ◊ ◊ ◊ O 0 ... ... ... 0 ◊ 0 w w
I Cl) Cl)
c:n -0.025
j c:n C C ftl ftl a: 0 0 0 0 0 0 oo o
0 a: -0.05 ,0- 0 0 0 -
-0.075 � � 0 6 � � 0 9 0 0
-0.1 -0.25 0 2 4 6 8 1 0 1 2 1 4 1 6 1 8 20 22 24 26 28 30 32
Success ive Data Links
Figure A-11: Flight 4 STT Range Errors
0.02 --
t O run 4
S' 0.01 5 0.8 S' Q) l). run 1 1 Q) .t! .t! "ii • run 1 4 "ii
E ■ run 7 0.6 E 0 0.01 0 ..s ♦ run 9 ..s
0) ,... 0.4 ,... C ,... ca
.,;- 0.005 0 ,... ,n
l. 0 ,n
C 0.2 C ::I
6 0 ::I
a: a: 0 • I ...
0 0 0 ... I ... ... ♦ ! • • ♦ • • • • 0 ... w w CD .0 Cl) c:n
■ c:n
C -- ■
C � -0.005 ■- I
---0.2 a:
I:,, -0.01 -0.4
0 2 3 4 5 6 7 8 9 1 0 1 1 1 2 1 3 1 4
Successive Data Links
Figure A-12: Flight 4 TWS Range Errors
Appendix A 44
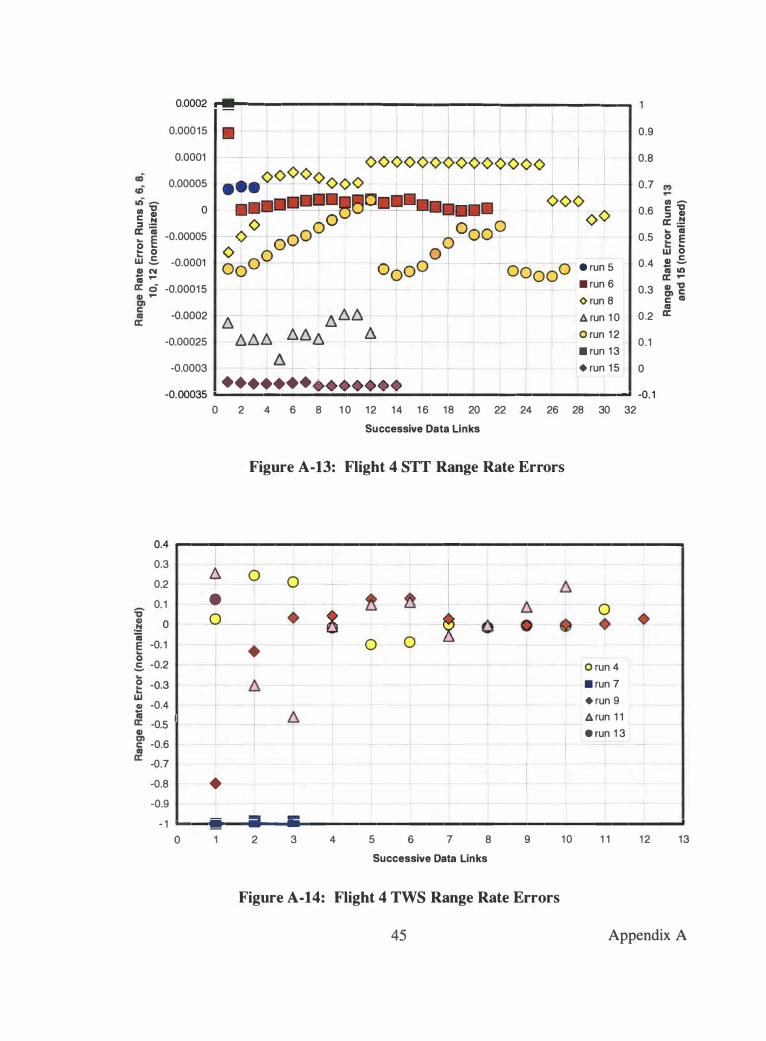
0.0002 P"lll-!--�-------"!'-��----..... --------
0.00015
0.0001
0.00005
io -(1) "0 0 C �
£E � ... E -0.00005 0 ... ... 0 w ..S -0.0001 G> N i .... a: o -0.00015 G) ....
i -0.0002 a:
-0.00025
-0.0003
6.- - 1:::,.6.1:l t::,,t::,.A Al:l f:l �
6. ·····•· ·
1 I
-r-OOooO e run 5 ■ run 6 ◊ run 8 � run 1 0 O run 1 2 ■ run 1 3 ♦ run 1 5
0.9
0.8
0.7
0.6
0.5
0.4
0.3
0.2
0 . 1
0
-0.00035 ---------.............. � ______________ .....,_ -0. 1 0 2 4 6 8 1 0 1 2 1 4 1 6 1 8 20 22 24 26 28 30 32
Successive Data Links
Figure A-13: Flight 4 STT Range Rate Errors
0 -C "0 ::::, G)
a: -� ... m 0 E
0 w G) ..s i IO a: .... G) "0 01 C C as as a:
0.4 .---�-------------""!"---------------0.3
0.2
0. 1
-� 0 m E -0. 1
..S -0.2
e -o.3 w Cl) -0.4 i ' a: -0.5 , G)
g> -0.6 a: -0.7
-0.8
-0.9
l:l • 0
•
0 0
♦ 0 0
1
t
0
O run 4 ■ run 7 ♦ run 9 � run 1 1 • run 1 3
- 1 .,__,.. ___ ...,.. .... ______________________ ___,.
0 2 3 4 5 6 7 8 9
Successive Data Links
Figure A-14: Flight 4 TWS Range Rate Errors
45
1 0 1 1 1 2 13
Appendix A
APPENDIX B
Mean and Standard Deviation for Range and Range Rate Errors in STT and TWS
46

0.3
0 I e flight 1
l 0.2 □ □ 1 □ flight 2 □
□ ♦ fl ight 3
Cl) 0. 1 D A flight 4 -� -cii
□ • • E • 0 � -t • .s 0 - -. •• • • • .. • A-
l e .. t ♦ i •
uj • ♦ • ♦
8, -0. 1 • ♦ .
't T • a: � i -0.2 •
♦ I -0.3
-0.4 0 2 3 4 5 6 7 8 9 1 0 1 1 1 2 1 3 1 4 1 5 1 6 1 7 1 8 1 9
Successive Data Links
Figure B-1 : TWS Mean Range Errors
0.7
l -0.6 e flight 1
0.5 t
□ flight 2 � �-♦ flight 3
0.4 A flight 4
0.3
0.2
-0.4
-0.5 ....,. _______________________________ __,,. 0 2 4 6 8 1 0 1 2 1 4 1 6 1 8 20 22 24 26 28 30
Successive Data Links
Figure B-2: STT Mean Range Rate Errors
47 Appendix B

0.4
0.3
,i' 0.2 a, .ti ti 0. 1 E 0 s 0 e uj a, -0. 1 • C as a: -0.2 C as a, _. :E -0.3
□: -0.4
-0.5 0 2
0.6
,i' -� 0.5 ca □ E .. 0 C � 0.4 � as ·s;: a, C 0.3 � --
• as "'Cl C as U) 0.2 e uj a, g> 0.1 • as a:
t
0 --
0 2
I
l □ •
--L Cl □
□ I □
l •
•
♦ I
7---+
- - +
♦
•
3 4 5 6 7 8 9 1 0 1 1 1 2 1 3 1 4 1 5
Successive Data Links
Figure B-3: TWS Mean Range Rate Errors
l - --t
l ____ •
I l + e flight 1
□ flight 2 ♦ flight 3 A flight 4
I
♦ ♦ t-l
1 6 1 7 1 8 1 9
e flight 1 - □ flight 2 ♦ flight 3
1 A flight 4 t
I + � l l __ • ♦
I • □ +-. It! ID D'
1D
□
i -- ----t- ♦
I 3 4 5 6 7 8 9 1 0 1 1 1 2 13 1 4 1 5 1 6 1 7
Successive Data Links
Figure B-4: TWS Range Error Standard Deviation
Appendix B 48
20
1 8

0.7 ...-----,-,--,--��-�------------------
S' -� 0.6 ai E
l o.5
C .2 J 0.4 Cl)
C
"C
� 0.3 C a, en .! 0.2 a, a: Cl) 0)
; 0.1 -a:
1 • • ·
•
•
♦
,- ♦ -
•·
e flight 1 □ flight 2 ♦ flight 3
_ A flight 4
0 1 2 3 4 5 6 7 8 9 1 0 1 1 1 2 1 3 1 4 1 5 1 6 1 7 1 8 1 9 20 21 22 23 24 25 26 27 28 Successive Data Links
Figure B-5: STT Range Rate Error Standard Deviation
0.6 • S' Cl) I • t 1 -� A 1 0.5 • • e flight 1 .. ♦ □ flight 2 0
□ .s. ♦ • ♦
♦ flight 3 C • ♦ � 0.4 I A flight 4 al ·; Cl) C "C ; 0.3 • ·• "C C
s en ♦ o 0.2 • .. • uj 9 ID .! •
� D al a: A a, 0.1
□ □1
• • • 0) C • t a, ♦ • • a: □
♦ 0 0 2 3 4 5 6 7 8 9 1 0 1 1 1 2 1 3 1 4 1 5 1 6 1 7 1 8
Successive Data Links
Figure B-6: TWS Range Rate Error Standard Deviation
49 Appendix B

APPENDIX C
Ensemble Averages for Errors in STT and TWS
50

Table C-1 : Ensemble Averages for STT Range Rate Errors
I'
Run Flight 1 Flight 2 Flight 3 Flight 4
1 st -0. 1 82 -0.01 8 -0. 1 87 0.001 2nd -0.009 0.017 0.403 0.000 3rd -0.098 -0.03 1 -0. 1 79 0.001 4th 0.001 -0.014 0.227 -0.003 5th 0.01 1 0.000 0.4 1 1 -0.001 6th -0.048 - 1 .000 -0.398 0.000 7th NIA -0. 1 33 -0.904
Standard 0.074 0.370 0.345 0.342 Deviation
Table C-2: Ensemble Averages for TWS Range Errors
Run Flight 1 Flight 2 Flight 3 Flight 4
1 st 0.017 -0.040 -0. 109 0.002 2nd 0. 179 0.350 0.012 -0. 152 3rd 0.07 1 0.035 0.039 0.069 4th 0.023 0.0 1 1 -0. 103 0.00 1 5th NIA NIA -0.3 1 8 0.043 6th NIA NIA -0.285 NIA
Standard 0.075 0. 177 0. 148 0.086 Deviation
Table C-3: Ensemble Averages for TWS Range Rate Errors
Run Flight 1 Flight 2 Flight 3 Flight 4
l st 0.034 -0.093 -0.09 1 0.030 2nd 0. 1 12 0.010 0.004 -0.992 3rd 0. 163 0.040 -0.073 -0.046 4th -0.014 0.000 -0. 108 -0.008 5th NIA NIA -0.562 0. 125 6th NIA NIA -0.252 NIA
Standard 0.079 0.058 0.205 0.459 Deviation
51 Appendix C

APPENDIX D
Track File, Data Link, and Projected Data Link Errors for Flight 4
52

0.6 -r----,------,------i----..... --..... --""!"'---..--------..
0.2 , ;, -� cii 0
0 -0.2 .s E -o.4 uj 8, -0.6 C a,
a: -0.8
-1
---TWS Track File • Data Links
Projected Data Link
-1 .2 .._ _______________________________ ,,_, -10 0 1 0 20 30 40 50 60 70 80 90 1 00 1 1 0
Time (normal ized)
Figure D-1 : Run 4 Range Errors
0.4 ..-------.---------�-----,---""!"'---..-----.-----.. 0.2
;, o �--- --.C I"=-'��-� � -� 1 -0.2 ---t------il----+-+--- ---
0 C ';;' -0.4 ---------1---+---+---<--l-
+- -
E ... --- rws Track File � -0.6 _____,.__-----1--+----+-----+----+-----+------+---------+-----l >-+-----
Cl • Data Links C � _0_8 ♦ Projected
-1 .2 ..,_ _____ ....,, __ ..,_ __ ... _____ ...., __ ...,. __ ...,.. __ ..,__...,. __ ...., __ .,. - 10 0 1 0 20 30 40 50 60 70 80 90 1 00 1 1 0
Time (normalized)
Figure D-2: Run 4 Range Rate Errors
53 Appendix D

1 . 1
0.9
:a- 0.8 ---Cl) .!!! 0.7
0.6 ... 0 ..s
0.5 e 0.4 uj Cl) 0.3 C) C a, a: 0.2 I
0. 1
0
-0. 1 -1 0
1 .2
1 -
:a- 0.8 Cl) .!!!
... 0.6 0 ..s e 0.4 uj Cl) C) C a, 0.2 a:
0
-0.2 -1 0
Appendix D
-I
0
0
1 0
�
I
1 0
-sn Track File • Data Links ♦ Projected Data Links J � - I
-I- L
r +-
�
20 30 40 50 60 70 80 90
Time (normalized)
Figure D-3: Run 6 Range Errors
20 30 40 50 60
Time (normalized)
-sn Track File • Data Links ♦ Projected Data Links
70
I �
t
80 90
Figure D-4: Run 6 Range Rate Errors
54
1 00 1 1 0
1 00 1 1 0

0.4 .--------- ---ir-----!"--"""!"'"-------------------
0.2
� 0
-� l -0.2 0 C ';;;' -0.4 2 w a> -0.6 c,, C
a: -0.8
-1
-STT Track File
I 1
• Data links �rojected Data links
t -1 .2 -------------------------------------
-10 0 1 0 20 30 40 50 60 70 80 90 100 1 1 0
Time (normalized)
Figure D-5 : Run 8 Range Errors
1 .2 -.---------!"--"""!"'"------------------------...
0.8
� 0.6
-� "ii 0.4
0 0.2
0 0 .E -0.2 Q) g, -0.4
a: -0.6
-0.8
-1
-STT Track File • Data links ♦ Projected Data links
- 1 .2 ,..,_ _______________________________ ....., __ _.
-1 0 0 1 0 20 30 40 50 60 70 80 90 1 00 1 1 0
Time (normalized)
Figure D-6: Run 8 Range Rate Errors
55 Appendix D

-0.4
-0.5
,; -0.6 Cl) -� E ... -0.7
u, ... -0.8
Cl) a, C ca -0.9 a:
-1
-1 . 1 -1 0 0
-0.4
-0.5
,; -0.6 .!:::!
E ... -0.7 0
u, ... 0
-0.8 ... ... a, C ca -0.9 a:
-1
-1 . 1 - 10 0
Appendix D
t
1 0
1 0
20 30 40 50 60
Time (normalized)
-STT Track File • Data Links ♦ Projected Data Links -
I
I
+-
70 80 90
Figure D-7: Run 10 Range Errors
20 30
I
40 50
I �STT Track File + • Data Links
♦ Projected Data Links
_J - j
... ...._I
60 70 80 90
Time (normalized)
Figure D-8: Run 10 Range Rate Errors
56
1 00 1 1 0
1 00 1 1 0

1 .2 1""'""---,---,,--'"""l"'"--..,....--,--�---�--""!"'I■ --------------
:;- 0.8 G) .!:t 'ii .. 0.6 0 s ti) .. 0
0.4 .. .. w G) C'I C ft! 0.2 -a:
0
-0.2 - 10 0 1 0 20 30 40 50 60
Time (normalized)
I_..,_ TWS Track File
• Data Links l ♦ Projected Data Links
I
70 80 90
Figure D-9: Run 14 Range Errors
1 00 1 1 0
1 .2 r----,--�--�--■■!""' ----------------------.
:;- 0.8 -� 'ii .. 0 s ti)
.. 0.4 w G) C'I C l 0.2
0
_..,_ TWS Track File • Data Links ♦ Projected Data Links
-0.2 ._ _________________________________ ___.,
- 10 0 1 0 20 30 40 50 60 70 80 90 100 1 1 0
Time (normalized)
Figure D-10: Run 14 Range Rate Errors
57 Appendix D

VITA
Cassidy Norman earned a Bachelor of Science degree in Aerospace Engineering from the University of Texas at Austin in 1993. From 199 1 to 1993, he worked for four semesterlong periods at NASA/JSC in both the Engineering and Mission Operations Directorates as part of the Cooperative Engineering Education Program. He had been accepted as a graduate student at the University of Texas as part of the Graduate Cooperative Engineering Education Program when he was selected to attend Aviation Officers Candidate School (AOCS) in Pensacola, Florida. In October of 1993, he graduated as a Naval Officer and the Distinguished Graduate of AOCS Class 10-93.
After Primary Flight Training flying T-34' s in Texas, Intermediate Jet Training flying T-2' s in Mississippi, and Advanced Jet Training flying T-45' s in Texas, ENS Norman was winged as a Naval Aviator in 1996 and was assigned to VFA- 1 25 in California, where he learned to fly the F/A- 18 Hornet. Immediately after completing Hornet training, he reported to VFA- 192 on deployment out of NAF Atsugi Japan. During his tour with the Golden Dragons, LT Norman was embarked on two 6-month cruises on the USS Independence and one on the USS Kitty Hawk. The latter two cruises supported Operation Southern Watch, in which LT Norman flew 40 missions over Iraq.
LT Norman left his Fleet tour 5 months early to report to United States Naval Test Pilot School (Class 1 1 8) . After a year of flying in Maryland and completing a capstone test project in Spain, LT Norman graduated as a Naval Test Pilot and was assigned to VX-30 as a Naval Test Pilot in Point Mugu, California. F�r over two years, he served as the AMRAAM and Improved Tactical Air Launched Decoy (IT ALD) Project Officer. He also served as Project Officer for an envelope-expanding ALQ- 1 67 Towed Decoy Project and a special project involving the DC- 130A in direct support of Operation Iraqi Freedom. He flew the F- 14A-D and the F/A-1 8A-F as test pilot for over 30 test projects, involving several weapons and systems integration tests.
LT Norman is currently completing degree requirements for a Master of Science degree in Aviation Systems at the University of Tennessee Space Institute. In summer of 2003, he will be reporting to Carrier Air Wing 1 7 in Virginia as the Strike Operations Officer.
58