Optimization of Bioactive Metabolites production by a...
15
Transcript of Optimization of Bioactive Metabolites production by a...

Biotechnology 14 (5): 211-224, 2015ISSN 1682-296X© 2015 Asian Network for Scientific Information Asian Network for Scientific Information
ans net.RESEARCH ARTICLE OPEN ACCESS
DOI: 10.3923/biotech.2015.211.224
Optimization of Bioactive Metabolites Production by a Newly Isolated MarineStreptomyces sp. Using Statistical Approach
1Attiya Hamed Mohamedin, 2Noura El-Ahmady El-Naggar, 1Abd El-Dayem A. Sherief and1Suzan Mohamed Hussien1Department of Botany, Faculty of Science, Mansoura University, Egypt2Department of Bioprocess Development, Genetic Engineering and Biotechnology Research Institute,City of Scientific Research and Technological Applications, Alexandria, Egypt
A R T I C L E I N F OArticle History:Received: July 06, 2015Accepted: September 07, 2015
Corresponding Author:Noura El-Ahmady Ali El-NaggarDepartment of Bioprocess Development,Genetic Engineering and BiotechnologyResearch Institute,City of Scientific Research andTechnological Applications,Alexandria, Egypt
A B S T R A C TThe newly isolated actinomycetes strain namely M19 was isolated from marinesediment and exhibited antibacterial activity against multidrug-resistantStaphylococcus epidermidis. It was identified on the basis of morphological,cultural, physiological and biochemical properties, together with 16S rRNAsequence as Streptomyces psammoticus strain M19 and sequencing product wasdeposited in the GenBank database under accession number KT160249. Fifteenfactors including starch, KNO3, K2HPO4, yeast extract, NaCl, MgSO4, CaCO3,FeSO4, pH, temperature, agitation speed, medium volume, inoculum size, inoculumage and fermentation time had been examined for their significance on theproduction of bioactive metabolites using Plackett-Burman design. Out of thefifteen factors; agitation speed, yeast extract, NaCl and KNO3 were selected due totheir significant effects on the production of bioactive metabolites and the optimallevels of these variables and the effect of their interactions on bioactive metabolitesproduction were determined by using central composite design. As a result, cultureconditions and a medium of the following formula were predicted to be theoptimum for production of extracellular bioactive metabolites in the culture filtrateof Streptomyces psammoticus strain M19: Starch 20 g, KNO3 1.5 g, K2HPO4 0.5 g,yeast extract 0.2 g, NaCl 0.5 g, MgSO4 0.1 g, CaCO3 3 g, FeSO4 0.01 g, pH 6.5,temperature 25°C, agitation speed (125 rpm minG1), medium volume 75 mL,inoculum size 2% (v/v), inoculation age 48 h and fermentation time 5 days. Theantagonistic activity produced from the optimized culture conditions againstmultidrug-resistant Staphylococcus epidermidis, showed about 1.37 fold increasethan that obtained from the un-optimized medium.
Key words: Streptomyces sp., bioactive metabolites, Plackett-Burman design,central composite design, 16S rRNA, scanning electron microscope
INTRODUCTION
New drugs especially antibiotics had been needed toreverse the spreading of antibiotic resistant pathogens whichcause infectious diseases and causes reduction in effectivenessof drug in curing of patients (Vimal et al., 2009).Staphylococci can cause a wide variety of disease either
through the production of toxins or invasion. Their infectionmay be due to cuts in the skin, direct skin to skin contact ordue to food contaminations. Staphylococci are becomingresistance to many commonly used antibiotics includingpenicillin. With the emergence of microorganisms thatbecoming resistance to available antibiotics that already hadbeen marketed, the need for discovering novel drugs is real
211www.ansinet.com | Volume 14 | Issue 5 | 2015 |

Biotechnology 14 (5): 211-224, 2015
(Levy, 2002). Staphylococcus epidermidis is a commonbacterium that is often above the skin and in the nose ofhealthy people.
Filamentous bacteria that belong to the orderActinomycetales, especially Streptomyces andMicromonospora strains have ability to produce novelantibiotics (Kishore, 2011) as they produce over two third ofthe clinically useful antibiotics of natural origin (Fenical andJensen, 2006). Most Streptomyces sp. produce array ofantibiotics including amino glycosides, anthracyclines,glycopeptides, β-lactam, polyenes, polyether, tetracyclines,chloramphenicol, rifamycins and other clinically importantantibiotics (Singh, 2009).
It has been shown that marine actinomycete species arephysiologically and phylogenetically distinct from theirterrestrial relatives, they can possess specific adaptations to theocean environment (e.g., to high salinity and pressure) andwere found to represent a rich source for novel, chemicallydiverse bioactive secondary metabolites with potentialapplications in antimicrobial and anticancer therapy(Bhatnagar and Kim, 2010).
The optimization of fermentation conditions, particularlyphysical and nutritional parameters by classical methods istime consuming, laborious and expensive; in addition, itignores the combined interactions among different variables(Li et al., 2009). Statistical approaches for the optimization ofmedia has eliminated the drawbacks of classical methods(Salihu et al., 2011). Therefore, in recent years, numbers ofstatistical designs were used to search the key factors rapidlyfrom a multivariable system, such as full factorial or Plackett-Burman design (Plackett and Burman, 1946) and responsesurface methodology (Khuri and Mukhopadhyay, 2010).Response surface methodology design allows determination ofthe effect between variables with a minimum number ofexperiments and evaluates the relative significance of severalvariables simultaneously. The components that havesignificant effect on antibiotic production were identified andthen the optimum values of these components weredetermined.
In this study, we have designed an optimization strategyto study the effect of the different fermentation variables andtheir interactions on the bioactive metabolites productionfrom marine Streptomyces sp. M19 against Staphylococcusepidermidis and to identify M19 isolate using a combinationof phenotypic and genotypic characteristics.
MATERIALS AND METHODS
Isolation and culture conditions of actinomycetes: This wasconducted by the soil dilution-plate technique (Johnson et al.,1960). The serial dilutions of the sea sediment samplescollected from Sharm El-Sheikh, South Sinai, Egypt weremade within sterile sea water (Kim et al., 2005). The seriallydiluted samples were spread over the Kuster’s agar medium(Baskaran et al., 2011). The agar plates were incubated at30°C for 7 days and the different colonies were picked up andpure culture was maintained on slopes containing starch-nitrateagar medium or stored in 20% glycerol at -20°C.
Screening of actinomycetes for antimicrobial activities: Theantimicrobial activities were tested against 8 organismsnamely: Staphylococcus aureus, Staphylococcus epidermidis,Bacillus subtilis, Pseudomonas aeruginosa, Escherichia coli,Proteus vulgaries, Shigella dysenteriae and Candida albicans.These clinically isolated strains were kindly provided by theDepartment of Medical Microbiology and Immunology,Faculty of Medicine, Mansoura University, Mansoura,Egypt.
Preparation of actinomycete inoculum: Two-hundred andfifty milliliter erlenmeyer flasks containing 50 mL of starchnitrate broth were inoculated with three disks of 9 mmdiameter 7 days old Streptomyces culture grown on starchnitrate agar medium. The flasks were incubated for 2 days ina rotary shaker (150 rpm) at 30°C and used for the subsequentexperiments (El-Naggar and Abdelwahed, 2012).
Fermentation conditions: The bioactive metabolitesproduction by Streptomyces sp. M19 was conducted in 250 mLErlenmeyer flask with 50-75 mL of the production medium(g LG1: Starch 20, KNO3 2, K2HPO4 1, MgSO4.7H2O 0.5, NaCl0.5, CaCO3 3, FeSO4.7H2O 0.01 and distilled water up to 1 L).The production medium had adjusted to pH of 6.5 using 1.0 MHCl and sterilized at 121°C for 20 min. It had been inoculatedwith 2-4% (v/v) of the inoculum. The inoculated flasks wereincubated in a rotatory incubator shaker at 150-200 rpm at25-30°C for the fermentation period of 5-7 days. After thespecified incubation time for each set of experimental trials,the mycelium was collected by centrifugation. The supernatantwas used for the analysis of antimicrobial activity.
Characterization of the Streptomyces isolate: The selectedisolate was characterized using cultural, morphological andphysiological methods (Shirling and Gottlieb, 1966). Furthercharacterization was done with 16S rRNA analysis.
Morphological characterization: The morphology of thespore chain and the spore surface ornamentation of theStreptomyces sp. M19 were examined on inorganic salt/starchagar (ISP medium 4) after 14 days at 30°C. The gold-coateddehydrated specimen of actinomycete spores were examinedat different magnifications with scanning electron microscope(SEM, Joel ISM 5300 at the Electron Microscope Unit,Faculty of Agriculture, Mansoura University) (Kumar et al.,2011).
Cultural characteristics: Aerial spore-mass color, substratemycelia pigmentation and the production of diffusiblepigments had been observed on yeast extract-malt extract agar(ISP medium 2), oatmeal agar (ISP medium 3), inorganic saltstarch agar (ISP medium 4), glycerol-asparagine agar (ISPmedium 5) peptone-yeast extract iron agar (ISP medium 6)and tyrosine agar (ISP medium 7) as described by Shirlingand Gottlieb (1966). All plates were incubated at 30°C for14 days.
212www.ansinet.com | Volume 14 | Issue 5 | 2015 |
Biotechnology 14 (5): 211-224, 2015
Physiological (biochemical) properties: The ability of theisolate to utilize different carbon sources like L-inositol,D-xylose, D-fructose, D-galactose, D-mannitol, maltose,lactose and sucrose was tested on plates containing ISP basalmedium 9 (Shirling and Gottlieb, 1966) supplemented with afinal concentration of 1% of the tested carbon sources. Theplates were incubated at 30°C and results were recorded after14 days. Melanoid pigment production was examined onpeptone-yeast extract-iron agar (ISP medium 6), tyrosine agar(ISP medium 7) and tryptone-yeast extract broth (ISPmedium 1) (Homans and Fuchs, 1970).
Liquefaction of gelatin was evaluated according toGordon and Smith (1949) using gelatin-peptone medium andthe capacity to decompose cellulose was tested on Hutchinsonliquid medium containing stripes of Whatman filter paper No.1following the method of Crawford et al. (1993). The ability ofstrain to produce α-amylase (amylolytic activity) wasdetermined by streaking the spore suspension of the isolateonto the surface of starch-nitrate agar medium plates andincubated at 30°C for 7 days. After incubation, the plate isflooded with Gram's iodine solution and zone of clearance wasobserved (Kokare et al., 2004). The ability of actinomyceteisolate to grow at different concentrations of NaCl was testedusing starch-nitrate agar medium supplemented with 1-12%NaCl (Tresner et al., 1968). The ability to coagulate or topeptonize milk had determined as described by Kokare et al.(2004). The ability of the isolate to inhibit the growth of sevenbacterial strains; Staphylococcus aureus, Staphylococcusepidermidis, Bacillus subtilis, Pseudomonas aeruginosa,Escherichia coli, Proteus vulgaris, Shigella dysenteriae andCandida albicans strain was determined.
16S rRNA sequencing: The preparation of genomic DNA ofthe strain was conducted in accordance with the methodsdescribed by Sambrook et al. (1989). The PCR amplificationreaction was performed in a total volume of 100 μL, whichcontained 1 μL DNA, 10 μL of 250 mM deoxyribonucleotide5'-triphosphate (dNTP’s), 10 μL PCR buffer, 3.5 μL 25 mMMgCl2 and 0.5 μL Taq polymerase, 4 μL of 10 pmol (each)forward 16SrRNA primer 27f (5'-AGAGTTTGATCMTGCCTCAG-3') and reverse 16SrRNA primer 1492 r (5'-TACGGYTACCTTGTTACGACTT-3') and water was added up to100 μL. The PCR-apparatus was programmed as follows:5 min denaturation at 94°C, followed by 35 amplificationcycles of 1 min at 94°C, 1 min of annealing at 55°C and 2 minof extension at 72°C, followed by a 10 min final extensionat 72°C. The PCR reaction mixture was then analyzed viaagarose gel electrophoresis and the remaining mixture waspurified using QIA quick PCR purification reagents(Qiagen, USA). The purified PCR product was sequenced byusing two primers, 518F, 5'-CCA GCA GCC GCG GTA ATACG-3' and 800R, 5'-TAC CAG GGT ATC TAA TCC-3'.Sequencing was performed by using Big Dye terminator cyclesequencing kit (Applied BioSystems, USA). Sequencingproduct was resolved on an Applied Biosystems model3730XL automated DNA sequencing system (AppliedBioSystems, USA).
Sequence alignment and phylogenetic analysis: The partial16S rRNA gene sequence (1425 bp) of strain M19 was alignedwith the corresponding 16S rRNA sequences of the typestrains of representative members of the genus Streptomycesretrieved from the Genbank, EMBL, DDBJ and PDBd a t a b a s e s b y u s i n g B L A S T p r o g r a m(blast.ncbi.nlm.nih.gov/Blast.cgi) (Altschul et al., 1997) andthe software package MEGA4 version 2.1 (Tamura et al.,2011) was used for multiple alignment and phylogeneticanalysis. The phylogenetic tree was constructed via thebootstrap test of neighbor-joining algorithm (Saitou and Nei,1987) based on the 16S rRNA gene sequences of strain M19and related organisms.
Optimization of process parameters: The optimizationprocess by statistical approach was carried out by two steps.The first step was to identify the components of mediumwhich have a significant effect on the production of bioactivemetabolites using the Plackett-Burman Design (PBD). Thesecond step was to identify their interaction and optimumconcentrations using Central Composite Design (CCD)(Ghribi et al., 2012).
Selection of the significant variables using Plackett-Burman design: This design allows the determination of themain effects between variables with a minimum number ofexperiments and evaluates the relative significance of severalvariables simultaneously (Fang et al., 2010). In general thisdesign is a two factorial one, which identifies the criticalparameters required for elevated antibiotic production byscreening n variables in n+1 experiments (Plackett andBurman, 1946).
A total of 15 independent (assigned) and four unassignedvariables (commonly referred as dummy variables) werescreened in Plackett–Burman experimental design of 20 trials(Table 1). Dummy variables (D1, D2, D3 and D4) are used toestimate experimental errors in data analysis. Each variable isrepresented at two levels, high and low denoted by (+) and (-),respectively. The variables chosen for the present study werestarch, KNO3, K2HPO4, yeast extract, CaCO3, MgSO4, NaCl,FeSO4, inoculum size, inoculum age, fermentation time,medium volume, agitation speed, pH and temperature(Table 1). It is assumed that the factors have no interactionsand a first-order multiple regression models are appropriate:
Y = β0+3βi Xi (1)
Where:Y = Predicted responseβ0 = Intercept termβi = Regression coefficientXi = Coded variables
Response surface methodology: The interaction effectsbetween various significant variables which exerted an effecton bioactive metabolites production were optimized by centralcomposite design (Chen et al., 2011). In this study, theexperimental design consisted of 30 trials and the independentvariables were studied at 5 different levels, -2, -1, 0, +1 and
213www.ansinet.com | Volume 14 | Issue 5 | 2015 |
Biotechnology 14 (5): 211-224, 2015
+2. All the experiments were done in duplicate and theaverage of antimicrobial activities obtained were taken as thedependent response (Y). Predicted activity was calculatedusing the following second order polynomial equation:
(2)2
0 i i ii i ij i ji ii ij
Y X X X X
Where:Y = Predicted responseβ0 = Model constantβi = Linear coefficientsβii = Quadratic coefficientsβij = Interaction coefficientsXi = Coded levels of independent variables
Statistical analysis: Minitab14 had used for experimentaldesigns. The experimental data obtained had subjected tomultiple linear regressions using Microsoft Excel 2007 toevaluate the analysis of variance (ANOVA) and to estimatemain effects, t-value, p- value and the confidence levels. Thequality of the model was expressed via the correlationcoefficient (R) and the adjusted R2. The statistical softwarepackage, STATISTICA software (Version 8.0, StatSoft Inc.,Tulsa, USA) was used to plot the three-dimensional surfaceplots, in order to illustrate the relationship between theresponses and the experimental levels of each of the variablesutilized in this study.
RESULTS AND DISCUSSIONS
Antimicrobial activity: The present study was designed toinvestigate the antimicrobial properties of a marineactinomycete namely Streptomyces sp. M19. The antimicrobialactivity of the secondary metabolites was tested against anumber of Gram-positive and Gram-negative bacteria inaddition to Candida albicans (Table 2). There was a strongactivity against Staphylococcus epidermidis. The diameter ofinhibition zones obtained with Staphylococcus epidermidis,Bacillus subtilis, Shigella dysenteriae and C. albicans were 30,
Table 1: Experimental independent variables at two levels used for theproduction of bioactive metabolites by Streptomyces isolate M19using Plackett-Burman design
Levels---------------------------
Codes Independent variables -1 +1X1 Starch (g LG1) 10 20X2 KNO3 (g LG1) 1 2X3 K2HPO4 (g LG1) 0.5 1X4 Yeast extract (g LG1) 0 0.1X5 NaCl (g LG1) 0.1 0.5X6 MgSO4.7H2O (g LG1) 0.1 0.5X7 CaCO3 (g LG1) 1 3X8 FeSO4 (g LG1) 0.01 0.02X9 pH 6.5 7.5X10 Temperature (°C) 25 30X11 Agitation speed (rpm) 150 200X12 Medium volume (mL/250 mL flask) 50 75X13 Inoculum size (%, v/v) 2 4X14 Inoculum age (h) 48 60X15 Fermentation time (d) 5 7
35, 10 and 20 mm, respectively. There was no activity againstProteus vulgaris, Pseudomonas aeruginosa, E. coli andStaphylococcus aureus.
Characterization of the selected isolate: The Streptomycessp. M19 was characterized by morphological, cultural,biochemical methods and 16S rRNA analysis.
Cultural characteristics: The cultural characteristics of theisolate are represented in Table 3. Streptomyces sp. M19exhibited moderate growth on tryptone-yeast extract agar(ISP-1), yeast extract-malt extract-agar (ISP-2) and inorganicsalt starch agar (ISP-4). The growth was well on Kuster’s agarmedium (Fig. 1a), starch-nitrate agar medium, glycerol-asparagine agar medium (ISP-5), peptone-yeast extract ironagar medium (ISP-6) and tyrosine agar medium (ISP-7), whileit was poor on nutrient agar. Pale green aerial mycelium wasfound on Kuster’s agar medium, starch nitrate agar mediumand tryptone yeast agar medium whereas the aerial myceliumwas white on Tyrosine agar medium, glycerol asparaginemedium and yeast malt extract agar medium and beige coloron peptone-yeast extract iron agar and greenish beige oninorganic salt starch agar medium. No aerial mycelium hadbeen formed on nutrient agar medium. The substrate myceliumranges from white to beige, not distinctive or yellowish beigeor golden on different tested media. Sivakumar (2001)reported that the cultural properties had been used as markersby which an individual strain can be recognized.
Morphological characteristics: The strain exhibited typicalmorphological characteristics of the genus Streptomyces.Morphological observation of the isolate showed that aerialand vegetative mycelia were abundant and well developedwith smooth surfaced spores showing irregular size andelongated or spherical shape (Fig. 1b). The microscopicexamination of the selected isolate revealed that aerial myceliawere morphologically related to section rectiflexibles.
Biochemical characterization: The details of biochemicaland physiological properties of the isolate are given inTable 4. The isolate exhibited positive response to starchhydrolysis, casein hydrolysis but negative response to gelatinliquefaction, melanin production and cellulose decomposition.The utilization of carbon sources could be used as a tool forspecies determination (Pridham et al., 1958). The tested isolatewas able to utilize D-glucose, D-xylose, ribose and D-mannitol and can’t utilize dextrose, L-arabinose, lactose, L-inositol,
Table 2: Antimicrobial activities of the bioactive metabolites produced by themarine Streptomyces isolate M19
Microorganisms Diameter of inhibition zone (mm)Gram-positive bacteriaStaphylococcus epidermidis 30Staphylococcus aureus -Bacillus subtilis 35Gram-negative bacteriaProteus vulgaries -Shigella dysenteriae 10Pseudomonas aeruginosa -Escherichia coli -YeastCandida albicans 20
214www.ansinet.com | Volume 14 | Issue 5 | 2015 |

Biotechnology 14 (5): 211-224, 2015
(a)
(b)
Fig. 1(a-b): Phenotypic characteristics of selected antagonistic actinomycetes strain, (a) Typical growth pattern of the marineisolate on Kuster’s agar medium and (b) Scanning electron micrograph showing the spore-chain morphology andspore-surface ornamentation of the strain grown on inorganic salt-starch agar medium for 14 days at 30°C atmagnification of 5000 X, 10000 X
Table 3: Cultural characteristics of the selected Streptomyces isolate M19Colors------------------------------------------------------------------------------------------------------------
Mediums Growth Aerial mycelium Substrate mycelium Diffusible pigmentKuster's agar medium Well Pale green White Non pigmentedStarch-nitrate agar Well Pale green White Non pigmentedTryptone yeast extract agar (ISP medium 1) Moderate Pale green Beige Non pigmentedYeast extract malt agar (ISP medium 2) Moderate White Golden Non pigmentedInorganic salt starch agar (ISP medium 4) Moderate Greenish beige Not-distinctive Non pigmentedGlycerol-asparagine agar (ISP medium 5) Well White White Non pigmentedPeptone-yeast extract iron agar(ISP medium 6) Well Beige Yellowish beige Non pigmentedTyrosine agar medium (ISP medium 7) Well White Beige Non pigmentedNutrient agar medium Poor Not distinctive Not distinctive Non pigmented
sucrose, D-galactose and D-raffinose. Optimum growth of theisolate occurred at the pH 6.5. The isolate exhibited salttolerance up to 11% with optimum growth at 6% NaCl;
accordingly, the isolate could be placed in the intermediate salttolerance group according to Tresner et al. (1968). The isolatehad no ability to produce any soluble pigments.
215www.ansinet.com | Volume 14 | Issue 5 | 2015 |

Biotechnology 14 (5): 211-224, 2015
Table 4: Summary of the cultural, morphological and physiological properties of the experimental actinomycete isolateCharacteristics IsolatesAerial mycelium on Kuster’s agar medium Pale greenSubstrate mycelium on Kuster's agar medium WhiteSpore chain morphology Suggestive to section rectiflexiblesSpore shape Spores are irregular in size and shape (Elongated or spherical with smooth surface)Melanin production -NaCl tolerance (w/v) Up to11%Growth on sole carbon sources (1%, w/v)D-glucose +D-xylose ++L-arabinose -Dextrose -Ribose +++D-mannitol +D-galactose -Lactose -L-inositol -D-raffinose -Sucrose -Enzyme activitiesAmylase (starch hydrolysis) +Cellulase (cellulose decomposition) -Casienase (casien hydrolysis) +Gelatinase (gelatin Liquefaction) -Antimicrobial activities againstE. coli, P. aeruginosa and S. aureus -B. subtilis, S. epidermidis, C. albicans and S. dysenteriae +
16S rRNA gene sequence comparisons and phylogeneticanalysis: The 16S rRNA gene sequence (1425 bp) wasdetermined for strain M19. A BLAST search (Altschul et al.,1997) of the Genbank database using this sequence showed itssimilarity to that of many species of the genus Streptomyces.A phylogenetic tree (Fig. 2) based on 16S rRNA genesequences of members of the genus Streptomyces wasconstructed according to the bootstrap test of neighbor-joiningalgorithm method of Saitou and Nei (1987) with MEGA4(Tamura et al., 2011). This tree shows the close phylogeneticassociation of strain M19 with certain other Streptomycesspecies. Phylogenetic analysis indicated that the strain M19consistently falls into a clade together with Streptomycesfulvissimus strain FHM275 (Genbank/EMBL/DDBJ accessionNo. KM438035.1), Streptomyces cinereorectus strain: NBRC14768 (GenBank/EMBL/DDBJ accession No. AB184619.1),Streptomyces clavuligerus strain MML2001 (GenBank/EMBL/DDBJ accession No. KF542656.1), Streptomyceshypolithicus strain PM262_DR006 (GenBank/EMBL/DDBJaccession No. JQ422166.1), Streptomyces aureofaciens JCM4624(GenBank/EMBL/DDBJ accession No. NR_112121.1)and Streptomyces psammoticus strain KP1404 (GenBank/EMBL/DDBJ accession No. GU166432.1).
On the basis of the collected data and in view of thecomparative study of the recorded properties of isolate M19 inrelation to the closest related species of the genusStreptomyces, it is most closely related to the type strains ofStreptomyces psammoticus (Goodfellow et al., 2012).Comparison of the morphological, cultural and physiologicalcharacteristics of strain M19 and its closest phylogeneticneighbours revealed significant similarities of the producedspore chains (section rectiflexibles), smooth spore surface and
irregular size and shape of spores. Aerial mass color in thegreen color series. Melanoid pigments are not formed inpeptone-yeast-iron agar, tyrosine agar or tryptone-yeast broth.No pigment is found in the medium in yeast-malt agar,oatmeal agar, salts-starch agar and glycerol-asparagine agar.D-glucose, D-mannitol are utilized for growth. No growth withL-arabinose, inositol and raffinose. Therefore, this strain wasidentified as Streptomyces psammoticus strain M19 and itssequencing product was deposited in the GenBank databaseunder accession number KT160249.
Screening of parameters using plackett- burman design:The experiment had been conducted in twenty runs to studythe effect of the selected factors on the production of bioactivemetabolites by Streptomyces psammoticus strain M19. Thedesign matrix selected for screening is shown in Table 5. Allthe trails were performed in duplicate and the average weretaken as response. The maximum bioactive metabolites activity (37 mm) was achieved in the run number 6, while theminimum bioactive metabolites activity (6 mm) was observedin the run number 19. The statistical analysis of Plackett-Burman design was performed (Table 6). The determinationcoefficient (R2) provides a measure of how much variability ofthe observed response can be explained by the experimentalfactors and their interactions. The R2 values will always be anumber between 0 and 1, with values close to 1 indicating agood degree of fit. In this design the value of R2 = 0.9919indicates that 99.19% of the variability of response was due tothe given variables and only 0.81% of the variation had notexplained by the independent variables. In addition, theadjusted R2 = 0.9618 had very high value which indicate ahigh significance of the model. The correlation coefficient
216www.ansinet.com | Volume 14 | Issue 5 | 2015 |

Biotechnology 14 (5): 211-224, 2015
Streptomyces hypolithicus strain HSM#10 (NR-044431.1)
Streptomyces clavuligerus strain MTCC 7037 (EU146061.1)
Streptomyces aureofaciens strain: NBRC 13183 (AB184322.1)
Streptomyces malaysiensis strain: ATB-11 (NR-114497.1)
Streptomyces avellaneus strain NBRC 13451 (NR-041138.1)
Streptomyces indiaensis strain IF5 (FJ951435.1)
Streptomyces avellaneus strain xsd08159 (FJ841075.1)
Streptomyces clavuligerus strain LCB69 (FJ867927.1)
Streptomyces rimosus strain MJM8796 (FJ799189.1)
Streptomyces sayamaensis strain: NBRC3519 (AB184778.2)
Streptomyces f ulvissimus strain ZG084 (GQ985452.1)
Streptomyces griseoplanus strain NRRL-ISP5009 (NR-118415.1)
Streptomyces sp. strain M19
Streptomyces f lavoviridis strain FHM275 (KM438035.1)
Streptomyces cinereorectus strain NBRC14768 (AB184619.1)
Streptomyces clavuligerus strain MML2001 (KF542656.1)
Streptomyces hypolithicus strain PM262-DR006 (JQ422166.1)
Streptomyces aureofaciens JCM4624 )NR-112121.1)
Streptomyces pasammoticus strain KP1404 (GU166432.1)
61
62
5
Fig. 2: Phylogenetic tree constructed via the bootstrap test of neighbor-joining algorithm based on the 16S rRNA gene sequencesof strain M19 and related species of the genus Streptomyces. Only bootstrap values above 50%, expressed as percentagesof 1000 replications, are shown at the branch points. GenBank sequence accession numbers are indicated in parenthesesafter the strain names. Phylogenetic analyses were conducted in the software package MEGA4, Bar 5 substitution pernucleotide position
Table 5: Twenty-trial Plackett–Burman experimental design for evaluation of fifteen independent variables with coded values along with the observed bioactivemetabolites activity
InhibitionTrials X1 X2 X3 X4 X5 X6 X7 X8 X9 X10 X11 X12 X13 X14 X15 D1 D2 D3 D4 zone (mm)1 1 1 -1 -1 1 1 1 1 -1 1 -1 1 -1 -1 -1 -1 1 1 -1 272 1 -1 -1 1 1 1 1 -1 1 -1 1 -1 -1 -1 -1 1 1 -1 1 333 -1 -1 1 1 1 1 -1 1 -1 1 -1 -1 -1 -1 1 1 -1 1 1 334 -1 1 1 1 1 -1 1 -1 1 -1 -1 -1 -1 1 1 -1 1 1 -1 345 1 1 1 1 -1 1 -1 1 -1 -1 -1 -1 1 1 -1 1 1 -1 -1 246 1 1 1 -1 1 -1 1 -1 -1 -1 -1 1 1 -1 1 1 -1 -1 1 377 1 1 -1 1 -1 1 -1 -1 -1 -1 1 1 -1 1 1 -1 -1 1 1 278 1 -1 1 -1 1 -1 -1 -1 -1 1 1 -1 1 1 -1 -1 1 1 1 299 -1 1 -1 1 -1 -1 -1 -1 1 1 -1 1 1 -1 -1 1 1 1 1 2610 1 -1 1 -1 -1 -1 -1 1 1 -1 1 1 -1 -1 1 1 1 1 -1 2211 -1 1 -1 -1 -1 -1 1 1 -1 1 1 -1 -1 1 1 1 1 -1 1 912 1 -1 -1 -1 -1 1 1 -1 1 1 -1 -1 1 1 1 1 -1 1 -1 2413 -1 -1 -1 -1 1 1 -1 1 1 -1 -1 1 1 1 1 -1 1 -1 1 2814 -1 -1 -1 1 1 -1 1 1 -1 -1 1 1 1 1 -1 1 -1 1 -1 3415 -1 -1 1 1 -1 1 1 -1 -1 1 1 1 1 -1 1 -1 1 -1 -1 2416 -1 1 1 -1 1 1 -1 -1 1 1 1 1 -1 1 -1 1 -1 -1 -1 1017 1 1 -1 1 1 -1 -1 1 1 1 1 -1 1 -1 1 -1 -1 -1 -1 1818 1 -1 1 1 -1 -1 1 1 1 1 -1 1 -1 1 -1 -1 -1 -1 1 3119 -1 1 1 -1 -1 1 1 1 1 -1 1 -1 1 -1 -1 -1 -1 1 1 620 -1 -1 -1 -1 -1 -1 -1 -1 -1 -1 -1 -1 -1 -1 -1 -1 -1 -1 -1 36X1-X15: Independent (assigned) variables, D1-D4: Dummy variables (unassigned), ‘1’: High level of variables, ‘-1’: Low level of variables
217www.ansinet.com | Volume 14 | Issue 5 | 2015 |
Biotechnology 14 (5): 211-224, 2015
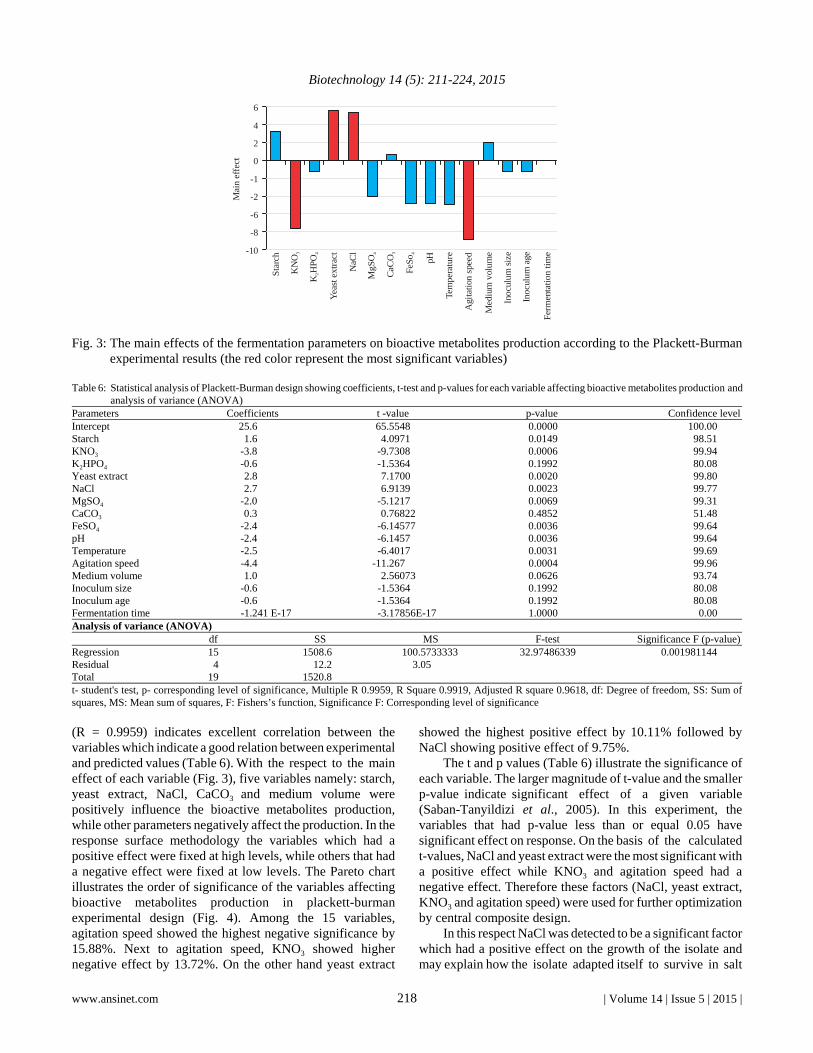
Fig. 3: The main effects of the fermentation parameters on bioactive metabolites production according to the Plackett-Burmanexperimental results (the red color represent the most significant variables)
Table 6: Statistical analysis of Plackett-Burman design showing coefficients, t-test and p-values for each variable affecting bioactive metabolites production andanalysis of variance (ANOVA)
Parameters Coefficients t -value p-value Confidence levelIntercept 25.6 65.5548 0.0000 100.00Starch 1.6 4.0971 0.0149 98.51KNO3 -3.8 -9.7308 0.0006 99.94K2HPO4 -0.6 -1.5364 0.1992 80.08Yeast extract 2.8 7.1700 0.0020 99.80NaCl 2.7 6.9139 0.0023 99.77MgSO4 -2.0 -5.1217 0.0069 99.31CaCO3 0.3 0.76822 0.4852 51.48FeSO4 -2.4 -6.14577 0.0036 99.64pH -2.4 -6.1457 0.0036 99.64Temperature -2.5 -6.4017 0.0031 99.69Agitation speed -4.4 -11.267 0.0004 99.96Medium volume 1.0 2.56073 0.0626 93.74Inoculum size -0.6 -1.5364 0.1992 80.08Inoculum age -0.6 -1.5364 0.1992 80.08Fermentation time -1.241 E-17 -3.17856E-17 1.0000 0.00Analysis of variance (ANOVA)
df SS MS F-test Significance F (p-value)Regression 15 1508.6 100.5733333 32.97486339 0.001981144Residual 4 12.2 3.05Total 19 1520.8t- student's test, p- corresponding level of significance, Multiple R 0.9959, R Square 0.9919, Adjusted R square 0.9618, df: Degree of freedom, SS: Sum ofsquares, MS: Mean sum of squares, F: Fishers’s function, Significance F: Corresponding level of significance
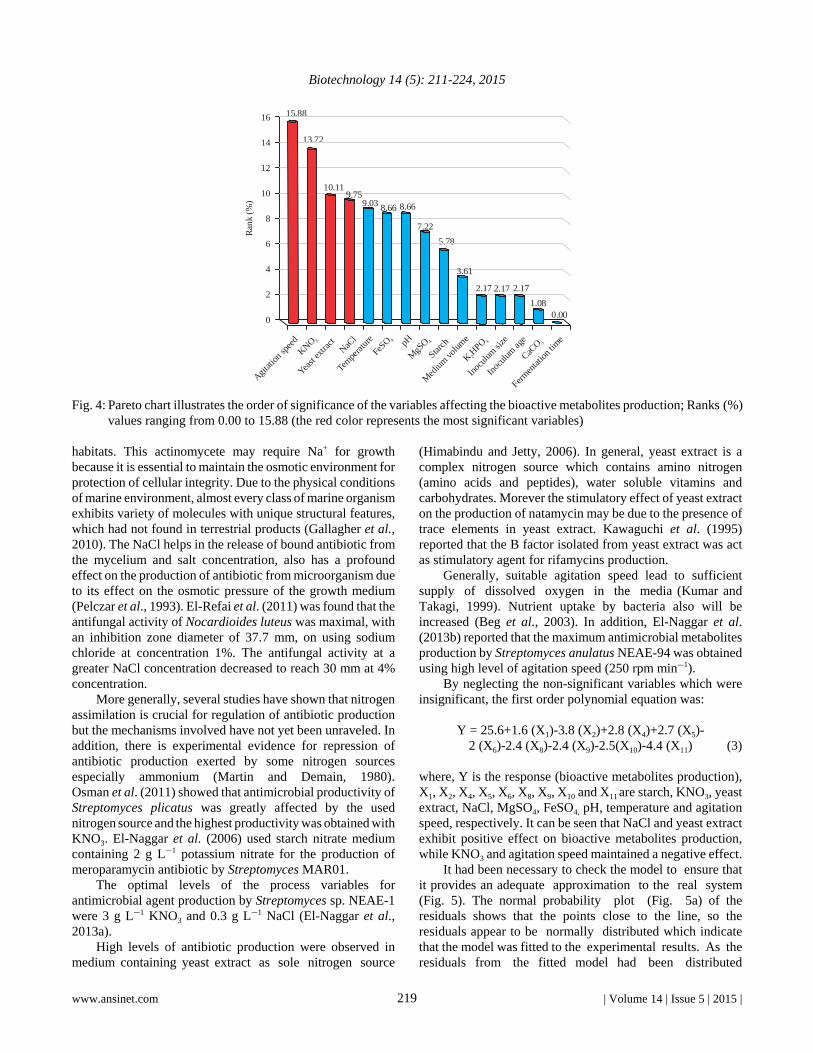
(R = 0.9959) indicates excellent correlation between thevariables which indicate a good relation between experimentaland predicted values (Table 6). With the respect to the maineffect of each variable (Fig. 3), five variables namely: starch,yeast extract, NaCl, CaCO3 and medium volume werepositively influence the bioactive metabolites production,while other parameters negatively affect the production. In theresponse surface methodology the variables which had apositive effect were fixed at high levels, while others that hada negative effect were fixed at low levels. The Pareto chartillustrates the order of significance of the variables affectingbioactive metabolites production in plackett-burmanexperimental design (Fig. 4). Among the 15 variables,agitation speed showed the highest negative significance by15.88%. Next to agitation speed, KNO3 showed highernegative effect by 13.72%. On the other hand yeast extract
showed the highest positive effect by 10.11% followed byNaCl showing positive effect of 9.75%.
The t and p values (Table 6) illustrate the significance ofeach variable. The larger magnitude of t-value and the smallerp-value indicate significant effect of a given variable(Saban-Tanyildizi et al., 2005). In this experiment, thevariables that had p-value less than or equal 0.05 havesignificant effect on response. On the basis of the calculatedt-values, NaCl and yeast extract were the most significant witha positive effect while KNO3 and agitation speed had anegative effect. Therefore these factors (NaCl, yeast extract,KNO3 and agitation speed) were used for further optimizationby central composite design.
In this respect NaCl was detected to be a significant factorwhich had a positive effect on the growth of the isolate andmay explain how the isolate adapted itself to survive in salt
6
4
2
0
-1
-2
-6
-8
-10
Mai
n ef
fect
Sta
rch
KN
O3
KH
PO2
4
Yea
st e
xtra
ct
NaC
l
MgS
O4
CaC
O3
pH
Tem
pera
ture
Agi
tatio
n sp
eed
Med
ium
vol
ume
Inoc
ulum
siz
e
Inoc
ulum
age
Ferm
enta
tion
tim
e
FeSo
4
218www.ansinet.com | Volume 14 | Issue 5 | 2015 |
Biotechnology 14 (5): 211-224, 2015
Fig. 4: Pareto chart illustrates the order of significance of the variables affecting the bioactive metabolites production; Ranks (%)values ranging from 0.00 to 15.88 (the red color represents the most significant variables)
habitats. This actinomycete may require Na+ for growthbecause it is essential to maintain the osmotic environment forprotection of cellular integrity. Due to the physical conditionsof marine environment, almost every class of marine organismexhibits variety of molecules with unique structural features,which had not found in terrestrial products (Gallagher et al.,2010). The NaCl helps in the release of bound antibiotic fromthe mycelium and salt concentration, also has a profoundeffect on the production of antibiotic from microorganism dueto its effect on the osmotic pressure of the growth medium(Pelczar et al., 1993). El-Refai et al. (2011) was found that theantifungal activity of Nocardioides luteus was maximal, withan inhibition zone diameter of 37.7 mm, on using sodiumchloride at concentration 1%. The antifungal activity at agreater NaCl concentration decreased to reach 30 mm at 4%concentration.
More generally, several studies have shown that nitrogenassimilation is crucial for regulation of antibiotic productionbut the mechanisms involved have not yet been unraveled. Inaddition, there is experimental evidence for repression ofantibiotic production exerted by some nitrogen sourcesespecially ammonium (Martin and Demain, 1980).Osman et al. (2011) showed that antimicrobial productivity ofStreptomyces plicatus was greatly affected by the usednitrogen source and the highest productivity was obtained withKNO3. El-Naggar et al. (2006) used starch nitrate mediumcontaining 2 g LG1 potassium nitrate for the production ofmeroparamycin antibiotic by Streptomyces MAR01.
The optimal levels of the process variables forantimicrobial agent production by Streptomyces sp. NEAE-1were 3 g LG1 KNO3 and 0.3 g LG1 NaCl (El-Naggar et al.,2013a).
High levels of antibiotic production were observed inmedium containing yeast extract as sole nitrogen source
(Himabindu and Jetty, 2006). In general, yeast extract is acomplex nitrogen source which contains amino nitrogen(amino acids and peptides), water soluble vitamins andcarbohydrates. Morever the stimulatory effect of yeast extracton the production of natamycin may be due to the presence oftrace elements in yeast extract. Kawaguchi et al. (1995)reported that the B factor isolated from yeast extract was actas stimulatory agent for rifamycins production.
Generally, suitable agitation speed lead to sufficientsupply of dissolved oxygen in the media (Kumar andTakagi, 1999). Nutrient uptake by bacteria also will beincreased (Beg et al., 2003). In addition, El-Naggar et al.(2013b) reported that the maximum antimicrobial metabolitesproduction by Streptomyces anulatus NEAE-94 was obtainedusing high level of agitation speed (250 rpm minG1).
By neglecting the non-significant variables which wereinsignificant, the first order polynomial equation was:
Y = 25.6+1.6 (X1)-3.8 (X2)+2.8 (X4)+2.7 (X5)-2 (X6)-2.4 (X8)-2.4 (X9)-2.5(X10)-4.4 (X11) (3)
where, Y is the response (bioactive metabolites production),X1, X2, X4, X5, X6, X8, X9, X10 and X11 are starch, KNO3, yeastextract, NaCl, MgSO4, FeSO4, pH, temperature and agitationspeed, respectively. It can be seen that NaCl and yeast extractexhibit positive effect on bioactive metabolites production,while KNO3 and agitation speed maintained a negative effect.
It had been necessary to check the model to ensure thatit provides an adequate approximation to the real system(Fig. 5). The normal probability plot (Fig. 5a) of theresiduals shows that the points close to the line, so theresiduals appear to be normally distributed which indicatethat the model was fitted to the experimental results. As theresiduals from the fitted model had been distributed
15.88
13.72
10.11
9.03 8.66 8.66
7.22
5.78
2.17 2.17 2.17
0.00
Starch
KNO 3
KHPO2
4
Yeast
extra
ctNaC
l
MgS
O 4
CaCO 3pH
Tem
perat
ure
Agitat
ion s
peed
Med
ium vo
lume
Inoc
ulum
size
Inoc
ulum
age
Fermen
tation
tim
e
FeSO 4
16
14
12
10
8
6
4
2
0
Ran
k (%
)
1.08
3.61
9.75
219www.ansinet.com | Volume 14 | Issue 5 | 2015 |

Biotechnology 14 (5): 211-224, 2015
2.0
1.5
1.0
0.5
0.0
-0.5
-1.0
-1.5
-2.0 -1.6 -1.2 -0.8 -0.4 0.0 0.4 0.8 1.2 1.6
Exp
ecte
d no
rmal
val
ue
Residuals
40
35
30
25
20
15
10
5
0 0 5 10 15 20 25 30 35 40
Obs
erve
d va
lues
Predicted values
1.6
1.2
0.8
0.4
0.0
-0.4
-0.8
-1.2
-1.6 0 5 10 15 20 25 30 35 40
Res
idua
ls
Predicted values
(a)
(b)
(c)
95% confidence
95% confidence
Fig. 5(a-c): (a) Normal probability plot of the residuals,(b) Correlation between the observed andpredicted values of the bioactive metabolitesactivity of Streptomyces sp. M19 determined bythe first-order polynomial equation and (c) Plot ofresiduals against predicted values for bioactivemetabolites production
normally, all the major assumptions of the model have beenvalidated. Figure 5b which presents a plot of predicted vsobserved values of response, showed a satisfactory correlationbetween the experimental values and predicted values wherein, the points gathered around the diagonal line indicatesthe good fit of the model. The residual plot (Fig. 5c) showsequal scatter of the residual data above and below the x-axis,indicating that the variance was independent of antimicrobialmetabolites production, thus supporting the adequency of themodel.
Table 7: Central composite design representing the response of antimicrobialmetabolites influenced by agitation speed (X1), KNO3 (X2), yeastextract (X3), NaCl (X4) and ranges of the variables along with thepredicted bioactive metabolites activities and residuals
Inhibition PredictedTrials X1 X2 X3 X4 zone inhibition zone Residuals1 0 2 0 0 28 28 02 -2 0 0 0 35 36 -13 0 -2 0 0 31 30 14 2 0 0 0 20 19 15 0 0 2 0 27 28 -16 0 0 0 0 41 41 07 0 0 -2 0 33 32 18 0 0 0 0 41 41 09 0 0 0 -2 33 33 010 0 0 0 2 29 29 011 1 1 -1 -1 26 27 -112 1 -1 1 -1 25 27 -213 1 1 -1 1 24 25 -114 1 1 1 -1 23 22 115 0 0 0 0 41 41 016 -1 -1 -1 -1 32 34 -117 1 -1 -1 1 26 27 -118 0 0 0 0 41 41 019 -1 1 1 1 31 32 -120 -1 -1 1 1 34 33 121 1 -1 1 1 24 25 -122 -1 -1 -1 1 31 32 -123 -1 1 -1 1 35 34 124 -1 1 -1 -1 37 36 125 1 1 1 1 21 20 126 -1 1 1 -1 35 35 027 0 0 0 0 41 41 028 0 0 0 0 41 41 029 1 -1 -1 -1 29 28 130 -1 -1 1 -1 37 35 2Level rpm g LG1 g LG1 g LG1
-2 100 0.5 0.0 0.1-1 125 1.0 0.1 0.30 150 1.5 0.2 0.51 175 2.0 0.3 0.72 200 2.5 0.4 0.9
Optimization by response surface methodology: The centralcomposite design was employed to study the optimal levelsand interactions between the significant variables. Othervariables that not selected in central composite design weremaintained at constant level which gave maximum productionin Plackett-Burman design. A total of 30 experiments withdifferent combinations of agitation speed (rpm), NaCl, yeastextract and KNO3 concentration were evaluated in Table 7.Close similarities is evident between the measured inhibitionzones and the predicted ones (Table 7).
Multiple regression and analysis of variance (ANOVA):Multiple regression analysis had been used to analyze the data(Table 8). The goodness of the model was checked by thecoefficient of determination (R2) which was found to be0.9900 (Table 8). This indicates that the variation of sample99.00% had been attributed to the selected variables and only1% of the total variance couldn’t be explained by the model.A regression model have R2 value higher than 0.9 wasconsidered to have a very high correlation (Cao et al., 2012).
220www.ansinet.com | Volume 14 | Issue 5 | 2015 |

Biotechnology 14 (5): 211-224, 2015
Table 8: Statistical analysis of central composite design showing coefficients, t-test and p-values for each variable affecting bioactive metabolites productionand analysis of variance (ANOVA)
Parameters Coefficients t-value p-value Confidence levelIntercept 41.0000 78.8505 0.0000 100.00X1 -4.3333 -16.6676 0.0000 100.00X2 -0.5000 -1.9232 0.0737 92.63X3 -0.9167 -3.5258 0.0031 99.69X4 -1.0833 -4.1669 0.0008 99.92X1X2 -0.8750 -2.7480 0.0149 98.51X1X3 -0.8750 -2.7480 0.0149 98.51X1X4 0.1250 0.3926 0.7002 29.98X2X3 -0.8750 -2.7480 0.0149 98.51X2X4 -0.1250 -0.3926 0.7002 29.98X3X4 -0.1250 -0.3926 0.7002 29.98X1X1 -3.3958 -13.9635 0.0000 100.00X2X2 -2.8958 -11.9075 0.0000 100.00X3X3 -2.7708 -11.3935 0.0000 100.00X4X4 -2.5208 -10.3655 0.0000 100.00Analysis of variance (ANOVA)
df SS MS F-test Significance F (p-value)Regression 14 1199.533 85.6810 52.8170 3.55924E-10Residual 15 24.3333 1.6222Total 29 1223.867t- student's test, p: Corresponding level of significance, Multiple R 0.9900, R Square 0.9801, Adjusted R Square 0.9615, df: Degree of freedom, SS: Sum ofsquares, MS: Mean sum of squares, F: Fishers’s function, Significance F: Corresponding level of significance
Therefore, the obtained R2 value reflected a very good fitbetween the observed and predicted responses and implied thatthe model is reliable for antimicrobial metabolites productionin the present study.
The Fisher’s test (52.8170) and very low probability value(3.55924E-10) showed that the model had a highlysignificance values. The significance of each variable wasdemonstrated by t-values and p-values which are listed inTable 8. The p-values denotes the significance of thecoefficients and also important in understanding the pattern ofmutual interaction between the variables. It can be seen fromthe degree of significance that the linear coefficients of X1, X3
and X4 and the quadratic effect of the all independent variableshave a significance effect on the production. The probabilityvalues of the coefficients suggest that among the four variablesstudied X1, X2, X1, X3 and X2. X3 showed maximuminteraction between the two variables. On the other, the linearcoefficients of X2 and the interaction between X1, X4, X2, X4
and X3, X4 has no effect on bioactive metabolites production.In order to evaluate the relationship between the variables todetermine the maximum antimicrobial metabolites productioncorresponding to the optimum levels of X1, X2, X3 and X4 asecond- order polynomial model was proposed to calculate theoptimum level of these variables. By applying the multipleregression analysis on the experimental data, the second orderpolynomial equations that define the predicted response (Y) interms of the independent variables (X1, X2, X3 and X4) wasobtained:
(4)
1 2 3 4 1 2
1 3 1 4 2 3 2 4
1 2 3 23 4 2 2 2 4
Y = 41-4.33X -0.50X -0.91X -1.08X -0.875X X -
0. 875X X +0.125X X -0.875X X +0.125X X -
0.125X X -3.395X -2.895X -2.77X -2.52X
Where:Y = Predicted responseX1 = Coded value of agitation speedX2 = Coded value of KNO3
X3 = Coded value of yeast extractX4 = Coded value of NaCl
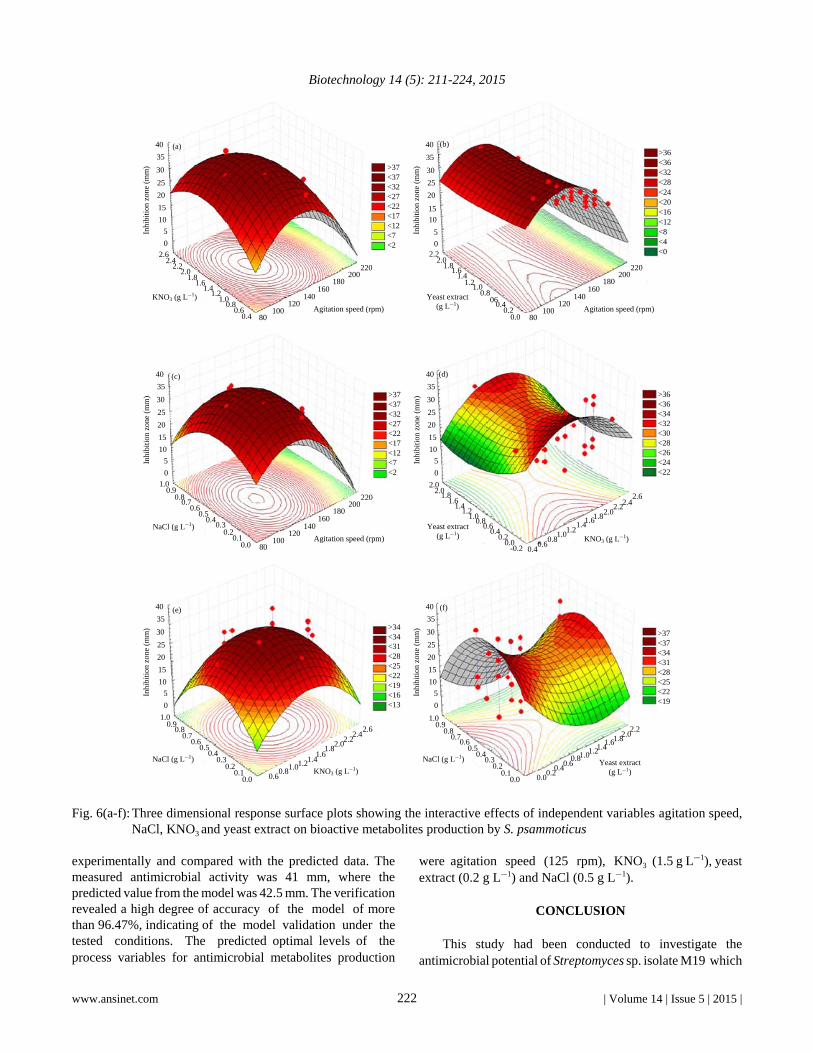
The interaction effects and the optimum levels betweenvariables had been determined by plotting the response surfacecurves (Fig. 6). Figure 6a showed the interaction betweenKNO3 and agitation speed as high levels of both factorssupported high antimicrobialmetabolites production. Figure 6bshowed that the highest value of antimicrobial metabolitesactivity was obtained with medium levels of agitation speedand different levels of yeast extract, further increase ofagitation speed resulted in decrease in antimicrobialmetabolites yields. Figure 6c showed the interaction betweenNaCl and agitation speed, the results show that by increasingthe levels of both factors, the rate of production will increase;further increase of both factors resulted in lower antimicrobialmetabolites yield. Figure 6d illustrates the interaction betweenyeast extract and KNO3. The results showed that the mediumlevels of KNO3 at medium levels of yeast extract will increasethe production. Figure 6e showed that the mediumconcentrations of both NaCl and yeast extract will increase theproduction of antimicrobial metabolites. Figure 6f showed theinteraction between NaCl and KNO3, the results showed thatmedium levels of both factors will increase the production thenthe production was decreased.
Verification of the model: Optimal values of the testedvariables obtained from the optimization had been verified
221www.ansinet.com | Volume 14 | Issue 5 | 2015 |
Biotechnology 14 (5): 211-224, 2015
Fig. 6(a-f): Three dimensional response surface plots showing the interactive effects of independent variables agitation speed,NaCl, KNO3 and yeast extract on bioactive metabolites production by S. psammoticus
experimentally and compared with the predicted data. Themeasured antimicrobial activity was 41 mm, where thepredicted value from the model was 42.5 mm. The verificationrevealed a high degree of accuracy of the model of morethan 96.47%, indicating of the model validation under the tested conditions. The predicted optimal levels of theprocess variables for antimicrobial metabolites production
were agitation speed (125 rpm), KNO3 (1.5 g LG1), yeast extract (0.2 g LG1) and NaCl (0.5 g LG1).
CONCLUSION
This study had been conducted to investigate theantimicrobial potential of Streptomyces sp. isolate M19 which
222www.ansinet.com | Volume 14 | Issue 5 | 2015 |
0.0
>37 <37 <32 <27 <22 <17 <12 <7 <2
40
35
30
25
20
15
10
5
0
Inhi
biti
on z
one
(mm
)
2.6 2.4
2.2
KNO3 (g LG1)
Agitation speed (rpm)
2.0 1.8
1.6 1.4
1.2 1.0
0.8 0.6
0.4 80 100
120 140
160180
200220
>36 <36 <32 <28 <24 <20 <16 <12 <8 <4 <0
40
35
30
25
20
15
10
5
0
Inhi
biti
on z
one
(mm
)
2.22.0
1.8
Yeast extract (g LG1) Agitation speed (rpm)
1.61.4
1.21.0
0.806
0.40.2
0.0 80100
120140
160 180
200 220
>37 <37 <32 <27 <22 <17 <12 <7 <2
40
35
30
25
20
15
10
5
0
Inhi
biti
on z
one
(mm
)
1.0 0.9
0.8
NaCl (g LG1)
Agitation speed (rpm)
0.7 0.6
0.5 0.4
0.3 0.2
0.1 0.0 80
100 120
140 160
180200
220
>36 <36 <34 <32 <30 <28 <26 <24 <22
40
35
30
25
20
15
10
5
0
Inhi
biti
on z
one
(mm
)
2.02.0
1.8
Yeast extract (g LG1) KNO3 (g LG1)
1.61.4
1.21.0
0.80.6
0.4
0.0-0.2 0.4
0.60.8
1.01.2
1.4 1.8 2.0
0.2
1.6
2.2 2.4 2.6
>34 <34 <31 <28 <25 <22 <19 <16 <13
40
35
30
25
20
15
10
5
0
Inhi
biti
on z
one
(mm
)
1.0 0.9
0.8
NaCl (g LG1)
KNO3 (g LG1)
0.7 0.6
0.5 0.4
0.3 0.2
0.10.0
>37 <37 <34 <31 <28 <25 <22 <19
40
35
30
25
20
15
10
5
0
Inhi
biti
on z
one
(mm
)
NaCl (g LG1)
Yeast extract (g LG1)
1.0
0.80.6
0.4
0.10.6
0.8 1.0 1.2 1.4 1.8 2.0
0.2
1.6
2.2
0.6 0.8 1.0 1.2 1.4
1.82.0
1.6
2.22.4
2.60.9
0.40.2
0.0
0.3
0.5
0.7
(a)
(b)
(c)
(d)
(e)
(f)

Biotechnology 14 (5): 211-224, 2015
was isolated from sea sediment in Egypt. The experimentalisolate was identified as S. psammoticuson the basis ofcultural, morphological, physiological characteristics and 16SrRNA analysis. Factors that affect the antimicrobial activitieswere investigated and assessed using the statisticalexperimental design. The antimicrobial metabolites productionhad been found to be significantly influenced by agitationspeed, KNO3, yeast extract and NaCl. The maximumextracellular antimicrobial metabolites production (41 mm)was achieved with the following optimized factors: Starch20 g, KNO3 1.5 g, K2HPO4 0.5 g, yeast extract 0.2 g, NaCl 0.5 g, MgSO4 0.1 g, CaCO3 3 g, FeSO4 0.01 g, pH 6.5,temperature 25°C, agitation speed (125 rpm/min), mediumvolume 75 mL, inoculum size 2(%,v/v), inoculation age 48 hand fermentation time 5 days. Validation experiments hadcarried out to verify the adequancy and accuracy of the modeland the results showed that the predicted value agreed wellwith the experimental values and about 1.5 fold increasecompared to the original medium was obtained.
REFERENCES
Altschul, S.F., T.L. Madden, A.A. Schaffer, J. Zhang,Z. Zhang, W. Miller and D.J. Lipman, 1997. GappedBLAST and PSI-BLAST: A new generation of proteindatabase search programs. Nucleic Acids Res.,25: 3389-3402.
Baskaran, R., R. Vijayakumar and P.M. Mohan, 2011.Enrichment method for the isolation of bioactiveactinomycetes from mangrove sediments of AndamanIslands, India. Malaysian J. Microbiol., 7: 26-32.
Beg, Q.K., V. Sahai and R. Gupta, 2003. Statistical mediaoptimization and alkaline protease production fromBacillus mojavensis in a bioreactor. Process Biochem.,39: 203-209.
Bhatnagar, I. and S.K. Kim, 2010. Immense essence ofexcellence: Marine microbial bioactive compounds.Mar. Drugs, 8: 2673-2701.
Cao, J., X. Chen, H. Ren, J. Zhang and L. Li et al., 2012.Production of cyclic adenosine monophosphate byArthrobacter sp. A302 using fed-batch fermentationwith pH-shift control. World J. Microbiol. Biotechnol.,28: 121-127.
Chen, X., L. Tang, S. Li, L. Liao, J. Zhang and Z. Mao, 2011.Optimization of medium for enhancement ofε-poly-L-lysine production by Streptomyces sp. M-Z18with glycerol as carbon source. Bioresour. Technol.,102: 1727-1732.
Crawford, D.L., J.M. Lynch, J.M. Whipps and M.A. Ousley,1993. Isolation and characterization of actinomyceteantagonists of a fungal root pathogen. Applied Environ.Microbiol., 59: 3899-3905.
El-Naggar, M.Y., S.A. El-Assar and S.M. Abdul-Gawad,2006. Meroparamycin production by newly isolatedStreptomyces sp. strain MAR01: Taxonomy, fermentation,purification and structural elucidation. J. Microbiol.,44: 432-438.
El-Naggar, N.E. and N.A.M. Abdelwahed, 2012. Optimizationof process parameters for the production of alkali-tolerantcarboxymethyl cellulase by newly isolatedStreptomyces sp. strain NEAE-D. Afr. J. Biotechnol.,11: 1185-1196.
El-Naggar, N.E., A.A. El-Bindary and N.S. Noour, 2013a.Production of antimicrobial agent inhibitory tosome human pathogenic multidrug-resistant bacteriaand Candida albicans by Streptomyces sp. NEAE-1.Int. J. Pharmacol., 9: 335-347.
El-Naggar, N.E., A.A. El-Bindary and N.S. Noour, 2013b.Statistical optimization of process variables forantimicrobial metabolites production by Streptomycesanulatus NEAE-94 against some multidrug-resistantstrains. Int. J. Pharmacol., 9: 322-334.
El-Refai, H.A., H.Y. AbdElRahman, H. Abdulla, H.G. Atef,A.M. Hashem, A.H. El-Refai and E.M. Ahmed, 2011.Studies on the production of Actinomycin byNocardioides luteus, a novel source. Curr. TrendsBiotechnol. Pharm., 5: 1282-1297.
Fang, X.L., J.T. Feng, W.G. Zhang, Y.H. Wang and X. Zhang,2010. Optimization of growth medium and fermentationconditions for improved antibiotic activity ofXenorhabdus nematophila TB using a statistical approach.Afr. J. Biotechnol., 9: 8068-8077.
Fenical, W. and P.R. Jensen, 2006. Developing a new resourcefor drug discovery: Marine actinomycete bacteria.Nat. Chem. Biol., 2: 666-673.
Gallagher, K.A., W. Fenical and P.R. Jensen, 2010. Hybridisoprenoid secondary metabolite production in terrestrialand marine actinomycetes. Curr. Opin. Biotechnol.,21: 794-800.
Ghribi, D., L. Abdelkefi-Mesrati, I. Mnif, R. Kammounand I. Ayadi et al., 2012. Investigation ofantimicrobial activity and statistical optimization ofBacillus subtilis SPB1 biosurfactant production insolid-state fermentation. J. Biomed. Biotechnol.10.1155/2012/373682
Goodfellow, M., P. Kampfer, H.J. Busse, M.E. Trujillo,K.I. Suzuki, W. Ludwig and W.B. Whitman, 2012.Bergey's Manual of Systematic Bacteriology. 2nd Edn.,Vol. 5, The Actinobacteria Part A. Springer, New York,Dordrecht, Heidelberg, London.
Gordon, R.E. and N.R. Smith, 1949. Aerobic spore formingbacteria capable of growth at high temperatures.J. Bacteriol., 58: 327-341.
223www.ansinet.com | Volume 14 | Issue 5 | 2015 |

Biotechnology 14 (5): 211-224, 2015
Himabindu, M. and A. Jetty, 2006. Optimization of nutritionalrequirements for gentamicin production byMicromonospora echinospora. Indian J. Exp. Biol.,44: 842-848.
Homans, A.L. and A. Fuchs, 1970. Direct bioautography onthin-layer chromatograms as a method for detectingfungitoxic substances. J. Chromatog, 51: 327-329.
Johnson, L.F., E.A. Curl, J.H. Bond and H.A. Fribourg, 1960.Methods for Studying Soil Microflora-Plant DiseaseRelationships. Burgess Publishing, Minneapolis,Minnesota.
Kawaguchi, Y., C.J. Wilson, S.J. Augood and P.C. Emson,1995. Striatal interneurones: Chemical, physiologicaland morphological characterization. Trends Neurosci.,18: 527-535.
Khuri, A.I. and S. Mukhopadhyay, 2010. Response surfacemethodology. Wiley Interdiscipl. Rev. Comput. Stat.,2: 128-149.
Kim, T.K., M.J. Garson and J.A. Fuerst, 2005. Marineactinomycetes related to the Salinospora group from thegreat barrier reef sponge Pseudoceratina clavata.Environ. Microbiol., 7: 509-518.
Kishore, P., 2011. Isolation, characterization and identificationof actinobacteria of Mangrove ecosystem. Ph.D. Thesis,Annamalai University,Tamilnadu, India.
Kokare, C.R., K.R. Mahadik, S.S. Kadam and B.A. Chopade,2004. Isolation, characterization and antimicrobial activityof marine halophilic Actinopolyspora species AH1 fromthe West Coast of India. Curr. Sci., 86: 593-597.
Kumar, C.G. and H. Takagi, 1999. Microbial alkalineproteases: From a bioindustrial viewpoint. Biotechnol.Adv., 17: 561-594.
Kumar, V., A. Bharti, O. Gusain and G.S. Bisht, 2011.Scanning electron microscopy of Streptomyces withoutuse of any chemical fixatives. Scanning, 33: 446-449.
Levy, S.B., 2002. Factors impacting on the problem ofantibiotic resistance. J. Antimicrob. Chemother.,49: 25-30.
Li, M., G.B. Penner, E. Hernandez-Sanabria, M. Oba andL.L. Guan, 2009. Effects of sampling location and timeand host animal on assessment of bacterial diversityand fermentation parameters in the bovine rumen.J. Applied Microbiol., 107: 1924-1934.
Martin, J.F. and A.L. Demain, 1980. Control of antibioticbiosynthesis. Microbiol. Rev., 44: 230-251.
Osman, M.E., F.A.H. Ahmed and W.S.M. Abd El All, 2011.Antibiotic production from local Streptomyces isolatesfrom Egyptian soil at Wady El Natron: Isolation,identification and optimization. Aust. J. Basic.Applied Sci., 5: 782-792.
Plackett, R.L. and J.P. Burman, 1946. The design of optimummultifactorial experiments. Biometrika, 33: 305-325.
Pridham, T.G., C.W. Hesseltine and R.G. Benedict, 1958.A guide for the classification of streptomycetes accordingto selected groups; placement of strains in morphologicalsections. Applied Microbiol., 6: 52-79.
Saban-Tanyildizi, M., O. Dursun and M. Elibol, 2005.Optimization of α-amylase production by Bacillus sp.using response surface methodology. Process Biochem.,40: 2291-2296.
Saitou, N. and M. Nei, 1987. The neighbor-joining method:A new method for reconstructing phylogenetic trees.Mol. Biol. Evol., 4: 406-425.
Salihu, A., M.Z. Alam, I.M. AbdulKarim and H.M. Salleh,2011. Optimization of lipase production by Candidacylindracea in palm oil mill effluent based medium usingstatistical experimental design. J. Mol. Catal. B:Enzymatic, 69: 66-73.
Sambrook, J., E.F. Fritish and T. Maniatis, 1989. MolecularCloning: A Laboratory Manual. 2nd Edn., ColdSpring Harbor Laboratory Press, New York, USA.,ISBN-13: 978-0879693091, Pages: 397.
Shirling, E.T. and D. Gottlieb, 1966. Methods forcharacterization of Streptomyces species. Int. J. Syst.Evol. Microbiol., 16: 313-340.
Singh, V., 2009. Isolation and characterization ofantimicrobial metabolites from microbial isolates.Int. J. Syst. Bacteriol., 8: 140-177.
Sivakumar, K., 2001. Actinomycetes of an Indian mangrove(Pitchavaram) environment: An inventory. Ph.D. Thesis,Annamalai University, India.
Tamura, K., D. Peterson, N. Peterson, G. Stecher, M. Nei andS. Kumar, 2011. MEGA5: Molecular evolutionarygenetics analysis using maximum likelihood, evolutionarydistance and maximum parsimony methods. Mol. Biol.Evol., 28: 2731-2739.
Tresner, H.D., J.A. Hayes and E.J. Backus, 1968. Differentialtolerance of streptomycetes to sodium chloride as ataxonomic aid. Applied Microbiol., 16: 1134-1136.
Vimal, V., R.B. Mercy and K. Kannabiran, 2009.Antimicrobial activity of marine actinomycete,Nocardiopsis sp. VITSVK 5 (FJ973467). Asian J. Med.Sci., 1: 57-63.
224www.ansinet.com | Volume 14 | Issue 5 | 2015 |