Optimization of a Steady-State Tokamak-Based Power Plant Farrokh Najmabadi University of California,...
16
Optimization of a Steady-State Tokamak- Based Power Plant Farrokh Najmabadi University of California, San Diego, La Jolla, CA IEA Workshop 59 “Shape and aspect ratio optimization for high , steady-state tokamaks” February 14-15, 2005 General Atomic, San Diego, CA Electronic copy: http://aries.uscd/edu/najmabadi/ ARIES Web Site: http://aries.ucsd.edu/ARIES/
-
date post
21-Dec-2015 -
Category
Documents
-
view
215 -
download
0
Transcript of Optimization of a Steady-State Tokamak-Based Power Plant Farrokh Najmabadi University of California,...

Optimization of a Steady-State Tokamak-Based Power Plant
Farrokh NajmabadiUniversity of California, San Diego, La Jolla, CA
IEA Workshop 59 “Shape and aspect ratio optimization for high , steady-state tokamaks”
February 14-15, 2005General Atomic, San Diego, CA
Electronic copy: http://aries.uscd/edu/najmabadi/ARIES Web Site: http://aries.ucsd.edu/ARIES/

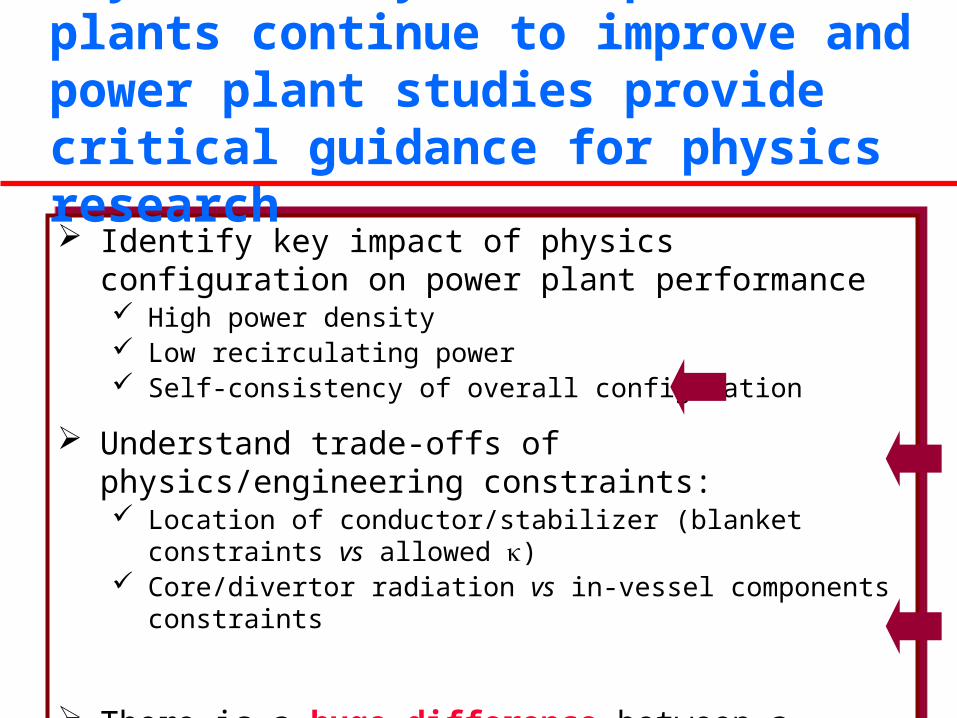
Identify key impact of physics configuration on power plant performance High power density Low recirculating power Self-consistency of overall configuration
Understand trade-offs of physics/engineering constraints: Location of conductor/stabilizer (blanket constraints vs allowed ) Core/divertor radiation vs in-vessel components constraints
There is a big difference between a physics optimization and an integrated systems optimization
Physics analysis of power plants continue to improve and power plant studies provide critical guidance for physics research
Improvements “saturate”after certain limit

Increase Power Density
Directions for Improvement
What we pay for,VFPC
r
Power density, 1/Vp
r > r ~ r <
Improvement “saturates” at ~5 MW/m2 peak wall loading (for a 1GWe plant).
A steady-state, first stability device with Nb3Sn technology has a power density about 1/3 of this goal.
Big Win Little
Gain
Decrease Recirculating Power Fraction Improvement “saturates” about Q ~ 40. A steady-state, first stability device with Nb3Sn Tech.
has a recirculating fraction about 1/2 of this goal.
High-Field Magnets
ARIES-I with 19 T at the coil (cryogenic).
Advanced SSTR-2 with 21 T at the coil (HTS).
High bootstrap, High 2nd Stability: ARIES-II/IV Reverse-shear: ARIES-RS,
ARIES-AT, A-SSRT2
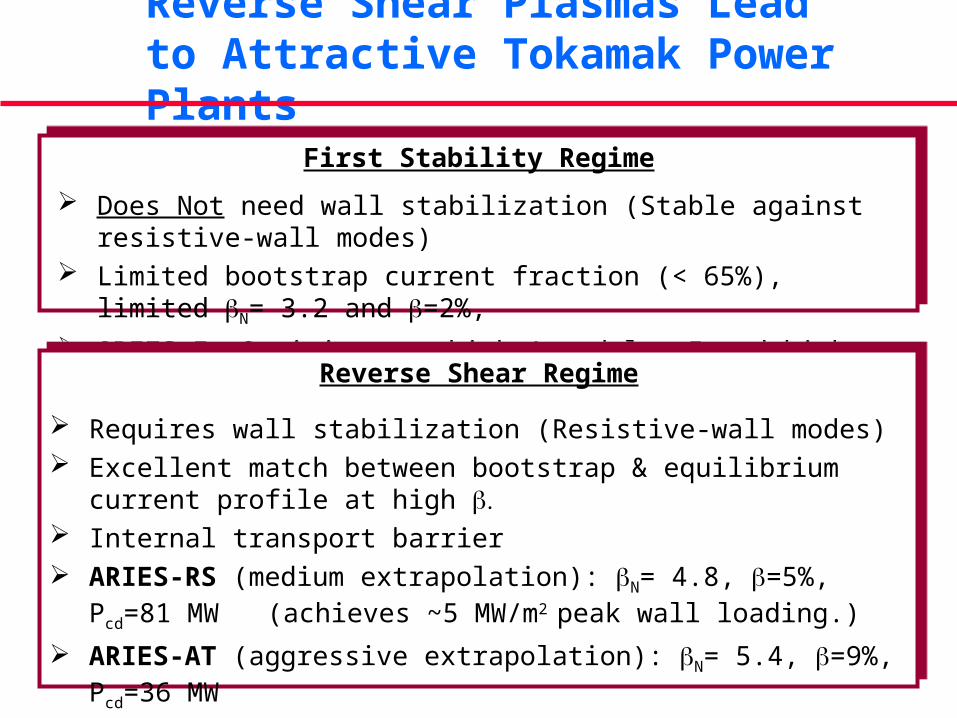
Reverse Shear Plasmas Lead to Attractive Tokamak Power Plants
First Stability Regime
Does Not need wall stabilization (Stable against resistive-wall modes) Limited bootstrap current fraction (< 65%), limited N= 3.2 and =2%,
ARIES-I: Optimizes at high A and low I and high magnetic field.
Reverse Shear Regime
Requires wall stabilization (Resistive-wall modes) Excellent match between bootstrap & equilibrium current profile at high Internal transport barrier ARIES-RS (medium extrapolation): N= 4.8, =5%, Pcd=81 MW
(achieves ~5 MW/m2 peak wall loading.) ARIES-AT (aggressive extrapolation): N= 5.4, =9%, Pcd=36 MW
(high is used to reduce peak field at magnet)

Approaching COE insensitive of current drive
Approaching COE insensitive of power density
Evolution of ARIES Designs
1st Stability,
Nb3Sn Tech.
ARIES-I’
Major radius (m) 8.0
) 2% (2.9)
Peak field (T) 16
Avg. Wall Load (MW/m2) 1.5
Current-driver power (MW) 237
Recirculating Power Fraction 0.29
Thermal efficiency 0.46
Cost of Electricity (c/kWh) 10
Reverse Shear
Option
High-Field
Option
ARIES-I
6.75
2% (3.0)
19
2.5
202
0.28
0.49
8.2
ARIES-RS
5.5
5% (4.8)
16
4
81
0.17
0.46
7.5
ARIES-AT
5.2
9.2% (5.4)
11.5
3.3
36
0.14
0.59
5

For first-stability devices (monotonic q profile), optimum A is around 4 mainly due to high current-drive power.
For reverse-shear, system code calculations indicate a broad minimum for A ~ 2.5 to 4.5
Detailed engineering design has always driven us to higher aspect ratios (A ~ 4). Inboard radial build is less
constraining; More “uniform” energy load on
fusion core (lower peak/average ratios).
ARIES Aspect Ratio Optimization
Identify key impact of physics configuration on power plant performance High power density Low recirculating power Self-consistency of overall configuration
Understand trade-offs of physics/engineering constraints: Location of conductor/stabilizer (blanket constraints vs allowed ) Core/divertor radiation vs in-vessel components constraints
There is a huge difference between a physics optimization and an integrated systems optimization
Physics analysis of power plants continue to improve and power plant studies provide critical guidance for physics research
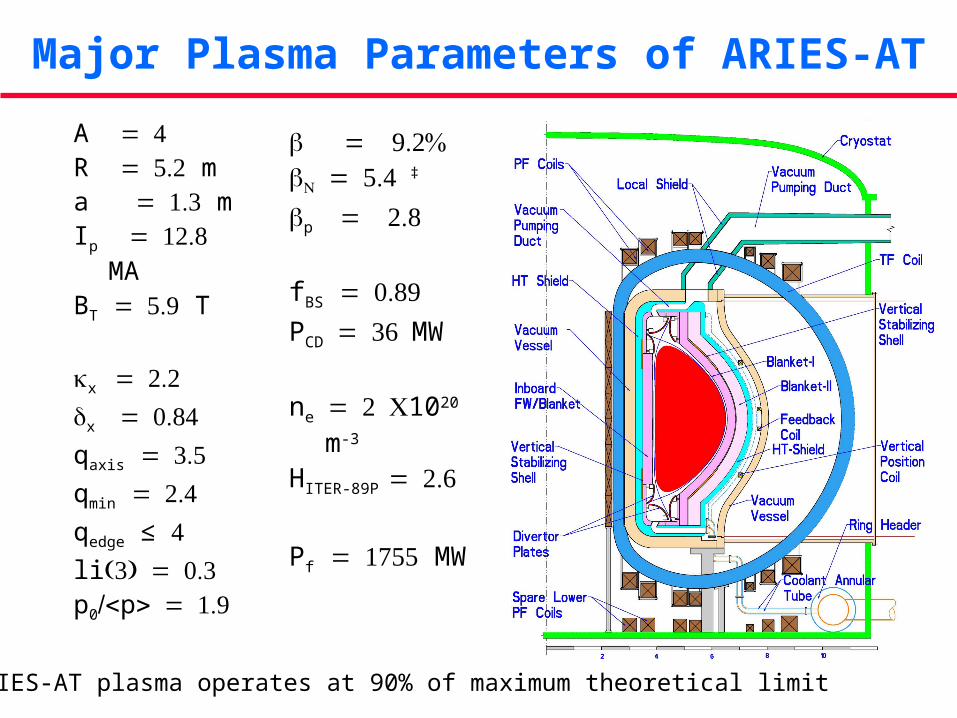
Major Plasma Parameters of ARIES-AT
A R ma mIp MA
BT T
x x qaxis qmin qedge ≤ lip0p
‡ ARIES-AT plasma operates at 90% of maximum theoretical limit
‡p
fBS PCDMW
ne1020 m-3
HITER-89P
Pf MW
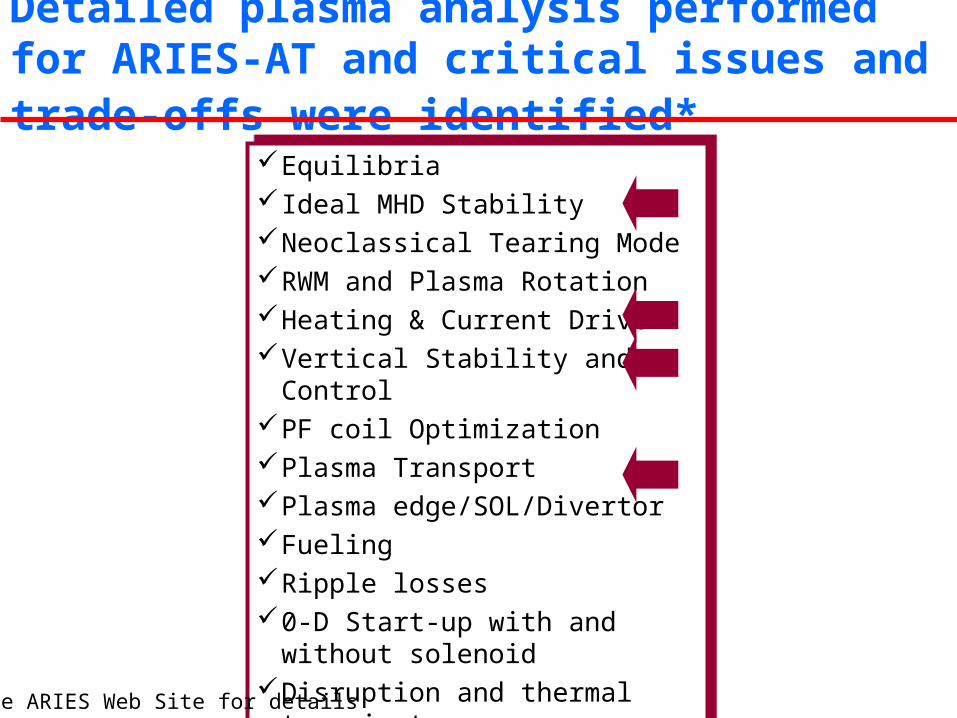
Detailed plasma analysis performed for ARIES-AT and critical issues and trade-offs were identified*
EquilibriaIdeal MHD StabilityNeoclassical Tearing ModeRWM and Plasma RotationHeating & Current DriveVertical Stability and ControlPF coil OptimizationPlasma Transport Plasma edge/SOL/DivertorFuelingRipple losses0-D Start-up with and without
solenoidDisruption and thermal transients
EquilibriaIdeal MHD StabilityNeoclassical Tearing ModeRWM and Plasma RotationHeating & Current DriveVertical Stability and ControlPF coil OptimizationPlasma Transport Plasma edge/SOL/DivertorFuelingRipple losses0-D Start-up with and without
solenoidDisruption and thermal transients
* See ARIES Web Site for details
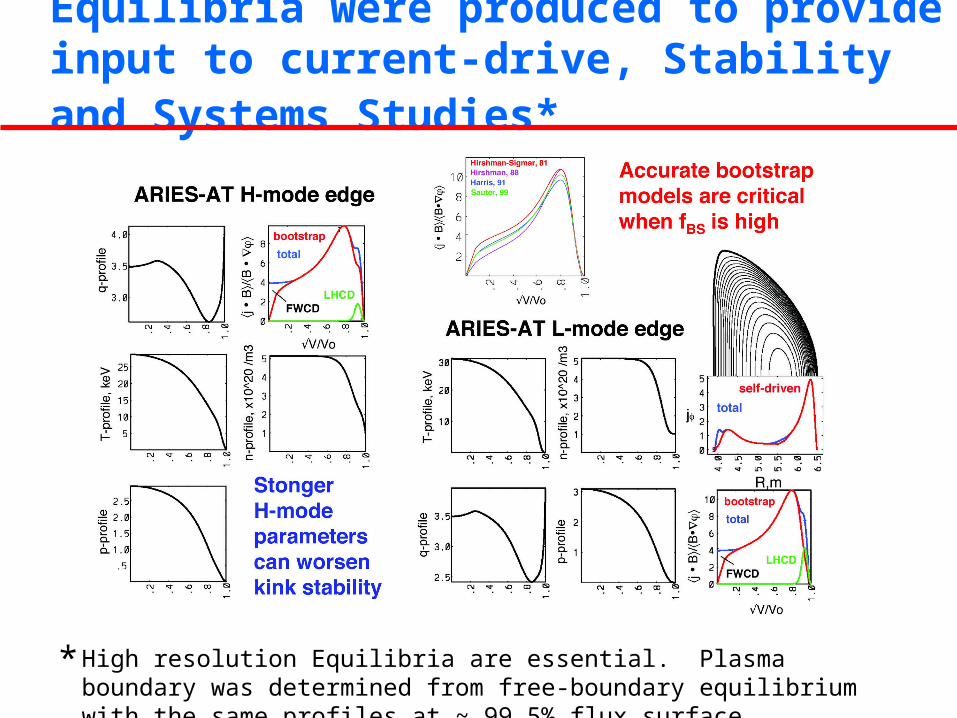
Equilibria were produced to provide input to current-drive, Stability and Systems Studies*
* High resolution Equilibria are essential. Plasma boundary was determined from free-boundary equilibrium with the same profiles at ~ 99.5% flux surface.

Plasma elongation and triangularity strongly influence achievable Low-n link and high-n ballooning was
performed by: PEST2 for 1 ≤ n ≤ 9 BALMSC for n MARS for n =1 rotation
Examined the impact of plasma shape, aspect ratio, and j and p profiles.
A data base was created for systems analysis.
High elongation requires high triangularity
Intermediate n is most restrictive
Same wall location for kink and vertical stability
ARIES-AT plasma Configuration at N(max)

Location of shell and feedback coils is a critical physics/engineering interface
Using DIIID C-coil as basis for RWM stabilization8-16 coils, 50 KA-turnswall = 3Ptotal = 10 MW
Passive stability is provided by tungsten shells located behind the blanket (4 cm thick, operating at 1,100oC)
Thinner ARIES-AT blanket yields x = 2.2 and leads to a much higher compared to ARIES-RS

Other parameters also influence plasma configuration and optimization
Minimum current-drive power does not occur at highest N
Another variable in the optimization

ARIES-AT utilizes ICRF/FW and LHCD
ICRF/FW: PFW MW, 68 MHz, n||
LHCD: PLH MW, 3.6 & 2.5 GHz, n||
120 keV NBI provides rotation and current drive for > 0.6 with PNB MW and PFW MW (NFREYA)
Alternative scenario with NBI

Radiated power distribution should balanced to produce optimal power handling A highly radiative mantle is NOT the optimum solution. First wall usually has a
much lower heat flux capability than the divertor: For ARIES AT: QFW
peak ≤ 0.45 MW/m2 while QDIVpeak ≤ 5 MW/m2
L-Mode Edge is preferable (higher edge density, no pedestal at the edge).
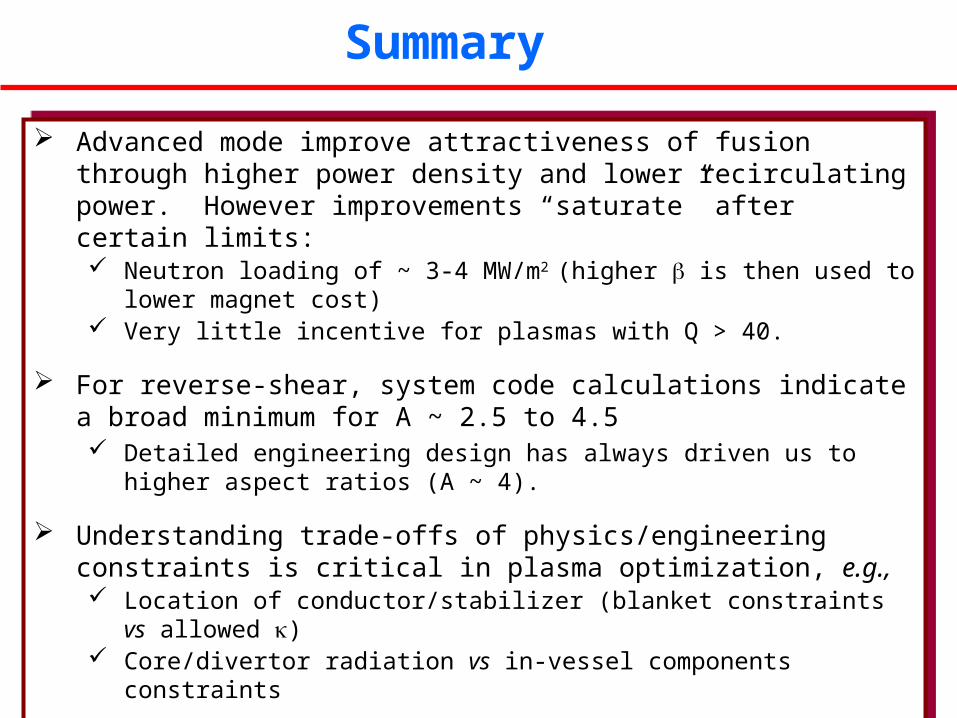
Advanced mode improve attractiveness of fusion through higher power density and lower recirculating power. However improvements “saturate” after certain limits: Neutron loading of ~ 3-4 MW/m2 (higher is then used to lower magnet cost) Very little incentive for plasmas with Q > 40.
For reverse-shear, system code calculations indicate a broad minimum for A ~ 2.5 to 4.5 Detailed engineering design has always driven us to higher aspect ratios (A ~ 4).
Understanding trade-offs of physics/engineering constraints is critical in plasma optimization, e.g., Location of conductor/stabilizer (blanket constraints vs allowed ) Core/divertor radiation vs in-vessel components constraints
There is a big difference between a physics optimization and an integrated systems optimization
Summary